pental limited 53 weeks ended 2 july 2017 for personal use ...name of entity financial year...
TRANSCRIPT
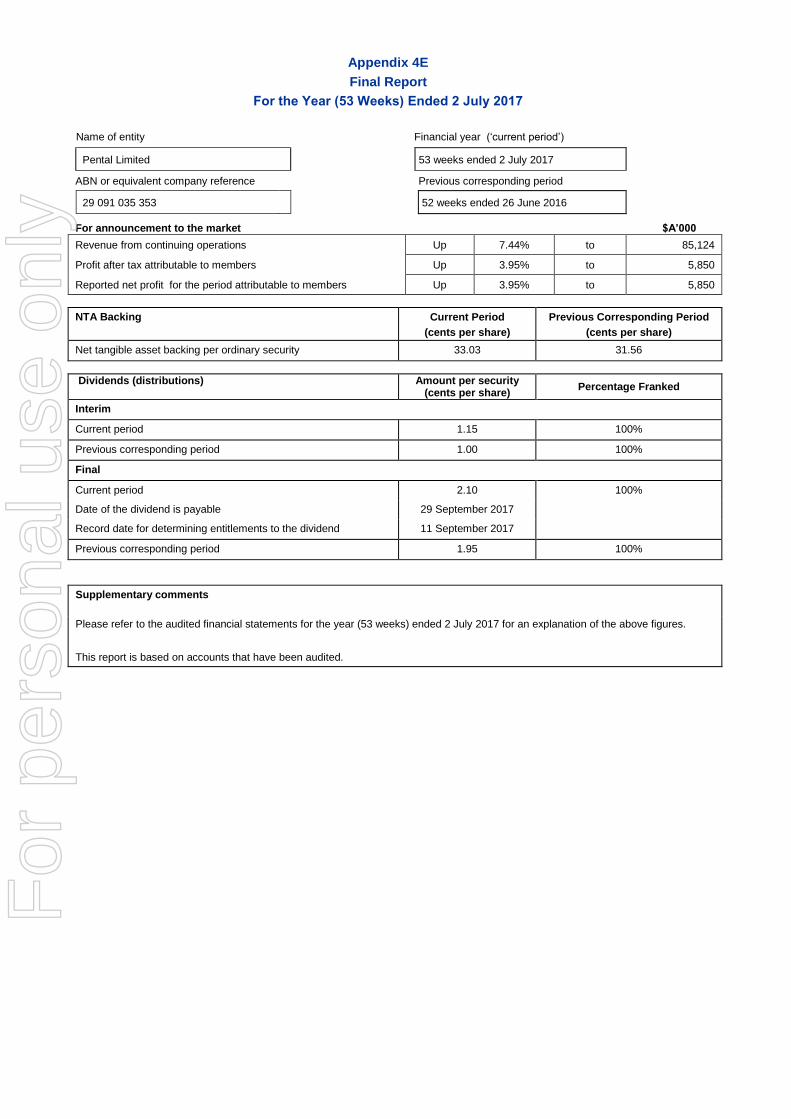
Appendix 4E
Final Report
For the Year (53 Weeks) Ended 2 July 2017
Name of entity Financial year (‘current period’)
Pental Limited 53 weeks ended 2 July 2017
ABN or equivalent company reference Previous corresponding period
29 091 035 353 52 weeks ended 26 June 2016
For announcement to the market $A’000
Revenue from continuing operations Up 7.44% to 85,124
Profit after tax attributable to members Up 3.95% to 5,850
Reported net profit for the period attributable to members Up 3.95% to 5,850
NTA Backing Current Period
(cents per share)
Previous Corresponding Period
(cents per share)
Net tangible asset backing per ordinary security 33.03 31.56
Dividends (distributions) Amount per security (cents per share)
Percentage Franked
Interim
Current period 1.15 100%
Previous corresponding period 1.00 100%
Final
Current period 2.10 100%
Date of the dividend is payable 29 September 2017
Record date for determining entitlements to the dividend 11 September 2017
Previous corresponding period 1.95 100%
Supplementary comments
Please refer to the audited financial statements for the year (53 weeks) ended 2 July 2017 for an explanation of the above figures.
This report is based on accounts that have been audited.
For
per
sona
l use
onl
y

Pental Limited
ABN: 29 091 035 353
Financial Report
for the year (53 weeks) ended 2 July 2017
For
per
sona
l use
onl
y

2
Contents
Description Page
Chairman’s Review 3
Corporate Governance Statement 5
Directors’ Report 11
Auditor’s Independence Declaration 28
Independent Auditors’ Report 29
Directors’ Declaration 33
Consolidated Statement of Profit or Loss and Other Comprehensive Income
34
Consolidated Statement of Financial Position 35
Consolidated Statement of Changes in Equity 36
Consolidated Statement of Cash Flows 37
Notes to the Financial Statements 38
ASX Additional Information 62
For
per
sona
l use
onl
y
3
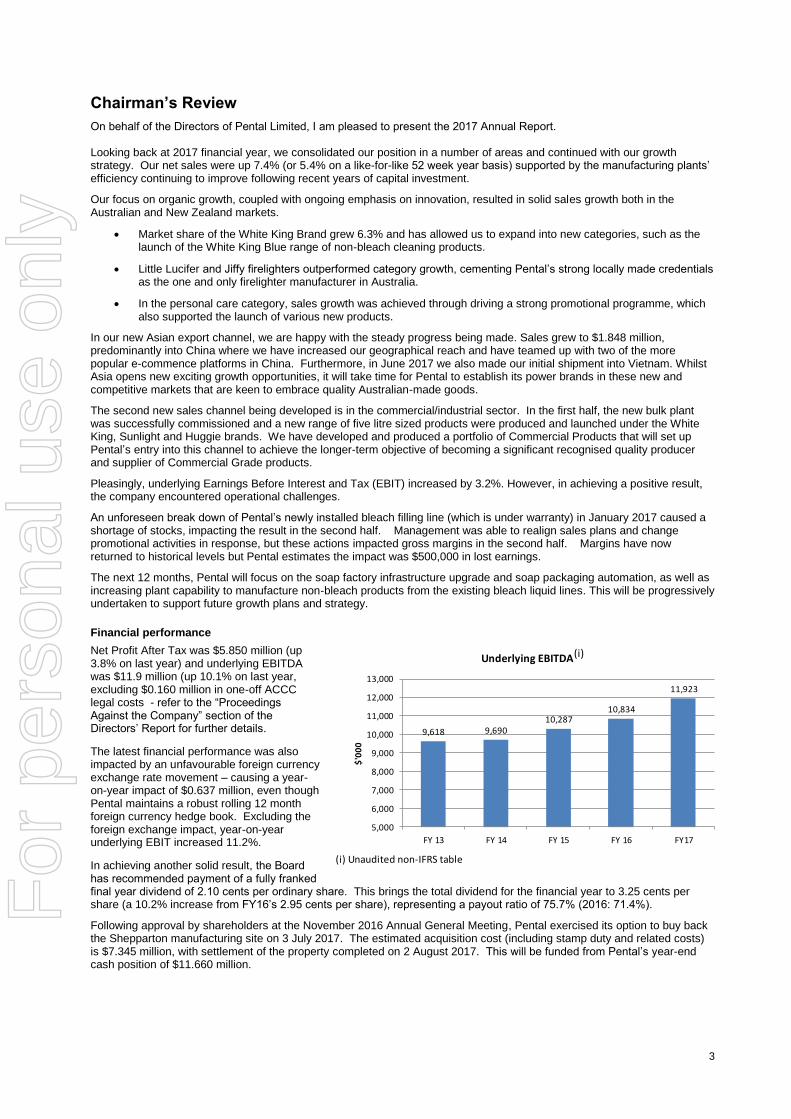
(i) Unaudited non-IFRS table
9,618 9,69010,287
10,834
11,923
5,000
6,000
7,000
8,000
9,000
10,000
11,000
12,000
13,000
FY 13 FY 14 FY 15 FY 16 FY17
$'0
00
Underlying EBITDA(i)
Chairman’s Review
On behalf of the Directors of Pental Limited, I am pleased to present the 2017 Annual Report. Looking back at 2017 financial year, we consolidated our position in a number of areas and continued with our growth strategy. Our net sales were up 7.4% (or 5.4% on a like-for-like 52 week year basis) supported by the manufacturing plants’ efficiency continuing to improve following recent years of capital investment.
Our focus on organic growth, coupled with ongoing emphasis on innovation, resulted in solid sales growth both in the Australian and New Zealand markets.
Market share of the White King Brand grew 6.3% and has allowed us to expand into new categories, such as the launch of the White King Blue range of non-bleach cleaning products.
Little Lucifer and Jiffy firelighters outperformed category growth, cementing Pental’s strong locally made credentials as the one and only firelighter manufacturer in Australia.
In the personal care category, sales growth was achieved through driving a strong promotional programme, which also supported the launch of various new products.
In our new Asian export channel, we are happy with the steady progress being made. Sales grew to $1.848 million, predominantly into China where we have increased our geographical reach and have teamed up with two of the more popular e-commence platforms in China. Furthermore, in June 2017 we also made our initial shipment into Vietnam. Whilst Asia opens new exciting growth opportunities, it will take time for Pental to establish its power brands in these new and competitive markets that are keen to embrace quality Australian-made goods.
The second new sales channel being developed is in the commercial/industrial sector. In the first half, the new bulk plant was successfully commissioned and a new range of five litre sized products were produced and launched under the White King, Sunlight and Huggie brands. We have developed and produced a portfolio of Commercial Products that will set up Pental’s entry into this channel to achieve the longer-term objective of becoming a significant recognised quality producer and supplier of Commercial Grade products.
Pleasingly, underlying Earnings Before Interest and Tax (EBIT) increased by 3.2%. However, in achieving a positive result, the company encountered operational challenges.
An unforeseen break down of Pental’s newly installed bleach filling line (which is under warranty) in January 2017 caused a shortage of stocks, impacting the result in the second half. Management was able to realign sales plans and change promotional activities in response, but these actions impacted gross margins in the second half. Margins have now returned to historical levels but Pental estimates the impact was $500,000 in lost earnings.
The next 12 months, Pental will focus on the soap factory infrastructure upgrade and soap packaging automation, as well as increasing plant capability to manufacture non-bleach products from the existing bleach liquid lines. This will be progressively undertaken to support future growth plans and strategy.
Financial performance
Net Profit After Tax was $5.850 million (up 3.8% on last year) and underlying EBITDA was $11.9 million (up 10.1% on last year, excluding $0.160 million in one-off ACCC legal costs - refer to the “Proceedings Against the Company” section of the Directors’ Report for further details.
The latest financial performance was also impacted by an unfavourable foreign currency exchange rate movement – causing a year-on-year impact of $0.637 million, even though Pental maintains a robust rolling 12 month foreign currency hedge book. Excluding the foreign exchange impact, year-on-year underlying EBIT increased 11.2%.
In achieving another solid result, the Board has recommended payment of a fully franked final year dividend of 2.10 cents per ordinary share. This brings the total dividend for the financial year to 3.25 cents per share (a 10.2% increase from FY16’s 2.95 cents per share), representing a payout ratio of 75.7% (2016: 71.4%).
Following approval by shareholders at the November 2016 Annual General Meeting, Pental exercised its option to buy back the Shepparton manufacturing site on 3 July 2017. The estimated acquisition cost (including stamp duty and related costs) is $7.345 million, with settlement of the property completed on 2 August 2017. This will be funded from Pental’s year-end cash position of $11.660 million.
For
per
sona
l use
onl
y

4
Looking forward
Pental continues to reinforce its operational foundations enabling it to focus on delivering significant and sustainable improvements, using the latest technology to increase efficiency and relentlessly drive costs down.
Understanding the market dynamics and consumer needs will help us to deliver new and innovative products that reinforce the superior performance and efficacy of our products. Through supporting our power brands, this will allow us to keep growing in Australia, New Zealand and Asia, and expand into new segments and channels.
The directors would like to thank all of our employees for their commitment and contribution during the year, and shareholders, suppliers and customers for their ongoing loyalty and support.
Peter Robinson
Chairman
For
per
sona
l use
onl
y

Pental Limited
Corporate governance statement
5
Corporate Governance Statement
This Corporate Governance Statement sets out the Company’s current compliance with the ASX Corporate Governance Council’s Principles of Good Corporate Governance and Best Practice Recommendations (Best Practice Recommendations).
The Company's website www.pental.com.au contains an Investor Section, which details the Company's Corporate Governance policies and procedures. This provides public access to all the information relevant to the Company meeting its corporate governance obligations.
BEST PRACTICE RECOMMENDATION COMMENT
1. Lay solid foundations for management and oversight
1.1 A listed entity should disclose:
(a) the respective roles and responsibilities of its board and management; and
(b) those matters expressly reserved to the board and those delegated to management.
The Corporate Governance Policies include a Board Charter, which discloses the specific responsibilities of the Board and provides that the Board shall delegate responsibility for the day-to-day operations and administration of the Company to the Chief Executive Officer.
The responsibilities of the Board, which are reserved for the Board and not delegated to management, include:
Oversight of the business and affairs of the Company;
Establishment of control and accountability systems;
Establishment with management of a strategic direction, supporting strategies and operating performance objectives;
Appointing the Chief Executive Officer (CEO) and any Executive Director; and
Reviewing and ratifying systems of risk management and internal compliance and control, codes of conduct and legal compliance.
The Board Charter is available on the Company’s website.
1.2 A listed entity should:
(a) undertake appropriate checks before appointing a person, or putting forward to security holders a candidate for election, as a director; and
(b) provide security holders with all material
information in its possession relevant to a
decision on whether or not to elect or re-elect
a director.
The Board has not established a Nominations Committee given the size of the Board and the Company’s operations. The Board as a whole performs the role of selection of potential new directors, and appropriate checks are made before an appointment occurs.
The Company provides security holders with all material information in its possession concerning the appointment or re-appointment of a director in the Notice of Shareholder Meeting concerning that appointment or re-appointment. A recommendation of the Directors concerning that appointment or re-appointment is also given.
1.3 A listed entity should have a written agreement with each director and senior executive setting out the terms of their appointment.
The Company has a written agreement with each director and senior executive setting out the terms of their appointment.
1.4 The company secretary of a listed entity should be accountable directly to the board, through the chair, on all matters to do with the proper functioning of the board.
The company secretary is accountable directly to the board, through the chair, on all matters to do with the proper functioning of the board. The current company secretary is a long-standing appointee and has direct contact with all directors as and when required.
1.5 A listed entity should:
(a) have a diversity policy which includes requirements for the board or a relevant committee of the board to set measurable objectives for achieving gender diversity and to assess annually both the objectives and the entity’s progress in achieving them;
The Company does not have a specific policy or measurable objectives for achieving gender diversity. The Board believes the existing Code of Conduct anti-discrimination provisions provides for this. The Company does not believe it is appropriate to establish a quota system for measuring gender diversity, and indeed such a quota system could itself lead to discrimination.
For
per
sona
l use
onl
y

Pental Limited
Corporate governance statement
6
BEST PRACTICE RECOMMENDATION COMMENT
(b) disclose that policy or a summary of it; and
(c) disclose as at the end of each reporting period the measurable objectives for achieving gender diversity set by the board or a relevant committee of the board in accordance with the entity’s diversity policy and its progress towards achieving them and either:
(1) the respective proportions of men and women on the board, in senior executive positions and across the whole organisation (including how the entity has defined “senior executive” for these purposes); or
(2) if the entity is a “relevant employer” under the Workplace Gender Equality Act, the entity’s most recent “Gender Equality Indicators”, as defined in and published under that Act.
The Company has instead required management to monitor gender diversity in line with the Corporate Governance Council Recommendations and intends to take appropriate action should it be of the view that there is insufficient gender diversity within the business.
As at 2 July 2017, there were 29 women employed representing 21.82% of total employees. There was one woman on the Board of Directors.
1.6 A listed entity should:
(a) have and disclose a process for periodically evaluating the performance of the board, its committees and individual directors; and
(b) disclose, in relation to each reporting period, whether a performance evaluation was undertaken in the reporting period in accordance with that process.
The Company does not have a formal policy for the periodic evaluation of it Board. The Board does not consider that a formal policy is necessary given the size of the Board and operations of the Company. The Board did however conduct a performance evaluation during the financial period.
1.7 A listed entity should:
(a) have and disclose a process for periodically evaluating the performance of its senior executives; and
(b) disclose, in relation to each reporting period, whether a performance evaluation was undertaken in the reporting period in accordance with that process.
The Board is responsible for assessing the performance of the Chief Executive Officer. The Chief Executive Officer is responsible for assessing the performance of the key executives within the Company, in conjunction with the Board. Executive assessments are conducted annually.
Formal appraisals are conducted at least annually for other staff and key performance indicators are set.
A performance evaluation for senior executives has taken place during the year under the process disclosed.
2. Structure the board to add value
2.1 The board of a listed entity should:
(a) have a nomination committee which:
(1) has at least three members, a majority of whom are independent directors; and
(2) is chaired by an independent director,
and disclose:
(3) the charter of the committee;
(4) the members of the committee; and
(5) as at the end of each reporting period, the number of times the committee met throughout the period and the individual attendances of the members at those meetings; or
(b) if it does not have a nomination committee, disclose that fact and the processes it employs to address board succession issues and to ensure that the board has the appropriate balance of skills, knowledge, experience, independence and diversity to enable it to discharge its duties and responsibilities effectively.
The Board has not established a Nominations Committee. The Board as a whole carries out the functions of a Nominations Committee, and Pental believes this is appropriate for a Company of its size and business. The Board seeks to ensure that it has an appropriate mix of skills necessary to fulfil its obligations.
For
per
sona
l use
onl
y

Pental Limited
Corporate governance statement
7
BEST PRACTICE RECOMMENDATION COMMENT
2.2 A listed entity should have and disclose a board skills matrix setting out the mix of skills and diversity that the board currently has or is looking to achieve in its membership.
Pental does not have a board skills matrix. The names and details of Directors in office at the date of this Annual Report, including skills, experience, term of office and expertise, are included in the Directors' Report Section of this Annual Report.
2.3 A listed entity should disclose:
(a) the names of the directors considered by the board to be independent directors;
(b) if a director has an interest, position, association or relationship of the type described in Box 2.3 but the board is of the opinion that it does not compromise the independence of the director, the nature of the interest, position, association or relationship in question and an explanation of why the board is of that opinion; and
(c) the length of service of each director.
Directors of Pental are considered to be independent when they are independent of management and free from any business or other relationship that could materially interfere with the exercise of their independent judgment. The following Directors are considered to be Independent: Mr Peter Robinson, Mr John Rishworth, Ms Kimberlee Wells and Mr John Etherington. Mr Mel Sutton is not considered to meet the test of independence as he has provided consultancy services to the Group during the previous reporting period.
The date of appointment of each Director is set out in the Directors’ Report Section of this Annual Report.
2.4 A majority of the board of a listed entity should be independent directors.
At the date of this report and during the period a majority of directors were independent directors.
2.5 The chair of the board of a listed entity should be an independent director and, in particular, should not be the same person as the CEO of the entity.
The Chairman is an independent director. The Chief Executive Officer is not the Chairman.
2.6 A listed entity should have a program for inducting new directors and provide appropriate professional development opportunities for directors to develop and maintain the skills and knowledge needed to perform their role as directors effectively.
The Company has an induction program for new directors.
The Company does not provide professional development opportunities for Directors. Given the current skill sets of each Director the Board considers that this is unnecessary.
3. Promote ethical and responsible decision-making
3.1 A listed entity should:
(a) have a code of conduct for its directors, senior executives and employees; and
(b) disclose that code or a summary of it.
The Company has a formal Code of Conduct, which applies to all Pental directors, employees, and contractors. A summary of this policy is available on the Company website within the Corporate Governance Section.
The Company’s Corporate Governance Section includes the Securities Trading Policy, which regulates dealings by directors, officers and employees in securities issued by the Company.
For
per
sona
l use
onl
y

Pental Limited
Corporate governance statement
8
BEST PRACTICE RECOMMENDATION COMMENT
4. Safeguard integrity in financial reporting
4.1 The board of a listed entity should:
(a) have an audit committee which:
(1) has at least three members, all of whom are non-executive directors and a majority of whom are independent directors; and
(2) is chaired by an independent director, who is not the chair of the board,
and disclose:
(3) the charter of the committee;
(4) the relevant qualifications and experience of the members of the committee; and
(5) in relation to each reporting period, the number of times the committee met throughout the period and the individual attendances of the members at those meetings; or
(b) if it does not have an audit committee, disclose that fact and the processes it employs that independently verify and safeguard the integrity of its corporate reporting, including the processes for the appointment and removal of the external auditor and the rotation of the audit engagement partner.
The Board has established an Audit Committee. The Audit Committee consisted of four members, the majority of whom are independent directors.
The Chair of the Committee was and is not the Chair of the Board during the period.
The names of the members of the Committee, details of their qualifications and experience and details of the number of meetings held during the period, are contained in the Directors’ Report section of this Annual Report.
The Audit Committee operates under a Charter which is available on the Company website within the Corporate Governance Section.
4.2 (a) The board of a listed entity should, before it approves the entity’s financial statements for a financial period, receive from its CEO and CFO a declaration that, in their opinion, the financial records of the entity have been properly maintained and that the financial statements comply with the appropriate accounting standards and give a true and fair view of the financial position and performance of the entity and that the opinion has been formed on the basis of a sound system of risk management and internal control which is operating effectively.
The Board has obtained the relevant assurances from management.
4.3 A listed entity that has an AGM should ensure that its external auditor attends its AGM and is available to answer questions from security holders relevant to the audit.
The external auditor attends its AGM and is available to answer questions from security holders relevant to the audit.
5. Make timely and balanced disclosure
5.1 A listed entity should:
(a) have a written policy for complying with its continuous disclosure obligations under the Listing Rules; and
(b) disclose that policy or a summary of it.
The Company has in place a Continuous Disclosure Policy, which has been implemented across the Company. The Policy is available on the Corporate Governance section of the Company website.
For
per
sona
l use
onl
y

Pental Limited
Corporate governance statement
9
BEST PRACTICE RECOMMENDATIONS COMMENT
6. Respect the rights of shareholders
6.1 A listed entity should provide information about itself and its governance to investors via its website.
The Company provides information about itself and its governance on its website. All policies and charters concerning governance issues are located on a dedicated section headed Corporate Governance.
6.2 A listed entity should design and implement an investor relations program to facilitate effective two-way communication with investors.
The Company has in place a Shareholder Communication Policy, which promotes effective communication with shareholders. The Policy is available on the Corporate Governance section of the Company website.
6.3 A listed entity should disclose the policies and processes it has in place to facilitate and encourage participation at meetings of security holders.
The Company has in place a Shareholder Communication Policy, which promotes effective communication with shareholders. The Policy is available on the Corporate Governance section of the Company website.
6.4 A listed entity should give security holders the option to receive communications from, and send communications to, the entity and its security registry electronically.
The Company gives security holders the option to receive communications from, and send communications to, the entity and its security registry electronically.
7. Recognise and manage risk
7.1 The board of a listed entity should:
(a) have a committee or committees to oversee risk, each of which:
(1) has at least three members, a majority of whom are independent directors; and
(2) is chaired by an independent director,
and disclose:
(3) the charter of the committee;
(4) the members of the committee; and
(5) as at the end of each reporting period, the number of times the committee met throughout the period and the individual attendances of the members at those meetings; or
(b) if it does not have a risk committee or committees that satisfy (a) above, disclose that fact and the processes it employs for overseeing the entity’s risk management framework.
The Audit Committee referred to in section 4 also oversees risk as part of its Charter.
7.2 The board or a committee of the board should:
(a) review the entity’s risk management framework at least annually to satisfy itself that it continues to be sound; and
(b) disclose, in relation to each reporting period, whether such a review has taken place.
The Audit Committee reviews the Company’s risk management framework annually and specific risks at each meeting. Key risks are referred to the Board periodically, and management reports on whether risk is being effectively managed.
For
per
sona
l use
onl
y

Pental Limited
Corporate governance statement
10
BEST PRACTICE RECOMMENDATION COMMENT
7.3 A listed entity should disclose:
(a) if it has an internal audit function, how the function is structured and what role it performs; or
(b) if it does not have an internal audit function, that fact and the processes it employs for evaluating and continually improving the effectiveness of its risk management and internal control processes.
The Company does not have an internal audit function. The Board considers that this is unnecessary given the size of the Company’s operations.
The Audit Committee reviews the Company’s risk management framework and risks generally. Where desirable, the Company has requested its external auditors to review particular operations to ensure internal controls are effective.
7.4 A listed entity should disclose whether it has any material exposure to economic, environmental and social sustainability risks and, if it does, how it manages or intends to manage those risks.
The Company does not have any economic, environmental and social sustainability risks over and above those of every commercial organisation, and not already disclosed to security holders.
8. Remunerate fairly and responsibly
8.1 The board of a listed entity should:
(a) have a remuneration committee which:
(1) has at least three members, a majority of whom are independent directors; and
(2) is chaired by an independent director,
and disclose:
(3) the charter of the committee;
(4) the members of the committee; and
(5) as at the end of each reporting period, the number of times the committee met throughout the period and the individual attendances of the members at those meetings; or
(b) if it does not have a remuneration committee, disclose that fact and the processes it employs for setting the level and composition of remuneration for directors and senior executives and ensuring that such remuneration is appropriate and not excessive.
The Board has established a Remuneration Committee. The Remuneration Committee operates under a Charter, which is available on the Company’s website.
Memberships of the Committee, and details of meetings held during the period, are contained in the Directors’ Report section.
8.2 A listed entity should separately disclose its policies and practices regarding the remuneration of non-executive directors and the remuneration of executive directors and other senior executives.
Remuneration policies are set out in the Remuneration Report section of this Annual Report.
When thought desirable the Board utilises specialist third parties to benchmark executive and non-executive director remuneration.
8.3 A listed entity which has an equity-based remuneration scheme should:
(a) have a policy on whether participants are permitted to enter into transactions (whether through the use of derivatives or otherwise) which limit the economic risk of participating in the scheme; and
(b) disclose that policy or a summary of it.
The Company has established an Executive Performance Rights Plan that may result in the issue of securities to executives. As those securities will be ordinary shares there is no policy on permitting participants to enter into transactions limiting the risk of participation in the scheme.
For
per
sona
l use
onl
y

11
Directors’ report
The directors of Pental Limited submit herewith the annual financial report of the company for the year (52 weeks) ended
2 July 2017. In order to comply with the provisions of the Corporations Act 2001, the directors report as follows:
Information about the directors
The names and particulars of the directors of the company during or since the end of the financial year are:
Name & Qualifications Experience and Responsibilities
Mr Peter Robinson B.Eco (Mon) Non-Executive Independent Chairman
Peter has a wealth of experience in the manufacturing sector within Australia and internationally. He was the Chief Executive of ACI Packaging Group and Vice President of Owens-Illinois Inc, the parent company of ACI Packaging Group. Previous roles include Chief Operating Officer and Director of BTR Nylex Limited, and General Manager of Bowater Scott, where he held substantial marketing roles. Appointed Director on 29 November 2002. Appointed Chairman on 5 March 2009. Member of the Audit Committee and Chairman of Remuneration Committee.
Mr Mel Sutton B.Com
Non-Executive Vice-Chairman
Mel has extensive experience and a diverse background across a number of key sectors, including food-production, wholesale and retail; facility services; apparel and footwear - wholesale and retail; consumer goods - beverage; and sporting goods - wholesale and retail. Mel was CEO and a Managing Director of Nike Pacific, Globe International, Colorado Group and a Divisional Chief Executive of George Weston Foods Limited and Spotless Group. Previous roles also include senior executive positions with Lion Nathan and Foster’s. Mel, as a Director of ZABS Advisory & Consulting Pty Ltd, currently provides advisory services across a wide range of disciplines to clients, who operate in and across diverse sectors. Appointed Director 2 October 2013. Member of Audit Committee and Member of Remuneration Committee.
Mr John Rishworth Non-Executive Independent Director
John has worked in the Fast Moving Consumer Goods sector for over 30 years. He held significant senior positions within Woolworths before founding his own successful retail brokerage business in 1987. Since selling that business he has taken on a number of consultancy assignments within the retail sector. Appointed Director 9 September 2004. Member of Audit Committee and Member of Remuneration Committee
Mr John Etherington B.Ec, FCA, FAICD Non-Executive Independent Director
John is a former senior partner of Deloitte, where he held both senior leadership positions and provided audit and advisory services to public, private and not for profit organisations, with a particular specialisation on rapidly-growing Australian-listed entities. He is also currently a non-executive director on a range of public and private organisations. Appointed Director 2 April 2013. Chairman of Audit Committee and Member of Remuneration Committee.
Ms Kimberlee Wells Non-Executive Independent Director
Kimberlee has spent her career building the brands of large blue-chip organisations including ANZ, NAB, Medibank, Qantas and Myer. She has written countless digital transition strategies for her clients and works in almost daily partnership with the digital pioneers of our time including Google and Facebook. Kimberlee also lectures with RMIT University, the Australian Direct Marketing Institute and other industry bodies. Kimberlee is currently the CEO of Whybin\TBWA Group Melbourne - a tier one global advertising and digital agency. Previous roles included senior management positions with BBDO, Wunderman and M&C Saatchi. Appointed Director 19 November 2015. Member of Remuneration Committee.
The above named directors held office during the whole of the financial year and since the end of the financial year. Any directorships of other listed companies held by directors in the three years immediately before the end of the financial year are indicated above under “experience and responsibilities”.
For
per
sona
l use
onl
y

12
Directors’ shareholdings
The following table sets out each director’s relevant interest in shares, debentures, and rights or options in shares or
debentures of the company or a related body corporate as at the date of this report.
Directors Fully paid ordinary shares
Number
Share options
Number
Peter Robinson 3,972,926 -
Mel Sutton - -
John Rishworth 13,207 -
John Etherington 160,000 -
Kimberlee Wells - -
Share options granted to directors and senior management
During and since the end of the financial year no share options were granted to directors or senior management, however
senior management were issued Rights pursuant to the Executive Performance Rights Plan as detailed in the Remuneration
Report.
Company secretary
Name & qualifications
Mr Oliver Carton B Juris LL.B Company Secretary
Experience and Responsibilities
Oliver is a qualified lawyer with over 29 years’ experience in a variety of corporate roles. He currently runs his own consulting business, and was previously a Director of the Chartered Accounting firm KPMG where he managed its Corporate Secretarial Group. Prior to that, he was a senior legal officer with ASIC.
Oliver is an experienced company secretary and is currently company secretary of a number of listed and unlisted companies, ranging from Pental Limited to the not for profit Melbourne Symphony Orchestra Pty Ltd.
Principal activities
The principal activities of the Group during the course of the financial year were the manufacturing and distribution of personal care and home products.
Company Overview - Trusted brands that get the job done
From humble beginnings Pental Limited has grown to include a portfolio of leading brands, which have become household names in Australia and New Zealand. Today we are an innovative market leader and the largest local manufacturer of bar soaps, liquid bleach and cube firelighters.
For more than 60 years we’ve worked hard to stay true to our Australian heritage, maintaining 90% of manufacturing at our plant in Shepparton, Victoria, supplemented with third party contract manufacturing in New Zealand for the local market. There are four distinct production plants at the Shepparton site, comprising the Soap plant, Bleach plant, Liquids plant and Firelighters plant.
Pental has grown through an unrelenting dedication to innovation, efficiency and quality. This foundation has made Pental a trusted manufacturer of household and commercial products, taking our business across Australia and New Zealand, and now into new Asian markets.
Our Brands
Personal Care Household cleaning Laundry Fire Needs Kitchen
Pental’s products are seen in more than 4,000 supermarkets, 700 pharmacies and 300 petrol and convenience, corner and hardware stores in Australia and New Zealand and the Company is now establishing a presence in Asia (commencing with China) and expanding into the commercial/industrial channels. These products are distributed from Shepparton (Victoria), Christchurch and Auckland (New Zealand), and the Shanghai and Ningbo Free Trade Zones (China) warehouses.
For
per
sona
l use
onl
y

13
FY17 (i) FY16 (i)
$’000 $’000 % Change
Reported profit after tax 5,850 5,628 3.9%
Income tax expense 2,493 2,590
Finance costs 44 64
EBIT 8,387 8,282 1.3%
One off - ACCC legal costs 160 -
Underlying EBIT 8,547 8,282 3.2%
Depreciation and amortisation 3,376 2,552
Underlying EBITDA 11,923 10,834 10.1%(i)
Unaudited non-IFRS financial table
Review of operations
Financial Performance
Gross sales of $117,660 million were up 7.0% or $7.680 million on last year, or 5.0% excluding the 53rd trading week on like-for-like.
o Gross sales in the Australian market were up 7.7%, with strong growth with the White King cleaning range, the Little Lucifer and Jiffy firelighters range, Country Life and Pears personal care range, and private label.
o New Zealand market share in a number of categories such as Toilet, Household Cleaning and Dish Wash continues to be solid. The ongoing aggressive marketing by competitors, in particular in the Dish Wash category, caused gross sales to be 1.0% down (3.7% in New Zealand dollars). However, with an improved promotional tactical program and the launch of new products, net sales (after trade spend) was up 4.6% (2.1% in New Zealand dollars).
o Expansion into Asia continues to grow at a steady pace, albeit slower than initially anticipated. Sales increased by $1.157 million to $1.837 million (first half $0.664 million and 2nd half $1.173 million). Ranging of Pental’s personal care brands (Country Life and Velvet), and cleaning brands (White King and Softly) in retail stores and through online channels in China continues to grow, as has Pental’s contract manufacturing business, where Asian customers are seeking high-quality Australian made products. Furthermore, Pental’s first shipment to Vietnam commenced in June 2017 and the company is actively developing other new export opportunities in the Asian region.
Trade spend (trading terms, promotional activities and discounts) at 28.1% of Australian and New Zealand gross sales was largely in line with the previous corresponding period. The current period also including the promotional activities to launch the Country Life Liquids range in the Australian market and support for expansion of the White King range and other personal care ranges.
Net sales (after trade spend) of $85.124 million were up 7.4% or $5.891 million on last year, or 5.4% excluding the 53rd trading week on like for like.
For
per
sona
l use
onl
y

14
Underlying EBIT (Earnings Before Interest and Tax) of $8.547 million was $0.265 million (or 3.2%) up on last year, after excluding one-off ACCC legal costs - refer to the “Proceedings Against the Company” section of the Directors’ Report for further details.
Although a solid result, the financial performance was also impacted by:
o an unforeseen break down of Pental’s newly installed bleach filling line (which is under warranty) in January 2017 which caused a shortage of stocks, impacting the result in the second half. Management was able to realign sales plans and change promotional activities in response, but these actions impacted gross margins in the second half. Margins have now returned to historical levels but Pental estimates the impact was $500,000 in lost earnings; and
o the year-on-year impact of foreign currency changes of $0.937m arising from the deterioration of the Australian dollar against the United States and New Zealand currencies. Pental continues to actively hedge its currency exposures on a rolling 12 month basis; and
Excluding the foreign exchange loss the underlying EBIT was $8.932 million, up $0.902 million or 11.2% (after excluding the prior year’s foreign exchange gain).
While EBIT was impact by the breakdown of equipment, operational costs continued be driven down:
o Freight out costs to customers decreased further this year, through renegotiation of routes and optimisation of
container re-usage. Freight costs to gross sales decreased by 0.55% to 5.42%;
o Renegotiation of non-commodity based raw materials and services has led to $1.087 million in Profit Delivery
Project savings;
o Direct wages net of manufacturing recoveries improved by $0.671 million (or 28.7%) on last year, with a 9.1%
increase in the number of cartons produced arising from improved manufacturing efficiency driven from the
capital investment completed in the prior year and continuous improvement in manufacturing disciplines; and
o Refocused marketing to specific in-store promotional activities and catalogues (that is, trade spend).
However, these significant savings were offset by: o Significant increases in gas and electricity prices;
o The rise in some commodity based raw materials, such as tallow and coconut, used in Country Life soaps; and
o A depreciation increase of $0.824 million following the recent years of significant capital investment to modernise the manufacturing facilities.
Consolidated net profit after tax for the year (53 weeks) ended 2 July 2017 was $5.850 million (2016: $5.628 million).
The total dividend for the 2017 financial year is 3.25 cents per ordinary share, representing 75.7% (2016: 71.4%) of the full-year net profit after tax and consists of :
- Interim fully franked dividend of 1.15 cents per ordinary share, which was paid 24 March 2017; and
- Proposed final fully franked dividend of 2.10 cents per ordinary share, payable to shareholders on 29 September 2017, with a record date of 11 September 2017.
Basic earnings per share of 4.29 cents increased from 4.13 cents in 2016. Cash generation and capital management
Operating cash flow of $6.615 million decreased by $4.644 on last year, predominately due to the FY16 and FY17 taxes paid in the current year, whilst there was no tax payment due in the prior year.
Net working capital (receivables, inventories less trade and other payables) of $16.668 million was also higher than last year by $0.879 million as the business increased its safety stock levels. This was as the major retailers continue to seek to minimise their stock holdings whilst requiring suppliers to maintain a Delivery In Full and On Time (DIFOT) benchmark of 97%. Pental’s prior year investment in new warehousing facilities and a strong balance sheet, with cash at bank of $11.660 million, allowed the business to effectively execute this change.
The net debtors and creditors position improved on last year due to timing of the 53 week financial year that closed on 2 July 2017 compared to the prior year closure on 26 June 2016. This resulted in additional cash receipts in FY17. It is also pleasing to report that Pental’s debtors’ position continues to be solid, with minimal over dues.
As previously indicated, cash reserves have been maintained pending the acquisition of the Shepparton property, which was approved by shareholders at the November 2016 Annual General Meeting. Settlement of the property was completed on 2 August 2017, following Pental exercising its buy back option on 3 July 2017. The purchase price is $6.891 million plus estimated stamp duty and related costs of $0.454 million. The total estimated acquisition cost is $7.345 million.
Cash reserves will also be utilised to complete further major capital works to upgrade the manufacturing facilities, which is expected over the next two years before returning to a normalised level of capital expenditure. Major capital works in FY18 will include the commencement of the soap plant upgrade and increasing plant capacity in producing non bleach based products.
For
per
sona
l use
onl
y

15
Strategic objectives & activities - Five key pillars to drive growth
Pental’s vision is to be a leading supplier of shelf stable (non-food) products to its chosen markets built around a reputation of delivering quality, innovation and sustainability to the satisfaction of customer needs whilst enhancing shareholder value.
Pental remains focused on what we believe are the highest-value opportunities for driving long-term profitable growth and generating solid total shareholder returns. The five strategic pillars to drive growth have continued to guide our decisions. A review of FY17 outcomes and progress follows:
Strategic Objective Outcomes and progress in FY17
1. Creating a solid platform for growth;
Continuously improving on the basics: safety, people, engagement, environment, quality, customer service, preventative maintenance processes, logistics and information systems; and
Installing cost-effective, high-performance manufacturing capability, where importation of the product is not cost effective and/or not aligned with its Australia made, Australia-owned marketing positioning.
Our health and safety vision, ‘Safety must always come first”, means we will not compromise on workplace safety in the pursuit of other business goals. We care about the health and safety of our employees, contractors and visitors, and we are focused on eliminating work-related injury. We believe that all incidents are preventable. There is a continuing commitment to identify and eliminate risks with the prime objective being to prevent injuries from occurring.
Through a safety conscious work force supported by safety initiatives such as safety walks by managers, random safety reviews for sections of the plant and monthly safety meetings, we have not only protected our team, but Pental’s WorkCover continues to be below industry standard. However, as much as we aim for zero harm, one lost time injury was reported in FY17.
While our strategic direction is top of mind with our employees, this cannot be delivered without fostering a highly motivated team committed to Pental’s core values. Maintaining a strong company culture is a critical organisational enabler and in 2017 our people substantively reconfirmed Pental’s core values and have continued to positively drive continuous improvement disciplines throughout the operations.
As continuous improvement disciplines spread throughout the manufacturing operations, the business recognised that engineer skills and preventative maintenance disciplines remained below expectations and was one of the causes of not consistently achieving the efficiency targets. As a result two senior engineers were appointed in the first half of FY17 with the appropriate skills to manage the new state-of-the-art equipment and to enhance the preventative maintenance disciplines. A refocused manufacturing operations team has steadily increased efficiency levels, which resulted in direct wages net of manufacturing recoveries improving by 28.7% on last year with 9.1% more cartons produced.
Preventative maintenance, whilst improved, is still a key area of focus in FY18, as we continue to build robust and sustainable disciplines.
Though it was pleasing to see the production efficiency progress being made, an unforeseen breakdown of Pental’s newly installed bleach filling line in January 2017 caused a shortage of stocks, impacting the result in the second half. Management was able to realign sales plans and change promotional activities in response, but these actions impacted gross margins in the second half. Margins have now returned to historical levels. The breakdown also caused our service levels measured by “DIFOT” (Delivered in Full On Time) to fall below acceptable levels and in turn led to loss of higher margin sales.
For
per
sona
l use
onl
y

16
Strategic Objective Outcomes and progress in FY17
The poor DIFOT, not only had a direct impact on the White King and Janola business, but also delayed the roll out of new products, until Pental returned to acceptable DIFOT levels.
Whilst DIFOT has returned to industry acceptable levels, further works are underway to ensure raw materials are delivered in time and as specified, such as in supplier operational audits, and that the preventative maintenance program is further improved to minimise unplanned stoppages, thus increasing plant efficiency.
During the year $3.067 million of capital improvements were undertaken, which included numerous smaller plant upgrades and replacements, site improvements and the completion of projects initiated in the prior year such as soap cutting equipment, SWING plant and installation of the new bulk plant. Following the new bulk plant commissioning in September 2016, it delivered on the first objective to reduce the cost of bulk products previously outsourced. Furthermore, the new equipment successfully produced a new range of commercial and industrial cleaning products under the White King and Sunlight brands.
The next major phases of the manufacturing strategy involves:
o upgrading of the bar soap factory;,
o increasing the level of automation in soap packaging; and
o increasing plant capacity to produce non-bleach based products. This will involve using existing “bleach” filling and packaging equipment with new batching equipment and processes to produce both non–bleach and bleach products.
Business cases for these upgrades are being evaluated and will depend on branded and private label sales growth opportunities in Australasia and Asia.
2. Optimising value growth from the current portfolio;
Focus on and over invest in growth categories and our power brands;
Build strategic alliances with category leaders to access customer insights and innovation pipeline;
Optimise pack and price in the right channel; and
Drive innovation - build its new product pipelines and launch new products to the market.
Pental has operated a common brand management process for several years. The process involves the creation of brand plans, which outlines the actions to be undertaken to grow and strengthen the brand for the year and beyond. The key focus was to grow our Core Power brands - White King, Country Life, Janola and Sunlight and then support our other “maintain” brands such as Jiffy, Little Lucifer, Velvet, Pears and Softy.
We also reviewed our longer-term position on a number of smaller trading brands and we expect to transition the smaller brands under some of our core “maintain” brands in order to increase key brand presence on shelf and leverage our marketing program over fewer larger brands compared to doing the same over numerous smaller brands. These transitional plans will be rolled out over the next few years. On the back of these brand plans the marketing and research and development teams launched a number of new products into growth categories, some previously not tackled by Pental. The successes and learnings have varied, but our innovation and drive to become a product leader is a key priority Pental will continue to aggressively pursue. During the year, some of the key products were launched into the market and others were developed and accepted by retailers ready for FY18:
White King Blue Range was launched in March 2017. The kitchen and bathroom cleaners have a non-bleach formulation, with comparative product testing indicating a higher efficacy. Pental is targeting to expand into this growth category. The White King brand market share continues to grow strongly at 6.3%*, with some key areas to note:
o Toilet cleaners grew 11.9%* o Household cleaners grew 5.9%* o White King Oxy grew 24.3%* o Increased White King Toilet shelf presence with key retailers
Whilst the general liquid bleach category of $19.2 is not growing, it continues to provide significant base and value in positioning expansion into other categories - White King has 80% of the branded liquid bleach market and Pental also supplies the majority of private label in this category*.
For
per
sona
l use
onl
y

17
Strategic Objective Outcomes and progress in FY17
On the back of success of the White King range in Australia, five new Janola toilet cleaning (Toilet PowerGel and In Bowl Cleaners) and
household cleaning (Mould & Soap Scum and bleach Power Cleaners) products were launched into the New Zealand market in June 2017.
New Sunlight Automatic Dish Washing tablets were developed during the year and will be ranged with New Zealand retailers in FY18. This is an exciting opportunity that complements the Sunlight Manual Dish Washing range (Sunlight being the third largest manual dish wash brand in New Zealand). Furthermore, Pental developed a new range of 2 litre dish washing liquids to diversify its range from 500ml and 750ml offerings, where the smaller sizes continue to be aggressively priced. The 2 litre size is now ranked the third top selling product* based on sales.
In early FY17 the Australian Country Life brand (mainly known for bar soaps) was launched into the liquid wash categories - entry into these categories was new to Pental. We achieved $1.660 million in gross sales in FY17 and the launch was strongly supported with significant investment through in-house development, digital marketing and in-store promotional activities (trade spend). However, “sales rate” per store did not achieve the expected levels with a major Australian grocery retailer.
Country Life Liquids ranging will continue with other retailers and we are excited with interest expressed in the export channel. In the short term we will refocus on Country Life bar soaps where Pental is the only manufacturer to be able to claim that its bar soaps are 100% Australian Made – from raw materials to finished products. At a later time, we will relaunch into the Australian grocery personal care liquid wash categories.
Little Lucifer brand was repositioned as the “Foodie’s Choice” fire needs range. This not only helped promote the key features of the firelighters, such as not affecting flavours, non-toxic and odourless, but allowed the fire range to be extended. In July 2017, Little Lucifer Scented Wood Chips were launched with retailers.
Similarly the Jiffy brand, in the fire needs category, was repositioned as the “outdoor living” firelighter brand, where Jiffy is the Number 1 selling product in grocery firelighters*. Furthermore, in June 2017 Jiffy Fire Lighting Sticks was introduced into the range.
Pental is the only firelighter manufacture in Australia (making its Jiffy and Little Lucifer 24 cube firelighters) and in FY17 significantly outperformed category growth and holds 42% of the grocery accounts*.
Following commissioning of the bulk plant, Pental launched a five litre commercial range of cleaning products. These included White King Sanitiser & Disinfectant, White King Floor cleaner, White King Glass Cleaner, Sunlight Rinse Aid, Sunlight Laundry Liquid and Sunlight Hand Wash.
A new Huggie range of fabric conditioners was launched in June 2017 on the back of the strong credentials provided by the Choice consumer advocacy group review of fabric softeners, which rated Pental’s Huggie Ultra Concentrate Fabric conditioner the best in the market. The new Huggie Easy Iron, Huggie Quick Dry and Huggie Eco Wash Fabric Concentrate range demonstrates Pental’s commitment to providing high-quality Australian products.
* Based on Aztec data
For
per
sona
l use
onl
y

18
Strategic Objective Outcomes and progress in FY17
As evident from the extensive new range of products, this was the key focus of the marketing budget in FY17 supported by in store activation and ongoing instore promotional activities (trade spend).
Pental’s power brands remain strong and front-of-mind in the marketplace, however we can’t slow down, in fact we are accelerating our actions to deliver both short-term and long-term sustainable growth, with innovative and quality products to consumers. In last quarter of FY17, we’ve put additional resources behind our brands by refreshing key sales, R&D and marketing positions to focus on highlighting the superior value of our brands and to accelerate driving new products into market, to be supported by strong targeted marketing programs and promotional activities in FY18.
3. Driving year-on-year real productivity savings;
Driving an agile business, eliminating low-value activities and reducing costs through product cost innovation and improved manufacturing techniques, supply chain optimisation and improved procurement, all lead to savings that can be reinvested to drive growth and improve profitability. Whilst the constant change of market conditions and ongoing price increase pressures from local and overseas suppliers has not subsided, Pental’s Continuous Improvement/Profit Delivery Projects process delivered significant savings of $1.087 million in FY17: For example:
o Renegotiation of pallet rates, changing from road to rail transport for certain destinations and container reusage.
o Improved buying of non-commodity based raw materials and services, and reduced wastage, such as fragrances, packaging, waste disposal costs;
o Minimising production changeover times;
o Reformulation of branded and private label of products; and
o Sourcing of finished products from new countries.
Furthermore, with the capital investment completed in prior years, and improved management of staffing and continuous improvement focused on increasing manufacturing efficiency, direct wages net of manufacturing recoveries improved by 28.7% on last year.
However, these significant savings were diluted by ongoing cost pressures from other areas, such as:
o Significant increases in gas and electricity prices. Although a number of initiatives have been introduced to minimise this impact,
utility price increases remain a challenge for the manufacturing sector; and
o The rise in some commodity-based raw materials, such as tallow and coconut, used in Country Life soaps. In FY17, the average
tallow was at a seven-year high. Pleasingly, in late May 2017 tallow prices improved. However, coconut prices remained very high,
due to the increased popularity of the ingredient.
Whilst year-on-year savings continues to be challenging, we are confident that the constant review of raw material and finished goods supply contracts, operational processes and other service costs will deliver ongoing savings and ensure Pental’s cost of goods remain competitive.
For
per
sona
l use
onl
y

19
Strategic Objective Outcomes and progress in FY17
4. Accelerating our capability to grow the export business and private label; and
We are excited with the steady progress being made to expand into new Asian markets; however it has proved to be challenging. In FY17 gross sales increased by $1.157 million, to $1.848 million. Geographically, we are widening our product reach from dotted cities along Eastern regions into wider regions and more provinces and cities into Central, Northern and Southern China, and in June 2017 a container also went to Vietnam. White King, Country Life, Velvet, Softly, Natural Selections sales have increased in a number of bricks and mortar stores and products were officially launched into two of the more popular e-commerce platforms in China - JD.com and Kaola.com.
Furthermore, on the back of increasing demand for Australian-made quality Pental branded products, which is our major focus, we also commenced contract manufacturing for multiple Chinese customers.
Whilst sales are slower than initially foreseen, it is worth remembering that Pental products and brands are totally new in this very competitive Chinese/Asian market. As a result, penetration into this new market will take some time for consumers to recognise our power brands and make their first and repeat purchases. Furthermore, during the year, progress was slowed as Chinese customs import regulations changed and Pental products required reverification, which was achieved without any concerns.
Bedding down the Chinese channel is the first step to building a sustainable Asian export business, which will continue to grow through enhancing Pental brand exposure in the Asian markets and the ongoing roll-out of new product development.
As we have innovated brand products, our private label sales growth of 6.0% on last year has being achieved by providing new formulas, fragrances and packaging formats to meet the progressive demands of today’s consumers. Private label represents 15% of gross sales and continues to be core element of the Pental business, and whilst sales growth is important, our key focus is on achieving commercially acceptable margins on the back of our manufacturing plant operating at optimum levels.
5. Driving growth through non-retail commercial and industrial channels.
The initial step of completing the commissioning of the new bulk plant was completed on target and on budget in September 2016. Concurrently, additional R&D and marketing resources were put in place, and we developed an exciting range of White King and Sunlight five litre products.
The launch of these commenced positively, with solid expression from a number of customers. However, due to staff turnover in the Pental commercial sales area, sales execution in these new channels was slower than initially anticipated. Initial ranging has been obtained in a number of new food, office and bulk good retailers and distributors. With further field development work to be undertaken in FY18, we expect this new channel to produce steady growth, whilst Pental establishes its new range of commercial cleaning products.
As the five pillars remain the cornerstone of our approach in organically growing the business, we also continue to search for new partnerships, distributorships and acquisitions that will complement the Company’s product range/expertise, and scope to leverage its infrastructure and/or provide the ability to expand into new channels.
For
per
sona
l use
onl
y

Pental Limited
Directors’ report
20
Operational risks
There are a number of operational risks, both specific to Pental and of a general nature, which may impact the future operating and financial performance of the Group. There can be no guarantee that Pental will achieve its objectives or that forward looking statements will be realised. The operating and financial performance is influenced by a variety of general economic and business conditions including levels of consumer spending, inflation, interest and exchange rates, and certain raw material prices such as tallow and/or sustainable palm noodles used in some soap products, and the price of resin affecting the cost of bottles. The specific material business risks faced by the Group and how the Group manages these risks are set out below:
Competition: the majority of Pental’s products are sold in supermarkets in Australia and New Zealand, which are dominated by two major participants in Australia. These retailers have been aggressively reviewing their product mix and also implementing a move towards their own or private label products. This has the potential to lead to delisting of Pental’s products by one or both of those retailers, which could cause a significant drop in sales of any product delisted. The two major participants have also been engaging in an aggressive campaign for market share, primarily through product price reductions. This has made it difficult for Pental to pass on price rises, despite rising production costs, thus impacting margins. This situation is not expected to change in the short to medium term. Pental believes it can continue to successfully operate in the Fast Moving Consumer Goods market through strong product innovation and managing its product sourcing and manufacturing costs;
Product sourcing: Pental relies on a range of parties for its product-sourcing strategy. Any change in existing relationships (including the termination of any key supply arrangements) or any change in terms or conditions of overseas/local suppliers and any change in the political or economic environment may lead to material adverse changes to Pental’s operational and financial performance. Pental is continually refining its sourcing arrangements and has in many instances dual sourcing arrangements that facilitates in reducing this risk;
Supply chain: Pental has established an extensive and reliable supply chain that allows it to procure and deliver products to customers in a timely and efficient manner. Disruption to any aspect of this supply chain could have a material adverse impact on Pental’s operational and financial performance. Pental’s ongoing review of supply chain costs and the corresponding change of supply chain arrangements with minimal disruption, shows that Pental is able to effectively manage this risk;
Loss of key personnel : Pental’s future success depends to a significant extent on the retention of key personnel, in particular its management team. These individuals have extensive experience in, and knowledge of the market Pental operates in and Pental's business. The loss of key personnel and the time taken to recruit suitable replacements or additional personnel could adversely affect the Company’s future financial performance. The Board has reviewed the organisational structure of the business and will continue to do so to ensure the best people are retained, whilst investing in developing other key people in the business; and
Damage to Pental's brands: the reputation and value associated with Pental’s brand names could be adversely impacted by a number of factors including failure to provide customers with the quality of products they expect and disputes with third parties such as suppliers or customers or adverse media coverage. Significant erosion in the reputation of, or value associated with, Pental's brands could have an adverse effect on Pental’s future financial performance. Pental believes that its processes and systems, and proactive tracking and management of any disputes, minimises this risk.
Outlook
The outlook for the Group is contained in the Chairman’s report.
Changes in the state of affairs During the financial year there were no significant changes in the state of affairs of the Group, other than as referred to in this Annual Report.
Future developments
Information regarding likely developments in the operations of the Group in future financial years is set out in the Review of
operations and elsewhere in the Annual Report.
Subsequent events
There has not been any matter or circumstance occurring subsequent to the end of financial year that has significantly
affected, or may affect, the operations of the Group, the results of those operations, or the state of affairs of the Group in
future financial years, except for:
Acquisition of Shepparton Property
Following the approval by shareholders at the November 2016 Annual General Meeting, Pental exercised its option to buy back the Shepparton property on 3 July 2017. The purchase price is $6.891 million plus estimated stamp duty and related costs of $0.454 million. Total estimated acquisition cost is $7.345 million. Settlement of the property was completed on 2 August 2017.
For
per
sona
l use
onl
y

Pental Limited
Directors’ report
21
Dividends
In respect of the year (53 weeks) ended 2 July 2017 an interim fully franked dividend of 1.15 cents per ordinary share was paid on 24 March 2017, and the directors have declared the payment of a final fully franked dividend of 2.10 cents per ordinary share, payable to shareholders on 29 September 2017, with a record date of 11 September 2017. The total dividend for the FY17 financial year of 3.25 cents per share represents a payout ratio of 75.7%.
In the prior year ended 26 June 2016, the total dividend paid was 2.95 cents per ordinary share, representing a payout ratio of 71.4%.
Pental’s dividend policy is to distribute at least 60% of the Company’s net profit after tax to shareholders, subject to the
Board’s overall discretion on dividend payments.
Environmental regulations
The Shepparton manufacturing site is subject to various pieces of environmental legislation. Licences and Agreements relevant to the environmental performance of its operations are currently held with Goulbourn Valley.
Pental proactively monitors the amount of trade waste discharge from the site and in recent years significantly changed it manufacturing equipment and processes to minimise trade waste. Whilst there have been some minor trade waste non-compliances, Pental continues to be focussed on working with Goulburn Valley Water to implement sustainable solutions.
Environmental performance is reported to the Site Management Group and the Board as required.
Shares under option or issued on exercise of options
There were no unissued shares under options as at the date of this report.
Indemnification of officers and auditors
During the financial year, the company paid a premium in respect of a contract insuring the directors of the company (as
named above), the company secretary, Oliver Carton, and all executive officers of the company and of any related body
corporate against a liability incurred by such a director, secretary or executive officer to the extent permitted by the
Corporations Act 2001. The contract of insurance prohibits disclosure of the nature of the liability and the amount of the
premium.
The company has not otherwise, during or since the end of the financial year, except to the extent permitted by law,
indemnified or agreed to indemnify an officer or auditor of the company or of any related body corporate against a liability
incurred as such an officer or auditor.
Directors’ meetings
The following table sets out the number of directors’ meetings (including meetings of committees of directors) held during the
financial year and the number of meetings attended by each director (while they were a director or committee member).
During the financial year, 11 Board, 4 Audit Committee and 2 Remuneration Committee meetings were held.
Board of
Directors
Audit
Committee Remuneration
Committee
Directors Eligible to
Attend Attended Eligible to
Attend Attended Eligible to
Attend Attended
Peter Robinson 11 11 4 4 2 2
Mel Sutton 11 11 4 3 2 1
John Rishworth 11 11 4 3 2 2
John Etherington 11 11 4 4 2 2
Kimberlee Wells 11 10 - - 2 1
For
per
sona
l use
onl
y

Pental Limited
Directors’ report
22
Proceedings against the Company
On 13 December 2016 ACCC commenced proceedings concerning claims made by Pental on the packaging for its White King Bathroom Flushable Wipes and on its websites that the wipes were flushable and/or that they disintegrate like toilet paper, which the ACCC alleges to be false, misleading or deceptive conduct.
The product packaging was inherited by Pental from a major international company with a long history of selling consumer products. Accordingly, Pental held the belief that the labelling and packaging of the White King Bathroom Wipes were in conformity with all relevant legal requirements.
In September 2014, Pental undertook its own review of the White King Bathroom Flushable Wipes packaging and removed the claims relating to disintegration like toilet paper. This was approximately 18 months prior to any ACCC investigation or any controversy about 'flushability' claims.
Pental continued to sell the biodegradable White King Bathroom Wipes as 'flushable' products for a period of time. There is currently no legal standard for flushability and therefore there is an inherent degree of ambiguity about the meaning of that term, and that the product is biodegradable.
Nevertheless, in response to the ACCC's concerns, Pental took action to remove the word 'flushable' from the White King Bathroom Wipes packaging and its websites in or around July 2016.
Pental takes its obligations under the Competition and Consumer Act 2010 (Cth) seriously. Pental has co-operated with the ACCC since it commenced an investigation in February 2016.
Pental is therefore disappointed that the ACCC has decided to issue proceedings despite Pental's proactive approach in removing the claims of concern to the ACCC and the fact that other larger multinational companies continue to sell similar products labelled as ‘flushable’ but are not subject to the same proceedings.
There are no other proceedings being brought against the company.
Non-audit services
Details of amounts paid or payable to the auditor for non-audit services provided during the year by the auditor are outlined in
Note 30 to the financial statements.
The directors are satisfied that the provision of non-audit services during the year, by the auditor (or by another person or firm
on the auditor’s behalf) is compatible with the general standard of independence for auditors imposed by the Corporations Act
2001.
The directors are of the opinion that the services as disclosed in Note 30 to the financial statements do not compromise the
external auditor’s independence, based on advice received from the Audit Committee, for the following reasons:
all non-audit services have been reviewed and approved to ensure that they do not impact the integrity and
objectivity of the auditor, and
none of the services undermine the general principles relating to auditor independence as set out in Code of
Conduct APES 110 Code of Ethics for Professional Accountants issued by the Accounting Professional & Ethical
Standards Board, including reviewing or auditing the auditor’s own work, acting in a management or decision-
making capacity for the company, acting as advocate for the company or jointly sharing economic risks and rewards.
Auditor’s independence declaration
The auditor’s independence declaration is included on page 28 of the annual report.
Rounding off of amounts
The Company is a company of the kind referred to in ASIC Class Order 98/0100, dated 10 July 1998, and in accordance with that Class Order amounts in the directors’ report and the financial report are rounded off to the nearest thousand dollars, unless otherwise indicated.
For
per
sona
l use
onl
y

Pental Limited
Directors’ report
23
Remuneration report - audited
This remuneration report details the nature and amount of remuneration for each director and senior management personnel
of Pental Limited.
The directors and other members of key management personnel of the Group during the year were:
Peter Robinson Non-executive Independent Chairman
Mel Sutton Non-executive Vice-Chairman
John Rishworth Non-executive Independent Director
John Etherington Non-executive Independent Director
Kimberlee Wells Non-executive Independent Director
Charlie McLeish Chief Executive Officer
Albert Zago Chief Financial Officer
Remuneration Policy
The remuneration policy of Pental Limited has been designed to align director and executive objectives with shareholder and business objectives by providing a fixed remuneration component and offering specific short-term and long-term incentives based upon key performance areas affecting the Group’s financial results. The board of Pental Limited believes the remuneration policy to be appropriate and effective in its ability to attract and retain the best executives and directors to run and manage the Group, as well as create goal congruence between directors, executives and shareholders. The Board’s policy for determining the nature and amount of remuneration for board members and senior executives of the Group is as follows: The remuneration policy, setting the terms and conditions for the executive directors and other senior executives, was developed and approved by the Board. Executive packages are reviewed annually by reference to the Group’s performance, executive performance and comparable information from industry sectors and other listed companies in similar industries. The performance of executives is measured regularly against agreed criteria and is based predominantly on the forecast growth of the Group’s profits and shareholders’ value. All bonuses and incentives are linked to predetermined operational and financial performance criteria. Executives are also entitled to participate in a performance rights plan. The directors and executives receive a superannuation guarantee contribution required by the law, and do not receive any other retirement benefits. Some individuals, however, may choose to sacrifice part of their salary to increase payments towards superannuation. The Board policy is to remunerate non-executive directors at market rates for comparable companies for time, commitment and responsibilities. The Board determines payments to the non-executive directors and reviews their remuneration annually, based on market practice, duties and accountability. The maximum aggregate amount of fees that can be paid to non-executive directors is subject to approval by shareholders at the Annual General Meeting. The maximum aggregate amount of fees that can be paid to non-executive directors as per last approval is $0.750 million. Fees for non-executive directors are not linked to the performance of the Group. No shares or options have been issued to non-executive directors, under the performance rights plan or an option scheme, within the last five years.
Key terms of employment contracts
Mr Charlie McLeish is employed by the Group under an ongoing contract. The period of notice required by either party to terminate the contract is twelve months without cause. Mr McLeish is entitled to receive a maximum yearly bonus of 35 per cent of his base salary plus superannuation. He is also entitled to participate in the Executive Performance Rights Plan (Rights Plan) as a long-term incentive, which is aligned to the Company’s performance.
Mr Albert Zago is employed by the Group under an ongoing contract which may be terminated on three months’ notice by either the Company or the executive. Mr Zago is entitled to receive a maximum yearly bonus of 30 per cent of his base salary plus superannuation. Mr Zago is also entitled to participate in the executive Rights Plan.
Relationship between the remuneration policy and company performance
The remuneration policy has been tailored to increase goal congruence between shareholders, directors and executives. This
has been achieved through a performance-based bonus system based on key performance indicators. F
or p
erso
nal u
se o
nly

Pental Limited
Directors’ report
24
The tables below set out summary information about the Group’s earnings and movements in shareholder wealth for the five
years to June 2017. It has been the focus of the Board of Directors to retain management personnel essential to the profitable
operations of the Group, and to attract suitable executives.
2 July
2017
$’000
26 June
2016
$’000
28 June
2015
$’000
29 June
2014
$’000
30 June
2013
$’000
Gross sales 117,660 109,980 111,150 109,376 141,060
Net profit/(loss) before tax
from continuing operations 8,343
8,218
7,035
7,338
739
Net profit/(loss) after tax
attributable to members of
the parent entity 5,850
5,628
5,087
5,336
1,893
2 July
2017
26 June
2016
28 June
2015
29 June4
2014
30 June4
2013
Share price at start of year 4 $0.575 $0.44 $0.033 $0.020 $0.075
Share price at end of year $0.595 $0.575 $0.44 $0.033 $0.020
Interim dividend (cents) per
share 1, 3
1.15
1.00
0.85
-
-
Final dividend (cents) per
share 1, 2, 3
2.10
1.95
1.80
0.12
-
Basic earnings (cents) per
share 3 4.29 4.13 4.08 0.34 0.20
Diluted earnings (cents) per
share 3 4.18 4.04 4.02 0.33 0.20
1 Franked to 100% at 30% corporate income tax rate.
2 Declared after the balance date and not reflected in the financial statements of that year.
3 On 1 December 2014, ordinary shares and options on issue were consolidated on the basis of 15 to 1.
4 Information provided is prior to the 1 December 2014 share consolidation on the basis of 15 to 1.
The compensation of each member of the key management personnel of the Group for the current year is set out below:
2017
Short-term employee benefits Post-employment
benefits
Share–based
payments
Total $
Salary & fees
$ Bonus
$
Non-monetary
(i)
$ Superannuation
$
Rights $
Non Executive Directors
Peter Robinson 91,325 - - 8,676 - 100,001 Mel Sutton 73,060 - - 6,941 - 80,001 John Rishworth 54,795 - - 5,205 - 60,000 John Etherington 54,795 - - 5,205 - 60,000 Kimberlee Wells 60,000 - - - - 60,000 -
Total Directors 333,975 - - 26,027 - 360,002
Executives
Charlie McLeish 392,694 40,000 5,873 34,997 22,061 495,625
Albert Zago 298,335 12,500 6,946 18,783 13,142 349,706
Total Executives 691,029 52,500 12,819 53,780 35,203 845,331
Total Remuneration 1,025,004 52,500 12,819 79,807 35,203 1,205,333
(i) Non-monetary benefits includes car parking & motor vehicle toll tags.
For
per
sona
l use
onl
y

Pental Limited
Directors’ report
25
The compensation of each member of the key management personnel of the Group for the prior year is set out below:
2016
Short-term employee benefits Post-employment
benefits
Share–based
payments
Total $
Salary & fees
$ Bonus
$
Non-monetary
(i)
$
Superannuation $
Rights $
Non Executive Directors
Peter Robinson 91,110 - - 8,676 - 99,786 Mel Sutton 73,059 - - 6,941 - 80,000 Alan Johnstone
(ii) 25,000 - - - - 25,000
John Rishworth 54,795 - - 5,205 - 60,000 John Etherington 54,795 - - 5,205 - 60,000 Kimberlee Wells 36,846 - - - - 36,846 -
Total Directors 335,605 - - 26,027 - 361,632
Executives
Charlie McLeish 384,475 112,875 5,383 36,525 30,451 569,709 Albert Zago 293,394 78,691 6,486 19,281 18,031 415,883
Total Executives 677,869 191,566 11,869 55,806 48,482 985,592
Total Remuneration 1,013,474 191,566 11,869 81,833 48,482 1,347,224
(i) Non-monetary benefits includes car parking & motor vehicle toll tags. (ii) Mr Johnstone retired as a director on 19 November 2015
Transactions with key management personnel
A director related entity of Mr Sutton was paid $8,600 (2016: $124,800) plus GST for consultancy services provided to the Group.
In the prior year, a director related entity of Mr Johnstone (retired director on 19 November 2015) was paid rental of $674,882 plus GST and outgoings, as the landlord of the Shepparton manufacturing and warehousing sites.
Share-based payments (Rights Plan)
The Company has an Executive Performance Rights Plan (Rights Plan) to provide Long Term Incentives (LTI) that is aligned to the Group’s long-term strategy. LTI will be provided as performance Rights granted at the commencement of the relevant three year performance period. The Rights Plan was introduced on 18 December 2014 and provides selected executives with a means of acquiring conditional Rights to acquire an ordinary share in Pental subject to the terms of the Plan, once milestones are met.
The Rights issued and converting Rights to ordinary shares are at no consideration.
The Board may also offer options under the Rights Plan, whereby the option will have an exercise price, whilst the Right does not. There were no options granted during the 2017 year (2016: nil).
The vesting of the Rights is conditional on:
a) the executive being employed by the Pental Group on the vesting date; and
b) Pental’s earnings per share for the financial year prior to the vesting date exceeding the target rate;
thereafter a percentage of the Rights will vest based on achieving the following strategic targets:
Gross sales revenue growth (40% weighting of Rights)
Earnings Before Interest and Tax (EBIT) margin (40% weighting of Rights)
Acquired business EBIT margin (20% weighting of Rights).
For
per
sona
l use
onl
y

Pental Limited
Directors’ report
26
Under the Rights Plan, the executives can receive the following annualised remuneration from the vesting of performance rights:
Percentage of fixed remuneration by achieving:
Threshold Targets Strategic Targets Stretch Strategic Targets
Charlie McLeish 12.5% 25.0% 50.0%
Albert Zago 10.0% 20.0% 40.0%
Details of performance Rights over ordinary shares in the Company that were granted in the current year to key management personnel are set out in the following table:
Grant Date
Vesting Date
Minimum earnings per share target
Cents
Rights granted during 2017
No.
Fair Value per Right at grant date
$
Fair value of rights
granted
$
Charlie McLeish 1 July 2016 1 July 2019 4.69 209,302 0.5178 108,376
Albert Zago 1 July 2016 1 July 2019 4.69 125,581 0.5178 65,026
The Rights are forfeited upon the earliest of the following:
a) if the employee ceases employment with the Group;
b) the Board determines the vesting conditions have not been satisfied; or
c) expiry date, being up to seven years after the grant date of the Rights.
The following factors were used in determining the fair value of the performance rights granted:
Grant Date
Vesting Date
Fair value per Right
$
Exercise Price
$
Price of shares on grant date
$
Estimated volatility
%
Risk free Interest Rate
%
Dividend Yield
%
1 July 2016 1 July 2019 0.5178 - 0.5700 65.00 2.03 4.87
The following table discloses changes in the performance rights holdings of management personnel:
Grant Date
Vesting Date
Balance
at
26/6/2016
No.
Rights granted
No.
Rights
vested
No.
Rights
lapsed/
forfeited
No.
Balance
at
2/7/2017
No.
Charlie McLeish 18/12/2014 3/7/17 740,741 - - - 740,741
Albert Zago 18/12/2014 3/7/17 444,444 - - - 444,444
Charlie McLeish 1/7/2015 1/7/2018 1,007,813 - - - 1,007,813
Albert Zago 1/7/2015 1/7/2018 596,756 - - - 596,756
Charlie McLeish 1/7/2016 1/7/2019 - 209,302 - - 209,302
Albert Zago 1/7/2016 1/7/2019 - 125,581 - - 125,581
There were no share options granted during the 2017 year (2016: nil).
For
per
sona
l use
onl
y

Pental Limited
Directors’ report
27
Key management personnel equity holdings
Fully paid ordinary shares of Pental Limited held by key management personnel:
Balance
at
28/6/15
Options exercised
Net
change other
(i)
Balance
at
26/6/16
Options exercised
Net change other
(i)
Balance(iii)
at
2/7/17
Non-Executive
Directors
Peter Robinson 3,972,926 - - 3,972,926 - - 3,972,926
Mel Sutton - - - - - - -
John Rishworth 13,207 - - 13,207 - - 13,207
John Etherington - - - - - 160,000 160,000
Kimberlee Wells - - - - - - -
Executives
Charlie McLeish (ii)
- - - - - - -
Albert Zago (ii)
- - - - - - -
(i) Net change other relates to shares purchased and sold during the financial year. (ii) Mr McLeish and Mr Zago have been issued rights under an Executive Performance Rights Plan. (iii) There has been no change in shareholdings from the end of the financial year to the date of this report.
Key management personnel share option holdings
Number of share options of Pental Limited held by key management personnel:
During the financial year, no options were granted or exercised by key management personnel (2016: nil).
Mr McLeish and Mr Zago have been offered rights under an Executive Performance Rights Plan. No equity or
options under the Company performance rights plan were issued to Mr Zago or Mr McLeish during the 2016 and
2017 financial years.
This directors’ report is signed in accordance with a resolution of directors made pursuant to s.298 (2) of the Corporations Act
2001.
On behalf of the Directors
Peter Robinson
Chairman
Melbourne, 21 August 2017
For
per
sona
l use
onl
y

Member of Deloitte Touche Tohmatsu Limited
Liability limited by a scheme approved under Professional Standards Legislation.
28
Deloitte Touche Tohmatsu
A.B.N. 74 490 121 060
550 Bourke Street
Melbourne VIC 3000
GPO Box 78
Melbourne VIC 3001 Australia
DX: 111
Tel: +61 (0) 3 9671 7000
Fax: +61 (0) 3 9671 7001
www.deloitte.com.au
Board of Directors
Pental Limited
Level 6, 390 St Kilda Road MELBOURNE, VIC 3004
21 August 2017
Dear Board Members
Auditor’s Independence Declaration – Pental Limited
In accordance with section 307C of the Corporations Act 2001, I am pleased to provide the following
declaration of independence to the directors of Pental Limited.
As lead audit partner for the audit of the financial statements of Pental Limited for the financial year
ended 2 July 2017, I declare that to the best of my knowledge and belief, there have been no
contraventions of:
(i) the auditor independence requirements of the Corporations Act 2001 in relation to the
audit; and
(ii) any applicable code of professional conduct in relation to the audit.
Yours sincerely
DELOITTE TOUCHE TOHMATSU
Andrew Reid Partner
Chartered Accountants
For
per
sona
l use
onl
y

Member of Deloitte Touche Tohmatsu Limited
Liability limited by a scheme approved under Professional Standards Legislation.
29
Independent Auditor’s Report to the Members
of Pental Limited Report on the Audit of the Financial Report
Opinion
We have audited the financial report of Pental Limited (the “Company”) and its subsidiaries (the “Group”) which comprises the consolidated statement of financial position as at 2 July 2017, the
consolidated statement of profit or loss and other comprehensive income, the consolidated statement of
changes in equity and the consolidated statement of cash flows for the year then ended, and notes to the
financial statements, including a summary of significant accounting policies and other explanatory information, and the directors’ declaration.
In our opinion, the accompanying financial report of the Group is in accordance with the Corporations Act 2001, including:
(i) giving a true and fair view of the Group’s financial position as at 2 July 2017 and of its financial
performance for the year then ended; and
(ii) complying with Australian Accounting Standards and the Corporations Regulations 2001.
Basis for Opinion
We conducted our audit in accordance with Australian Auditing Standards. Our responsibilities under
those standards are further described in the Auditor’s Responsibilities for the Audit of the Financial
Report section of our report. We are independent of the Group in accordance with the auditor independence requirements of the Corporations Act 2001 and the ethical requirements of the
Accounting Professional and Ethical Standards Board’s APES 110 Code of Ethics for Professional
Accountants (the Code) that are relevant to our audit of the financial report in Australia. We have also
fulfilled our other ethical responsibilities in accordance with the Code.
We confirm that the independence declaration required by the Corporations Act 2001, which has been
given to the directors of the Group, would be in the same terms if given to the directors as at the time of this auditor’s report.
We believe that the audit evidence we have obtained is sufficient and appropriate to provide a basis for
our opinion.
Deloitte Touche Tohmatsu
ABN 74 490 121 060
550 Bourke Street
Melbourne VIC 3000
GPO Box 78
Melbourne VIC 3001 Australia
Tel: +61 3 9671 7000
Fax: +61 3 9671 7001
www.deloitte.com.au
For
per
sona
l use
onl
y

30
Key Audit Matters
Key audit matters are those matters that, in our professional judgement, were of most significance in
our audit of the financial report for the current period. These matters were addressed in the context of
our audit of the financial report as a whole, and in forming our opinion thereon, and we do not provide
a separate opinion on these matters.
Key Audit Matter How the scope of our audit responded to the Key
Audit Matter
Carrying value of the Consumer Products
cash generating unit
At 2 July 2017, the Group held goodwill of $29.4
million (2016: $29.4 million) allocated to its
Consumer Products cash generating unit (CGU) as
disclosed in Note 13.
Management has assessed the recoverable amount
of the Consumer Products CGU using a
discounted cash flow model which incorporates
judgements about the future growth rate of the
business, the discount rate applied to future cash
flow forecasts and assumptions used in the value-in-use model.
In conjunction with our valuation specialists our
procedures included, but were not limited to:
• obtaining an understanding of
management’s processes associated with the
preparation of the value-in-use model; • agreeing forecast cash flows to the latest
Board approved forecasts and assessing the
historical accuracy of forecasting;
• assessing management’s value-in-use methodology;
• challenging key assumptions, including
forecast growth rates by comparing them to
historical results and economic and industry forecasts;
• evaluating the discount rate used by
assessing the cost of capital for the CGU by
comparison to market data and industry
research; • recalculating the mathematical accuracy of
the value-in-use mode;
• assessing managements sensitivity analyses
around key assumptions used in the valuation model and the likelihood of such a
movement in those key assumptions arising;
and
• evaluating the appropriateness of the related disclosure included in Note 13 to the
financial statements.
Other Information
The directors are responsible for the other information. The other information comprises the information
included in the Group’s annual report for the year ended 2 July 2017, but does not include the financial
report and our auditor’s report thereon.
Our opinion on the financial report does not cover the other information and we do not express any
form of assurance conclusion thereon.
For
per
sona
l use
onl
y

31
In connection with our audit of the financial report, our responsibility is to read the other information
and, in doing so, consider whether the other information is materially inconsistent with the financial report or our knowledge obtained in the audit, or otherwise appears to be materially misstated. If, based
on the work we have performed, we conclude that there is a material misstatement of this other
information, we are required to report that fact. We have nothing to report in this regard.
Responsibilities of the directors for the Financial Report
The directors of the Group are responsible for the preparation of the financial report that gives a true and fair view in accordance with Australian Accounting Standards and the Corporations Act 2001 and
for such internal control as the directors determine is necessary to enable the preparation of the financial
report that gives a true and fair view and is free from material misstatement, whether due to fraud or error.
In preparing the financial report, the directors are responsible for assessing the ability of the Group to
continue as a going concern, disclosing, as applicable, matters related to going concern and using the going concern basis of accounting unless the directors either intend to liquidate the Group or to cease
operations, or has no realistic alternative but to do so.
Auditor’s Responsibilities for the Audit of the Financial Report
Our objectives are to obtain reasonable assurance about whether the financial report as a whole is free from material misstatement, whether due to fraud or error, and to issue an auditor’s report that includes
our opinion. Reasonable assurance is a high level of assurance, but is not a guarantee that an audit
conducted in accordance with the Australian Auditing Standards will always detect a material
misstatement when it exists. Misstatements can arise from fraud or error and are considered material if, individually or in the aggregate, they could reasonably be expected to influence the economic decisions
of users taken on the basis of this financial report.
As part of an audit in accordance with the Australian Auditing Standards, we exercise professional
judgement and maintain professional scepticism throughout the audit. We also:
Identify and assess the risks of material misstatement of the financial report, whether due to
fraud or error, design and perform audit procedures responsive to those risks, and obtain audit
evidence that is sufficient and appropriate to provide a basis for our opinion. The risk of not
detecting a material misstatement resulting from fraud is higher than for one resulting from error, as fraud may involve collusion, forgery, intentional omissions, misrepresentations, or the
override of internal control.
Obtain an understanding of internal control relevant to the audit in order to design audit
procedures that are appropriate in the circumstances, but not for the purpose of expressing an opinion on the effectiveness of the Group’s internal control.
Evaluate the appropriateness of accounting policies used and the reasonableness of accounting
estimates and related disclosures made by the directors.
Conclude on the appropriateness of the director’s use of the going concern basis of accounting
and, based on the audit evidence obtained, whether a material uncertainty exists related to
events or conditions that may cast significant doubt on the Group’s ability to continue as a going concern. If we conclude that a material uncertainty exists, we are required to draw
attention in our auditor’s report to the related disclosures in the financial report or, if such
disclosures are inadequate, to modify our opinion. Our conclusions are based on the audit
evidence obtained up to the date of our auditor’s report. However, future events or conditions may cause the Group to cease to continue as a going concern.
For
per
sona
l use
onl
y

32
Evaluate the overall presentation, structure and content of the financial report, including the
disclosures, and whether the financial report represents the underlying transactions and events
in a manner that achieves fair presentation.
Obtain sufficient appropriate audit evidence regarding the financial information of the entities
or business activities within the Group to express an opinion on the financial report. We are
responsible for the direction, supervision and performance of the Group’s audit. We remain
solely responsible for our audit opinion.
We communicate with the directors regarding, among other matters, the planned scope and timing of
the audit and significant audit findings, including any significant deficiencies in internal control that we identify during our audit.
We also provide the directors with a statement that we have complied with relevant ethical requirements regarding independence, and to communicate with them all relationships and other matters that may
reasonably be thought to bear on our independence, and where applicable, related safeguards.
From the matters communicated with the directors, we determine those matters that were of most significance in the audit of the financial report of the current period and are therefore the key audit
matters. We describe these matters in our auditor’s report unless law or regulation precludes public
disclosure about the matter or when, in extremely rare circumstances, we determine that a matter should not be communicated in our report because the adverse consequences of doing so would reasonably be
expected to outweigh the public interest benefits of such communication.
Report on the Remuneration Report
Opinion on the Remuneration Report
We have audited the Remuneration Report included in pages 32 to 61 of the Director’s report for the year ended 2 July 2017.
In our opinion, the Remuneration Report of Pental Limited, for the year ended 2 July 2017, complies
with section 300A of the Corporations Act 2001.
Responsibilities
The directors of the Group are responsible for the preparation and presentation of the Remuneration
Report in accordance with section 300A of the Corporations Act 2001. Our responsibility is to express
an opinion on the Remuneration Report, based on our audit conducted in accordance with Australian
Auditing Standards.
DELOITTE TOUCHE TOHMATSU
Andrew Reid
Partner
Chartered Accountants Melbourne, 21 August 2017
For
per
sona
l use
onl
y

Pental Limited
Directors’ declaration
33
Directors’ declaration
The Directors declare that:
(a) in the Directors’ opinion, there are reasonable grounds to believe that the company will be able to pay its debts as and
when they become due and payable;
(b) in the Directors’ opinion, the attached financial statements and notes thereto are in accordance with the Corporations
Act 2001, including compliance with accounting standards and giving a true and fair view of the financial position and
performance of the Group;
(c) in the Director’s opinion the financial statements and notes thereto are in accordance with International Financial
Reporting Standards issued by the International Accounting Standards Board as stated in note 2 to the financial
statements; and
(d) the Directors have been given the declarations required by s.295A of the Corporations Act 2001.
At the date of this declaration, the company is within the class of companies affected by ASIC Class Order 98/1418. The
nature of the deed of cross guarantee is such that each company which is party to the deed guarantees to each creditor
payment in full of any debt in accordance with the deed of cross guarantee.
In the Directors’ opinion, there are reasonable grounds to believe that the company and the companies to which the ASIC
Class Order applies, as detailed in note 11 to the financial statements will, as a group, be able to meet any obligations or
liabilities to which they are, or may become, subject by virtue of the deed of cross guarantee.
Signed in accordance with a resolution of the directors made pursuant to s.295 (5) of the Corporations Act 2001.
On behalf of the Directors
Peter Robinson
Chairman
Melbourne, 21 August 2017.
For
per
sona
l use
onl
y
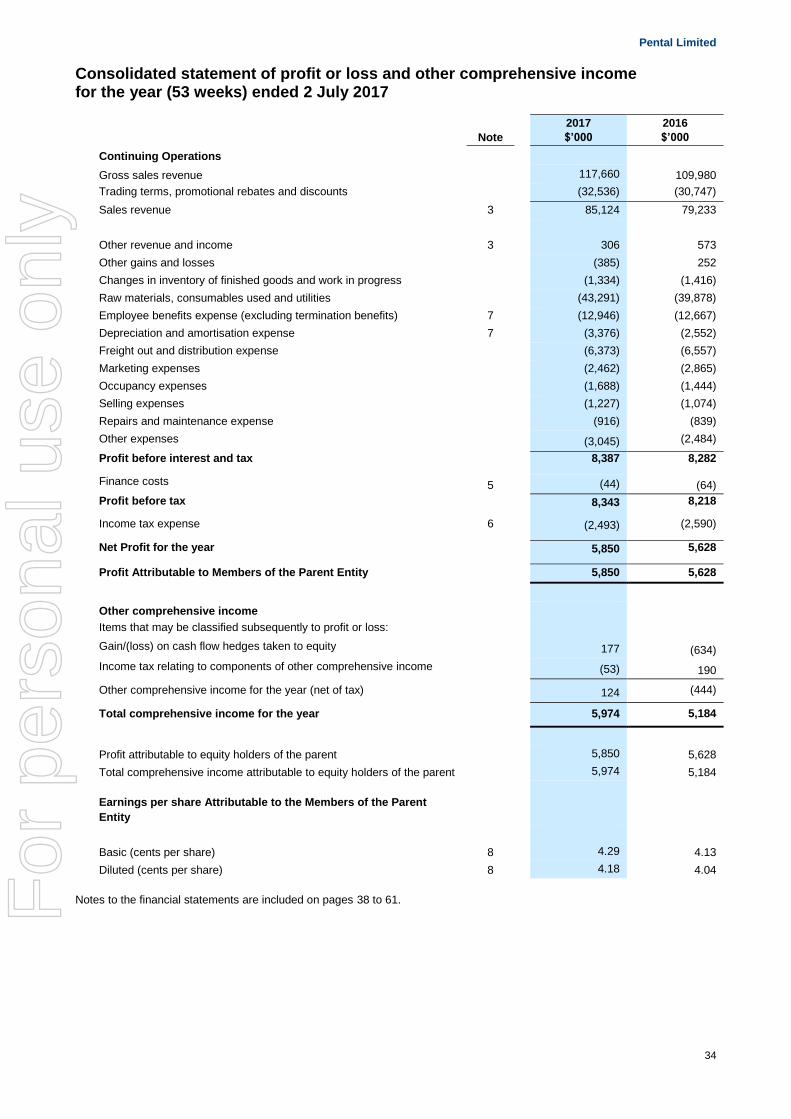
Pental Limited
34
Consolidated statement of profit or loss and other comprehensive income for the year (53 weeks) ended 2 July 2017
Note
2017
$’000
2016
$’000
Continuing Operations
Gross sales revenue 117,660 109,980
Trading terms, promotional rebates and discounts (32,536) (30,747)
Sales revenue 3 85,124 79,233
Other revenue and income 3 306 573
Other gains and losses (385) 252
Changes in inventory of finished goods and work in progress (1,334) (1,416)
Raw materials, consumables used and utilities (43,291) (39,878)
Employee benefits expense (excluding termination benefits) 7 (12,946) (12,667)
Depreciation and amortisation expense 7 (3,376) (2,552)
Freight out and distribution expense (6,373) (6,557)
Marketing expenses (2,462) (2,865)
Occupancy expenses (1,688) (1,444)
Selling expenses (1,227) (1,074)
Repairs and maintenance expense (916) (839)
Other expenses (3,045) (2,484)
Profit before interest and tax 8,387 8,282
Finance costs 5 (44) (64)
Profit before tax 8,343 8,218
Income tax expense 6 (2,493) (2,590)
Net Profit for the year 5,850 5,628
Profit Attributable to Members of the Parent Entity 5,850 5,628
Other comprehensive income
Items that may be classified subsequently to profit or loss:
Gain/(loss) on cash flow hedges taken to equity 177 (634)
Income tax relating to components of other comprehensive income (53) 190
Other comprehensive income for the year (net of tax) 124 (444)
Total comprehensive income for the year 5,974 5,184
Profit attributable to equity holders of the parent 5,850 5,628
Total comprehensive income attributable to equity holders of the parent 5,974 5,184
Earnings per share Attributable to the Members of the Parent
Entity
Basic (cents per share) 8 4.29 4.13
Diluted (cents per share) 8 4.18 4.04
Notes to the financial statements are included on pages 38 to 61. For
per
sona
l use
onl
y

Pental Limited
35
Consolidated statement of financial position as at 2 July 2017
Note
2 July 2017
$’000
26 June 2016
$’000
Current assets Cash and cash equivalents 26(a) 11,660 12,335
Trade and other receivables 9 23,613 23,582
Inventories 10 10,297 8,866
Other 15 335 260
Total current assets 45,905 45,043
Non-current assets
Plant and equipment 12 18,865 18,949
Goodwill 13 29,446 29,446
Other intangible assets 14 14,865 15,091
Total non-current assets 63,176 63,486
Total assets 109,081 108,529
Current liabilities
Trade and other payables 16 17,242 16,659
Other financial liabilities 17 182 358
Current tax payables 6 551 2,275
Provisions 19 1,569 1,394
Total current liabilities 19,544 20,686
Non-current liabilities
Deferred tax liabilities 6 4,446 4,554
Provisions 19 131 112
Total non-current liabilities 4,577 4,666
Total liabilities 24,121 25,352
Net assets 84,960 83,177
Equity
Issued capital 20 90,658 90,658
Reserves (19) (176)
Accumulated losses (5,679) (7,305)
Total equity 84,960 83,177
Notes to the financial statements are included on pages 38 to 61.
For
per
sona
l use
onl
y

Pental Limited
36
Consolidated statement of changes in equity for the year (53 weeks) ended 2 July 2017
Note
Issued
capital
$’000
Hedging
reserve
$’000
Equity
settled
employee
benefits
reserve
$’000
Retained
earnings
$’000
Total
$’000
Balance at 29 June 2015 90,658 193 - (9,117) 81,734
Profit for the year - - - 5,628 5,628
Gain/(loss) on cash flow hedges - (634) - - (634)
Deferred tax arising on hedges 6 - 190 - - 190
Total comprehensive income for the year - (444) - 5,628 5,184
Dividend Payment 21(a) - - (3,816) (3,816)
Recognition of share based payments - - 75 - 75
Balance at 26 June 2016 90,658 (251) 75 (7,305) 83,177
Balance at 26 June 2016 90,658 (251) 75 (7,305) 83,177
Profit for the year - - - 5,850 5,850
Gain/(loss) on cash flow hedges - 177 - - 177
Deferred tax arising on hedges 6 - (53) - - (53)
Total comprehensive income for the year - 124 - 5,850 5,974
Dividend Payment 21(a) - - - (4,224) (4,224)
Recognition of share based payments - - 33 - 33
Balance at 2 July 2017 90,658 (127) 108 (5,679) 84,960
Notes to the financial statements are included on pages 38 to 61.
For
per
sona
l use
onl
y

Pental Limited
37
Consolidated statement of cash flows for the year (53 weeks) ended 2 July 2017
Note
2017
$’000
2016
$’000
Cash flows from operating activities
Receipts from customers 139,262 132,457
Payments to suppliers and employees (128,475) (121,202)
Interest received 225 272
Interest and other costs of finance paid (44) (64)
Income tax paid (4,353) (204)
Net cash provided by operating activities 26(b) 6,615 11,259
Cash flows from investing activities
Payments for plant and equipment 12 (2,932) (5,898)
Payments for intangible assets 14 (134) (250)
Net cash used in investing activities (3,066) (6,148)
Cash flows from financing activities
Dividends paid 21 (4,224) (3,816)
Net cash used in financing activities (4,224) (3,816)
Net increase/(decrease) in cash and cash equivalents (675) 1,295
Cash and cash equivalents at the beginning of the financial year
12,335 11,040
Cash and cash equivalents at the end of the financial year 26(a) 11,660 12,335
Note to the financial statements are included on pages 38 to 61.
For
per
sona
l use
onl
y

Pental Limited
Notes to the financial statements
38
1. General Information
Pental Limited, incorporated and domiciled in Australia, is a publicly listed company on the Australian Stock Exchange, limited
by shares.
Company Secretary
Mr Oliver Carton
Principal Registered office
Pental Limited
Level 6, 390 St. Kilda Road
Melbourne Victoria 3004
Telephone: (03) 9251 2311
Facsimile: (03) 9645 3001
www.pental.com.au
Share Registry
Boardroom Pty Limited
Grosvenor Place, Level 12,
225 George Street Sydney NSW 2000
Telephone within Australia: 1300 737 760
Telephone outside Australia: +61 2 9290 9600
Facsimile: +61 2 9279 0664
www.boardroomlimited.com.au
2. Significant accounting policies
Statement of compliance
These financial statements are general purpose financial statements which have been prepared in accordance with the
Corporations Act 2001, Accounting Standards and Interpretations, and comply with other requirements of the law. The financial
statements comprise consolidated financial statements of the consolidated entity (the “Group”). For the purposes of preparing
the consolidated financial statements, the Company is a for-profit entity.
Accounting Standards include Australian equivalents to International Financial Reporting Standards (‘A-IFRS’). Compliance with
A-IFRS ensures that the financial statements and notes of the Group comply with International Financial Reporting Standards
(‘IFRS’).
The financial statements were authorised for issue by the directors on 21 August 2017.
Basis of preparation
The financial statements have been prepared on the basis of historical cost, except for the revaluation of certain financial
instruments. Cost is based on the fair values of the consideration given in exchange for assets. All amounts are presented in
Australian dollars, unless otherwise noted.
The company is a company of the kind referred to in ASIC Class Order 98/0100, dated 10 July 1998, and in accordance with
that Class Order amounts in the financial report are rounded off to the nearest thousand dollars, unless otherwise indicated.
Critical accounting judgments and key sources of estimation uncertainty
In the application of the Group’s accounting policies, management is required to make judgments, estimates and assumptions
about carrying values of assets and liabilities that are not readily apparent from other sources. The estimates and associated
assumptions are based on historical experience and other factors that are considered to be relevant. Actual results may differ
from these estimates.
The estimates and underlying assumptions are reviewed on an ongoing basis. Revisions to accounting estimates are
recognised in the period in which the estimate is revised if the revision affects only that period or in the period of the revision
and future periods if the revision affects both current and future periods. The following are the key assumptions concerning the future, and other key sources of estimation uncertainty at balance sheet date, that have a significant risk of causing a material adjustment to the carrying amounts of assets and liabilities within the next financial year:
Impairment of goodwill and brand names
Determining whether goodwill and brand names are impaired requires an estimation of the value in use of the cash-generating units to which goodwill and brand names have been allocated. The value in use calculation requires the entity to estimate the future cash flows expected to arise from the cash-generating unit and a suitable discount rate in order to calculate present value.
As a consequence of an IFRS Interpretation Committee (IFRIC) agenda decision issued in November 2016, management has amended its accounting policy to recognise a deferred tax liability on indefinite life intangibles acquired as part of a business combination. The amendment resulted in an increase of $4.362 million to goodwill and deferred tax liabilities as at the beginning of the earliest comparative period. The carrying amount of goodwill at 2 July 2017 was $29.446 million (26 June 2016: $29.446 million). Details of the impairment testing are set out in Note 13.
The carrying amount of brand names at 2 July 2017 was $14.539 million (26 June 2016: $14.539 million). Details of movements are set out in Note 14. Details of the impairment testing are set out in Note 13.
Impairment of property, plant and equipment
Determining whether property, plant and equipment are impaired requires an estimation of the value in use of the cash-generating units to which property, plant and equipment have been allocated. The value in use calculation requires the entity to
For
per
sona
l use
onl
y

Pental Limited
Notes to the financial statements
39
estimate the future cash flows expected to arise from the cash-generating unit and a suitable discount rate in order to calculate present value.
The carrying amount of property, plant and equipment at 2 July 2017 was $18.865 million (26 June 2016: $18.949 million). Details of movements are set out in Note 12.
Adoption of new and revised Accounting Standards
In the current year, the Group has adopted all of the following new and revised Standards and Interpretations issued by the
Australian Accounting Standards Board (the AASB) that are relevant to its operations and effective for the current annual
reporting period:
(i) AASB 2014-4 Amendments to Australian Accounting Standards - Clarification of Acceptable Methods of
Depreciation and Amortisation (effective 1 January 2016)
(ii) AASB 2015-1 Amendments to Australian Accounting Standards - Annual Improvements to Australian Accounting
Standards 2012-2014 Cycle (effective 1 January 2016)
(iii) AASB 2015-2 Amendments to Australian Accounting Standards - Disclosure Initiative: Amendments to AASB 101
(effective 1 January 2016)
(iv) AASB 2016-2 Amendments to Australian Accounting Standards – Disclosure Initiative: Amendments to AASB 107
(effective 1 January 2017)
Accounting policies
The following significant accounting policies have been adopted in the preparation and presentation of the financial statements:
(a) Basis of consolidation
The consolidated financial statements are prepared by combining the financial statements of all the entities that comprise the consolidated entity, being the company (the parent entity) and its subsidiaries (referred to as “the Group” in these financial statements) as defined in Accounting Standard AASB 10 ‘Consolidated Financial Statements’. A list of subsidiaries appears in Note 11 to the financial statements. Consistent accounting policies are employed in the preparation and presentation of the consolidated financial statements.
On acquisition, the assets, liabilities and contingent liabilities of a subsidiary are measured at their fair values at the date of acquisition. Any excess of the cost of acquisition over the fair values of the identifiable net assets acquired is recognised as goodwill. If, after reassessment, the fair values of the identifiable net assets acquired exceed the cost of acquisition, the deficiency is credited to profit and loss in the period of acquisition.
In preparing the consolidated financial statements, all intercompany balances and transactions, and unrealised profits arising within the Group are eliminated in full.
(b) Business combinations
Acquisitions of subsidiaries and businesses are accounted for using the acquisition method. The consideration for each
acquisition is measured as the aggregate of the fair values (at the date of exchange) of assets given, liabilities incurred or
assumed, and equity instruments issued by the Group in exchange for control of the acquiree. Acquisition related costs are
recognised in profit and loss as incurred.
At the acquisition date, the identifiable assets acquired and the liabilities assumed are recognised at their fair value, except that:
deferred tax assets or liabilities and assets or liabilities related to employee benefit arrangements are recognised and measured in accordance with AASB 112 ‘Income Taxes’ and AASB 119 ‘Employee Benefits’ respectively;
liabilities or equity instruments related to share-based payment arrangements of the acquiree or share-based payment arrangements of the Group entered into to replace share-based payment arrangements of the acquire are measured in accordance with AASB 2 ‘Share-based Payment’ at the acquisition date; and
assets (or disposal groups) that are classified as held for sale in accordance with AASB 5 ‘Non-current Assets Held for Sale and Discontinued Operations’ are measured in accordance with that Standard.
Goodwill arising on acquisition is recognised as an asset and initially measured at cost, being the excess of the consideration
transferred, the amount of any non-controlling interests in the acquiree, and the fair value of acquirer’s previously held equity
interest in the acquiree (if any) over the net of the acquisition-date amounts of the identifiable assets acquired and the liabilities
assumed. If, after reassessment, the Group’s interest in the net fair value of the acquiree’s identifiable net assets exceeds the
sum of the consideration transferred, the amount of any non-controlling interests in the acquiree and the fair value of the
acquirer’s previously held equity interest in the acquiree, the excess is recognised immediately in profit or loss as a bargain
purchase gain.
(c) Foreign currency
The presentation and functional currency of the Group is Australian dollars.
Foreign currency transactions
All foreign currency transactions during the financial year are brought to account using the exchange rate in effect at the date of the transaction. Foreign currency monetary items at reporting date are translated at the exchange rate existing at reporting date.
For
per
sona
l use
onl
y

Pental Limited
Notes to the financial statements
40
Exchange differences are recognised in profit or loss in the period in which they arise except that:
exchange differences on transactions entered into in order to hedge certain foreign currency risks (refer Note 22); and
exchange differences on monetary items receivable from or payable to a foreign operation for which settlement is neither planned or likely to occur, which form part of the net investment in a foreign operation, are recognised in the foreign currency translation reserve and recognised in profit or loss on disposal of the net investment.
(d) Goods and services tax
Revenues, expenses and assets are recognised net of the amount of goods and services tax (GST), except:
i. where the amount of GST incurred is not recoverable from the taxation authority, it is recognised as part of the cost of
acquisition of an asset or as part of an item of expense; or
ii. for receivables and payables which are recognised inclusive of GST.
The net amount of GST recoverable from, or payable to, the taxation authority is included as part of receivables or payables.
Cash flows are included in the cash flow statement on a gross basis. The GST component of cash flows arising from investing
and financing activities which is recoverable from, or payable to, the taxation authority is classified within operating cash flows.
(e) Revenue
Revenues are recognised at fair value of the consideration received net of the amount of goods and services tax (GST) payable to the taxation authority.
Sale of goods
Revenue from the sale of goods is recognised (net of returns, rebates, discounts and allowances) when the Group has transferred to the buyer control and the significant risks and rewards of ownership of the goods.
Interest revenue
Interest revenue is recognised on a time proportionate basis that takes into account the effective yield on the financial asset.
(f) Share based payment transactions
The Executive Performance Rights Plan grants shares in the Company to certain employees. The fair value of the performance rights granted under the Executive Performance Rights Plan is recognised as an employee expense with a corresponding increase in equity. The fair value is measured at grant date and is spread over the vesting period, which is the period from the grant date to the end of the plan period. The fair value of the performance rights granted is measured using Black-Scholes model, taking into account the terms and conditions upon which the performance rights were granted.
(g) Income tax
Current tax
Current tax is calculated by reference to the amount of income taxes payable or recoverable in respect of the taxable profit or
tax loss for the period. It is calculated using tax rates and tax laws that have been enacted or substantively enacted by reporting
date. Current tax for current and prior periods is recognised as a liability (or asset) to the extent that it is unpaid (or refundable). Deferred tax Deferred tax is accounted for using the comprehensive balance sheet liability method in respect of temporary differences arising from differences between the carrying amount of assets and liabilities in the financial statements and the corresponding tax base of those items.
In principle, deferred tax liabilities are recognised for all taxable temporary differences. Deferred tax assets are recognised to the extent that it is probable that sufficient taxable amounts will be available against which deductible temporary differences or unused tax losses and tax offsets can be utilised.
However, deferred tax assets and liabilities are not recognised if the temporary differences giving rise to them arise from the initial recognition of assets and liabilities (other than as a result of a business combination) which affects neither taxable income nor accounting profit. Furthermore, a deferred tax liability is not recognised in relation to taxable temporary differences arising from goodwill.
Deferred tax liabilities are recognised for taxable temporary differences arising on investments in subsidiaries, except where the Group is able to control the reversal of the temporary differences and it is probable that the temporary differences will not reverse in the foreseeable future. Deferred tax assets arising from deductible temporary differences associated with these investments and interests are only recognised to the extent that it is probable that there will be sufficient taxable profits against which to utilise the benefits of the temporary differences and they are expected to reverse in the foreseeable future.
Deferred tax assets and liabilities are measured at the tax rates that are expected to apply to the period(s) when the asset and liability giving rise to them are realised or settled, based on tax rates (and tax laws) that have been enacted or substantively enacted by reporting date. The measurement of deferred tax liabilities and assets reflects the tax consequences that would follow from the manner in which the Group expects, at the reporting date, to recover or settle the carrying amount of its assets and liabilities.
Deferred tax assets and liabilities are offset when they relate to income taxes levied by the same taxation authority and the company/Group intends to settle its current tax assets and liabilities on a net basis.
For
per
sona
l use
onl
y

Pental Limited
Notes to the financial statements
41
Current and deferred tax for the period
Current and deferred tax is recognised as an expense or income in the statement of comprehensive income, except when it relates to items credited or debited directly to equity, in which case the deferred tax is also recognised directly in equity, or where it arises from the initial accounting for a business combination, in which case it is taken into account in the determination of goodwill or excess. Tax consolidation
The company and all its wholly-owned Australian resident entities are part of a tax consolidated group under Australian taxation law. Pental Limited is the head entity in the tax-consolidated group. Tax expense/income, deferred tax liabilities and deferred tax assets arising from temporary differences of the members of the tax consolidated group are recognised in the separate financial statements of the members of the tax-consolidated group using the ‘separate taxpayer within group’ approach.
Current tax liabilities and assets and deferred tax assets arising from unused tax losses and tax credits of the members of the tax-consolidated group are recognised by the company (as head entity in the tax-consolidated group). Due to the existence of a tax funding arrangement between the entities in the tax consolidated group, amounts are recognised as payable to or receivable by the company and each member of the group in relation to the tax contribution amounts paid or payable between the parent entity and the other members of the tax-consolidated group in accordance with the arrangement.
Where the tax contribution amount recognised by each member of the tax-consolidated group for a particular period is different to the aggregate of the current tax liability or asset and any deferred tax asset arising from unused tax losses and tax credits in respect of that period, the difference is recognised as a contribution from (or distribution to) equity participants.
(h) Cash and cash equivalents
Cash and cash equivalents comprise cash on hand, cash in banks and investments in money market instruments, net of outstanding bank overdrafts. Bank overdrafts are shown within borrowings in current liabilities in the statement of financial position.
(i) Financial assets Loans and receivables, and investments in subsidiaries are recognised and derecognised on trade date where purchase or sale of an investment or a loan and receivable is under a contract whose terms require delivery of the asset within the timeframe established by the market concerned, and are initially measured at fair value, net of transaction costs. Subsequent to initial recognition, investments are measured at cost.
Loans and receivables
Trade receivables, loans, and other receivables are recorded at amortised cost less impairment.
Other financial assets
For the accounting policy on derivatives – refer Note 2(s) and Note 22. (j) Inventories Inventories are carried at the lower of cost and net realisable value.
Cost includes direct materials, direct labour, other direct variable costs and allocated production overheads necessary to bring inventories to their present location and condition, based on normal operating capacity of the production facilities.
Manufacturing activities
The cost of manufacturing inventories and work-in-progress are assigned on a first-in first-out basis. Costs arising from exceptional wastage are expensed as incurred.
Net realisable value
Net realisable value represents the estimated selling price for inventories less estimated costs of completion and costs necessary to make the sale. Net realisable value is determined on the basis of each inventory line’s normal selling pattern.
(k) Plant and equipment
The carrying amount of plant and equipment is valued on the cost basis.
Depreciation is calculated on a straight line basis so as to write off the net cost of each asset over its expected useful li fe to its estimated residual value. Leasehold improvements are depreciated over the period of the lease or estimated useful life, whichever is the shorter, using the straight line method. The estimated useful lives, residual values and depreciation method are reviewed at the end of each annual reporting period. Plant and equipment estimated useful life used in the calculation of depreciation is 3 to 20 years.
(l) Borrowing costs
Borrowing costs include interest, amortisation of discounts or premiums relating to borrowings, amortisation of ancillary costs incurred in connection with arrangement of borrowings, foreign exchange differences net of hedged amounts on borrowings, including trade creditors and lease finance charges.
Ancillary costs incurred in connection with the arrangement of borrowings are capitalised and amortised over the life of the borrowings. Borrowing costs are expensed as incurred.
For
per
sona
l use
onl
y

Pental Limited
Notes to the financial statements
42
(m) Operating leases
Operating lease payments are recognised as an expense on a straight line basis over the lease term.
(n) Intangible assets
Goodwill
Goodwill is not amortised, but tested for impairment annually and whenever there is an indication that the goodwill may be impaired. Any impairment is recognised immediately in the profit or loss and is not subsequently reversed. Refer also to Note 13.
Brand names
The Pental brand names are not amortised as the Directors believe the brands have an indefinite useful life. Brand names with indefinite useful lives are tested for impairment annually and whenever there is an indication that the asset may be impaired. Brand names are recorded at fair value at the time of acquisition, less any impairment subsequently recorded.
Computer Software
All costs directly incurred in the purchase or development of major computer software or subsequent upgrades and material enhancements, which can be reliably measured and are not integral to a related asset, are capitalised as intangible assets. Costs capitalised include external direct costs of materials, services and travel. Costs incurred on computer maintenance or during planning phase are expensed as incurred. Computer software is amortised over the period of time during which the benefits are expected to arise being 3 to 5 years.
(o) Impairment of assets
At each reporting date, the Group reviews the carrying amounts of its tangible and intangible assets to determine whether there is any indication that those assets have suffered an impairment loss. If any such indication exists, the recoverable amount of the asset is estimated in order to determine the extent of the impairment loss (if any). Where the asset does not generate cash flows that are independent from other assets, the Group estimates the recoverable amount of the cash-generating unit to which the asset belongs. Intangible assets with indefinite useful lives are tested for impairment at least annually and whenever there is an indication that the asset may be impaired.
Recoverable amount is the higher of fair value less costs to sell and value in use. In assessing value in use, the estimated future cash flows are discounted to their present value using a pre-tax discount rate that reflects current market assessments of the time value of money and the risks specific to the asset for which the estimates of future cash flows have not been adjusted.
If the recoverable amount of an asset (or cash-generating unit) is estimated to be less than its carrying amount, the carrying amount of the asset (or cash-generating unit) is reduced to its recoverable amount. An impairment loss is recognised in the profit or loss immediately, unless the relevant asset is carried at fair value, in which case the impairment loss is treated as a revaluation decrease.
Where an impairment loss subsequently reverses, the carrying amount of the asset (or cash-generating unit) is increased to the revised estimate of its recoverable amount, but only to the extent that the increased carrying amount does not exceed the carrying amount that would have been determined had no impairment loss been recognised for the asset (or cash-generating unit) in prior years. A reversal of an impairment loss is recognised in profit or loss immediately, unless the relevant asset is carried at fair value, in which case the reversal of the impairment loss is treated as a revaluation increase.
(p) Employee benefits
Short-term and long-term employee benefits
Provision is made for benefits accruing to employees in respect of wages and salaries, annual leave, long service leave, and sick leave when it is probable that settlement will be required and they are capable of being measured reliably. Provisions made in respect of employee benefits are measured as the present value of estimated future cash outflows to be made by the Group in respect of services provided by employees up to reporting date.
(q) Provisions
Provisions are recognised when the Group has a present obligation (legal or constructive) as a result of a past event, it is probable that the Group will be required to settle the obligation, and a reliable estimate can be made of the amount of the obligation.
The amount recognised as a provision is the best estimate of the consideration required to settle the present obligation at reporting date, taking into account the risks and uncertainties surrounding the obligation. Where a provision is measured using the cash flows estimated to settle the present obligation, its carrying amount is the present value of those cash flows. When some or all of the economic benefits required to settle a provision are expected to be recovered from a third party, the receivable is recognised as an asset if it is virtually certain that reimbursement will be received and the amount of the receivable can be measured reliably. Dividends
A provision for dividends payable is recognised in the reporting period in which the dividends are declared, for the entire undistributed amount, regardless of the extent to which they will be paid in cash.
For
per
sona
l use
onl
y
Pental Limited
Notes to the financial statements
43
(r) Financial instruments issued by the company
Debt and equity instruments
Debt and equity instruments are classified as either liabilities or as equity in accordance with the substance of the contractual arrangement.
Transaction costs on the issue of equity instruments
Transaction costs arising on the issue of equity instruments are recognised directly in equity as a reduction of the proceeds of the equity instruments to which the costs relate. Transaction costs are the costs that are incurred directly in connection with the issue of those equity instruments and which would not have been incurred had those instruments not been issued.
Interest and dividends
Interest and dividends are classified as expenses or as distributions of profit consistent with the statement of financial position classification of the related debt or equity instruments or component parts of compound instruments.
(s) Derivative financial instruments
The Group is exposed to changes in interest rates and foreign exchange rates from its activities. The Group uses interest rate swaps and forward foreign exchange contracts to hedge these risks. Derivative financial instruments are not held for speculative purposes.
The Group uses derivative financial instruments, being interest rate swaps and forward foreign currency contracts to hedge the risk associated with interest rate and foreign currency fluctuations. Such derivatives are stated at fair value. The fair value of forward exchange contracts is calculated by reference to current forward exchange rates for contracts with similar maturity profiles. The fair value of interest swaps are calculated by reference to current rates for contracts with similar maturity profiles.
Derivatives are initially recognised at fair value on the date a derivative contract is entered into and are subsequently remeasured to their fair value at each reporting date. For derivatives that do not qualify for hedge accounting, any gains or losses arising from changes in fair value are taken directly to profit or loss for the year. All Interest rates swaps do not qualify for hedge accounting and have been taken directly to the profit and loss for the year.
For derivatives that qualify for hedge accounting, the method for recognising gains and losses on changes in fair value depends on whether the derivative is classified as a fair value hedge or a cash flow hedge. Derivatives are classified as fair value hedges when they hedge the exposure to changes in the fair value of a recognised asset or liability and as cash flow hedges when they hedge exposure to variability in cash flows that are attributable to either a particular risk associated with a recognised asset or liability or to a forecast transaction. The Group documents at inception of the hedge the relationship between the hedging instruments (derivatives) and the hedged items, as well as the risk management objective and strategy for undertaking the hedge transaction.
The Group also documents, both at inception of the hedge and on an ongoing basis whether the derivatives that are used in the hedging transactions have been, and will continue to be, highly effective in offsetting changes in fair values or cash flows of hedged items.
Changes in the fair value of derivatives that are designated and qualify as fair value hedges are recorded in the income statement, together with any changes in the fair value of the hedged asset or liability that are attributable to the hedged risk. The effective portion of changes in the fair value of derivatives that are designated and qualify as cash flow hedges is recognised in equity in the hedging reserve and transferred to profit or loss when the hedged item affects profit or loss. The gain or loss relating to the ineffective portion is recognised immediately in the profit or loss. However, when the cash flow hedge relates to a forward foreign exchange contract to hedge a highly probable forecast transaction or firm commitment that results in a non-financial asset (e.g. inventory) or a non-financial liability, the gains and losses previously deferred in equity are transferred from equity and included in the initial measurement of the initial cost or carrying amount of the asset or liability.
Hedge accounting is discontinued when the hedging instrument expires, or is sold, terminated or exercised, or no longer qualifies for hedge accounting. At that point in time, any cumulative gains or losses on the hedging instrument recognised in equity is kept in equity until the forecast transaction occurs. If the forecast transaction is no longer expected to occur, the net cumulative gain or loss recognised in equity is transferred to the statement of comprehensive income and recognised in net profit or loss for the year.
(t) Financial year
As allowed under Section 323D(2) of the Corporations Act 2001, the Directors have determined the financial year to be a fixed period of 52 calendar or 53 calendar weeks. For the period to 2 July 2017, the Group is reporting on the 53 week period that began 27 June 2016 and ended 2 July 2017. For the period to 26 June 2016, the Group is reporting on the 52 week period commencing 29 June 2015 and ended 26 June 2016.
(u) Changes in accounting policy The Group adopted all new and amended Australian Accounting Standards and Interpretations that became applicable during the current financial year. The adoption of these Standards and Interpretations did not have a significant impact on the Group’s financial results or statement of financial position. As a consequence of an IFRS Interpretation Committee (IFRIC) agenda decision issued in November 2016, management has amended its accounting policy to recognise a deferred tax liability on indefinite life intangibles acquired as part of a business combination. The amendment resulted in an increase of $4.362 million to goodwill and deferred tax liabilities as at the beginning of the earliest comparative period. All other accounting policies are consistent with those applied in the previous financial year.
For
per
sona
l use
onl
y

Pental Limited
Notes to the financial statements
44
(v) Standards and Interpretations issued not yet effective
At the date of authorisation of the financial report, the Standards and Interpretations listed below were in issue but not yet effective.
(v) AASB 9 Financial Instruments (effective 1 January 2018)
(vi) AASB 15 Revenue from Contracts with Customers, 2014-5 Amendments to Australian Accounting Standards
arising from AASB 15, 2015-8 Amendments to Australian Accounting Standards – Effective date of AASB 15,
2016-3 Amendments to Australian Accounting Standards – Clarifications to AASB 15 (effective 1 January 2018)
(vii) AASB 16 Leases (effective 1 January 2019)
(viii) AASB 2015-10 Amendments to Australian Accounting Standards – Effective Date of Amendments to AASB 10
and AASB 128 (effective 1 January 2018)
At the date of authorisation of the financial statements, there have been no IASB Standards and IFRIC Interpretations that are issued but not yet effective.
The Directors have not yet assessed the impact the adoption of these Standards and Interpretations in future periods will have on the financial statements of the Group.
These Standards and Interpretations will be first applied in the financial statements of the Group that relates to the annual reporting period beginning after the effective date of each pronouncement. In addition to the standards issued above, other standards have been issued by the Australian Accounting Standards Board (the AASB), these standards are not relevant to the operations of the Group.
For
per
sona
l use
onl
y

Pental Limited
Notes to the financial statements
45
[Inse
rt en
tity n
am
e]
No
tes to
the
finan
cia
l sta
tem
ents
[Inse
rt en
tity n
am
e]
No
tes to
the
finan
cia
l sta
tem
ents
3. Revenue
An analysis of the Group’s revenue for the year is as follows:
2017
$’000
2016
$’000
Sales Revenue
Revenue from the sale of goods 85,124 79,233
85,124 79,233
Other revenue and income
Interest on bank deposits 225 272
Other revenue and income 81 301
306 573
Total Revenue from continuing operations 85,430 79,806
4. Segment information
AASB 8 ‘Operating Segments’ requires operating segments to be identified on the basis of internal reports about components of
the Group that are regularly reviewed by the chief operating decision maker in order to allocate resources to the segment and to
assess its performance. Information reported to the Group’s chief operating decision maker for the purposes of resource
allocation and assessment of performance is more specifically focused on one operating segment, being the manufacture and
distribution of personal care and home products.
Information on segments
Inter-segment pricing is determined on an arm’s length basis.
Segment results, assets and liabilities include items directly attributable to a segment as well as those that can be allocated on a
reasonable basis.
Segment capital expenditure is the total cost incurred during the period to acquire segment assets that are expected to be used
for more than one period.
In presenting information on the basis of geographical segments, segment revenue is based on the geographical location of
customers. Segment assets and liabilities are located in Australia and are unable to be allocated to individual geographical
segments by location of customers on a reasonable basis. The Group’s segment revenue is geographically as follows:
Geographical Location Product
Australia Soaps, detergents, fire needs and bleach
New Zealand Soaps, detergents, fire needs and bleach
Asia Soaps and detergents
Geographical information
The Group’s revenue from external customers by geographical location is detailed below.
2017 $’000
2016 $’000
Geographical sales
Australia 69,658 65,531
New Zealand 13,628 13,021
Asia 1,838 681
Total geographical sales 85,124 79,233
The top four customers account for 81.5% of total sales revenue for the year (2016: 86.0%). These top four customers
individually represent greater than 8% of total sales revenue.
5. Finance costs
2017
$’000
2016
$’000
Other borrowing costs 44 64
Total interest expense 44 64
For
per
sona
l use
onl
y

Pental Limited
Notes to the financial statements
46
[Inse
rt en
tity n
am
e]
No
tes to
the
finan
cia
l sta
tem
ents
[Inse
rt en
tity n
am
e]
No
tes to
the
finan
cia
l sta
tem
ents
6. Income taxes
Income tax recognised in profit or loss
2017
$’000
2016
$’000
Tax expense comprises: Current tax expense in respect of the current year 2,658 2,353
Deferred tax expense relating to the origination and reversal of temporary differences (161) 95 Adjustments recognised in the current year in relation to the current
tax of prior years (4) 142
Total tax expense 2,493 2,590
The prima facie income tax expense on pre-tax accounting profit reconciles to the income tax expense in the financial statements as follows:
2017 $’000
2016 $’000
Profit from operations 8,343 8,218
Income tax expense calculated at 30% 2,502 2,465
Non-assessable income (5) (17)
Adjustments recognised in the current year in relation to the current
tax of prior years (4) 142
Income tax expense recognised in profit 2,493 2,590
Comprising of:
Income tax expense 2,493 2,590
2,493 2,590
The tax rate used in the above reconciliation is the corporate tax rate of 30% payable by Australian corporate entities on taxable
profits under Australian tax law. There has been no change in the corporate tax rate when compared with the previous reporting
period.
Income tax recognised in other comprehensive income
2017
$’000
2016
$’000
Deferred tax
Arising on income and expenses recognised in other comprehensive
income:
Revaluations of financial instruments treated as cash flow hedges (53) 190
(53) 190
For
per
sona
l use
onl
y

Pental Limited
Notes to the financial statements
47
[Inse
rt en
tity n
am
e]
No
tes to
the
finan
cia
l sta
tem
ents
[Inse
rt en
tity n
am
e]
No
tes to
the
finan
cia
l sta
tem
ents
6. Income taxes (continued)
Deferred tax balances
Deferred tax assets/ (liabilities) arise from the following:
2017
Opening balance
Charged to income
Recognised in other
comprehensive income
Charged to equity
Closing Balance
$’000 $’000 $’000
$’000 $’000
Deferred tax assets
Doubtful debts 15 (15) - - -
Provisions 493 64 - - 557
Share issue costs 132 (116) - - 16
Foreign currency items 107 19 (53) - 73
Stock obsolescence 38 33 - - 71
Accruals 31 (27) - - 4
816 (42) (53) - 721
Deferred tax liabilities
Property, plant and equipment (972) 170 - - (802)
Intangibles (4,362) - - - (4,362)
Foreign currency items (33) 33 - - -
Other (3) - - - (3)
(5,370) 203 - - (5,167)
Net deferred tax asset / (liability) (4,554)
161
(53) - (4,446)
2016
Opening balance
Charged to income
Recognised in other
comprehensive income
Charged to equity
Closing Balance
$’000 $’000 $’000
$’000 $’000
Deferred tax assets
Doubtful debts 15 - - - 15
Provisions 460 33 - - 493
Share issue costs 248 (116) - - 132
Foreign currency items (83) - 190 - 107
Stock obsolescence 52 (14) - - 38
Accruals 27 4 - - 31
719 (93) 190 - 816
Deferred tax liabilities
Property, plant and equipment (1,080) 108 - - (972)
Intangibles (4,362) - - - (4,362)
Foreign currency items 77 (110) - - (33)
Other (3) - - - (3)
(5,368) (2) - - (5,370)
Net deferred tax asset / (liability)
(4,649)
(95)
190 - (4,554)
Current tax liabilities
2017
$’000
2016
$’000
Income tax payable 551 2,275
551 2,275
For
per
sona
l use
onl
y

Pental Limited
Notes to the financial statements
48
[Inse
rt en
tity n
am
e]
No
tes to
the
finan
cia
l sta
tem
ents
6. Income taxes (continued)
Tax consolidation
Relevance of tax consolidation to the Group
The company and its wholly-owned Australian resident entities have formed a tax-consolidated group, and are therefore taxed
as a single entity from that date. The head entity within the tax-consolidated group is Pental Limited. The members of the tax-
consolidated group are identified at Note 11.
Nature of tax funding arrangements and tax sharing agreements
Entities within the tax-consolidated group have entered into a tax funding arrangement and a tax-sharing agreement with the
head entity. Under the terms of the tax funding arrangement, Pental Limited and each of the entities in the tax-consolidated
group has agreed to pay a tax equivalent payment to or from the head entity, based on the current tax liability or current tax
asset of the entity. Such amounts are reflected in amounts receivable from or payable to other entities in the tax-consolidated
group. The tax sharing agreement entered into between members of the tax-consolidated group provides for the determination
of the allocation of income tax liabilities between the entities should the head entity default on its tax payment obligations or if an
entity should leave the tax-consolidated group. The effect of the tax sharing agreement is that each member’s liability for tax
payable by the tax-consolidated group is limited to the amount payable to the head entity under the tax funding arrangement.
Unrecognised taxable temporary differences associated with investments and interests
In accordance with AASB112.81, there are no taxable temporary differences in relation to investments in subsidiaries for which
deferred tax assets or liabilities have not been recognised.
7. Profit for the year
(a) Profit for the year has been arrived at after charging the following expenses:
2017
$’000
2016
$’000
Expenses
Cost of goods sold 56,287 52,256
Depreciation: Plant and equipment 3,016 2,191
Amortisation: Software 360 361
Total depreciation and amortisation 3,376 2,552
Employee benefits expense:
Post-employment benefits – defined contribution plans 1,077 1,039
Other employee benefits 11,869 11,628
12,946 12,667
Operating lease minimum payments 1,457 1,071
For
per
sona
l use
onl
y

Pental Limited
Notes to the financial statements
49
8. Earnings per share
2017
Cents
Per Share
2016
Cents
per share
Basic earnings per share 4.29 4.13
Diluted earnings per share 4.18 4.04
The earnings and weighted average number of ordinary shares used in the calculation of basic and diluted earnings per share
are as follows:
2017
$’000
2016
$’000
Net profit 5,850 5,628
Earnings used in the calculation of basic EPS 5,850 5,628
Earnings used in the calculation of diluted EPS 5,850 5,628
2017
No.
2016
No.
Weighted average number of ordinary shares for the purposes of
basic earnings per share 136,250,633 136,250,633
The weighted average number of ordinary shares for the purposes of diluted earnings per share reconciles to the weighted average number of ordinary shares used in the calculation of basic earnings per share as follows.
2017
No.
2016
No.
Weighted average number of ordinary shares for the purposes of
basic earnings per share 136,250,633 136,250,633
Shares deemed to be issued for no consideration in respect of:
- performance rights over ordinary shares 3,625,244 3,191,550
Weighted average number of ordinary shares for the purposes of diluted EPS 139,875,877 139,442,183
Classification of securities as potential ordinary shares Performance rights over ordinary shares in the Company that were granted to key management personnel have been classified as potential ordinary shares and is included in the calculation of diluted earnings per share.
For
per
sona
l use
onl
y

Pental Limited
Notes to the financial statements
50
9. Trade and other receivables
Current
2017
$’000
2016
$’000
Trade receivables (i) and Other (ii) 23,613 23,631
Allowance for doubtful debts - (49)
23,613 23,582
(i) The average credit period on sales of goods is 60 days. No interest is charged on trade receivables. An allowance has been
made for estimated irrecoverable trade receivable amounts arising from the past sale of goods, determined by reference to
specific customers where receipt is in doubt. During the current financial year, any doubtful debt movements were recognised
in profit/ (loss) for the year.
Before accepting any new customers, the Group will perform a credit check to assess the potential customer’s credit quality
and defines credit limits by customer. Limits are reviewed as necessary. Of the trade receivables balance at the end of the
year $19.723 million is due from four customers (2016: $19.733 million) and these four customers account for 81.5% of total
sales revenue for the year (2016: 86.0%). There are no other customers who represent more than 5% of the total balance of
trade receivables or total sales revenues from continuing operations for the year. Debtors who are past due at the end of the
reporting period have not been provided for on the whole, as there has not been a significant change in credit quality and the
amounts are still considered recoverable. The Group does not hold any collateral over these balances.
(ii) Other receivables generally arise from transactions outside the usual operating activities of the Group. Collateral is generally
not obtained.
Ageing of past due but not impaired
2017
$’000
2016
$’000
Overdue 31 to 60 days 429 266
Overdue 61 to 90 days 617 35
Overdue 91 days and beyond 19 44
Total 1,065 345
Movement in the allowance for doubtful debts
2017
$’000
2016
$’000
Balance at the beginning of the year 49 50
Amounts written off as uncollectible - (1)
Amounts written back to profit (49) -
Balance at the end of the year - 49
In determining the recoverability of a trade receivable, the Group considers any change in the credit quality of the trade receivable
from the date credit was initially granted up to the reporting date. The concentration of credit risk is limited due to the customer base
being large and unrelated. Accordingly, the directors believe that there is no further credit provision required in excess of the
allowance for doubtful debts.
10. Inventories
2017
$’000
2016
$’000
Raw materials 3,007 3,496
Finished goods 7,290 5,370
10,297 8,866
For
per
sona
l use
onl
y
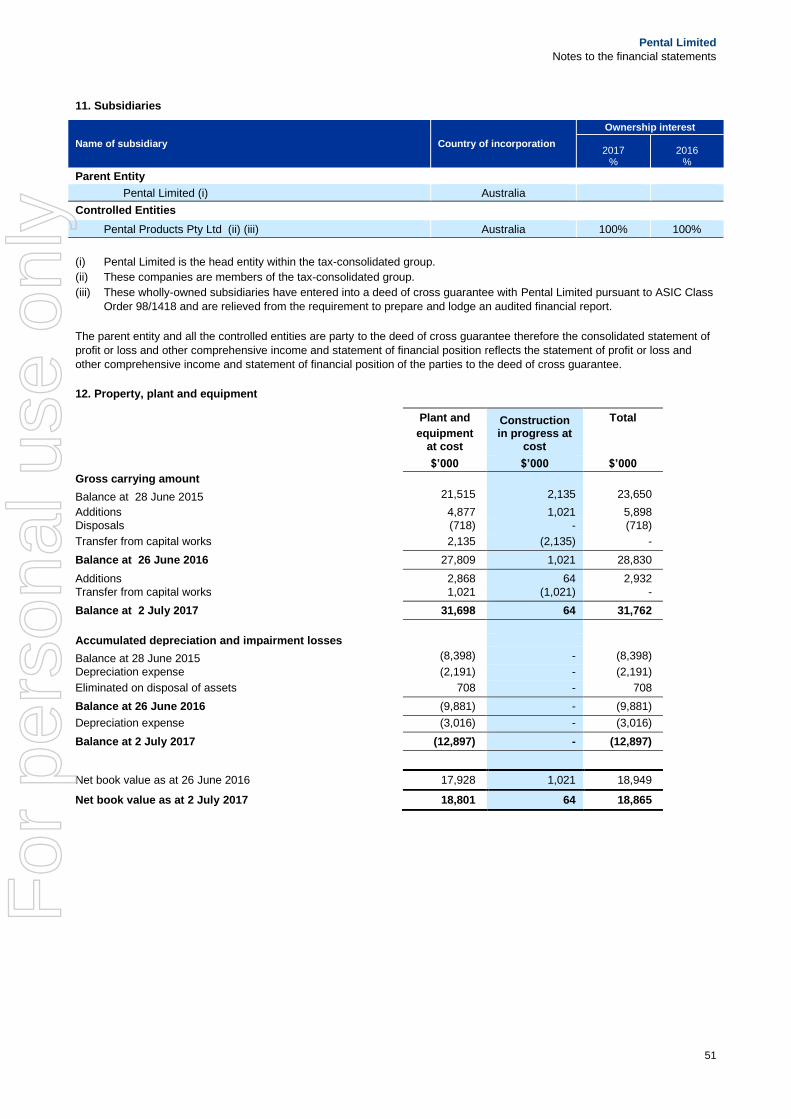
Pental Limited
Notes to the financial statements
51
11. Subsidiaries
Name of subsidiary Country of incorporation
Ownership interest
2017 %
2016 %
Parent Entity
Pental Limited (i) Australia
Controlled Entities
Pental Products Pty Ltd (ii) (iii) Australia 100% 100%
(i) Pental Limited is the head entity within the tax-consolidated group.
(ii) These companies are members of the tax-consolidated group.
(iii) These wholly-owned subsidiaries have entered into a deed of cross guarantee with Pental Limited pursuant to ASIC Class
Order 98/1418 and are relieved from the requirement to prepare and lodge an audited financial report.
The parent entity and all the controlled entities are party to the deed of cross guarantee therefore the consolidated statement of
profit or loss and other comprehensive income and statement of financial position reflects the statement of profit or loss and
other comprehensive income and statement of financial position of the parties to the deed of cross guarantee.
12. Property, plant and equipment
Plant and
equipment at cost
Construction in progress at
cost
Total
$’000 $’000 $’000
Gross carrying amount
Balance at 28 June 2015 21,515 2,135 23,650
Additions 4,877 1,021 5,898
Disposals (718) - (718)
Transfer from capital works 2,135 (2,135) -
Balance at 26 June 2016 27,809 1,021 28,830
Additions 2,868 64 2,932
Transfer from capital works 1,021 (1,021) -
Balance at 2 July 2017 31,698 64 31,762
Accumulated depreciation and impairment losses
Balance at 28 June 2015 (8,398) - (8,398)
Depreciation expense (2,191) - (2,191)
Eliminated on disposal of assets 708 - 708
Balance at 26 June 2016 (9,881) - (9,881)
Depreciation expense (3,016) - (3,016)
Balance at 2 July 2017 (12,897) - (12,897)
Net book value as at 26 June 2016 17,928 1,021 18,949
Net book value as at 2 July 2017 18,801 64 18,865
For
per
sona
l use
onl
y

Pental Limited
Notes to the financial statements
52
13. Goodwill
2017
$’000
2016
$’000
Cost 74,778 74,778
Accumulated impairment losses (45,332) (45,332)
29,446 29,446
Gross carrying amount
Balance at beginning of financial year 74,778 74,778
Balance at end of financial year 74,778 74,778
Accumulated impairment losses
Balance at beginning of financial year 45,332 45,332
Balance at end of financial year 45,332 45,332
As a consequence of an IFRS Interpretation Committee (IFRIC) agenda decision issued in November 2016, management has amended its accounting policy to recognise a deferred tax liability on indefinite life intangibles acquired as part of a business combination. The amendment resulted in an increase of $4.362 million to goodwill and deferred tax liabilities as at the beginning of the earliest comparative period.
Allocation of goodwill to cash-generating units Goodwill has been allocated for impairment testing over the Consumer Products business Unit. The Pental brand names (refer Note 14) and, property, plant and equipment are included in the Consumer Products Cash Generating Unit (CGU). The recoverable amount of the Consumer Products cash generating unit is determined based on a value in use calculation, which uses cash flow projections based on a financial budget approved by the Board, covering a five year period and a discount rate (pre-tax) of 15.0% (2016: 15.0%). The cash flow has been extrapolated using a 3% (2016: 3%) growth rate including an inflation rate of 2.5% (2016: 2.5%).
14. Other intangible assets
Brand Names at cost
Software at cost
Total
$’000 $’000 $’000
Gross carrying amount
Balance at 28 June 2015 19,000 1,536 20,536
Additions - 250 250
Disposals - (22) (22)
Balance at 26 June 2016 19,000 1,764 20,764
Additions - 134 134
Disposals - (23) (23)
Balance at 2 July 2017 19,000 1,875 20,875
Accumulated Impairment/Amortisation
Balance at 28 June 2015 (4,461) (873) (5,334)
Amortisation expense - (361) (361)
Eliminated on disposal of assets - 22 22
Balance at 26 June 2016 (4,461) (1,212) (5,673)
Amortisation expense - (360) (360)
Eliminated on disposal of assets - 23 23
Balance at 2 July 2017 (4,461) (1,549) (6,010)
Net book value as at 26 June 2016 14,539 552 15,091
Net book value as at 2 July 2017 14,539 326 14,865
15. Other assets
2017
$’000
2016
$’000
Prepayments 335 260
For
per
sona
l use
onl
y

Pental Limited
Notes to the financial statements
53
16. Trade and other payables
2017
$’000
2016
$’000
Trade payables 9,108 8,344
Trade spend liabilities 4,952 5,267
Sundry payables 3,182 3,048
17,242 16,659
The average credit period on the purchases of goods ranges from 7 to 35 days. No interest is charged on the trade payables.
The Group has financial risk management policies in place to ensure that, as often as possible, all payables are paid within a
reasonable timeframe.
17. Other financial liabilities
2017
$’000
2016
$’000
Current
Foreign currency forward contracts 182 358
182 358
18. Banking facilities
2017
$’000
2016
$’000
Summary of financing arrangements
Facilities utilised at reporting date:
Multi option loan facility
- Bank Guarantee 340 340
340 340
Facilities not utilised at reporting date:
Multi option loan facility
- Bank overdraft 4,450 4,450
- Bank Guarantee 210 210
4,660 4,660
Multi option loan facility The Group has a multi option loan facility with the ANZ bank that allows the Group to choose the appropriate type of funding facility to suit its business needs under one interest rate. The multi option facility can be used as a bank overdraft, variable rate fully drawn advance, cash advance, standby letter of credit/guarantee and/or trade finance facility. The multi option facility has a facility limit of $5,000,000 (2016: $5,000,000). The multi option facility bears an interest rate of 2.46% plus a line fee of 0.8% (2016: 3.00% plus a line fee of 0.9% ) as at 2 July 2017. The financing arrangement is secured by the Group's assets through first ranking fixed and floating charges over the Company and its subsidiaries (with corresponding cross guarantee). The facility expires 31 October 2019.
19. Provisions
2017
$’000
2016
$’000
Current
Employee benefits 1,569 1,394
1,569 1,394
Non-current
Employee benefits 131 112
131 112
Total Provisions 1,700 1,506
The provision for employee benefits represents annual leave, rostered days off and vested long service leave entitlements accrued by employees. The increase in the carrying amount of the provision for the current year results from more benefits being accrued than paid in the current year.
For
per
sona
l use
onl
y

Pental Limited
Notes to the financial statements
54
20. Issued capital
(a) Fully paid ordinary shares
2017
No.
2016
No.
Share Capital
Opening balance of ordinary shares, fully paid 136,250,633 136,250,633
Balance at end of financial year 136,250,633 136,250,633
Fully paid ordinary shares $’000 $’000
Balance at beginning of financial year 90,658 90,658
Balance at end of financial year 90,658 90,658
Holders of ordinary shares are entitled to receive dividends as declared from time to time and are entitled to one vote per share at shareholders’ meetings.
In the event of winding up of the Company, ordinary shareholders rank after all creditors and are fully entitled to any proceeds of liquidation.
Changes to the then Corporations Law abolished the authorised capital and par value concept in relation to share capital from 1
July 1998. Therefore, the company does not have a limited amount of authorised capital and issued shares do not have a par
value.
21. Dividends
(a) Recognised Amounts
2017 2016
Cents per
Share
Total
$’000
Cents per
share
Total
$’000
Fully paid ordinary shares
Final dividend: Fully franked at 30% tax rate 1.95 2,657 1.80 2,453
Interim dividend: Fully franked at 30% tax rate 1.15 1,567 1.00 1,363
3.10 4,224 2.80 3,816
(b) Unrecognised Amounts
2017
$’000
2016
$’000
Final dividend 2,861 2,657
In respect of the year (53 weeks) ended 2 July 2017 the Company declared a full year fully franked dividend of 2.10 cents per
ordinary share, payable on 29 September 2017, with a record date of 11 September 2017 (2016: 1.95 cents per ordinary share).
22. Financial instruments
(a) Capital risk management
The Group manages its capital to ensure that entities in the Group will be able to continue as a going concern while maximising
the return to stakeholders through the optimisation of the debt and equity balance.
The capital structure of the Group consists of cash and short term deposits, and equity attributable to equity holders of the
parent, comprising issued capital (as disclosed in note 20), reserves and retained earnings/(accumulated losses).
Operating cash flows are used to maintain and expand the Group’s assets, as well as to make the routine outflows of payables,
tax, dividends and pay for other financial instruments.
2017
$’000
2016
$’000
Adjusted franking account balance 17,159 14,614
Impact on franking account balance of dividends not recognised 1,226 1,139
For
per
sona
l use
onl
y

Pental Limited
Notes to the financial statements
55
22. Financial instruments (continued)
Gearing ratio
The Board of Directors reviews the capital structure on an ongoing basis. As a part of this review the Board considers the cost
of capital and the risks associated with each class of capital. Based on recommendations of the Board, the Group will balance
its overall capital structure through the payment of dividends, new share issues, and the issue or repayment of debt to execute
its strategic plans. As at 2 July 2017, the Group was debt free and had no debt in the prior financial year.
(b) Categories of financial instruments
At the reporting date there are no significant concentrations of credit risk relating to loans and receivables at amortised cost. The carrying amount reflected in the statement of financial position represents the Group’s maximum exposure to credit risk for such loans and receivables.
2017
$’000
2016
$’000
Financial assets
Cash and cash equivalents 11,660 12,335
Trade and other receivables (Loans and receivables) 23,613 23,582
Financial liabilities
Trade and other payables (amortised cost) 17,242 16,659
Derivative instruments in designated hedge accounting relationships 182 358
(c) Financial risk management objectives
The Group’s finance function provides services to the business by monitoring and managing the financial risks relating to the operations through internal risk reports which analyse exposures by degree and magnitude of risk.
The Group’s activities expose it primarily to the financial risks of changes in foreign currency exchange rates. The Group enters into forward foreign currency contracts to manage its exposure to foreign currency exchange rate fluctuations where it has entered into fixed price contracts. The Group does not enter into or trade financial instruments, including derivative financial instruments, for speculative purposes. The use of financial instruments is governed by the Group’s policies approved by the Board of Directors. The Chief Financial Officer is responsible for managing the Group’s treasury requirements in accordance with this policy.
(d) Market risk
The Group’s activities expose it primarily to the financial risks of changes in foreign currency exchange rates. The Group enters into derivative financial instruments to manage its exposure to foreign currency risk, including forward foreign currency contracts to manage its exposure to foreign currency exchange rate fluctuations (refer notes 22(c) and 22(e)).
(e) Foreign currency risk management
The Group undertakes transactions denominated in foreign currencies; consequently, exposures to exchange rate fluctuations arise. Where appropriate, exchange rate exposures are managed within approved policy parameters utilising forward exchange
contracts or by offsetting import and export currency exposures. The carrying amounts of the Group’s foreign currency denominated monetary assets and monetary liabilities at the end of the
reporting period are as follows:
Assets Liabilities
2017
$’000
2016
$’000
2017
$’000
2016
$’000
Currency of USA - - 45 220
Currency of New Zealand 2,272 4,412 471 519
Currency of Fiji 15 13 - -
Currency of Europe - - 23 41
Forward foreign exchange contracts The Group enters into forward foreign exchange contracts to hedge a proportion of anticipated sales and purchase commitments denominated in foreign currencies (principally US Dollars and New Zealand Dollars) expected in each month. The amount of anticipated future sales is forecast in light of current conditions in foreign markets, commitments from customers and experience.
For
per
sona
l use
onl
y

Pental Limited
Notes to the financial statements
56
22. Financial instruments (continued) The following table sets out the gross contract value to be received/paid under forward foreign currency contracts, the weighted average contracted exchange rates and settlement periods of outstanding contracts for the Group.
Weighted average exchange rate
Foreign currency
FC’000
Contract value
$’000
Fair value
gain/(loss)
$’000
2017 2016 2017 2016 2017 2016 2017 2016
Buy USD – less than one year 0.7476 0.7180 2,981 2,977 3,987 4,146 (105) (120)
Buy Euro – less than one year - 0.6405 - 155 - 242 - (9)
Sell NZD – less than one year 1.0666 1.0945 5,500 6,000 5,156 5,482 (77) (229)
(182) (358)
As at reporting date, the aggregate amount of unrealised gains/(losses) under forward foreign currency contracts relating to
anticipated future contracts is $0.182 million loss - tax effected $0.108 million loss (2016: $0.358 million loss - tax effected
$0.251 million loss). In the current year, these unrealised gains/ (losses) have been deferred in the hedging reserve to the
extent the hedge is effective.
Foreign currency sensitivity analysis
The Group is mainly exposed to USD and NZD currencies. The following table details the Group’s sensitivity to a 5 cent
increase and decrease in the Australian dollar against the relevant foreign currencies. The analysis includes derivative
instruments in designated hedge accounting relationships, all trade receivables and trade payables outstanding at year end.
USD Impact EUR Impact NZD Impact FJD Impact
2017
$’000
2016
$’000
2017
$’000
2016
$’000
2017
$’000
2016
$’000
2017 $’000
2016 $’000
Profit 4 22 - 5 87 186 - -
Equity 286 310 - 20 435 784 - -
(f) Interest rate risk management
The Group has been exposed to interest rate risk during the period as it invests cash on call at floating interest rates and cash in short term deposits at fixed interest rates. The Directors consider that the Group’s sensitivity to a reasonably possible change in interest rates would not have a material impact on profit or equity. The following table details the Group’s exposure to interest rate and liquidity risk. The table includes both interest and principal cash flows.
2017
Weighted average interest
rate
Less than 1 month $’000
1-3 months
$’000
3 months to 1 year
$’000
1-5 years
$’000
5+ years
$’000
Total
$’000
Financial assets Variable interest rate instruments 1.58% 11,660 - - - - 11,660 Non-interest bearing - 13,574 10,039 - - - 23,613
25,234 10,039 - - - 35,273
Financial liabilities Non-interest bearing - 8,993 8,249 - - - 17,242
8,993 8,249 - - - 17,242
2016
Weighted average interest
rate
Less than 1 month $’000
1-3 months
$’000
3 months to 1 year
$’000
1-5 years
$’000
5+ years
$’000
Total
$’000
Financial assets Variable interest rate instruments 2.25% 3,335 9,000 - - - 12,335 Non-interest bearing - 12,392 11,190 - - - 23,582
15,727 20,190 - - - 35,917
Financial liabilities Non-interest bearing - 8,466 8,193 - - - 16,659
8,466 8,193 - - - 16,659
For
per
sona
l use
onl
y

Pental Limited
Notes to the financial statements
57
22. Financial instruments (continued)
(g) Credit risk management
Credit risk management refers to the risk that a counterparty will default on its contractual obligations resulting in financial loss to the Group. The Group has adopted a policy of only dealing with creditworthy counterparties and obtaining sufficient collateral, where appropriate, as a means of mitigating the risk of financial loss from defaults. The Group’s exposure and the credit ratings of its counterparties are continuously monitored and the aggregate values of transactions concluded are spread amongst approved counterparties. The Group measures credit risk on a fair value basis.
Trade accounts receivable consist of a number of customers supplying the retail sector in Australia and New Zealand. Ongoing credit evaluation is performed on the financial condition of accounts receivable and, where appropriate, credit guarantees are obtained.
The Group has significant credit risk exposure with the Woolworths Limited, Wesfarmers Ltd, Metcash Ltd and Foodstuffs (Auckland) Ltd Groups which represent 73.0% of the total trade receivables less related allowances and rebates of the Consumer Products business. The credit risk on liquid funds and derivative financial instruments is limited because the counterparties are banks with high credit-ratings assigned by international credit-rating agencies. The carrying amount of financial assets recorded in the financial statements, net of any allowances for losses, represents the Group’s maximum exposure to credit risk without taking accounts of the value of any collateral obtained.
(h) Liquidity risk management
The Group manages liquidity risk by maintaining adequate reserves, banking facilities and reserve borrowing facilities by continuously monitoring forecast and actual cash flows and matching the maturity profiles of financial assets and liabilities.
(i) Fair value of financial instruments
The directors consider that the carrying amounts of financial assets and liabilities recorded in the financial statements approximate their fair values.
The fair values and net fair values of financial assets and liabilities are determined as follows:
the fair value of financial assets and financial liabilities with standard terms and conditions and traded on active liquid markets are determined with reference to quoted market prices;
the fair value of other financial assets and liabilities are determined in accordance with generally accepted pricing models based on discounted cash flow analysis; and
the fair value of derivative instruments, included in hedging assets and liabilities, are calculated using quoted prices, which is a Level 2 fair value measurement. Where such prices are not available use is made of discounted cash flow analysis using the applicable yield curve for the duration of the instruments.
23. Share-based payments
The Company has an Executive Performance Rights Plan (Rights Plan) to provide Long Term Incentives (LTI) that is aligned to the Group’s long-term strategy. LTI will be provided as performance Rights granted at the commencement of the relevant three year performance period. The Rights Plan was introduced on 18 December 2014 and provides selected executives with a means of acquiring conditional Rights to acquire an ordinary share in Pental subject to the terms of the Plan, once milestones are met.
The Rights issued and converting Rights to ordinary shares are at no consideration.
The Board may also offer options under the Rights Plan, whereby the option will have an exercise price, whilst the Right does not. There were no options granted during the 2017 year (2016: nil).
The vesting of the Rights is conditional on:
a) the executive being employed by the Pental Group on the vesting date; and
b) Pental’s earnings per share for the financial year prior to the vesting date exceeding the target rate;
thereafter a percentage of the Rights will vest based on achieving the following strategic targets:
Gross sales revenue growth (40% weighting of Rights)
Earnings Before Interest and Tax (EBIT) margin (40% weighting of Rights)
Acquired business EBIT margin (20% weighting of Rights).
For
per
sona
l use
onl
y

Pental Limited
Notes to the financial statements
58
23. Share-based payments (continued)
Under the Rights Plan, the executives can receive the following annualised remuneration from the vesting of performance rights:
Percentage of fixed remuneration by achieving:
Threshold Targets Strategic Targets Stretch Strategic Targets
Charlie McLeish 12.5% 25.0% 50.0%
Albert Zago 10.0% 20.0% 40.0%
Details of performance Rights over ordinary shares in the Company that were granted in the current year to key management personnel are set out in the following table:
Grant Date
Vesting Date
Minimum earnings per share target
Cents
Rights granted during 2017
No.
Fair Value per Right at grant
date
$
Fair value of rights granted
$
Charlie McLeish 1 July 2016 1 July 2019 4.69 209,302 0.5178 108,376
Albert Zago 1 July 2016 1 July 2019 4.69 125,581 0.5178 65,026
The Rights are forfeited upon the earliest of the following:
a) if the employee ceases employment with the Group;
b) the Board determines the vesting conditions have not been satisfied; or
c) expiry date, being up to seven years after the grant date of the Rights.
The following factors were used in determining the fair value of the performance rights granted:
Grant Date
Vesting Date
Fair value per Right
$
Exercise Price
$
Price of shares on grant date
$
Estimated volatility
%
Risk free Interest Rate
%
Dividend Yield
%
1 July 2016 1 July 2019 0.5178 - 0.5700 65.00 2.03 4.87
The following table discloses changes in the performance rights holdings of management personnel:
Grant Date
Vesting Date
Balance
at
26/6/2016
No.
Rights granted
No.
Rights
vested
No.
Rights
lapsed/
forfeited
No.
Balance
at
2/7/2017
No.
Charlie McLeish 18/12/2014 3/7/17 740,741 - - - 740,741
Albert Zago 18/12/2014 3/7/17 444,444 - - - 444,444
Charlie McLeish 1/7/2015 1/7/2018 1,007,813 - - - 1,007,813
Albert Zago 1/7/2015 1/7/2018 596,756 - - - 596,756
Charlie McLeish 1/7/2015 1/7/2019 - 209,302 - - 209,302
Albert Zago 1/7/2016 1/7/2019 - 125,581 - - 125,581
There were no share options granted during the 2017 year (2016: nil).
24. Key management personnel compensation
The aggregate compensation of the key management personnel of the Group is set out below
2017
$
2016
$
Short-term employee benefits 1,090,323 1,216,909
Share based payments 35,203 48,482
Post-employment benefits 79,807 81,833
1,205,333 1,347,224
For
per
sona
l use
onl
y

Pental Limited
Notes to the financial statements
59
25. Related party transactions
The compensation of each member of the key management personnel of the Group is set out in the Remuneration Report.
Transactions with key management personnel
A director related entity of Mr Sutton was paid $8,600 (2016: $124,800) plus GST for consultancy services provided to the Group.
In the prior year, a director related entity of Mr Johnstone (retired director on 19 November 2015) was paid rental of $674,882 plus GST and outgoings, as the landlord of the Shepparton manufacturing and warehousing sites.
There were no other services performed by key management personnel outside of normal business operations.
On the 2 November 2012, the Group entered into a Banking facility with its primary banker - ANZ which included a condition that if the sale of the Shepparton properties did not eventuate in an open market by 31 May 2013, a director related entity of Mr Johnstone would exercise the option to purchase the Shepparton properties for a net amount of not less than $6.000 million. As an open market sale did not eventuate, a director related entity of Mr Johnstone purchased the Shepparton properties for $6.000 million on 28 June 2013 and entered into a lease agreement for the Shepparton properties. The key terms of the lease are as follows:
(i) the base annual rent payable of $0.650 million per annum (plus GST and outgoings) and subject to annual CPI
reviews;
(ii) the term of the lease is 10 years with an option of two further terms of five years each;
(iii) the Group provided a bank guarantee as security for the performance of the lease in the amount of $0.163 million; and
(iv) the Group has an option to buy the Shepparton properties from the director related entity which is exercisable from 1
July 2017 to 30 June 2019 at a price to be determined by reference to director related entity costs of acquisition plus
the cost of any capital expenses incurred by the director related entity in respect of the Shepparton Site.
Following approval by shareholders at the November 2016 Annual General Meeting, Pental exercised its option to buy back the Shepparton manufacturing site on 3 July 2017. The estimated acquisition cost (including stamp duty and related costs) is $7.345 million, with settlement of the property completed on 2 August 2017.
Equity interests in subsidiaries
Details of interests in subsidiaries are set out in note 11.
The Company purchase services from, and sells services to, its controlled entity Pental Products Pty Ltd in the normal course of
business and on normal terms and conditions. No interest is charged on the loans made to subsidiaries.
The aggregate amount receivable from and payable to, wholly owned group entities by the Company at balance date are as
follows:
2017
$
2016
$
Non-current loans to subsidiaries 77,258,133 78,866,792
26. Cash and cash equivalents
(a) Reconciliation of cash and cash equivalents
For the purposes of the cash flow statement, cash includes cash on hand and at bank. Cash and cash equivalents at the end of
the financial year as shown in the cash flow statement is reconciled to the related items in the statement of financial position as
follows:
2017
$’000
2016
$’000
Cash and bank balances 11,660 12,335
Net Cash and Cash Equivalents 11,660 12,335
For
per
sona
l use
onl
y

Pental Limited
Notes to the financial statements
60
26. Cash and cash equivalents (continued)
(b) Reconciliation of Profit for the year to net cash flows from operating activities
2017
$’000
2016
$’000
Profit for the year 5,850 5,628
Depreciation and amortisation expense 3,376 2,552
Loss on disposal of assets - 9
Provision for equity settled employee benefits reserve 33 75
Changes in net assets and liabilities, net of effects from
acquisition of businesses:
(Increase)/decrease in assets: Trade and other receivables (31) 536 Inventories (1,431) (1,466) Current and deferred tax assets - -
Other assets (75) 463 Increase/(decrease) in liabilities and reserves: Trade and other payables 583 1,288
Provisions and hedging reserve 318 (322)
Current and deferred tax liabilities (1,832) 2,138
Other liabilities (176) 358
Net cash from operating activities 6,615 11,259
27. Operating lease arrangements
2017
$’000
2016
$’000
Non-cancellable operating lease expenses
Not later than 1 year 932 1,341
Later than 1 year and not later than 5 years 775 4,040
Later than 5 years - 1,573
1,707 6,954
The non-cancellable operating leases relate to leases for the:
1. Melbourne support office lease is for a remaining term of 1 years, with rental increasing annually by 4%; 2. Warehouse storage facility for a remaining term of 1.5 years with a two year option and rental to increase annually by
3.5%; 3. Other leases are for forklifts, motor vehicles and photo copiers for terms between 1 and 5 years.
28. Capital expenditure commitment
2017
$’000
2016
$’000
Plant and equipment
- 128
The Group entered into various contracts to purchase manufacturing equipment for the upgrade and modernisation of
Shepparton manufacturing facility.
29. Contingent liabilities
2017
$’000
2016
$’000
(a) Bank guarantees to third parties in respect of property lease
obligations. The bank guarantees are held by the parent entity,
Pental Limited. 340 340
For
per
sona
l use
onl
y

Pental Limited
Notes to the financial statements
61
29. Contingent liabilities (continued)
(b) The Australian Competition and Consumer Commission (ACCC) instituted proceedings against Pental Limited and Pental
Products Pty Ltd (Pental) in the Federal Court in relation to a matter previously announced to the Australian Stock Exchange
(ASX) on 13 December 2016. For further details, refer to the section “Proceedings against the Company” in Directors’
report.
Due to inherent uncertainties, no accurate quantification of any cost, or timing of such cost, which may arise from the
abovementioned legal proceedings can be made.
30. Remuneration of auditors
2017
$
2016
$
Auditor of the parent entity
Audit or review of the financial report 140,425 137,800
Non-audit services – Tax and other services 61,070 54,095
201,495 191,895
The auditor of Pental Limited is Deloitte Touche Tohmatsu.
31. Parent entity information
The accounting policies of the parent entity, which have been applied in determining the financial information shown below, are
the same as those applied in the consolidated financial statements. Refer to Note 2 for a summary of the significant accounting
policies relating to the Group.
Financial position
2017
$’000
2016
$’000
Assets
Current assets 1 1
Non current assets 77,943 79,667
Total assets 77,944 79,668 Liabilities
Current liabilities 592 2,316
Non current liabilities -
Total liabilities 592 2,316 Equity
Issued capital 90,658 90,658
(Accumulated losses)/Retained earnings (13,306) (13,306)
Total equity 77,352 77,352
Financial performance
2017
$’000
2016
$’000
Loss for the year - -
Other comprehensive income - -
Total comprehensive income - -
32. Subsequent events
Subsequent to balance date, there have been no significant events which have affected the operations of the Group except for: Acquisition of Shepparton Property Following the approval by shareholders at the November 2016 Annual General Meeting, Pental exercised its option to buy back the Shepparton property on 3 July 2017. The purchase price is $6.891 million plus estimated stamp duty and related costs of $0.454 million. Total estimated acquisition cost is $7.345 million. Settlement of the property was completed on 2 August 2017.
Dividends In respect of the year (53 weeks) ended 2 July 2017 the Company will pay final fully franked dividend of 2.10 cents per ordinary share, payable to shareholders on 29 September 2017, with a record date of 11 September 2017.
For
per
sona
l use
onl
y

62
Additional stock exchange information as at 16 August 2017
Additional information required by the Australian Stock Exchange Limited Listing Rules and not disclosed elsewhere in this
report is set out below.
Ordinary share capital
136,250,633 fully paid ordinary shares are held by 1,732 individual shareholders.
The voting rights attaching to the fully paid ordinary share, set out in clause 43 of the Company’s Constitution are:
“Subject to any rights or restrictions attaching to any class of shares: (a) every member may vote; (b) on a show of hands every member has one vote; (c) on a poll every member has:
(i) for each fully paid share held by the member, one vote; and (ii) for each partly paid share held by the member, a fraction of a vote equivalent to the proportion which the amount
paid (not credited) is of the total amounts paid and payable (excluding amounts credited to) on the share.” Performance Share Rights
There are no voting rights attached to performance share rights. On-market buy-back
There is no current on-market buy-back.
Distribution of holders of equity securities
Fully paid
ordinary shares
1 – 1,000 297
1,001 – 5,000 655
5,001 – 10,000 280
10,001 – 100,000 433
100,001 and over 67
1,732
Holding less than a
marketable parcel 229
Substantial shareholders
(i) Alan Johnstone has a relevant interest in Pental shares held by Western Park Holdings Pty Ltd and PMSF Company
Pty Ltd <Penfold Motors Burwood Super Fund>.
(ii) Elevation Capital Management Ltd. has a relevant interest in shares held by BNP Paribas Noms (NZ) Ltd.
(iii) Allan Gray Australia Pty Ltd has a relevant interest in shares held by a number of investment institutions including
Citicorp Nominees Pty Limited, JP Morgan Nominees Australia Limited and National Nominees Limited amounting to
13.83% of the total issued capital of Pental Ltd.
Ordinary shareholders
Fully paid ordinary shares
Number Percentage
Alan Johnstone (i) 29,849,050 21.91%
John Rostyn Homewood 17,210,000 12.63%
BNP Paribas Noms (NZ) Ltd (ii) 11,609,802 8.52%
Citicorp Nominees Pty Limited (iii) 10,100,356 7.41%
68,769,208 50.47%
Pental Limited Additional stock exchange information
For
per
sona
l use
onl
y

63
Twenty largest holders of quoted equity securities
Ordinary shareholders
Fully paid ordinary shares
Number Percentage
1 WESTERN PARK HOLDINGS PTY LTD <JOHNSTONE FAMILY A/C> 27,191,619 19.96%
2 ACE PROPERTY HOLDINGS PTY LTD 17,210,000 12.63%
3 BNP PARIBAS NOMS (NZ) LTD <DRP> 11,609,802 8.52%
4 CITICORP NOMINEES PTY LIMITED 10,100,356 7.41%
5 MR GARRY GEORGE JOHNSON 6,670,739 4.90%
6 HSBC CUSTODY NOMINEES (AUSTRALIA) LIMITED 5,150,679 3.78%
7 J P MORGAN NOMINEES AUSTRALIA LIMITED 4,877,097 3.58%
8 PJR SUPERANNUATION PTY LTD <PJR SUPERANNUATION FUND A/C> 3,972,927 2.92%
9 NATIONAL NOMINEES LIMITED 3,871,134 2.84%
10 DALLMOUNT CUSTODIANS PTY LTD 3,000,000 2.20%
11 LABELMAKERS GROUP PTY LTD 2,666,668 1.96%
12 P M S F COMPANY PTY LIMITED <PENFOLD MTR BURWOOD S/F A/C> 2,657,431 1.95%
13 RATHVALE PTY LIMITED 1,832,759 1.35%
14 VANWARD INVESTMENTS LIMITED 1,438,294 1.06%
15 DALLMOUNT PTY LTD <LABELMAKERS S/F A/C> 1,204,761 0.88%
16 DIXSON TRUST PTY LIMITED 855,000 0.63%
17 MRS JOY DOROTHY JOHNSTONE 834,092 0.61%
18 BUDUVA PTY LTD 800,000 0.59%
19 BARKING DOG PTY LTD <NETTLEFOLD SUPER FUND A/C> 733,530 0.54%
20 ALNEY PTY LTD <WA EXECUTIVE SUPER FUND A/C> 666,667 0.49%
107,343,555 78.78%
Pental Limited Additional stock exchange information
For
per
sona
l use
onl
y