pennsylvania’s workforce characteristics report
TRANSCRIPT

Pennsylvania’s
WORKFORCE CHARACTERISTICS REPORTA Briefing PaperA report for Pennsylvania’s State System of Higher Education
2016

2DRAFT
CONTENTS
3 Background
5 The Labor Market Landscape
6 Top Indicators on the Health of the Economy7 Pennsylvania Sub-region Breakdown
9 Industries in Pennsylvania
11 Largest Skilled Occupations
14 Key Skilled High Demand Occupations Aligning to University-level Education
15 Key Skilled High Demand Occupational Profile21 Key Skilled High Demand Occupations in Pennsylvania’s
Sub-Regions
23 Demographic and Socioeconomic Composition
23 Pennsylvania’s Demographics
30 Conclusion
31 Appendix 1: High Demand Skilled Occupations inPennsylvania, 2014 to 2024
33 About The State System’s Gap Analysis Project

3DRAFT
BACKGROUND
Pennsylvania’s State System of Higher Education (State System) commissioned an education supply and workforce demand gap analysis. This gap analysis project is in direct response to the State System’s strategic plan, Rising to the Challenge 2020 and is a means to get a handle on the big economic picture for the commonwealth and its regions. Knowing the supply of graduates in a given area and the relevant employer demand for those graduates helps university stakeholders evaluate the entire economic eco-system and determine areas that deserve their attention.
The two phases of the State System’s Gap Analysis Project created the context for the supply-demand analysis to better understand the characteristics of the economy and workforce it supports as well as the education preparation needed for these jobs. The outcome of phase I and phase II inlcude the following two reports:
• Phase I: ‘Degrees of Value: College Majors and the Pennsylvania State System’s Contribution to the Workforce’ from Georgetown University’s Center on Education and the Workforce (CEW) delves into the increasing importance of bachelor’s degree holders in the commonwealth’s workforce, the critical role the State System plays as a part of Pennsylvania’s bachelor’s degree sector, and how earnings, employment vary by field of study and occupational area for the majors.
• Phase II: ‘Workforce Characteristics Report’ for Pennsylvania and its regions which contain a set of economic, workforce, demographic and socio-economic information to be used to help contextualize the next phase of research—the gap analysis.
The goal of this Workforce Characteristics Briefing Paper is to provide high level findings from the statewide and regional Workforce Characteristics Report. By doing so it answers key policy questions including:
• What is the labor market landscape for Pennsylvania and its regions?
• What are the largest skilled occupations employed within the state?
• What are some characteristics of specific high-volume and high-growth occupations including:

4DRAFT
‧ Are women or men typically found in the occupation?
‧ Do certain races/ethnicities occupy larger shares of the occupation?
‧ What is the age distribution of the occupation?
‧ What is the educational attainment of workers in the occupation?
• What is the demographic and socio-economic composition of Pennsylvania’s workforce?
Detailed technical reports are available for both Pennsylvania and its regions.

5DRAFT
THE LABOR MARKET LANDSCAPE
Pennsylvania’s economically diverse geography supports the need for a regionalized perspective of economic and workforce characteristics. To respond to this, the State System conducted research to identify five broad sub-regions as well as fourteen university-specific workforce regions (labor sheds). It is important to note that the five broad sub-regions developed by the State System align with Pennsylvania’s Partnerships for Regional Economic Performance (PREP). The PREP regions are Pennsylvania’s network of businesses as defined by the Department of Community and Economic Development (DCED). Aligning the State System’s five regions to the PREP reflects a broader goal of the State System to connect higher education with economic development in the commonwealth. The only exception to the PREP region boundary is Schuylkill County, which was put within the Central sub-region. This allocation better balances enrollment between regions, given that learners from Schuylkill were nearly evenly dispersed between the Central, Northeast and Southeast sub-regions.
Figure 1 illustrates the geographic areas for the sub-regions as well as the locations of the State System Universities. Figure 2 provides summary data of the population and learner enrollment for each respective sub-region
Fig. 1: Pennsylvania State System Sub Regions
Source: Oxford Economics mapping

6DRAFT
Subsequent sections of this Briefing Report present the workforce characteristics for Pennsylvania and its five regions as defined by the State System Gap Analysis Project. The five regions include:
• Central Pennsylvania (CEN),
• North East Pennsylvania (NE),
• North West Pennsylvania (NW),
• South East Pennsylvania (SE), and
• South West Pennsylvania (SW).
Top Indicators on the Health of the EconomyWith a population of 12.7 million and an employment base of 5.6 million workers, Pennsylvania is a driving economic force within the U.S. The commonwealth is home to approximately 347,000 business establishments and has an unemployment rate lower than the U.S.
The bachelor’s degree educational attainment rate for those working in Pennsylvania is slightly lower than the U.S. average. Projections of new job growth in Pennsylvania over the next 10 years indicate that approximately 536,213 new jobs will be created as a result of industry growth. This projected industry growth translates into needs for occupations and skilled workers to staff companies, which is further described in the Skilled Occupations section of this briefing paper.
Fig. 2: Pennsylvania Population and State System Learner Enrollment by Sub-Region
Pennsylvania Region
Number of Counties
Regional Population
Regional Population
Share
PA Resident State System
Learners
Regional State System
Learner Share
Northwest 14 941,584 7.4% 11,504 11.7%
Southwest 15 2,943,544 23.1% 21,741 22.1%
Central 19 2,690,436 21.1% 22,813 23.2%
Northeast 11 1,061,613 8.3% 8,202 8.4%
Southeast 8 5,094,204 40.0% 33,940 34.6%
Pennsylvania Total 67 12,731,381 100.0% 98,200 100.0%
American Community Survey 2009-2013 five-year file; Pennsylvania’s State System of Higher Education Research Office (2012-2014 Average Annual Enrollment)

7DRAFT
Pennsylvania Sub-region BreakdownThe economic indicators vary by Pennsylvania region, reflecting diverse regional industry, workforce, infrastructure, and education attributes. Data demonstrate the following top level workforce characteristics for the five sub-regions:
1. Southeast Region (SE) has the largest population and therefore the largest business establishment and employment numbers. It has the highest level of educational attainment, however, the unemployment rate for the SE is slightly higher than the statewide total.
2. Southwest (SW) has the second largest population and the second largest employment numbers. It has a high level of educational attainment and the unemployment rate for the SW is equal to the state.
3. Central Region (CEN) has the third highest population along with the lowest unemployment rate of any region. It also has the lowest poverty rate of any region at 12% and is expected to grow to 1.3 million jobs in 2024.
4. Northeast (NE) has the region has the highest poverty rate of any region in the state but is expected to grow significantly over the next 10 years.
Fig. 3: Pennsylvania and U.S. Workforce Characteristics Summary
Workforce Characteristic Pennsylvania United States Data Source
Population 12.7 million 311.5 million 2009-2013 American Community Survey 5-Year Estimates
Employed 5.6 million 136.6 million 2014 BLS Quarterly Census of Employment and Wages
Unemployed 370,000 9.6 million 2014 BLS Local Area Unemployment Statistics
Unemployment Rate 5.80% 6.20% 2014 BLS Local Area Unemployment Statistics
Poverty Rate 13.70% 15.80% 2013 Census Small Area Income and Poverty Estimates
Business Establishments 347,000 9.4 million 2014 BLS Quarterly Census of
Employment and Wages
Educational Attainment (25+ Population with Bachelor's or Higher)
27.40% 28.80% 2009-2013 American Community Survey 5-Year Estimates
Bachelor's or Higher Completions 137,000 2.7 million
Integrated Postsecondary Education Data System 3-Year Average AY2010-11 to AY2012-13
Projected Employment 6.2 million* 160 million**Oxford Economics- Pennsylvania Projections 2024* and BLS- U.S. Projections 2024**

8DRAFT
The estimated 440,000 jobs in 2024 are largely due to the growth in trade, transportation, and utilities sectors concentrated in the region.
5. Northwest Region (NW) is the least populated region in the state but has a high concentration of manufacturing establishments. The manufacturing sectors provide many jobs opportunities that do not require post-secondary education, which largely explains why NW has the lowest levels of educational attainment in the state.
Figure 4 allows a comparative analysis of the economic indicators between the five regions of Pennsylvania to gauge economic strengths as well as areas of concern.
These economic indicators are further evaluated later in this briefing paper. The next section provides an analysis of industries in Pennsylvania with a focus on the post-recession recovery period 2009 to 2014
Fig. 4: Pennsylvania and Sub-Regions Workforce Characteristics Summary
Workforce Characteristic NE Region SE Region NW Region SW Region CEN Region Pennsylvania
Population 1.1 million 5.1 million 950,000 2.9 million 2.7 million 12.7 million
Employed 392,000 2.3 million 366,000 1.3 million 1.2 million 5.6 million
Unemployed 35,000 152,000 26,800 85,200 71,000 370,000
Unemployment Rate 6.9% 5.9% 6.1% 5.8% 5.2% 5.8%
Poverty Rate 14.1% 14.3% 16.0% 13.2% 12.0% 13.7%
Business Establishments* 25,000 134,000 24,000 77,000 62,000 347,000
Educational Attainment (% of 25+ Population with Bachelor’s or Higher) 21.8% 32.7% 19.3% 27.3% 22.9% 27.4%
Projected Jobs in 2024 440,000 2.6 million 400,000 1.5 million 1.3 million 6.2 million
* Region establishment numbers will not sum to statewide numbers due to rounding and data suppressions
Source: BLS (QCEW, LAUS), US Census (ACS, SAIPE), NCES (IPEDS), Oxford Economics Projections

9DRAFT
INDUSTRIES IN PENNSYLVANIA
Over the five years from 2009 to 2014, the Pennsylvania economy experienced significant growth in service based sectors, while manufacturing and government saw a reduction in jobs. Sectors such as education and health care, professional and business services, leisure and hospitality have added a combined 187,800 new jobs between 2009 and 2014. Manufacturing declined modestly with a loss of 8,000 jobs. The largest job losses occurred within government and information. Overall, the economy added about 175,550 jobs during the recovery period, 2009 to 2014. This growth reflects the recovery period for Pennsylvania from one of the worst recessions since the Great Depression—the Great Recession which lasted from 2007 to 2009.
Figure 5 illustrates historic and current industry employment in Pennsylvania.
Fig. 5: Pennsylvania Industry Employment, 2009-2014
Source: Bureau of Labor Statistics’ Quarterly Census of Employment and Wages (QCEW) Annual Data
Education and health services
Trade, transportation, and utilities
Professional and business services
Government
Manufacturing
Leisure and hospitality
Financial activities
Construction
Other services
Information
Natural resources and mining
1.21.00.80.60.40.20.097+96+66+59+49+47+27+20+17+7+592+93+59+63+50+43+28+20+16+9+4
2009 Jobs Jobs in millions2014 Jobs
10DRAFT
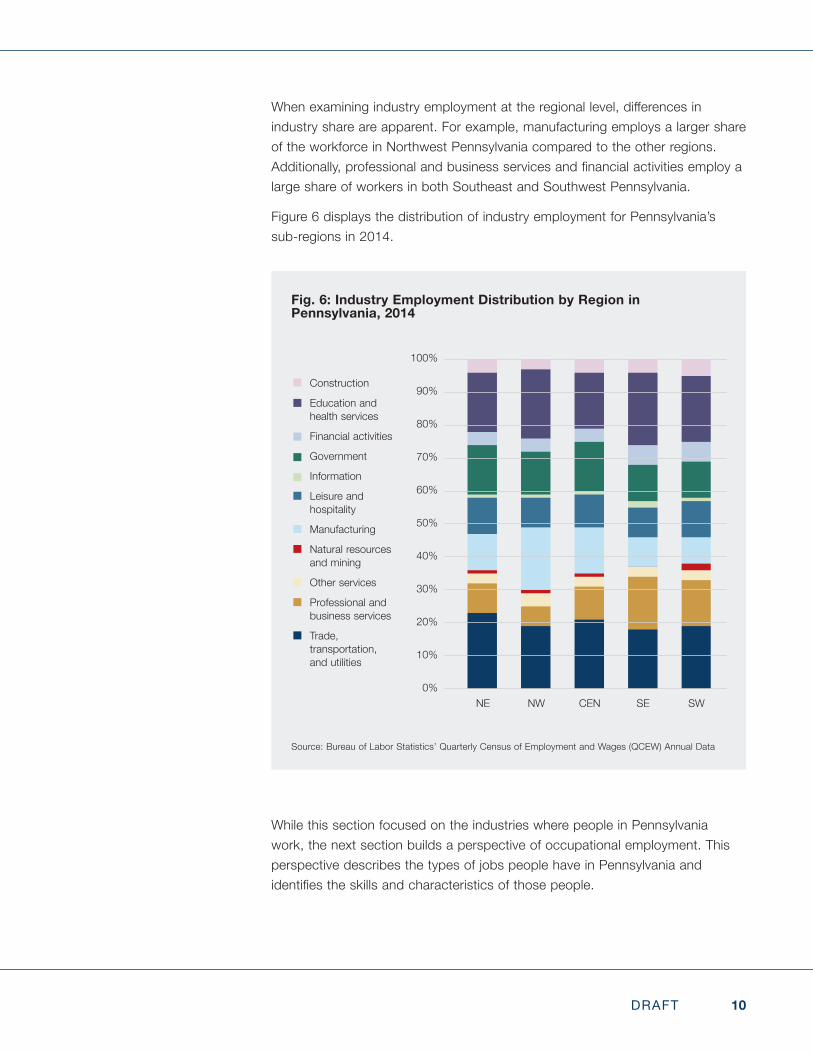
When examining industry employment at the regional level, differences in industry share are apparent. For example, manufacturing employs a larger share of the workforce in Northwest Pennsylvania compared to the other regions. Additionally, professional and business services and financial activities employ a large share of workers in both Southeast and Southwest Pennsylvania.
Figure 6 displays the distribution of industry employment for Pennsylvania’s sub-regions in 2014.
While this section focused on the industries where people in Pennsylvania work, the next section builds a perspective of occupational employment. This perspective describes the types of jobs people have in Pennsylvania and identifies the skills and characteristics of those people.
Fig. 6: Industry Employment Distribution by Region in Pennsylvania, 2014
Source: Bureau of Labor Statistics’ Quarterly Census of Employment and Wages (QCEW) Annual Data
100+96+78+74+59+58+47+36+35+32+23100%
90%
80%
70%
60%
50%
40%
30%
20%
10%
0%
Construction
Education and health services
Financial activities
Government
Information
Leisure and hospitality
Manufacturing
Natural resources and mining
Other services
Professional and business services
Trade, transportation, and utilities 100+97+76+72+59+58+49+30+29+25+19100+96+79+75+60+59+49+35+34+31+21100+96+74+68+57+55+46+37+37+34+18100+95+75+69+58+57+46+38+36+33+19
NE NW CEN SE SW
11DRAFT
LARGEST SKILLED OCCUPATIONS
Top skilled occupations in the state are driven by industry composition. For example, medical centers employ a cadre of health professionals, while enterprise management companies employ a range of business professionals. Given the dominating presence of trade, transportation and utilities; healthcare and education services; and professional and business services establishments in Pennsylvania, top skilled occupations include:
• Registered nurses (128,807 jobs),
• Secretaries and administrative assistants (107,410 jobs), and
• General and operations managers (65,499 jobs).
An important aspect to distinguish skilled occupations, in this sub-section, is that while post-secondary education is not necessarily a pre-requisite for employment, a high percentage of those employed in the skilled occupation have a post-secondary education.
Skilled occupations in the State System’s Gap Analysis project are defined using terminology from the O*NET program. The O*NET program is the nation’s primary source of occupational information. For this analysis a “skilled” occupation is defined as an occupation in O*NET Job Zones Three, Four, or Five. A Job Zone is a group of occupations that are similar in how much education people need to do the work, how much related experience people need to do the work, and how much on-the-job training people need to do the work.
Figure 7 highlights the top 20 skilled occupations in the state and 10-year job growth projections from 2014 to 2024.

12DRAFT
Fig. 7: Largest Skilled Occupations in Pennsylvania and Projections, 2014-2024
Source: BLS (QCEW and OES); Pennsylvania Department of Labor & Industry; Oxford Economics Projections
Registered Nurses
Secretaries and Administrative Assistants, Except Legal, Medical, and Executive
General and Operations Managers
Bookkeeping, Accounting, and Auditing Clerks
Sales Reps., Wholesale and Manufacturing, Except Technical and Scientific Products
Maintenance and Repair Workers, General
Elementary School Teachers, Except Special Education
Accountants and Auditors
First-Line Supervisors of Office and Administrative Support Workers
Secondary School Teachers, Except Special and Career/Technical Education
Teacher Assistants
Licensed Practical and Licensed Vocational Nurses
Automotive Service Technicians and Mechanics
Police and Sheriff's Patrol Officers
Billing and Posting Clerks
Computer User Support Specialists
Lawyers
Hairdressers, Hairstylists, and Cosmetologists
Middle School Teachers, Except Special and Career/Technical Education
Medical Assistants
83+69+42+42+41+40+36+35+35+33+29+24+22+18+17+16+16+16+16+15100+78+49+46+39+42+35+39+36+31+31+30+24+17+19+21+18+18+17+19
2014 JobsJobs2024 Jobs
120,000100,00080,00060,00040,00020,0000 160,000140,000

13DRAFT
New and replacement jobs1 presented in Figure 8 represents employer demand. Demand for new and replacement jobs reflects new job growth as well as the need to replace workers who retire or otherwise leave an occupation. Therefore, occupations that show little or no job growth may still require a significant number of new workers to fill replacement demand. An example of this is secondary school teachers. Projections indicate that secondary teacher employment will decline by 3,342 jobs between 2014 and 2024. However, the need to replace teachers who retire or leave the occupation will exceed 14,000 jobs over the same time period.
In the next section, an analysis of a narrower set of skilled occupations is provided. This group of occupations comes from the top skilled occupation list and they align more closely to university-level education.
1 New and replacement job change takes into account demand for occupations based on: industry growth (new jobs), occupation productivity, workforce ageing, migration and other factors that would contribute to new and replacement job openings.
Fig. 8: Largest Skilled Occupations (New and Replacement Demand) in Pennsylvania
SOC Code Occupation Title 2014 Jobs 2024 Jobs
10-year New and
Replacement Demand
29-1141 Registered Nurses 128,807 154,599 51,87443-6014 Secretaries and Administrative Assistants, Except Legal, Medical, and Executive 107,410 121,313 27,86011-1021 General and Operations Managers 65,499 76,216 22,37743-3031 Bookkeeping, Accounting, and Auditing Clerks 65,090 70,698 12,044
41-4012 Sales Representatives, Wholesale and Manufacturing, Except Technical and Scientific Products 63,944 60,271 11,182
49-9071 Maintenance and Repair Workers, General 61,467 64,865 16,93825-2021 Elementary School Teachers, Except Special Education 55,324 53,736 12,33013-2011 Accountants and Auditors 54,384 59,962 23,68243-1011 First-Line Supervisors of Office and Administrative Support Workers 53,975 56,449 15,40025-2031 Secondary School Teachers, Except Special and Career/Technical Education 50,953 47,611 14,01225-9041 Teacher Assistants 45,510 47,400 13,20029-2061 Licensed Practical and Licensed Vocational Nurses 36,876 46,128 18,99049-3023 Automotive Service Technicians and Mechanics 33,495 36,747 12,99233-3051 Police and Sheriff's Patrol Officers 27,582 26,483 8,79643-3021 Billing and Posting Clerks 26,292 28,692 7,71815-1151 Computer User Support Specialists 25,365 33,260 12,43623-1011 Lawyers 24,745 27,197 6,67639-5012 Hairdressers, Hairstylists, and Cosmetologists 24,351 28,440 10,97725-2022 Middle School Teachers, Except Special and Career/Technical Education 24,071 26,935 8,91031-9092 Medical Assistants 23,869 28,903 9,826
Source: BLS (QCEW and OES); Pennsylvania Department of Labor & Industry; Oxford Economics Projections

14DRAFT
Key Skilled High Demand Occupations Aligning to University-level Education
Out of the top skilled occupation list, the following five occupations represent a narrower identification of skilled occupations aligning more closely to university-level education and programs. These occupations include:
• Registered nurses (51,874 10-year new and replacement jobs),
• Accountants and auditors (23,682 10-year new and replacement jobs),
• General and operations managers (22,377 10-year new and replacement jobs),
• Market research analysts & marketing specialists (11,326 10-year new and replacement jobs), and
• Computer systems analysts (12,531 10-year new and replacement jobs).
Figure 9 and Figure 10 display the projected job growth and new and replacement job demand for the key skilled occupations.
Fig. 9: Projections of Key Skilled High Demand Occupations in Pennsylvania
Source: BLS (QCEW and OES); Pennsylvania Department of Labor & Industry; Oxford Economics Projections
Registered Nurses
Accountants and Auditors
General and Operations Managers
Market Research Analysts & Marketing Specialists
Computer Systems Analysts
83+35+42+15+15100+39+49+20+2033+15+14+7+82014 Jobs
Jobs in thousands
2024 Jobs 10 Year New & Replacement Demand
16080400 120

15DRAFT
Key Skilled High Demand Occupational ProfileIn addition to understanding the industries that employ key skilled high demand occupations, it is useful to focus on the demographic characteristics of those employed. The following section outlines the demographics for people from Pennsylvania who work in these key skilled occupations by showing each occupation’s composition by gender, race/ethnicity, age, and education. This lends further insight into who generally works in the career and answers questions such as:
• Are women or men typically found in the occupation?
• Do certain races/ethnicities occupy larger shares of the occupation?
• What is the age distribution of the occupation?
• What is the educational attainment of workers in the occupation?
For comparative purposes, the demographic composition of Pennsylvania’s entire population is further described in the demographics section, found later in this report.
Fig. 10: Projections of Key Skilled High Demand Occupations in Pennsylvania
SOC Code Occupation Title 2014 Jobs 2024 Jobs
10-Year New &
Replacement Demand
29-1141 Registered Nurses 128,807 154,599 51,874
13-2011 Accountants and Auditors 54,384 59,962 23,682
11-1021 General and Operations Managers 65,499 76,216 22,377
13-1161 Market Research Analysts and Marketing Specialists 23,315 30,907 11,326
15-1121 Computer Systems Analysts 23,193 31,622 12,531
Source: BLS (QCEW and OES); Pennsylvania Department of Labor & Industry; Oxford Economics Projections

16DRAFT
Source: U.S. Census - American Community Survey (ACS) 2009-2013 5-year file
7+93+G15+33+52+G 88+12+G
88+7+3+1+1+G88+78+35
Gender
Age Group
Race/ Ethnicity
7%
15%
33%
88%
7%3%
12%
88%
1% 1%
93%
52%
Male
16–29
White
College Degree
Hispanic
Associate’s
Female
30–44 45+
Black
No Degree
Other
Bachelor’s
Asian
Master’s or above
Education
10%
43%
35%
REGISTERED NURSES IN PENNSYLVANIAThe demographic profile of registered nurses is largely dominated by white females. Age distribution indicates that registered nurses are a more mature cohort of workers (45 years and older), which can put increasing pressure on replacement jobs due to retirements over the next 10 years. Nearly 90% of registered nurses have an associate’s degree or higher indicating that this is a highly educated occupation.
17DRAFT
Source: U.S. Census - American Community Survey (ACS) 2009-2013 5-year file
71+29+G8+36+56+G 58+42+G
89+5+2+2+2+G58+42+9
Gender
Age Group
Race/ Ethnicity
71%
8%
36%
90%
5%2%
42%
58%
2%2%
29%
56%
Male
16–29
White
College Degree
Hispanic
Associate’s
Female
30–44 45+
Black
No Degree
Other
Bachelor’s
Asian
Master’s or above
Education
16%
33%
9%
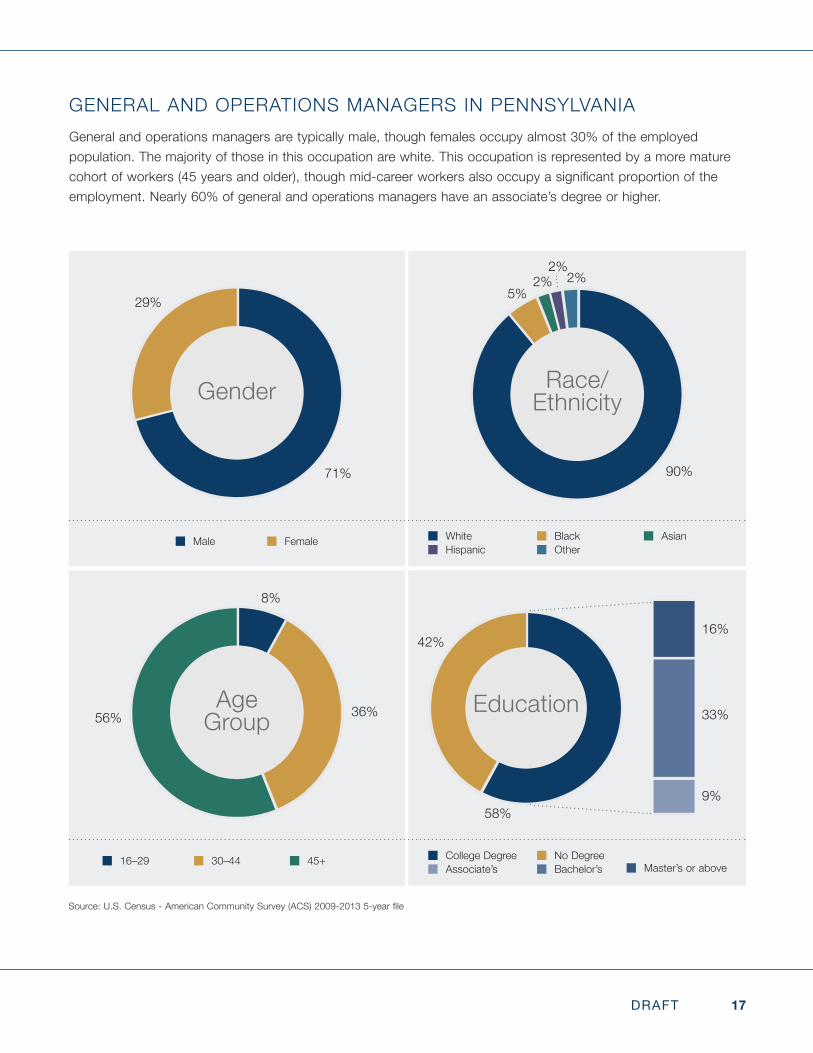
GENERAL AND OPERATIONS MANAGERS IN PENNSYLVANIAGeneral and operations managers are typically male, though females occupy almost 30% of the employed population. The majority of those in this occupation are white. This occupation is represented by a more mature cohort of workers (45 years and older), though mid-career workers also occupy a significant proportion of the employment. Nearly 60% of general and operations managers have an associate’s degree or higher.

18DRAFT
ACCOUNTANTS AND AUDITORS IN PENNSYLVANIAAccountants and auditors are fairly equally split between male and female. A high proportion of white individuals are found in the occupation. Additionally, the age distribution is fairly even between entry-level and mature workers, indicating that the occupation provides good opportunities for first destinations of recent college graduates. Nearly 90% of accountants and auditors have an associate’s degree or higher indicating that this is a highly educated occupation.
Source: U.S. Census - American Community Survey (ACS) 2009-2013 5-year file
47+53+G19+34+47+G 89+11+G
87+6+4+2+1+GGender
Age Group
Race/ Ethnicity
47%
19%
34%
88%
6%4%
11%
89%
2%1%
53%
47%
Male
16–29
White
College Degree
Hispanic
Associate’s
Female
30–44 45+
Black
No Degree
Other
Bachelor’s
Asian
Master’s or above
Education 89+70+919%
61%
9%

19DRAFT
Source: U.S. Census - American Community Survey (ACS) 2009-2013 5-year file
65+35+G19+38+43+G 81+19+G
78+5+14+2+1+G81+59+8
Gender
Age Group
Race/ Ethnicity
65%
19%
38%
78%
5%
14%
19%
81%
2%1%
35%
43%
Male
16–29
White
College Degree
Hispanic
Associate’s
Female
30–44 45+
Black
No Degree
Other
Bachelor’s
Asian
Master’s or above
Education
22%
51%
8%
COMPUTER SYSTEMS ANALYSTS IN PENNSYLVANIAComputer systems analysts show a larger proportion of males in the occupation compared to females. While still represented by a larger share of white workers, a significant number of Asian workers are found in the occupation. The age composition of this occupation indicates that a higher proportion of younger and mid-career workers make up the workforce. Over 80% of computer systems analysts have an associate’s degree or higher indicating that this is a highly educated occupation.

20DRAFT
Source: U.S. Census - American Community Survey (ACS) 2009-2013 5-year file
43+57+G24+44+32+G 88+12+G
86+4+3+5+2+G88+57+4
Gender
Age Group
Race/ Ethnicity
43%
24%
44%
86%
4%3%
13%
88%
5% 2%
57%
32%
Male
16–29
White
College Degree
Hispanic
Associate’s
Female
30–44 45+
Black
No Degree
Other
Bachelor’s
Asian
Master’s or above
Education
30%
53%
4%
MARKET RESEARCH ANALYSTS AND MARKETING SPECIALISTS IN PENNSYLVANIAMarket research analysts and marketing specialists indicate a larger proportion of females within the occupation compared to males. The race/ethnicity distribution of the occupation is predominately white. The age distribution of the occupation shows more than two thirds of the employed market research analysts and marketing specialists are under 45 years old. Nearly 90% of workers in this occupation have an associate’s degree or higher indicating that this is a highly educated occupation.
21DRAFT
While this section covers skilled occupations state-wide, the next section briefly highlights the top high demand skilled occupations in each of Pennsylvania’s five sub-regions.
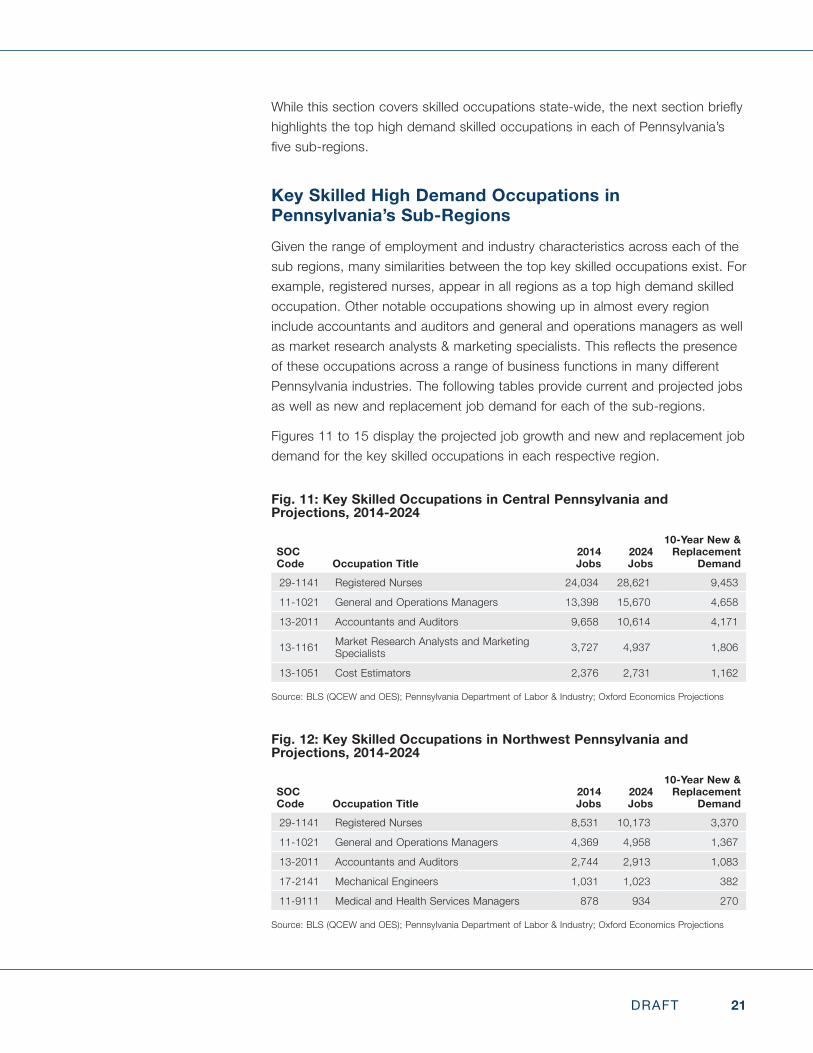
Key Skilled High Demand Occupations in Pennsylvania’s Sub-RegionsGiven the range of employment and industry characteristics across each of the sub regions, many similarities between the top key skilled occupations exist. For example, registered nurses, appear in all regions as a top high demand skilled occupation. Other notable occupations showing up in almost every region include accountants and auditors and general and operations managers as well as market research analysts & marketing specialists. This reflects the presence of these occupations across a range of business functions in many different Pennsylvania industries. The following tables provide current and projected jobs as well as new and replacement job demand for each of the sub-regions.
Figures 11 to 15 display the projected job growth and new and replacement job demand for the key skilled occupations in each respective region.
Fig. 11: Key Skilled Occupations in Central Pennsylvania and Projections, 2014-2024
SOC Code Occupation Title
2014 Jobs
2024 Jobs
10-Year New & Replacement
Demand29-1141 Registered Nurses 24,034 28,621 9,453
11-1021 General and Operations Managers 13,398 15,670 4,658
13-2011 Accountants and Auditors 9,658 10,614 4,171
13-1161 Market Research Analysts and Marketing Specialists 3,727 4,937 1,806
13-1051 Cost Estimators 2,376 2,731 1,162
Source: BLS (QCEW and OES); Pennsylvania Department of Labor & Industry; Oxford Economics Projections
Fig. 12: Key Skilled Occupations in Northwest Pennsylvania and Projections, 2014-2024
SOC Code Occupation Title
2014 Jobs
2024 Jobs
10-Year New & Replacement
Demand29-1141 Registered Nurses 8,531 10,173 3,370
11-1021 General and Operations Managers 4,369 4,958 1,367
13-2011 Accountants and Auditors 2,744 2,913 1,083
17-2141 Mechanical Engineers 1,031 1,023 382
11-9111 Medical and Health Services Managers 878 934 270
Source: BLS (QCEW and OES); Pennsylvania Department of Labor & Industry; Oxford Economics Projections

22DRAFT
The final section of this report explores Pennsylvania’s demographic and socioeconomic characteristics. While not tied to a specific occupation, the analysis further contextualizes the statewide population and workforce.
Fig. 13: Key Skilled Occupations in Northeast Pennsylvania and Projections, 2014-2024
Code Occupation Title2014 Jobs
2024 Jobs
10-Year New & Replacement
Demand29-1141 Registered Nurses 8,544 10,329 3,515
11-1021 General and Operations Managers 4,459 5,152 1,486
13-1161 Market Research Analysts and Marketing Specialists 1,204 1,547 537
15-1121 Computer Systems Analysts 1,022 1,264 423
13-1111 Management Analysts 1,018 1,145 296
Source: BLS (QCEW and OES); Pennsylvania Department of Labor & Industry; Oxford Economics Projections
Fig. 14: Key Skilled Occupations in Southeast Pennsylvania and Projections, 2014-2024
Code Occupation Title2014 Jobs
2024 Jobs
10-Year New & Replacement
Demand29-1141 Registered Nurses 56,147 68,896 24,118
13-2011 Accountants and Auditors 25,453 28,254 11,274
11-1021 General and Operations Managers 27,499 32,312 9,708
13-1161 Market Research Analysts and Marketing Specialists 11,847 15,780 5,829
15-1121 Computer Systems Analysts 12,413 16,782 6,564
Source: BLS (QCEW and OES); Pennsylvania Department of Labor & Industry; Oxford Economics Projections
Fig. 15: Key Skilled Occupations in Southwest Pennsylvania and Projections, 2014-2024
SOC Code Occupation Title
2014 Jobs
2024 Jobs
10-Year New & Replacement
Demand29-1141 Registered Nurses 31,551 36,580 11,418
13-2011 Accountants and Auditors 13,610 15,001 5,922
15-1121 Computer Systems Analysts 5,589 7,885 3,284
13-1161 Market Research Analysts and Marketing Specialists 5,648 7,542 2,799
17-2051 Civil Engineers 4,301 4,971 1,843
Source: BLS (QCEW and OES); Pennsylvania Department of Labor & Industry; Oxford Economics Projections

23DRAFT
DEMOGRAPHIC AND SOCIOECONOMIC COMPOSITION
This section provides information about the regional demographic and socio-economic composition of Pennsylvania’s workforce in order to better understand the characteristics of the population. An additional focus evaluates changes in age cohorts for university-age residents.
Analysis of three socio-economic indicators—education, unemployment, and poverty—also provides insight into the segment of the population that may be considered economically disadvantaged. Areas with high proportions of economically disadvantaged learners may require additional considerations in education support.
Pennsylvania’s DemographicsThe Pennsylvania economy has a population of about 12.7 million people. As shown in Figure 16, there are about 310,000 more females compared to males. Figure 17 illustrates that the majority of the state is represented by a white demographic, with Blacks representing the next largest group, followed by Hispanics.
Fig. 16: Pennsylvania Population Distribution by Gender
Source: U.S. Census – American Community Survey (ACS) 2009-2013 5-year file
49+51+I Male6,211,011
49%Female
6,520,37051%

24DRAFT
Next, the age characteristics of both the Pennsylvania population and State System learners are analyzed. Fall 2014 data from the State System Research Office indicates
• Traditional students (aged 18 to 22 years) comprise approximately 83% (90,966) of learners within the State System and
• Adult learners (aged 23 year and above) comprise about 17% (18,640) of State System learners.
A view of the change in population by age demographic indicates a diminishing number in the traditional age cohort in the commonwealth and a growing number of adults aged 25 to 34 years old. As illustrated in figure 18, the 10 to 19 year old cohort population declined by over 75,000 people between 2010 and 2014—a 4% decline. Conversely, the 25-34 year old cohort increased nearly 8%, or 113,000 people, over the same time period. This demographic shift presents challenges and opportunities related to university recruitment strategy.
Fig. 17: Pennsylvania and Sub-Regions Race/Ethnicity Composition
Source: U.S. Census - American Community Survey (ACS) 2009-2013 5-year file
100%
White Black Asian Hispanic All Other
90%
80%
70%
60%
50%
40%
30%
20%
10%
0% 79 + 10 + 3 + 6 + 287 + 4 + 1 + 6 + 292 + 4 + 1 + 2 + 187 + 5 + 2 + 5 + 266 + 18 + 5 + 9 + 288 + 7 + 2 + 1 + 2PA 79% 10% 3% 6% 2%NE 87% 4% 1% 6% 2%NW 92% 4% 1% 2% 1%CEN 87% 5% 2% 5% 2%SE 66% 18% 5% 9% 2%SW 88% 7% 2% 1% 2%

25DRAFT
The next sub-section further explores the shifting socio-economic characteristics in Pennsylvania by identifying three inter-related variables—educational attainment, unemployment, and poverty.
Educational Attainment in Pennsylvania
The levels of educational attainment of a population indicate several characteristics in an economy. Areas with better educated workers earn higher wages, are more productive and can typically adjust more quickly to changing economic conditions. Additionally, an educated workforce is less likely to be unemployed, require social assistance, and more likely to lead a healthier lifestyle.2, 3
A view of Pennsylvania’s educational attainment indicates that more than half (52%) of those over 25 years old have had some post-secondary education or higher. Some college is defined by the American Community Survey (ACS) as having some college, but less than one year or one or more years of college credit, but no degree. This lags behind the national average of 58% of the population having some post-secondary education or higher.
2 Feinstein et. al. (2006), “The effects of education on health: Concepts, evidence and policy implications: A review for the OECD Center for Educational Research and Innovation (CERI)”, unpublished manuscript, OECD, Paris.
3 Mitra, Dana (2011), “Pennsylvania’s Best Investment: The Social and Economic Benefits of Public Education.” Report published for the Education Law Center.
Fig. 18: Pennsylvania Changes in Age Cohorts
Source: U.S. Census
950,000
900,000
850,000
800,000
750,000
700,0002010 2011 2012 2013 2014
10 to 14 years15 to 19 years20 to 24 years25 to 29 years30 to 34 years

26DRAFT
When comparing degree completion, Pennsylvania is near the national average for the proportion of the population with an associate’s degree, bachelor’s degree, and master’s degree or higher.
At the regional level, Southeast Pennsylvania has the highest level of educational attainment with 39% of the 25+ population having an associate’s degree or higher, while Northwest Pennsylvania has the lowest level at 28%.
Figure 19 compares the educational attainment of the 25 years and older population in Pennsylvania and its sub-regions.
Unemployment
Pennsylvania’s unemployment rate—5.8% in 2014—trended closely with the national unemployment rate since 2012. This suggests that opportunities for dislocated workers on average are roughly the same, compared to the rest of the nation.
Figure 20 shows the convergence of the unemployment rates of the US and Pennsylvania from 2009 to 2014.
Fig. 19: Pennsylvania and Sub-Regions Educational Attainment of 25+ Years Olds
Source: U.S. Census - American Community Survey (ACS) 2009-2013 5-year file
HS or Below Some College Associate’s Bachelor’s Master’s or Higher
60%
50%
40%
30%
20%
10%
0% 48 + 17 + 8 + 17 + 1152 + 18 + 9 + 14 + 857 + 15 + 8 + 13 + 754 + 16 + 8 + 14 + 944 + 17 + 7 + 19 + 1347 + 16 + 9 + 17 + 10PA 48% 17% 8% 17% 11%NE 52% 18% 9% 14% 8%NW 57% 15% 8% 13% 7%CEN 54% 16% 8% 14% 9%SE 44% 17% 7% 19% 13%SW 47% 16% 9% 17% 10%

27DRAFT
At the regional level, Central Pennsylvania has the lowest unemployment rate at 5.2%, while Northeast Pennsylvania has the highest unemployment rate at 6.9%.
Figure 21 displays the unemployment rates for Pennsylvania’s sub-regions in 2014.
Fig. 20: Pennsylvania and U.S. Unemployment Rate
Source: Bureau of Labor Statistics – Local Area Unemployment Statistics
20102009 2011 2012 2013 2014
Unemployment Rate PA Unemployment Rate US12.0
10.0
8.0
6.0
2.0
0.0
4.0
Fig. 21: Pennsylvania’s Sub-Region Unemployment Rates, 2014
Source: Bureau of Labor Statistics – Local Area Unemployment Statistics, Oxford Economics Mapping

28DRAFT
Poverty
In Pennsylvania, the poverty rate trended upward since 2009. However, the poverty rate remains more than 15% below the U.S. average.4 Given the lower poverty rate compared with the nation, there is an underlying assumption that the compensation associated with the jobs in Pennsylvania may be higher than the national average.
Figure 22 compares the poverty rates of the US and Pennsylvania from 2009 to 2013.
At the regional level, Central Pennsylvania has the lowest poverty rate at 12% while Northwest Pennsylvania has the highest poverty rate at 16%. However, Northwest Pennsylvania is close to the U.S. poverty rate of 15.9% indicating that all regions in Pennsylvania are at or below the national poverty rate.
Figure 23 displays the poverty rates for Pennsylvania’s sub-regions in 2013.
4 Poverty estimates are based on U.S. Census Bureau’s Small Area Income and Poverty Estimates data series. Calculations comprise the total number of individuals (all ages) in the geography, divided by the number of individuals (all ages) that are classified as being in poverty.
Fig. 22: Pennsylvania and U.S. Poverty Rates
Source: U.S. Census – Small Area Income & Poverty Estimates (SAIPE)
20102009 2011 2012 2013
Poverty Rate PA Poverty Rate US18.0
16.0
14.0
10.0
8.0
12.0

29DRAFT
When unemployment and poverty are evaluated together, a significant decline in unemployment to pre-recession levels, coupled with a small uptick in the poverty rate, suggests an underlying cause that is contributing to marginally increased poverty rates. This cause may be associated with the quality of new jobs that have emerged since the recession, which have done little to abate poverty rates, despite decreasing unemployment.
Although the poverty rate indicates an overall small increasing trend, the unemployment rate shows a decreasing trend, meaning a larger proportion of the workforce is either employed or is no longer seeking employment.
Fig. 23: Pennsylvania’s Sub-Region Poverty Rates, 2013
Source: U.S. Census – Small Area Income & Poverty Estimates (SAIPE), Oxford Economics Mapping

30DRAFT
CONCLUSION
These findings are further described in the statewide and regional Workforce Characteristics Reports.
This report sets the foundation for program planning by accomplishing three key tasks:
• Defining the state’s sub-region workforce areas
• Describing key economic, workforce, and demographic attributes in the state economy
• Forecasting the initial demand for skilled occupations in Pennsylvania and its regions.
The next steps for research to support Pennsylvania’s State System of Higher Education Program Alignment Toolkit are the development of an education supply and workforce demand gap analysis.
The report was produced through a multi-organization collaboration that consisted of Pennsylvania’s State System of Higher Education Office of the Chancellor, Oxford Economics USA Inc., and Georgetown University’s Center for Education and the Workforce—the team. This report is confidential to clients of Pennsylvania’s State System of Higher Education and may not be published or distributed without their prior written permission.

31DRAFT
APPENDIX 1: HIGH DEMAND5 SKILLED6 OCCUPATIONS IN PENNSYLVANIA, 2014 TO 2024
SOC Code Occupation Title
Job Zone
New and Replacement
Jobs, 2014-202429-1141 Registered Nurses 3 51,874
43-6014 Secretaries and Administrative Assistants, Except Legal, Medical, and Executive 3 27,860
13-2011 Accountants and Auditors 4 23,682
11-1021 General and Operations Managers 4 22,377
29-2061 Licensed Practical and Licensed Vocational Nurses 3 18,990
49-9071 Maintenance and Repair Workers, General 3 16,938
43-1011 First-Line Supervisors of Office and Administrative Support Workers 3 15,400
25-2031 Secondary School Teachers, Except Special and Career/Technical Education 4 14,012
25-9041 Teacher Assistants 3 13,200
49-3023 Automotive Service Technicians and Mechanics 3 12,992
15-1121 Computer Systems Analysts 4 12,531
15-1151 Computer User Support Specialists 3 12,436
25-2021 Elementary School Teachers, Except Special Education 4 12,330
43-3031 Bookkeeping, Accounting, and Auditing Clerks 3 12,044
13-1161 Market Research Analysts and Marketing Specialists 4 11,326
41-4012 Sales Representatives, Wholesale and Manufacturing, Except Technical and Scientific Products 4 11,182
39-5012 Hairdressers, Hairstylists, and Cosmetologists 3 10,977
47-2111 Electricians 3 10,844
15-1132 Software Developers, Applications 4 10,702
31-9092 Medical Assistants 3 9,826
21-1093 Social and Human Service Assistants 4 9,638
25-2022 Middle School Teachers, Except Special and Career/Technical Education 4 8,910
5 New and replacement demand over 5,0006 Occupations in Job Zones Three, Four, and Five

32DRAFT
SOC Code Occupation Title
Job Zone
New and Replacement
Jobs, 2014-202415-1131 Computer Programmers 4 8,849
13-1071 Human Resources Specialists 4 8,830
43-6013 Medical Secretaries 3 8,822
33-3051 Police and Sheriff’s Patrol Officers 3 8,796
25-2011 Preschool Teachers, Except Special Education 3 8,622
51-4121 Welders, Cutters, Solderers, and Brazers 3 8,389
13-1111 Management Analysts 4 8,251
51-4041 Machinists 3 7,597
49-9041 Industrial Machinery Mechanics 3 6,914
29-1123 Physical Therapists 5 6,878
23-1011 Lawyers 5 6,676
49-1011 First-Line Supervisors of Mechanics, Installers, and Repairers 3 6,663
29-2041 Emergency Medical Technicians and Paramedics 3 6,661
21-1021 Child, Family, and School Social Workers 4 6,172
39-9041 Residential Advisors 3 6,043
49-3031 Bus and Truck Mechanics and Diesel Engine Specialists 3 6,003
49-9021 Heating, Air Conditioning, and Refrigeration Mechanics and Installers 3 5,999
47-1011 First-Line Supervisors of Construction Trades and Extraction Workers 3 5,995
41-3021 Insurance Sales Agents 4 5,937
39-9011 Childcare Workers 3 5,579
13-2051 Financial Analysts 4 5,522
17-2051 Civil Engineers 4 5,445
51-4011 Computer-Controlled Machine Tool Operators, Metal and Plastic 3 5,149
29-1069 Physicians and Surgeons, All Other 5 5,145
13-1031 Claims Adjusters, Examiners, and Investigators 4 5,093

33DRAFT
ABOUT THE STATE SYSTEM’S GAP ANALYSIS PROJECT
The Workforce Characteristics Report was produced through a multi-organization collaboration that consisted of Pennsylvania’s State System of Higher Education Office of the Chancellor, Oxford Economics USA Inc., and Georgetown University’s Center on Education and the Workforce. Oxford Economics completed the analysis and research work for this report, under the guidance of The State System’s Office of the Chancellor, the team sought feedback and insight from senior administration and representatives from each of the 14 State System Universities. The team also drew on insight and feedback from subject matter experts involved in labor market intelligence and education program alignment.
The modeling and results presented here are based on information provided by third parties, upon which Oxford Economics has relied in producing its report and forecasts in good faith. Any subsequent revision or update of those data will affect the assessments and projections shown.
Oxford Economics is a key adviser to corporate, financial, government and education decision-makers and thought leaders. Oxford Economics’ worldwide client base now comprises over 1000 international organizations, including leading multinational companies and financial institutions; key government bodies and trade associations; and top universities, consultancies, and think tanks.
This report is confidential to clients of Pennsylvania’s State System of Higher Education and may not be published or distributed without their prior written permission. Contact information for such request is provided below:
Dr. Sue Mukherjee Executive Director for Program Alignment and Policy Development Phone: (717) 720-4201 Email: [email protected]