pengumuman equity research pt multipolar tbk. (mlpl
TRANSCRIPT

PENGUMUMAN
Equity Research PT Multipolar Tbk. (MLPL)
(Tercatat Di Papan : Pengembangan) No.Peng-ER-00011/BEI.PPJ/03-2012
(dapat dilihat di laman: http://www.idx.co.id) PT Bursa Efek Indonesia pada tanggal 21 Maret 2012 telah menerima surat melalui email dari PT Pemeringkat Efek Indonesia dengan No. 485/PEF-DIR/IiI/2012 tanggal 19 Maret 2012 mengenai Publikasi Laporan Penilaian Target Harga Referensi Saham PT Multipolar Tbk. sebagaimana terlampir (32 lembar). Demikian untuk diketahui.
21 Maret 2012
Umi Kulsum Andre P.J. Toelle Kepala Divisi Penilaian Perusahaan Sektor Jasa Kepala Divisi Perdagangan Saham Tembusan: 1. Yth. Ketua Badan Pengawas Pasar Modal dan LK; 2. Yth. Kepala Biro Transaksi dan Lembaga Efek Bapepam dan LK; 3. Yth. Kepala Biro PKP Sektor Jasa Bapepam dan LK; 4. Yth. Pengurus Pusat Referensi Pasar Modal; 5. Yth. Direksi PT Multipolar Tbk.
psu_MLPL_er_20120321_11

'"PEFINDO CREDIT RATING INDONESIA
485 /PEF-DIR/III/ 2012
Jakarta, 19 Maret 2012
Kepada Yth.1. PT Multipolar Tbk
Menara Matahari - Lippo life Lt. 16Boulevard Palem Raya 7Karawaci 1100Tangerang 15811
u.p. Bapak Reynold Ong , DirekturBapak Chrys R.N. Sinulingga, Corporate Secretary
2. PT Bursa Efek IndonesiaGedung Bursa Efek IndonesiaJI. Jend. Sudirman Kav 52-53Jakarta Selatan, 12190
u.p. Bapak Ito Warsito, Direktur UtamaBapak Eddy Sugito, Direktur Penilaian Perusahaan
Perihal: Publikasi Laporan Penilaian Target Harga Referensi Saham PT Multipolar Tbk.
Dengan hormat,
Sehubungan dengan penugasan yang kami peroleh untuk melakukan Penilaian Target HargaReferensi Saham, dengan ini kami sampaikan hasil penilaian kami atas saham PT Multipolar Tbk(MLPL) dalam versi Bahasa Indonesia dan Bahasa Inggris.
Apabila masih ada hal-hal yang memerlukan penjelasan lebih lanjut, mohon agar menghubungi kami.Atas perhatian dan kerjasamanya, kami ucapkan terima kasih.
Hormat kami,
"
se Rizalirektur
Ronald T. Andi Kasim, CFADirektur Utama
Tembusan : Ibu Umi Kulsum, Kepala Divisi Pencatatan Sektor Jasa, PT Bursa Efek Indonesia
/ww
PT. Pemeringkat Efek IndonesiaPanin Tower Senayan City, 17th FloorJI. Asia Afrika Lot. 19, Jakarta 10270, INDONESIAPhone: (62-21) 7278 2380 • Fax: (62-21) 7278 2370

Halaman 1 dari 16 halaman
Kontak: Equity & Index Valuation Division Phone: (6221) 7278 2380 [email protected] “Pernyataan disclaimer pada halaman akhir
merupakan bagian yang tidak terpisahkan dari
dokumen ini”
www.pefindo.com
Multipolar, Tbk Laporan Utama
Equity Valuation
19 Maret 2012
Target Harga
Terendah Tertinggi 360 385
Grup Retail & IT
Property
Kinerja Saham
Source : Bloomberg
Informasi Saham Rp
Kode Saham MLPL
Harga saham per 16 Maret 2012 136
Harga Tertinggi 52 Minggu Terakhir 275
Harga Terendah 52 Minggu Terakhir 124
Kapitalisasi Pasar Tertinggi 52 Minggu
(miliar) 2.396
Kapitalisasi Pasar Terendah 52 Minggu
(miliar) 958
Market Value Added & Market Risk
Source : Bloomberg, Pefindo Equity & Index Valuation Division
Pemegang Saham * (%)
Cyport Limited 26,95
Grandhill Asia Limited 5,05
HSBC-Fund Services 5,38
Public (each below 5%) 62,62
Catt: Per 31 Desember 2011
Menjanjikan untuk Menjadi Pemain Terbesar dalam
Industri Ritel
PT Multipolar Tbk (“MLPL”) didirikan pada tahun 1975 sebagai peritel elektronik yang berubah menjadi penyedia solusi informasi dan teknologi (IT). Di tahun 1986, MLPL menjadi mitra usaha IBM yang pertama di Indonesia. Walaupun MLPL memulai usahanya sebagai peritel elektronik,
saat ini MLPL juga fokus dalam mengembangkan bisnisnya untuk menjadi
pemain besar dalam industri ritel melalui kepemilikannya pada PT Matahari Putra Prima Tbk (MPPA) dan Robbinz Department Store (“RDS”) di Cina. Saat ini, MLPL memiliki jaringan ritel yang sangat luas yang tersebar di Indonesia dan Cina. Di Indonesia, MLPL melalui MPPA mengoperasikan 63 Hypermart, 24 Foodmart dan 63 Boston HBC’s.
Sedangkan di Cina, MLPL telah membuka 6 toko ritel yang terdiri dari 2 Hypermart di Tianjin dan Suzhou dan 4 Department Store di Tianjin, Chengdu, Yangzhou, dan Suzhou. Selain itu, MLPL masih akan terus melakukan pengembangan pada lini bisnis IT dan Multimedianya dan terus mencari peluang investasi lainnya untuk mencapai portfolio bisnis yang lebih strategis.

“Pernyataan disclaimer pada halaman
akhir merupakan bagian yang tidak
terpisahkan dari dokumen ini”
www.pefindo.com
Multipolar, Tbk
19 Maret 2012 Halaman 2 dari 16 halaman
Perkembangan Perekonomian Indonesia dan Cina: Permintaan Domestik Masih Akan Mendukung Pertumbuhan Ekonomi
Pertumbuhan perekonomian dunia di tahun 2012 masih akan diperkuat oleh pertumbuhan yang dinamis di negara-negara berkembang dan negara maju yang didukung oleh permintan domestik mereka. Perekonomian
negara berkembang diperkirakan akan tumbuh sebesar 5,1% YoY di tahun 2011, lebih rendah dari 6,4% YoY di tahun 2010, sedangkan perekonomian Indonesia di tahun 2012 diperkirakan akan tumbuh sebesar 6,2% YoY sedikit lebih rendah dari pertumbuhan tahun 2011 yaitu sebesar 6,5% YoY. Pertumbuhan ekonomi Cina masih akan tinggi karena masih kuatnya permintaan konsumen. Perekonomian Cina diperkirakan akan tumbuh sebesar 8,7% YoY di tahun 2012, lebih rendah dari pertumbuhan tahun
2011 yaitu sebesar 9,5% YoY. Masih tingginya proyeksi pertumbuhan perekonomian kedua negara juga tergambar pada outlook industri ritel yang memiliki kaitan yang sangat erat dengan permintaan konsumen, pendapatan per kapita dan daya beli masyarakat. Industri ritel pada kedua negara diestimasikan akan tumbuh masing-masing sebesar 20% dan 13,2% di Indonesia dan Cina.
Kinerja yang Lebih Baik selama 9M2011 Selain rugi bersih dari perusahaan asosiasi pada sembilan bulan pertama 2011, MLPL menunjukkan kinerja yang lebih baik dibandingkan dengan periode yang sama tahun 2010. Pada lini atas, pendapatan konsolidasi MLPL meningkat 7,3% YoY menjadi Rp 7,6 triliun dari Rp 7,0 triliun di 9M2010. Peningkatan pendapatan pada periode ini berasal dari unit usaha ritel dan distribusi yang didukung oleh pendapatan MPPA. Selama 9M2011,
pendapatan dari unit bisnis ritel meningkat sebesar 0,63% YoY menjadi Rp 6,6 triliun dan memberikan kontribusi sekitar 88% terhadap pendapatan konsolidasi MLPL. Sementara, pendapatan MLPL dari bisnis TI tumbuh secara signifikan sebesar 115% YoY menjadi Rp 833 miliar dari Rp 388 miliar di 9M2010. Sedangkan, pada tingkat operasi, MLPL berhasil membukukan laba usaha positif sebesar Rp 843 juta, meningkat 102% YoY dari minus Rp 41 miliar di 9M2010.
Berekspansi Untuk Pertumbuhan Berkelanjutan
Untuk tahun 2012, MLPL telah menganggarkan dana sebesar USD 90 juta untuk pengembangan usaha. Sebagai kontributor utama pendapatannya, MLPL terus mengembangakan bisnis ritel dengan membuka beberapa toko baru. Selain toko ritel MPPA di Indonesia yang telah membuka 12 toko ritel
baru di tahun 2011, pada waktu yang sama, MLPL juga membuka 3 toko ritel di Cina yang terdiri atas 2 Hypermart di Tianjin dan Suzhou dan 1 gerai Robbinz di Suzhou. Sementara itu, di tahun 2012, MLPL berencana untuk membuka sekitar 10 toko baru di Cina yang diproyeksikan akan membutuhkan dana sekitar USD 60 juta, sedangkan di Indonesia anak perusahaannya (MPPA) juga akan membuka sekitar 15 gerai Hypermart selama tahun 2012. Di sisi lain, lini bisnis IT sedang mengembangkan
program cloud computing (komputasi awan) yang direncanakan akan diluncurkan pada tahun 2013. Di tahun ini, MLPL akan membangun pusat data untuk mendukung program cloud computing tersebut dan diperkirakan akan menghabiskan belanja modal sekitar USD 30 juta. Dengan belanja modal tersebut, kami memproyeksikan pendapatan MLPL akan tumbuh dengan rata-rata CAGR sebesar 23,0% selama periode 2010-2014.
Prospek Usaha
Sejalan dengan pertumbuhan industri ritel di Indonesia dan Cina yang diperkirakan akan terus tumbuh masing-masing sebesar 20% dan 13,2%, prospek bisnis ritel yang merupakan kontributor pendapatan utama MLPL akan tetap aman, didukung oleh jaringan ritel yang luas dan tersebar dihampir semua provinsi di Indonesia dan di beberapa kota-kota besar di Cina. Kami memproyeksikan pendapatan MLPL dari bisnis ritel akan tumbuh
sebesar 17,5%YoY di tahun 2012 dan tumbuh dengan rata-rata CAGR sebesar 27,1% selama tahun 2011-2015. Pada sisi lain, tahun 2012 akan menjadi tahun yang penting bagi industri teknologi, informasi dan komunikasi (TIK) baik secara global maupun di Asia. Khusus di Indonesia, Business Monitor International (BMI) memprediksikan industri TIK akan tumbuh sebesar 18% per tahun dalam empat tahun ke depan. Berbagai
PARAMETER INVESTASI
“Pernyataan disclaimer pada halaman
akhir merupakan bagian yang tidak
terpisahkan dari dokumen ini”
www.pefindo.com
Multipolar, Tbk
19 Maret 2012 Halaman 3 dari 16 halaman
tren yang menunjukkan daya tarik industri ini dalam beberapa tahun terakhir yang telah teruji dan akan menjadi fitur utama dari industri TIK dimasa yang akan datang, sebagai contoh komputasi awan. Sejalan dengan ekspansi dalam program komputasi awan, MLPL akan merasakan manisnya
bisnis ini pada tahun 2013. Namun demikian, industri TIK di Indonesia masih dihadapkan pada minimnya infrastruktur dan kesenjangan digital
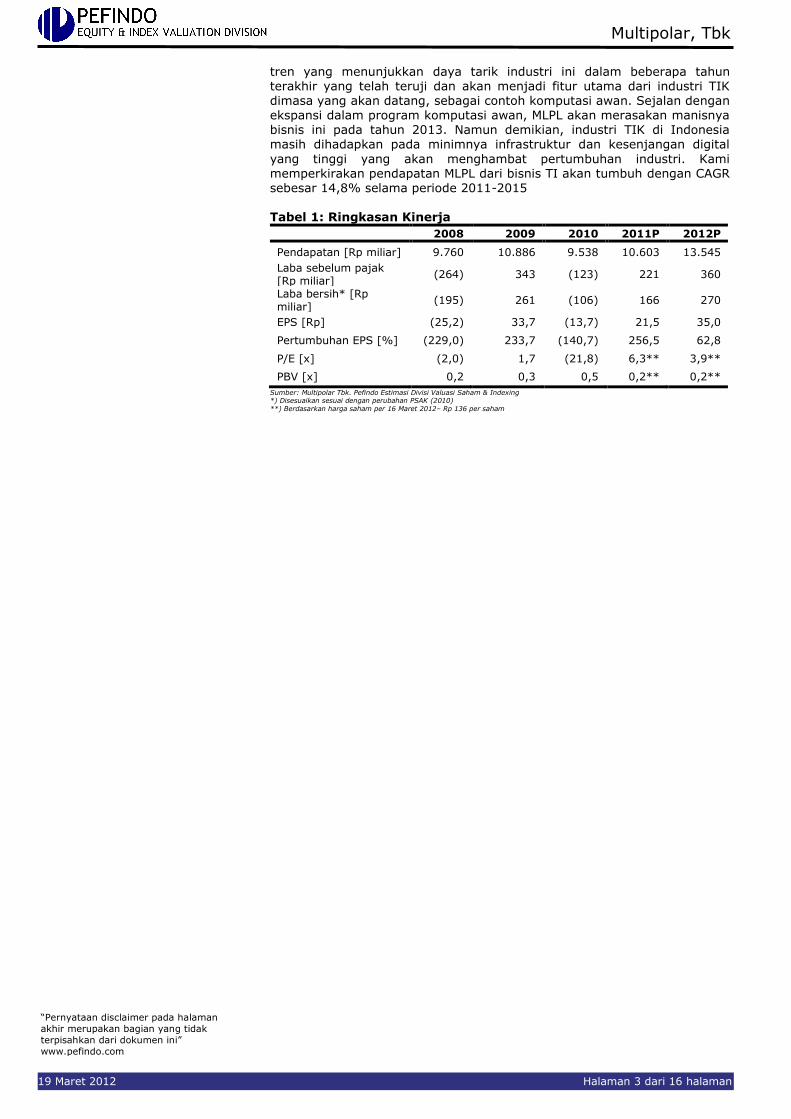
yang tinggi yang akan menghambat pertumbuhan industri. Kami memperkirakan pendapatan MLPL dari bisnis TI akan tumbuh dengan CAGR sebesar 14,8% selama periode 2011-2015 Tabel 1: Ringkasan Kinerja
2008 2009 2010 2011P 2012P
Pendapatan [Rp miliar] 9.760 10.886 9.538 10.603 13.545
Laba sebelum pajak [Rp miliar]
(264) 343 (123) 221 360
Laba bersih* [Rp miliar]
(195) 261 (106) 166 270
EPS [Rp] (25,2) 33,7 (13,7) 21,5 35,0
Pertumbuhan EPS [%] (229,0) 233,7 (140,7) 256,5 62,8
P/E [x] (2,0) 1,7 (21,8) 6,3** 3,9**
PBV [x] 0,2 0,3 0,5 0,2** 0,2**
Sumber: Multipolar Tbk. Pefindo Estimasi Divisi Valuasi Saham & Indexing *) Disesuaikan sesuai dengan perubahan PSAK (2010) **) Berdasarkan harga saham per 16 Maret 2012– Rp 136 per saham
“Pernyataan disclaimer pada halaman
akhir merupakan bagian yang tidak
terpisahkan dari dokumen ini”
www.pefindo.com
Multipolar, Tbk
19 Maret 2012 Halaman 4 dari 16 halaman
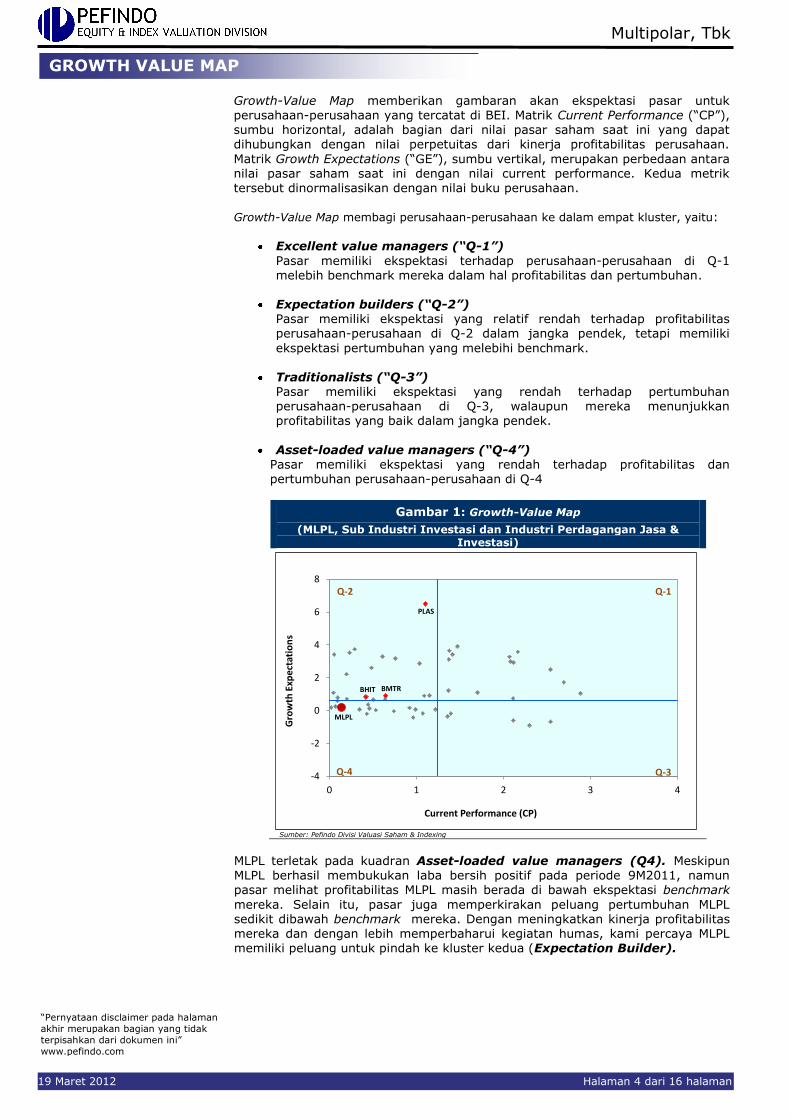
Growth-Value Map memberikan gambaran akan ekspektasi pasar untuk perusahaan-perusahaan yang tercatat di BEI. Matrik Current Performance (“CP”),
sumbu horizontal, adalah bagian dari nilai pasar saham saat ini yang dapat dihubungkan dengan nilai perpetuitas dari kinerja profitabilitas perusahaan.
Matrik Growth Expectations (“GE”), sumbu vertikal, merupakan perbedaan antara nilai pasar saham saat ini dengan nilai current performance. Kedua metrik tersebut dinormalisasikan dengan nilai buku perusahaan. Growth-Value Map membagi perusahaan-perusahaan ke dalam empat kluster, yaitu:
Excellent value managers (“Q-1”)
Pasar memiliki ekspektasi terhadap perusahaan-perusahaan di Q-1 melebih benchmark mereka dalam hal profitabilitas dan pertumbuhan.
Expectation builders (“Q-2”) Pasar memiliki ekspektasi yang relatif rendah terhadap profitabilitas perusahaan-perusahaan di Q-2 dalam jangka pendek, tetapi memiliki
ekspektasi pertumbuhan yang melebihi benchmark.
Traditionalists (“Q-3”)
Pasar memiliki ekspektasi yang rendah terhadap pertumbuhan perusahaan-perusahaan di Q-3, walaupun mereka menunjukkan profitabilitas yang baik dalam jangka pendek.
Asset-loaded value managers (“Q-4”) Pasar memiliki ekspektasi yang rendah terhadap profitabilitas dan pertumbuhan perusahaan-perusahaan di Q-4
Gambar 1: Growth-Value Map
(MLPL, Sub Industri Investasi dan Industri Perdagangan Jasa & Investasi)
-4
-2
0
2
4
6
8
0 1 2 3 4
Gro
wth
Exp
ecta
tio
ns
Current Performance (CP)
BMTR
PLAS
Q-1
Q-3
Q-2
Q-4
BHIT
MLPL
Sumber: Pefindo Divisi Valuasi Saham & Indexing
MLPL terletak pada kuadran Asset-loaded value managers (Q4). Meskipun MLPL berhasil membukukan laba bersih positif pada periode 9M2011, namun pasar melihat profitabilitas MLPL masih berada di bawah ekspektasi benchmark
mereka. Selain itu, pasar juga memperkirakan peluang pertumbuhan MLPL sedikit dibawah benchmark mereka. Dengan meningkatkan kinerja profitabilitas mereka dan dengan lebih memperbaharui kegiatan humas, kami percaya MLPL memiliki peluang untuk pindah ke kluster kedua (Expectation Builder).
GROWTH VALUE MAP

Multipolar, Tbk
February 23rd, 2012 Page 5 of 15 pages
Outlook Perekonomian Dunia: Masih Akan Didukung oleh Pertumbuhan yang Lebih Kuat di Negara-Negara Berkembang
Berdasarkan riset yang dilakukan oleh The Conference Board, perekonomian global diprediksikan akan tumbuh sebesar 3,2% YoY di tahun 2012, melemah dari pertumbuhan di tahun sebelumnya yaitu 3,9% YoY, tapi pertumbuhan ekonomi tersebut diperkirakan akan berakselerasi hingga 3,5% YoY selama periode 2013-2016. Tingginya tingkat pengangguran dan melemahnya tingkat konsumsi di negara-negara maju adalah penyebab turunnya revisi proyeksi pertumbuhan perekonomian dunia dari proyeksi sebelumnya. Meskipun
mengalami penurunan, pertumbuhan perekonomian di tahun 2012, masih akan didukung oleh pertumbuhan yang lebih kuat di negara-negara berkembang walaupun momentumnya berkurang sebagai imbas dari krisis di Eropa dan Amerika.
Negara-negara maju akan menghadapi penurunan permintaan eksternal di tahun 2012, tapi pada sebagian besar negara-negara berkembang, mereka bisa
bergantung kepada permintaan domestik untuk mendorong pertumbuhan ekonomi mereka hingga perkonomian dunia menjadi lebih sehat. Tapi bagi negara-negara berkembang yang bergantung terhadap permintaan eksternal,
akan merasakan dampak dari penurunan pasar global. Sejalan dengan penurunan perekonomian secara keseluruhan, perekonomian negara-negara berkembang diperkirakan hanya akan tumbuh sebesar 5,1% YoY di tahun 2012 turun dari 6,4% YoY di tahun 2011. Penyusutan ini merupakan akibat dari negara
berkembang yang akan mengalami pertumbuhan ekspor yang lebih lambat, dan beberapa karena mungkin sudah tumbuh di atas tren. Namun, mereka umumnya memiliki lebih banyak fleksibilitas dalam kebijakan fiskal dari sebagian besar negara-negara maju yang mungkin menguntungkan mereka dalam bentuk pertumbuhan yang lebih stabil.
Tabel 2: Pertumbuhan Perekonomian Global
Negara 2011E 2012F
US
EU-15
Jepang
Negara Maju Lainnya
Negara Ekonomi Maju
1,5
1,5
-0,5
3,3
1,6
1,1
1,1
0,7
2,5
1,3
Cina India
Negara berkembang Asia lainnya
Amerika Latin
Timur Tengah
Afrika
Eropa Tengah & Timur
Rusia dan negara-negara CIS
Emerging Market and Developing Economies
9,5 7,8
5,1
4,5
4,3
4,4
4,0
4,6
6,4
8,7 7,4
2,8
2,9
2,3
2,4
2,1
2,8
5,1
Dunia 3,9 3,2 Sumber: The Conference Board Economic Outlook, November 2011; Pefindo Divisi Valuasi Saham & Indexing
Permintaan Domestik Masih Menjadi Mesin Utama Pertumbuhan Ekonomi Indonesia dan Cina di Tahun 2012 Memburuknya perekonomian global mungkin akan menghambat pertumbuhan
perekonomian Cina dan Indonesia pada tahun 2012. Pemerintah Cina terus mengambil langkah-langkah untuk mencegah overheating dan untuk mengarahkan perekonomian menuju soft landing, sementara perpaduan antara langkah-langkah moneter dan kehati-hatian makro memperlambat pertumbuhan PDB, meskipun pertumbuhan PDB masih tetap kuat karena kuatnya permintaan konsumen.
Tabel 3: Indikator Perekonomian Indonesia
2008 2009 2010 2011
Pertumbuhan PDB (%, YoY)
Tingkat Inflasi (%, YoY)
Nilai tukar * (Rp/USD)
Tingkat SBI (%)
6,1
11,06
9.136
9,25
4,5
2,78
9.680
6,50
6,1
6,96
10.398
6,5
6,5
3,79
8.779
6,0 * Rata-rata nilai tengah Bank Indonesia Sumber: BPS, Bank Indonesia, diolah oleh Pefindo Divisi Valuasi Saham & Indexing
Sedangkan fundamental perekonomian Indonesia akan tetap kuat meskipun efek dari krisis global saat ini diprediksikan akan dapat memperlambat perekonomian global. Pefindo memperkirakan bahwa pertumbuhan ekonomi Indonesia akan sedikit turun ke 6,2% YoY pada tahun 2012, sementara di tahun 2011,
pertumbuhan ekonomi Indonesia tercatat sebesar 6,5% YoY. Penggerak utama perekonomian masih akan berasal dari kontribusi konsumsi swasta dengan
INFORMASI USAHA
“Pernyataan disclaimer pada halaman
akhir merupakan bagian yang tidak
terpisahkan dari dokumen ini”
www.pefindo.com
Multipolar, Tbk
19 Maret 2012 Halaman 6 dari 16 halaman
didukung oleh masih berlanjutnya optimisme konsumen, terjaganya tingkat inflasi, rendahnya tingkat suku bunga dan meningkatnya pendapatan per kapita. Pendapatan per kapita Indonesia mencapai USD 3.543 pada 2011, dan mungkin bisa mencapai USD 4.000 pada tahun 2012, dibandingkan dengan USD 3.000
pada tahun 2010. Sementara itu, realisasi investasi tahun 2011 mencapai Rp 251,3 triliun atau naik 20,5% dibandingkan dengan tahun 2010. Dengan
komposisi penduduk yang didominasi oleh penduduk usia produktif (sekitar 60%) dan meningkatnya persepsi internasional terhadap perkembangan perekonomian Indonesia yang tercermin dari masuknya Indonesia menjadi investment grade dari Fitch pada Desember 2011 dan oleh Moody`s pada Januari 2012, maka kami percaya bahwa Indonesia akan mampu mempertahankan pertumbuhan yang menguntungkan di tahun mendatang
Industri TIK akan Berkembang di Tahun 2012
Tahun 2012 akan menjadi tahun yang penting bagi Industri Teknologi, Informasi dan komunikasi (TIK) baik secara global maupun di Asia. Khusus di Indonesia, Business Monitor International (BMI) memprediksikan industri TIK akan tumbuh sebesar 18% per tahun dalam 4 tahun yang akan datang. Berbagai tren yang meningkatkan daya tarik industri ini dalam beberapa tahun terakhir telah diadaptasi dan akan menjadi fitur utama dalam industri TIK yang terus tumbuh,
seperti cloud computing (komputasi awan). Sementara itu, nilai industri TIK berdasarkan data dari Kementerian Komunikasi dan Informatika (Kemkominfo) telah mencapai Rp 350 triliun, meningkat 17% YoY dari Rp 300 triliun di tahun 2010. Pertumbuhan tersebut didorong oleh beberapa hal, antara lain penyebaran industri teknologi informasi, pasar yang semakin kompetitif, peningkatan penjualan hardware dan software dan penyebaran jasa teknologi informasi. Penjualan hardware seperti Telepon Seluler (Ponsel) dan komputer tumbuh
dengan rata-rata CAGR masing-masing sebesar 37,3% dan 27,9% selama periode 2008-2011, sedangkan penjualan software mencapai USD 599 juta di tahun 2011 dan diperkirakan akan tumbuh dengan CAGR sebesar 22% dalam lima tahun yang akan datang. Selain itu, industri TIK juga didongkrak oleh meningkatnya belanja pemerintah untuk teknologi informasi seperti program e-learning, e-KTP dan e-passport.
Namun demikian, industri TIK di Indonesia masih dihadapkan dengan masalah
masih kurangnya infrastruktur dan tingginya digital gap yang akan menekan pertumbuhan industri tersebut. Untuk mengatasi masalah tersebut, pemerintah
Indonesia di tahun 2012 telah menganggarkan sekitar Rp 3,2 triliun dalam draft anggaran pendapatan dan belanja Kementerian Komunikasi dan Informatika Republik Indonesia (Kemkominfo). Kemkominfo akan menggunakan dana tersebut untuk fokus dalam pembangunan infrastruktur telekomunikasi seperti
Palapa Ring sesuai dengan target pemerintah untuk meningkatkan penetrasi internet hingga 30% di tahun 2014.
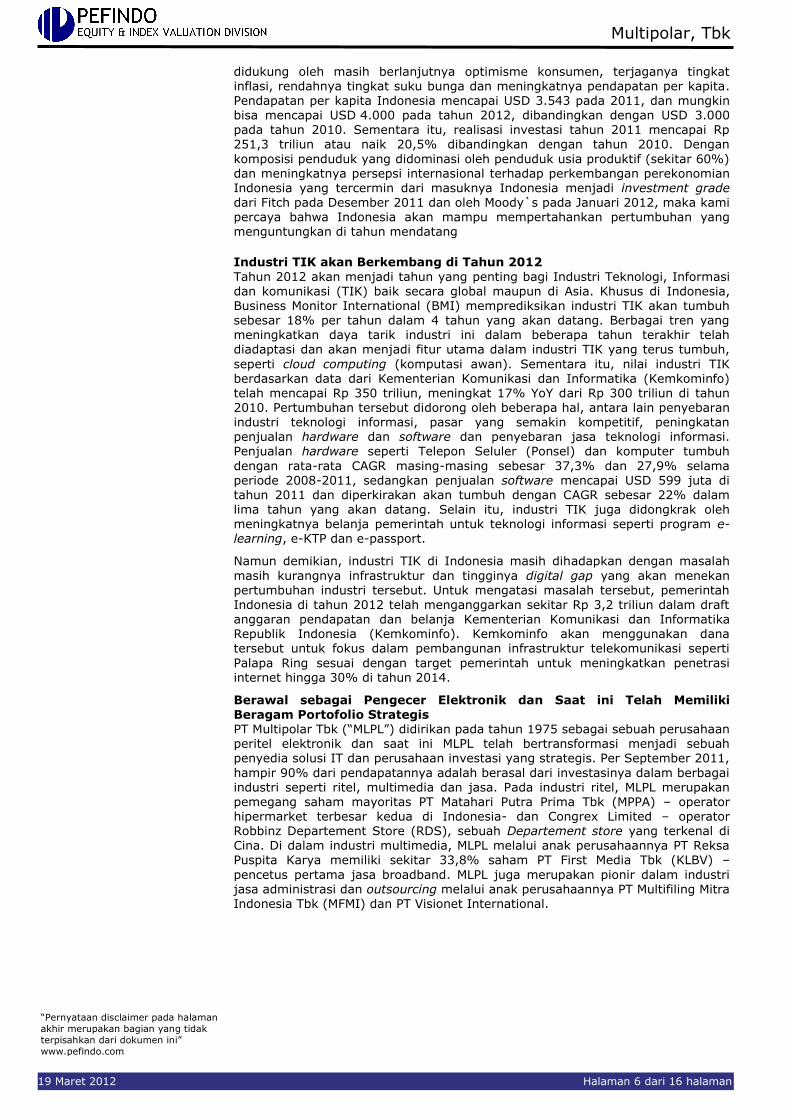
Berawal sebagai Pengecer Elektronik dan Saat ini Telah Memiliki Beragam Portofolio Strategis PT Multipolar Tbk (“MLPL”) didirikan pada tahun 1975 sebagai sebuah perusahaan peritel elektronik dan saat ini MLPL telah bertransformasi menjadi sebuah penyedia solusi IT dan perusahaan investasi yang strategis. Per September 2011,
hampir 90% dari pendapatannya adalah berasal dari investasinya dalam berbagai industri seperti ritel, multimedia dan jasa. Pada industri ritel, MLPL merupakan pemegang saham mayoritas PT Matahari Putra Prima Tbk (MPPA) – operator hipermarket terbesar kedua di Indonesia- dan Congrex Limited – operator Robbinz Departement Store (RDS), sebuah Departement store yang terkenal di
Cina. Di dalam industri multimedia, MLPL melalui anak perusahaannya PT Reksa Puspita Karya memiliki sekitar 33,8% saham PT First Media Tbk (KLBV) –
pencetus pertama jasa broadband. MLPL juga merupakan pionir dalam industri jasa administrasi dan outsourcing melalui anak perusahaannya PT Multifiling Mitra Indonesia Tbk (MFMI) dan PT Visionet International.

“Pernyataan disclaimer pada halaman
akhir merupakan bagian yang tidak
terpisahkan dari dokumen ini”
www.pefindo.com
Multipolar, Tbk
19 Maret 2012 Halaman 7 dari 16 halaman
Gambar 2: Portfolio MLPL
Multipolar Tbk
Teknologi Informasi Ritel Jasa Multimedia
PT Matahari Putra Prima Tbk
Congrex Limited
PT Sharestar Indonesia
PT Surya Cipta Investama
PT Multifiling Mitra Indonesia Tbk
PT Visonet International
PT Reksa Puspita Karya
PT First Media Tbk
Sumber: PT Multipolar Tbk, Pefindo Divisi Valuasi Saham & Indexing
Pertumbuhan yang Kuat Pada Sektor Keuangan dan Telekomunikasi Menguntungkan Pendapatan Bisnis IT MLPL Secara sektoral, sumber pertumbuhan perekonomian Indonesia mulai seimbang sejalan dengan pertumbuhan sektor tradable yang menyumbangkan sekitar 46,5% dari total PDB naik 4,5% selama tahun 2011, sedangkan sektor non-
tradable tumbuh 8,3% YoY dibandingkan periode yang sama 8,2% YoY pada tahun lalu. Pertumbuhan sektor non-tradable, antara lain didukung oleh sektor keuangan dan sektor komunikasi. Selama tahun 2011, sektor keuangan tumbuh sebesar 6,8% YoY sementara sektor pengangkutan dan telekomunikasi tumbuh sebesar 10,7% YoY. Prospek industri keuangan akan tetap positif karena diuntungkan oleh meningkatnya rating Indonesia.
Kondisi ini merupakan indikasi positif bagi divisi bisnis IT MLPL, karena sebagian besar pendapatan divisi ini berasal dari kedua industri tersebut. Selama 9M2011, sektor perbankan/institusi keuangan berkontribusi sebesar 64% dari total pendapatan divisi IT, sedangkan sektor telekomunikasi masih merupakan
kontributor terbesar kedua pendapatan divisi IT yaitu sebesar 23%.
Gambar 3: Kontributor Pendapatan Divisi Usaha IT
Sumber: PT Multipolar Tbk, Pefindo Divisi Valuasi Saham & Indexing
Jaringan Distribusi Ritel yang Luas di Dalam Negeri dan di Luar Negeri Dipercayai Akan Mendongkrak Pendapatan MLPL dari Unit Usaha Ritel Salah satu investasi strategis MLPL adalah dalam industri ritel. Pada industri ini, MLPL memiliki mayoritas saham MPPA dan Congrex Limited. MPPA merupakan operator Hypermart, hipermaket terbesar kedua di Indonesia. Dalam 6 tahun
terakhir, jumlah outlet Hypermart telah tumbuh dengan rata-rata sebesar 23,0% per tahun. Di tahun 2005, jumlah outlet Hypermart adalah sebanyak 17 unit dan meningkat menjadi 59 unit di tahun 2011. Jaringan ritel ini tersebar di 32 kota di Indonesia. Hypermart didukung oleh 3 pusat distribusi (distribution center) yang memiliki peranan penting dalam mendistribusikan barang-barang ke Hypermart dan Foodmart. Gudang-gudang pusat distribusi ini berlokasi di Surabaya,
Balaraja dan Cibitung. Di tahun 2011, MPPA telah membuka sekitar 12 toko baru
“Pernyataan disclaimer pada halaman
akhir merupakan bagian yang tidak
terpisahkan dari dokumen ini”
www.pefindo.com
Multipolar, Tbk
19 Maret 2012 Halaman 8 dari 16 halaman
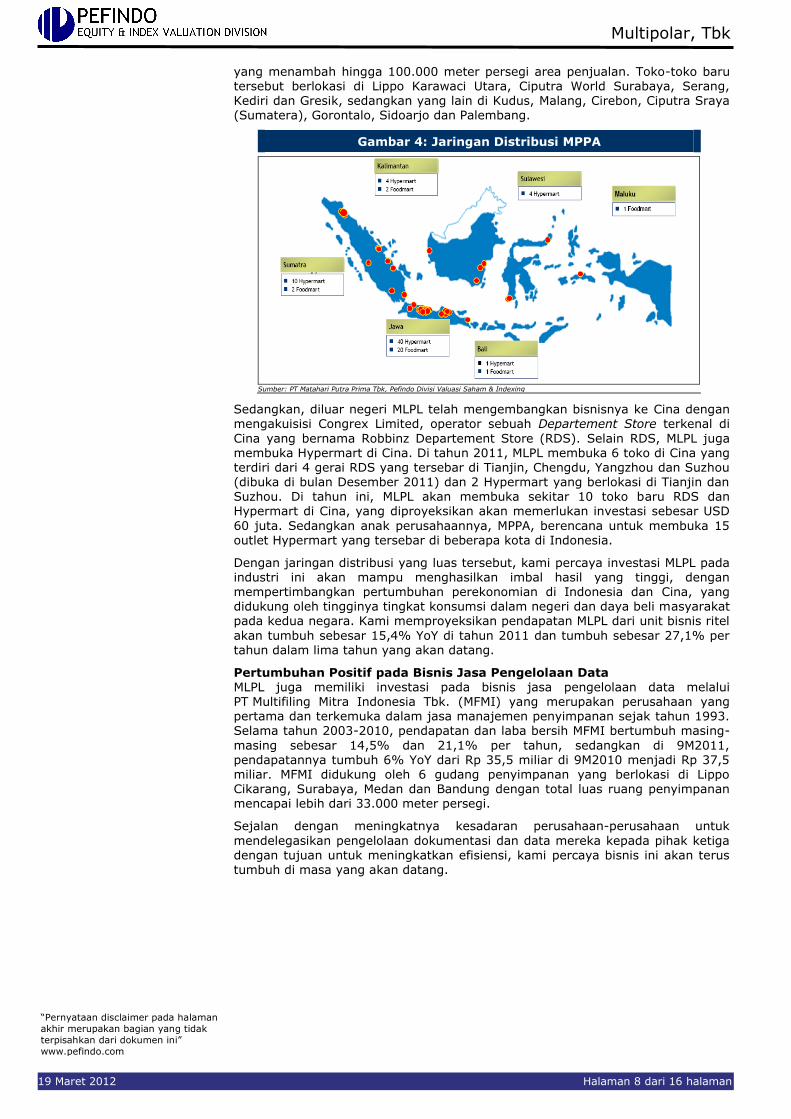
yang menambah hingga 100.000 meter persegi area penjualan. Toko-toko baru tersebut berlokasi di Lippo Karawaci Utara, Ciputra World Surabaya, Serang, Kediri dan Gresik, sedangkan yang lain di Kudus, Malang, Cirebon, Ciputra Sraya (Sumatera), Gorontalo, Sidoarjo dan Palembang.
Gambar 4: Jaringan Distribusi MPPA
Sumber: PT Matahari Putra Prima Tbk, Pefindo Divisi Valuasi Saham & Indexing
Sedangkan, diluar negeri MLPL telah mengembangkan bisnisnya ke Cina dengan mengakuisisi Congrex Limited, operator sebuah Departement Store terkenal di
Cina yang bernama Robbinz Departement Store (RDS). Selain RDS, MLPL juga membuka Hypermart di Cina. Di tahun 2011, MLPL membuka 6 toko di Cina yang terdiri dari 4 gerai RDS yang tersebar di Tianjin, Chengdu, Yangzhou dan Suzhou (dibuka di bulan Desember 2011) dan 2 Hypermart yang berlokasi di Tianjin dan Suzhou. Di tahun ini, MLPL akan membuka sekitar 10 toko baru RDS dan Hypermart di Cina, yang diproyeksikan akan memerlukan investasi sebesar USD
60 juta. Sedangkan anak perusahaannya, MPPA, berencana untuk membuka 15 outlet Hypermart yang tersebar di beberapa kota di Indonesia.
Dengan jaringan distribusi yang luas tersebut, kami percaya investasi MLPL pada industri ini akan mampu menghasilkan imbal hasil yang tinggi, dengan mempertimbangkan pertumbuhan perekonomian di Indonesia dan Cina, yang
didukung oleh tingginya tingkat konsumsi dalam negeri dan daya beli masyarakat pada kedua negara. Kami memproyeksikan pendapatan MLPL dari unit bisnis ritel
akan tumbuh sebesar 15,4% YoY di tahun 2011 dan tumbuh sebesar 27,1% per tahun dalam lima tahun yang akan datang.
Pertumbuhan Positif pada Bisnis Jasa Pengelolaan Data MLPL juga memiliki investasi pada bisnis jasa pengelolaan data melalui PT Multifiling Mitra Indonesia Tbk. (MFMI) yang merupakan perusahaan yang pertama dan terkemuka dalam jasa manajemen penyimpanan sejak tahun 1993. Selama tahun 2003-2010, pendapatan dan laba bersih MFMI bertumbuh masing-
masing sebesar 14,5% dan 21,1% per tahun, sedangkan di 9M2011, pendapatannya tumbuh 6% YoY dari Rp 35,5 miliar di 9M2010 menjadi Rp 37,5 miliar. MFMI didukung oleh 6 gudang penyimpanan yang berlokasi di Lippo Cikarang, Surabaya, Medan dan Bandung dengan total luas ruang penyimpanan mencapai lebih dari 33.000 meter persegi.
Sejalan dengan meningkatnya kesadaran perusahaan-perusahaan untuk
mendelegasikan pengelolaan dokumentasi dan data mereka kepada pihak ketiga
dengan tujuan untuk meningkatkan efisiensi, kami percaya bisnis ini akan terus tumbuh di masa yang akan datang.

“Pernyataan disclaimer pada halaman
akhir merupakan bagian yang tidak
terpisahkan dari dokumen ini”
www.pefindo.com
Multipolar, Tbk
19 Maret 2012 Halaman 9 dari 16 halaman
Gambar 5: Pusat Penyimpanan Pengelolaan Data
Sumber: Multipolar Tbk, Pefindo Divisi Valuasi Saham & Indexing
Pendapatan MLPL Bertumbuh Sejalan dengan Pertumbuhan Perekonomian Indonesia
MLPL menunjukkan kinerja yang lebih baik dalam 9 bulan pertama 2011 dibandingkan dengan periode yang sama pada tahun sebelumnya. Berdasarkan pertumbuhan tahunan, pendapatan MLPL meningkat 7,3% YoY dari Rp 7,0 triliun pada 9M2010 menjadi Rp 7,6 triliun di 9M2011. Peningkatan pendapatan MLPL selama periode ini merupakan satu dari sekian banyak dampak positif pertumbuhan perekonomian Indonesia selama tahun 2011 yang mencapai 6,5% YoY. Meningkatnya pendapatan perkapita yang mendukung daya beli
masyarakat telah meningkatkan pendapatan bisnis ritel (khususnya di Indonesia) yang merupakan kontributor terbesar pendapatan MLPL. Secara triwulanan,
pendapatan MLPL pada 3Q2011 tumbuh signifikan yaitu sebesar 14% q-o-q dari 2Q2011 menjadi Rp 2,8 triliun. Tingginya pendapatan ini dikarenakan meningkatnya pengeluaran masyarakat selama bulan Ramadhan dan sebelum hari Lebaran yang jatuh pada triwulan ini. Sedangkan untuk 4Q2011, kami memproyeksikan pendapatan MLPL akan tumbuh menjadi Rp 3,0 triliun, atau
naik 8,3% q-o-q atau tumbuh 17,7% YoY dari Rp 2,6 triliun pada 4Q2010. Selain dari unit usaha ritel, pendapatan MLPL pada periode ini juga didorong oleh pendapatan dari bisnis IT khususnya dari penjualan hardware seperti Ponsel dan komputer (PC).
Gambar 6 : Penjualan, Laba Kotor dan Pertumbuhan Penjualan (QoQ)
Sumber :PT Multipolar Tbk, Estimasi Pefindo Divisi Valuasi Saham & Indexing
KEUANGAN

“Pernyataan disclaimer pada halaman
akhir merupakan bagian yang tidak
terpisahkan dari dokumen ini”
www.pefindo.com
Multipolar, Tbk
19 Maret 2012 Halaman 10 dari 16 halaman
Pendapatan Bertumbuh di Semua Lini Bisnis Sebagai perusahaan investasi, MLPL menggantungkan pendapatannya kepada anak perusahaan yang mayoritas sahamnya dimiliki oleh MLPL, yang dikelompokkan berdasarkan kegiatan operasionalnya kedalam beberapa unit
usaha yaitu unit usaha ritel, unit usaha Informasi dan Teknologi (IT), unit usaha jasa dan multimedia (lain-lain). Setelah melepaskan Matahari Department Store
(MDS) di awal tahun 2010, unit usaha ritel masih mengalami pertumbuhan yang signifikan yang didukung oleh ekspansi agresif selama tahun 2011, seperti terlihat pada pendapatan di 9M2011, meningkat sebesar 58,2% menjadi Rp 6,7 triliun dari Rp Rp 4,2 triliun di 6M2011, atau secara tahunan tumbuh sebesar 0,63% YoY dari Rp 6,6 triliun di 9M2010. Selain bisnis ritel, divisi IT juga mencatatkan kinerja yang memuaskan dan tumbuh sebesar 115% YoY dari Rp 387,8 miliar di 9M2010 menjadi Rp Rp 833,4 miliar di 9M2011. Secara
kuartalan, bisnis IT tumbuh 14,5% q-o-q menjadi Rp 336 miliar dari Rp 293 miliar pada kuartal sebelumnya.
Gambar 7 : Penjualan MLPL Per Unit Usaha
Sumber: PT Multipolar Tbk, Pefindo Divisi Valuasi Saham & Indexing
Semakin Efisien dalam Kegiatan Operasional Pada lini operasi, MLPL mampu meningkatkan efisiensi dalam kegiatan operasionalnya dan membukukan laba operasi sebesar Rp 834 juta, naik 102% YoY dari minus Rp 41 miliar di 9M2010. Efisiensi biaya operasi khususnya
terjadi pada beban pemasaran yang turun menjadi Rp 381 juta, lebih rendah 34% YoY dari Rp 578 juta di 9M2010. Sedangkan beban umum dan administrasi
turun 12% YoY menjadi Rp 1,3 triliun dari beban umum dan administrasi pada 9M2010.
Gambar 8 : Laba Operasi MLPL
524,4545,1
15,9
-41,3
0,8
-100
0
100
200
300
400
500
600
2008 2009 2010 9M2010 9M2011
Dalam Rp miliar
Tumbuh Sebesar
102% YoY
Sumber: PT Multipolar Tbk, Pefindo Divisi Valuasi Saham & Indexing

“Pernyataan disclaimer pada halaman
akhir merupakan bagian yang tidak
terpisahkan dari dokumen ini”
www.pefindo.com
Multipolar, Tbk
19 Maret 2012 Halaman 11 dari 16 halaman
Menargetkan Belanja Modal sebesar USD 90 juta untuk Pengembangan Usaha Saat ini, MLPL sedang mengerjakan 2 proyek ekspansi yaitu bisnis komputasi awan (cloud computing) dan bisnis ritel di Cina. Dengan berkerja sama dengan
HCL Industries, MLPL berencana untuk memasuki pasar komputasi awan sejak tahun 2010. Saat ini, MLPL masih dalam proses pengkajian untuk menentukan
lokasi terbaik untuk data center yang direncanakan akan dibangun di tengah tahun kedua tahun 2012 dan mulai beroperasi di tahun 2013. Untuk proyek ini, MLPL menganggarkan dana sebesar USD 30 juta atau setara dengan Rp 263,0 miliar (dengan asumsi nilai tukar Rupiah USD 1 = Rp 8.768 – rata-rata nilai tukar Rupiah selama tahun 2011-).
Selain itu, pengembangan usaha yang dilakukan MPPA di Indonesia selama tahun 2011, MLPL juga menginvestasikan belanja modal sekitar USD 60 juta atau sama
dengan Rp 526,1 miliar untuk membuka 3 outlet ritel di Cina yang diperkirakan akan menghasilkan return sebesar Rp 2 juta per meter persegi. Sedangkan di tahun 2012, MLPL berencana untuk membukan sekitar 10 outlet RDS dan Hypermart yang diproyeksikan juga akan menghabiskan dana sekitar USD 60 juta.
Gambar 9: Belanja Modal MLPL dan Perkembangan Toko Bisnis Ritelnya di
Indonesia dan Cina
Sumber: PT Multipolar Tbk, Estimasi Pefindo Divisi Valuasi Saham & Indexing
Dengan mempertimbangkan perkembangan komputasi awan di Indonesia yang diperkirakan akan tumbuh sebesar 54% di tahun 2014 dan masih kuatnya
permintaan domestik di Indonesia dan Cina yang akan mendukung industri ritel,
kami percaya rencana ekspansi MLPL ini akan menghasilkan laba dan meningkatkan pendapatan MLPL. Untuk periode 2010-2014, kami memproyeksikan pendapatan MLPL akan tumbuh dengan rata-rata CAGR sebesar 23,0%
Likuiditas yang Memadai Untuk Pelunasan Pinjaman Per 9M2011, kewajiban MLPL adalah sebanyak Rp 5,55 triliun, naik 0,6% dari
kewajiban pada bulan Desember 2010. Sekitar 30% dari total kewajiban tersebut adalah merupakan kewajiban jangka panjang yaitu berupa obligasi yang diterbitkan oleh anak perusahaannya (MPPA) di tahun 2009 dan akan jatuh tempo pada tahun 2012 dan 2014 dan pinjaman bank yang digunakan untuk modal kerja. Sedangkan 70%-nya merupakan pinjaman jangka pendek yaitu modal kerja anak-anak perusahaannya. Dengan jumlah kewajiban tersebut dibagi dengan total ekuitas MLPL sebesar Rp 8,1 triliun, maka rasio kewajiban terhadap
ekuitas adalah 0,7x. Sedangkan dengan total aset yang mencapai Rp 13,7 triliun, rasio total kewajiban terhadap aset adalah sebesar 0,41x. Kondisi ini menunjukkan bahwa MLPL memiliki dana yang memadai untuk membayar
seluruh kewajibannya kepada kreditor.

“Pernyataan disclaimer pada halaman
akhir merupakan bagian yang tidak
terpisahkan dari dokumen ini”
www.pefindo.com
Multipolar, Tbk
19 Maret 2012 Halaman 12 dari 16 halaman
Gambar 10 : Aset, Kewajiban dan Ekuitas MLPL
Sumber: PT Multipolar Tbk, Estimasi Pefindo Divisi Valuasi Saham & Indexing
Prospek Usaha MLPL
Kuatnya permintaan konsumen masih menjadi mesin utama untuk pertumbuhan
perekonomian di Cina dan Indonesia pada tahun 2012, meskipun diperkirakan pertumbuhannya akan lebih rendah dari tahun sebelumnya yaitu masing-masing sebesar 8,7% dan 6,2%. Industri ritel di Indonesia dan Cina diperkirakan akan tumbuh masing-masing sebesar 20% YoY dan 13,2 YoY pada periode yang sama. Ritel modern masih memiliki potensi untuk tumbuh di Indonesia karena, saat ini penetrasi pasar ritel modern baru menjangkau sekitar 40% dari total pasar, lebih kecil dari negara-negara Asia lainnya, sementara normalisasi harga properti di
Cina diperkirakan akan meningkatkan konsumsi pada sektor lainnya termasuk sektor ritel.
Di sisi lain, tahun 2012 akan menjadi tahun yang penting bagi industri TIK global dan di Asia. Khusus di Indonesia, Business Monitor International (BMI) memperkirakan industri TIK akan tumbuh sebesar 18% per tahun dalam empat tahun yang akan datang. Berbagai tren yang meningkatkan daya tarik industri ini
dalam beberapa tahun terakhir telah diadaptasi dan akan menjadi fitur utama dalam industri TIK yang terus tumbuh, seperti komputasi awan (cloud
computing). BMI juga memperkirakan bahwa nilai belanja TIK di Indonesia pada 2011 akan mencapai Rp 5,4 miliar, naik 14,9% YoY dari 2010. Pertumbuhan ini didorong beberapa hal, antara lain penyebaran industri informasi teknologi, pasar yang semakin kompetitif, peningkatan penjualan hardware dan penjualan perangkat lunak dan penyebaran layanan teknologi informasi. Pertumbuhan
industri ini juga didorong oleh meningkatnya pengeluaran pemerintah untuk teknologi dan informasi, seperti program e-learning, e-KTP dan e-paspor. Namun, industri TIK masih menghadapi kurangnya infrastruktur dan kesenjangan digital yang tinggi yang bisa menghambat pertumbuhan industri ini.
Diperkuat oleh rencana ekspansi usaha MLPL dan anak perusahaannya selama tahun 2011-2012 yang diproyeksikan akan memerlukan dana sekitar USD 60 juta sampai dengan USD 90 juta, kami memproyeksikan pendapatan MLPL dapat
tumbuh dengan rata-rata CAGR sebesar 23,0% selama periode 2010-2014.
Gambar 11 : Proyeksi Pendapatan MLPL
Sumber: PT Multipolar Tbk, Estimasi Pefindo Divisi Valuasi Saham & Indexing

“Pernyataan disclaimer pada halaman
akhir merupakan bagian yang tidak
terpisahkan dari dokumen ini”
www.pefindo.com
Multipolar, Tbk
19 Maret 2012 Halaman 13 dari 16 halaman
Tabel 4: Analisa SWOT
Kekuatan (Strengths) Kelemahan (Weakness)
Terkenal sebagai penyedia solusi
IT Memiliki jaringan distribusi yang
luas yang tersebar di Indonesia dan Cina
Memiliki hubungan yang baik dengan penyedia IT ternama di dunia
Rendahnya hambatan dalam
industri Tidak baiknya kinerja anak-anak
perusahaan, dimana MLPL memiliki saham minoritas bisa menurunkan
laba bersih MLPL
Kesempatan (Opportunities) Ancaman (Threats) Berkembangnya industri IT
seperti komputasi awan di
Indonesia Lebih baiknya prospek
perekonomian di Indonesia dan Cina, begitu juga dengan prospek industri ritel
Pemain baru dengan modal yang
lebih besar akan meningkatkan
persaingan Mundurnya penyelesaian beberapa
proyek properti dapat menghambat pengembangan toko
Kurangnya infrastruktur TIK di Indonesia
ANALISA SWOT

“Pernyataan disclaimer pada halaman
akhir merupakan bagian yang tidak
terpisahkan dari dokumen ini”
www.pefindo.com
Multipolar, Tbk
19 Maret 2012 Halaman 14 dari 16 halaman
Penilaian
Metodologi Penilaian
Kami mengaplikasikan metode discounted cash flow (DCF) sebagai metode penilaian utama dengan pertimbangan bahwa pertumbuhan pendapatan adalah merupakan faktor yang sangat mempengaruhi nilai (value driver) jika dibandingkan dengan pertumbuhan aset. Kami tidak mengkombinasikan perhitungan DCF ini dengan metode Guideline Company Method (GCM) di dalam valuasi ini, disebabkan tidak terdapat peers
yang benar-benar dapat diperbandingkan di Bursa Efek Indonesia. Penilaian ini berdasarkan pada harga 100% saham MLPL per 16 Maret 2012, dengan menggunakan laporan keuangan MLPL per 30 September 2011 sebagai dasar analisa fundamental.
Estimasi Nilai
Kami menggunakan Cost of Capital sebesar 13,4% dan Cost of Equity sebesar 14,8% berdasarkan asumsi-asumsi berikut:
Tabel 5: Asumsi
Risk free rate [%]* 5,9
Risk premium [%]* 9,3
Beta [x]* 0,9
Cost of Equity [%] 14,8
Marginal tax rate [%] 25,0
Debt to Equity Ratio 0,3
WACC [%] 13,4
Sumber: Bloomberg, Pefindo Divisi Valuasi Saham & Indexing Catt: * per 16 Maret 2012
Estimasi Target harga saham untuk 12 bulan berdasarkan posisi penilaian pada tanggal 16 Maret 2012 dengan menggunakan metode DCF dan asumsi
tingkat diskonto 13,4% adalah sebesar Rp 360-Rp 385.- per lembar saham Tabel 6: Ringkasan Penilaian Metode DCF
Konservatif Moderat Agresif
PV of Free Cash Flows [Rp miliar] 833 876 920
PV Terminal Value [Rp miliar] 957 1,007 1,057
Non-Operating Assets [Rp miliar] 3.649 3.649 3.649
Net Debt [Rp miliar] (2.669) (2.669) (2.669)
Total Equity Value [Rp miliar] 2.769 2.864 2.958
Number of Share [juta saham] 7.728 7.728 7.728
Fair Value per Share [Rp] 360 370 385 Sumber: Estimasi Pefindo Divisi Valuasi Saham & Indexing
TARGET HARGA

“Pernyataan disclaimer pada halaman
akhir merupakan bagian yang tidak
terpisahkan dari dokumen ini”
www.pefindo.com
Multipolar, Tbk
19 Maret 2012 Halaman 15 dari 16 halaman
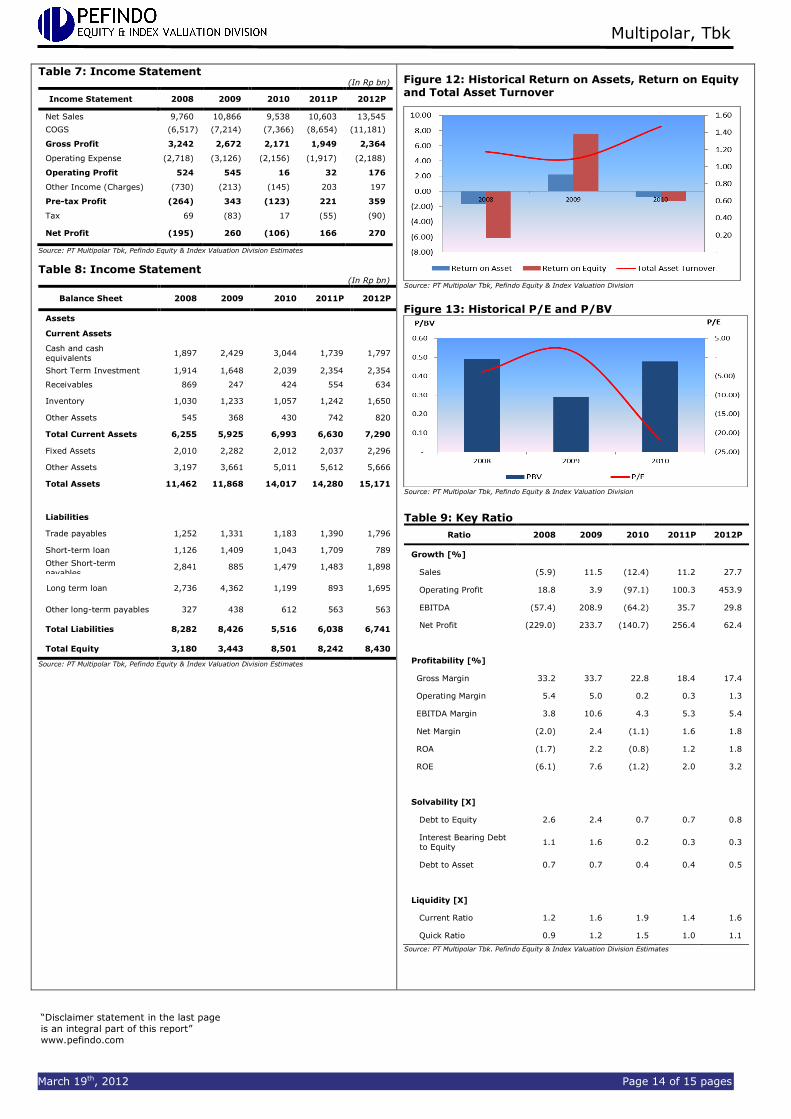
Tabel 7: Laporan Laba (Rugi) (Dalam Rp miliar)
Income Statement 2008 2009 2010 2011P 2012P
Penjualan 9.760 10.866 9.538 10.603 13.545
Harga Pokok Penjualan (6.517) (7.214) (7.366) (8.654) (11.181)
Laba Kotor 3.242 2.672 2.171 1.949 2.364
Beban Operasi (2.718) (3.126) (2.156) (1.917) (2.188)
Laba Operasi 524 545 16 32 176
Pendapatan (Beban) Lain-
lain (730) (213) (145) 203 197
Laba Sebelum Pajak (264) 343 (123) 221 359
Pajak 69 (83) 17 (55) (90)
Laba Bersih (195) 260 (106) 166 270
Sumber: PT Multipolar Tbk., Estimasi Pefindo Divisi Valuasi Saham & Indexing
Tabel 8: Neraca (Dalam Rp miliar)
Neraca 2008 2009 2010 2011P 2012P
Aset
Aset Lancar
Kas dan Setara Kas 1.897 2.429 3.044 1.739 1.797
Investasi Jk. Pendek 1.914 1.648 2.039 2.354 2.354
Piutang Usaha 869 247 424 554 634
Persediaan 1.030 1.233 1.057 1.242 1.650
Aset Lancar Lain-lain 545 368 430 742 820
Total Aset Lancar 6.255 5.925 6.993 6.630 7.290
Aset Tetap 2.010 2.282 2.012 2.037 2.296
Aset Lain-lain 3.197 3.661 5.011 5.612 5.666
Total Aset 11.462 11.868 14.017 14.280 15.171
Kewajiban
Hutang Usaha 1.252 1.331 1.183 1.390 1.796
Pinjaman Jk. Pendek 1.126 1.409 1.043 1.709 789
Pinjaman Jk. Pendek
lainnya 2.841 885 1.479 1.483 1.898
Pinjaman Jk. Panjang 2.736 4.362 1.199 893 1.695
Kewajiban Lain-lain 327 438 612 563 563
Total Kewajiban 8.282 8.426 5.516 6.038 6.741
Total Ekuitas 3.180 3.443 8.501 8.242 8.430
Sumber: PT Multipolar Tbk., Estimasi Pefindo Divisi Valuasi Saham & Indexing
Gambar 12: Return on Assets, Return on Equity dan Total Asset Turnover Historis
Sumber: PT Multipolar Tbk., Pefindo Divisi Valuasi Saham & Indexing
Gambar 13: P/E dan P/BV Historis
Sumber: PT Multipolar Tbk., Pefindo Divisi Valuasi Saham & Indexing
Tabel 9: Rasio-Rasio Kunci
Rasio 2008 2009 2010 2011P 2012P
Pertumbuhan [%]
Penjualan (5,9) 11,5 (12,4) 11,2 27,7
Laba Operasi 18,8 3,9 (97,1) 100,3 453,9
EBITDA (57,4) 208,9 (64,2) 35,7 29,8
Laba Bersih (229,0) 233,7 (140,7) 256,4 62,4
Profitabilitas [%]
Marjin Laba Kotor 33,2 33,7 22,8 18,4 17,4
Marjin Laba Operasi 5,4 5,0 0,2 0,3 1,3
Marjin EBITDA 3,8 10,6 4,3 5,3 5,4
Marjin Laba Bersih (2,0) 2,4 (1,1) 1,6 1,8
ROA (1,7) 2,2 (0,8) 1,2 1,8
ROE (6,1) 7,6 (1,2) 2,0 3,2
Solvabilitas [X]
Debt to Equity 2,6 2,4 0,7 0,7 0,8
Interest Bearing Debt to Equity
1,1 1,6 0,2 0,3 0,3
Debt to Asset 0,7 0,7 0,4 0,4 0,5
Likuiditas [X]
Rasio Lancar 1,2 1,6 1,9 1,4 1,6
Rasio Cepat 0,9 1,2 1,5 1,0 1,1
Sumber: PT Multipolar Tbk., Estimasi Pefindo Divisi Valuasi Saham & Indexing
“Pernyataan disclaimer pada halaman
akhir merupakan bagian yang tidak
terpisahkan dari dokumen ini”
www.pefindo.com
Multipolar, Tbk
19 Maret 2012 Halaman 16 dari 16 halaman
DISCLAIMER
Laporan ini dibuat berdasarkan sumber-sumber yang kami anggap terpercaya dan dapat diandalkan. Namun kami tidak menjamin kelengkapan, keakuratan atau kecukupannya. Dengan demikian kami tidak bertanggung jawab atas segala keputusan investasi yang diambil berdasarkan laporan ini. Adapun asumsi, opini, dan perkiraan merupakan hasil dari pertimbangan internal kami per tanggal penilaian (cut off date), dan kami dapat mengubah pertimbangan diatas sewaktu-waktu tanpa pemberitahuan terlebih dahulu.
Kami tidak bertanggung jawab atas kekeliruan atau kelalaian yang terjadi akibat penggunaan laporan ini. Kinerja dimasa lalu tidak selalu dapat dijadikan acuan hasil masa depan. Laporan ini bukan merupakan rekomendasi penawaran, pembelian atau menahan suatu saham tertentu. Laporan ini mungkin tidak sesuai untuk beberapa investor. Seluruh opini dalam laporan ini telah disampaikan dengan itikad baik, namun sewaktu-waktu dapat berubah tanpa pemberitahuan terlebih dahulu, dan disajikan dengan benar per tanggal diterbitkan laporan ini. Harga, nilai, atau pendapatan dari setiap saham Perseroan yang disajikan dalam laporan ini kemungkinan dapat lebih rendah dari harapan pemodal, dan pemodal juga mungkin mendapatkan pengembalian yang lebih rendah dari nilai investasi yang ditanamkan. Investasi didefinisikan sebagai pendapatan yang kemungkinan besar diterima dimasa depan, namun nilai dari pendapatan yang akan diterima tersebut kemungkinan besar juga akan berfluktuasi. Untuk saham Perseroan yang penyajian laporan keuangannya didenominasi dalam mata uang selain Rupiah, perubahan nilai tukar mata uang
tersebut kemungkinan dapat menurunkan nilai, harga, atau pendapatan investasi pemodal. Informasi dalam laporan ini bukan merupakan pertimbangan pajak dalam mengambil suatu keputusan investasi.
Target harga saham dalam Laporan ini merupakan nilai fundamental, bukan merupakan Nilai Pasar Wajar, dan bukan merupakan harga acuan transaksi yang diwajibkan oleh peraturan perundang-undangan yang berlaku.
Laporan target harga saham yang diterbitkan oleh Pefindo Divisi Valuasi Saham dan Indexing bukan merupakan rekomendasi untuk membeli, menjual, atau menahan suatu saham tertentu, dan tidak dapat dianggap sebagai nasehat investasi oleh Pefindo Divisi Valuasi Saham dan Indexing yang behubungan dengan cakupan Jasa Pefindo kepada, atau kaitannya kepada, beberapa pihak, termasuk emiten, penasehat keuangan, pialang saham, investment banks, institusi keuangan dan perantara keuangan, dalam kaitannya menerima imbalan atau keuntungan lainnya dari pihak tersebut,
Laporan ini tidak ditujukan untuk pemodal tertentu dan tidak dapat dijadikan bagian dari tujuan investasi terhadap suatu saham dan juga bukan merupakan rekomendasi investasi terhadap suatu saham tertentu atau suatu strategi investasi. Sebelum melakukan tindakan dari hasil laporan ini, pemodal disarankan untuk mempertimbangkan terlebih dahulu kesesuaian situasi dan kondisi dan, jika dibutuhkan, mintalah bantuan penasehat keuangan.
PEFINDO memisahkan kegiatan Valuasi Saham dengan kegiatan Pemeringkatan untuk menjaga independensi dan objektivitas dari proses dan produk kegiatan analitis. PEFINDO telah menetapkan kebijakan dan prosedur untuk menjaga kerahasiaan informasi non-publik tertentu yang diterima sehubungan dengan proses analitis. Keseluruhan proses, metodologi dan database yang digunakan dalam penyusunan Laporan Target Harga Referensi Saham ini secara keseluruhan adalah berbeda dengan proses, metodologi dan database yang digunakan PEFINDO dalam melakukan pemeringkatan.
Laporan ini dibuat dan disiapkan Pefindo Divisi Valuasi Saham & Indexing dengan tujuan untuk meningkatkan transparansi harga saham yang tercatat di Bursa Efek Indonesia. Laporan ini juga bebas dari pengaruh tekanan atau paksaan dari Bursa maupun Perseroan yang dinilai. Pefindo Divisi Valuasi Saham & Indexing akan menerima imbalan sebesar Rp.40.000.000,- dari perusahaan yang dinilai untuk 2 (dua) kali pelaporan per tahun. Untuk keterangan lebih lanjut, dapat mengunjungi website kami di http://www.pefindo.com
Laporan ini dibuat dan disiapkan oleh Pefindo Divisi Valuasi Saham dan Indexing. Di Indonesia Laporan ini dipublikasikan pada website kami dan juga pada website Bursa Efek Indonesia.

Page 1 of 15 pages
Contact: Equity & Index Valuation Division Phone: (6221) 7278 2380 [email protected] “Disclaimer statement in the last page is an
integral part of this report”
www.pefindo.com
Multipolar, Tbk Primary Report
Equity Valuation
March 19th, 2012
Target Price
Low High 360 385
Retail & IT Group
Property
Historical Chart
Source : Bloomberg
Stock Information Rp
Ticker code MLPL
Market price as of March 16th, 2012 136
Market price – 52 week high 275
Market price – 52 week low 124
Market cap – 52 week high (bn) 2,396
Market cap – 52 week low (bn) 958
Market Value Added & Market Risk
Source : Bloomberg, Pefindo Equity & Index Valuation Division
Shareholders* (%)
Cyport Limited 26.95
Grandhill Asia Limited 5.05
HSBC-Fund Services 5.38
Public (each below 5%) 62.62
Notes: As of December 31st, 2011
Promising to Become the Biggest Player in Retail Industry
PT Multipolar Tbk (“MLPL”) was established in 1975 as an electronics retailer which transforms to Information & Technology (“IT”) solutions provider. In 1986, MLPL became the first IBM business partner in Indonesia. Even though MLPL started its business as an electronic retailer, nowadays MLPL also focus in developing its business to become a big player in retail industry through its ownership in PT Matahari Putra
Prima Tbk (“MPPA”) and Robbinz Department Store (“RDS”) in China. Currently MLPL has extensive retail network in Indonesia and China. In Indonesia, MLPL through MPPA operates 63 Hypermarts, 24 Foodmarts and 63 Boston HBC’s. While in China, MLPL has opened 6 retail stores in China, consist of 2 Hypermarts in Tianjin and Suzhou and 4 Department Stores in Tianjin, Chengdu, Yangzhou and Suzhou. Moreover, MLPL will
continue to develop it’s IT and Multimedia business unit and looking for another investment opportunity in order to achieve more strategic business portfolio.

“Disclaimer statement in the last page
is an integral part of this report”
www.pefindo.com
Multipolar, Tbk
March 19th, 2012 Page 2 of 15 pages
Indonesia and China Economic Development: Domestic Demand Will Continue Support the Economic Growth
World’s economy growth in 2012 will again be bolstered by the vibrant growth in emerging and developing market which supported by its domestic market. The emerging economy is estimated will grow by 5.1% YoY in
2011, lowering from 6.4% YoY growth in 2010. While Indonesia economy in 2012 will grow by 6.2% slightly down than 2011 figures of 6.5% YoY. The economic growth in China remains robust due to strong consumer demand. It is estimated will grow by 8.7% YoY in 2012, lower than 2011 growth of 9.5% YoY. Better economy outlook in both countries also reflected in the outlook of retail industry which very closely related to consumer demand, per capita income and people purchasing power. Retail
industry in both countries is estimated will grow by 20% and 13.2% in Indonesia and China, respectively.
Better Performance during 9M2011 Despite of net loss of associated companies in the first nine month 2011, MLPL showed better performance compared to the same period in 2010. In the top line, MLPL consolidated revenue increased by 7.3% YoY to
Rp 7.6 trillion from Rp 7.0 trillion in 9M2010. The revenue increases in this periods was from retail and distribution business unit that was driven by MPPA’s revenue. In 9M2011, the revenue of retail business unit increased by 0.63% YoY to Rp 6.6 trillion and contributes about 88% to MLPL’s consolidated revenue. While, MLPL’s revenue from IT business grew significantly by 115% YoY to Rp 833 billion from Rp 388 billion in 9M2010. Whereas, at operating level, MLPL managed to book positive operating
profit of Rp 843 million, up by 102% YoY from minus Rp 41 billion in 9M2010.
Expansion for Further Growth For 2012, MLPL has budgeted about USD 90 million for business expansion. As the main contributor to its revenue, MLPL continues expanding its retail business by opening new stores. In addition to MPPA’s retail store in Indonesia which opened about 12 stores in 2011, at the same periods,
MLPL also opened 3 retail stores in China, consisting of 2 Hypermart in Tianjin and Suzhou and 1 Robbinz in Suzhou. While for 2012, MLPL plans to
open about 10 retail stores in China in 2012 which estimated will spend about USD 60 million; while in Indonesia its subsidiary (MPPA) also plan to open 15 new stores during 2012. On the other hand, IT business unit is on working to develop cloud computing program which estimated will be
released in 2013. This year, MLPL will build a data center to support the cloud computing program which will spend about USD 30 million capital expenditures. With such expansion, we estimate MLPL’s revenue to grow at a CAGR of 23.0% during 2010-2014 periods
Business Prospects As the retail industry in Indonesia and china continue to grow by 20% and 13.2%, respectively, the prospect of retail business of which the biggest
contributor of MLPL’s revenue will remain conducive, bolstered up by extensive retail network which spread over almost all provinces in Indonesia and in several big cities in China. We estimate MLPL’s revenue from retail business will grow by 17.5% YoY in 2011 and growing at CAGR of 27.1% during 2011-2015. On the other hand, year 2012 will be the
momentous year for ICT industry globally and in Asia. Specifically in Indonesia, Business Monitor International (BMI) estimates ICT industry will
grow by 18% per year within the next four year. Many trends gaining traction in the last couple of years have crossed the chasm and will be a mainstream feature of the ICT industry moving forward, such as cloud computing. In line with its expansion in cloud computing program, MLPL will taste the sweetness of this business in 2013. Nevertheless, ICT industry in Indonesia is still faced with the lack of infrastructure and high digital gap
which will hamper ICT industry growth. We estimate MLPL’s revenue from IT business to grow at a CAGR of 14.8% during 2011-2015 periods.
INVESTMENT PARAMETER
“Disclaimer statement in the last page
is an integral part of this report”
www.pefindo.com
Multipolar, Tbk
March 19th, 2012 Page 3 of 15 pages
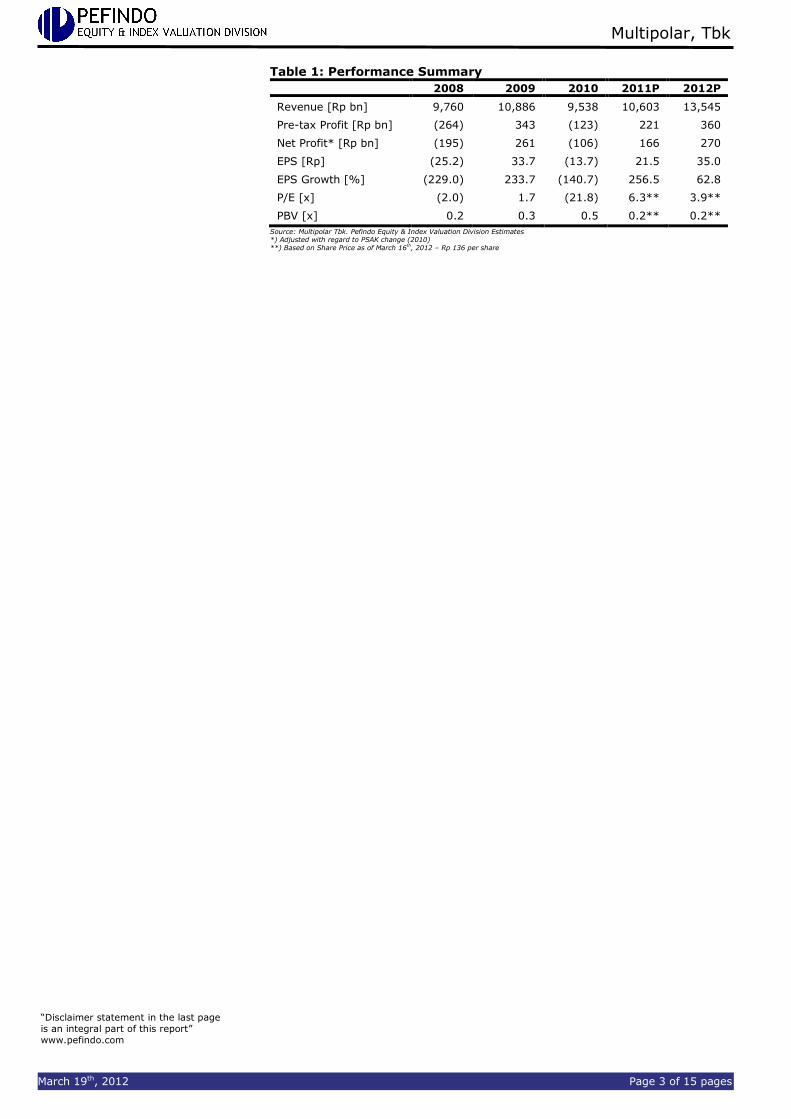
Table 1: Performance Summary
2008 2009 2010 2011P 2012P
Revenue [Rp bn] 9,760 10,886 9,538 10,603 13,545
Pre-tax Profit [Rp bn] (264) 343 (123) 221 360
Net Profit* [Rp bn] (195) 261 (106) 166 270
EPS [Rp] (25.2) 33.7 (13.7) 21.5 35.0
EPS Growth [%] (229.0) 233.7 (140.7) 256.5 62.8
P/E [x] (2.0) 1.7 (21.8) 6.3** 3.9**
PBV [x] 0.2 0.3 0.5 0.2** 0.2**
Source: Multipolar Tbk. Pefindo Equity & Index Valuation Division Estimates *) Adjusted with regard to PSAK change (2010) **) Based on Share Price as of March 16
th, 2012 – Rp 136 per share

“Disclaimer statement in the last page
is an integral part of this report”
www.pefindo.com
Multipolar, Tbk
March 19th, 2012 Page 4 of 15 pages
Growth-Value Map gives visualization of market expectations for the companies listed on IDX. Current Performance (“CP”) metric is a portion of current stock
market value that can be linked to the perpetuity of current company’s performance in profitability. Growth Expectations (“GE”) metric is the difference
between current stock market value and the value of current performance. Both metrics are normalized by the company’s book value. Growth-Value Map divides companies into four clusters, they are:
Excellent value managers (“Q-1”) Market expects companies in Q-1 to surpass their benchmark in
profitability and growth.
Expectation builders (“Q-2”) Market has relatively low expectations of profitability from companies in Q-2 in the short term, but has growth expectations exceed the benchmark.
Traditionalists (“Q-3”)
Market has low growth expectations of companies in the Q-3, although they showed a good profitability in the short term.
Asset-loaded value managers (“Q-4”) Market has low expectations in terms of profitability and growth for companies in Q-4
Figure 1: Growth-Value Map
(MLPL, Investment Sub Industry, and Trade, Services & Investment Industry)
-4
-2
0
2
4
6
8
0 1 2 3 4
Gro
wth
Exp
ecta
tio
ns
Current Performance (CP)
BMTR
PLAS
Q-1
Q-3
Q-2
Q-4
BHIT
MLPL
Source: Pefindo Equity & Index Valuation Division
MLPL is lying in Asset-loaded value managers (Q4). Although MLPL managed to book positive net income in 9M2011, but market view MLPL profitability below
their benchmark expectations. Moreover, market also expects MLPL’s growth opportunity slightly below their benchmark. By improving its profitability performance as well as rejuvenate its investor relation activity, we believe MLPL has opportunity to move to the second cluster (Expectation Builder).
GROWTH VALUE MAP

Multipolar, Tbk
February 23rd, 2012 Page 5 of 15 pages
World Economic Outlook: Will Again Be Bolstered By the Vibrant Growth in Emerging Markets
Based on The Conference Board research, global economy growth is projected to grow at 3.2% YoY in 2012, weakening from the previous year growth of 3.9% YoY, but then expected to accelerate somewhat to 3.5% YoY for the periods of 2013-2016. High unemployment and weak consumption in developed nations caused the downward revision in forecasts of world economic growth in 2012 from earlier projections. Despite the downturn, the world economy in 2012 will again be bolstered by the vibrant growth in emerging markets despite reduced
momentum due to the spillover effects of the crisis in Europe and the US.
Developing countries will face weakening external demand in 2012, but in most emerging economies they can rely on domestic demand to propel the growth until the world economy becomes healthier. But for developing countries that rely on external demand, will be impacted from the shrinking global market. In line with the downturn in overall economy, emerging economies are estimated to have
growth of only 5.1% YoY in 2012 lowering from 6.4% YoY growth in 2011. The downsize is resulting from emerging economies facing a slower export growth, after beating the trend for a while. However, they generally have more flexibility
in fiscal policy than most developed countries that may benefit them in term of more stable growth.
Table 2: Global Economic Growth
Country 2011E 2012F
US
EU-15
Japan
Other Advance Advance Economies
1.5
1.5
-0.5
3.3 1.6
1.1
1.1
0.7
2.5 1.3
China India
Other developing Asia
Latin America
Middle East
Africa
Central & Eastern Europe
Russia and Other CIS
Emerging Market and Developing Economies
9.5 7.8
5.1
4.5
4.3
4.4
4.0
4.6
6.4
8.7 7.4
2.8
2.9
2.3
2.4
2.1
2.8
5.1
World 3.9 3.2 Source: The Conference Board Economic Outlook, November 2011; Pefindo Equity & Index Valuation Division
Domestic Demand Remain the Main Engine for Indonesia and China Economic Growth in 2012 A deteriorating global economy is likely to impede growth in China and Indonesia in 2012. The Chinese government has continued taking steps to avert
overheating and to steer the economy toward a soft landing, while a mix of monetary and macro prudential measures has slowed GDP growth, although growth still remains robust due to strong consumer demand.
Table 3: Indonesia Economic Indicator
2008 2009 2010 2011
GDP Growth (%, YoY)
Inflation rate (%, YoY)
Exchange rate* (Rp/USD)
SBI rate (%)
6.1
11.06
9,136
9.25
4.5
2.78
9,680
6.50
6.1
6.96
10,398
6.5
6.5
3.79
8,779
6.0 * Bank Indonesia middle rate average Source: BPS, Bank Indonesia, Pefindo Equity & Index Valuation Division
Meanwhile Indonesia’s economic fundamentals will remain strong despite
expected effect of current global crisis that may cause world economic slowdown. Pefindo estimates that Indonesia’s economic growth will slightly down to 6.2% YoY in 2012, as in 2011, it was recorded of 6.5% YoY. The growth locomotive would be contributed from private consumption with the support of continued consumers’ optimism, manageable inflation, lower interest rate, and increasing per capita income. Indonesia’s per capita income reached USD 3,543 in 2011,
and may break USD 4,000 in 2012, compared to USD 3,000 in 2010. Meanwhile, investment realization in 2011 reached Rp 251.3 trillion or rose by 20.5% compared to 2010’s. With population composition is dominated by productive age population (around 60%) and increasing international perception of Indonesia’s economy development that reflected from the inclusion of Indonesia into investment grade by Fitch on December 2011 and by Moody’s on January 2012, then we believe that Indonesia will able to maintain its favorable growth in the
coming years.
BUSINESS INFORMATION

“Disclaimer statement in the last page
is an integral part of this report”
www.pefindo.com
Multipolar, Tbk
March 19th, 2012 Page 6 of 15 pages
ICT Industry Will be Flourished in 2012 Year 2012 will be the momentous year for ICT industry globally and in Asia. Specifically in Indonesia, Business Monitor International (BMI) estimates ICT industry will grow by 18% per year within the next four years. Many trends
gaining traction in the last couple of years have crossed the chasm and will be a mainstream feature of the ICT industry moving forward, such as cloud
computing. Meanwhile, the value of ICT industry based on the data from ministry of Communication and Information Technology (Kemkominfo) was reached Rp 350 trillion, up by 17% YoY from Rp 300 trillion in 2010. The growth was driven by a few things such as the spread of information technology industry, an increasingly competitive market, increase of hardware and software sales and the spread of information technology services. The sales of hardware, such as cell phone and computer grew at CAGR of 37.3% and 27.9% during 2008-2011
periods, while the sales of software reach USD 599 million in 2011 and estimated to grow at 22%CAGR in the next five years. Moreover, ICT industry is also boosted by the increase of government spending for technology and information, such as e-learning program, e-KTP and e-passport.
However, ICT industry is still facing lack of infrastructure and high digital gap which will hamper ICT industry growth. To solve this problem, Indonesia
government in 2012 has budgeted about Rp 3.2 trillion in the draft budget of
government’s revenue and expenditure for the Ministry of Communication and Information Technology. Kemkominfo will use these funds to focus on building telecommunication infrastructure such as Palapa Ring that relate to government targets to increase internet penetration up to 30% in 2014.
Starting as Electronic Retailer and Now Having a Wide Range of Strategic Portfolio
PT Multipolar Tbk (MLPL) was established in 1975 as an electronic retailer and now MLPL transforms to IT solution provider and strategic investment company. As of September 2011, almost 90% of its income was from its investment in various industry i.e. retail, multimedia and services. In retail industry, MLPL hold majority shares of ownership in PT Matahari Putra Prima Tbk (MPPA) - operator the second largest hypermarket in Indonesia- and Congrex Limited, operator of Robbinz Department Store (RDS), a well-known department store in China. In
Multimedia Industry, MLPL through its subsidiary PT Reksa Puspita Karya has about 33.8% shares of PT First Media Tbk (KBLV) - first mover in broadband services. MLPL is also a pioneer in the field of administrative services and
outsourcing industry through its subsidiaries PT Multifiling Mitra Indonesia Tbk (MFMI) and PT Visionet International.
Figure 2: MLPL’s Portfolios
Multipolar Tbk
Information Technology Retail Services Multimedia
PT Matahari Putra Prima Tbk
Congrex Limited
PT Sharestar Indonesia
PT Surya Cipta Investama
PT Multifiling Mitra Indonesia Tbk
PT Visonet International
PT Reksa Puspita Karya
PT First Media Tbk
Source: PT Multipolar Tbk, Pefindo Equity & Index Valuation Division
Strong Growth of Financial and Telecommunication Sectors Benefited MLPL IT Business’s revenue
On the sector basis, the source of Indonesian growth has started to be more balanced as the tradable sectors that accounted 46.5% of total GDP rose 4.5% YoY in the 2011, while non-tradable sectors grew 8.3% YoY in the same period vs. 8.2% YoY last year. The growth of non-tradable sector, among others, was supported by financial sector and communication sector. In 2011, financial sector grew by 6.8% YoY while transportation and telecommunication sector grew

“Disclaimer statement in the last page
is an integral part of this report”
www.pefindo.com
Multipolar, Tbk
March 19th, 2012 Page 7 of 15 pages
by 10.7% YoY. The outlook of financial industry will remain positive benefited by credit-rating upgrade.
This condition is a positive indication for MLPL’s IT business division, as majority
of its revenue is from these industries. During 9M2011, banking/financial institution contribute about 64% of total revenue of IT business unit, while telecommunication sectors still constitutes as the second biggest contributor by
23%.
Figure 3: IT Business Revenue Contributors
Source: PT Multipolar Tbk, Pefindo Equity & Index Valuation Division
Extensive Retail Distribution Network Nationwide and Abroad is Believed Will Boosted MLPL’s Revenue from Retail Business Unit One of MLPL strategic investments is in retail industry. In this industry, MLPL has majority shares of PT Matahari Putra Prima Tbk (MPPA) and Congrex Limited. MPPA is operator of Hypermart, the second largest hypermarket in Indonesia. In
the past six years, the number of Hypermart outlet has increased 23.0% a year on the average. In 2005, the number of Hypermart outlet was 17 units and increased to 59 units in 2011. This retail networks are spread over 32 cities in Indonesia. Hypermart is backed up with three distribution centers which have an important role in the distribution of goods to Hypermart and Foodmart. The warehouses of the three distribution centers are located in Surabaya, Balaraja
and Cibitung. In 2011, MPPA has opened 12 new stores of Hypermart which
increased up to 100,000 sqm sales area. The new stores are located in Lippo Karawaci Utara, Ciputra World Surabaya, Serang, Kediri and Gresik, while the rest is planned to be opened in Kudus, Malang, Cirebon, Ciputra Sraya (Sumatera), Gorontalo, Sidoarjo and Palembang.
Figure 4: MPPA’s Distribution Network
Source: PT Matahari Putra Prima Tbk, Pefindo Equity & Index Valuation Division
Meanwhile, abroad, MLPL succeed to expand its business to China by acquiring Congrex Limited, operator of a well-known Department Store in China, namely
Robbinz Department Store (RDS). In addition to RDS, MLPL also develop Hypermart in China. In 2011, MLPL has about 6 stores in China includes 4 RDS stores which spread over Tianjin, Chengdu, Yangzhou and Suzhou (open in December 2011) and 2 Hypermart which located in Tianjin and Suzhou. In this year, MLPL will open about 10 new stores of RDS and Hypermart in China, which

“Disclaimer statement in the last page
is an integral part of this report”
www.pefindo.com
Multipolar, Tbk
March 19th, 2012 Page 8 of 15 pages
we estimate will spend about USD 60 million investments. While, its subsidiary (MPPA) plans to open about 15 stores of Hypermart spread over several cities in Indonesia.
With such extensive retail distribution network we believe, MLPL investment in this industry will create high return, considering the economic growth in Indonesia and China, which supported by high domestic consumption and high
purchasing power. We estimate MLPL’s revenue from retail business unit will grow by 15.4% YoY in 2011 and grew by 27.1% per year in the next five years.
Positive Growth in Data Management Services MLPL also has investment in data management services industry, especially PT Multifiling Mitra Indonesia (“MFMI”) which is a pioneer and leader in Record Management Services since 1993. During 2007-2010, MFMI’s revenue and net income grew by 14.5% and 21.1% per year, respectively, while in 9M2011, its
revenue grew by 6% YoY from Rp 35.5 billion in 9M2010 to Rp 37.5 billion. MFMI is supported by 6 storages located in Lippo Cikarang, Surabaya, Medan, and Bandung which coverage more than 33,000 sqm storage area.
Along with the increase of many companies awareness to delegate their documentation and data management to third party in order to increase their efficiency, we believe its business will continue to grow in subsequent periods.
Figure 5: Data Management-Storage Center
Source: Multipolar Tbk, Pefindo Equity & Index Valuation Division
MLPL’s Revenue Increase Along With the Indonesia Economic Growth MLPL showed a better performance in the first nine months of 2011 compared to the same period in the last year. In year on year basis, MLPL’s revenue grew by 7.3% YoY from Rp 7.0 trillion in 9M2010 to Rp 7.6 trillion in 9M2011. The increases of MLPL’s revenue during this period were one from many positive
effect of Indonesia economy growth during 2011 of 6.5% YoY. Rising per capita income that sustains people purchasing power has boosted retail business revenue (especially in Indonesia) which is the biggest contributor to MLPL’s
revenue. On quarterly basis, MLPL revenue in 3Q2011 grew significantly by 14% q-o-q from 2Q2011 to Rp 2.8 trillion. It was due to high public spending during Ramadhan and before Lebaran days which happen in this quarter. For 4Q2011, we estimate MLPL’s revenue will grow to Rp 3.0 trillion, up by 8.3% q-o-q or
17.7% YoY from Rp 2.6 trillion in 4Q2010. In addition to retail sales, MLPL’s revenue in this period also surge by the revenue from IT unit business especially the sales of hardware such as cellular phone and personal computer.
FINANCE
“Disclaimer statement in the last page
is an integral part of this report”
www.pefindo.com
Multipolar, Tbk
March 19th, 2012 Page 9 of 15 pages
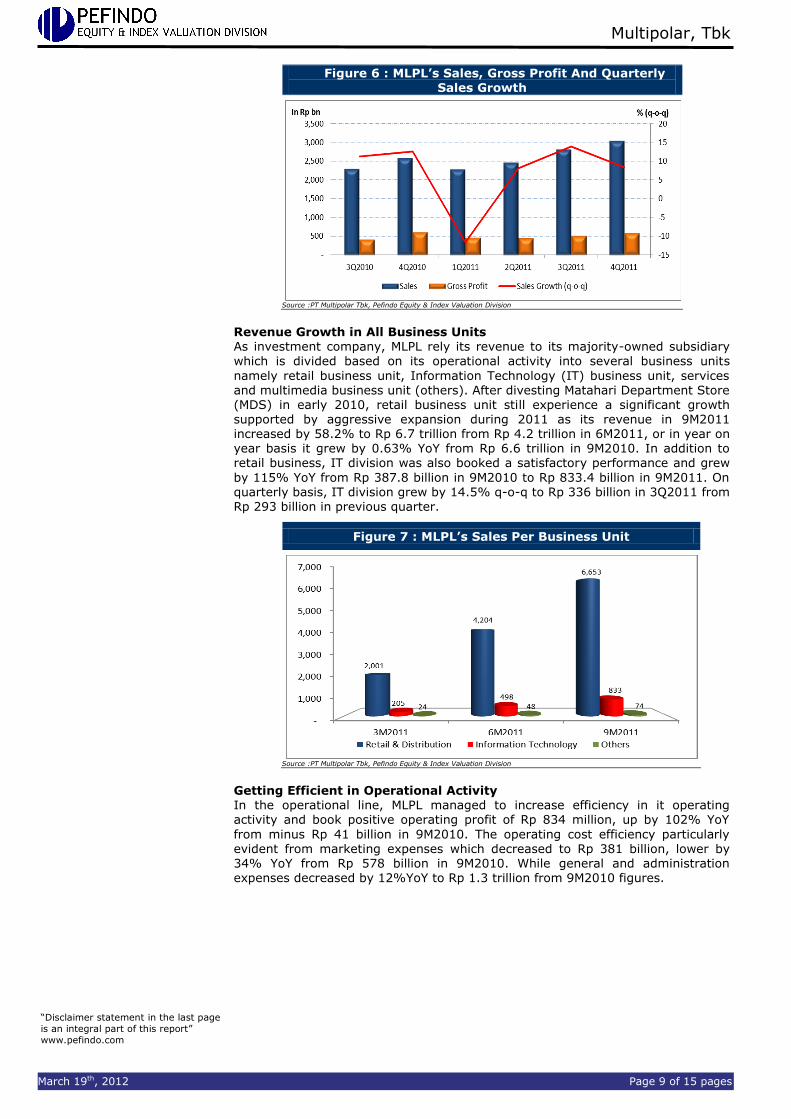
Figure 6 : MLPL’s Sales, Gross Profit And Quarterly Sales Growth
Source :PT Multipolar Tbk, Pefindo Equity & Index Valuation Division
Revenue Growth in All Business Units As investment company, MLPL rely its revenue to its majority-owned subsidiary
which is divided based on its operational activity into several business units
namely retail business unit, Information Technology (IT) business unit, services and multimedia business unit (others). After divesting Matahari Department Store (MDS) in early 2010, retail business unit still experience a significant growth supported by aggressive expansion during 2011 as its revenue in 9M2011 increased by 58.2% to Rp 6.7 trillion from Rp 4.2 trillion in 6M2011, or in year on year basis it grew by 0.63% YoY from Rp 6.6 trillion in 9M2010. In addition to retail business, IT division was also booked a satisfactory performance and grew
by 115% YoY from Rp 387.8 billion in 9M2010 to Rp 833.4 billion in 9M2011. On quarterly basis, IT division grew by 14.5% q-o-q to Rp 336 billion in 3Q2011 from Rp 293 billion in previous quarter.
Figure 7 : MLPL’s Sales Per Business Unit
Source :PT Multipolar Tbk, Pefindo Equity & Index Valuation Division
Getting Efficient in Operational Activity In the operational line, MLPL managed to increase efficiency in it operating activity and book positive operating profit of Rp 834 million, up by 102% YoY
from minus Rp 41 billion in 9M2010. The operating cost efficiency particularly
evident from marketing expenses which decreased to Rp 381 billion, lower by 34% YoY from Rp 578 billion in 9M2010. While general and administration expenses decreased by 12%YoY to Rp 1.3 trillion from 9M2010 figures.
“Disclaimer statement in the last page
is an integral part of this report”
www.pefindo.com
Multipolar, Tbk
March 19th, 2012 Page 10 of 15 pages
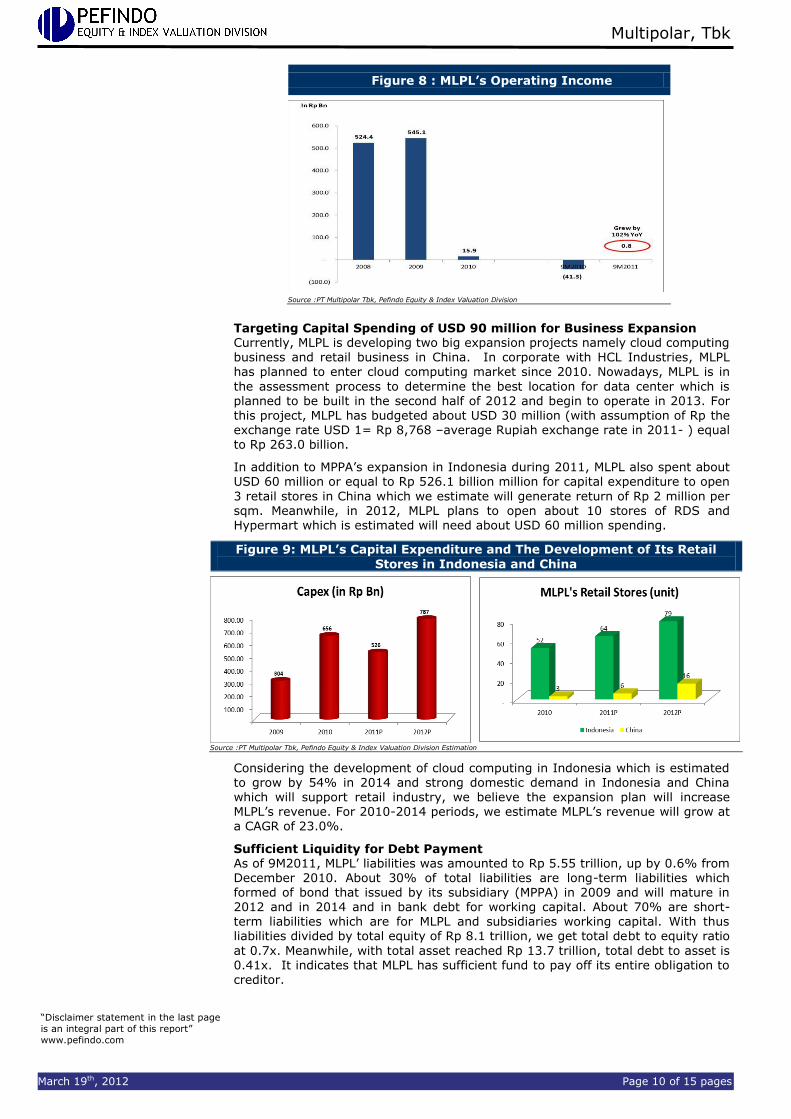
Figure 8 : MLPL’s Operating Income
Source :PT Multipolar Tbk, Pefindo Equity & Index Valuation Division
Targeting Capital Spending of USD 90 million for Business Expansion Currently, MLPL is developing two big expansion projects namely cloud computing business and retail business in China. In corporate with HCL Industries, MLPL
has planned to enter cloud computing market since 2010. Nowadays, MLPL is in
the assessment process to determine the best location for data center which is planned to be built in the second half of 2012 and begin to operate in 2013. For this project, MLPL has budgeted about USD 30 million (with assumption of Rp the exchange rate USD 1= Rp 8,768 –average Rupiah exchange rate in 2011- ) equal to Rp 263.0 billion.
In addition to MPPA’s expansion in Indonesia during 2011, MLPL also spent about USD 60 million or equal to Rp 526.1 billion million for capital expenditure to open
3 retail stores in China which we estimate will generate return of Rp 2 million per sqm. Meanwhile, in 2012, MLPL plans to open about 10 stores of RDS and Hypermart which is estimated will need about USD 60 million spending.
Figure 9: MLPL’s Capital Expenditure and The Development of Its Retail
Stores in Indonesia and China
Source :PT Multipolar Tbk, Pefindo Equity & Index Valuation Division Estimation
Considering the development of cloud computing in Indonesia which is estimated to grow by 54% in 2014 and strong domestic demand in Indonesia and China which will support retail industry, we believe the expansion plan will increase MLPL’s revenue. For 2010-2014 periods, we estimate MLPL’s revenue will grow at a CAGR of 23.0%.
Sufficient Liquidity for Debt Payment As of 9M2011, MLPL’ liabilities was amounted to Rp 5.55 trillion, up by 0.6% from December 2010. About 30% of total liabilities are long-term liabilities which formed of bond that issued by its subsidiary (MPPA) in 2009 and will mature in 2012 and in 2014 and in bank debt for working capital. About 70% are short-term liabilities which are for MLPL and subsidiaries working capital. With thus liabilities divided by total equity of Rp 8.1 trillion, we get total debt to equity ratio
at 0.7x. Meanwhile, with total asset reached Rp 13.7 trillion, total debt to asset is 0.41x. It indicates that MLPL has sufficient fund to pay off its entire obligation to creditor.

“Disclaimer statement in the last page
is an integral part of this report”
www.pefindo.com
Multipolar, Tbk
March 19th, 2012 Page 11 of 15 pages
Figure 10 : MLPL’s Assets, Liabilities and Equities
Source :PT Multipolar Tbk, Pefindo Equity & Index Valuation Division
MLPL Business Prospects
Strong consumer demand remain the main engine for economic growth in China
and Indonesia in 2012, although it is estimated will be lower than previous years of 8.7% and 6.2%, respectively. Retail industry in Indonesia and China is estimated to grow by 20% YoY and 13.2 YoY in the same periods. Modern retail still has potential grow in Indonesia as now it caters approximately 40% of total market, smaller than other Asian country, while normalization of property prices in China is estimated will boost consumption in other area include retail.
On the other hand, year 2012 will be the momentous year for ICT industry globally and in Asia. Specifically in Indonesia, Business Monitor International (BMI) estimates ICT industry will grow by 18% per year within the next four year. Many trends gaining traction in the last couple of years have crossed the chasm and will be a mainstream feature of the ICT industry moving forward, such as cloud computing. BMI also estimates that the value of Indonesia’s ICT
spending in 2011 will reach USD 5.4 billion, up by 14.9% YoY from 2010. The growth was driven by a few things, including the spread of information technology industry, an increasingly competitive market, increase of hardware and software sales and the spread of information technology services. It also
boosting by the increase of government spending for technology and information, such as e-learning program, e-KTP and e-passport. However, ICT industry is still faced with the lack of infrastructure and high digital gap that will hamper ICT
industry growth.
Augmented with MLPL and its subsidiaries expansion plan during 2011-2012, which will spent about USD 60 million - USD 90 million, we estimate MLPL’s revenue will grow at a CAGR of 23.0% during 2010-2014 period.
Figure 11 : MLPL’s Sales Projection
Source :PT Multipolar Tbk, Pefindo Equity & Index Valuation Division Estimates

“Disclaimer statement in the last page
is an integral part of this report”
www.pefindo.com
Multipolar, Tbk
March 19th, 2012 Page 12 of 15 pages
Table 4: SWOT Analysis
Strengths Weakness
Well-known as IT solution
partners Extensive retail store network
distribution in Indonesia and China
Good relationship with world class IT provider
Low entry barrier in the industry Underperformed of minority
interest in subsidiaries burden MLPL net income
Opportunities Threats The development of IT industries
such as cloud computing program in Indonesia
Positive outlook of Indonesia and China economy as well as retail
industry
Newcomer with big capital can
give more competition. The delayed of several property
projects hampered the store expansion
Lack of ICT infrastructure in Indonesia
SWOT ANALYSIS

“Disclaimer statement in the last page
is an integral part of this report”
www.pefindo.com
Multipolar, Tbk
March 19th, 2012 Page 13 of 15 pages
VALUATION
Methodology
We apply Discounted Cash Flow (DCF) method as the main valuation approach considering the income growth is a value driver in MLPL instead of asset growth. We do not combine DCF method with Guideline Company Method (GCM) as there is no similar company eligible to be compared with MLPL in the IDX.
This valuation is based on 100% of MLPL’s shares price as of March 16th, 2012, using MLPL’s financial report as of September 30th, 2011 for our fundamental analysis.
Value Estimation
We use Cost of Capital of 13.4% and Cost of Equity of 14.8% based on the following assumptions: Table 5: Assumption
Risk free rate [%]* 5.9
Risk premium [%]* 9.3
Beta [x]* 0.9
Cost of Equity [%] 14.8
Marginal tax rate [%] 25.0
Debt to Equity Ratio 0.3
WACC [%] 13.4
Source: Bloomberg, Pefindo Equity & Index Valuation Division Estimates Notes: * As of March 16
th, 2012
Target price for 12 months based on valuation as per March 16th, 2012 using
DCF method with an assumption of 13.4% discount rate is Rp 360 – Rp 385 per share
Table 6: DCF Method
Conservative Moderate Aggressive
PV of Free Cash Flows [Rp bn] 833 876 920
PV Terminal Value [Rp bn] 957 1,007 1,057
Non-Operating Assets 3,649 3,649 3,649
Net Debt [Rp bn] (2,669) (2,669) (2,669)
Total Equity Value [Rp bn] 2,769 2,864 2,958
Number of Share [mn shares] 7,728 7,728 7,728
Fair Value per Share [Rp] 360 370 385 Source: Pefindo Equity & Index Valuation Division Estimates
TARGET PRICE
“Disclaimer statement in the last page
is an integral part of this report”
www.pefindo.com
Multipolar, Tbk
March 19th, 2012 Page 14 of 15 pages
Table 7: Income Statement (In Rp bn)
Income Statement 2008 2009 2010 2011P 2012P
Net Sales 9,760 10,866 9,538 10,603 13,545
COGS (6,517) (7,214) (7,366) (8,654) (11,181)
Gross Profit 3,242 2,672 2,171 1,949 2,364
Operating Expense (2,718) (3,126) (2,156) (1,917) (2,188)
Operating Profit 524 545 16 32 176
Other Income (Charges) (730) (213) (145) 203 197
Pre-tax Profit (264) 343 (123) 221 359
Tax 69 (83) 17 (55) (90)
Net Profit (195) 260 (106) 166 270
Source: PT Multipolar Tbk, Pefindo Equity & Index Valuation Division Estimates
Table 8: Income Statement (In Rp bn)
Balance Sheet 2008 2009 2010 2011P 2012P
Assets
Current Assets
Cash and cash
equivalents 1,897 2,429 3,044 1,739 1,797
Short Term Investment 1,914 1,648 2,039 2,354 2,354
Receivables 869 247 424 554 634
Inventory 1,030 1,233 1,057 1,242 1,650
Other Assets 545 368 430 742 820
Total Current Assets 6,255 5,925 6,993 6,630 7,290
Fixed Assets 2,010 2,282 2,012 2,037 2,296
Other Assets 3,197 3,661 5,011 5,612 5,666
Total Assets 11,462 11,868 14,017 14,280 15,171
Liabilities
Trade payables 1,252 1,331 1,183 1,390 1,796
Short-term loan 1,126 1,409 1,043 1,709 789
Other Short-term
payables 2,841 885 1,479 1,483 1,898
Long term loan 2,736 4,362 1,199 893 1,695
Other long-term payables 327 438 612 563 563
Total Liabilities 8,282 8,426 5,516 6,038 6,741
Total Equity 3,180 3,443 8,501 8,242 8,430
Source: PT Multipolar Tbk, Pefindo Equity & Index Valuation Division Estimates
Figure 12: Historical Return on Assets, Return on Equity and Total Asset Turnover
Source: PT Multipolar Tbk, Pefindo Equity & Index Valuation Division
Figure 13: Historical P/E and P/BV
Source: PT Multipolar Tbk, Pefindo Equity & Index Valuation Division
Table 9: Key Ratio
Ratio 2008 2009 2010 2011P 2012P
Growth [%]
Sales (5.9) 11.5 (12.4) 11.2 27.7
Operating Profit 18.8 3.9 (97.1) 100.3 453.9
EBITDA (57.4) 208.9 (64.2) 35.7 29.8
Net Profit (229.0) 233.7 (140.7) 256.4 62.4
Profitability [%]
Gross Margin 33.2 33.7 22.8 18.4 17.4
Operating Margin 5.4 5.0 0.2 0.3 1.3
EBITDA Margin 3.8 10.6 4.3 5.3 5.4
Net Margin (2.0) 2.4 (1.1) 1.6 1.8
ROA (1.7) 2.2 (0.8) 1.2 1.8
ROE (6.1) 7.6 (1.2) 2.0 3.2
Solvability [X]
Debt to Equity 2.6 2.4 0.7 0.7 0.8
Interest Bearing Debt to Equity
1.1 1.6 0.2 0.3 0.3
Debt to Asset 0.7 0.7 0.4 0.4 0.5
Liquidity [X]
Current Ratio 1.2 1.6 1.9 1.4 1.6
Quick Ratio 0.9 1.2 1.5 1.0 1.1
Source: PT Multipolar Tbk. Pefindo Equity & Index Valuation Division Estimates

“Disclaimer statement in the last page
is an integral part of this report”
www.pefindo.com
Multipolar, Tbk
March 19th, 2012 Page 15 of 15 pages
DISCLAIMER
This report was prepared based on the trusted and reliable sources. Nevertheless, we do not guarantee its completeness, accuracy and adequacy. Therefore we do not responsible of any investment decision making based on this report. As for any assumptions, opinions and predictions were solely our internal judgments as per reporting date, and those judgments are subject to change without further notice. We do not responsible for mistake and negligence occurred by using this report. Last performance could not always be used as reference for future outcome. This report is not an offering recommendation, purchase or holds particular shares. This report might not be suitable for some investors. All opinion in this report has been presented fairly as per issuing date with good intentions; however it could be change at any time without further notice. The price, value or income from each share of the Company stated in this report might lower than the investor expectation and investor might obtain lower return than the invested amount. Investment is defined as the probable income that will be received in the future; nonetheless such return may possibly fluctuate. As for the Company which its share is denominated other than Rupiah, the foreign exchange fluctuation may reduce the value, price or investor investment return. This report does not contain any information for tax consideration in investment decision making .
The share price target in this report is a fundamental value, not a fair market value nor a transaction price reference required by the regulations. The share price target issued by Pefindo Equity & Index Valuation Division is not a recommendation to buy, sell or hold particular shares and it could not be considered as an investment advice from Pefindo Equity & Index Valuation Division as its scope of service to, or in relation to some parties, including listed companies, financial advisor, broker, investment bank, financial institution and intermediary, in correlation with receiving rewards or any other benefits from that parties. This report is not intended for particular investor and cannot be used as part of investment objective on particular shares and neither an investment recommendation on particular shares or an investment strategy. We strongly recommended investor to consider the suitable situation and condition at first before making decision in relation with the figure in this report. If i t is necessary, kindly contact your financial advisor. PEFINDO keeps the activities of Equity Valuation separate from Ratings to preserve independence and objectivity of its analytical processes and products. PEFINDO has established policies and procedures to maintain the confidentiality of certain non-public information received in connection with each analytical process. The entire process, methodology and the database used in the preparation of the Reference Share Price Target Report as a whole is different from the processes, methodologies and databases used PEFINDO in doing the rating. This report was prepared and composed by Pefindo Equity & Index Valuation Division with the objective to enhance shares price transparency of listed companies in Indonesia Stock Exchange (IDX). This report is also free of other party’s influence, pressure or force either from IDX or the listed company which reviewed by Pefindo Equity & Index Valuation Division. Pefindo Equity & Index Valuation Division will earn reward amounting to Rp 40 mn from the reviewed company for issuing report twice per year. For further information, please visit our website at http://www.pefindo.com This report is prepared and composed by Pefindo Equity & Index Valuation Division. In Indonesia, this report is published in our website and in IDX website.