penetra tion of the stigma and style elicits a novel … et al 2009.pdf · yu an qin 1, alexan der...
TRANSCRIPT
Penetration of the Stigma and Style Elicits a NovelTranscriptome in Pollen Tubes, Pointing to Genes Criticalfor Growth in a PistilYuan Qin1, Alexander R. Leydon2, Ann Manziello3, Ritu Pandey3, David Mount3, Stojan Denic4, Bane
Vasic4, Mark A. Johnson2*, Ravishankar Palanivelu1*
1Department of Plant Sciences, University of Arizona, Tucson, Arizona, United States of America, 2Department of Molecular Biology, Cell Biology, and Biochemistry,
Brown University, Providence, Rhode Island, United States of America, 3Arizona Cancer Center and Southwest Environmental Health Sciences Center, University of
Arizona, Tucson, Arizona, United States of America, 4Department of Electrical and Computer Engineering, University of Arizona, Tucson, Arizona, United States of America
Abstract
Pollen tubes extend through pistil tissues and are guided to ovules where they release sperm for fertilization. Althoughpollen tubes can germinate and elongate in a synthetic medium, their trajectory is random and their growth rates areslower compared to growth in pistil tissues. Furthermore, interaction with the pistil renders pollen tubes competent torespond to guidance cues secreted by specialized cells within the ovule. The molecular basis for this potentiation of thepollen tube by the pistil remains uncharacterized. Using microarray analysis in Arabidopsis, we show that pollen tubes thathave grown through stigma and style tissues of a pistil have a distinct gene expression profile and express a substantiallylarger fraction of the Arabidopsis genome than pollen grains or pollen tubes grown in vitro. Genes involved in signaltransduction, transcription, and pollen tube growth are overrepresented in the subset of the Arabidopsis genome that isenriched in pistil-interacted pollen tubes, suggesting the possibility of a regulatory network that orchestrates geneexpression as pollen tubes migrate through the pistil. Reverse genetic analysis of genes induced during pollen tube growthidentified seven that had not previously been implicated in pollen tube growth. Two genes are required for pollen tubenavigation through the pistil, and five genes are required for optimal pollen tube elongation in vitro. Our studies form thefoundation for functional genomic analysis of the interactions between the pollen tube and the pistil, which is an excellentsystem for elucidation of novel modes of cell–cell interaction.
Citation: Qin Y, Leydon AR, Manziello A, Pandey R, Mount D, et al. (2009) Penetration of the Stigma and Style Elicits a Novel Transcriptome in Pollen Tubes,Pointing to Genes Critical for Growth in a Pistil. PLoS Genet 5(8): e1000621. doi:10.1371/journal.pgen.1000621
Editor: Gregory S. Barsh, Stanford University School of Medicine, United States of America
Received June 5, 2009; Accepted July 29, 2009; Published August 28, 2009
Copyright: ! 2009 Qin et al. This is an open-access article distributed under the terms of the Creative Commons Attribution License, which permits unrestricteduse, distribution, and reproduction in any medium, provided the original author and source are credited.
Funding: This work was supported by a seed grant from University of Arizona Faculty small grant program to RP and NSF grants to RP (IOS-0723421) and MAJ(IOS-0644623). The funders had no role in study design, data collection and analysis, decision to publish, or preparation of the manuscript.
Competing Interests: The authors have declared that no competing interests exist.
* E-mail: [email protected] (MAJ); [email protected] (RP)
Introduction
Cell-cell interactions can regulate the fate, morphology, andmigration patterns of cells during development of multicellularorganisms. Cell surface molecules mediate these interactions byinitiating intracellular signal transduction cascades that causechanges in nuclear gene expression patterns [1]. Since the pollentube of flowering plants interacts with several distinct cell typesduring its migration to an ovule, it represents an attractive modelsystem for studying changes in global gene expression patterns inresponse to cell-cell interactions.Flowering plants alternate between haploid gametophytic and
diploid sporophytic phases of their life cycle. Male and femalegametophytes develop through a series of mitotic divisions ofhaploid spores, which are produced when diploid sporophyticcells within the anther (male) and ovule (female) undergo meiosis[2]. Male spores divide asymmetrically to produce a vegetativecell that engulfs a smaller generative cell. The generative cellthen divides to form two sperm cells within the cytoplasm of thepollen grain, which constitutes the mature male gametophyte[3,4].
Upon binding a compatible stigma, the pollen grain germinatesa tube that penetrates the stigma and grows rapidly through aprotein and carbohydrate-rich extracellular matrix secreted byspecialized cells of the pistil [5]. Pollen tubes extend by an actin-myosin-based tip-growth mechanism that transports vesiclesloaded with new cell wall material to the extending apex [6–9].In response to guidance cues from female cells, individual pollentubes target and enter an ovule micropyle [10], contact the femalegametophyte [11], arrest growth [12,13], and burst [14], releasingtwo sperm for fertilization of female gametes [15].Pollen is released from anthers at anthesis and has therefore
been amenable to global gene expression profiling. Transcriptomeanalysis showed that pollen expresses a unique subset of theArabidopsis genome relative to sporophytic tissues [16–19] andrevealed changes in the patterns of gene expression as the malegametophyte develops from a spore to a tricellular pollen grain[18]. Determination of the transcriptome of purified sperm cellsshowed that male gametes have a distinct gene expressionprogram that contributes to the transcriptome of the pollen grain[20]. Recently, genome-wide expression profiling of pollen tubesgrown in vitro identified a set of genes that are expressed in the
PLoS Genetics | www.plosgenetics.org 1 August 2009 | Volume 5 | Issue 8 | e1000621
pollen tube but not in pollen [21]. This important study suggeststhat there is de novo mRNA synthesis in the growing pollen tubeand raises the interesting possibility that a novel set of genes maybe expressed in response to growth through the pistil.Studies in maize and petunia suggest that pistils induce gene
expression changes in pollen tubes. For example, exposure ofpetunia pollen to kaempferol, a pollen germination-inducingmolecule produced by the stigma [22], resulted in significant geneexpression changes during the first 0.5 hours after pollen germina-tion. Eight novel cDNAs whose expression increased in response tokaempferol were identified in petunia pollen tubes [23].It is also clear that pollen tube physiology changes as a
consequence of growth through pistil tissue, but the molecularbases for these changes are largely unknown. Pollen tubes extendat faster rates in a pistil and achieve substantially greater terminallengths compared to pollen tubes grown in vitro [24]. Furthermore,pollen tubes germinated in vitro target the ovule micropyle at verylow efficiencies; however, if pollen tubes are first grown throughpistil tissues, guidance to ovules is significantly enhanced [25,26].Therefore, it is likely that the transcriptome of pollen tubes grownthrough the pistil differs considerably from that of in vitro-grownpollen tubes. Defining these differences could lead to the discoveryof genes that are activated by potentiation of the pollen tube by thepistil and are required for pollen tube guidance, and to theidentification of gene regulatory networks that mediate the pollentube response to the pistil environment.In this study, we defined the transcriptome of pollen tubes that
have grown through pistil tissues using a semi-in vivo pollen tube(SIV PT) growth system we developed for Arabidopsis [26].Importantly, the SIV PT transcriptome was significantly differentfrom those of pollen grains or pollen tubes grown in vitro. Inaddition, we showed that a significant number of genes are sharedbetween the SIV PT transcriptome and sporophytic tissues, whichare not expressed in pollen or pollen tubes grown in vitro. We alsodefined a set of genes that are enriched in semi-in vivo grown pollentubes relative to pollen, pollen tubes grown in vitro, and a collectionof sporophytic tissues. The distribution of functional categories inthis set of genes compared to pollen grains revealed a significant
enrichment for the Toll/Interleukin-1 Receptor homology-Nucle-otide Binding Site-Leucine Rich Repeat (TIR-NBS-LRR)-typereceptor family of proteins [27]. These genes have been implicatedin pathogen-derived-effector-protein recognition and could play adirect signaling role during pollen tube potentiation by pistils. Todetermine whether genes whose expression increases during pollentube growth in vitro and/or semi in vivo are required for pollen tubefunction, we performed reverse-genetic analysis of selected genes.We identified five mutants that disrupt pollen tube growth in vitroand two mutants that specifically disrupt pollen tube growth in thepistil. Our studies lay the foundation for functional genomicanalysis of pollen tube-pistil interactions.
Results
Microarray Analysis To Identify Genes Expressed in InVitro– and Semi In Vivo–Grown Pollen TubesTo identify gene expression changes during pollen tube growth
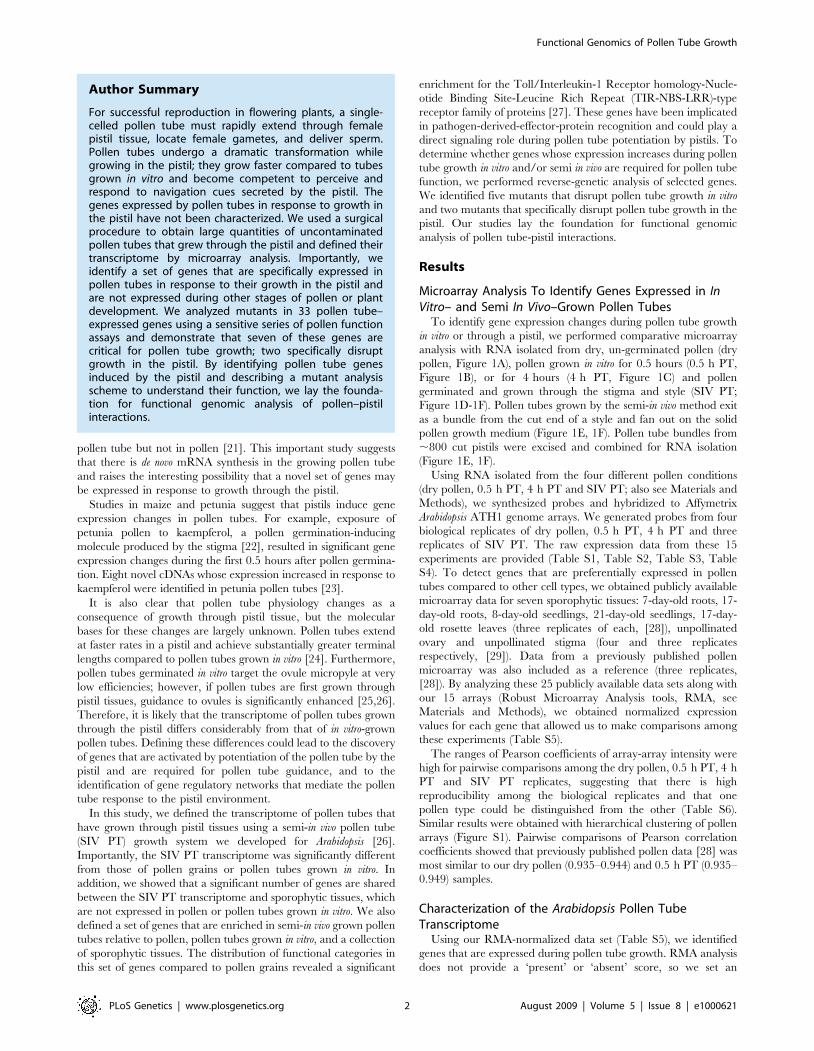
in vitro or through a pistil, we performed comparative microarrayanalysis with RNA isolated from dry, un-germinated pollen (drypollen, Figure 1A), pollen grown in vitro for 0.5 hours (0.5 h PT,Figure 1B), or for 4 hours (4 h PT, Figure 1C) and pollengerminated and grown through the stigma and style (SIV PT;Figure 1D-1F). Pollen tubes grown by the semi-in vivo method exitas a bundle from the cut end of a style and fan out on the solidpollen growth medium (Figure 1E, 1F). Pollen tube bundles from,800 cut pistils were excised and combined for RNA isolation(Figure 1E, 1F).Using RNA isolated from the four different pollen conditions
(dry pollen, 0.5 h PT, 4 h PT and SIV PT; also see Materials andMethods), we synthesized probes and hybridized to AffymetrixArabidopsis ATH1 genome arrays. We generated probes from fourbiological replicates of dry pollen, 0.5 h PT, 4 h PT and threereplicates of SIV PT. The raw expression data from these 15experiments are provided (Table S1, Table S2, Table S3, TableS4). To detect genes that are preferentially expressed in pollentubes compared to other cell types, we obtained publicly availablemicroarray data for seven sporophytic tissues: 7-day-old roots, 17-day-old roots, 8-day-old seedlings, 21-day-old seedlings, 17-day-old rosette leaves (three replicates of each, [28]), unpollinatedovary and unpollinated stigma (four and three replicatesrespectively, [29]). Data from a previously published pollenmicroarray was also included as a reference (three replicates,[28]). By analyzing these 25 publicly available data sets along withour 15 arrays (Robust Microarray Analysis tools, RMA, seeMaterials and Methods), we obtained normalized expressionvalues for each gene that allowed us to make comparisons amongthese experiments (Table S5).The ranges of Pearson coefficients of array-array intensity were
high for pairwise comparisons among the dry pollen, 0.5 h PT, 4 hPT and SIV PT replicates, suggesting that there is highreproducibility among the biological replicates and that onepollen type could be distinguished from the other (Table S6).Similar results were obtained with hierarchical clustering of pollenarrays (Figure S1). Pairwise comparisons of Pearson correlationcoefficients showed that previously published pollen data [28] wasmost similar to our dry pollen (0.935–0.944) and 0.5 h PT (0.935–0.949) samples.
Characterization of the Arabidopsis Pollen TubeTranscriptomeUsing our RMA-normalized data set (Table S5), we identified
genes that are expressed during pollen tube growth. RMA analysisdoes not provide a ‘present’ or ‘absent’ score, so we set an
Author Summary
For successful reproduction in flowering plants, a single-celled pollen tube must rapidly extend through femalepistil tissue, locate female gametes, and deliver sperm.Pollen tubes undergo a dramatic transformation whilegrowing in the pistil; they grow faster compared to tubesgrown in vitro and become competent to perceive andrespond to navigation cues secreted by the pistil. Thegenes expressed by pollen tubes in response to growth inthe pistil have not been characterized. We used a surgicalprocedure to obtain large quantities of uncontaminatedpollen tubes that grew through the pistil and defined theirtranscriptome by microarray analysis. Importantly, weidentify a set of genes that are specifically expressed inpollen tubes in response to their growth in the pistil andare not expressed during other stages of pollen or plantdevelopment. We analyzed mutants in 33 pollen tube–expressed genes using a sensitive series of pollen functionassays and demonstrate that seven of these genes arecritical for pollen tube growth; two specifically disruptgrowth in the pistil. By identifying pollen tube genesinduced by the pistil and describing a mutant analysisscheme to understand their function, we lay the founda-tion for functional genomic analysis of pollen–pistilinteractions.
Functional Genomics of Pollen Tube Growth
PLoS Genetics | www.plosgenetics.org 2 August 2009 | Volume 5 | Issue 8 | e1000621
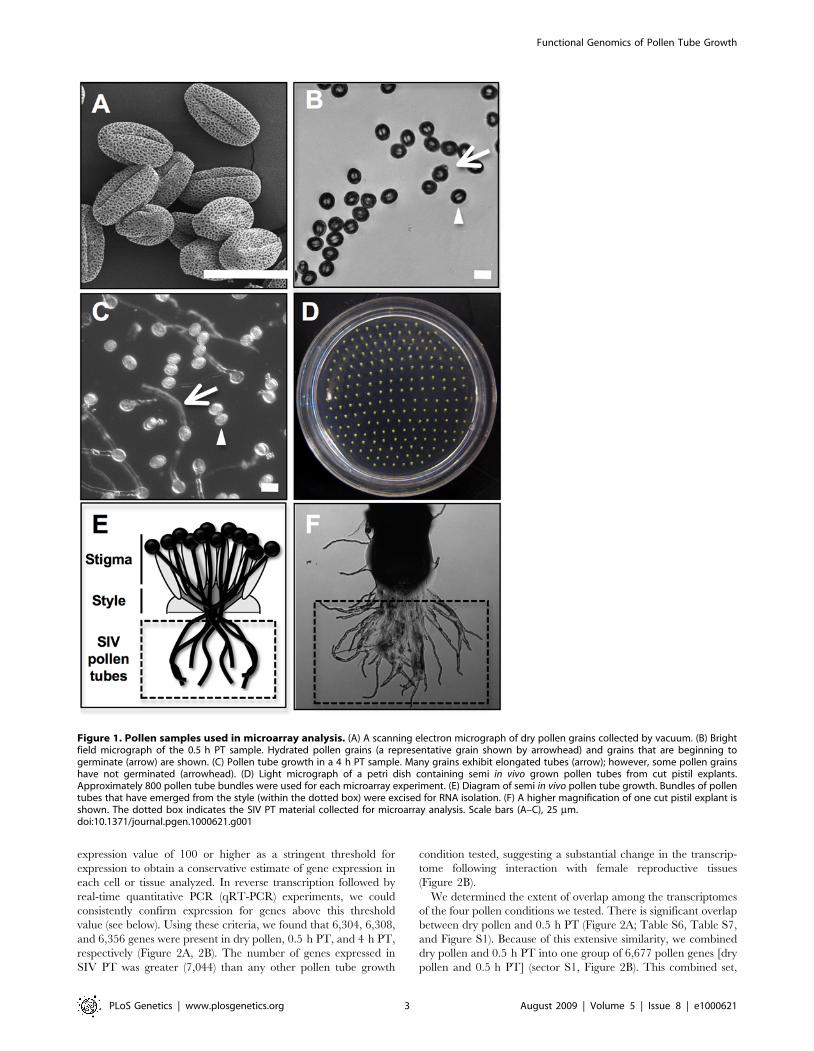
expression value of 100 or higher as a stringent threshold forexpression to obtain a conservative estimate of gene expression ineach cell or tissue analyzed. In reverse transcription followed byreal-time quantitative PCR (qRT-PCR) experiments, we couldconsistently confirm expression for genes above this thresholdvalue (see below). Using these criteria, we found that 6,304, 6,308,and 6,356 genes were present in dry pollen, 0.5 h PT, and 4 h PT,respectively (Figure 2A, 2B). The number of genes expressed inSIV PT was greater (7,044) than any other pollen tube growth
condition tested, suggesting a substantial change in the transcrip-tome following interaction with female reproductive tissues(Figure 2B).We determined the extent of overlap among the transcriptomes
of the four pollen conditions we tested. There is significant overlapbetween dry pollen and 0.5 h PT (Figure 2A; Table S6, Table S7,and Figure S1). Because of this extensive similarity, we combineddry pollen and 0.5 h PT into one group of 6,677 pollen genes [drypollen and 0.5 h PT] (sector S1, Figure 2B). This combined set,
Figure 1. Pollen samples used in microarray analysis. (A) A scanning electron micrograph of dry pollen grains collected by vacuum. (B) Brightfield micrograph of the 0.5 h PT sample. Hydrated pollen grains (a representative grain shown by arrowhead) and grains that are beginning togerminate (arrow) are shown. (C) Pollen tube growth in a 4 h PT sample. Many grains exhibit elongated tubes (arrow); however, some pollen grainshave not germinated (arrowhead). (D) Light micrograph of a petri dish containing semi in vivo grown pollen tubes from cut pistil explants.Approximately 800 pollen tube bundles were used for each microarray experiment. (E) Diagram of semi in vivo pollen tube growth. Bundles of pollentubes that have emerged from the style (within the dotted box) were excised for RNA isolation. (F) A higher magnification of one cut pistil explant isshown. The dotted box indicates the SIV PT material collected for microarray analysis. Scale bars (A–C), 25 mm.doi:10.1371/journal.pgen.1000621.g001
Functional Genomics of Pollen Tube Growth
PLoS Genetics | www.plosgenetics.org 3 August 2009 | Volume 5 | Issue 8 | e1000621
Figure 2. Differential gene expression in pollen and pollen tubes. Genes were considered expressed in a given cell type or tissue if theirmean, normalized expression value was greater than 100; the total number of genes expressed in each category is provided. (A) A two-waycomparison of dry pollen (dry) with 0.5 h PT. (B) The set of 6,677 genes expressed in dry and 0.5 h PT in a 3-way comparison with 4 h PT and SIV PT.(C) Relative percentage of genes with selected GO terms that were significantly overrepresented in sectors 1–4 in Figure 2B. The number above eachcolumn denotes the cumulative number of genes detected for a particular GO term in the four sectors (also see Materials and Methods). (D) The set of7,025 genes expressed in dry, 0.5 h PT, and 4 h PT in a 3-way comparison with the set of genes expressed in any of the seven sporophytic tissuesanalyzed (sporophyte) and SIV PT. (E) A 4-way comparison among the pollen samples of 2,040 pollen-enriched genes that were not expressed in anyof the seven sporophytic tissues analyzed. (F) Number of genes with selected GO terms that were significantly overrepresented in the genes that areup or down regulated significantly in SIV PT compared to dry pollen or 4 h PT (Table S14 and Table S15).doi:10.1371/journal.pgen.1000621.g002
Functional Genomics of Pollen Tube Growth
PLoS Genetics | www.plosgenetics.org 4 August 2009 | Volume 5 | Issue 8 | e1000621

when compared with 4 h PT (sector S2, Figure 2B) and SIV PT(sector S3, Figure 2B) identified 5,312 genes (sector S4, Figure 2B)shared by all pollen samples, representing a core set of pollengenes. Previously characterized pollen and pollen tube-expressedgenes known to be critical for pollen tube growth such as the ROP1GTPase (At3g51300, [30]), AtGEF12 (At1g79860, [31]), RabA4d(At3g12160, [32]), ACA9 (At3g21180, [33]), CNGC18 (At5g14870,[34]), the VANGUARD pectinesterase (At3g621790, [35]), andAtMGD2 and AtMGD3 (At5g20410 and At2g11810, [36]) wereexpressed in the SIV PT, 4 h PT, 0.5 h PT and dry pollentranscriptomes (Table S5).Gene Ontology (GO) term enrichment analysis of the three
sectors (S1–S3) also revealed that certain GO term categories areoverrepresented in all pollen conditions relative to the wholegenome (first 15 GO categories, Figure 2C). The two pollen tubetranscriptomes shared 273 genes not found in [dry pollen, 0.5 h PT](S1, Figure 2B). GO term category overrepresentation analysis alsohighlighted the overlap between the 4 h PT and SIV PTtranscriptomes: genes encoding kinases, antiporters, nucleosidetriphosphatases, calcium ion binding proteins, and nucleic acidbinding proteins are overrepresented in 4 h PT and SIV PT but notin dry pollen and 0.5 h PT (Figure 2C). Interestingly, the number ofgenes detected only in SIV PT (1,254) was significantly higher thanthe number of genes detected only in 4 h PT (75, Figure 2B). Thesedata suggest that growth through the pistil elicits a significantchange in the pollen tube transcriptome.
A Distinct Set of Genes Define Pollen Tube Growth InVitro and in a PistilWe next explored the overlap in expression between sporo-
phytic tissues (expressed in any of seven sporophytic samplesanalyzed), SIV PT, and all other pollen conditions (Figure 2D).Notably, SIV PT and sporophytic tissues share a set of 871 genesthat are not expressed in the three other pollen samples analyzed.This analysis also identified 2,040 genes that were expressed inpollen but not sporophytic samples. Among these 2,040 genes,1,097 are shared by all four pollen conditions (Figure 2E). Ouranalysis also identified a set of 507 pollen tube-enriched genes,including the 100 genes that are common to SIV PT and 4 h PT(Figure 2E). Interestingly, SIV PT has the largest number ofunique genes (383) compared to any other pollen condition(Figure 2E and Table S8; referred henceforth as SIV PT-enrichedgenes), further confirming that the SIV PT transcriptome isdistinct from dry pollen or in vitro grown pollen tubes despite theoverlap it shares with these transcriptomes.
Genes with Potential Functions in Signal Transduction,Pollen Tube Growth, and Transcription AreOverrepresented Among SIV PT-Enriched GenesWe determined if any GO terms were significantly overrepre-
sented among the 383 SIV PT-enriched genes (Figure 2D, TableS8) compared to pollen-expressed genes (ATGE_73A-C; [28]).Twenty-one GO terms, including those related to signaling, cellextension and transcription, were significantly overrepresented inthe SIV PT-enriched genes (P value cut off ,0.05, Table 1 andTable S9). The most overrepresented terms in the three GOcategories were transmembrane receptor activity (molecularfunction, n= 4, P= 0.001), defense response (biological process,n = 7, P= 0.003), and intrinsic to membrane (cellular component,n = 4, P= 0.003). There were four genes common to each of thesethree GO categories and all of them belong to the TIR-NBS-LRRreceptor subfamily that is part of a ‘R’ gene superfamily implicatedin pathogen recognition [27]. In addition, a set of protein kinases
(molecular function, n= 4, P = 0.024) was enriched in SIV PT(Table 1, Table S9). These signaling genes may facilitate pollentube perception and response to pistil guidance cues. A set of genesannotated as polygalacturonases, sucrose transporters, and anti-porters are overrepresented in SIV PT compared to pollen(Table 1, Table S9). These categories have been implicated inpollen tube extension [37–42]. Several GO terms related totranscription were also overrepresented in SIV PT-enriched genes(Table 1); they may respond to growth through the pistil andfunction as key regulators of expression of other genes required forpollen tube growth and guidance (Table 2).
A Modest Number of Gene Expression Changes OccurDuring Pollen Hydration and Pollen Tube Growth In VitroWe used a t-test (Materials and Methods) on the RMA-
normalized data (Table S5) to define statistically significantchanges in gene expression during pollen tube growth (Table 2).To minimize false positives, we established two stringent cut-offvalues: only those genes that had a B value (false discovery rate) of3 or higher and a fold change of at least 3 were considered to haveundergone a significant change in expression (Table S5).We analyzed changes that occurred between dry pollen and
0.5 h PT to assess the impact of pollen hydration on geneexpression. This analysis defined a very small number of genes thatincrease (15) or decrease (8) during the hydration process (Table 2,Table S10). To define the changes in transcript levels that occurafter hydration and during pollen tube growth in vitro, wecompared 0.5 h PT and 4 h PT; this time period accounts fornearly all of pollen tube extension observed in vitro (Figure 1). Onehundred thirty-seven genes had significant increases in expressionvalue in this comparison, while no genes were observed to have asignificant decrease (Table 2, Table S11). We also compared drypollen with 4 h PT and identified 186 genes that increase and 11genes that decrease during the entire process of hydration andgrowth in vitro (Table 2, Table S12). These results are alsoconsistent with a recent report that identified modest, butsignificant, changes in the transcriptome of in vitro-grown pollentubes [21].
A Large Number of Gene Expression Changes OccurWhen Pollen Tubes Grow Through Pistil TissuesThe number of genes whose expression was significantly different
between SIV PT and dry pollen (1,578) or between SIV PT and 4 hPT (1,135) was dramatically greater than any other comparisonamong the pollen transcriptomes (Table 2, Table S13, Table S14).We compared SIV PT with 4 h PT and identified a large number ofgenes (900) with significantly higher expression values in SIV PTcompared with 4 h PT. There were also a significant number ofgenes whose expression went down (235) in this comparison (Table 2,Table S13, Table S14). The large number of genes (1,135) that arealtered when pollen tubes grow through pistil tissues are candidatefactors that underlie the physiological and molecular changes inpollen tubes during a successful fertilization event [22–26]. Amongthe altered genes, we identified a set of genes that can best distinguishSIV PT from dry pollen and 4 h PT (Table S15) using the non-hierarchical k-means clustering method ([43]; also see Materials andMethods). These genes could be used as markers for pollen tubes thathave interacted with the pistil.In SIV PT, the up-regulated genes (compared to both dry pollen
and 4 h PT) included the overrepresented molecular function GOcategories of transporter, antiporter, symporter activity andcalcium ion binding. These functions are known to be criticalfor pollen tube growth [39–42]. Interestingly, a different set of
Functional Genomics of Pollen Tube Growth
PLoS Genetics | www.plosgenetics.org 5 August 2009 | Volume 5 | Issue 8 | e1000621
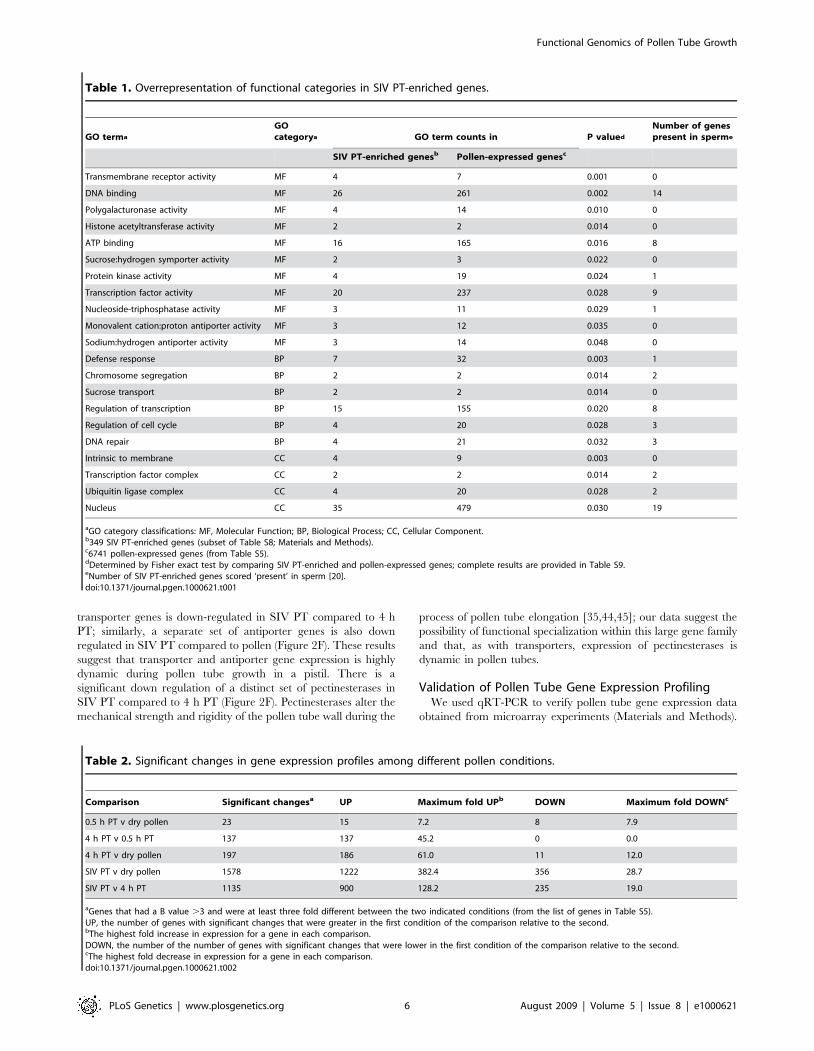
transporter genes is down-regulated in SIV PT compared to 4 hPT; similarly, a separate set of antiporter genes is also downregulated in SIV PT compared to pollen (Figure 2F). These resultssuggest that transporter and antiporter gene expression is highlydynamic during pollen tube growth in a pistil. There is asignificant down regulation of a distinct set of pectinesterases inSIV PT compared to 4 h PT (Figure 2F). Pectinesterases alter themechanical strength and rigidity of the pollen tube wall during the
process of pollen tube elongation [35,44,45]; our data suggest thepossibility of functional specialization within this large gene familyand that, as with transporters, expression of pectinesterases isdynamic in pollen tubes.
Validation of Pollen Tube Gene Expression ProfilingWe used qRT-PCR to verify pollen tube gene expression data
obtained from microarray experiments (Materials and Methods).
Table 2. Significant changes in gene expression profiles among different pollen conditions.
Comparison Significant changesa UP Maximum fold UPb DOWN Maximum fold DOWNc
0.5 h PT v dry pollen 23 15 7.2 8 7.9
4 h PT v 0.5 h PT 137 137 45.2 0 0.0
4 h PT v dry pollen 197 186 61.0 11 12.0
SIV PT v dry pollen 1578 1222 382.4 356 28.7
SIV PT v 4 h PT 1135 900 128.2 235 19.0
aGenes that had a B value .3 and were at least three fold different between the two indicated conditions (from the list of genes in Table S5).UP, the number of genes with significant changes that were greater in the first condition of the comparison relative to the second.bThe highest fold increase in expression for a gene in each comparison.DOWN, the number of the number of genes with significant changes that were lower in the first condition of the comparison relative to the second.cThe highest fold decrease in expression for a gene in each comparison.doi:10.1371/journal.pgen.1000621.t002
Table 1. Overrepresentation of functional categories in SIV PT-enriched genes.
GO terma
GOcategorya GO term counts in P valued
Number of genespresent in sperme
SIV PT-enriched genesb Pollen-expressed genesc
Transmembrane receptor activity MF 4 7 0.001 0
DNA binding MF 26 261 0.002 14
Polygalacturonase activity MF 4 14 0.010 0
Histone acetyltransferase activity MF 2 2 0.014 0
ATP binding MF 16 165 0.016 8
Sucrose:hydrogen symporter activity MF 2 3 0.022 0
Protein kinase activity MF 4 19 0.024 1
Transcription factor activity MF 20 237 0.028 9
Nucleoside-triphosphatase activity MF 3 11 0.029 1
Monovalent cation:proton antiporter activity MF 3 12 0.035 0
Sodium:hydrogen antiporter activity MF 3 14 0.048 0
Defense response BP 7 32 0.003 1
Chromosome segregation BP 2 2 0.014 2
Sucrose transport BP 2 2 0.014 0
Regulation of transcription BP 15 155 0.020 8
Regulation of cell cycle BP 4 20 0.028 3
DNA repair BP 4 21 0.032 3
Intrinsic to membrane CC 4 9 0.003 0
Transcription factor complex CC 2 2 0.014 2
Ubiquitin ligase complex CC 4 20 0.028 2
Nucleus CC 35 479 0.030 19
aGO category classifications: MF, Molecular Function; BP, Biological Process; CC, Cellular Component.b349 SIV PT-enriched genes (subset of Table S8; Materials and Methods).c6741 pollen-expressed genes (from Table S5).dDetermined by Fisher exact test by comparing SIV PT-enriched and pollen-expressed genes; complete results are provided in Table S9.eNumber of SIV PT-enriched genes scored ‘present’ in sperm [20].doi:10.1371/journal.pgen.1000621.t001
Functional Genomics of Pollen Tube Growth
PLoS Genetics | www.plosgenetics.org 6 August 2009 | Volume 5 | Issue 8 | e1000621
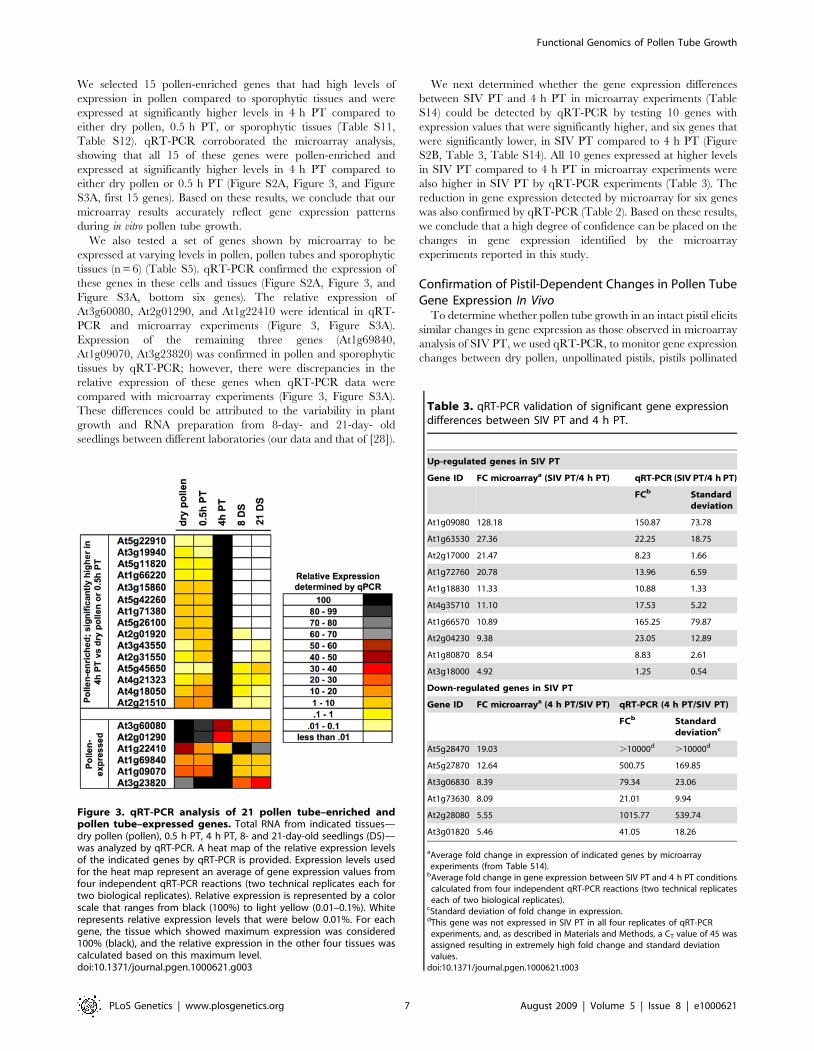
We selected 15 pollen-enriched genes that had high levels ofexpression in pollen compared to sporophytic tissues and wereexpressed at significantly higher levels in 4 h PT compared toeither dry pollen, 0.5 h PT, or sporophytic tissues (Table S11,Table S12). qRT-PCR corroborated the microarray analysis,showing that all 15 of these genes were pollen-enriched andexpressed at significantly higher levels in 4 h PT compared toeither dry pollen or 0.5 h PT (Figure S2A, Figure 3, and FigureS3A, first 15 genes). Based on these results, we conclude that ourmicroarray results accurately reflect gene expression patternsduring in vitro pollen tube growth.We also tested a set of genes shown by microarray to be
expressed at varying levels in pollen, pollen tubes and sporophytictissues (n = 6) (Table S5). qRT-PCR confirmed the expression ofthese genes in these cells and tissues (Figure S2A, Figure 3, andFigure S3A, bottom six genes). The relative expression ofAt3g60080, At2g01290, and At1g22410 were identical in qRT-PCR and microarray experiments (Figure 3, Figure S3A).Expression of the remaining three genes (At1g69840,At1g09070, At3g23820) was confirmed in pollen and sporophytictissues by qRT-PCR; however, there were discrepancies in therelative expression of these genes when qRT-PCR data werecompared with microarray experiments (Figure 3, Figure S3A).These differences could be attributed to the variability in plantgrowth and RNA preparation from 8-day- and 21-day- oldseedlings between different laboratories (our data and that of [28]).
We next determined whether the gene expression differencesbetween SIV PT and 4 h PT in microarray experiments (TableS14) could be detected by qRT-PCR by testing 10 genes withexpression values that were significantly higher, and six genes thatwere significantly lower, in SIV PT compared to 4 h PT (FigureS2B, Table 3, Table S14). All 10 genes expressed at higher levelsin SIV PT compared to 4 h PT in microarray experiments werealso higher in SIV PT by qRT-PCR experiments (Table 3). Thereduction in gene expression detected by microarray for six geneswas also confirmed by qRT-PCR (Table 2). Based on these results,we conclude that a high degree of confidence can be placed on thechanges in gene expression identified by the microarrayexperiments reported in this study.
Confirmation of Pistil-Dependent Changes in Pollen TubeGene Expression In VivoTo determine whether pollen tube growth in an intact pistil elicits
similar changes in gene expression as those observed in microarrayanalysis of SIV PT, we used qRT-PCR, to monitor gene expressionchanges between dry pollen, unpollinated pistils, pistils pollinated
Figure 3. qRT-PCR analysis of 21 pollen tube–enriched andpollen tube–expressed genes. Total RNA from indicated tissues—dry pollen (pollen), 0.5 h PT, 4 h PT, 8- and 21-day-old seedlings (DS)—was analyzed by qRT-PCR. A heat map of the relative expression levelsof the indicated genes by qRT-PCR is provided. Expression levels usedfor the heat map represent an average of gene expression values fromfour independent qRT-PCR reactions (two technical replicates each fortwo biological replicates). Relative expression is represented by a colorscale that ranges from black (100%) to light yellow (0.01–0.1%). Whiterepresents relative expression levels that were below 0.01%. For eachgene, the tissue which showed maximum expression was considered100% (black), and the relative expression in the other four tissues wascalculated based on this maximum level.doi:10.1371/journal.pgen.1000621.g003
Table 3. qRT-PCR validation of significant gene expressiondifferences between SIV PT and 4 h PT.
Up-regulated genes in SIV PT
Gene ID FC microarraya (SIV PT/4 h PT) qRT-PCR (SIV PT/4 h PT)
FCb Standarddeviation
At1g09080 128.18 150.87 73.78
At1g63530 27.36 22.25 18.75
At2g17000 21.47 8.23 1.66
At1g72760 20.78 13.96 6.59
At1g18830 11.33 10.88 1.33
At4g35710 11.10 17.53 5.22
At1g66570 10.89 165.25 79.87
At2g04230 9.38 23.05 12.89
At1g80870 8.54 8.83 2.61
At3g18000 4.92 1.25 0.54
Down-regulated genes in SIV PT
Gene ID FC microarraya (4 h PT/SIV PT) qRT-PCR (4 h PT/SIV PT)
FCb Standarddeviationc
At5g28470 19.03 .10000d .10000d
At5g27870 12.64 500.75 169.85
At3g06830 8.39 79.34 23.06
At1g73630 8.09 21.01 9.94
At2g28080 5.55 1015.77 539.74
At3g01820 5.46 41.05 18.26
aAverage fold change in expression of indicated genes by microarrayexperiments (from Table S14).bAverage fold change in gene expression between SIV PT and 4 h PT conditionscalculated from four independent qRT-PCR reactions (two technical replicateseach of two biological replicates).
cStandard deviation of fold change in expression.dThis gene was not expressed in SIV PT in all four replicates of qRT-PCRexperiments, and, as described in Materials and Methods, a CT value of 45 wasassigned resulting in extremely high fold change and standard deviationvalues.doi:10.1371/journal.pgen.1000621.t003
Functional Genomics of Pollen Tube Growth
PLoS Genetics | www.plosgenetics.org 7 August 2009 | Volume 5 | Issue 8 | e1000621
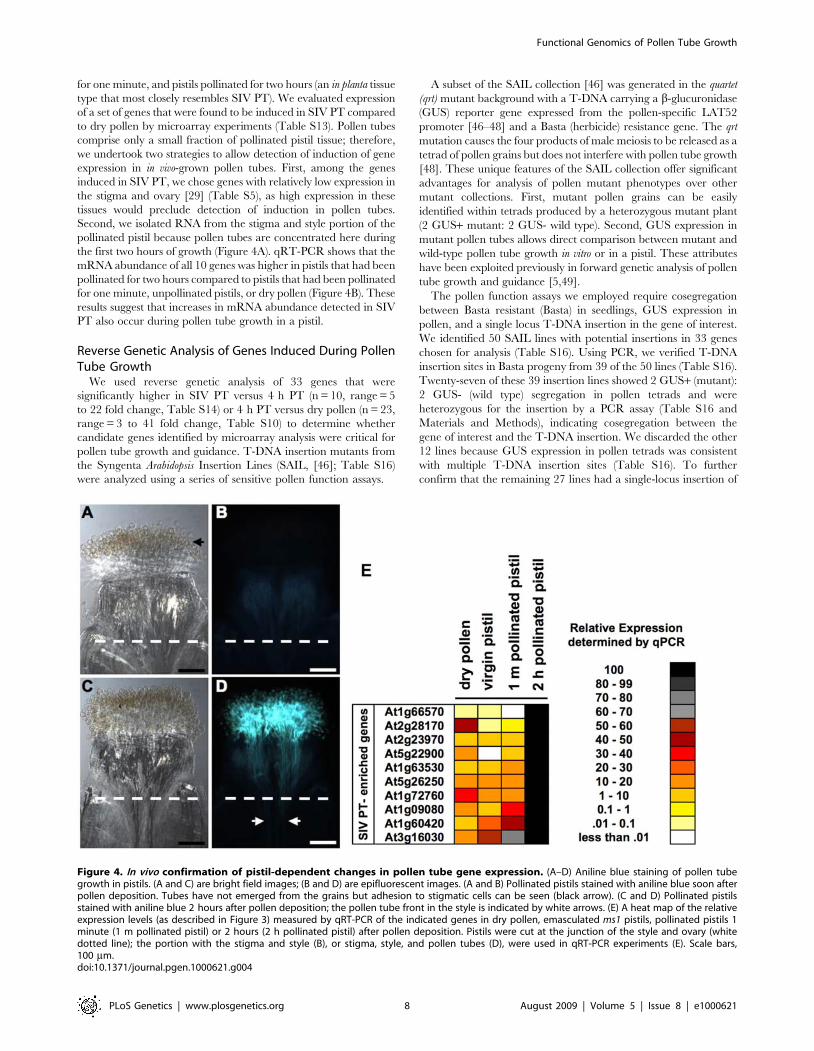
for one minute, and pistils pollinated for two hours (an in planta tissuetype that most closely resembles SIV PT). We evaluated expressionof a set of genes that were found to be induced in SIV PT comparedto dry pollen by microarray experiments (Table S13). Pollen tubescomprise only a small fraction of pollinated pistil tissue; therefore,we undertook two strategies to allow detection of induction of geneexpression in in vivo-grown pollen tubes. First, among the genesinduced in SIV PT, we chose genes with relatively low expression inthe stigma and ovary [29] (Table S5), as high expression in thesetissues would preclude detection of induction in pollen tubes.Second, we isolated RNA from the stigma and style portion of thepollinated pistil because pollen tubes are concentrated here duringthe first two hours of growth (Figure 4A). qRT-PCR shows that themRNA abundance of all 10 genes was higher in pistils that had beenpollinated for two hours compared to pistils that had been pollinatedfor one minute, unpollinated pistils, or dry pollen (Figure 4B). Theseresults suggest that increases in mRNA abundance detected in SIVPT also occur during pollen tube growth in a pistil.
Reverse Genetic Analysis of Genes Induced During PollenTube GrowthWe used reverse genetic analysis of 33 genes that were
significantly higher in SIV PT versus 4 h PT (n = 10, range= 5to 22 fold change, Table S14) or 4 h PT versus dry pollen (n = 23,range = 3 to 41 fold change, Table S10) to determine whethercandidate genes identified by microarray analysis were critical forpollen tube growth and guidance. T-DNA insertion mutants fromthe Syngenta Arabidopsis Insertion Lines (SAIL, [46]; Table S16)were analyzed using a series of sensitive pollen function assays.
A subset of the SAIL collection [46] was generated in the quartet(qrt) mutant background with a T-DNA carrying a b-glucuronidase(GUS) reporter gene expressed from the pollen-specific LAT52promoter [46–48] and a Basta (herbicide) resistance gene. The qrtmutation causes the four products of male meiosis to be released as atetrad of pollen grains but does not interfere with pollen tube growth[48]. These unique features of the SAIL collection offer significantadvantages for analysis of pollen mutant phenotypes over othermutant collections. First, mutant pollen grains can be easilyidentified within tetrads produced by a heterozygous mutant plant(2 GUS+ mutant: 2 GUS- wild type). Second, GUS expression inmutant pollen tubes allows direct comparison between mutant andwild-type pollen tube growth in vitro or in a pistil. These attributeshave been exploited previously in forward genetic analysis of pollentube growth and guidance [5,49].The pollen function assays we employed require cosegregation
between Basta resistant (Basta) in seedlings, GUS expression inpollen, and a single locus T-DNA insertion in the gene of interest.We identified 50 SAIL lines with potential insertions in 33 geneschosen for analysis (Table S16). Using PCR, we verified T-DNAinsertion sites in Basta progeny from 39 of the 50 lines (Table S16).Twenty-seven of these 39 insertion lines showed 2 GUS+ (mutant):2 GUS- (wild type) segregation in pollen tetrads and wereheterozygous for the insertion by a PCR assay (Table S16 andMaterials and Methods), indicating cosegregation between thegene of interest and the T-DNA insertion. We discarded the other12 lines because GUS expression in pollen tetrads was consistentwith multiple T-DNA insertion sites (Table S16). To furtherconfirm that the remaining 27 lines had a single-locus insertion of
Figure 4. In vivo confirmation of pistil-dependent changes in pollen tube gene expression. (A–D) Aniline blue staining of pollen tubegrowth in pistils. (A and C) are bright field images; (B and D) are epifluorescent images. (A and B) Pollinated pistils stained with aniline blue soon afterpollen deposition. Tubes have not emerged from the grains but adhesion to stigmatic cells can be seen (black arrow). (C and D) Pollinated pistilsstained with aniline blue 2 hours after pollen deposition; the pollen tube front in the style is indicated by white arrows. (E) A heat map of the relativeexpression levels (as described in Figure 3) measured by qRT-PCR of the indicated genes in dry pollen, emasculated ms1 pistils, pollinated pistils 1minute (1 m pollinated pistil) or 2 hours (2 h pollinated pistil) after pollen deposition. Pistils were cut at the junction of the style and ovary (whitedotted line); the portion with the stigma and style (B), or stigma, style, and pollen tubes (D), were used in qRT-PCR experiments (E). Scale bars,100 mm.doi:10.1371/journal.pgen.1000621.g004
Functional Genomics of Pollen Tube Growth
PLoS Genetics | www.plosgenetics.org 8 August 2009 | Volume 5 | Issue 8 | e1000621

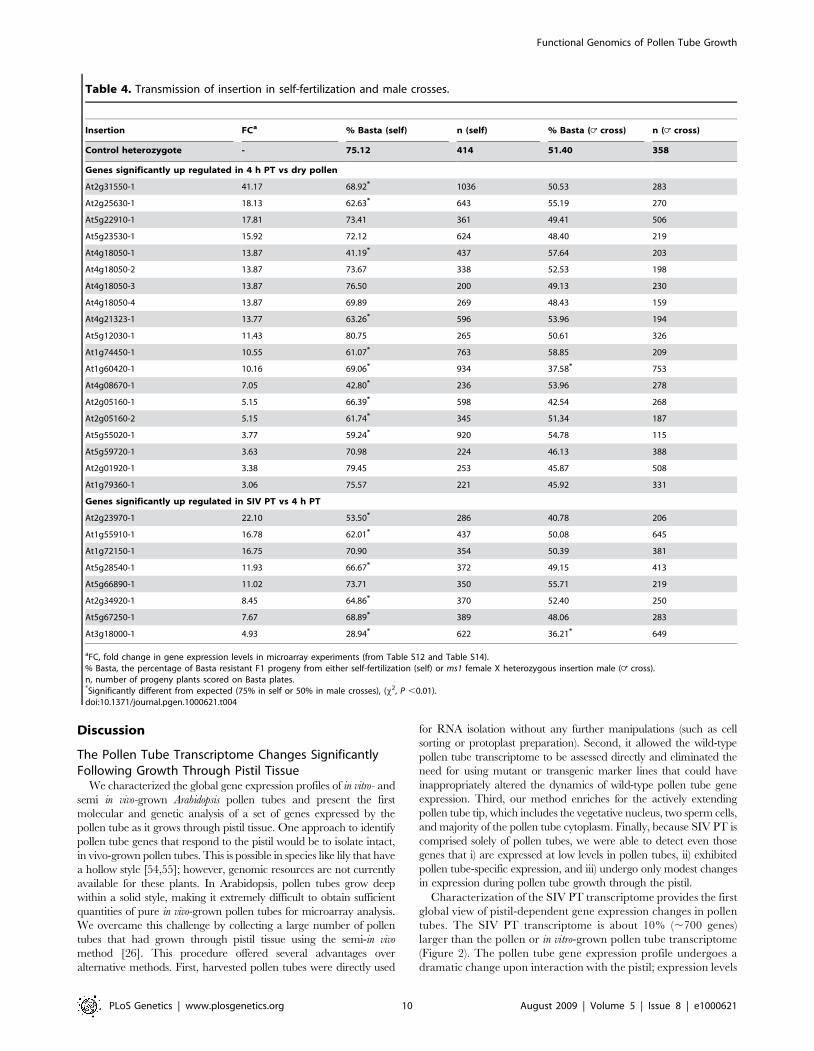
the T-DNA, we analyzed the segregation of Basta among theprogeny of a self-fertilized heterozygous plant (2:2 GUS+: GUS-tetrads, heterozygous by PCR assay). Plants heterozygous for asingle insertion site are expected to generate 75% Basta progeny(3:1 segregation of dominant marker). However, if the insertiondisrupts a gene required for male/female gametophyte function, orseed development, the fraction of Basta progeny will besignificantly reduced [50]. We found that the percentage of Bastaprogeny was ,75% or significantly lower in all 27 lines,confirming that they had a single T-DNA insertion site andindicating that several (16/27) may disrupt the male and/orfemale gametophyte or seed development (Table 4).
At1g60420-1 and At3g18000-1 Reduce TransmissionThrough PollenMutations that completely disrupt pollen function are not
transmitted to progeny through pollen, while milder defectsreduce, but do not eliminate transmission [49]. To focus ontransmission of the T-DNA through pollen, we pollinated malesterile 1 (ms1) pistils with heterozygous pollen from 27 single-locusT-DNA insertion lines and determined the percentage of Bastaplants in the progeny (Table 4). Any significant deviation from50% in this assay indicates that mutant pollen is less likely tofertilize ovules than wild-type pollen. We found that progeny fromtwo of the insertion lines, one in a 4 h PT-induced gene(At1g60420) and another in a SIV PT-induced gene(At3g18000) yielded significantly fewer than the expected 50%Basta plants (Table 4) indicating that these genes are critical forpollen function in the pistil.At1g60420 encodes an uncharacterized protein with thiore-
doxin and C1-like domains. C1 domains have been shown to binddiacylglycerol and phorbol esters and are implicated in lipidsignaling in mammals [51]. At3g18000 (XIPOTL) encodes one ofthree Arabidopsis S-adenosyl-L-methionine: phosphoethanolamineN-methyltransferase (PEAMT) required for synthesis of phospha-tidylcholine, a major membrane lipid and the precursor ofphosphatidic acid, an important lipid signaling molecule [52].Since the proteins encoded by these two genes may be involved ingeneration of lipid signaling molecules, the in vivo transmissiondefects of insertions in these genes point to a potential role for lipidsignaling in pollen tube growth through the pistil.
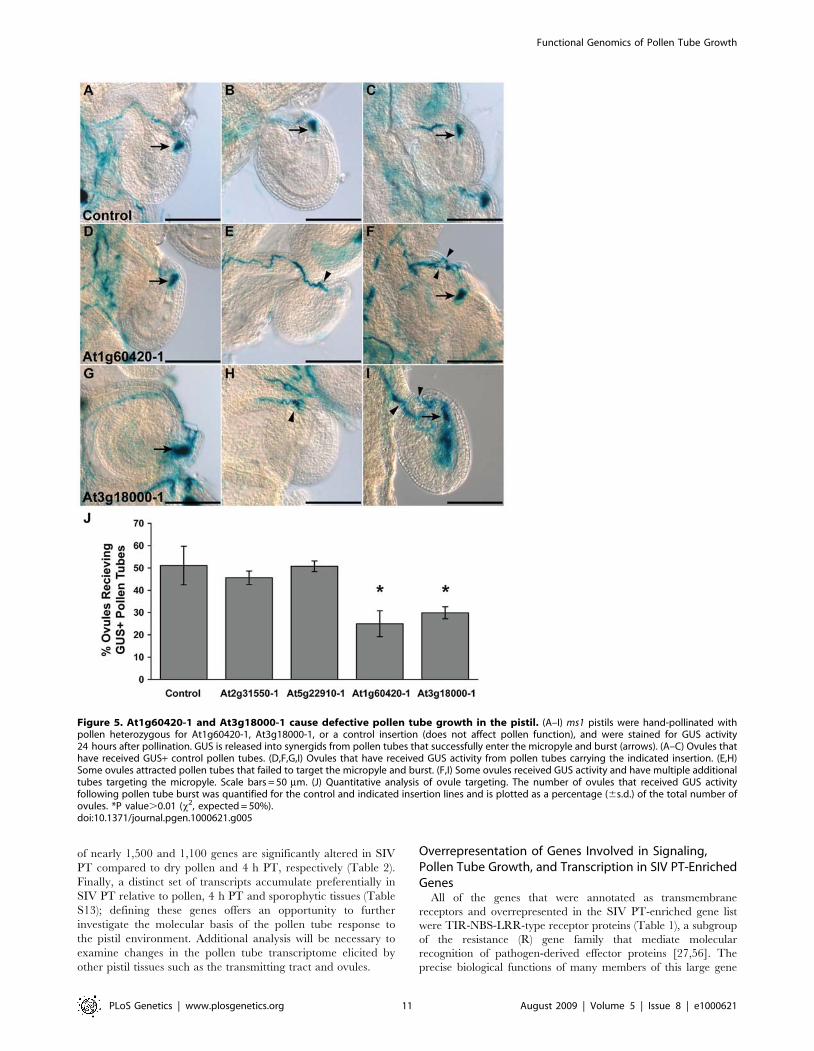
At1g60420-1 and At3g18000-1 Cause Defective PollenTube Growth in the PistilTo analyze the growth behavior of At1g60420-1 and At3g18000-
1 pollen tubes in vivo and determine the specific stage of pollen tubegrowth disrupted by these insertions, we pollinated ms1 pistils withheterozygous pollen and stained for GUS activity 24 hours later[5,49]. When ms1 pistils were pollinated with heterozygous controlpollen, GUS+ pollen tubes germinated, penetrated the stigmaticpapillae, grew through the style, entered the ovary through thetransmitting tract, and migrated toward an ovule. After entering themicropyle, GUS+ pollen tubes burst, releasing an aggregate of GUSactivity in the micropylar end of the ovule serving as a convenientmarker for successful ovule targeting by a pollen tube (Figure 5A–5C). In this assay, ,50% of ovules were targeted by GUS+ pollentubes from the heterozygous control line (Figure 5J; [5]). When ms1pistils were pollinated with heterozygous At2g31550-1 orAt5g22910-1 pollen (insertions that did not affect mutant alleletransmission through pollen, Table 4) the germination and growthof the GUS+ tubes in stigma, style and transmitting tract wasnormal (data not shown) and nearly 50% of the ovules were targetedby GUS+ pollen tubes (Figure 5J). However, when ms1 pistils were
pollinated with heterozygous At1g60420-1 or At3g18000-1 pollen,GUS+ pollen tubes were only half as efficient in targeting ovules asthe GUS- tubes (Figure 5D, 5G, 5J). These results are consistentwith the reduction in mutant allele transmission in At1g60420-1 andAt3g18000-1 insertion lines (Table 4).In addition to a significant reduction in the ability to target
ovules, At1g60420-1 and At3g18000-1 GUS+ pollen tubesexhibited an increased frequency of abnormal pollen tubebehaviors. Unlike in control crosses (ms1 ovules with GUS+ pollentubes from control heterozygotes, 0%, n= 182), a noticeablefraction of ms1 ovules had At1g60420-1 or At3g18000-1 GUS+pollen tubes that approached, but did not enter, the ovule micropyle(Figure 5F, 5I; At1g60420-1, 8.33%, n= 204; At3g18000-1, 5.49%,n= 164). For a small number of ovules, pollen tubes grew towardsthe chalazal end, instead of the micropylar end, of the ovule (notshown; At1g60420-1, 1.22%, n= 204; At3g18000-1, 1.96%,n= 164; control, 0%, n= 182). Finally, ovules that attractedmultiple GUS+ At1g60420-1 or At3g18000-1 pollen tubes wereobserved (Figure 5E, 5H; At1g60420-1, 1.83%, n= 204;At3g18000-1, 3.43%, n= 164; control, 0%, n= 182).
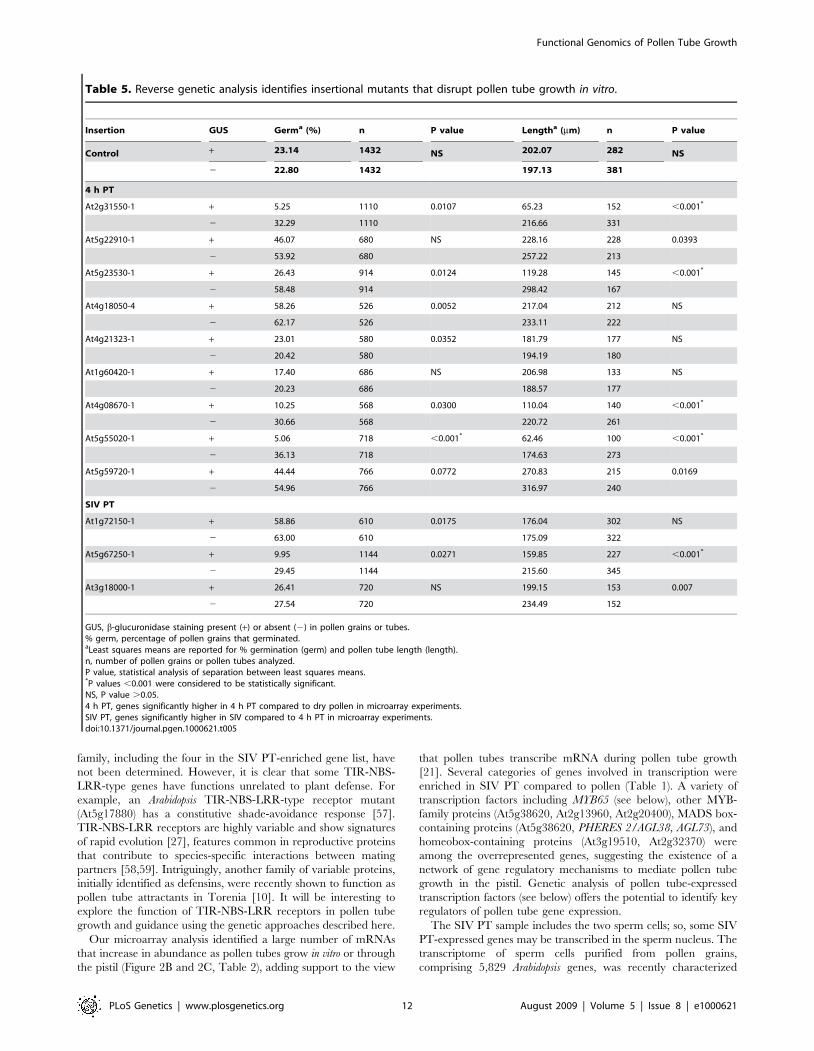
Five Insertions Disrupt Pollen Tube Growth In VitroWe wanted to determine whether At1g60420-1 or At3g18000-
1, insertions that disrupt pollen tube growth in the pistil, hadinherent defects in pollen tube extension. We also wanted toexamine if other single-locus insertion lines had subtle defects inthe ability of pollen grains to form and extend a polar tube thatmay have been masked by growth in the pistil. In vitro pollengermination and tube growth provides a sensitive and direct assayfor pollen function that is independent of pistil tissue. We assayedin vitro pollen tube germination and growth for the 27 single-locusinsertion lines. We used heterozygous pollen so that we couldanalyze mutant pollen (GUS+, blue) alongside wild-type pollen(GUS-, white) after staining for GUS activity. This side-by-sidecomparison between mutant and wild type is critical because itprovides an internal control for the inter-experiment variability ofpollen tube growth in vitro [53]. GUS staining in pollen tubes wasdark enough to clearly distinguish mutant from wild type in 12lines (Table 5, Figure S4).We analyzed at least three replicates of all in vitro pollen
germination and tube length experiments using statistical methodsthat account for variation between and within experiments and seta stringent criterion for statistical significance at P,0.001. In vitropollen germination rates and tube lengths were similar for GUS+and GUS- pollen from heterozygous control plants (Table 5,Figure S4). Although At1g60420-1 and At3g18000-1 weretransmitted through the pollen with significantly reduced frequen-cies (Table 4) and were less likely to target ovules (Figure 5), theseinsertions did not affect tube growth in vitro (Table 5, Figure S4).These results indicate that the in vivo transmission defect in theseinsertion lines cannot be due to an inherent defect in pollen tubeextension and is likely caused by loss of functions specificallyrequired to navigate the pistil environment.The lengths of GUS+ pollen tubes were significantly shorter
(P,0.001) than GUS- pollen tubes for insertions in At2g31550(GDSL-motif lipase/hydrolase family protein), At5g23530 (car-boxyesterase 18), At4g08670 (similar to lipid transfer proteins),At5g67250 (an SCF-type F-box and leucine rich repeat-containingE3 ubiquitin ligase), and At5g55020 (MYB120, Table 5, FigureS4). Of the 12 lines we analyzed, only the insertion in MYB120(At5g55020-1) also caused a significant defect (P,0.001) in pollentube germination (Table 5, Figure S4). These results indicate thatinsertions in five genes resulted in pollen tube growth defects thatwere only detectable in vitro.
Functional Genomics of Pollen Tube Growth
PLoS Genetics | www.plosgenetics.org 9 August 2009 | Volume 5 | Issue 8 | e1000621
Discussion
The Pollen Tube Transcriptome Changes SignificantlyFollowing Growth Through Pistil TissueWe characterized the global gene expression profiles of in vitro- and
semi in vivo-grown Arabidopsis pollen tubes and present the firstmolecular and genetic analysis of a set of genes expressed by thepollen tube as it grows through pistil tissue. One approach to identifypollen tube genes that respond to the pistil would be to isolate intact,in vivo-grown pollen tubes. This is possible in species like lily that havea hollow style [54,55]; however, genomic resources are not currentlyavailable for these plants. In Arabidopsis, pollen tubes grow deepwithin a solid style, making it extremely difficult to obtain sufficientquantities of pure in vivo-grown pollen tubes for microarray analysis.We overcame this challenge by collecting a large number of pollentubes that had grown through pistil tissue using the semi-in vivomethod [26]. This procedure offered several advantages overalternative methods. First, harvested pollen tubes were directly used
for RNA isolation without any further manipulations (such as cellsorting or protoplast preparation). Second, it allowed the wild-typepollen tube transcriptome to be assessed directly and eliminated theneed for using mutant or transgenic marker lines that could haveinappropriately altered the dynamics of wild-type pollen tube geneexpression. Third, our method enriches for the actively extendingpollen tube tip, which includes the vegetative nucleus, two sperm cells,and majority of the pollen tube cytoplasm. Finally, because SIV PT iscomprised solely of pollen tubes, we were able to detect even thosegenes that i) are expressed at low levels in pollen tubes, ii) exhibitedpollen tube-specific expression, and iii) undergo only modest changesin expression during pollen tube growth through the pistil.Characterization of the SIV PT transcriptome provides the first
global view of pistil-dependent gene expression changes in pollentubes. The SIV PT transcriptome is about 10% (,700 genes)larger than the pollen or in vitro-grown pollen tube transcriptome(Figure 2). The pollen tube gene expression profile undergoes adramatic change upon interaction with the pistil; expression levels
Table 4. Transmission of insertion in self-fertilization and male crosses.
Insertion FCa % Basta (self) n (self) % Basta (= cross) n (= cross)
Control heterozygote - 75.12 414 51.40 358
Genes significantly up regulated in 4 h PT vs dry pollen
At2g31550-1 41.17 68.92* 1036 50.53 283
At2g25630-1 18.13 62.63* 643 55.19 270
At5g22910-1 17.81 73.41 361 49.41 506
At5g23530-1 15.92 72.12 624 48.40 219
At4g18050-1 13.87 41.19* 437 57.64 203
At4g18050-2 13.87 73.67 338 52.53 198
At4g18050-3 13.87 76.50 200 49.13 230
At4g18050-4 13.87 69.89 269 48.43 159
At4g21323-1 13.77 63.26* 596 53.96 194
At5g12030-1 11.43 80.75 265 50.61 326
At1g74450-1 10.55 61.07* 763 58.85 209
At1g60420-1 10.16 69.06* 934 37.58* 753
At4g08670-1 7.05 42.80* 236 53.96 278
At2g05160-1 5.15 66.39* 598 42.54 268
At2g05160-2 5.15 61.74* 345 51.34 187
At5g55020-1 3.77 59.24* 920 54.78 115
At5g59720-1 3.63 70.98 224 46.13 388
At2g01920-1 3.38 79.45 253 45.87 508
At1g79360-1 3.06 75.57 221 45.92 331
Genes significantly up regulated in SIV PT vs 4 h PT
At2g23970-1 22.10 53.50* 286 40.78 206
At1g55910-1 16.78 62.01* 437 50.08 645
At1g72150-1 16.75 70.90 354 50.39 381
At5g28540-1 11.93 66.67* 372 49.15 413
At5g66890-1 11.02 73.71 350 55.71 219
At2g34920-1 8.45 64.86* 370 52.40 250
At5g67250-1 7.67 68.89* 389 48.06 283
At3g18000-1 4.93 28.94* 622 36.21* 649
aFC, fold change in gene expression levels in microarray experiments (from Table S12 and Table S14).% Basta, the percentage of Basta resistant F1 progeny from either self-fertilization (self) or ms1 female X heterozygous insertion male (= cross).n, number of progeny plants scored on Basta plates.*Significantly different from expected (75% in self or 50% in male crosses), (x2, P ,0.01).doi:10.1371/journal.pgen.1000621.t004
Functional Genomics of Pollen Tube Growth
PLoS Genetics | www.plosgenetics.org 10 August 2009 | Volume 5 | Issue 8 | e1000621
of nearly 1,500 and 1,100 genes are significantly altered in SIVPT compared to dry pollen and 4 h PT, respectively (Table 2).Finally, a distinct set of transcripts accumulate preferentially inSIV PT relative to pollen, 4 h PT and sporophytic tissues (TableS13); defining these genes offers an opportunity to furtherinvestigate the molecular basis of the pollen tube response tothe pistil environment. Additional analysis will be necessary toexamine changes in the pollen tube transcriptome elicited byother pistil tissues such as the transmitting tract and ovules.
Overrepresentation of Genes Involved in Signaling,Pollen Tube Growth, and Transcription in SIV PT-EnrichedGenesAll of the genes that were annotated as transmembrane
receptors and overrepresented in the SIV PT-enriched gene listwere TIR-NBS-LRR-type receptor proteins (Table 1), a subgroupof the resistance (R) gene family that mediate molecularrecognition of pathogen-derived effector proteins [27,56]. Theprecise biological functions of many members of this large gene
Figure 5. At1g60420-1 and At3g18000-1 cause defective pollen tube growth in the pistil. (A–I) ms1 pistils were hand-pollinated withpollen heterozygous for At1g60420-1, At3g18000-1, or a control insertion (does not affect pollen function), and were stained for GUS activity24 hours after pollination. GUS is released into synergids from pollen tubes that successfully enter the micropyle and burst (arrows). (A–C) Ovules thathave received GUS+ control pollen tubes. (D,F,G,I) Ovules that have received GUS activity from pollen tubes carrying the indicated insertion. (E,H)Some ovules attracted pollen tubes that failed to target the micropyle and burst. (F,I) Some ovules received GUS activity and have multiple additionaltubes targeting the micropyle. Scale bars = 50 mm. (J) Quantitative analysis of ovule targeting. The number of ovules that received GUS activityfollowing pollen tube burst was quantified for the control and indicated insertion lines and is plotted as a percentage (6s.d.) of the total number ofovules. *P value.0.01 (x2, expected= 50%).doi:10.1371/journal.pgen.1000621.g005
Functional Genomics of Pollen Tube Growth
PLoS Genetics | www.plosgenetics.org 11 August 2009 | Volume 5 | Issue 8 | e1000621
family, including the four in the SIV PT-enriched gene list, havenot been determined. However, it is clear that some TIR-NBS-LRR-type genes have functions unrelated to plant defense. Forexample, an Arabidopsis TIR-NBS-LRR-type receptor mutant(At5g17880) has a constitutive shade-avoidance response [57].TIR-NBS-LRR receptors are highly variable and show signaturesof rapid evolution [27], features common in reproductive proteinsthat contribute to species-specific interactions between matingpartners [58,59]. Intriguingly, another family of variable proteins,initially identified as defensins, were recently shown to function aspollen tube attractants in Torenia [10]. It will be interesting toexplore the function of TIR-NBS-LRR receptors in pollen tubegrowth and guidance using the genetic approaches described here.Our microarray analysis identified a large number of mRNAs
that increase in abundance as pollen tubes grow in vitro or throughthe pistil (Figure 2B and 2C, Table 2), adding support to the view
that pollen tubes transcribe mRNA during pollen tube growth[21]. Several categories of genes involved in transcription wereenriched in SIV PT compared to pollen (Table 1). A variety oftranscription factors including MYB65 (see below), other MYB-family proteins (At5g38620, At2g13960, At2g20400), MADS box-containing proteins (At5g38620, PHERES 2/AGL38, AGL73), andhomeobox-containing proteins (At3g19510, At2g32370) wereamong the overrepresented genes, suggesting the existence of anetwork of gene regulatory mechanisms to mediate pollen tubegrowth in the pistil. Genetic analysis of pollen tube-expressedtranscription factors (see below) offers the potential to identify keyregulators of pollen tube gene expression.The SIV PT sample includes the two sperm cells; so, some SIV
PT-expressed genes may be transcribed in the sperm nucleus. Thetranscriptome of sperm cells purified from pollen grains,comprising 5,829 Arabidopsis genes, was recently characterized
Table 5. Reverse genetic analysis identifies insertional mutants that disrupt pollen tube growth in vitro.
Insertion GUS Germa (%) n P value Lengtha (mm) n P value
Control + 23.14 1432 NS 202.07 282 NS
2 22.80 1432 197.13 381
4 h PT
At2g31550-1 + 5.25 1110 0.0107 65.23 152 ,0.001*
2 32.29 1110 216.66 331
At5g22910-1 + 46.07 680 NS 228.16 228 0.0393
2 53.92 680 257.22 213
At5g23530-1 + 26.43 914 0.0124 119.28 145 ,0.001*
2 58.48 914 298.42 167
At4g18050-4 + 58.26 526 0.0052 217.04 212 NS
2 62.17 526 233.11 222
At4g21323-1 + 23.01 580 0.0352 181.79 177 NS
2 20.42 580 194.19 180
At1g60420-1 + 17.40 686 NS 206.98 133 NS
2 20.23 686 188.57 177
At4g08670-1 + 10.25 568 0.0300 110.04 140 ,0.001*
2 30.66 568 220.72 261
At5g55020-1 + 5.06 718 ,0.001* 62.46 100 ,0.001*
2 36.13 718 174.63 273
At5g59720-1 + 44.44 766 0.0772 270.83 215 0.0169
2 54.96 766 316.97 240
SIV PT
At1g72150-1 + 58.86 610 0.0175 176.04 302 NS
2 63.00 610 175.09 322
At5g67250-1 + 9.95 1144 0.0271 159.85 227 ,0.001*
2 29.45 1144 215.60 345
At3g18000-1 + 26.41 720 NS 199.15 153 0.007
2 27.54 720 234.49 152
GUS, b-glucuronidase staining present (+) or absent (2) in pollen grains or tubes.% germ, percentage of pollen grains that germinated.aLeast squares means are reported for % germination (germ) and pollen tube length (length).n, number of pollen grains or pollen tubes analyzed.P value, statistical analysis of separation between least squares means.*P values ,0.001 were considered to be statistically significant.NS, P value .0.05.4 h PT, genes significantly higher in 4 h PT compared to dry pollen in microarray experiments.SIV PT, genes significantly higher in SIV compared to 4 h PT in microarray experiments.doi:10.1371/journal.pgen.1000621.t005
Functional Genomics of Pollen Tube Growth
PLoS Genetics | www.plosgenetics.org 12 August 2009 | Volume 5 | Issue 8 | e1000621
[20]. We examined the overlap between SIV PT-enriched genesand genes called ‘present’ in sperm and found that 161 of the 383SIV PT-enriched genes (43%) are expressed in sperm (Table 1,Table S7). Genes overrepresented in SIV PT, but not detected insperm, include those potentially important for signaling (trans-membrane receptor activity, Table 1), transcription (histoneacetyltransferase activity, Table 1) and pollen tube growth(polygalacturonase, sucrose transport and antiporter activity,Table 1). Genes proposed to be involved in DNA repair,chromosome segregation, and cell cycle regulation (Table 1) wereoverrepresented in SIV PT-enriched genes; all of these genes arepresent in sperm (Table 1, Table S8) [20]. The pollen tube nuclearDNA (vegetative nucleus) does not replicate during pollen tubegrowth; however, sperm complete a round of DNA synthesisduring pollen tube growth in the pistil [60]. This group of genes,identified in the SIV PT transcriptome, is therefore likelyexpressed in sperm as the pollen tube is growing through thepistil and function in sperm DNA synthesis.
Microarray-Directed Reverse Genetic Analysis of PollenTube GrowthOne of the goals of this study was to assess the extent to which
microarray analysis identifies genes that are critical for pollenfunction. We identified single-insertion-locus T-DNA lines andemployed four highly sensitive assays to determine loss-of-functionphenotypes in pollen. Insertions in two genes (At3g18000,At1g60420) affected mutant allele transmission through pollenand disrupted pollen tube growth and guidance in vivo. Insertionsin five additional genes (At2g31550, At4g08670, At5g23530,At5g55020, At5g67250) caused pollen tube growth defects in vitro.A previous forward genetic screen yielded ,30 mutants thatdisrupt pollen function from a population of ,10,000 T-DNAinsertion lines (0.3%, [49]). In this study, by starting with apopulation of 50 T-DNA insertions in genes induced during pollentube growth, we identified seven mutations that disrupt pollen tubegrowth in vitro or in the pistil (14%); this amounts to a ,45 foldenrichment in identification of functionally significant genes overthe forward genetic screen.We ascribed loss-of-function mutant phenotypes to seven
Arabidopsis genes not previously implicated in pollen tube growth(Figure S3B). Five of these genes (At2g31550, At4g08670,At5g23530, At5g55020, At1g60420) were not characterizedgenetically before this study. In these mutants, we confirmed thatthe T-DNA disrupted the gene of interest using gene-specific PCRand showed that this PCR product cosegregated with two reportergenes (Basta and GUS expression) carried on the T-DNA. Allpollen assays directly compare the function of pollen with the T-DNA insert (GUS+ and carrying Basta gene) with wild-type pollen(GUS- and not carrying Basta gene) as they were performed inpollen tetrads from heterozygous plants. The mutant phenotypeswe identified are linked to the T-DNA insertion. Therefore, wecan rule out the possibility that unlinked mutations, not tagged bythe T-DNA in the gene of interest, are responsible for the observedphenotypes. Our data suggest that loss-of-function of the indicatedgenes caused the pollen phenotypes recorded here.In this study, we systematically addressed whether mutations
that affect pollen tube growth in vitro also disrupt pollen tubegrowth in vivo. It is reasonable to predict that a mutation affecting apollen tube structural component or a factor required for tipgrowth would disrupt growth in either the pistil or in a definedgrowth medium [34,35,61]. However, a mutation that specificallydisrupts the ability of the pollen tube to re-orient growth inresponse to pollen tube guidance cues would not be expected tocause a defect in the ability of pollen tubes to extend in vitro. We
found two insertions (At3g18000-1 [XIPOTL]; At1g60420-1[thioredoxin and C1-domain containing]) that caused significantreductions in ovule targeting (Table 4, Figure 5), but did not affectpollen tube growth in vitro (Table 5, Figure S4). A third type ofmutation would cause mutant phenotypes in vitro, but would notresult in defective growth in the pistil environment. Thesemutations may define genes that play a role in the growth process,but whose mutant phenotypes in the pistil are masked by factors inthe pistil environment that enhance growth [24]. For thesemutations, in vitro pollen tube growth may be viewed as a sensitizedenvironment capable of revealing subtle mutant phenotypes. Weidentified five insertions that disrupted pollen tube growth in vitrothat did not obviously affect the ability of pollen to sire progeny invivo. For example, At5g55020-1 (MYB120, discussed below)significantly reduced pollen germination and tube length in vitro(Table 5, Figure S4), but did not affect transmission of the mutantallele through pollen (Table 4). Our microarray data show that thetranscriptome of pollen tubes grown in vitro is dramaticallydifferent from that of pollen tubes grown through pistil tissue.Our genetic experiments also confirm this difference by showingthat the consequences of loss-of-function in a pollen tube gene aredifferent in these distinct environments and that the combinationof assays probing growth in vitro and in vivo is essential tocomprehensively understand pollen tube growth.An insertion in MYB120 (At5g55020-1) caused defective pollen
germination and tube growth in vitro (Table 5, Figure S4).Phylogentic analysis of 125 MYB-related transcription factorsplace MYB120 in subgroup 18, which comprises seven closelyrelated genes [62,63]. Analysis of 125 Arabidopsis MYBs in our dataset showed that three of the four most abundant MYBs in the SIVPT are from subgroup 18 (including MYB120). Furthermore, fourmembers of subgroup 18 are expressed at much higher levels inpollen than in other tissues we analyzed and three members(including MYB120 and MYB65) of the subgroup have their peakexpression in SIV PT (Figure S5). MYB65 is a SIV PT-enrichedgene (Table S8) and was identified among the transcription factorsoverrepresented in SIV PT-enriched genes compared to pollen-expressed genes (Table S9). Perhaps functional redundancy withinthis MYB subgroup explains why an insertion in MYB120(At5g55020-1) affected pollen tube growth in vitro did not causea defect in the pistil (Table 4). Analyzing single and multiplemutations in members of this subgroup, using the assays describedhere, can be used to test this hypothesis and to determine whetherthis group of transcription factors is an important regulator of geneexpression in actively extending pollen tubes.We uncovered a role in pollen tube growth for two genes
(At5g67250, At3g18000) already shown to be critical forsporophytic growth and development. Our microarray analysisshows that both of these genes have broad expression patterns insporophytic tissues and are significantly higher in SIV PT than 4 hPT (Figure S3B). These expression patterns underscore animportant aspect of the SIV PT transcriptome; 871 genes(Figure 2D) are shared between SIV PT and the sporophytictissues we analyzed that are not expressed in pollen or pollen tubesgrown in vitro. At5g67250 and At3g18000 illustrate how functionalanalysis using pollen can provide new insights into the function ofthis part of the Arabidopsis genome.Previous RNAi analysis of At5g67250 (an SCF-type F-box and
leucine rich repeat-containing E3 ubiquitin ligase, VFB-4) showedthat reduction of expression was associated with defects in lateralroot formation and rosette leaf expansion [64]. SCF-type E3ubiquitin ligases determine substrate specificity for ubiquitinationand proteolysis, thereby regulating an array of biological processesincluding cell cycle progression [65,66] and auxin signaling
Functional Genomics of Pollen Tube Growth
PLoS Genetics | www.plosgenetics.org 13 August 2009 | Volume 5 | Issue 8 | e1000621
[67,68]. Here we have shown that VFB-4 is required for pollentube growth in vitro (Table 5, Figure S4), suggesting that regulatedproteolysis is important for pollen tube extension. A limitation ofmicroarray analysis is that it only documents changes in mRNAabundance and does not identify genes whose mRNA levelsremain unaltered, but encode proteins that undergo post-translational modification in response to growth in the pistil.Post-translational regulation of protein function is likely animportant mediator of pollen-pistil interactions. For example,LePRK2, a pollen-specific receptor kinase required for pollen tubegrowth in tomato [69] has been shown to be dephosphorylated bya stigma extract [70]. Methods developed for large-scale SIV PTisolation (this study) and pollen proteomic analysis [71–73], couldbe combined to identify the set of pollen tube proteins that aremodified in response to growth in the pistil.At3g18000 (XIPOTL) was identified in a genetic screen for root
architecture defects [52], and encodes a PEAMT required forproduction of phosphatidylcholine (see Results). At3g18000-1disrupted ovule targeting in the pistil (Table 4, Figure 5), suggestingthat XIPOTLmay be required for navigating the pistil environmentand that lipid signaling and/or a particular plasma membranecomposition is required for pollen tube growth and guidance.
Materials and Methods
Plant Materials and Growth ConditionsArabidopsis plants were grown in chambers at 21uC under
illumination (100 mmol m22 s21 with a 16-hour photoperiod).Wild-type pollen and pollen tubes (Col-0 accession) were used formicroarray experiments. The SAIL lines (Col-0 accession) andmale sterile 1 mutant, ms1 (CS75, Landsberg ecotype) were obtainedfrom the Arabidopsis Biological Resource Center (Columbus, OH).ms1 does not produce pollen, but has a normal pistil; this mutanttherefore yields pistils that do not require emasculation.
Collection of Dry Pollen and In Vitro–Grown Pollen TubesDry pollen grains were collected by the vacuum method [74]
into microfuge tubes containing 250 ml liquid pollen growthmedium [75] and incubated for 0.5 or 4 hours in a 24uC growthchamber. Pollen tubes were centrifuged at 4,000 rpm for 5minutes, the supernatant was removed and the microfuge tubeswere frozen in liquid nitrogen and stored in 280uC until RNAisolation. Aliquots of pollen tube suspensions were observed underan Axiovert 100 microscope (Carl Zeiss, Oberkochen, Germany)to determine % pollen germination and pollen tube length usingMetamorph software version 7.1.4.0 (Molecular Devices Inc.,Downingtown, PA). Pollen grains with emerging tubes equal to orlonger than their diameters were considered germinated. After4 hours of growth, 58.366.0% of the pollen grains germinatedand formed tubes (average length of 383.8632.1 mm; Figure 1C).Under our growth conditions, the remainder of the grains in the4 hour sample did not germinate and the germination rates didnot increase even with longer incubation times (Figure 1C).
Collection of Semi In Vivo–Grown Pollen Tubes (SIV PT)Pollen tubes grown through the stigma and style were collected
by the semi in vivo procedure essentially as described [26].Pollinated ms1 pistils were placed vertically on solid pollen growthmedium for one hour (establish growth into the pistil) before theywere laid horizontally; tubes emerged from cut pistils after threehours of growth and were harvested as bundles after three hours ofgrowth on the media surface. Bundles were excised at the point ofemergence from the cut pistil and collected into liquid nitrogen-frozen microfuge tubes. Eight hundred pollen tube bundles
(obtained from 800 cut pistil explants) were used for each of thethree replicate RNA isolations. Pollen tube bundles wereconfirmed to be free of pistil tissue contamination by microscopy.
Collection of Other Tissues and Pollinated PistilsFor 8-day-old seedling samples, both shoots and roots of
seedlings grown on 0.5X Murashige and Skoog (MS) media [MSsalts (Carolina Biological Supply Company, Burlington, NorthCarolina), 10% sucrose, pH 5.7, 7% Bacto Agar] were included.However, for 21-day-old seedling samples, only aerial parts of theplants grown on soil were included. For in vivo confirmation ofgene expression experiments, flower stage 14 [76] ms1 pistils werehand pollinated with wild-type (Col-0) pollen. Pollinated pistils,either 1 minute or 2 hours after pollination, were cut at thejunction of the style and ovary and the stigma and style portion(cut pistils) were used for RNA isolation. For unpollinated pistils,flower stage 14 [76] ms1 cut pistils devoid of any pollen were used.Fifteen cut pistils of each kind were used for each replicate (2)RNA isolation.
RNA Extraction, Probe Preparation, and Gene ChipHybridizationTotal RNA was extracted from dry pollen, 0.5 h PT, 4 h PT
and SIV PT using the Qiagen RNeasy kit (http://www.qiagen.com). The yield and RNA purity were determined by Nano-Drop(Thermo Scientific, Wilmington, DE, USA) and gel electropho-resis. RNA integrity was checked using an Agilent 2100Bioanalyzer (Agilent Technologies, Boblingen, Germany). Hy-bridization and post hybridization processing were performed asper the manufacturer’s instructions by the Arizona Cancer CenterMicroarray facility (http://www.azcc.arizona.edu/laboratory/l_microarray.htm). Total RNA (5 mg, dry pollen, 0.5 h PT and4 h PT) and 2 mg (SIV PT) was processed as per the AffymetrixGeneChip Expression Analysis protocol (Part#701071, Rev 5,Affymetrix, Santa Clara, CA). Briefly, after first and second strandcDNA synthesis with total RNA, the cDNAs were used to generatecRNA labeled with biotin in an in vitro transcription reaction. Foreach pollen condition, labeled cRNA was fragmented and 15 mgof fragmented cRNA (25–200 nt as per Agilent 2100 BioanalyzerRNA 6000 Nano Chip Series II Assay, Agilent Technologies,Waldbronn, Germany) was hybridized to the GeneChip ArabidopsisATH1 genome arrays (http://www.affymetrix.com) for 20 hoursat 45uC. Standard washing and staining procedures wereperformed using the GeneChip Fluidics Station 450 (Affymetrix,Santa Clara, CA). The arrays were then scanned using theGeneChip Scanner 3000 with 7 G upgrade (Affymetrix, SantaClara, CA). Signal intensities from each of the 15 arrays wereconverted to raw expression data (with Present, ‘‘P’’, Absent, ‘‘A’’and Marginal, ‘‘M’’ scores) using GeneChip Operating Software(GCOS) (Affymetrix, Santa Clara, CA) and are provided assupplementary files (Table S1, Table S2, Table S3, Table S4).
Accessing Microarray DataRaw data (.CEL and CHP files) from all 15 microarrays
reported in this study have been deposited in Gene ExpressionOmnibus [77] public repository and can be accessed from (http://www.ncbi.nlm.nih.gov/geo/query/acc.cgi?acc =GSE17343) us-ing the Series accession number GSE17343.
Bioinformatic and Statistical Analysis of Affymetrix ATH1Genome Array DataIn addition to the 15 arrays from this study, we obtained 25
publicly available array data (AtGenExpress, http://www.ebi.ac.
Functional Genomics of Pollen Tube Growth
PLoS Genetics | www.plosgenetics.org 14 August 2009 | Volume 5 | Issue 8 | e1000621
uk [28] and stigma and ovary microarray data from GeneExpression Omnibus at http://www.ncbi.nlm.nih.gov/geo/[29]).The following cel files were downloaded: 7 day old roots–ATGE_3A-C, 17 day old roots–ATGE_9A-C, rosette leaves–ATGE_17A-C, pollen–ATGE_73A-C, 8 day old seedlings–ATGE_96A-C, 21 day old seedlings–ATGE_100A-C. Probe datafor ovary–GSM67078.cel, GSM67079.cel, GSM67080.cel,SM67081.cel and stigma–GSM67084.cel, GSM67086.cel,GSM67087.cel.Using RMA (Robust Microarray Analysis tool in the affy
library) [78], we normalized the data from all of these 40 arrays(Table S5). Using the affy and limma BioConductor libraries(http://www.bioconductor.org) and the R programming project(http://www.R-project.org), we calculated the statistical signifi-cance in expression level changes of the following comparisons:0.5 h PT vs. dry pollen; 4 h PT vs. dry pollen; 4 h PT vs. 0.5 hPT; SIV PT vs. dry pollen; SIV PT vs. 4 h PT. After estimatingthe variance of mean signal intensities for each probe set, thesignificance of this value in the two conditions was evaluated byperforming a t-test [79]. The probabilities obtained were correctedfor multiple hypothesis testing by reshuffling the data to obtain anestimate of the false discovery rate (B values) and applying thisestimate to lower the probability of the t-value (adjusted P values).The complete results from the statistical analysis for each of thefive comparisons and for every probe set in an array are alsoreported in Table S5.
Hierarchical and Non-Hierarchical k-Means ClusteringTo investigate the relationships among pollen samples, agglom-
erative hierarchical clustering of the fifteen microarrays represent-ing four pollen conditions, was performed as described [43,80]. Tofind genes that had the best discriminative ability, based on itsexpression profile, we employed non-hierarchical k-means cluster-ing method [43]. For this, we compared dry pollen and 4 h PThierarchical clusters to the SIV PT hierarchical cluster and in eachcomparison, for every gene, we calculated discriminative weight, aparameter that measures the ability of a gene’s expression values todistinguish two clusters. The discriminative weight of the gene for apair of clusters is defined by,
w~dB=k1dw1zk2dw2za
where dB is the distance between centers of the clusters, dwi is theaverage Euclidean distance among all sample pairs within cluster i,ki~ti= t1zt2ð Þ where ti is the total number of sample pairs in thecluster i.
GO Analysis for SIV PT-Enriched GenesGO term enrichment analysis reported in Figure 2 was
performed essentially as described in [81,82]. Briefly, thehypergeometric distribution test was applied on the gene sets insectors 1–4 (Figure 2B) using the GOHyperGAll function [81]which yielded raw and Bonferroni corrected p-values (adjusted pvalue). GO terms from the ‘‘Molecular Function’’ category thathad an adjusted P value of ,0.05 were considered highly enrichedand are shown in Figures 2C and 2E. Arabidopsis gene-to-GOmappings were downloaded from the GO site (10/12/2007release; http://geneontology.org). A complete list of GO-terms(for all three broad GO categories) associated with sectors 1–4 areprovided in Table S7. Within each sector, only unique genesbelonging to each GO term category were considered. For thetotal number of genes for each GO term category reported inFigure 2C, unique numbers of genes from each sector were added,
without eliminating gene overlap between sectors. The Fisherexact test was performed to determine if any GO term wassignificantly overrepresented in SIV PT-enriched genes (Table 1),given that this gene list was smaller compared to those used inFigure 2C [83]. From the SIV PT-enriched gene list (383, TableS8), we excluded genes that were also expressed in pollen samples(ATGE_73A-C); the remaining 357 probes were mapped to genes.Only single probes were chosen if multiple probes mapped to thesame gene or a gene family. This criteria resulted in a final list of349 SIV-enriched genes that was then compared to pollen-expressed genes (ATGE_73A-C, [28] to obtain P-values foroverrepresented GO terms in SIV PT-enriched genes. The GOterms with P,0.05 were considered significantly overrepresentedin SIV PT-enriched genes and reported in Table 1. Completeresults of this analysis and the genes associated with GO-termslisted in Table 1 are provided in Table S9.
RT-PCR and qRT-PCRFor each of the RT-PCR experiments, new RNA samples were
isolated from the indicated cells/tissues, cDNA was synthesized andused as template for PCR (Figure S2) and quantitative real-time PCR(Figure 3 and Table 3). Total RNA was isolated using the QiagenRNeasy kit followed by treatment with Fermentas DNase I (http://www.fermentas.com) prior to first-strand cDNA synthesis usingInvitrogen ThermoScript RT-PCR kit (http://www.invitrogen.com).PCR (with PowerTaq DNA Polymerase PCR system, AltilaBiosystems, Palo Alto, CA) was performed as follows: 3 minutes(min) at 94uC, 38 cycles of 30 seconds (sec) at 94uC, 1 min at 60uCand 1 min at 72uC, followed by 5 min at 72uC. Real-time RT-PCRwas performed using the Roche FastStart DNAMaster SYBRGreenI master mix (http://www.roche.com) in a LightCycler system(Roche, http://www.roche.com). The PCR primers used in RT-PCR and qRT-PCR experiments are listed in Table S17. The PCRcycle conditions used for real time PCR were as follows: a 95uC for5 min followed by 45 cycles of 95uC for 10 sec, 60uC for 15 sec, and72uC for 15 sec. For each gene analyzed by RT-PCR and qRT-PCR, four reactions were carried out, including two technicalreplicates and two biological replicates (using RNA from indepen-dently harvested tissues). In each qRT-PCR run, ACTIN2(Threshold Cycle (CT) value of 18–19), was used to normalize formRNA levels. We considered a gene to be expressed only if it had aCT value ,36. When expression was not detected in a qRT-PCRreaction, a CT value of 45 (since 45 cycles were used in a real timePCR reaction) was used to calculate the fold change.
In Vivo Pollen Tube StainingManually self-pollinated ms1 pistils were harvested either one
minute or 2 hours after pollination. The pollinated pistils werestained with aniline blue to visualize in vivo pollen tube growth asdescribed previously [84]. Stained pistils were observed on a ZeissAxiovert 100 microscope with a Zeiss 365 G filter (Carl Zeiss,Oberkochen, Germany). By this staining procedure, the majorityof the pollen tubes reached the style tissue in 2 hours (Figure 4A).
Reverse Genetic AnalysisSAIL lines were chosen (http://signal.salk.edu/[85]) with
insertions between 300 bp upstream of the 59 UTR and 300bp downstream of the 39UTR (exons were prioritized overintrons); and for which there was a TAIL PCR sequence thatcorroborated the T-DNA insert site to a single locus in theArabidopsis genome. Determination of Basta was performed asreported [49]. Basta plants were transferred to soil and T-DNAinsertion sites were confirmed using left border (LB3, LB2, and/orLB1 [86]) and gene-specific ‘right’ primers (Table S16, designed
Functional Genomics of Pollen Tube Growth
PLoS Genetics | www.plosgenetics.org 15 August 2009 | Volume 5 | Issue 8 | e1000621

using http://signal.salk.edu/tdnaprimers.2.html) in a PCR reac-tion. The PCR program used for this reaction was: 94uC for 5 minfollowed by 36 cycles of 94uC for 15 sec, 60uC for 30 sec, 72uC for2 min, and a final elongation step of 72uC for 4 min. Pollentetrads from one stage 14 flower [76] from each Basta plant werestained and assayed for segregation of the LAT52:GUS transgeneas described [49]. Transmission of the T-DNA following self-fertilization or through crosses to ms1 were tested as described[49].
In Vitro Pollen Phenotypic AnalysisPollen grains were incubated in liquid pollen growth medium
[53] on upside-down slides [87] for 6 hours and stained for GUSactivity as described [49]. Images were captured (Zeiss Axiovert200 M, Carl Zeiss, Oberkochen, Germany) and used to determinepollen tube germination rates and pollen tube length for GUS-and GUS+ pollen using ImageJ software (http://rsbweb.nih.gov/ij/docs/faqs.html). These experiments were analyzed as arandomized complete block design with dates of observation asblocks and genotype of pollen (GUS+, insertion; GUS-, wild type)as treatments. Pollen germination and pollen tube length valueswere subjected to mixed-model analysis of variance with blockconsidered a random effect and treatment a fixed effect.Untransformed least-squares means and P values [88] from thisanalysis are reported (Table 5). Analysis was done using PROCMIXED in SAS/STAT Version 9.1 of the SAS System forWindows. (Copyright ! 2002-2003 SAS Institute Inc).
In Vivo Pollen Phenotypic AnalysisPollen tube growth in the pistil was examined after crossing
pollen from heterozygous insertion plants to three or more ms1pistils. Pollinated pistils were harvested 24 hours after pollination,prepared for GUS staining and microscopy observations asdescribed previously [49]. Stained pistils were imaged (differentialinterference contrast) using a Zeiss Axiovert 200 M microscope(Carl Zeiss, Oberkochen, Germany).
Supporting Information
Figure S1 Hierarchical clustering of pollen arrays. Agglomera-tive hierarchical clustering of the fifteen microarrays representingfour pollen conditions was performed to generate the dendrogram.Found at: doi:10.1371/journal.pgen.1000621.s001 (0.09 MB TIF)
Figures S2 RT-PCR analysis of gene expression. Total RNAfrom indicated tissues—dry pollen, 0.5 h PT, 4 h PT, 8- and 21-day-old seedlings (DS) —was used as templates to perform oligo-dT primed reverse transcription reactions followed by cDNAsynthesis. RT-PCR was performed with cDNAs from indicatedtissues and gel images of PCR products amplified are shown. (A)RT-PCR analysis of pollen-enriched and pollen-expressed genes.(B) RT-PCR analysis of genes that are significantly altered in SIVPT compared to 4 h PT. (C) RT-PCR analysis of pistil-dependentgene expression changes in vivo. Samples analyzed were drypollen, unpollinated ms1 pistils (virgin pistil), ms1 pistils pollinatedfor one minute (1 m pollinated pistil) and ms1 pistils pollinated fortwo hours (2 h pollinated pistil).Found at: doi:10.1371/journal.pgen.1000621.s002 (1.89 MB TIF)
Figure S3 Heat maps representing microarray data. (A) Genesanalyzed by qRT-PCR (Figure 3, Figure 4, and Table 3). Relativeexpression values obtained from microarray analysis (Table S5)are shown as a heat map. For each gene, the highest value is set at100% and the relative value is calculated for other samples. (B)Genes chosen for reverse genetic analysis. The top set of genes
were chosen because they were significantly higher in 4 h PTcompared to dry pollen. The bottom set of genes were chosenbecause they were significantly higher in SIV PT than in 4 h PT.The heat map displays normalized expression values for allpublicly available datasets we analyzed along with our pollenmicroarray data. The right panel shows a phenotypic summary ofour reverse genetic analysis. Male transmission defects weredetermined by crossing heterozygous insertion pollen to ms1 pistils(Table 4). Germination % and tube length were determined invitro (Table 5, Figure S4). Ovule targeting was determined bycrossing heterozygous insertion pollen to ms1 pistils and countingthe number of ovules targeted by insertion pollen tubes (Figure 5).Found at: doi:10.1371/journal.pgen.1000621.s003 (0.88 MB TIF)
Figure S4 Five insertions cause defects in pollen tube growth invitro. Pollen heterozygous for the indicated insertion was grown invitro for 6 hours and then stained for GUS expression. GUS+(blue) pollen tubes carry insertions; GUS- (white) pollen tubes arewild type. In control pollen (A), the GUS+ (blue) pollen tubes areas long and as numerous as GUS- (white) pollen tubes (see Table 5for quantification). Insertions that did not cause severe growthdefects are also shown (B–H). Insertions caused severe defects inpollen tube germination (L,N) and/or in tube length (I–P). Highermagnification images of indicated insertions are shown (N–P).Arrowheads point to representative GUS+ (black arrowhead) andGUS- (white arrowhead) in (A); all GUS+ pollen tubes arehighlighted with black arrowheads in (O) and (P). Scalebars = 100 mm.Found at: doi:10.1371/journal.pgen.1000621.s004 (1.54 MB TIF)
Figure S5 Members of subgroup 18 are expressed in growingpollen tubes. Mean microarray expression data (log2, Table S5)are plotted for each of the cell or tissue types analyzed in this studyfor seven genes that comprise MYB subgroup 18 [60,61].Found at: doi:10.1371/journal.pgen.1000621.s005 (0.25 MB TIF)
Table S1 Raw gene expression data for dry pollenFound at: doi:10.1371/journal.pgen.1000621.s006 (6.27 MBXLS)
Table S2 Raw gene expression data for 0.5 h PTFound at: doi:10.1371/journal.pgen.1000621.s007 (6.27 MBXLS)
Table S3 Raw gene expression data for 4 h PTFound at: doi:10.1371/journal.pgen.1000621.s008 (6.27 MBXLS)
Table S4 Raw gene expression data for SIV PT. Normalizedexpression data (log2) for each replicate of dry pollen, 0.5 h PT,4 h PT, SIV PT, and 25 selected experiments from publiclyavailable sources; and statistical analyses for selected comparisons.Found at: doi:10.1371/journal.pgen.1000621.s009 (5.95 MBXLS)
Table S5 Normalized expression data (log2) for each replicate ofdry pollen, 0.5 h PT, 4 h PT, SIV PT, and 25 selected experimentsfrom publicly available sources; and statistical analyses for selectedcomparisons. Statistical analyses of significant differences betweentwo indicated conditions are described in Materials and Methods.The table has been sorted by Affymetrix ID (ascending). FC=FoldChange; B value=False discovery rate. Affymetrix probe sets (ID,Column A) associated with a single nuclear gene are identified by aGenbank number (column D) that begins At1G, At2G, At3G,At4G, or At5G; mitochondrial genes begin AtMG, chloroplastgenes begin AtCG. Affymetrix probe sets associated with multiplegenes are identified as ‘multiple’ in column D. Affymetrix probe setsthat are not associated with genes are blank in column D. Genes
Functional Genomics of Pollen Tube Growth
PLoS Genetics | www.plosgenetics.org 16 August 2009 | Volume 5 | Issue 8 | e1000621
associated with multiple Affymetrix probe sets are flagged (*) incolumn E. Affymetrix control probe sets begin ‘AFFX-’ (Column A),these were not counted in analyses.Found at: doi:10.1371/journal.pgen.1000621.s010 (6.81 MB ZIP)
Table S6 Pearson correlation coefficients between microarrayexperiments. The Pearson correlation coefficients between quan-tile normalized 40 microarray data sets used in this study areshown.Found at: doi:10.1371/journal.pgen.1000621.s011 (0.04 MBXLS)
Table S7 Complete list of overrepresented GO terms shown inFigure 2C and Figure 2EFound at: doi:10.1371/journal.pgen.1000621.s012 (2.25 MBXLS)
Table S8 SIV PT-enriched genesFound at: doi:10.1371/journal.pgen.1000621.s013 (0.51 MBXLS)
Table S9 Complete list of overrepresented GO terms and theassociated genes from the Fisher exact test shown in Table 1Found at: doi:10.1371/journal.pgen.1000621.s014 (0.17 MBXLS)
Table S10 Statistical analysis of significant gene expressionchanges between 0.5 h PT and dry pollenFound at: doi:10.1371/journal.pgen.1000621.s015 (0.05 MBXLS)
Table S11 Statistical analysis of gene expression changesbetween 4 h PT and 0.5 h PTFound at: doi:10.1371/journal.pgen.1000621.s016 (0.15 MBXLS)
Table S12 Statistical analysis of gene expression changesbetween 4 h PT and dry pollenFound at: doi:10.1371/journal.pgen.1000621.s017 (0.21 MBXLS)
Table S13 Statistical analysis of gene expression changesbetween SIV PT and dry pollenFound at: doi:10.1371/journal.pgen.1000621.s018 (1.36 MBXLS)
Table S14 Statistical analysis of gene expression changesbetween SIV PT v 4 h PTFound at: doi:10.1371/journal.pgen.1000621.s019 (0.99 MBXLS)
Table S15 Genes that best discriminate the SIV PT cluster fromother pollen clustersFound at: doi:10.1371/journal.pgen.1000621.s020 (0.06 MBDOC)
Table S16 Syngenta Arabidopsis Insertion Lines (SAIL) ana-lyzedFound at: doi:10.1371/journal.pgen.1000621.s021 (0.04 MBXLS)
Table S17 List of primers used in RT-PCR and qRT-PCRexperimentsFound at: doi:10.1371/journal.pgen.1000621.s022 (0.02 MBXLS)
Acknowledgments
We thank Jose L. Munoz-Rodrıguez, and George Watts of the GenomicsShared service, The Arizona Cancer Center, University of Arizona, forpreparing labeled cRNA, hybridization to Affymetrix ATH1 genomearrays, and scanning the slides. We acknowledge Yuko Hasegawa andGeoff Williams for the Scanning Electron Micrograph in Figure 1. Wegratefully acknowledge the assistance of Dr. Steven E. Smith, School ofNatural Resources, University of Arizona, with statistical analysis of in vitropollen germination and tube growth, and Dr. Ram Yadav, University ofCalifornia Riverside, for assistance with GO term enrichment analysisusing the hypergeometric distribution test. We thank Dr. Ramin Yadegarifor providing access to the real-time PCR machine. We thank Drs. JudithBender, Alison DeLong, Karen Schumaker, Frans Tax, Ramin Yadegari,and three anonymous reviewers for critical comments on the manuscript.
Author Contributions
Conceived and designed the experiments: Yuan Qin, Alexander R.Leydon, Mark A. Johnson, Ravishankar Palanivelu. Performed theexperiments: Yuan Qin, Alexander R. Leydon. Analyzed the data: YuanQin, Alexander R. Leydon, Ann Manziello, Ravishankar Palanivelu,David Mount, Stojan Denic, Bane Vasic, Mark A. Johnson, Ritu Pandey.Contributed reagents/materials/analysis tools: Mark A. Johnson, Ra-vishankar Palanivelu. Wrote the paper: Yuan Qin, Alexander R. Leydon,Mark A. Johnson, Ravishankar Palanivelu. Coordinated the study andserved as the liaison among the authors: Ravishankar Palanivelu.
References
1. Bishopp A, Mahonen AP, Helariutta Y (2006) Signs of change: hormonereceptors that regulate plant development. Development 133: 1857–1869.
2. Yadegari R, Drews GN (2004) Female gametophyte development. Plant Cell 16:S133–S141.
3. Borg M, Brownfield L, Twell D (2009) Male gametophyte development: amolecular perspective. J Exp Bot 60: 1465–1478.
4. McCormick S (2004) Control of male gametophyte development. Plant Cell 16(Suppl): S142–S153.
5. von Besser K, Frank AC, Johnson MA, Preuss D (2006) Arabidopsis HAP2(GCS1) is a sperm-specific gene required for pollen tube guidance andfertilization. Development 133: 4761–4769.
6. Yang Z (2008) Cell polarity signaling in Arabidopsis. Annu Rev Cell Dev Biol24: 551–575.
7. Cardenas L, Lovy-Wheeler A, Kunkel JG, Hepler PK (2008) Pollen tube growthoscillations and intracellular calcium levels are reversibly modulated by actinpolymerization. Plant Physiol 146: 1611–1621.
8. Cheung AY, Wu HM (2008) Structural and signaling networks for the polar cellgrowth machinery in pollen tubes. Annu Rev Plant Biol 59: 547–572.
9. Geitmann A, Palanivelu R (2007) Fertilization Requires Communication: SignalGeneration and Perception During Pollen Tube Guidance. Floriculture andOrnamental Biotechnology 1: 77–89.
10. Okuda S, Tsutsui H, Shiina K, Sprunck S, Takeuchi H, et al. (2009) Defensin-like polypeptide LUREs are pollen tube attractants secreted from synergid cells.Nature 458: 357–361.
11. Sandaklie-Nikolova L, Palanivelu R, King EJ, Copenhaver GP, Drews GN(2007) Synergid cell death in Arabidopsis is triggered following direct interactionwith the pollen tube. Plant Physiol 144: 1753–1762.
12. Escobar-Restrepo JM, Huck N, Kessler S, Gagliardini V, Gheyselinck J, et al.(2007) The FERONIA receptor-like kinase mediates male-female interactionsduring pollen tube reception. Science 317: 656–660.
13. Capron A, Gourgues M, Neiva LS, Faure JE, Berger F, et al. (2008) Maternalcontrol of male-gamete delivery in Arabidopsis involves a putative GPI-anchored protein encoded by the LORELEI gene. Plant Cell 20: 3038–3049.
14. Christensen CA, Gorsich SW, Brown RH, Jones LG, Brown J, et al. (2002)Mitochondrial GFA2 is required for synergid cell death in Arabidopsis. PlantCell 14: 2215–2232.
15. Ingouff M, Hamamura Y, Gourgues M, Higashiyama T, Berger F (2007)Distinct dynamics of HISTONE3 variants between the two fertilization productsin plants. Curr Biol 17: 1032–1037.
16. Becker JD, Boavida LC, Carneiro J, Haury M, Feijo JA (2003) Transcriptionalprofiling of Arabidopsis tissues reveals the unique characteristics of the pollentranscriptome. Plant Physiology 133: 713–725.
17. Honys D, Twell D (2003) Comparative analysis of the Arabidopsis pollentranscriptome. Plant Physiol 132: 640–652.
18. Honys D, Twell D (2004) Transcriptome analysis of haploid male gametophytedevelopment in Arabidopsis. Genome Biol 5: R85.
19. Pina C, Pinto F, Feijo JA, Becker JD (2005) Gene family analysis of theArabidopsis pollen transcriptome reveals biological implications for cell growth,
Functional Genomics of Pollen Tube Growth
PLoS Genetics | www.plosgenetics.org 17 August 2009 | Volume 5 | Issue 8 | e1000621
division control, and gene expression regulation. Plant Physiology 138: 744–756.
20. Borges F, Gomes G, Gardner R, Moreno N, McCormick S, et al. (2008)Comparative transcriptomics of Arabidopsis sperm cells. Plant Physiol 148:1168–1181.
21. Wang Y, Zhang WZ, Song LF, Zou JJ, Su Z, et al. (2008) Transcriptomeanalyses show changes in gene expression to accompany pollen germination andtube growth in Arabidopsis. Plant Physiol 148: 1201–1211.
22. Mo Y, Nagel C, Taylor LP (1992) Biochemical complementation of chalconesynthase mutants defines a role for flavonols in functional pollen. Proc Natl AcadSci U S A 89: 7213–7217.
23. Guyon VN, Astwood JD, Garner EC, Dunker AK, Taylor LP (2000) Isolationand characterization of cDNAs expressed in the early stages of flavonol-inducedpollen germination in petunia. Plant Physiol 123: 699–710.
24. Taylor LP, Hepler PK (1997) Pollen Germination and Tube Growth. Annu RevPlant Physiol Plant Mol Biol 48: 461–491.
25. Higashiyama T, Kuroiwa H, Kawano S, Kuroiwa T (1998) Guidance in vitro ofthe pollen tube to the naked embryo sac of torenia fournieri. Plant Cell 10:2019–2032.
26. Palanivelu R, Preuss D (2006) Distinct short-range ovule signals attract or repelArabidopsis thaliana pollen tubes in vitro. BMC Plant Biol 6: 7.
27. Meyers BC, Kozik A, Griego A, Kuang H, Michelmore RW (2003) Genome-wide analysis of NBS-LRR-encoding genes in Arabidopsis. Plant Cell 15:809–834.
28. Schmid M, Davison TS, Henz SR, Pape UJ, Demar M, et al. (2005) A geneexpression map of Arabidopsis thaliana development. Nat Genet 37: 501–506.
29. Swanson R, Clark T, Preuss D (2005) Expression profiling of Arabidopsis stigmatissue identifies stigma-specific genes. Sexual Plant Reproduction 18: 163–171.
30. Li H, Wu G, Ware D, Davis KR, Yang Z (1998) Arabidopsis Rho-relatedGTPases: differential gene expression in pollen and polar localization in fissionyeast. Plant Physiol 118: 407–417.
31. Zhang Y, McCormick S (2007) A distinct mechanism regulating a pollen-specificguanine nucleotide exchange factor for the small GTPase Rop in Arabidopsisthaliana. Proc Natl Acad Sci U S A 104: 18830–18835.
32. Szumlanski AL, Nielsen E (2009) The Rab GTPase RabA4d Regulates PollenTube Tip Growth in Arabidopsis thaliana. Plant Cell 21: 526–544.
33. Schiott M, Romanowsky SM, Baekgaard L, Jakobsen MK, Palmgren MG, et al.(2004) A plant plasma membrane Ca2+ pump is required for normal pollen tubegrowth and fertilization. Proc Natl Acad Sci U S A 101: 9502–9507.
34. Frietsch S, Wang YF, Sladek C, Poulsen LR, Romanowsky SM, et al. (2007) Acyclic nucleotide-gated channel is essential for polarized tip growth of pollen.Proc Natl Acad Sci U S A 104: 14531–14536.
35. Jiang L, Yang SL, Xie LF, Puah CS, Zhang XQ, et al. (2005) VANGUARD1encodes a pectin methylesterase that enhances pollen tube growth in theArabidopsis style and transmitting tract. Plant Cell 17: 584–596.
36. Kobayashi K, Awai K, Takamiya K, Ohta H (2004) Arabidopsis type Bmonogalactosyldiacylglycerol synthase genes are expressed during pollen tubegrowth and induced by phosphate starvation. Plant Physiol 134: 640–648.
37. Huang L, Cao J, Zhang A, Ye Y, Zhang Y, et al. (2009) The polygalacturonasegene BcMF2 from Brassica campestris is associated with intine development.J Exp Bot 60: 301–313.
38. Parre E, Geitmann A (2005) Pectin and the role of the physical properties of thecell wall in pollen tube growth of Solanum chacoense. Planta 220: 582–592.
39. Bock KW, Honys D, Ward JM, Padmanaban S, Nawrocki EP, et al. (2006)Integrating membrane transport with male gametophyte development andfunction through transcriptomics. Plant Physiol 140: 1151–1168.
40. Stadler R, Truernit E, Gahrtz M, Sauer N (1999) The AtSUC1 sucrose carriermay represent the osmotic driving force for anther dehiscence and pollen tubegrowth in Arabidopsis. Plant J 19: 269–278.
41. Hepler PK, Vidali L, Cheung AY (2001) Polarized cell growth in higher plants.Annu Rev Cell Dev Biol 17: 159–187.
42. Holdaway-Clarke TL, Weddle NM, Kim S, Robi A, Parris C, et al. (2003) Effectof extracellular calcium, pH and borate on growth oscillations in Liliumformosanum pollen tubes. J Exp Bot 54: 65–72.
43. Bittner M, Meltzer P, Chen Y, Jiang Y, Seftor E, et al. (2000) Molecularclassification of cutaneous malignant melanoma by gene expression profiling.Nature 406: 536–540.
44. Franklin-Tong VE (1999) Signaling and the modulation of pollen tube growth.Plant Cell 11: 727–738.
45. Bosch M, Cheung AY, Hepler PK (2005) Pectin methylesterase, a regulator ofpollen tube growth. Plant Physiol 138: 1334–1346.
46. Sessions A, Burke E, Presting G, Aux G, McElver J, et al. (2002) A high-throughput Arabidopsis reverse genetics system. Plant Cell 14: 2985–2994.
47. Twell D, Wing R, Yamaguchi J, McCormick S (1989) Isolation and expressionof an anther-specific gene from tomato. Mol Gen Genet 217: 240–245.
48. Preuss D, Rhee SY, Davis RW (1994) Tetrad analysis possible in Arabidopsiswith mutation of the QUARTET (QRT) genes. Science 264: 1458–1460.
49. Johnson MA, von Besser K, Zhou Q, Smith E, Aux G, et al. (2004) Arabidopsishapless mutations define essential gametophytic functions. Genetics 168:971–982.
50. Drews GN, Yadegari R (2002) Development and function of the angiospermfemale gametophyte. Annu Rev Genet 36: 99–124.
51. Chen J, Deng F, Li J, Wang QJ (2008) Selective binding of phorbol esters anddiacylglycerol by individual C1 domains of the PKD family. Biochem J 411:333–342.
52. Cruz-Ramirez A, Lopez-Bucio J, Ramirez-Pimentel G, Zurita-Silva A, Sanchez-Calderon L, et al. (2004) The xipotl mutant of Arabidopsis reveals a critical rolefor phospholipid metabolism in root system development and epidermal cellintegrity. Plant Cell 16: 2020–2034.
53. Boavida LC, McCormick S (2007) Temperature as a determinant factor forincreased and reproducible in vitro pollen germination in Arabidopsis thaliana.Plant J 52: 570–582.
54. Mollet JC, Park SY, Nothnagel EA, Lord EM (2000) A lily stylar pectin isnecessary for pollen tube adhesion to an in vitro stylar matrix. Plant Cell 12:1737–1750.
55. Kim S, Mollet JC, Dong J, Zhang K, Park SY, et al. (2003) Chemocyanin, asmall basic protein from the lily stigma, induces pollen tube chemotropism. ProcNatl Acad Sci U S A 100: 16125–16130.
56. Burch-Smith TM, Dinesh-Kumar SP (2007) The functions of plant TIRdomains. Sci STKE 2007: pe46.
57. Faigon-Soverna A, Harmon FG, Storani L, Karayekov E, Staneloni RJ, et al.(2006) A constitutive shade-avoidance mutant implicates TIR-NBS-LRRproteins in Arabidopsis photomorphogenic development. Plant Cell 18:2919–2928.
58. Swanson WJ, Vacquier VD (2002) The rapid evolution of reproductive proteins.Nat Rev Genet 3: 137–144.
59. Swanson WJ, Wong A, Wolfner MF, Aquadro CF (2004) Evolutionary expressedsequence tag analysis of Drosophila female reproductive tracts identifies genessubjected to positive selection. Genetics 168: 1457–1465.
60. Friedman WE (1999) Expression of the cell cycle in sperm of Arabidopsis:implications for understanding patterns of gametogenesis and fertilization inplants and other eukaryotes. Development 126: 1065–1075.
61. Procissi A, Guyon A, Pierson ES, Giritch A, Knuiman B, et al. (2003) KINKYPOLLEN encodes a SABRE-like protein required for tip growth in Arabidopsisand conserved among eukaryotes. Plant J 36: 894–904.
62. Kranz HD, Denekamp M, Greco R, Jin H, Leyva A, et al. (1998) Towardsfunctional characterisation of the members of the R2R3-MYB gene family fromArabidopsis thaliana. Plant J 16: 263–276.
63. Stracke R, Werber M, Weisshaar B (2001) The R2R3-MYB gene family inArabidopsis thaliana. Curr Opin Plant Biol 4: 447–456.
64. Schwager KM, Calderon-Villalobos LI, Dohmann EM, Willige BC, Knierer S,et al. (2007) Characterization of the VIER F-BOX PROTEINE genes fromArabidopsis reveals their importance for plant growth and development. PlantCell 19: 1163–1178.
65. Gusti A, Baumberger N, Nowack M, Pusch S, Eisler H, et al. (2009) TheArabidopsis thaliana F-box protein FBL17 is essential for progression throughthe second mitosis during pollen development. PLoS ONE 4: e4780.doi:10.1371/journal.pone.0004780.
66. Kim HJ, Oh SA, Brownfield L, Hong SH, Ryu H, et al. (2008) Control of plantgermline proliferation by SCF(FBL17) degradation of cell cycle inhibitors.Nature 455: 1134–1137.
67. Kepinski S, Leyser O (2005) The Arabidopsis F-box protein TIR1 is an auxinreceptor. Nature 435: 446–451.
68. Dharmasiri N, Dharmasiri S, Estelle M (2005) The F-box protein TIR1 is anauxin receptor. Nature 435: 441–445.
69. Zhang D, Wengier D, Shuai B, Gui CP, Muschietti J, et al. (2008) The pollenreceptor kinase LePRK2 mediates growth-promoting signals and positivelyregulates pollen germination and tube growth. Plant Physiol 148: 1368–1379.
70. Muschietti J, Eyal Y, McCormick S (1998) Pollen tube localization implies a rolein pollen-pistil interactions for the tomato receptor-like protein kinases LePRK1and LePRK2. Plant Cell 10: 319–330.
71. Zou J, Song L, Zhang W, Wang Y, Ruan S, et al. (2009) Comparative proteomicanalysis of Arabidopsis mature pollen and germinated pollen. J Integr Plant Biol51: 438–455.
72. Holmes-Davis R, Tanaka CK, Vensel WH, Hurkman WJ, McCormick S (2005)Proteome mapping of mature pollen of Arabidopsis thaliana. Proteomics 5:4864–4884.
73. Grobei MA, Qeli E, Brunner E, Rehrauer H, Zhang R, et al. (2009)Deterministic protein inference for shotgun proteomics data provides newinsights into Arabidopsis pollen development and function. Genome Res. pp 22June.
74. Johnson-Brousseau SA, McCormick S (2004) A compendium of methods usefulfor characterizing Arabidopsis pollen mutants and gametophytically-expressedgenes. Plant J 39: 761–775.
75. Palanivelu R, Brass L, Edlund AF, Preuss D (2003) Pollen tube growth andguidance is regulated by POP2, an Arabidopsis gene that controls GABA levels.Cell 114: 47–59.
76. Smyth DR, Bowman JL, Meyerowitz EM (1990) Early flower development inArabidopsis. Plant Cell 2: 755–767.
77. Edgar R, Domrachev M, Lash AE (2002) Gene Expression Omnibus: NCBIgene expression and hybridization array data repository. Nucleic Acids Res 30:207–210.
78. Irizarry RA, Hobbs B, Collin F, Beazer-Barclay YD, Antonellis KJ, et al. (2003)Exploration, normalization, and summaries of high density oligonucleotide arrayprobe level data. Biostatistics 4: 249–264.
Functional Genomics of Pollen Tube Growth
PLoS Genetics | www.plosgenetics.org 18 August 2009 | Volume 5 | Issue 8 | e1000621

79. Smyth GK (2004) Linear models and empirical Bayes methods for assessingdifferential expression in microarray experiments. Stat Appl Genet Mol Biol 3:Article 3.
80. Everitt B (1992) Applied Multivariate Data Analysis. New York: Oxford Univ.Press.
81. Horan K, Jang C, Bailey-Serres J, Mittler R, Shelton C, et al. (2008) Annotatinggenes of known and unknown function by large-scale coexpression analysis.Plant Physiol 147: 41–57.
82. Yadav RK, Girke T, Pasala S, Xie M, Reddy GV (2009) Gene expression mapof the Arabidopsis shoot apical meristem stem cell niche. Proc Natl AcadSci U S A 106: 4941–4946.
83. Tanner SW, Agarwal P (2008) Gene Vector Analysis (Geneva): a unified methodto detect differentially-regulated gene sets and similar microarray experiments.BMC Bioinformatics 9: 348.
84. Preuss D, Lemieux B, Yen G, Davis RW (1993) A conditional sterile mutationeliminates surface components from Arabidopsis pollen and disrupts cellsignaling during fertilization. Genes Dev 7: 974–985.
85. Alonso JM, Stepanova AN, Leisse TJ, Kim CJ, Chen H, et al. (2003) Genome-wide insertional mutagenesis of Arabidopsis thaliana. Science 301: 653–657.
86. McElver J, Tzafrir I, Aux G, Rogers R, Ashby C, et al. (2001) Insertionalmutagenesis of genes required for seed development in Arabidopsis thaliana.Genetics 159: 1751–1763.
87. Hicks GR, Rojo E, Hong S, Carter DG, Raikhel NV (2004) Geminating pollenhas tubular vacuoles, displays highly dynamic vacuole biogenesis, and requiresVACUOLESS1 for proper function. Plant Physiol 134: 1227–1239.
88. Searle S, Speed FM, Milliken GA (1980) Population marginal means in thelinear model: an alternative to least squares means. American Statistician 34:216–221.
Functional Genomics of Pollen Tube Growth
PLoS Genetics | www.plosgenetics.org 19 August 2009 | Volume 5 | Issue 8 | e1000621