pelagic organism decline (pod): acute and chronic ... organism decline (pod): acute and chronic ......
TRANSCRIPT
Aquatic Toxicology Laboratory School of Veterinary Medicine
University of California Davis, California
Pelagic Organism Decline (POD): Acute and Chronic Invertebrate and Fish Toxicity
Testing in the Sacramento-San Joaquin Delta 2006-2007
Final Report
30 April, 2008
Inge Werner, Linda Deanovic, Dan Markiewicz, Marie Stillway, Nathan Offer, Richard Connon, Susanne Brander

II
ACKNOWLEDGMENTS
This project was only made possible through the hard work and devotion of the staff of the UC Davis Aquatic Toxicology Laboratory, Dr. Juergen Geist and Dr. Richard Connon. Leandro D’Abronzo, Emily Tung, Katharina Sternecker and Tony Ha provided laboratory assistance for molecular biomarker analysis. The UC Davis Fish Conservation and Culture Laboratory, Byron, CA, supplied delta smelt and a wealth of much needed advice for our laboratory studies with this species. We thank Dr. D. J. Ostrach for providing striped bass for use in our tests, and tissue samples for our collaborative efforts on biomarker development for this species. We are grateful for the services provided by the California Department of Fish and Game, in particular the assistance of their boat operators and use of boats for the collection of water samples. We also thank the IEP-POD Management Team for their tireless efforts in providing advice and guidance to ensure the success of this work. Funding was provided by the Interagency Ecological Program, Sacramento, California (Contract No. 4600004445 to I. Werner), and a post-doctoral scholarship to J. Geist by Bayerische Forschungsstiftung (Bavarian Research Foundation), Germany.
III
CONTENTS
Page
1. Executive Summary VI
2. Background and Approach 1
3. Toxicity Monitoring 2
3.1 Sampling Sites 2
3.2 Collection of Water Samples 10
3.3 Water Quality at Sampling Sites 10 3.3.1 General Water Quality Parameters 10 3.3.2 Site-Dependent Differences in Ammonia 13
4. Tests with Hyalella azteca (Amphipoda) 24
4.1 Field Monitoring 24
4.1.1 Methods 24 4.1.1.1 Toxicity Testing 24 4.1.1.2 Toxicity Identification Evaluations 26 4.1.1.3 Statistical Analysis 27 4.1.1.4 Analytical Chemistry 29
4.1.2 Results 30 4.1.2.1 Acute Toxicity - Effects on 10-d Survival 30 4.1.2.2 Chronic Toxicity – Effects on 10-d Growth 30 4.1.2.3 Toxicity Identification Evaluations 38 4.1.2.4 Analytical Chemistry 39 4.1.2.5 Effect of Salinity on Survival and Growth 40 4.1.2.6 Effect of Ammonia on Survival and Growth 46
4.2 Laboratory Experiments 49 Pyrethroid Toxicity at Environmentally Relevant Concentrations: Lethal and Sublethal Effects in the Amphipod Hyalella azteca
4.3 References 57
5. Tests with Striped Bass (Morone saxatilis) 61
5.1 Methods 61 5.1.1 Toxicity Testing 61 5.1.2 Statistical Analysis 64
5.2 Results 65
5.3 References 67
IV
CONTENTS, continued
Page
6. Tests with Delta Smelt (Hypomesus transpacificus) 70
6.1 Methods 70
6.1.1 2005 Toxicity Testing 70
6.1.2 2006 Toxicity Testing 70
6.1.3 2007 Toxicity Testing 76 6.1.4 Reference Toxicant Testing 81
6.1.4.1 Copper 81 6.1.4.2 Esfenvalerate 81
6.1.5 Statistical Analysis 82
6.2 Results 83
6.2.1 2005 Toxicity Testing 83
6.2.2 2006 Toxicity Testing 83
6.2.3 2007 Toxicity Testing 84
6.2.4 Ammonia and Delta Smelt Survival 85 6.2.4.1 Testing Period 2006 85 6.2.4.2 Testing Period 2007 86 6.2.4.3 Testing Period 2006-2007 87
6.2.5 Reference Toxicant Testing 89 6.2.5.1 Copper 89 6.2.5.2 Esfenvalerate 89
6.3 References 95
7. Sublethal Indicators of Contaminant Effects in Delta Species 96
7.1 Inhibition of Acetyl-Cholinesterase in Brain and Muscle Tissue 96 of Juvenile Striped Bass and Delta Smelt
7.1.1 Methods 96
7.1.2 Results 97 7.1.2.1 Striped Bass 97 7.1.2.2 Delta Smelt 98
V
Page
7.2 Expression of Stress Response Genes in Striped Bass 99 (Morone saxatilis)
7.2.1 Comparisons of Tissue-Specific Transcription of Stress 99 Response Genes with Whole Animal Endpoints of Adverse Effect in Striped Bass (Morone saxatilis) – Geist et al. (2007)
7.2.2 Tissue-Specific Expression of Stress Response Genes 99 in Striped Bass Exposed to Water Samples from the Sacramento-San Joaquin Delta
7.2.3 Tissue-Specific Expression of Stress Response Genes 106 in Striped Bass Exposed to Extracts of Semi-Permeable Membrane Devices (SPMD) Deployed in the Sacramento-San Joaquin Delta
7.3 Identification of molecular biomarkers in the Delta Smelt 109 (Hypomesus transpacificus) using microarray technology
7.4 References 119
8. Quality Assurance/Quality Control 121 8.1 Reference Toxicant Tests 121
8.2 Field Duplicates 122
8.3 Bottle Blanks 123
8.4 Trip Blanks 123
8.5 Test Acceptability Criteria 123
8.6 Deviations 123
8.7 Completeness 124
APPENDICES A. Summary Tables of H. azteca Toxicity Tests and Water Chemistry
B. H. azteca Growth Analysis
C. Summary Tables of Striped Bass Toxicity Tests and Water Chemistry
D. Summary Tables of Delta Smelt Toxicity Tests and Water Chemistry
E. Summary Tables of Fathead Minnow Toxicity Test and Water Chemistry
F. Quality Assurance/Quality Control
G. Geist et al. (2007). Aquatic Toxicology 85:28–39
VI
1. Executive Summary
This report covers the project period of January 1, 2006 – December 31, 2007. Relevant information obtained in 2005 is also included. The study described here encompasses a sampling and toxicity monitoring program in the Sacramento-San Joaquin Delta (including several sites in Suisun Bay and the Napa River), and the development of molecular stress indicators for two fish species of concern, delta smelt (Hypomesus transpacificus) and striped bass (Morone saxatilis). Biweekly toxicity tests were performed using Hyalella azteca, an amphipod species resident in the Delta. Toxicity testing protocols were developed for larval and juvenile delta smelt and juvenile striped bass, and water samples from the Delta were tested during late spring/early summer using these fish species.
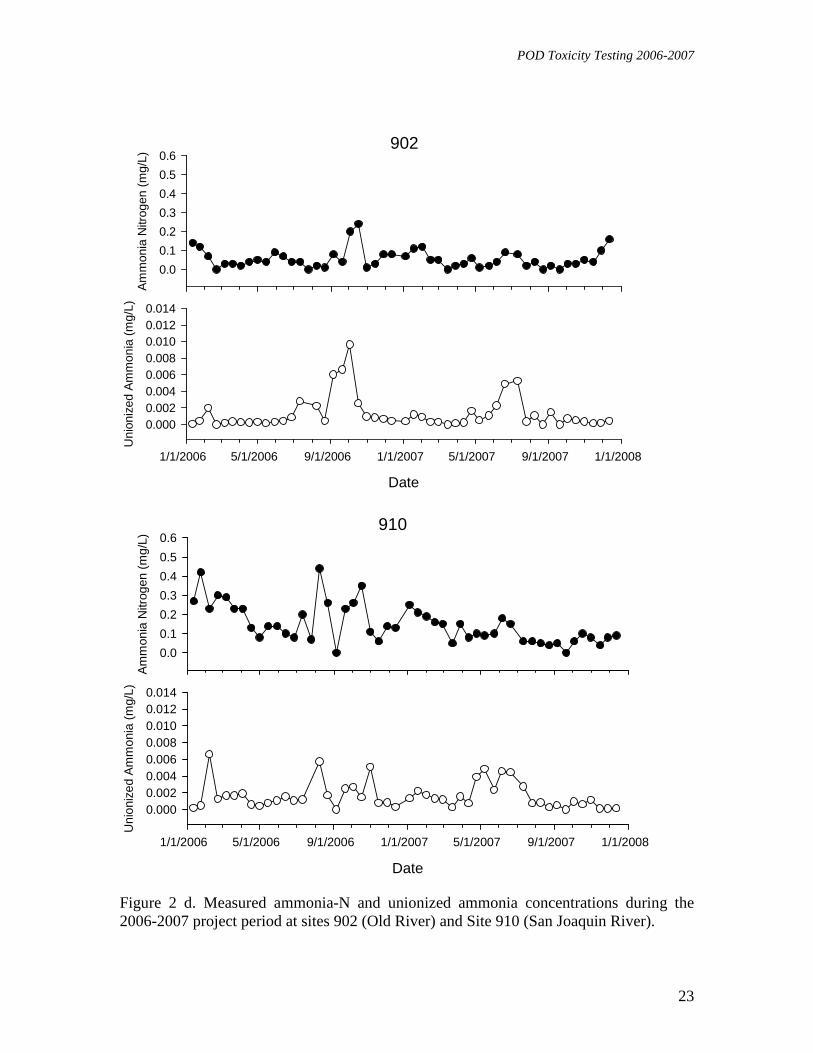
Water Quality at Field Sites: Site-specific water quality parameters were routinely monitored in the field at the time of sampling. During the project period, temperature ranged from 5.8 (site 902) to 28.6oC (Light 55), dissolved oxygen from 5.1 (site 609) to 13.9 mg/L (Light 55), specific conductivity from 86 (site 915) to 30,260 µS/cm (site 323), pH from 7.6 (Hood) to 8.7 (site 915) and turbidity from 1.4 (site 504) to 219.7 NTU (site 323). Mean total ammonia-N concentrations were highest at stations Hood and 711, both on the lower Sacramento River however, annual and seasonal differences were apparent. Unionized ammonia concentrations were highest at sites 405 (Benicia), 711 (Sacramento River nr. Rio Vista) and Light 55 (Sacramento Deep Water Channel). Other sites with seasonally high NH3 concentrations were 902 (summer 2006), 602 (winter 2007), and 910 (spring 2007).
Toxicity Monitoring with H. azteca: Monitoring sites were selected among the California Department of Fish and Game Townet Survey stations, and in accordance with the prevalent distribution patterns of fish species of concern. Water samples were collected twice a month at sites 323, 340, 405, 504, 508, 602, 609, 704, 711, 804, 812, 902, 910, 915, and Light 55 in the Sacramento River Deep Water Channel (for more detailed information see Table 1), and tested using a 10-day H. azteca bioassay with growth and survival as chronic and acute endpoints, respectively. Routine partial toxicity identification evaluation (TIE) tests were conducted on all water samples with the chemical piperonyl-butoxide (PBO), a chemical synergist/antagonist, to provide early evidence for the presence of two classes of toxic insecticides, organophosphates and pyrethroids. If toxicity (>50% survival within 7 days) was observed in a water sample, TIEs were initiated immediately to identify the causative agents. Water samples were submitted for chemical analyses whenever significant acute or chronic toxicity was observed.
Acute Toxicity to H. azteca: Of 693 water samples tested during the project period, fifteen (2.2%) caused a significant reduction in amphipod survival. Most of these were collected from sites in the lower Sacramento River (Hood, site 711), the Deep Water Shipping Channel (Light 55) and site 405 (Benicia). In addition, one sample collected on 7/10/07 from site 602 (Suisun Bay) and one sample from site 323 (7/12/06, San Pablo Bay) were acutely toxic. The majority of toxic samples (93.3%) were collected in 2007, mostly during the second half of the year (July-December). Samples from the Sacramento River at Hood were only tested in the second part of 2007, and 38% of these samples were acutely toxic to H. azteca. The observed pattern suggests an inverse
VII
relationship of toxicity with river flows, and compromised water quality in the lower Sacramento River/Deep Water Shipping Channel and Carquinez Strait near Benicia.
PBO Effect on H. azteca Survival: Significant changes in acute toxicity due to
addition of PBO were seen in seven samples (1%) collected from the Sacramento River at Hood, sites 711, 704, Light 55, 340 (Napa River), 405 (Benicia) and 323 (San Pablo Bay). The observed response suggests the presence of organophosphate insecticides in samples collected from Hood and Light 55 (both in Oct. 2007), and the presence of pyrethroid insecticides in samples collected at site 323, 340, and 405. There is some evidence that pyrethroids were also present in samples collected on July 10, 2007 from sites 804, 504 and 508, three adjacent field sites. TIEs performed on toxic samples from sites 323 and 405 indicated that non-polar organic chemicals contributed to the observed toxic effects, while toxicity was lost in samples from sites 711 and Hood by the time TIEs could be performed (ca. 14 days after sample collection). Analytical chemistry confirmed that the sample from site 340 contained 3 ng/L cyfluthrin and 16 ng/L esfenvalerate, and two samples from site 405 contained 3 ng/L esfenvalerate, and 5 ng/L permethrin, respectively, but most samples did not contain detectable amounts of insecticides. Studies to trace the fate of pyrethroid insecticides during sampling and testing are scheduled.
Chronic Toxicity to H. azteca: Addition of PBO to the ambient sample resulted in a significant reduction or increase in amphipod growth (relative weight at test termination) when compared to the ambient sample in a total of 33 water samples (4.9% of samples tested). PBO addition led to increased growth in 3, and decreased growth in 30 samples. Significant PBO effects were detected in 14 samples in 2006 (4.1%), and 19 samples in 2007 (5.7%). Water samples where PBO addition resulted in a reduction in growth were primarily collected from sites in the South-Eastern Delta (902, 910, 915), the lower Sacramento River (Light 55, 711) and Suisun Bay (609, 602, 508). Three water samples where PBO addition resulted in an increase in growth were collected from sites 902, 910 and 812 on June 6, 2007. Patterns where several neighboring sites sampled on the same date triggered the same response in bioassay organisms were seen repeatedly, and most of these samples were collected in the spring or summer. Several of these samples contained detectable amounts of pyrethroid pesticides: Site 902 sampled on 8/22/06 contained 5 ng/L cyfluthrin and 24 ng/L permethrin; site 340 sampled 2/13/07 contained 63 ng/L cyfluthrin, and sites 915 and 508 sampled on 2/28/07 and 3/1/07, respectively, contained 2 and 3 ng/L lambda-cyhalothrin. A sample from Light 55 collected 2/1/07 contained 6 ng/L diazinon.
Site-Specific Growth of H. azteca: Growth data from toxicity tests conducted during 2006 with H. azteca was analyzed to determine if any site-specific effects on growth were detectable. No strong evidence was found that would suggest major site-to-site or seasonal differences in H. azteca growth that could not be accounted for by differences in conductivity. However, season-specific analysis of growth data revealed trends in growth deviations from expected values at sites 711, 405 and 602 (lower) and 704, 804, 902, 915 (higher).
Effect of Ammonia on H. azteca Survival and Growth: Analysis of the entire dataset revealed that ammonia-N and unionized ammonia had significant effects on H.
VIII
azteca growth, but no significant effect on H. azteca survival. When analyzed by site, total ammonia-N concentrations were negatively correlated to survival at Light 55, but positively correlated to amphipod survival at sites 504, 609 and 804. Ammonia-N and unionized ammonia concentrations were negatively related to H. azteca growth at sites 323, 812 and Light 55. Analysis of ammonia effects across sites for different seasons determined that survival and growth during the winter of 2007 was negatively associated with levels of ammonia-N and unionized ammonia.
Laboratory Experiments with H. azteca: A study was performed to evaluate the toxicity of environmentally relevant concentrations and mixtures of two pyrethroid pesticides detected in a water sample collected on August 22, 2006 at Site 902 (Old River at the mouth of Holland Cut. The LC50 for cyfluthrin alone was determined to be 0.0065 ppb, and the LC50 for permethrin alone was estimated to be 0.0465 ppb. The addition of 25 ppb PBO doubled the toxicity of cyfluthrin and more than tripled the toxicity of permethrin. The permethrin and cyfluthrin mixture resulted in higher, but slightly less-than-additive toxicity than either pesticide alone.
Toxicity Monitoring with Striped Bass: To date, just a few pilot tests have been performed with larval striped bass due to the difficulties in obtaining larvae of this particular strain of striped bass. Two tests with juvenile (80-90 d old) fish were conducted with water collected from sites 340, 508, 609, 711, 910 and 915 on July 30, 2005 and August 25, 2006. No significant effects on survival or growth were observed. The sensitivity of juvenile (81-90 d) striped bass to two individual toxicants, copper and the pyrethroid insecticide esfenvalerate was investigated. The 7-d LC50 for copper was determined to be 254 µg/L Cu2+ (dissolved). For esfenvalerate, the 24-h LC50 was 2.17 µg/L, and the 24-h EC25 (swimming behavior) was 1.07 µg/L.
Toxicity Monitoring with Delta Smelt: Test protocols were developed for toxicity tests using delta smelt larvae at different stages of development (20-92 d) and juveniles. While static renewal tests were performed in 2006, a flow-through system was used in 2007. This system proved to be superior to the static renewal method. Delta smelt were obtained from the UC Davis Fish Conservation and Culture Laboratory, Byron, CA, and exposed for 7 days to water samples from sites 711, 910, 915, 609, 504 and 340 (2006), or 711, Hood, 915, Vernalis, 609, 504 and 340 (2007) as well as EC and turbidity controls. The sensitivity of delta smelt to copper and the pyrethroid insecticide esfenvalerate, was investigated.
Turbidity and EC/salinity were the two most important factors determining survival of delta smelt larvae overall, particularly for larvae less than 44 days old. These younger larvae (20-36 d old) tended to survive poorly in low EC samples from the lower Sacramento River, Old River and the San Joaquin River, as well as in the low EC control (150-180 uS/cm) even when turbidity was adjusted to 10 NTU. Their survival was highest in water from the Napa River (site 340), and Montezuma Slough (site 609), which had both saline (EC>4000 uS/cm) and the most turbid water. Larvae that were 44 d old and older appeared to be less dependent on high turbidity and salinity. Survival was significantly lower than in the low EC control among delta smelt exposed to samples from Hood (collected June 6, 2007) and site 711 (July 26, 2007), both in the lower Sacramento River. Although EC and turbidity were low at these sites, the reduced survival cannot be explained by these factors alone.
IX
Effect of Ammonia on Delta Smelt Larvae: Data analysis results showed a significant correlation of unionized ammonia concentrations (maximum laboratory value measured during test) and larval survival in static renewal tests performed in 2006, with an approximate LC50 of 0.012 mg/L NH3. The same analysis on 2007 data showed no such correlation. Taking into account the effects of EC, statistical analysis of the complete 2006-2007 data showed no correlation of larval 7-d survival with NH3 concentration in our tests, where maximum unionized ammonia concentrations were <0.016 mg/L. However, in the 2006 data set we continued to see a marginally significant (p=0.06) correlation of 7-d survival and unionized ammonia. It is important to note that the laboratory tests were carried out with larvae of different ages (20-92 days old). Targeted tests to determine ammonia toxicity to delta smelt are scheduled.
Reference Toxicants: A 7-day test with juvenile (90 d) delta smelt yielded LC50 values for copper toxicity of 33.5 µg/L (96 h), and 24.7 µg/L (7 d). The 24-h LC50 of the pyrethroid esfenvalerate for 10-d to 204-d old delta smelt was 0.1-0.76 µg/L (nominal conc.), and the 24-hEC25 for swimming impairment was 0.03-0.28 µg/L, indicating that delta smelt larvae are highly sensitive to this insecticide, and that sensitivity is inversely related to age/size.
Sublethal Indicators of Contaminant Effects in Delta Species: In an effort to develop field-applicable tools for the detection of stressor-specific, sublethal effects in striped bass and delta smelt tissues, biochemical and molecular biomarker protocols were developed and applied.
Inhibition of Acetyl-Cholinesterase in Brain and Muscle Tissue of Juvenile Striped Bass and Delta Smelt: For organophosphate (OP) and carbamate insecticides, the primary mechanism of toxic action is the inhibition of the enzyme acetylcholinesterase (AChE), which is commonly used as a diagnostic tool for sublethal OP and carbamate exposure and effect. For this study, we quantified AChE activity in brain and muscle of juvenile striped bass and delta smelt exposed to water samples from the Delta or to copper. No effects on AChE activity were seen after exposure to water samples from the Delta collected on July 27/28, 2005 (striped bass) and on August 30/31, 2005 (delta smelt) from CDFG stations 340, 711, 910 and 915. Copper did not affect AChE activity at sublethal Cu+ concentrations however, at 50 ppb Cu+ enzyme activity in the brain of delta smelt was significantly reduced.
Expression of Stress-Responsive Genes in Striped Bass Exposed to Copper and Esfenvalerate: Method development and results of laboratory tests were published by Geist et al. (2007). The effects of two reference toxicants, copper (Cu) and the pyrethroid insecticide esfenvalerate, on lethal (mortality) and sublethal endpoints (growth, swimming behavior, and transcription levels of stress response genes) were investigated in juvenile (81-90 d old) striped bass (Morone saxatilis). Cellular stress response markers for proteotoxicity (HSP70, HSP90), phase I detoxification mechanism (CYP1A1), metal-binding (metallothionein), as well as immune-function and pathogen-defense (TGF-B, Mx-protein, nRAMP) were developed. Quantitative real-time TaqMan-PCR was used to examine tissue-specific changes in the transcriptome of liver, spleen, white muscle, anterior kidney and gills after 7-d Cu exposures and 24-h esfenvalerate exposures. On the transcriptome level, exposure to Cu showed strongest effects on the transcription of
X
metallothionein in spleen tissue, causing a 4-fold increase of mRNA at 42 ppb total Cu and a 10-fold increase at 160 ppb Cu. Exposure to Cu also caused significant tissue-specific changes in gene transcription for immune-system related genes. Esfenvalerate exposure had tissue-specific effects on the transcription of HSP70, HSP90 and CYP1A1. The most significant effects were detected in liver tissue after exposure to 0.64 µg/L esfenvalerate. Results show that the stress response at the transcriptome level is a more sensitive indicator for Cu and esfenvalerate exposures at low concentrations than swimming behavior, growth or mortality.
Expression of Stress-Responsive Genes in Striped Bass Exposed to Delta Water Samples: Tissue samples of juvenile striped bass exposed for 7 d to Delta water samples collected on August 22/23, 2006 from CDFG stations 340, 508, 609, 711, 910 and 915, were analyzed for the following stress- or contaminant-responsive genes: for proteotoxicity (HSP70, HSP90), phase I detoxification mechanism (CYP1A1), metal-binding (metallothionein), immune-function and pathogen-defense (TGF-B, Mx-protein, nRAMP) as well as estrogenic endocrine disruption (Vitellogenin). Significant responses were seen at sites 910, 609 and 711. Data analysis is ongoing.
Expression of Stress-Responsive Genes in Striped Bass Exposed to SPMD Extracts from Delta Sites: To assess the presence and effects of bioavailable lipophilic contaminants in the estuary Semi-Permeable Membrane Devices (SPMDs) were deployed in three locations in the Delta from August 16 to September 13, 2005, by D. Ostrach, UC Davis. SPMDs bind nonionic organic compounds and some neutral organo-metal complexes. SPMD extracts were used in 3-d injection experiments with striped bass. Spleen and liver samples were analyzed for molecular biomarkers described above. SPMD extracts from all three field sites produced gene responses in the liver, but not the spleen, of exposed fish. Extract from the Collinsville site down-regulated transcription of Cyp1a1 and Mt, while extracts from Sand Mound and Napa down-regulated transcription of Mt only. Vitellogenin was slightly increased in fish exposed to SPMD extracts from Collinsville. Further data analysis is ongoing.
Expression of Stress-Responsive Genes in Delta Smelt (DNA-Microarray): In order to understand the effects of contaminants upon Hypomesus transpacificus a microarray with over 8,000 Expressed Sequence Tags (ESTs) was constructed and applied to measure gene responses on 60-day old juveniles exposed to 50 µg/L copper for 7 days. The sublethal effects of copper exposure in the delta smelt appear to be on neuro-muscular activity, respiration and metabolism. Expression of a number of genes involved in cardio-muscular contraction, neuro-transmission, oxidative stress, metal ion binding, immunity and systemic inflammation, and digestion was altered in response to copper exposure. Amongst the responding genes there was a significant up-regulation of osteonectin, a source of copper-binding peptides, which may be indicative of tissue damage caused by excess copper. Future work will include additional microarray analyses of delta smelt exposed to different toxicants, and investigation of a selected suite of genes from these microarray assessments, using real-time quantitative PCR to develop informative molecular biomarkers of stress and exposure in the delta smelt.
POD Toxicity Testing 2006-2007
1
2. Background and Approach
In the last several years, abundance indices of numerous pelagic fish species residing in
the Sacramento-San Joaquin Delta of California, USA, have shown marked declines and record lows for the endemic delta smelt (Hypomesus transpacificus), age-0 striped bass (Morone saxatilis), longfin smelt (Spirinchus thaleichthys) and threadfin shad (Dorosoma petenense)(Stevens and Miller, 1983; Stevens et al., 1985; Moyle et al., 1992; Moyle and Williams, 1990).While several of these species - including in particular longfin smelt and juvenile striped bass - have shown evidence of long-term declines, there appears to have been a precipitous “step-change” to very low abundance during the period 2002-2004 (Bryant and Souza, 2004; Hieb et al., 2005; Feyrer et al., 2007). It is presently unclear what might have caused this critical population decline, but toxic contaminants may be one of several factors acting individually or in concert to lower pelagic productivity.
Agricultural, industrial, urban and mining sources release contaminants into waterways,
and water quality assessment studies indicate that the criteria for the protection of freshwater aquatic life have been exceeded in many Central Valley streams (Domagalski et al., 2000; Dubrovsky et al., 1998; DeVlaming et al., 2000; Werner et al., 2000). While measured concentrations of chemical contaminants were generally below acutely toxic levels for fish, sublethal toxic effects may result in energy reallocation, increased susceptibility to disease and predation, reduced reproductive success and behavioral abnormalities, with the potential to decrease evolutionary fitness (Scholz et al., 2000; Sorensen, 1991; DeVlaming et al., 2000; Sandahl et al., 2005, Clifford et al., 2005, Floyd et al., 2008).
Ecological effects of aquatic contaminants are difficult to detect and quantify. Available
ecotoxicological tools for screening contaminant exposures in the field include bioassays, Toxicity Identification Evaluation methods (TIEs) or risk assessments based on existing data (Rand, 1995; US EPA, 1989 a, b; 1991; 2000). On a level of higher resolution, altered cellular and molecular responses to stressors can be used as powerful tools for gaining a better understanding of the mechanisms involved, and thus as biomarkers for the identification of environmental impacts on aquatic ecosystems (Huggett et al., 1992). The rising field of ecotoxicogenomics links the two disciplines genomics and ecotoxicology, mostly by identifying cellular biomarkers and biosignals at the transcriptome level as indicators for the exposure to contaminants. In a first step, microarray approaches are used to initially identify suites of up- or downregulated genes, and changes in gene expression of selected genes are quantified subsequently by quantitative real-time PCR. However, for non-model species the high number of unidentifiable genes from random libraries and the comparatively high costs of microarray development and use can pose substantial limitations to this approach. In addition, only few studies simultaneously consider multiple tissues and tissue-specific effects when carrying out studies on the transcriptome.
During a 2005 four-month pilot study involving toxicity testing of Delta water samples,
significant acute and chronic toxicity to amphipods (Hyalella azteca) was detected at five out of ten sampling sites: the Napa River (340), the Old River (902), the San Joaquin River (910), the San Joaquin River, 1 km upstream from the mouth (804), and the Sacramento River (711) in 6 of
POD Toxicity Testing 2006-2007
2
131 water samples tested (4.6%). Our 2006-07 study continued this approach with a spatially and temporally expanded sampling and toxicity testing program. Fifteen sites were sampled twice a month in accordance with the prevalent distribution patterns of fish species of concern. The amphipod species, H. azteca, an important component of the Delta ecosystem, was used for routine toxicity testing. This species is resident in the Delta, sensitive to contaminants, and is routinely used in toxicity testing programs throughout the Nation. Routine partial TIE tests (addition of PBO) were conducted to provide early evidence for the presence of two classes of toxic insecticides, organophosphates and pyrethroids. If toxicity was observed at a site through initial screening, Toxicity Identification Evaluation (TIE) procedures were to be initiated immediately to identify the causative agents. In addition to the conventional bioassay approach, molecular biomarkers are being developed and validated for two fish species of concern, striped bass (M. saxatilis) and delta smelt (H. transpacificus). The expression of certain genes in response to environmental stressors is considered to be more sensitive, and potentially stressor-specific, and is of promise for the identification of stressor impacts in the field.
Questions addressed:
1) Is water in the Delta and the Napa River toxic to pelagic fish and fish food organisms?
2) What is the spatial and temporal distribution of water column toxicity in areas of the Delta that are important for fish species of concern?
3) What are the primary toxicants in Delta water samples?
3. Toxicity Monitoring 3.1 Sampling Sites
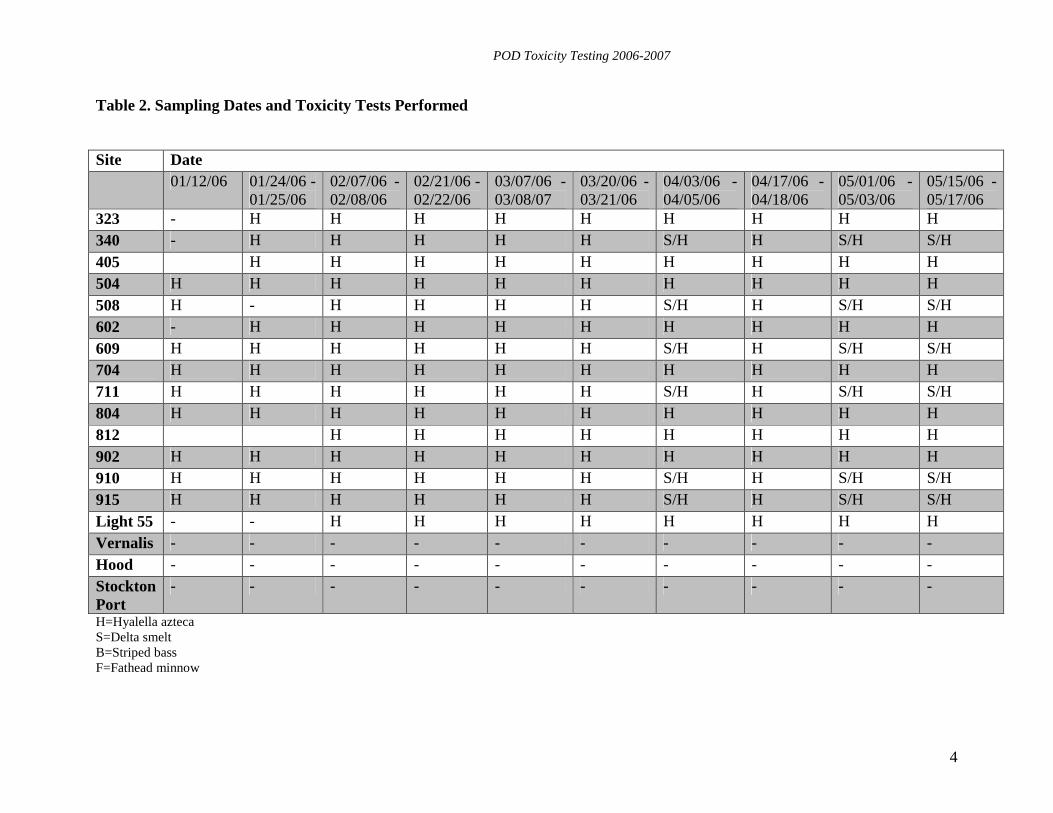
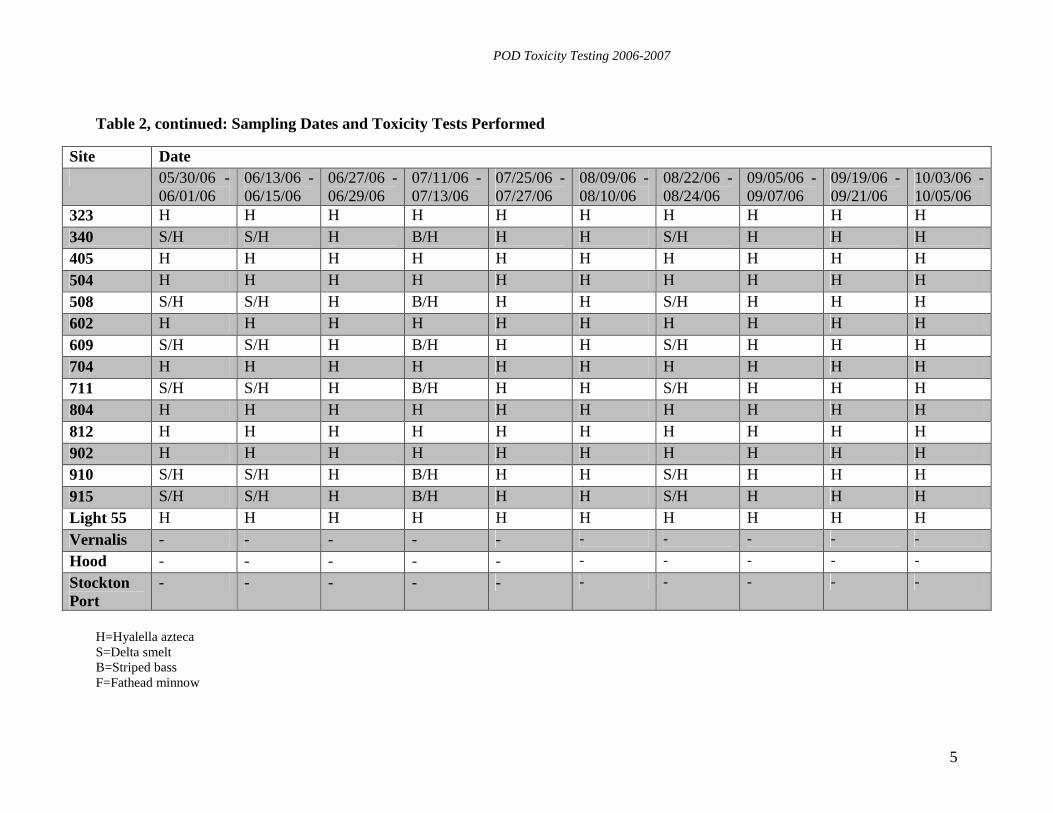
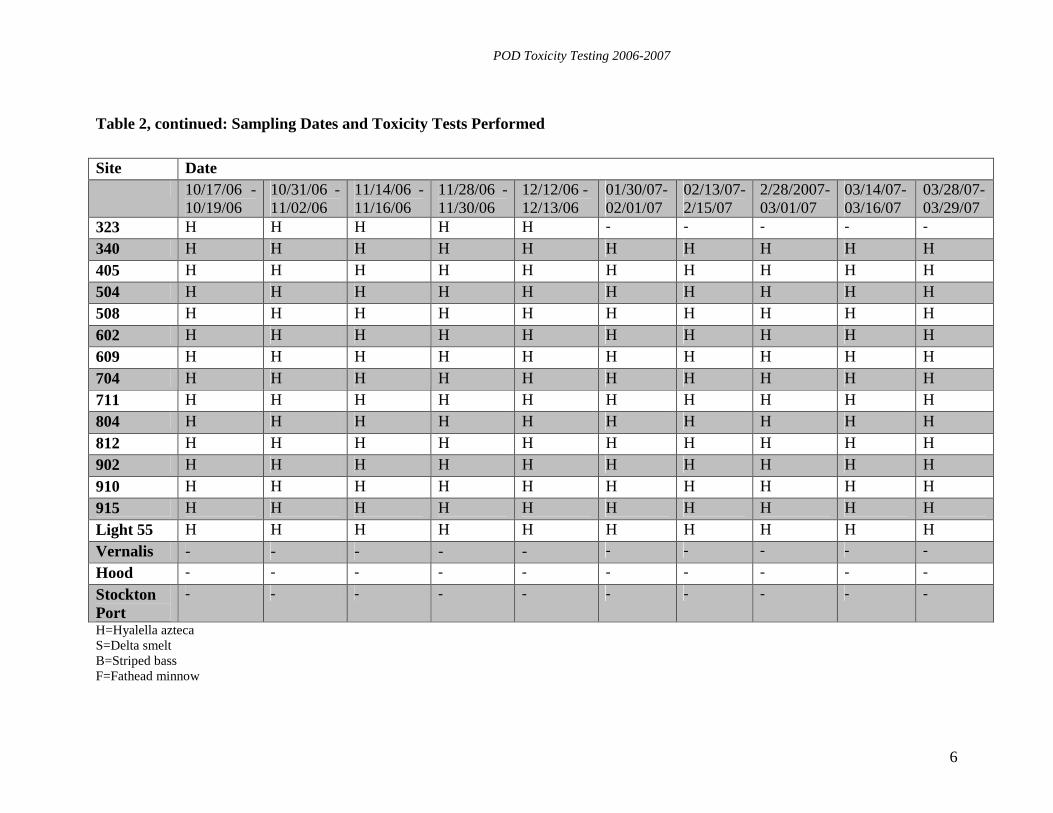
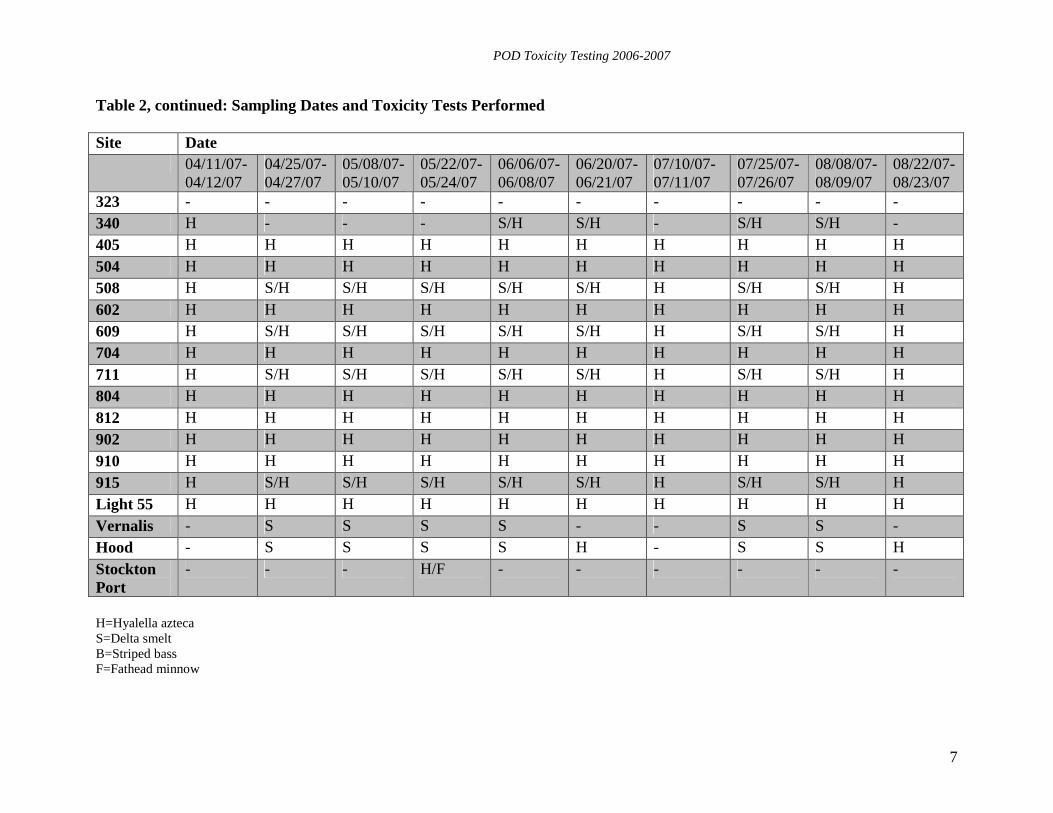
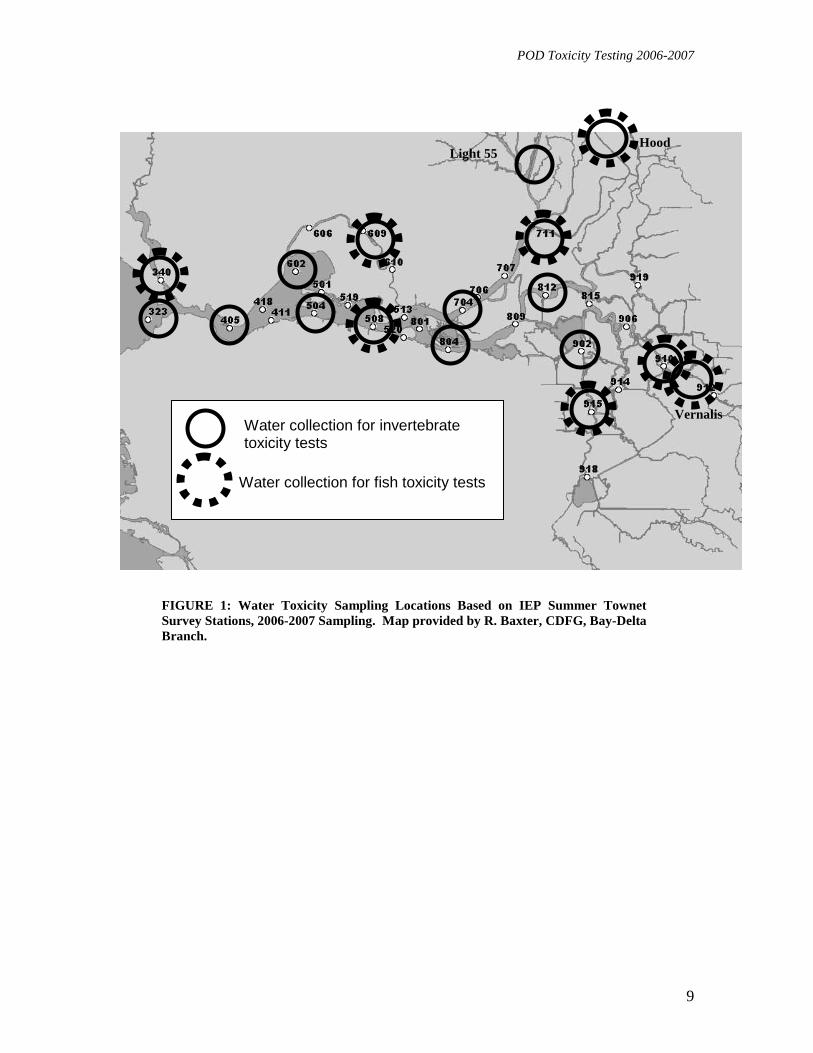
Sampling occurred on a bi-weekly basis from the period of 1 January, 2006 through 31 December, 2007 (Tables 1, 2, Fig. 1). Of the 17 sampling sites, six (2006) to seven (2007) were tested with a fish species, delta smelt and striped bass, in addition to invertebrates. Due to a change in testing methods for delta smelt in 2007 from static renewal methods to flow-through exposures, water from the San Joaquin River was collected by car at the DWR Monitoring Station at Vernalis replacing site 910 (sampled by boat in 2006). The DWR Monitoring Station at Hood was added as a sampling site for delta smelt testing in 2007, and we continued testing samples from this site with H. azteca from the summer of 2007 until the end of the project period. All sampling sites lie within the greater Sacramento-San Joaquin Delta. Only one sample was collected from “Stockton Port” following a possible fish kill in the vicinity of this site, and tested using fathead minnow larvae and H. azteca. In addition, 10 water and 10 sediment samples were collected on 13-15 June, 2006 for chemical analysis of pesticides by the Department of Pesticide Regulation.
POD Toxicity Testing 2006-2007
3
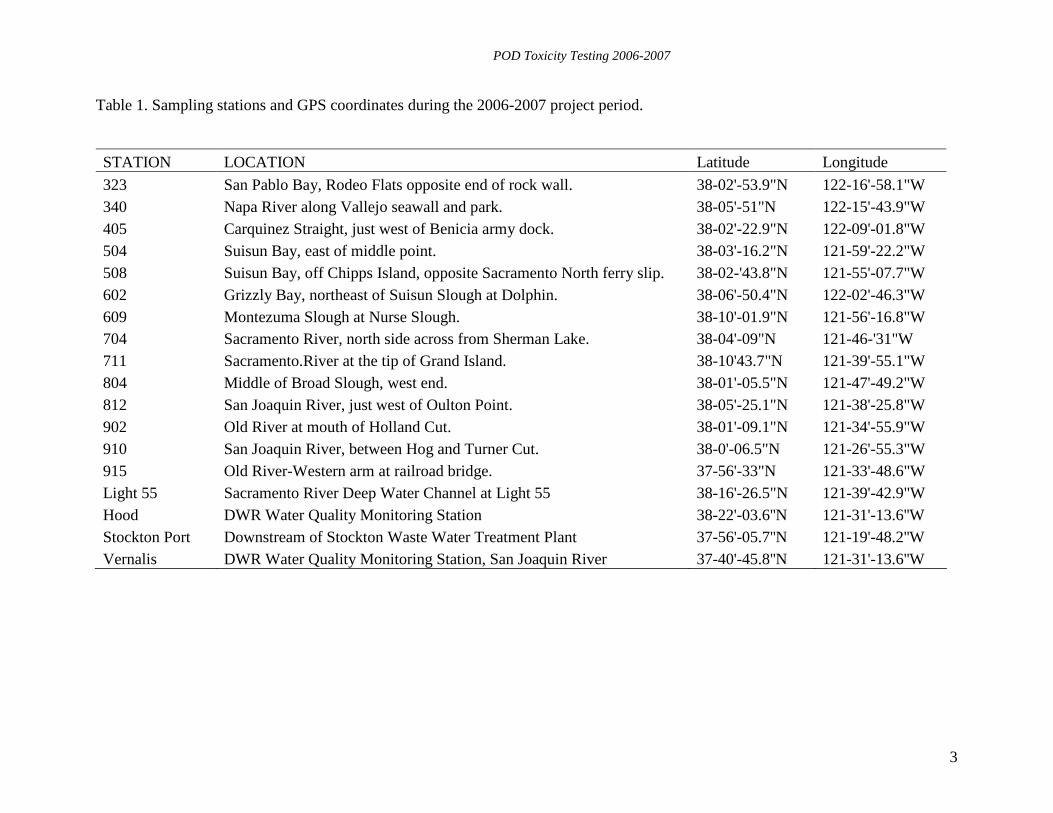
Table 1. Sampling stations and GPS coordinates during the 2006-2007 project period.
STATION LOCATION Latitude Longitude
323 San Pablo Bay, Rodeo Flats opposite end of rock wall. 38-02'-53.9"N 122-16'-58.1"W 340 Napa River along Vallejo seawall and park. 38-05'-51"N 122-15'-43.9"W 405 Carquinez Straight, just west of Benicia army dock. 38-02'-22.9"N 122-09'-01.8"W 504 Suisun Bay, east of middle point. 38-03'-16.2"N 121-59'-22.2"W 508 Suisun Bay, off Chipps Island, opposite Sacramento North ferry slip. 38-02-'43.8"N 121-55'-07.7"W 602 Grizzly Bay, northeast of Suisun Slough at Dolphin. 38-06'-50.4"N 122-02'-46.3"W 609 Montezuma Slough at Nurse Slough. 38-10'-01.9"N 121-56'-16.8"W 704 Sacramento River, north side across from Sherman Lake. 38-04'-09"N 121-46-'31"W 711 Sacramento.River at the tip of Grand Island. 38-10'43.7"N 121-39'-55.1"W 804 Middle of Broad Slough, west end. 38-01'-05.5"N 121-47'-49.2"W 812 San Joaquin River, just west of Oulton Point. 38-05'-25.1"N 121-38'-25.8"W 902 Old River at mouth of Holland Cut. 38-01'-09.1"N 121-34'-55.9"W 910 San Joaquin River, between Hog and Turner Cut. 38-0'-06.5"N 121-26'-55.3"W 915 Old River-Western arm at railroad bridge. 37-56'-33"N 121-33'-48.6"W Light 55 Sacramento River Deep Water Channel at Light 55 38-16'-26.5"N 121-39'-42.9"W Hood DWR Water Quality Monitoring Station 38-22'-03.6''N 121-31'-13.6''W Stockton Port Downstream of Stockton Waste Water Treatment Plant 37-56'-05.7''N 121-19'-48.2''W Vernalis DWR Water Quality Monitoring Station, San Joaquin River 37-40'-45.8''N 121-31'-13.6''W
POD Toxicity Testing 2006-2007
4
Table 2. Sampling Dates and Toxicity Tests Performed
H=Hyalella azteca S=Delta smelt B=Striped bass F=Fathead minnow
Site Date 01/12/06 01/24/06 -
01/25/06 02/07/06 - 02/08/06
02/21/06 - 02/22/06
03/07/06 - 03/08/07
03/20/06 - 03/21/06
04/03/06 - 04/05/06
04/17/06 - 04/18/06
05/01/06 - 05/03/06
05/15/06 - 05/17/06
323 - H H H H H H H H H 340 - H H H H H S/H H S/H S/H 405 H H H H H H H H H 504 H H H H H H H H H H 508 H - H H H H S/H H S/H S/H 602 - H H H H H H H H H 609 H H H H H H S/H H S/H S/H 704 H H H H H H H H H H 711 H H H H H H S/H H S/H S/H 804 H H H H H H H H H H 812 H H H H H H H H 902 H H H H H H H H H H 910 H H H H H H S/H H S/H S/H 915 H H H H H H S/H H S/H S/H Light 55 - - H H H H H H H H Vernalis - - - - - - - - - - Hood - - - - - - - - - - Stockton Port
- - - - - - - - - -
POD Toxicity Testing 2006-2007
5
Table 2, continued: Sampling Dates and Toxicity Tests Performed
H=Hyalella azteca S=Delta smelt B=Striped bass F=Fathead minnow
Site Date 05/30/06 -
06/01/06 06/13/06 - 06/15/06
06/27/06 - 06/29/06
07/11/06 - 07/13/06
07/25/06 - 07/27/06
08/09/06 - 08/10/06
08/22/06 - 08/24/06
09/05/06 - 09/07/06
09/19/06 - 09/21/06
10/03/06 - 10/05/06
323 H H H H H H H H H H 340 S/H S/H H B/H H H S/H H H H 405 H H H H H H H H H H 504 H H H H H H H H H H 508 S/H S/H H B/H H H S/H H H H 602 H H H H H H H H H H 609 S/H S/H H B/H H H S/H H H H 704 H H H H H H H H H H 711 S/H S/H H B/H H H S/H H H H 804 H H H H H H H H H H 812 H H H H H H H H H H 902 H H H H H H H H H H 910 S/H S/H H B/H H H S/H H H H 915 S/H S/H H B/H H H S/H H H H Light 55 H H H H H H H H H H Vernalis - - - - - - - - - -
Hood - - - - - - - - - -
Stockton Port
- - - - - - - - - -
POD Toxicity Testing 2006-2007
6
Table 2, continued: Sampling Dates and Toxicity Tests Performed
H=Hyalella azteca S=Delta smelt B=Striped bass F=Fathead minnow
Site Date 10/17/06 -
10/19/06 10/31/06 - 11/02/06
11/14/06 - 11/16/06
11/28/06 - 11/30/06
12/12/06 - 12/13/06
01/30/07-02/01/07
02/13/07-2/15/07
2/28/2007-03/01/07
03/14/07-03/16/07
03/28/07-03/29/07
323 H H H H H - - - - -
340 H H H H H H H H H H 405 H H H H H H H H H H 504 H H H H H H H H H H 508 H H H H H H H H H H 602 H H H H H H H H H H 609 H H H H H H H H H H 704 H H H H H H H H H H 711 H H H H H H H H H H 804 H H H H H H H H H H 812 H H H H H H H H H H 902 H H H H H H H H H H 910 H H H H H H H H H H 915 H H H H H H H H H H Light 55 H H H H H H H H H H Vernalis - - - - - - - - - -
Hood - - - - - - - - - -
Stockton Port
- - - - - - - - - -
POD Toxicity Testing 2006-2007
7
Table 2, continued: Sampling Dates and Toxicity Tests Performed Site Date 04/11/07-
04/12/07 04/25/07-04/27/07
05/08/07-05/10/07
05/22/07-05/24/07
06/06/07-06/08/07
06/20/07-06/21/07
07/10/07-07/11/07
07/25/07-07/26/07
08/08/07-08/09/07
08/22/07-08/23/07
323 - - - - - - - - - - 340 H - - - S/H S/H - S/H S/H - 405 H H H H H H H H H H 504 H H H H H H H H H H 508 H S/H S/H S/H S/H S/H H S/H S/H H 602 H H H H H H H H H H 609 H S/H S/H S/H S/H S/H H S/H S/H H 704 H H H H H H H H H H 711 H S/H S/H S/H S/H S/H H S/H S/H H 804 H H H H H H H H H H 812 H H H H H H H H H H 902 H H H H H H H H H H 910 H H H H H H H H H H 915 H S/H S/H S/H S/H S/H H S/H S/H H Light 55 H H H H H H H H H H Vernalis - S S S S - - S S - Hood - S S S S H - S S H Stockton Port
- - - H/F - - - - - -
H=Hyalella azteca S=Delta smelt B=Striped bass F=Fathead minnow

POD Toxicity Testing 2006-2007
8
Table 2, continued: Sampling Dates and Toxicity Tests Performed
H=Hyalella azteca S=Delta smelt B=Striped bass F=Fathead minnow
Site Date 09/04/07 -
09/05/07 09/19/07 - 09/21/07
10/02/07 - 10/04/07
10/16/07 - 10/18/07
10/30/07 - 11/01/07
11/13/07 - 11/15/07
11/27/07 - 11/29/07
12/11/07 - 12/13/07
323 - - - - - - - - 340 - - - - - - - - 405 H H H H H H H H 504 H H H H H H H H 508 H H H H H H H H 602 H H H H H H H H 609 H H H H H H H H 704 H H H H H H H H 711 H H H H H H H H 804 H H H H H H H H 812 H H H H H H H H 902 H H H H H H H H 910 H H H H H H H H 915 H H H H H H H H Light 55 H H H H H H H H Vernalis - - - - - - - - Hood H H H H H H H H Stockton Port
- - - - - - - -
POD Toxicity Testing 2006-2007
9
FIGURE 1: Water Toxicity Sampling Locations Based on IEP Summer Townet Survey Stations, 2006-2007 Sampling. Map provided by R. Baxter, CDFG, Bay-Delta Branch.
Water collection for invertebrate toxicity tests
Water collection for fish toxicity tests
Light 55
Vernalis
Hood
POD Toxicity Testing 2006-2007
10
3.2 Collection of Water Samples Staff from the UC Davis Aquatic Toxicology Laboratory (UCD ATL) and
California Department of Fish and Game (CDFG) collected water samples by boat. Water was pumped into HDPE cubitainers using a standard water pump. Subsurface grab samples were pumped from a depth of approximately 0.5 m into clean, 1-gal amber HDPE cubitainers for invertebrate tests and water chemistry, 1-gal clear HDPE cubitainers for chemical analysis and 5-gal clear HDPE cubitainers for fish tests. Water samples were transported, stored and preserved following protocols outlined in UCD ATL standard operating procedures (SOP), nos. 5-1 and 5-2 (UCD ATL, 2007). All cubitainers for water collection were labeled with the site number, collection date, time and initials of the sampler then rinsed three times with ambient sample water prior to filling. Eight gallons of water were collected from each of the fifteen sites for invertebrate testing, and up to thirty additional gallons were collected for fish testing.
Sediment samples were collected mid-channel using a handheld Stainless Steel
Petite Ponar Grab. Sample depth varied from four to twenty-three feet, depending on sample site depth. A 152X152 mm area was sampled for each grab. Approximately 1-liter was collected from the top 2 cm of the sample and placed into clean 500 ml Mason jars. Water for the California Department of Pesticide Regulation (DPR) was collected into certified clean 1-liter narrow mouth amber glass jars with Teflon®-lined lids as subsurface grabs. All samples were placed into an ice chest on wet ice for transport to UCD ATL. Ice was renewed as needed to keep sample temperature at 0-6ºC (USEPA 2002). Upon receipt at UCD ATL, water samples were stored in an environmental chamber at 4 + 2ºC. For the single sediment collection event, samples were preserved in a freezer until transfer to the Department of Pesticide Regulation (DPR).
3.3 Water Quality at Sampling Sites 3.3.1 General Water Quality Parameters
Field measurements including pH, specific conductivity (SC), electrical conductivity (EC), dissolved oxygen (DO) and temperature were recorded for each site and sampling time. DO and SC were measured using YSI 85 meters, and pH was measured with a Beckman 240 pH meter. DO/SC and pH meters were calibrated according to the manufacturer’s instructions at the start of each field day. Turbidity and ammonia nitrogen were measured within 24 hours of sample receipt at UCD ATL using a Hach 2100P Turbidimeter or a Hach DR/890 Colorimeter with the appropriate Hach AmVer Ammonia Test'N Tube Reagent Set. For ammonia measurements the “low range” test kit (0-2.5 mg/L N) was used first. If the maximum value was exceeded the “high range” test kit (0-50 mg/L N) was used. Unionized ammonia concentrations for all samples were calculated using measured total ammonia-N, as well as field temperature and field pH measurements for each station at the time of sampling. General weather conditions and GPS coordinates were recorded for each site and sampling event. Tables 3 a, b summarize minimum and maximum data by site. Sites are listed in order of increasing maximum EC.

POD Toxicity Testing 2006-2007
11
Table 3a. Minimum and maximum water quality parameters measured at sites sampled during 2006 - 2007
Temperature (oC)
DO (mg/L) pH SC (uS/cm) Turbidity (NTU) Sample
Min Max Min Max Min Max Min Max Min Max 323 10.7 21.9 6.7 10.5 7.3 7.8 174 30260 19.8 219.7 340 6.5 25.2 5.8 13.5 7.1 8.6 217 25760 4.9 89.5 405 7.9 23.1 7.0 12.0 6.7 8.2 163 28200 6.1 205.7 504 7.2 24.6 7.0 12.5 6.3 8.1 123 17540 1.4 83.8 508 7.2 24.7 7.3 13.0 6.3 8.1 100 12250 4.2 83.4 602 7.4 22.7 7.5 12.5 6.8 8.1 145 18860 4.8 200.7 609 6.7 26.3 5.1 12.4 6.1 7.9 188 15130 8.6 109.2 704 7.2 25.3 6.8 13.5 6.6 8.2 107 5540 4.6 128.6 711 6.1 25.0 6.8 13.9 6.6 8.3 95 695 2.3 60.8 804 7.2 26.5 6.5 12.9 6.6 8.5 114 5550 4.4 29.0 812 6.7 26.3 6.5 13.6 6.9 8.4 94 832 3.0 13.8 902 5.8 27.2 7.1 12.9 6.3 8.7 132 830 2.2 13.2 910 6.6 28.6 5.3 12.9 6.6 8.3 115 702 3.0 13.0 915 6.6 28.0 6.4 13.3 6.2 8.7 86 721 2.0 10.9 Hood 10.8 23.7 7.0 11.4 7.0 7.6 124 328 2.8 14.1 Light 55 6.4 28.6 6.6 13.9 6.8 8.3 96 534 9.5 68.9 Vernalis 19.6 24.7 9.7 11.0 8.1 8.4 452 587 4.4 13.6 Cache Slough@Ulatis1 20.3 - 8.5 - 7.8 - 272 - 27.7 - Stockton WWTF1 20.3 - 11.0 - 8.8 - 345 - 31.3 -
1 Site was sampled and tested only once during the project period.
POD Toxicity Testing 2006-2007
12
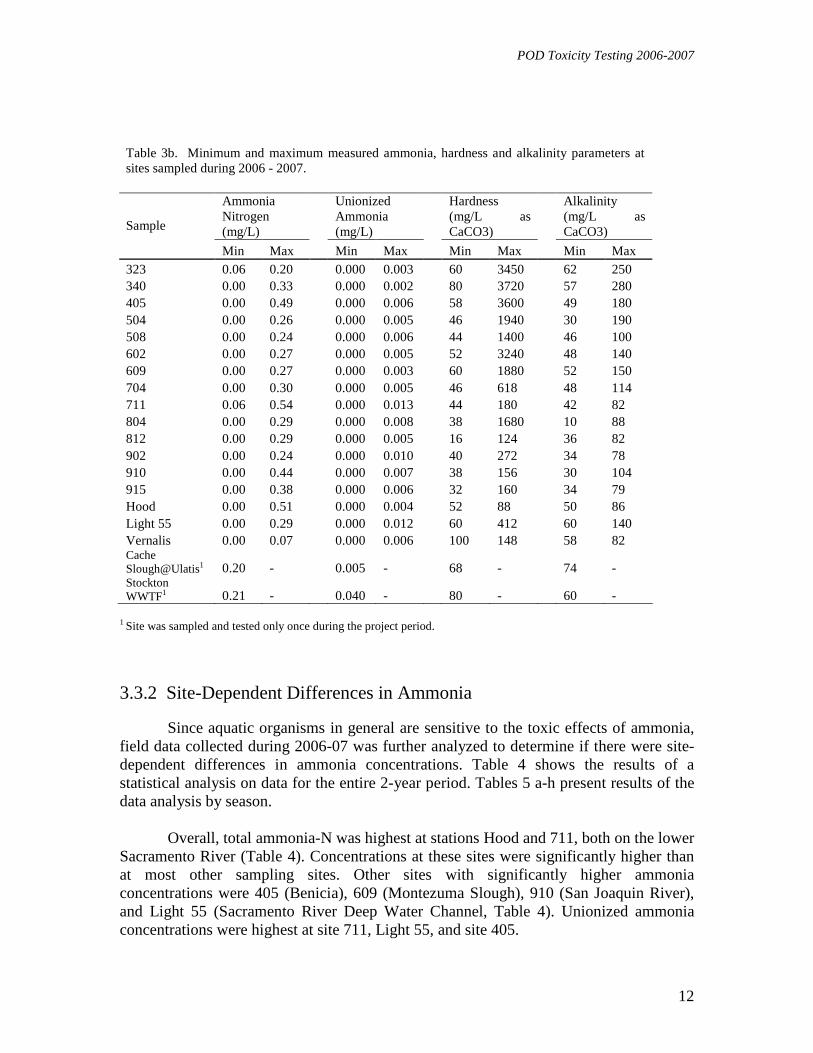
Table 3b. Minimum and maximum measured ammonia, hardness and alkalinity parameters at sites sampled during 2006 - 2007.
Ammonia Nitrogen (mg/L)
Unionized Ammonia (mg/L)
Hardness (mg/L as CaCO3)
Alkalinity (mg/L as CaCO3) Sample
Min Max Min Max Min Max Min Max 323 0.06 0.20 0.000 0.003 60 3450 62 250 340 0.00 0.33 0.000 0.002 80 3720 57 280 405 0.00 0.49 0.000 0.006 58 3600 49 180 504 0.00 0.26 0.000 0.005 46 1940 30 190 508 0.00 0.24 0.000 0.006 44 1400 46 100 602 0.00 0.27 0.000 0.005 52 3240 48 140 609 0.00 0.27 0.000 0.003 60 1880 52 150 704 0.00 0.30 0.000 0.005 46 618 48 114 711 0.06 0.54 0.000 0.013 44 180 42 82 804 0.00 0.29 0.000 0.008 38 1680 10 88 812 0.00 0.29 0.000 0.005 16 124 36 82 902 0.00 0.24 0.000 0.010 40 272 34 78 910 0.00 0.44 0.000 0.007 38 156 30 104 915 0.00 0.38 0.000 0.006 32 160 34 79 Hood 0.00 0.51 0.000 0.004 52 88 50 86 Light 55 0.00 0.29 0.000 0.012 60 412 60 140 Vernalis 0.00 0.07 0.000 0.006 100 148 58 82 Cache Slough@Ulatis1 0.20 - 0.005 - 68 - 74 - Stockton WWTF1 0.21 - 0.040 - 80 - 60 -
1 Site was sampled and tested only once during the project period.
3.3.2 Site-Dependent Differences in Ammonia
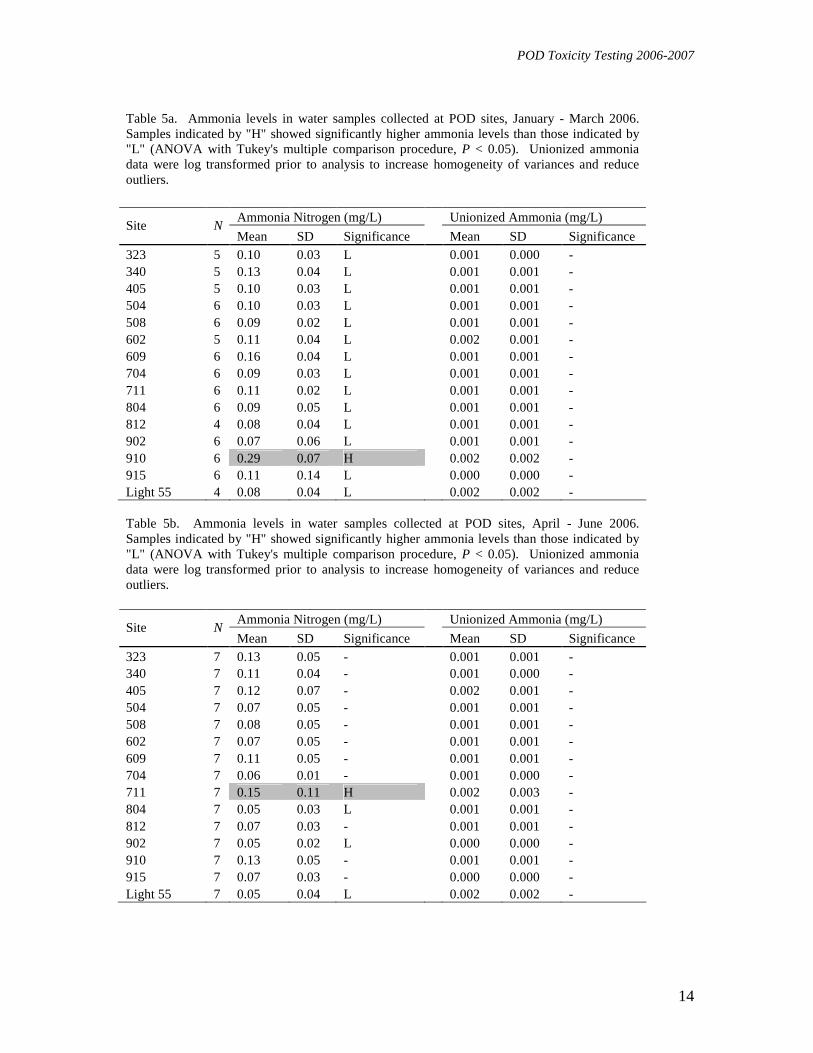
Since aquatic organisms in general are sensitive to the toxic effects of ammonia, field data collected during 2006-07 was further analyzed to determine if there were site-dependent differences in ammonia concentrations. Table 4 shows the results of a statistical analysis on data for the entire 2-year period. Tables 5 a-h present results of the data analysis by season.
Overall, total ammonia-N was highest at stations Hood and 711, both on the lower
Sacramento River (Table 4). Concentrations at these sites were significantly higher than at most other sampling sites. Other sites with significantly higher ammonia concentrations were 405 (Benicia), 609 (Montezuma Slough), 910 (San Joaquin River), and Light 55 (Sacramento River Deep Water Channel, Table 4). Unionized ammonia concentrations were highest at site 711, Light 55, and site 405.
POD Toxicity Testing 2006-2007
13
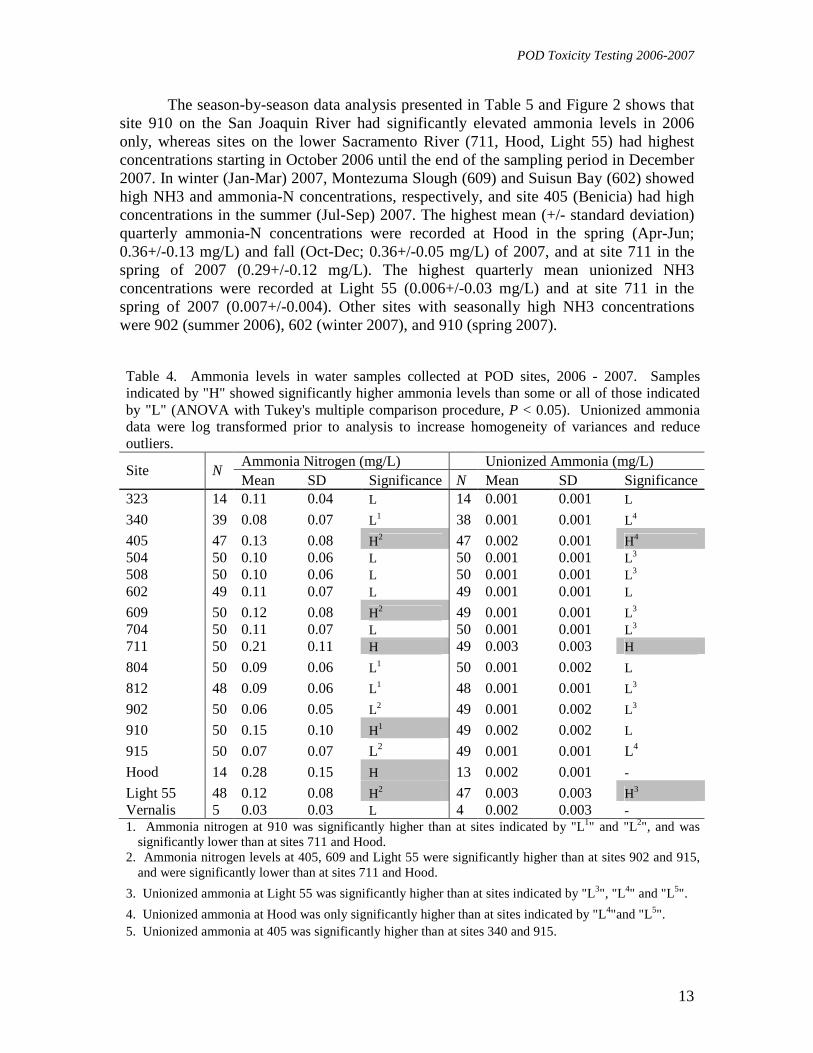
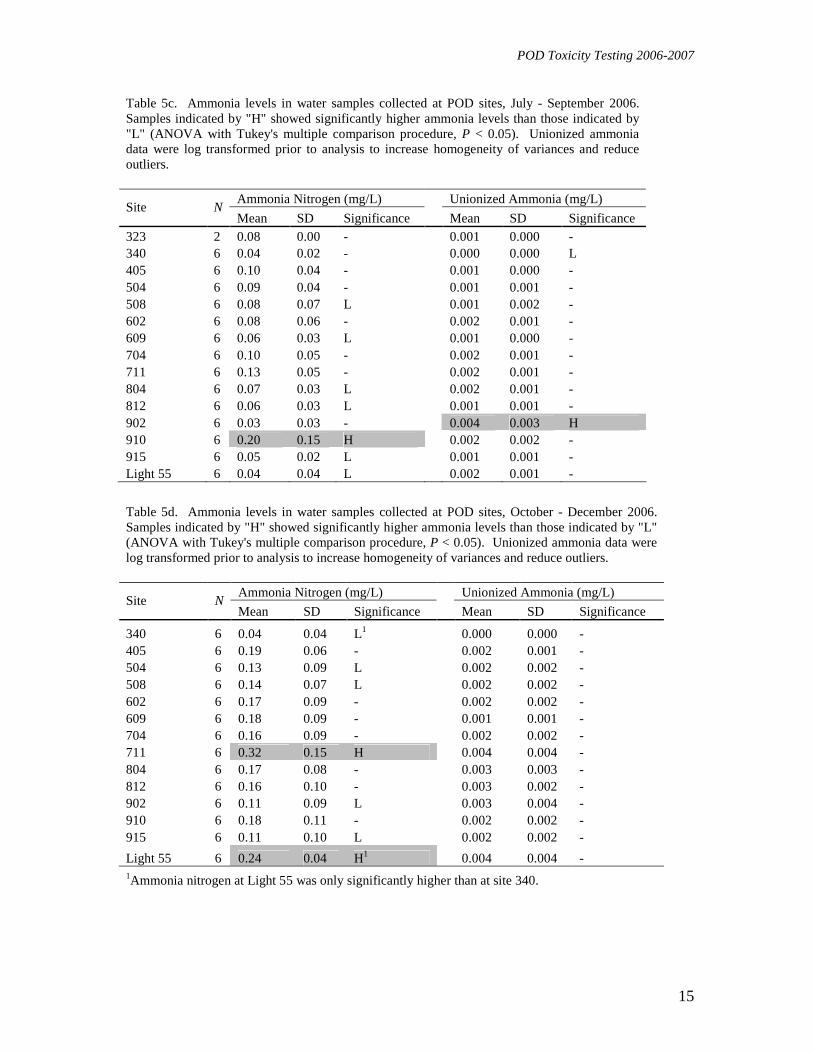
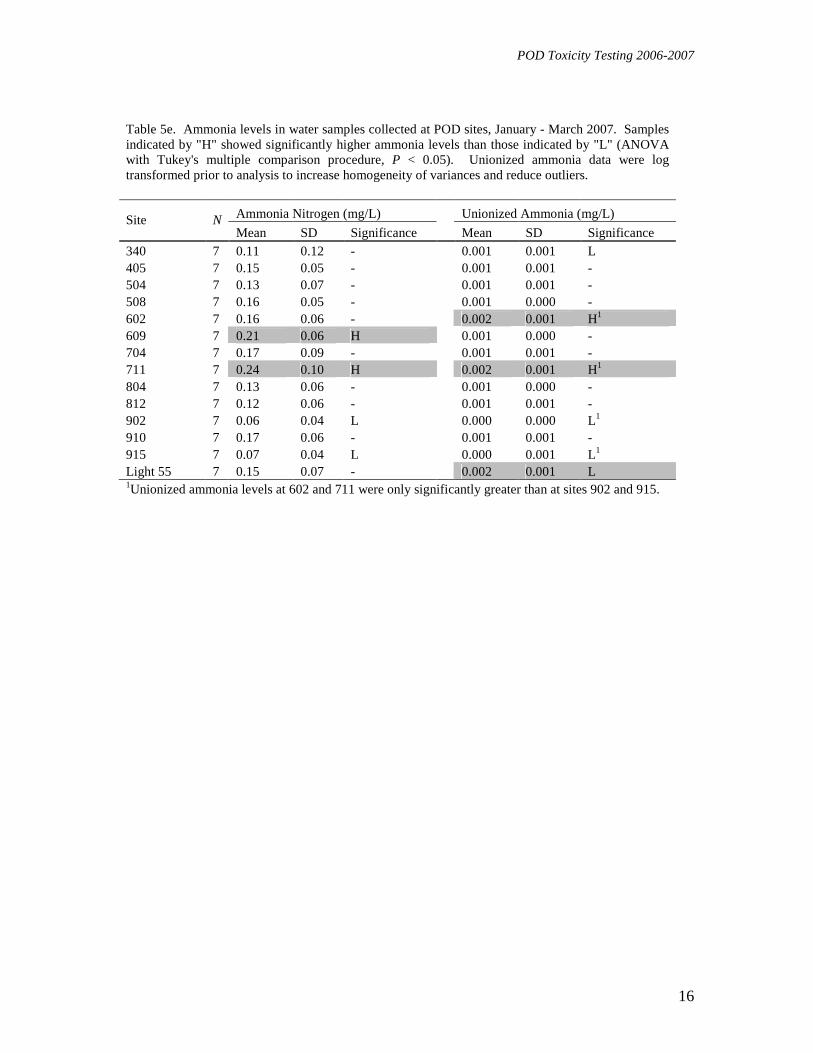
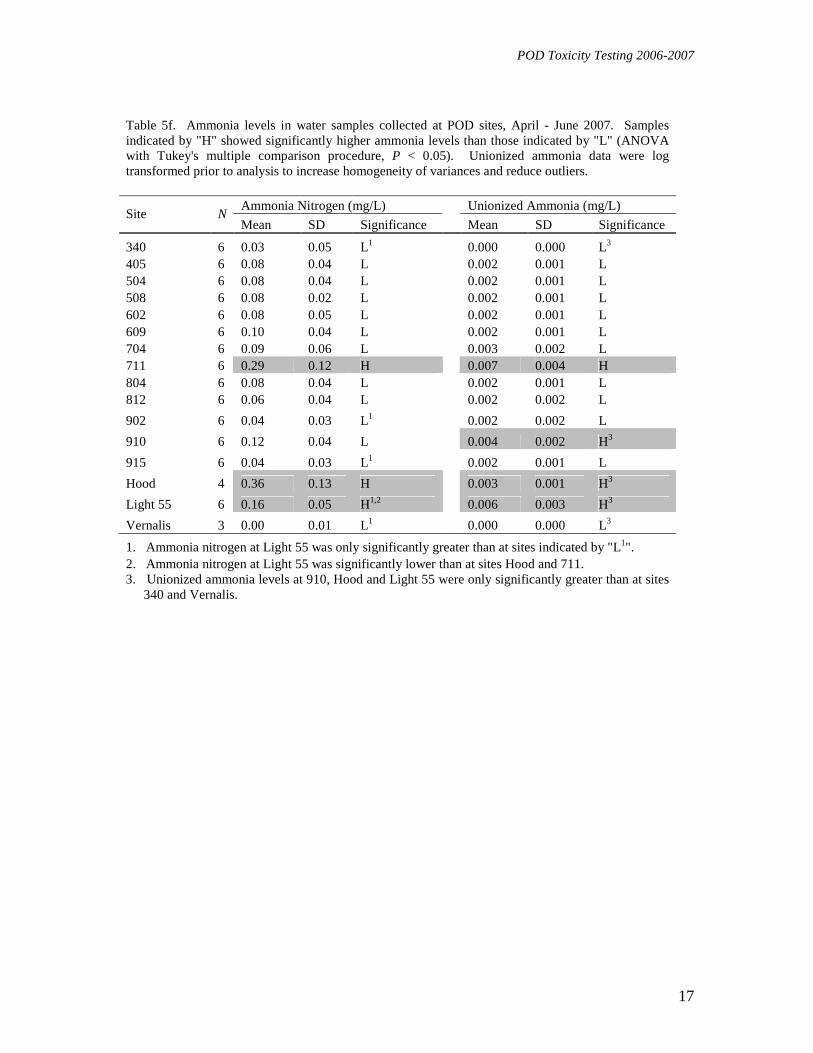
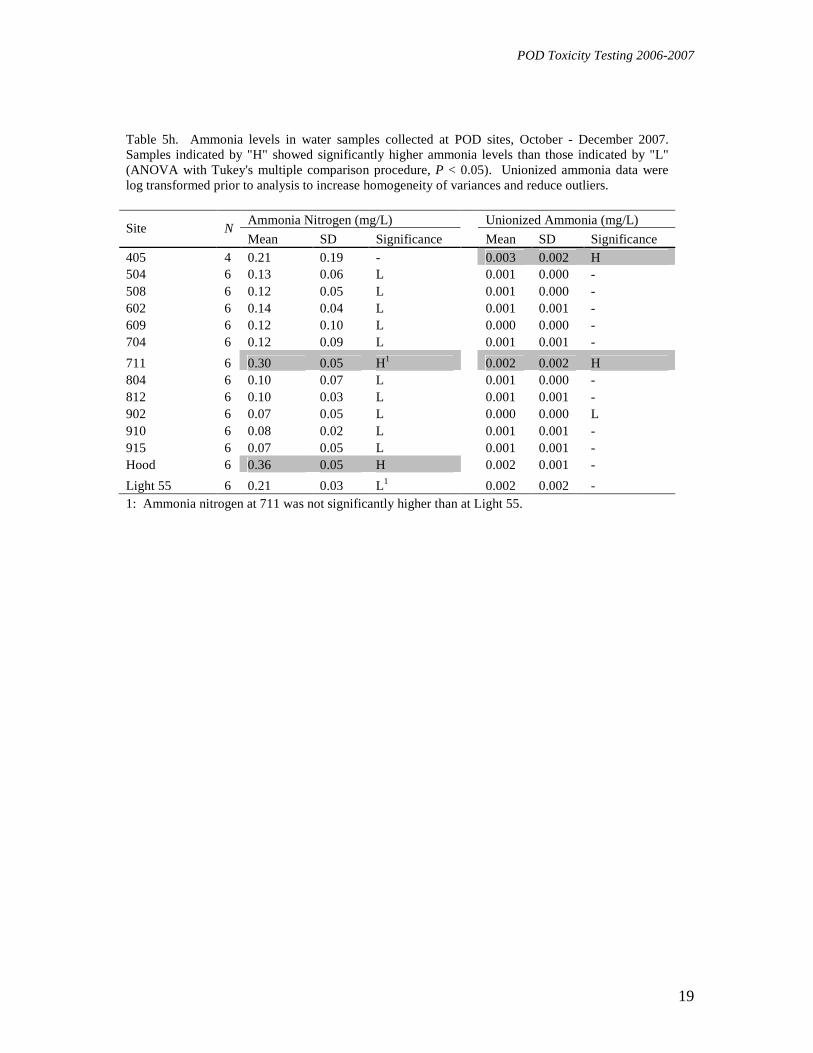
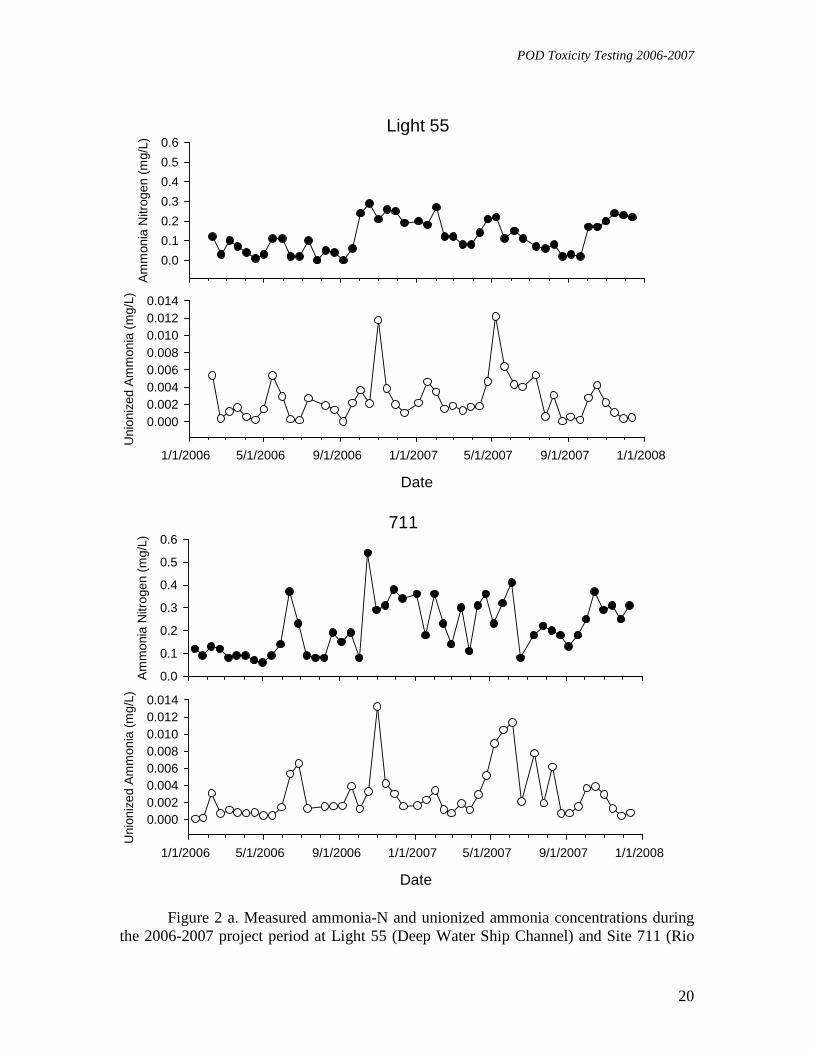
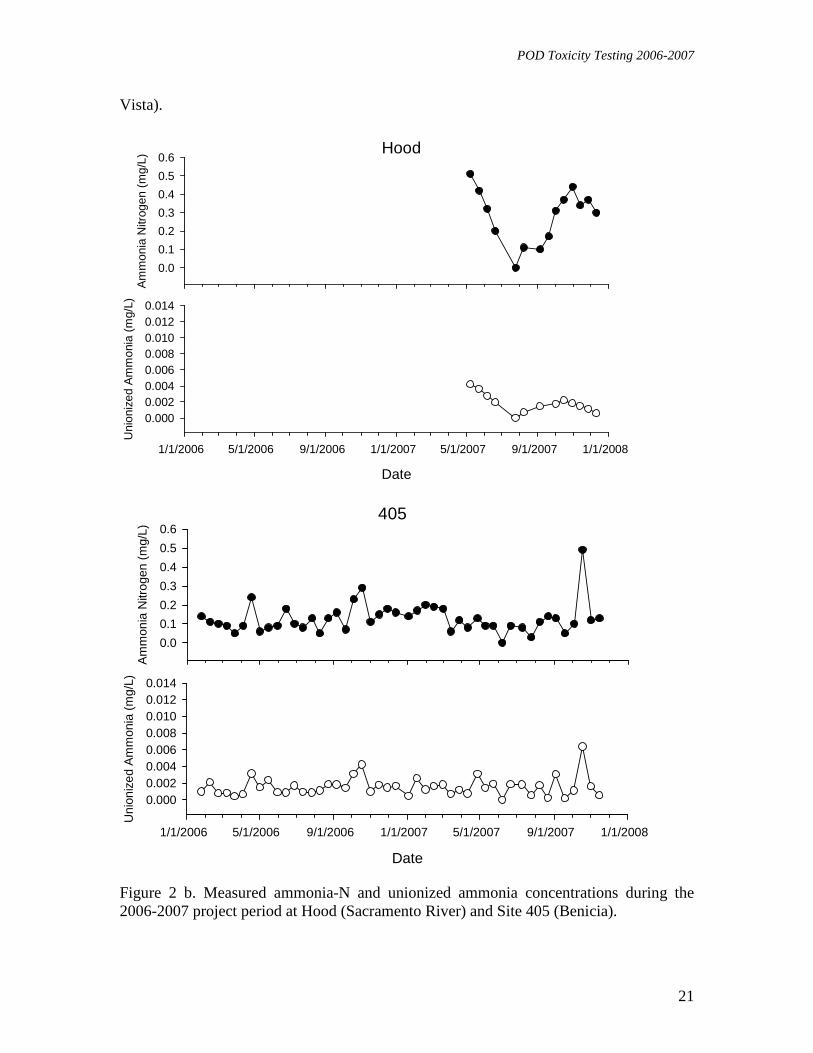
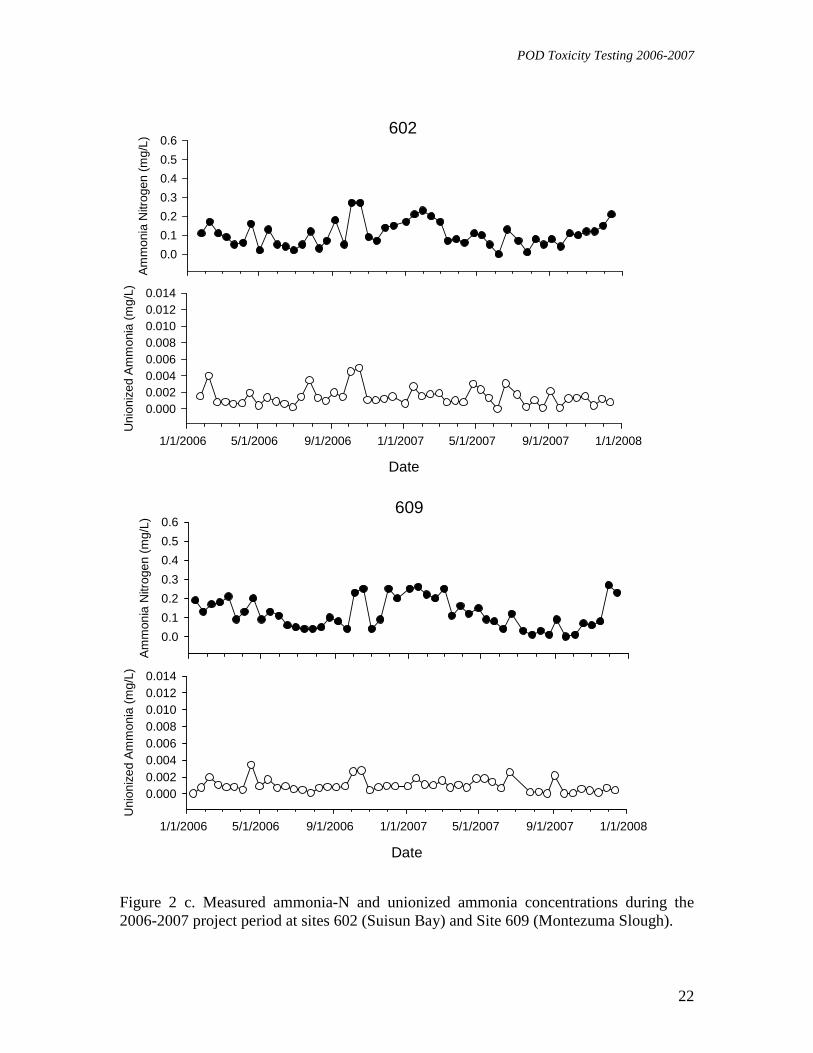
The season-by-season data analysis presented in Table 5 and Figure 2 shows that site 910 on the San Joaquin River had significantly elevated ammonia levels in 2006 only, whereas sites on the lower Sacramento River (711, Hood, Light 55) had highest concentrations starting in October 2006 until the end of the sampling period in December 2007. In winter (Jan-Mar) 2007, Montezuma Slough (609) and Suisun Bay (602) showed high NH3 and ammonia-N concentrations, respectively, and site 405 (Benicia) had high concentrations in the summer (Jul-Sep) 2007. The highest mean (+/- standard deviation) quarterly ammonia-N concentrations were recorded at Hood in the spring (Apr-Jun; 0.36+/-0.13 mg/L) and fall (Oct-Dec; 0.36+/-0.05 mg/L) of 2007, and at site 711 in the spring of 2007 (0.29+/-0.12 mg/L). The highest quarterly mean unionized NH3 concentrations were recorded at Light 55 (0.006+/-0.03 mg/L) and at site 711 in the spring of 2007 (0.007+/-0.004). Other sites with seasonally high NH3 concentrations were 902 (summer 2006), 602 (winter 2007), and 910 (spring 2007).
Table 4. Ammonia levels in water samples collected at POD sites, 2006 - 2007. Samples indicated by "H" showed significantly higher ammonia levels than some or all of those indicated by "L" (ANOVA with Tukey's multiple comparison procedure, P < 0.05). Unionized ammonia data were log transformed prior to analysis to increase homogeneity of variances and reduce outliers.
Ammonia Nitrogen (mg/L) Unionized Ammonia (mg/L) Site N
Mean SD Significance N Mean SD Significance 323 14 0.11 0.04 L 14 0.001 0.001 L
340 39 0.08 0.07 L1 38 0.001 0.001 L4
405 47 0.13 0.08 H2 47 0.002 0.001 H4 504 50 0.10 0.06 L 50 0.001 0.001 L3 508 50 0.10 0.06 L 50 0.001 0.001 L3 602 49 0.11 0.07 L 49 0.001 0.001 L
609 50 0.12 0.08 H2 49 0.001 0.001 L3 704 50 0.11 0.07 L 50 0.001 0.001 L3 711 50 0.21 0.11 H 49 0.003 0.003 H
804 50 0.09 0.06 L1 50 0.001 0.002 L
812 48 0.09 0.06 L1 48 0.001 0.001 L3
902 50 0.06 0.05 L2 49 0.001 0.002 L3
910 50 0.15 0.10 H1 49 0.002 0.002 L
915 50 0.07 0.07 L2 49 0.001 0.001 L4
Hood 14 0.28 0.15 H 13 0.002 0.001 -
Light 55 48 0.12 0.08 H2 47 0.003 0.003 H3 Vernalis 5 0.03 0.03 L 4 0.002 0.003 - 1. Ammonia nitrogen at 910 was significantly higher than at sites indicated by "L1" and "L2", and was
significantly lower than at sites 711 and Hood. 2. Ammonia nitrogen levels at 405, 609 and Light 55 were significantly higher than at sites 902 and 915,
and were significantly lower than at sites 711 and Hood.
3. Unionized ammonia at Light 55 was significantly higher than at sites indicated by "L3", "L4" and "L5".
4. Unionized ammonia at Hood was only significantly higher than at sites indicated by "L4"and "L5". 5. Unionized ammonia at 405 was significantly higher than at sites 340 and 915.
POD Toxicity Testing 2006-2007
14
Table 5a. Ammonia levels in water samples collected at POD sites, January - March 2006. Samples indicated by "H" showed significantly higher ammonia levels than those indicated by "L" (ANOVA with Tukey's multiple comparison procedure, P < 0.05). Unionized ammonia data were log transformed prior to analysis to increase homogeneity of variances and reduce outliers.
Ammonia Nitrogen (mg/L) Unionized Ammonia (mg/L)
Site N Mean SD Significance Mean SD Significance
323 5 0.10 0.03 L 0.001 0.000 - 340 5 0.13 0.04 L 0.001 0.001 - 405 5 0.10 0.03 L 0.001 0.001 - 504 6 0.10 0.03 L 0.001 0.001 - 508 6 0.09 0.02 L 0.001 0.001 - 602 5 0.11 0.04 L 0.002 0.001 - 609 6 0.16 0.04 L 0.001 0.001 - 704 6 0.09 0.03 L 0.001 0.001 - 711 6 0.11 0.02 L 0.001 0.001 - 804 6 0.09 0.05 L 0.001 0.001 - 812 4 0.08 0.04 L 0.001 0.001 - 902 6 0.07 0.06 L 0.001 0.001 - 910 6 0.29 0.07 H 0.002 0.002 - 915 6 0.11 0.14 L 0.000 0.000 - Light 55 4 0.08 0.04 L 0.002 0.002 -
Table 5b. Ammonia levels in water samples collected at POD sites, April - June 2006. Samples indicated by "H" showed significantly higher ammonia levels than those indicated by "L" (ANOVA with Tukey's multiple comparison procedure, P < 0.05). Unionized ammonia data were log transformed prior to analysis to increase homogeneity of variances and reduce outliers.
Ammonia Nitrogen (mg/L) Unionized Ammonia (mg/L) Site N
Mean SD Significance Mean SD Significance 323 7 0.13 0.05 - 0.001 0.001 - 340 7 0.11 0.04 - 0.001 0.000 - 405 7 0.12 0.07 - 0.002 0.001 - 504 7 0.07 0.05 - 0.001 0.001 - 508 7 0.08 0.05 - 0.001 0.001 - 602 7 0.07 0.05 - 0.001 0.001 - 609 7 0.11 0.05 - 0.001 0.001 - 704 7 0.06 0.01 - 0.001 0.000 - 711 7 0.15 0.11 H 0.002 0.003 - 804 7 0.05 0.03 L 0.001 0.001 - 812 7 0.07 0.03 - 0.001 0.001 - 902 7 0.05 0.02 L 0.000 0.000 - 910 7 0.13 0.05 - 0.001 0.001 - 915 7 0.07 0.03 - 0.000 0.000 - Light 55 7 0.05 0.04 L 0.002 0.002 -
POD Toxicity Testing 2006-2007
15
Table 5c. Ammonia levels in water samples collected at POD sites, July - September 2006. Samples indicated by "H" showed significantly higher ammonia levels than those indicated by "L" (ANOVA with Tukey's multiple comparison procedure, P < 0.05). Unionized ammonia data were log transformed prior to analysis to increase homogeneity of variances and reduce outliers.
Ammonia Nitrogen (mg/L) Unionized Ammonia (mg/L) Site N
Mean SD Significance Mean SD Significance 323 2 0.08 0.00 - 0.001 0.000 - 340 6 0.04 0.02 - 0.000 0.000 L 405 6 0.10 0.04 - 0.001 0.000 - 504 6 0.09 0.04 - 0.001 0.001 - 508 6 0.08 0.07 L 0.001 0.002 - 602 6 0.08 0.06 - 0.002 0.001 - 609 6 0.06 0.03 L 0.001 0.000 - 704 6 0.10 0.05 - 0.002 0.001 - 711 6 0.13 0.05 - 0.002 0.001 - 804 6 0.07 0.03 L 0.002 0.001 - 812 6 0.06 0.03 L 0.001 0.001 - 902 6 0.03 0.03 - 0.004 0.003 H 910 6 0.20 0.15 H 0.002 0.002 - 915 6 0.05 0.02 L 0.001 0.001 - Light 55 6 0.04 0.04 L 0.002 0.001 -
Table 5d. Ammonia levels in water samples collected at POD sites, October - December 2006. Samples indicated by "H" showed significantly higher ammonia levels than those indicated by "L" (ANOVA with Tukey's multiple comparison procedure, P < 0.05). Unionized ammonia data were log transformed prior to analysis to increase homogeneity of variances and reduce outliers.
Ammonia Nitrogen (mg/L) Unionized Ammonia (mg/L) Site N
Mean SD Significance Mean SD Significance
340 6 0.04 0.04 L1 0.000 0.000 - 405 6 0.19 0.06 - 0.002 0.001 - 504 6 0.13 0.09 L 0.002 0.002 - 508 6 0.14 0.07 L 0.002 0.002 - 602 6 0.17 0.09 - 0.002 0.002 - 609 6 0.18 0.09 - 0.001 0.001 - 704 6 0.16 0.09 - 0.002 0.002 - 711 6 0.32 0.15 H 0.004 0.004 - 804 6 0.17 0.08 - 0.003 0.003 - 812 6 0.16 0.10 - 0.003 0.002 - 902 6 0.11 0.09 L 0.003 0.004 - 910 6 0.18 0.11 - 0.002 0.002 - 915 6 0.11 0.10 L 0.002 0.002 -
Light 55 6 0.24 0.04 H1 0.004 0.004 - 1Ammonia nitrogen at Light 55 was only significantly higher than at site 340.
POD Toxicity Testing 2006-2007
16
Table 5e. Ammonia levels in water samples collected at POD sites, January - March 2007. Samples indicated by "H" showed significantly higher ammonia levels than those indicated by "L" (ANOVA with Tukey's multiple comparison procedure, P < 0.05). Unionized ammonia data were log transformed prior to analysis to increase homogeneity of variances and reduce outliers.
Ammonia Nitrogen (mg/L) Unionized Ammonia (mg/L) Site N Mean SD Significance Mean SD Significance
340 7 0.11 0.12 - 0.001 0.001 L 405 7 0.15 0.05 - 0.001 0.001 - 504 7 0.13 0.07 - 0.001 0.001 - 508 7 0.16 0.05 - 0.001 0.000 - 602 7 0.16 0.06 - 0.002 0.001 H1 609 7 0.21 0.06 H 0.001 0.000 - 704 7 0.17 0.09 - 0.001 0.001 - 711 7 0.24 0.10 H 0.002 0.001 H1 804 7 0.13 0.06 - 0.001 0.000 - 812 7 0.12 0.06 - 0.001 0.001 - 902 7 0.06 0.04 L 0.000 0.000 L1 910 7 0.17 0.06 - 0.001 0.001 - 915 7 0.07 0.04 L 0.000 0.001 L1 Light 55 7 0.15 0.07 - 0.002 0.001 L 1Unionized ammonia levels at 602 and 711 were only significantly greater than at sites 902 and 915.
POD Toxicity Testing 2006-2007
17
Table 5f. Ammonia levels in water samples collected at POD sites, April - June 2007. Samples indicated by "H" showed significantly higher ammonia levels than those indicated by "L" (ANOVA with Tukey's multiple comparison procedure, P < 0.05). Unionized ammonia data were log transformed prior to analysis to increase homogeneity of variances and reduce outliers.
Ammonia Nitrogen (mg/L) Unionized Ammonia (mg/L) Site N
Mean SD Significance Mean SD Significance
340 6 0.03 0.05 L1 0.000 0.000 L3 405 6 0.08 0.04 L 0.002 0.001 L 504 6 0.08 0.04 L 0.002 0.001 L 508 6 0.08 0.02 L 0.002 0.001 L 602 6 0.08 0.05 L 0.002 0.001 L 609 6 0.10 0.04 L 0.002 0.001 L 704 6 0.09 0.06 L 0.003 0.002 L 711 6 0.29 0.12 H 0.007 0.004 H 804 6 0.08 0.04 L 0.002 0.001 L 812 6 0.06 0.04 L 0.002 0.002 L
902 6 0.04 0.03 L1 0.002 0.002 L
910 6 0.12 0.04 L 0.004 0.002 H3
915 6 0.04 0.03 L1 0.002 0.001 L
Hood 4 0.36 0.13 H 0.003 0.001 H3
Light 55 6 0.16 0.05 H1,2 0.006 0.003 H3
Vernalis 3 0.00 0.01 L1 0.000 0.000 L3
1. Ammonia nitrogen at Light 55 was only significantly greater than at sites indicated by "L1". 2. Ammonia nitrogen at Light 55 was significantly lower than at sites Hood and 711. 3. Unionized ammonia levels at 910, Hood and Light 55 were only significantly greater than at sites
340 and Vernalis.

POD Toxicity Testing 2006-2007
18
Table 5g. Ammonia levels in water samples collected at POD sites, July - September 2007. Samples indicated by "H" showed significantly higher ammonia levels than those indicated by "L" (ANOVA with Tukey's multiple comparison procedure, P < 0.05). Unionized ammonia data were log transformed prior to analysis to increase homogeneity of variances and reduce outliers.
Ammonia Nitrogen (mg/L) Unionized Ammonia (mg/L) Site N
Mean SD Significance Mean SD Significance 340 2 0.06 0.04 L 0.000 0.000 -
405 6 0.09 0.04 H1,2 0.001 0.001 - 504 6 0.04 0.02 L 0.001 0.001 - 508 6 0.04 0.02 L 0.001 0.001 - 602 6 0.06 0.03 L 0.001 0.001 - 609 6 0.03 0.03 L 0.000 0.001 - 704 6 0.05 0.02 L 0.001 0.001 - 711 6 0.18 0.03 H 0.003 0.003 - 804 6 0.03 0.03 L 0.001 0.002 - 812 6 0.07 0.02 L 0.001 0.002 - 902 6 0.03 0.03 L 0.001 0.002 - 910 6 0.04 0.02 L 0.001 0.001 -
915 6 0.03 0.03 L1 0.001 0.002 - Hood 4 0.10 0.07 L 0.001 0.001 - Light 55 6 0.05 0.03 L 0.002 0.002 - Vernalis 2 0.06 0.01 L - - - 1. Ammonia nitrogen at 405 was only significantly greater than at site 915. 2. Ammonia nitrogen at 405 was significantly lower than at site 711.
POD Toxicity Testing 2006-2007
19
Table 5h. Ammonia levels in water samples collected at POD sites, October - December 2007. Samples indicated by "H" showed significantly higher ammonia levels than those indicated by "L" (ANOVA with Tukey's multiple comparison procedure, P < 0.05). Unionized ammonia data were log transformed prior to analysis to increase homogeneity of variances and reduce outliers.
Ammonia Nitrogen (mg/L) Unionized Ammonia (mg/L) Site N
Mean SD Significance Mean SD Significance 405 4 0.21 0.19 - 0.003 0.002 H 504 6 0.13 0.06 L 0.001 0.000 - 508 6 0.12 0.05 L 0.001 0.000 - 602 6 0.14 0.04 L 0.001 0.001 - 609 6 0.12 0.10 L 0.000 0.000 - 704 6 0.12 0.09 L 0.001 0.001 -
711 6 0.30 0.05 H1 0.002 0.002 H 804 6 0.10 0.07 L 0.001 0.000 - 812 6 0.10 0.03 L 0.001 0.001 - 902 6 0.07 0.05 L 0.000 0.000 L 910 6 0.08 0.02 L 0.001 0.001 - 915 6 0.07 0.05 L 0.001 0.001 - Hood 6 0.36 0.05 H 0.002 0.001 -
Light 55 6 0.21 0.03 L1 0.002 0.002 - 1: Ammonia nitrogen at 711 was not significantly higher than at Light 55.
POD Toxicity Testing 2006-2007
20
Am
mon
ia N
itrog
en (
mg/
L)
0.0
0.1
0.2
0.3
0.4
0.5
0.6
Date
1/1/2006 5/1/2006 9/1/2006 1/1/2007 5/1/2007 9/1/2007 1/1/2008
Uni
oniz
ed A
mm
onia
(m
g/L)
0.0000.0020.0040.0060.0080.0100.0120.014
Light 55
Am
mon
ia N
itrog
en (
mg/
L)
0.0
0.1
0.2
0.3
0.4
0.5
0.6
Date
1/1/2006 5/1/2006 9/1/2006 1/1/2007 5/1/2007 9/1/2007 1/1/2008
Uni
oniz
ed A
mm
onia
(m
g/L)
0.0000.0020.0040.0060.0080.0100.0120.014
711
Figure 2 a. Measured ammonia-N and unionized ammonia concentrations during
the 2006-2007 project period at Light 55 (Deep Water Ship Channel) and Site 711 (Rio
POD Toxicity Testing 2006-2007
21
Vista).
Am
mon
ia N
itrog
en (
mg/
L)
0.0
0.1
0.2
0.3
0.4
0.5
0.6
Date
1/1/2006 5/1/2006 9/1/2006 1/1/2007 5/1/2007 9/1/2007 1/1/2008
Uni
oniz
ed A
mm
onia
(m
g/L)
0.0000.0020.0040.0060.0080.0100.0120.014
Hood
Am
mon
ia N
itrog
en (
mg/
L)
0.0
0.1
0.2
0.3
0.4
0.5
0.6
Date
1/1/2006 5/1/2006 9/1/2006 1/1/2007 5/1/2007 9/1/2007 1/1/2008
Uni
oniz
ed A
mm
onia
(m
g/L)
0.0000.0020.0040.0060.0080.0100.0120.014
405
Figure 2 b. Measured ammonia-N and unionized ammonia concentrations during the 2006-2007 project period at Hood (Sacramento River) and Site 405 (Benicia).
POD Toxicity Testing 2006-2007
22
Am
mon
ia N
itrog
en (
mg/
L)
0.0
0.1
0.2
0.3
0.4
0.5
0.6
Date
1/1/2006 5/1/2006 9/1/2006 1/1/2007 5/1/2007 9/1/2007 1/1/2008
Uni
oniz
ed A
mm
onia
(m
g/L)
0.0000.0020.0040.0060.0080.0100.0120.014
602
Am
mon
ia N
itrog
en (
mg/
L)
0.0
0.1
0.2
0.3
0.4
0.5
0.6
Date
1/1/2006 5/1/2006 9/1/2006 1/1/2007 5/1/2007 9/1/2007 1/1/2008
Uni
oniz
ed A
mm
onia
(m
g/L)
0.0000.0020.0040.0060.0080.0100.0120.014
609
Figure 2 c. Measured ammonia-N and unionized ammonia concentrations during the 2006-2007 project period at sites 602 (Suisun Bay) and Site 609 (Montezuma Slough).
POD Toxicity Testing 2006-2007
23
Am
mon
ia N
itrog
en (
mg/
L)
0.0
0.1
0.2
0.3
0.4
0.5
0.6
Date
1/1/2006 5/1/2006 9/1/2006 1/1/2007 5/1/2007 9/1/2007 1/1/2008
Uni
oniz
ed A
mm
onia
(m
g/L)
0.0000.0020.0040.0060.0080.0100.0120.014
902
Am
mon
ia N
itrog
en (
mg/
L)
0.0
0.1
0.2
0.3
0.4
0.5
0.6
Date
1/1/2006 5/1/2006 9/1/2006 1/1/2007 5/1/2007 9/1/2007 1/1/2008
Uni
oniz
ed A
mm
onia
(m
g/L)
0.0000.0020.0040.0060.0080.0100.0120.014
910
Figure 2 d. Measured ammonia-N and unionized ammonia concentrations during the 2006-2007 project period at sites 902 (Old River) and Site 910 (San Joaquin River).

POD 2006-2007: H. azteca
24
4. Tests with Hyalella azteca 4.1 Field Monitoring 4.1.1 Methods 4.1.1.1 Toxicity Testing
H. azteca were purchased from Aquatic Research Organisms (Hampton, NH). Before
initiating bioassays, the water samples were mixed rigorously in the original containers, filtered through a 60-µm screen, brought to test temperature (23oC) and aerated at a rate of 100 bubbles/min until the dissolved oxygen concentration was approximately 8.5 mg/L. The laboratory control water consists of deionized water amended to US EPA moderately hard standards (DIEPAMHR).
The 10-day tests consisted of four replicate 250 ml glass beakers each containing 100 ml of sample, a one-square-inch piece of nitex screen (a substrate for the H. azteca to cling to), and 10 organisms. Tests were initiated with 7 to 14 day old H. azteca. Animals in each replicate were fed 1000 µl of YCT (a mixture of yeast, organic alfalfa and trout chow) on test initiation and days 2, 4, 6, 8, as well as on day 5, when 75% of the test water was renewed. Each series of tests included a standard laboratory control, and if necessary, “high EC controls” and a “low EC control”. “High EC” control water was reconstituted to EPA moderate hardness and the EC adjusted to match the highest EC of the ambient water samples (typically found at site 340, Napa River and 323, San Pablo Bay; and at site 405, Carquinez Straight) with pre-filtered Pacific Ocean seawater obtained from Bodega Bay Marine Laboratory, Bodega Bay, CA. Multiple high EC controls were sometimes conducted in order to have appropriate controls for every sample during sampling events when ambient waters showed a wide range of conductivities. “Low EC” control water was reconstituted to EPA moderate hardness and the EC adjusted to match the lowest EC of the water samples (typically found at site 711, Sacramento River) by diluting with deionized water.
Tests were conducted with and without the addition of piperonyl butoxide (PBO). PBO was added because of its synergistic and antagonistic action with pyrethroid and organophosphate insecticides, respectively. A five parts per million (5 ppm) PBO stock solution was prepared and added to 400 ml of water sample to yield the desired test concentration. Tests were initially conducted with 100 ppb of PBO, which did not affect survival of H. azteca (Table 6). However, the concentration was later reduced to 25 ppb because ≥50 ppb PBO negatively affected H. azteca growth (Table 7). Pairwise analysis of the 2006-07 data revealed no effect of PBO on growth overall, examination of the data by season showed that higher PBO concentrations used in 2006 did affect growth during certain times of the year (Tables 7, 8). The difference in growth was small, and did not affect results of our tests due to relatively high mean standard deviations (MSD) in ambient testing.
Growth in laboratory control water is generally lower than in ambient samples due to the lack of microorganisms naturally present in Delta water. These are obviously an important food source for H. azteca. As of 1/04/2007, we added a 1% delta water nutrient concentrate to the laboratory control water (DIEPAMHR) and its counterpart with PBO. The intent of this addition was to more closely match the nutrient and detritus content of control water to that of delta water and to increase the sensitivity of the weight endpoint. As of 2/02/2007, the nutrient concentrate

POD 2006-2007: H. azteca
25
was also added to the high EC controls and their corresponding PBO treatments. The nutrient concentrate was prepared by centrifuging up to seven Delta water samples with ECs below 1000 mS/cm in a continuous flow centrifuge until 100 times the original concentration was reached. The water used for centrifugation was saved from previous tests after proving to be nontoxic to H. azteca. This “nutrient addback” was then added to the control waters and their PBO treatments at 1%, or 1ml to 100 ml of sample waters. An additional control treatment of DIEPAMHR without the “nutrient addback” was included in each test to evaluate the effects of the delta water concentrate on the animals. Our results show that growth of control animals improved considerably when additional natural food was added (Table 8a).
Tests were conducted at a temperature of 23 ± 2° C with a 16h:8h L:D photoperiod. Mortality was recorded daily, and water was renewed on day 5. On day 10, the surviving H. azteca were dried and weighed to determine dry tissue weight per individual and relative growth.
Table 6. Survival of H. azteca in a 10-day chronic toxicity test exposed to PBO treated and untreated control waters, some of which were spiked with natural food/organic matter. Differences between treatments with and without PBO were examined by paired t-tests.
Survival (%) Dataset Control Water N
Mean Non-PBO Mean PBO P
2006 - 2007 No Organic Matter 76 97.2 94.8 0.151 Organic Matter Added 50 95.5 93.3 0.304
A test to verify if direct toxicity of PBO contributed to the observed effects showed that PBO at a concentration of 25 ppb, used in our tests after 7/27/2006 does not affect 10-day survival or growth of H. azteca (Table 7).
Table 7. Summary of 10-day Hyalella water column toxicity test initiated on 5/28/07 examining the toxicity of piperonyl butoxide (PBO).
Survival (%)1
Weight (mg/individual)1 Treatment
mean se mean se DIEPAMHR 90 7.1 0.033 0.003 DIEPAMHR + 5 ppb PBO 90 7.1 0.040 0.006 DIEPAMHR + 10 ppb PBO 100 0.0 0.034 0.002 DIEPAMHR + 15 ppb PBO 100 0.0 0.044 0.005 DIEPAMHR + 20 ppb PBO 100 0.0 0.037 0.003 DIEPAMHR + 25 ppb PBO 98 2.5 0.039 0.005 DIEPAMHR + 50 ppb PBO 98 2.5 0.025 0.004 DIEPAMHR + 100 ppb PBO 98 2.5 0.021 0.001 Weight PMSD = 41.4% Weight NOEC = 100 ppb Weight EC25 = 42.4 ppb 1 Highlighted areas indicate a significant reduction in survival or weight compared to the
DIEPAMHR control.
POD 2006-2007: H. azteca
26
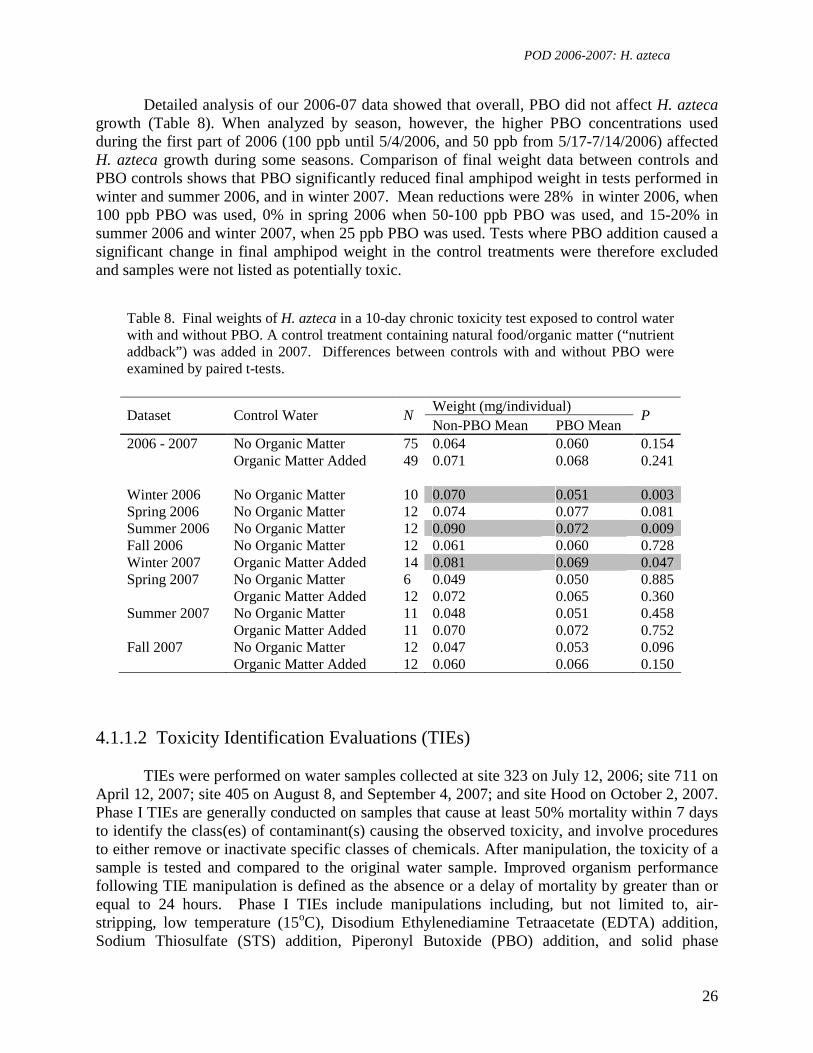
Detailed analysis of our 2006-07 data showed that overall, PBO did not affect H. azteca growth (Table 8). When analyzed by season, however, the higher PBO concentrations used during the first part of 2006 (100 ppb until 5/4/2006, and 50 ppb from 5/17-7/14/2006) affected H. azteca growth during some seasons. Comparison of final weight data between controls and PBO controls shows that PBO significantly reduced final amphipod weight in tests performed in winter and summer 2006, and in winter 2007. Mean reductions were 28% in winter 2006, when 100 ppb PBO was used, 0% in spring 2006 when 50-100 ppb PBO was used, and 15-20% in summer 2006 and winter 2007, when 25 ppb PBO was used. Tests where PBO addition caused a significant change in final amphipod weight in the control treatments were therefore excluded and samples were not listed as potentially toxic.
Table 8. Final weights of H. azteca in a 10-day chronic toxicity test exposed to control water with and without PBO. A control treatment containing natural food/organic matter (“nutrient addback”) was added in 2007. Differences between controls with and without PBO were examined by paired t-tests.
Weight (mg/individual) Dataset Control Water N
Non-PBO Mean PBO Mean P
2006 - 2007 No Organic Matter 75 0.064 0.060 0.154 Organic Matter Added 49 0.071 0.068 0.241 Winter 2006 No Organic Matter 10 0.070 0.051 0.003 Spring 2006 No Organic Matter 12 0.074 0.077 0.081 Summer 2006 No Organic Matter 12 0.090 0.072 0.009 Fall 2006 No Organic Matter 12 0.061 0.060 0.728 Winter 2007 Organic Matter Added 14 0.081 0.069 0.047 Spring 2007 No Organic Matter 6 0.049 0.050 0.885 Organic Matter Added 12 0.072 0.065 0.360 Summer 2007 No Organic Matter 11 0.048 0.051 0.458 Organic Matter Added 11 0.070 0.072 0.752 Fall 2007 No Organic Matter 12 0.047 0.053 0.096 Organic Matter Added 12 0.060 0.066 0.150
4.1.1.2 Toxicity Identification Evaluations (TIEs)
TIEs were performed on water samples collected at site 323 on July 12, 2006; site 711 on April 12, 2007; site 405 on August 8, and September 4, 2007; and site Hood on October 2, 2007. Phase I TIEs are generally conducted on samples that cause at least 50% mortality within 7 days to identify the class(es) of contaminant(s) causing the observed toxicity, and involve procedures to either remove or inactivate specific classes of chemicals. After manipulation, the toxicity of a sample is tested and compared to the original water sample. Improved organism performance following TIE manipulation is defined as the absence or a delay of mortality by greater than or equal to 24 hours. Phase I TIEs include manipulations including, but not limited to, air-stripping, low temperature (15oC), Disodium Ethylenediamine Tetraacetate (EDTA) addition, Sodium Thiosulfate (STS) addition, Piperonyl Butoxide (PBO) addition, and solid phase
POD 2006-2007: H. azteca
27
extraction (C8-SPE).
Heavy metals can be toxic to aquatic species if concentrations exceed threshold levels. EDTA chelates metals, making them unavailable to biota. Three concentrations of EDTA are added to toxic samples and tested along with the appropriate controls. If the toxicant is a metal(s), the unmanipulated sample exhibits high mortality while the sample amended with EDTA causes reduced or no mortality.
PBO decreases toxicity by retarding or preventing formation of the toxicologically active forms of diazinon, chlorpyrifos and other OP insecticides (Bailey et al., 1996). It has no effect on carbofuran, a carbamate insecticide, but potentiates the toxicity of pyrethroid insecticides. PBO is added to the toxic samples for a final concentration of 25 ppb. The unmanipulated sample and the sample amended with PBO are tested along with the appropriate controls in a toxicity test. If the toxicant is a metabolically activated OP insecticide, the unmanipulated test sample will cause high mortality while the test sample amended with PBO results in reduced or no mortality. However, if the toxicant is a carbamate or pyrethroid, both the manipulated and unmanipulated samples will exhibit high mortality.
SPE columns primarily remove non-polar organic chemicals from water samples. A toxic sample is passed through an SPE column and the through-column “rinsate” is tested along with the unmanipulated sample. Control water also is passed through an SPE column and serves as one of the method controls (blank). The adsorbate is then eluted with methanol and the eluate added to control water and tested along with the appropriate method control. If the toxicant is a non-polar organic chemical, the ambient sample and control water amended with methanol eluate will exhibit mortality while the sample passed through the SPE column results in reduced or no mortality.
Air stripping reduces or removes toxicity caused by chemicals such as surfactants, chlorine and/or ammonia from waters. Toxic samples are air stripped and tested along with the appropriate control. If the toxicant is a volatile, the ambient sample exhibits high mortality while the air-stripped sample results in reduced or no mortality. Work performed at UCD ATL documented that air-stripping of a water sample spiked with non-volatile insecticide reduced C. dubia mortality.
When ammonia toxicity is suspected based on high ammonia concentrations the pH of the water sample is adjusted to 7.3 and 6.3. At lower pH levels ammonia (NH3) is converted to ionic ammonium (NH4
+), which is less toxic to aquatic organisms, therefore a reduction in toxicity due to lowering of the pH confirms that ammonia was responsible for the observed toxicity. 4.1.1.3 Statistical Analysis
Statistical analysis of H. azteca 10-day chronic toxicity data involved three endpoints: 10-day survival, 10-day weight, and 10-day biomass. For each toxicity test a two-part analysis was performed using JMP 5.0.1 (SAS 2003).
POD 2006-2007: H. azteca
28
First, each unmanipulated (non-PBO) treatment was compared to the non-PBO control.
In 2006, we followed modified EPA standard statistical procedures for multiple concentration static renewal toxicity tests (USEPA 2002). Shapiro-Wilk’s test and Bartlett’s test were used to examine normality of distributions and homogeneity of variances (alpha = 0.01). When non-normal distributions or heteroschedasticity was indicated by these tests, a one-tailed Kruskal-Wallis test was used to determine if significant differences in performance existed among the treatments being compared (alpha = 0.05). When the Kruskal-Wallis test indicated the existence of significant differences, each treatment having a lower mean than the control was compared to the control using Bonferroni-corrected Wilcoxon tests. When normal distributions and homoschedasticity were present, a one-tailed one-way ANOVA was used to determine if significant differences in performance were present (alpha = 0.05). When the ANOVA indicated the existence of significant differences, a Dunnett’s multiple comparison procedure was performed to determine which treatments showed significant differences from the control (one-tailed alpha = 0.05). In tests containing high or low conductivity samples (high EC > 10,000 uS/cm; low EC < 100 uS/cm) and a high or low conductivity control treatment, statistics were performed separately for the normal conductivity subset of samples and the high or low conductivity subset.
Second, each sample and control water treatment was compared to its PBO treated
counterpart by a full factorial two-way ANOVA (two-tailed alpha = 0.05). The three terms in the ANOVA were 1) the identity of test water, 2) the presence or absence of PBO and 3) an interaction term between test water and PBO presence. When there was a significant overall effect of PBO or interaction effect, a Tukey’s multiple comparison procedure was performed to identify if a significant difference existed between any control or test water and its PBO treated counterpart, and to identify if any PBO-treated sample showed a significant decrease in survival or weight relative to the PBO-treated control of the most appropriate conductivity.
In 2007, we changed statistical methods to maximize and standardize test sensitivity and
to allow the calculation of meaningful minimum significant differences (MSDs) for all tests. Instead of using a modification of USEPA statistics intended for multiple concentration tests, we used one-way ANOVA and Tukey’s multiple comparison procedure to evaluate all comparisons among waters not treated with PBO. Tukey’s multiple comparison procedure has greater statistical sensitivity than most of the methods involved in the USEPA protocol, and it has the advantage of evaluating of all possible pairwise comparisons between treatments, instead of being limited to comparing each treatment to one control. The USEPA protocol requires that data are tested for normality and homogeneity of variance before being tested using ANOVA. However, Zar (1996) reports that tests for homogeneity of variance perform poorly and are not recommended for testing the underlying assumptions of ANOVA, and reports that ANOVA is reliable for multisample testing among means even in cases of substantial heterogeneity of variances or considerable deviations from normality. Therefore, data were not tested for normality or homogeneity of variance before being tested with ANOVA and Tukey’s procedure. Significant reductions in survival and weight in unmanipulated (ambient) samples were evaluated relative to the control with the most appropriate conductivity. The statistical evaluation of PBO-treated water samples did not change in 2007; we continued to use the two-way ANOVA protocol outlined above. We calculated MSDs for all one-way and two-way ANOVA
POD 2006-2007: H. azteca
29
Tukey’s tests to track the sensitivity of the endpoints over the course of the year. Methods used in the analysis of long-term patterns and trends included pairwise
correlations, ANOVA, ANCOVA, MANOVA, linear regression, and polynomial regression models performed in JMP 5.0.1. Polynomial regression showed that conductivity affected both the survival and weight of H. azteca in 10-day chronic toxicity tests. Therefore, conductivity was included in models constructed to examine the effects of factors such as site, season and PBO treatment on H. azteca survival and weight.
Many samples and controls were simultaneously tested with and without the addition of
PBO. This enabled us to consider PBO as a within-subjects (or repeated measures) factor in models designed to examine the effects of PBO. Paired t-tests were used to examine the effects of PBO in normal EC control water. MANOVA models with non-PBO and PBO-treated toxicity endpoints as paired response variables were used to examine the effects of PBO in ambient water samples and in high conductivity controls while controlling for the effects of differences in conductivity.
PBO Effects on Weight: PBO was shown to cause significant decreases in H. azteca
weight when added to some ambient delta water samples in 2006, but also caused small but frequent decreases in H. azteca weight in control waters. A large number of delta water samples were tested during this study, and the question arises if the significant decreases in H. azteca weight due to PBO addition could have been found randomly due to the same effects seen in the controls, with the greater number of significant effects occurring due to the greater sample size of ambient waters tested. To address this possibility, changes in H. azteca weight in control waters with PBO addition were examined separately in each season. The mean and standard deviation of weight change in the control waters for each season were used to calculate a z-score for each ambient sample showing a significant reduction in weight with PBO addition. This z-score allowed the calculation of the probability and numbers of samples expected to show the level of weight reduction showed by the ambient sample, if the effects of PBO in ambient samples conform to the null model of the effects of PBO in control waters. The numbers of samples expected by the null model to show given levels of reduction in weight were compared to the numbers of samples actually observed at those levels of weight reduction to reveal if the ambient samples showed a greater extent of weight reduction with PBO addition than would be expected due solely to the pattern of weight reduction seen in the controls.
4.1.1.4 Analytical Chemistry
Water samples for analytical chemistry were collected at each sampling site and sampling event using acid-cleaned, amber water bottles, transported on ice and stored at 4oC. If a sample noticeably affected survival or growth of H. azteca, samples were submitted to the California Department of Fish and Game – Water Pollution Laboratory, Rancho Cordova, CA, for chemical analysis. As of June 20/21, 2007, 10 mL dichloromethylene (DCM) were added to one 1-L sample upon receipt at UCD ATL to prevent possible degradation of pyrethroid insecticides during storage.
POD 2006-2007: H. azteca
30
4.1.2 Results A total of 693 water samples were collected for toxicity testing with H. azteca during the
project period January 1, 2006 to December 31, 2007. Results of the toxicity tests are summarized in Tables 9 a-c and 10 a, b below. Detailed results and water chemistry data are shown in Appendix A, Tables A2-A107.
4.1.2.1 Acute Toxicity to H. azteca - Effects on 10-d Survival During the 2006-2007 period, a total of fifteen water samples (2.2% of total samples
tested) were acutely toxic causing a significant reduction in amphipod survival (Table 9 a). Table 10 a shows from which sites these samples were collected, and the relative site-specific percentage of samples showing toxic effects, since sample numbers varied for some sites. A more detailed listing of results including the dates when samples were collected is presented in Table 11 a. Most of the acutely toxic samples were from sites in the lower Sacramento River (Hood, 711), the Deep Water Ship Channel (Light 55) and site 405 (Benicia). In addition, one sample collected on 7/10/07 from site 602 (Suisun Bay) and one sample from site 323 (7/12/06, San Pablo Bay) were acutely toxic. The majority of toxic samples (93.3%) were collected in 2007 (Table 9 b), mostly during the second half of the year (July-December; Table 9 c). Of all samples tested in 2006, only 0.3% exhibited acute toxicity, while 4.1% of samples tested in 2007 were toxic. Since 2006 was a year with high precipitation and river flows, and flows are generally higher in the first part of the year, this pattern suggests an inverse relationship of toxicity with flows.
PBO Effect on 10-d Survival: Significant changes in acute toxicity due to PBO addition
to the ambient samples were seen in seven additional samples (1% of total samples tested) from the Sacramento River at Hood, sites 711, 704, Light 55, 340 (Napa River), 405 (Benicia) and 323 (San Pablo Bay). Toxicity was reduced due to PBO addition indicating the possible presence of organophosphate insecticides in samples collected from Hood on Oct 2, and Oct 30, 2007, and from Light 55 on Oct 31, 2007. Two samples collected on Apr 12, 2007 from site 711, and on Feb 1, 2007 from Light 55 showed a trend towards improved survival due to PBO addition. PBO increased toxicity, indicating the possible presence of pyrethroid insecticides, in samples collected on Jan 25, 2006 at site 323, Aug 22, 2006 at site 711, Mar 29, 2007, at site 340, and Aug 8, 2007 at site 405. In addition, PBO addition significantly reduced 48-hour survival in samples collected on July 10, 2007 from sites 804, 504 and 508 (Table A81-1), three adjacent field sites, suggesting that PBO-synergized chemicals such as pyrethroid insecticides may have been present. Only 0.047 ug/L piperonyl butoxide, a synergist used in pyrethroid pesticide formulations, was detected at site 804. Toxicity seen in samples collected on February 28, 2007 at site 711, Jul 25, 2007 at site 704, Oct 16 and Nov 13, 2007 at Hood, and Nov 28, 2007 at Light 55 remained unchanged after addition of PBO. 4.1.2.2 Chronic Toxicity to H. azteca - Effects on 10-d Growth
Only one sample (site 323) reduced H. azteca growth (Tables 9 a, 10 b). In general, this
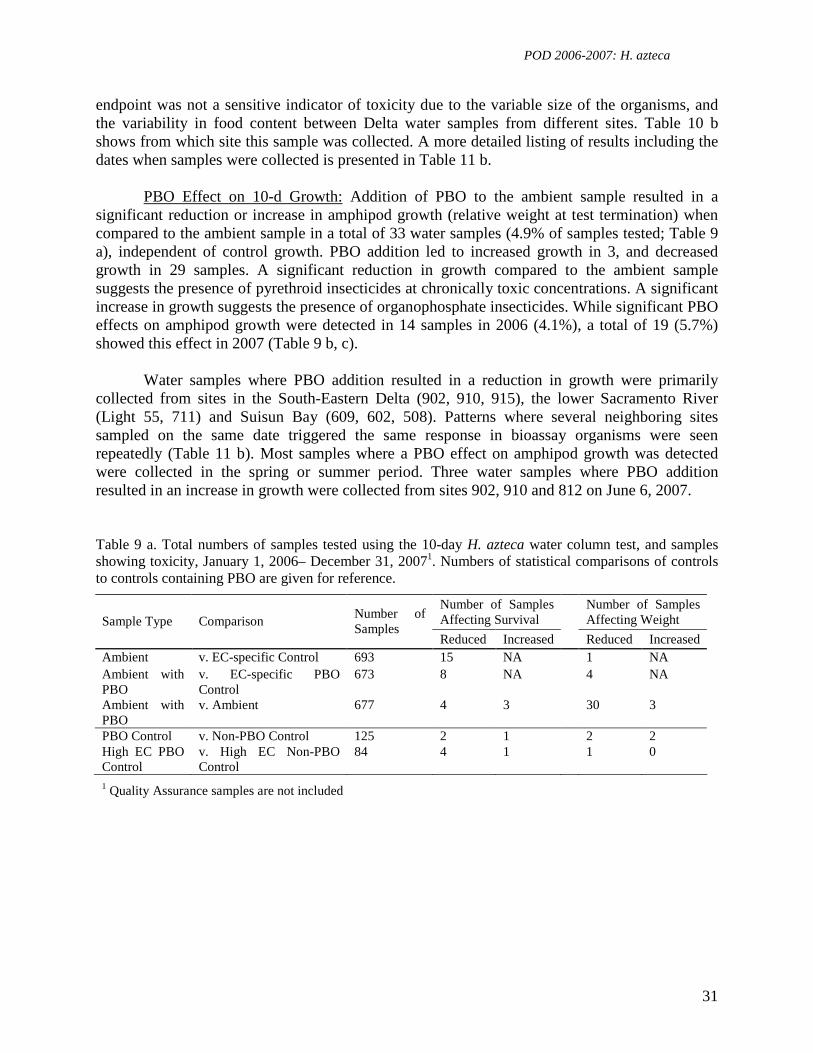
POD 2006-2007: H. azteca
31
endpoint was not a sensitive indicator of toxicity due to the variable size of the organisms, and the variability in food content between Delta water samples from different sites. Table 10 b shows from which site this sample was collected. A more detailed listing of results including the dates when samples were collected is presented in Table 11 b.
PBO Effect on 10-d Growth: Addition of PBO to the ambient sample resulted in a
significant reduction or increase in amphipod growth (relative weight at test termination) when compared to the ambient sample in a total of 33 water samples (4.9% of samples tested; Table 9 a), independent of control growth. PBO addition led to increased growth in 3, and decreased growth in 29 samples. A significant reduction in growth compared to the ambient sample suggests the presence of pyrethroid insecticides at chronically toxic concentrations. A significant increase in growth suggests the presence of organophosphate insecticides. While significant PBO effects on amphipod growth were detected in 14 samples in 2006 (4.1%), a total of 19 (5.7%) showed this effect in 2007 (Table 9 b, c).
Water samples where PBO addition resulted in a reduction in growth were primarily
collected from sites in the South-Eastern Delta (902, 910, 915), the lower Sacramento River (Light 55, 711) and Suisun Bay (609, 602, 508). Patterns where several neighboring sites sampled on the same date triggered the same response in bioassay organisms were seen repeatedly (Table 11 b). Most samples where a PBO effect on amphipod growth was detected were collected in the spring or summer period. Three water samples where PBO addition resulted in an increase in growth were collected from sites 902, 910 and 812 on June 6, 2007.
Table 9 a. Total numbers of samples tested using the 10-day H. azteca water column test, and samples showing toxicity, January 1, 2006– December 31, 20071. Numbers of statistical comparisons of controls to controls containing PBO are given for reference.
Number of Samples Affecting Survival
Number of Samples Affecting Weight Sample Type Comparison
Number of Samples
Reduced Increased Reduced Increased Ambient v. EC-specific Control 693 15 NA 1 NA Ambient with PBO
v. EC-specific PBO Control
673 8 NA 4 NA
Ambient with PBO
v. Ambient 677 4 3 30
3
PBO Control v. Non-PBO Control 125 2 1 2 2 High EC PBO Control
v. High EC Non-PBO Control
84 4 1 1 0
1 Quality Assurance samples are not included
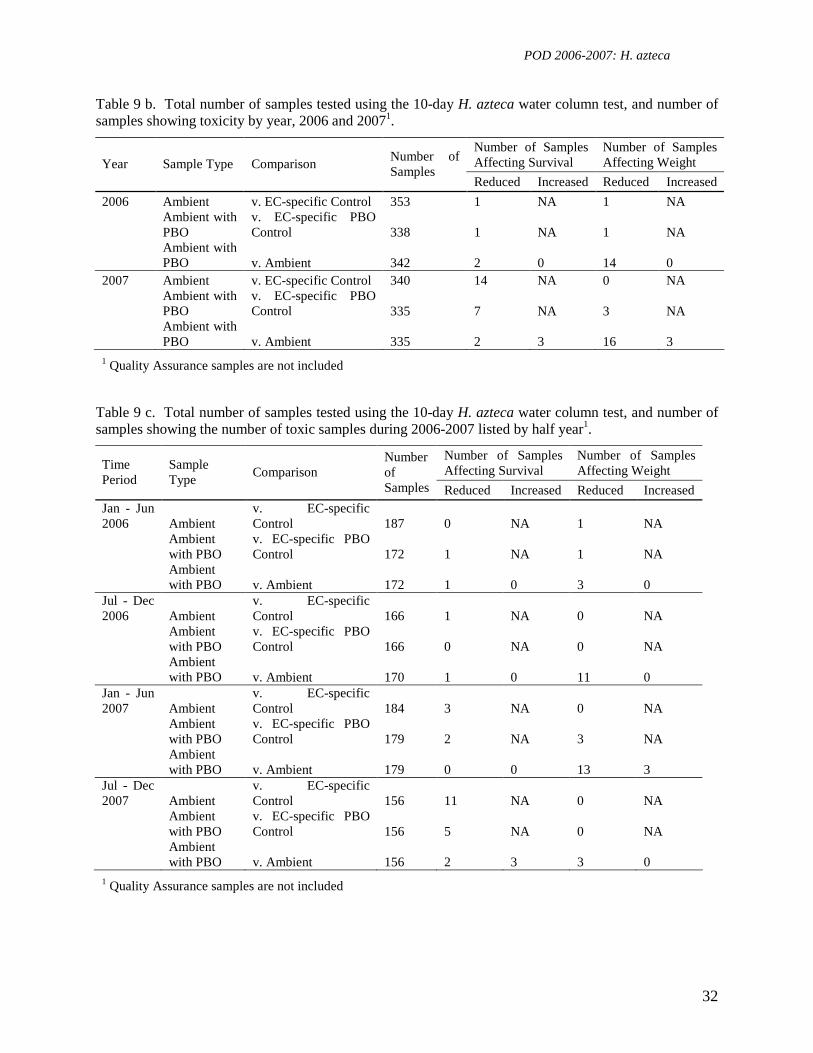
POD 2006-2007: H. azteca
32
Table 9 b. Total number of samples tested using the 10-day H. azteca water column test, and number of samples showing toxicity by year, 2006 and 20071.
Number of Samples Affecting Survival
Number of Samples Affecting Weight Year Sample Type Comparison
Number of Samples
Reduced Increased Reduced Increased
2006 Ambient v. EC-specific Control 353 1 NA 1 NA
Ambient with PBO
v. EC-specific PBO Control 338 1 NA 1 NA
Ambient with PBO v. Ambient 342 2 0 14 0
2007 Ambient v. EC-specific Control 340 14 NA 0 NA
Ambient with PBO
v. EC-specific PBO Control 335 7 NA 3 NA
Ambient with PBO v. Ambient 335 2 3 16 3
1 Quality Assurance samples are not included Table 9 c. Total number of samples tested using the 10-day H. azteca water column test, and number of samples showing the number of toxic samples during 2006-2007 listed by half year1.
Number of Samples Affecting Survival
Number of Samples Affecting Weight Time
Period Sample Type
Comparison Number of Samples Reduced Increased Reduced Increased
Jan - Jun 2006 Ambient
v. EC-specific Control 187 0 NA 1 NA
Ambient with PBO
v. EC-specific PBO Control 172 1 NA 1 NA
Ambient with PBO v. Ambient 172 1 0 3 0
Jul - Dec 2006 Ambient
v. EC-specific Control 166 1 NA 0 NA
Ambient with PBO
v. EC-specific PBO Control 166 0 NA 0 NA
Ambient with PBO v. Ambient 170 1 0 11 0
Jan - Jun 2007 Ambient
v. EC-specific Control 184 3 NA 0 NA
Ambient with PBO
v. EC-specific PBO Control 179 2 NA 3 NA
Ambient with PBO v. Ambient 179 0 0 13 3
Jul - Dec 2007 Ambient
v. EC-specific Control 156 11 NA 0 NA
Ambient with PBO
v. EC-specific PBO Control 156 5 NA 0 NA
Ambient with PBO v. Ambient 156 2 3 3 0
1 Quality Assurance samples are not included
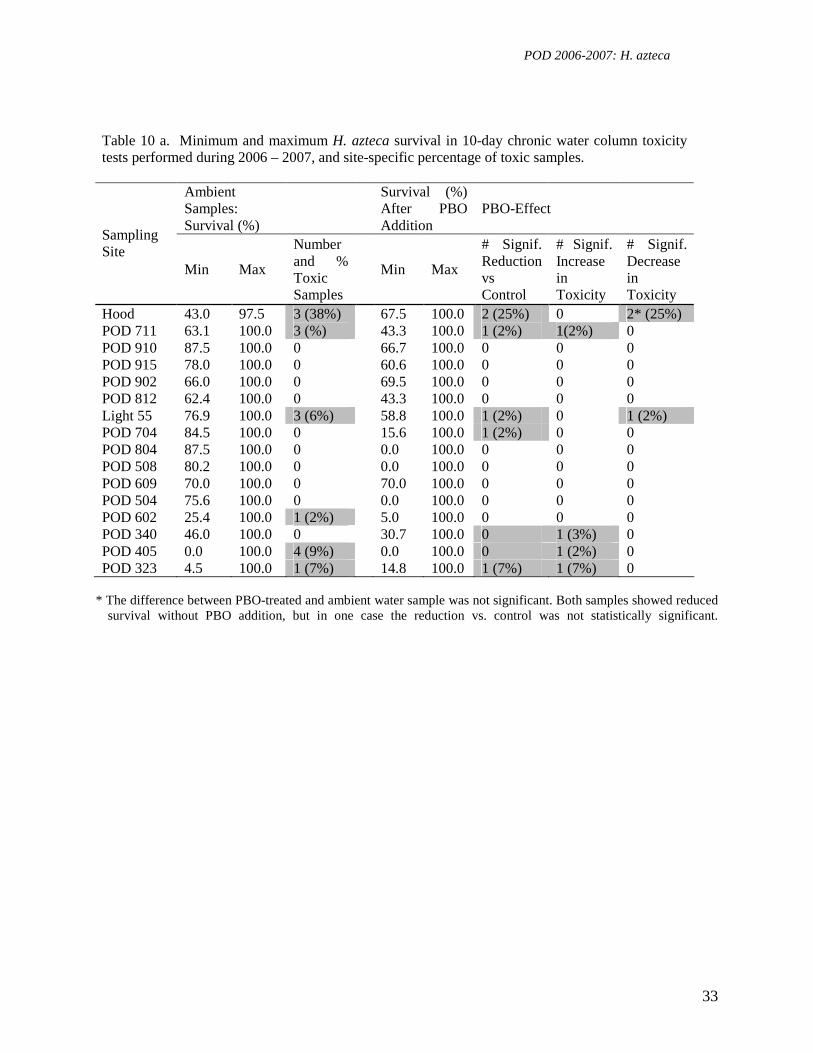
POD 2006-2007: H. azteca
33
Table 10 a. Minimum and maximum H. azteca survival in 10-day chronic water column toxicity tests performed during 2006 – 2007, and site-specific percentage of toxic samples.
Ambient Samples: Survival (%)
Survival (%) After PBO Addition
PBO-Effect
Sampling Site
Min Max
Number and % Toxic Samples
Min Max
# Signif. Reduction vs Control
# Signif. Increase in Toxicity
# Signif. Decrease in Toxicity
Hood 43.0 97.5 3 (38%) 67.5 100.0 2 (25%) 0 2* (25%) POD 711 63.1 100.0 3 (%) 43.3 100.0 1 (2%) 1(2%) 0 POD 910 87.5 100.0 0 66.7 100.0 0 0 0 POD 915 78.0 100.0 0 60.6 100.0 0 0 0 POD 902 66.0 100.0 0 69.5 100.0 0 0 0 POD 812 62.4 100.0 0 43.3 100.0 0 0 0 Light 55 76.9 100.0 3 (6%) 58.8 100.0 1 (2%) 0 1 (2%) POD 704 84.5 100.0 0 15.6 100.0 1 (2%) 0 0 POD 804 87.5 100.0 0 0.0 100.0 0 0 0 POD 508 80.2 100.0 0 0.0 100.0 0 0 0 POD 609 70.0 100.0 0 70.0 100.0 0 0 0 POD 504 75.6 100.0 0 0.0 100.0 0 0 0 POD 602 25.4 100.0 1 (2%) 5.0 100.0 0 0 0 POD 340 46.0 100.0 0 30.7 100.0 0 1 (3%) 0 POD 405 0.0 100.0 4 (9%) 0.0 100.0 0 1 (2%) 0 POD 323 4.5 100.0 1 (7%) 14.8 100.0 1 (7%) 1 (7%) 0
* The difference between PBO-treated and ambient water sample was not significant. Both samples showed reduced
survival without PBO addition, but in one case the reduction vs. control was not statistically significant.

POD 2006-2007: H. azteca
34
Table 10 b. Minimum and maximum H. azteca final weights after 10-day chronic water column toxicity tests performed during 2006 – 2007, and site-specific percentage of affected samples.
Non-PBO Weight (mg dry wt./individual)
Weight (mg dry wt./individual) After PBO Addition
Sample Min Max
# Signif. Reduction vs Control
Min Max
# Signif. Reduction vs Control
# Signif. Increase in Toxicity
# Signif. Decrease in Toxicity
Hood 0.045 0.093 0 0.035 0.066 0 0 0 POD 711 0.043 0.159 0 0.031 0.144 0 3 (6%) 0 POD 910 0.036 0.199 0 0.047 0.168 0 3 (6%) 1 (2%) POD 915 0.049 0.162 0 0.050 0.151 0 3 (6%) 0 POD 902 0.031 0.182 0 0.048 0.143 0 4 (8%) 1 (2%) POD 812 0.033 0.187 0 0.033 0.173 1 (2%) 1 (2%) 1 (2%) Light 55 0.042 0.182 0 0.040 0.158 0 2 (4%) 0 POD 704 0.038 0.192 0 0.045 0.178 0 0 0 POD 804 0.041 0.177 0 0.047 0.172 0 0 0 POD 508 0.032 0.156 0 0.037 0.146 0 3 (6%) 0 POD 609 0.039 0.182 0 0.030 0.204 0 3 (6%) 0 POD 504 0.021 0.182 0 0.032 0.162 0 3 (6%) 0 POD 602 0.026 0.164 0 0.024 0.166 0 2 (4%) 0 POD 340 0.020 0.195 0 0.007 0.180 0 1 (3%) 0 POD 405 0.017 0.153 0 0.023 0.179 0 1 0 POD 323 0.047 0.168 1 (7%) 0.003 0.122 0 1 (7%) 0
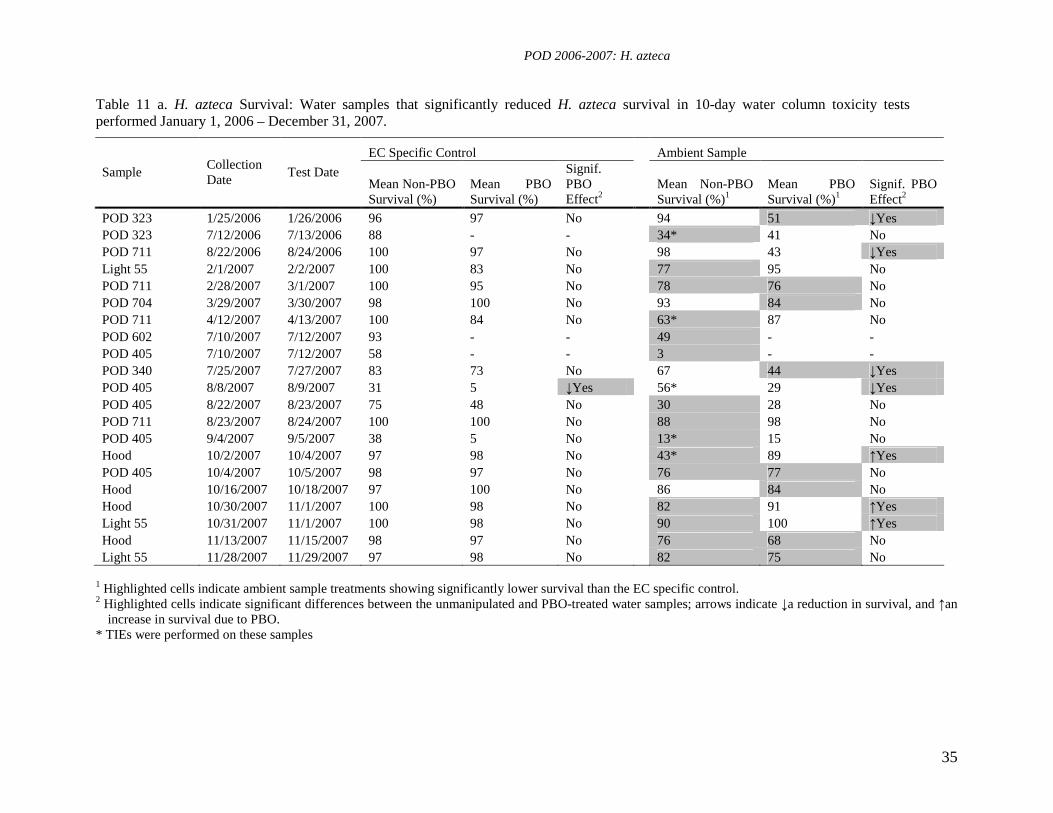
POD 2006-2007: H. azteca
35
Table 11 a. H. azteca Survival: Water samples that significantly reduced H. azteca survival in 10-day water column toxicity tests performed January 1, 2006 – December 31, 2007.
EC Specific Control Ambient Sample
Sample Collection Date
Test Date Mean Non-PBO Survival (%)
Mean PBO Survival (%)
Signif. PBO Effect2
Mean Non-PBO Survival (%)1
Mean PBO Survival (%)1
Signif. PBO Effect2
POD 323 1/25/2006 1/26/2006 96 97 No 94 51 ↓Yes POD 323 7/12/2006 7/13/2006 88 - - 34* 41 No POD 711 8/22/2006 8/24/2006 100 97 No 98 43 ↓Yes Light 55 2/1/2007 2/2/2007 100 83 No 77 95 No POD 711 2/28/2007 3/1/2007 100 95 No 78 76 No POD 704 3/29/2007 3/30/2007 98 100 No 93 84 No POD 711 4/12/2007 4/13/2007 100 84 No 63* 87 No POD 602 7/10/2007 7/12/2007 93 - - 49 - - POD 405 7/10/2007 7/12/2007 58 - - 3 - - POD 340 7/25/2007 7/27/2007 83 73 No 67 44 ↓Yes POD 405 8/8/2007 8/9/2007 31 5 ↓Yes 56* 29 ↓Yes POD 405 8/22/2007 8/23/2007 75 48 No 30 28 No POD 711 8/23/2007 8/24/2007 100 100 No 88 98 No POD 405 9/4/2007 9/5/2007 38 5 No 13* 15 No Hood 10/2/2007 10/4/2007 97 98 No 43* 89 ↑Yes POD 405 10/4/2007 10/5/2007 98 97 No 76 77 No Hood 10/16/2007 10/18/2007 97 100 No 86 84 No Hood 10/30/2007 11/1/2007 100 98 No 82 91 ↑Yes Light 55 10/31/2007 11/1/2007 100 98 No 90 100 ↑Yes Hood 11/13/2007 11/15/2007 98 97 No 76 68 No Light 55 11/28/2007 11/29/2007 97 98 No 82 75 No
1 Highlighted cells indicate ambient sample treatments showing significantly lower survival than the EC specific control. 2 Highlighted cells indicate significant differences between the unmanipulated and PBO-treated water samples; arrows indicate ↓a reduction in survival, and ↑an
increase in survival due to PBO. * TIEs were performed on these samples
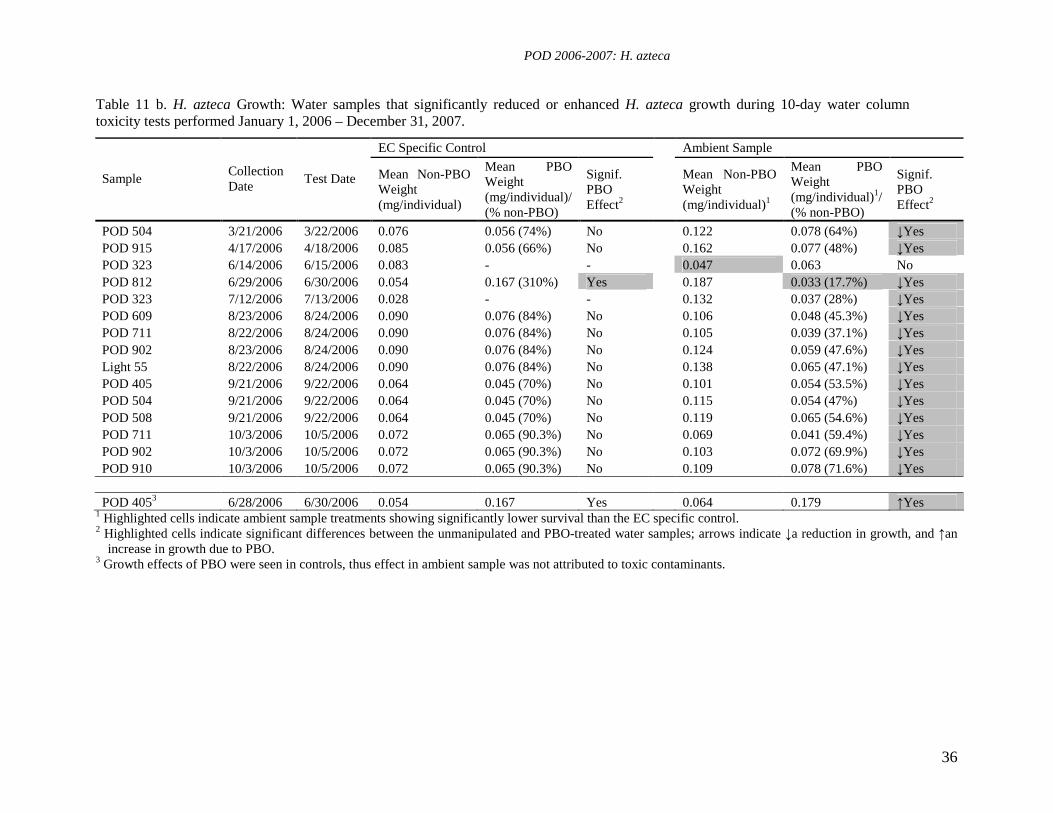
POD 2006-2007: H. azteca
36
Table 11 b. H. azteca Growth: Water samples that significantly reduced or enhanced H. azteca growth during 10-day water column toxicity tests performed January 1, 2006 – December 31, 2007.
EC Specific Control Ambient Sample
Sample Collection Date
Test Date Mean Non-PBO Weight (mg/individual)
Mean PBO Weight (mg/individual)/ (% non-PBO)
Signif. PBO Effect2
Mean Non-PBO Weight (mg/individual)1
Mean PBO Weight (mg/individual)1/ (% non-PBO)
Signif. PBO Effect2
POD 504 3/21/2006 3/22/2006 0.076 0.056 (74%) No 0.122 0.078 (64%) ↓Yes POD 915 4/17/2006 4/18/2006 0.085 0.056 (66%) No 0.162 0.077 (48%) ↓Yes POD 323 6/14/2006 6/15/2006 0.083 - - 0.047 0.063 No POD 812 6/29/2006 6/30/2006 0.054 0.167 (310%) Yes 0.187 0.033 (17.7%) ↓Yes POD 323 7/12/2006 7/13/2006 0.028 - - 0.132 0.037 (28%) ↓Yes POD 609 8/23/2006 8/24/2006 0.090 0.076 (84%) No 0.106 0.048 (45.3%) ↓Yes POD 711 8/22/2006 8/24/2006 0.090 0.076 (84%) No 0.105 0.039 (37.1%) ↓Yes POD 902 8/23/2006 8/24/2006 0.090 0.076 (84%) No 0.124 0.059 (47.6%) ↓Yes Light 55 8/22/2006 8/24/2006 0.090 0.076 (84%) No 0.138 0.065 (47.1%) ↓Yes POD 405 9/21/2006 9/22/2006 0.064 0.045 (70%) No 0.101 0.054 (53.5%) ↓Yes POD 504 9/21/2006 9/22/2006 0.064 0.045 (70%) No 0.115 0.054 (47%) ↓Yes POD 508 9/21/2006 9/22/2006 0.064 0.045 (70%) No 0.119 0.065 (54.6%) ↓Yes POD 711 10/3/2006 10/5/2006 0.072 0.065 (90.3%) No 0.069 0.041 (59.4%) ↓Yes POD 902 10/3/2006 10/5/2006 0.072 0.065 (90.3%) No 0.103 0.072 (69.9%) ↓Yes POD 910 10/3/2006 10/5/2006 0.072 0.065 (90.3%) No 0.109 0.078 (71.6%) ↓Yes POD 4053 6/28/2006 6/30/2006 0.054 0.167 Yes 0.064 0.179 ↑Yes
1 Highlighted cells indicate ambient sample treatments showing significantly lower survival than the EC specific control. 2 Highlighted cells indicate significant differences between the unmanipulated and PBO-treated water samples; arrows indicate ↓a reduction in growth, and ↑an
increase in growth due to PBO. 3 Growth effects of PBO were seen in controls, thus effect in ambient sample was not attributed to toxic contaminants.
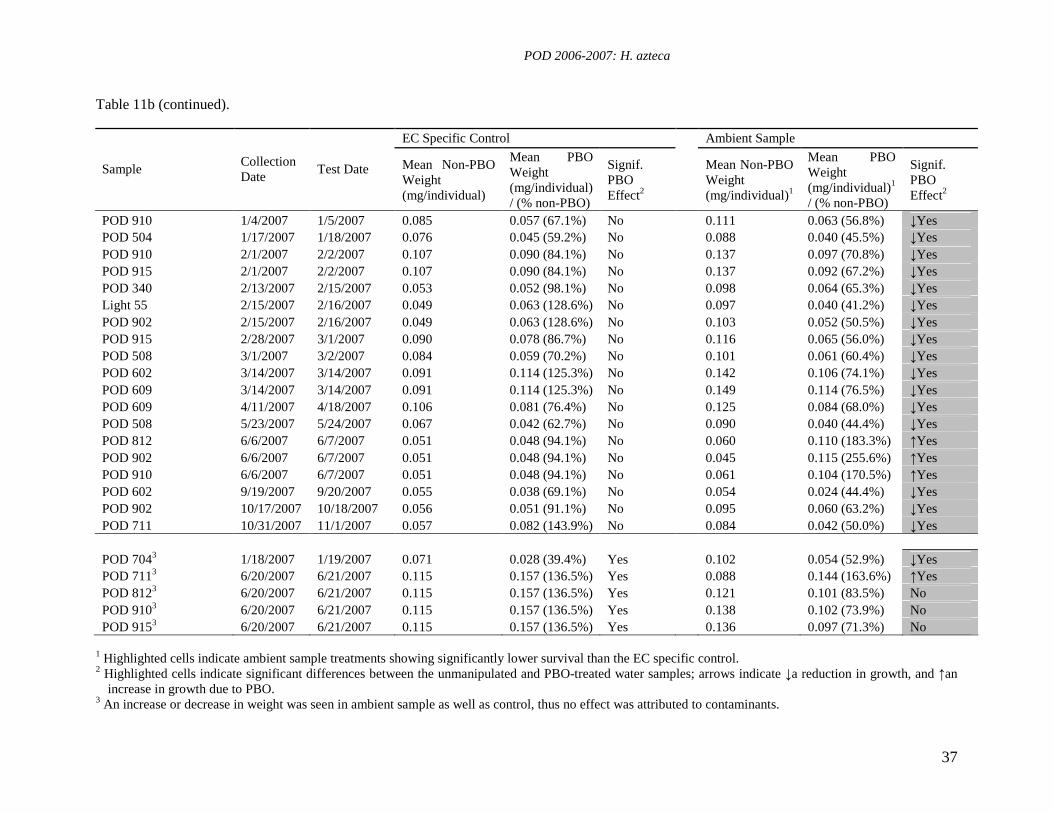
POD 2006-2007: H. azteca
37
Table 11b (continued).
EC Specific Control Ambient Sample
Sample Collection Date
Test Date Mean Non-PBO Weight (mg/individual)
Mean PBO Weight (mg/individual) / (% non-PBO)
Signif. PBO Effect2
Mean Non-PBO Weight (mg/individual)1
Mean PBO Weight (mg/individual)1
/ (% non-PBO)
Signif. PBO Effect2
POD 910 1/4/2007 1/5/2007 0.085 0.057 (67.1%) No 0.111 0.063 (56.8%) ↓Yes POD 504 1/17/2007 1/18/2007 0.076 0.045 (59.2%) No 0.088 0.040 (45.5%) ↓Yes POD 910 2/1/2007 2/2/2007 0.107 0.090 (84.1%) No 0.137 0.097 (70.8%) ↓Yes POD 915 2/1/2007 2/2/2007 0.107 0.090 (84.1%) No 0.137 0.092 (67.2%) ↓Yes POD 340 2/13/2007 2/15/2007 0.053 0.052 (98.1%) No 0.098 0.064 (65.3%) ↓Yes Light 55 2/15/2007 2/16/2007 0.049 0.063 (128.6%) No 0.097 0.040 (41.2%) ↓Yes POD 902 2/15/2007 2/16/2007 0.049 0.063 (128.6%) No 0.103 0.052 (50.5%) ↓Yes POD 915 2/28/2007 3/1/2007 0.090 0.078 (86.7%) No 0.116 0.065 (56.0%) ↓Yes POD 508 3/1/2007 3/2/2007 0.084 0.059 (70.2%) No 0.101 0.061 (60.4%) ↓Yes POD 602 3/14/2007 3/14/2007 0.091 0.114 (125.3%) No 0.142 0.106 (74.1%) ↓Yes POD 609 3/14/2007 3/14/2007 0.091 0.114 (125.3%) No 0.149 0.114 (76.5%) ↓Yes POD 609 4/11/2007 4/18/2007 0.106 0.081 (76.4%) No 0.125 0.084 (68.0%) ↓Yes POD 508 5/23/2007 5/24/2007 0.067 0.042 (62.7%) No 0.090 0.040 (44.4%) ↓Yes POD 812 6/6/2007 6/7/2007 0.051 0.048 (94.1%) No 0.060 0.110 (183.3%) ↑Yes POD 902 6/6/2007 6/7/2007 0.051 0.048 (94.1%) No 0.045 0.115 (255.6%) ↑Yes POD 910 6/6/2007 6/7/2007 0.051 0.048 (94.1%) No 0.061 0.104 (170.5%) ↑Yes POD 602 9/19/2007 9/20/2007 0.055 0.038 (69.1%) No 0.054 0.024 (44.4%) ↓Yes POD 902 10/17/2007 10/18/2007 0.056 0.051 (91.1%) No 0.095 0.060 (63.2%) ↓Yes POD 711 10/31/2007 11/1/2007 0.057 0.082 (143.9%) No 0.084 0.042 (50.0%) ↓Yes POD 7043 1/18/2007 1/19/2007 0.071 0.028 (39.4%) Yes 0.102 0.054 (52.9%) ↓Yes POD 7113 6/20/2007 6/21/2007 0.115 0.157 (136.5%) Yes 0.088 0.144 (163.6%) ↑Yes POD 8123 6/20/2007 6/21/2007 0.115 0.157 (136.5%) Yes 0.121 0.101 (83.5%) No POD 9103 6/20/2007 6/21/2007 0.115 0.157 (136.5%) Yes 0.138 0.102 (73.9%) No POD 9153 6/20/2007 6/21/2007 0.115 0.157 (136.5%) Yes 0.136 0.097 (71.3%) No
1 Highlighted cells indicate ambient sample treatments showing significantly lower survival than the EC specific control. 2 Highlighted cells indicate significant differences between the unmanipulated and PBO-treated water samples; arrows indicate ↓a reduction in growth, and ↑an
increase in growth due to PBO. 3 An increase or decrease in weight was seen in ambient sample as well as control, thus no effect was attributed to contaminants.
POD 2006-2007: H. azteca
38
4.1.2.3 Toxicity Identification Evaluations Investigation of the causes of toxicity using TIE methods proved difficult due to generally low acute toxicity of water samples, and the confounding factors due to high salinity effects on H. azteca. Salinity affected the chemistry of water samples in a way that reduced the effectiveness of some of the TIE manipulations, in particular the addition of STS to bind metals, and addition of esterase and bovine serum albumin (BSA) in efforts to identify pyrethroid toxicity. Below we list and describe the results of TIEs conducted in 2006-2007.
Site 323 (7/12/2006): Toxicity to H. azteca was observed at site 323, collected on July 12, 2006. Relative survival was significantly reduced to 50% by day six of the test. PBO did not enhance acute toxicity, but in fact reduced it, and the same pattern was seen for the “high salinity control”. A Phase I Toxicity Identification Evaluation (TIE) was initiated. Salinity of the water was 15.3 ppt, which is close to the tolerance limit for this species. We therefore tested a series of salinities to evaluate if salinity was the cause of reduced survival. The results are shown in Table A29 (Appendix A). Organic chemicals (eluate addback treatment) as well as high salinity were likely contributing factors in the observed toxic effects.
Site 711 (4/12/2007): Toxicity (47% mortality within 10 days) to H. azteca was observed at site 711, in a sample collected on April 12, 2007. Although the toxicity was below the trigger for TIE testing (50% mortality within 7 days), an attempt was made to identify the toxicant in this sample, and a Phase I Toxicity Identification Evaluation (TIE) was initiated. The results of the TIE are shown in Table A69-1 (Appendix A). Toxicity in the original sample was lost by the time the TIE could be completed (90% survival), and the cause of toxicity could not be determined. The metal chelators EDTA and STS did not reduce toxicity. STS by itself appears to be toxic to H. azteca. Addition of esterase also introduced toxicity. It is possible that enzyme break-down led to toxic components. These two compounds continued to present problems in TIEs with H. azteca, and will not be used in future work.
Site 405 (8/8/2007): Survival of H. azteca was significantly decreased after PBO addition
to the ambient sample. Although this effect was also seen in the respective high salinity control, a TIE focused on the identification of pyrethroids was initiated. These treatments include extracting organic chemicals using a C8 column and testing the concentrated column eluate, and testing the ambient sample at reduced temperature, with the addition of PBO, esterase, and BSA. Results are shown in Table A86-1 (Appendix A). The C8 eluate (concentrated 3-fold) was more toxic than the respective solvent (MeOH) control, indicating that organic chemicals contributed to the toxicity. Pyrethroid insecticides likely caused at least part of the toxicity, since low temperature increased toxicity in this sample from (77% to 47% survival), and PBO enhanced toxicity. However, analytical chemistry did not detect pyrethroid insecticides (Table 13, below). High salinity likely contributed significantly to the toxicity seen in this sample.
Site 405 (9/4/07): Survival of H. azteca was significantly decreased in an ambient sample
(13%) collected on October 2, 2007 as well as in the respective PBO treatment (15%) compared to the high EC control. The respective high EC control also showed reduced survival (38%) indicating that high salinity was contributing to the high mortality, but an additional stressor was present. Although it is very difficult to separate a contaminant signal from a high salinity signal,
POD 2006-2007: H. azteca
39
a TIE was initiated on September 12, 2007. Results are shown in Table A91-1 (Appendix A). The majority of the toxicity in the original, ambient sample was no longer detectable, making the interpretation of TIE results difficult. The C8 eluate (concentrated 3-fold) was more toxic than the respective solvent (MeOH) control, indicating that organic chemicals contributed to the toxicity. Both metal chelators, EDTA and STS, caused toxicity in high salinity laboratory control water, but not in the ambient sample. In order to appropriately interpret these results, further investigations on the interactions of metal chelators with high EC water are needed.
Site Hood (10/2/07): Survival of H. azteca was significantly decreased (43%) in a sample
collected on October 2, 2007. Addition of PBO alleviated toxicity by a factor of 2, suggesting that organophosphate insecticides caused the observed toxicity. Chemical analysis resulted in no detectable concentrations of organophosphate insecticides. Although the toxicity was below the threshold triggering a TIE (50% mortality by day 7), a TIE was initiated on October 21, 2007. Results are shown in Table A96-1 (Appendix A). Toxicity was no longer present in the original ambient water sample, and therefore the chemical toxicant group could not be further identified. However, the initial signal obtained by the addition of PBO is strong evidence for OP insecticides. The fact that the signal disappeared within 3 weeks, and OPs were not detected by chemical analysis, indicates that the toxicity may have been due to a mixture of chemicals with a similar mechanism of action as OPs. 4.1.2.4 Analytical Chemistry
Water samples submitted for chemical analysis showed noticeable effects on one or more bioassay endpoints: survival, survival after PBO addition, growth or growth after PBO addition. Results from chemical analyses of water samples obtained to date are shown in Table 13. Nine field samples analyzed during the reporting period contained detectable concentrations of pesticides: A sample from site 340 cause a significant reduction in H. azteca survival after PBO addition (Table 11 a), and contained 3 ng/L cyfluthrin and 16 ng/L esfenvalerate. Two samples from site 405 caused significant mortality (9/4/07, 10/4/07) and contained 3 ng/L esfenvalerate, and 5 ng/L permethrin, respectively.
Several samples that caused a significant reduction in H. azteca growth contained
detectable amounts of pyrethroid pesticides: Site 902 sampled on 8/22/06 contained 5 ng/L cyfluthrin and 24 ng/L permethrin; site 340 sampled 2/13/07 contained 63 ng/L cyfluthrin, and sites 915 and 508 sampled on 2/28/07 and 3/1/07, respectively, contained 2 and 3 ng/L lambda-cyhalothrin. A sample from Light 55 collected 2/1/07 contained 6 ng/L diazinon.
Other stressors were likely affecting H. azteca in some of these samples. For example, the
presence of 5 ng/L esfenvalerate at site 405 (9/4/07) would be unlikely to cause >85% mortality. Contrary to that, the amount of suspended material may alleviate toxicity due to contaminants, in particular the hydrophobic pyrethroids. For example, a concentration of 63 ng/L cyfluthrin detected at site 340 on 2/13/07 would be expected to cause significant mortality, but in this case resulted in only a growth reduction after PBO addition. Further studies to trace the fate of pyrethroid insecticides during sampling and testing are scheduled.
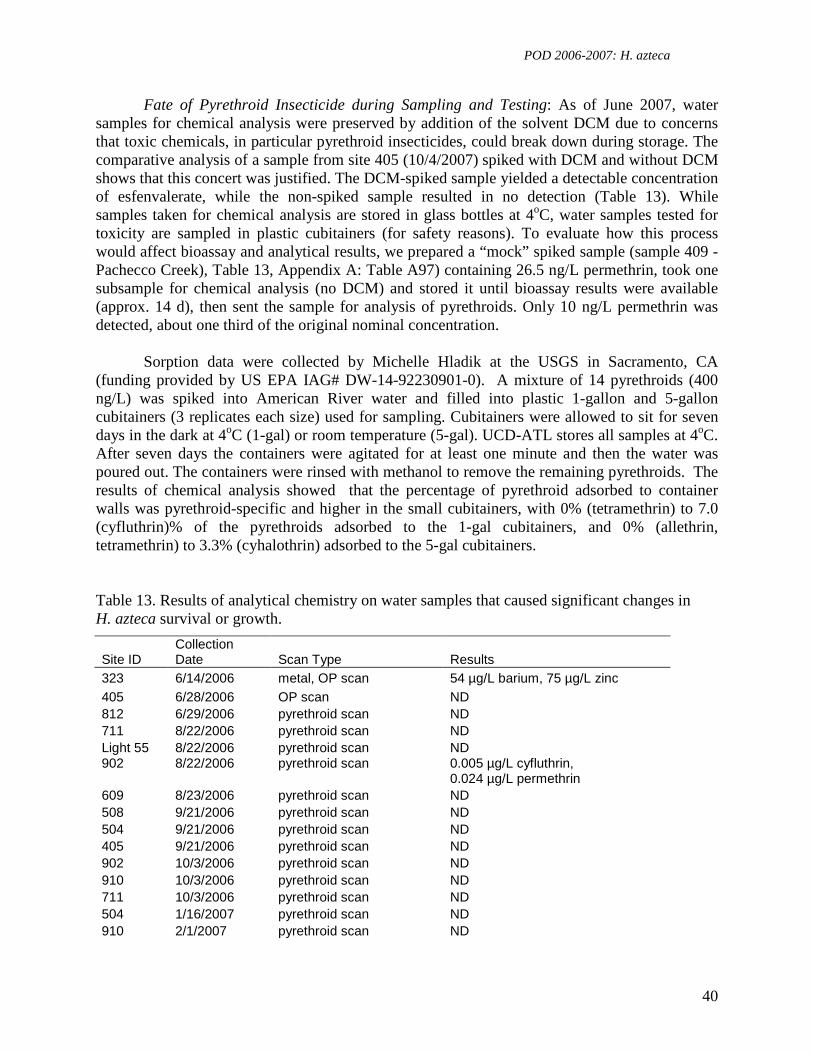
POD 2006-2007: H. azteca
40
Fate of Pyrethroid Insecticide during Sampling and Testing: As of June 2007, water samples for chemical analysis were preserved by addition of the solvent DCM due to concerns that toxic chemicals, in particular pyrethroid insecticides, could break down during storage. The comparative analysis of a sample from site 405 (10/4/2007) spiked with DCM and without DCM shows that this concert was justified. The DCM-spiked sample yielded a detectable concentration of esfenvalerate, while the non-spiked sample resulted in no detection (Table 13). While samples taken for chemical analysis are stored in glass bottles at 4oC, water samples tested for toxicity are sampled in plastic cubitainers (for safety reasons). To evaluate how this process would affect bioassay and analytical results, we prepared a “mock” spiked sample (sample 409 - Pachecco Creek), Table 13, Appendix A: Table A97) containing 26.5 ng/L permethrin, took one subsample for chemical analysis (no DCM) and stored it until bioassay results were available (approx. 14 d), then sent the sample for analysis of pyrethroids. Only 10 ng/L permethrin was detected, about one third of the original nominal concentration.
Sorption data were collected by Michelle Hladik at the USGS in Sacramento, CA
(funding provided by US EPA IAG# DW-14-92230901-0). A mixture of 14 pyrethroids (400 ng/L) was spiked into American River water and filled into plastic 1-gallon and 5-gallon cubitainers (3 replicates each size) used for sampling. Cubitainers were allowed to sit for seven days in the dark at 4oC (1-gal) or room temperature (5-gal). UCD-ATL stores all samples at 4oC. After seven days the containers were agitated for at least one minute and then the water was poured out. The containers were rinsed with methanol to remove the remaining pyrethroids. The results of chemical analysis showed that the percentage of pyrethroid adsorbed to container walls was pyrethroid-specific and higher in the small cubitainers, with 0% (tetramethrin) to 7.0 (cyfluthrin)% of the pyrethroids adsorbed to the 1-gal cubitainers, and 0% (allethrin, tetramethrin) to 3.3% (cyhalothrin) adsorbed to the 5-gal cubitainers.
Table 13. Results of analytical chemistry on water samples that caused significant changes in H. azteca survival or growth.
Site ID Collection Date Scan Type Results
323 6/14/2006 metal, OP scan 54 µg/L barium, 75 µg/L zinc 405 6/28/2006 OP scan ND 812 6/29/2006 pyrethroid scan ND 711 8/22/2006 pyrethroid scan ND Light 55 8/22/2006 pyrethroid scan ND 902
8/22/2006
pyrethroid scan
0.005 µg/L cyfluthrin, 0.024 µg/L permethrin
609 8/23/2006 pyrethroid scan ND 508 9/21/2006 pyrethroid scan ND 504 9/21/2006 pyrethroid scan ND 405 9/21/2006 pyrethroid scan ND 902 10/3/2006 pyrethroid scan ND 910 10/3/2006 pyrethroid scan ND 711 10/3/2006 pyrethroid scan ND 504 1/16/2007 pyrethroid scan ND 910 2/1/2007 pyrethroid scan ND
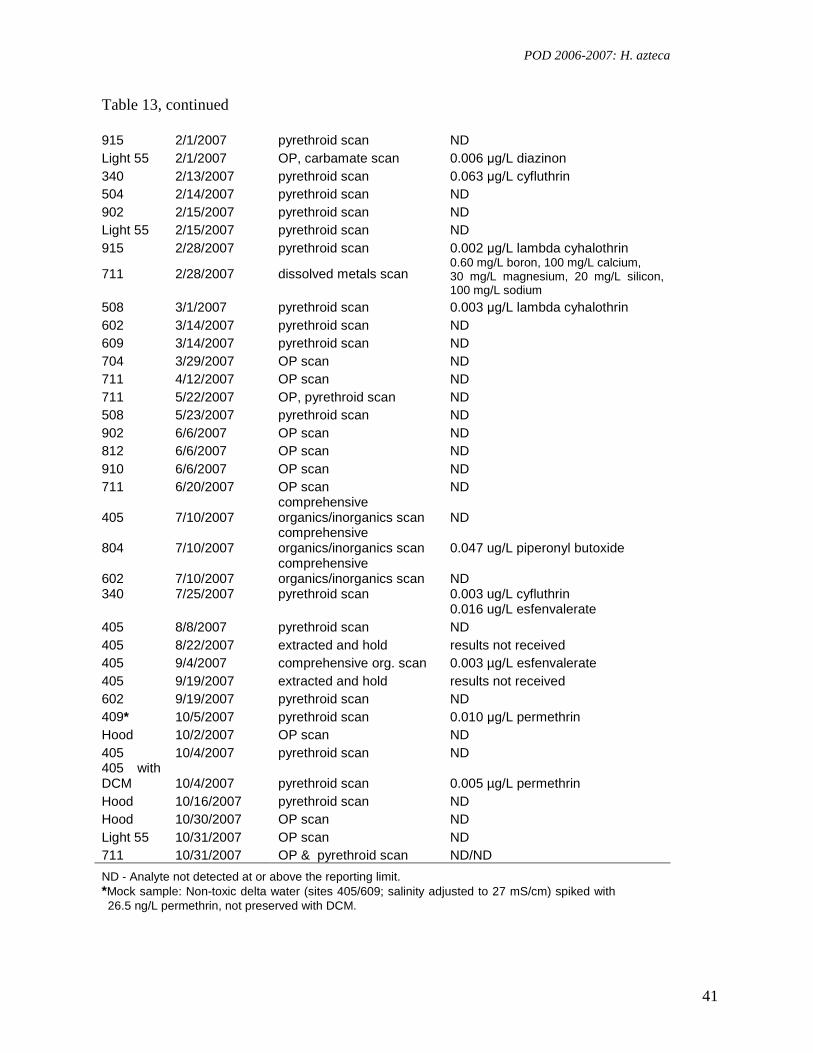
POD 2006-2007: H. azteca
41
Table 13, continued 915 2/1/2007 pyrethroid scan ND Light 55 2/1/2007 OP, carbamate scan 0.006 µg/L diazinon 340 2/13/2007 pyrethroid scan 0.063 µg/L cyfluthrin 504 2/14/2007 pyrethroid scan ND 902 2/15/2007 pyrethroid scan ND Light 55 2/15/2007 pyrethroid scan ND 915 2/28/2007 pyrethroid scan 0.002 µg/L lambda cyhalothrin
711
2/28/2007
dissolved metals scan
0.60 mg/L boron, 100 mg/L calcium, 30 mg/L magnesium, 20 mg/L silicon, 100 mg/L sodium
508 3/1/2007 pyrethroid scan 0.003 µg/L lambda cyhalothrin 602 3/14/2007 pyrethroid scan ND 609 3/14/2007 pyrethroid scan ND 704 3/29/2007 OP scan ND 711 4/12/2007 OP scan ND 711 5/22/2007 OP, pyrethroid scan ND 508 5/23/2007 pyrethroid scan ND 902 6/6/2007 OP scan ND 812 6/6/2007 OP scan ND 910 6/6/2007 OP scan ND 711 6/20/2007 OP scan ND
405 7/10/2007 comprehensive organics/inorganics scan ND
804 7/10/2007 comprehensive organics/inorganics scan 0.047 ug/L piperonyl butoxide
602 7/10/2007 comprehensive organics/inorganics scan ND
340
7/25/2007
pyrethroid scan
0.003 ug/L cyfluthrin 0.016 ug/L esfenvalerate
405 8/8/2007 pyrethroid scan ND 405 8/22/2007 extracted and hold results not received 405 9/4/2007 comprehensive org. scan 0.003 µg/L esfenvalerate 405 9/19/2007 extracted and hold results not received 602 9/19/2007 pyrethroid scan ND 409* 10/5/2007 pyrethroid scan 0.010 µg/L permethrin Hood 10/2/2007 OP scan ND 405 10/4/2007 pyrethroid scan ND 405 with DCM 10/4/2007 pyrethroid scan 0.005 µg/L permethrin Hood 10/16/2007 pyrethroid scan ND Hood 10/30/2007 OP scan ND Light 55 10/31/2007 OP scan ND 711 10/31/2007 OP & pyrethroid scan ND/ND
ND - Analyte not detected at or above the reporting limit. *Mock sample: Non-toxic delta water (sites 405/609; salinity adjusted to 27 mS/cm) spiked with 26.5 ng/L permethrin, not preserved with DCM.
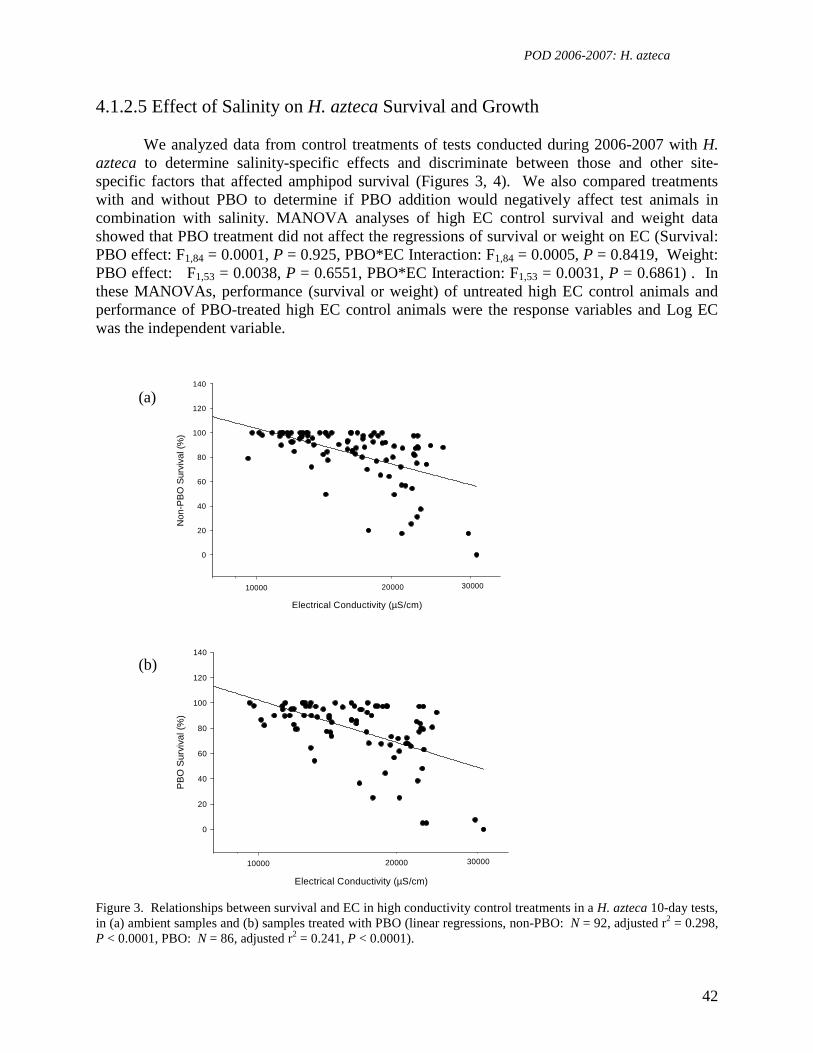
POD 2006-2007: H. azteca
42
4.1.2.5 Effect of Salinity on H. azteca Survival and Growth We analyzed data from control treatments of tests conducted during 2006-2007 with H.
azteca to determine salinity-specific effects and discriminate between those and other site-specific factors that affected amphipod survival (Figures 3, 4). We also compared treatments with and without PBO to determine if PBO addition would negatively affect test animals in combination with salinity. MANOVA analyses of high EC control survival and weight data showed that PBO treatment did not affect the regressions of survival or weight on EC (Survival: PBO effect: F1,84 = 0.0001, P = 0.925, PBO*EC Interaction: F1,84 = 0.0005, P = 0.8419, Weight: PBO effect: F1,53 = 0.0038, P = 0.6551, PBO*EC Interaction: F1,53 = 0.0031, P = 0.6861) . In these MANOVAs, performance (survival or weight) of untreated high EC control animals and performance of PBO-treated high EC control animals were the response variables and Log EC was the independent variable.
Non
-PB
O S
urvi
val (
%)
0
20
40
60
80
100
120
140
Electrical Conductivity (µS/cm)
10000 20000 30000
Electrical Conductivity (µS/cm)
10000
PB
O S
urvi
val (
%)
0
20
40
60
80
100
120
140
20000 30000
Figure 3. Relationships between survival and EC in high conductivity control treatments in a H. azteca 10-day tests, in (a) ambient samples and (b) samples treated with PBO (linear regressions, non-PBO: N = 92, adjusted r2 = 0.298, P < 0.0001, PBO: N = 86, adjusted r2 = 0.241, P < 0.0001).
(b)
(a)

POD 2006-2007: H. azteca
43
Non
-PB
O S
urvi
val (
%)
0
20
40
60
80
100
120
Electrical Conductivity (µS/cm)
100 1000 10000
PB
O S
urvi
val (
%)
0
20
40
60
80
100
120
Electrical Conductivity (µS/cm)
100 1000 10000
Figure 4. Relationships between survival and EC in ambient delta water samples in a H. azteca 10-day chronic toxicity test, in (a) ambient samples and (b) samples treated with PBO (polynomial regressions, non-PBO: N = 704, adjusted r2 = 0.188, P < 0.0001, PBO: N = 675, adjusted r2 = 0.212, P < 0.0001).
Site and Seasonal differences in H. azteca growth: The parabolic curve fits of EC to
weight data (Figures 5, 6) were used in ANCOVA models aimed at revealing any sites or seasons where H. azteca weights deviated from expectations based on conductivity of the sample water. Few significant deviations were found, and those tended to occur at the low and high extremes of the conductivity spectrum. This indicates that the deviations occurred because the parabolic curve fit to the EC effect may not adequately describe the effects of EC at very low and high conductivities. No strong evidence was found that would suggest that major site to site or seasonal differences in H. azteca weight were present that could not be accounted for by differences in conductivity. It should be noted, as our weight MSD readings show, that detecting
(a)
(b)

POD 2006-2007: H. azteca
44
small to moderate differences between sites and seasons is challenging given the low statistical sensitivity of comparisons involving weight, and many potential differences between sites may not be revealed by this analysis.
Season-specific analysis of growth data revealed trends in growth deviations from values
expected based on EC at each sites. Figures in Appendix B show H. azteca weight by season and site. The ANCOVA models show that the differences in H. azteca weights among sites may be largely explained by the effects of conductivity, but model coefficients for the effects associated with specific sites are provided to indicate potential between-site effects that were not adequately explained by the effects of conductivity. Sites 711, 405 and 602 tended to have lower than expected growth, while site 704, 804, 902, 915 had instances of higher than expected growth.
Non
-PB
O W
eigh
t(%
of C
ontr
ol +
Org
anic
Mat
ter
Wei
ght)
0
50
100
150
200
250
Electrical Conductivity (µS/cm)
10000 20000 30000
PB
O W
eigh
t(%
of C
ontr
ol +
Org
anic
Mat
ter
Wei
ght)
0
50
100
150
200
250
Electrical Conductivity (µS/cm)
10000 20000 30000
Figure 5. Relationships between weight and EC in high conductivity control waters in a H. azteca 10-day chronic toxicity test, in (a) ambient samples and (b) samples treated with PBO (linear regressions, non-PBO: N = 55, adjusted r2 = 0.091, P = 0.014, PBO: N = 55, adjusted r2 = 0.144, P < 0.0025).
(a)
(b)
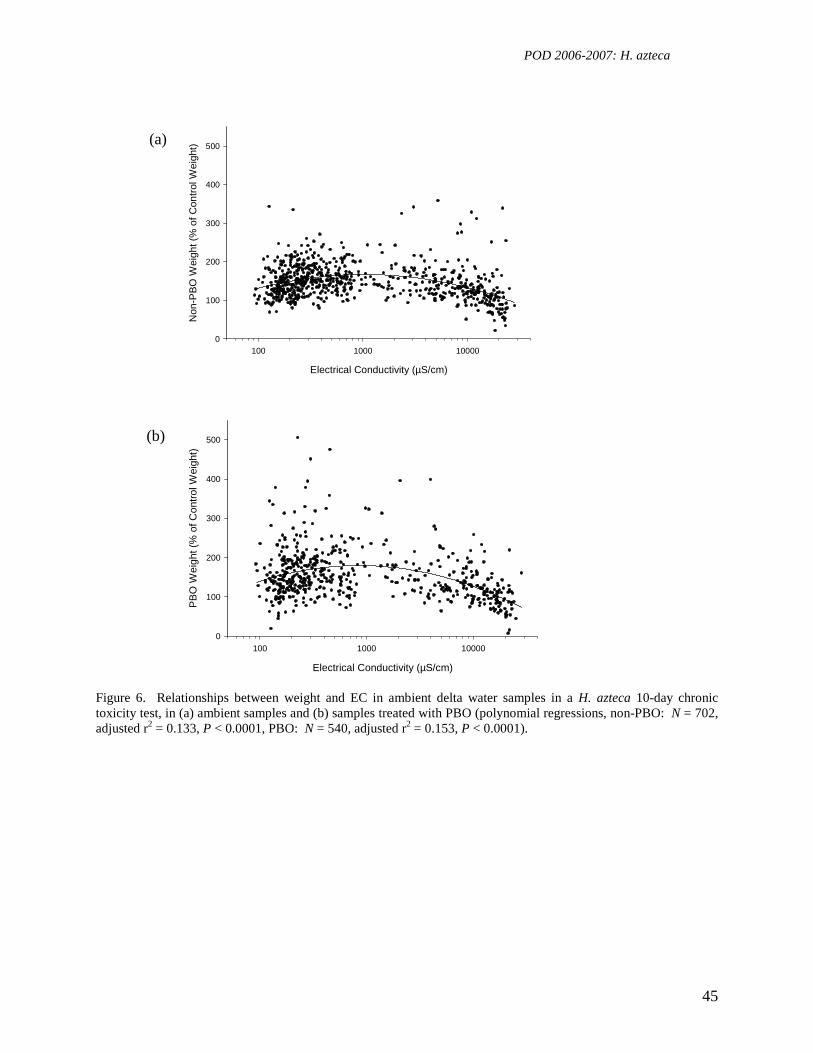
POD 2006-2007: H. azteca
45
Electrical Conductivity (µS/cm)
100 1000 10000
Non
-PB
O W
eigh
t (%
of C
ontr
ol W
eigh
t)
0
100
200
300
400
500
Electrical Conductivity (µS/cm)
100 1000 10000
PB
O W
eigh
t (%
of C
ontr
ol W
eigh
t)
0
100
200
300
400
500
Figure 6. Relationships between weight and EC in ambient delta water samples in a H. azteca 10-day chronic toxicity test, in (a) ambient samples and (b) samples treated with PBO (polynomial regressions, non-PBO: N = 702, adjusted r2 = 0.133, P < 0.0001, PBO: N = 540, adjusted r2 = 0.153, P < 0.0001).
(b)
(a)
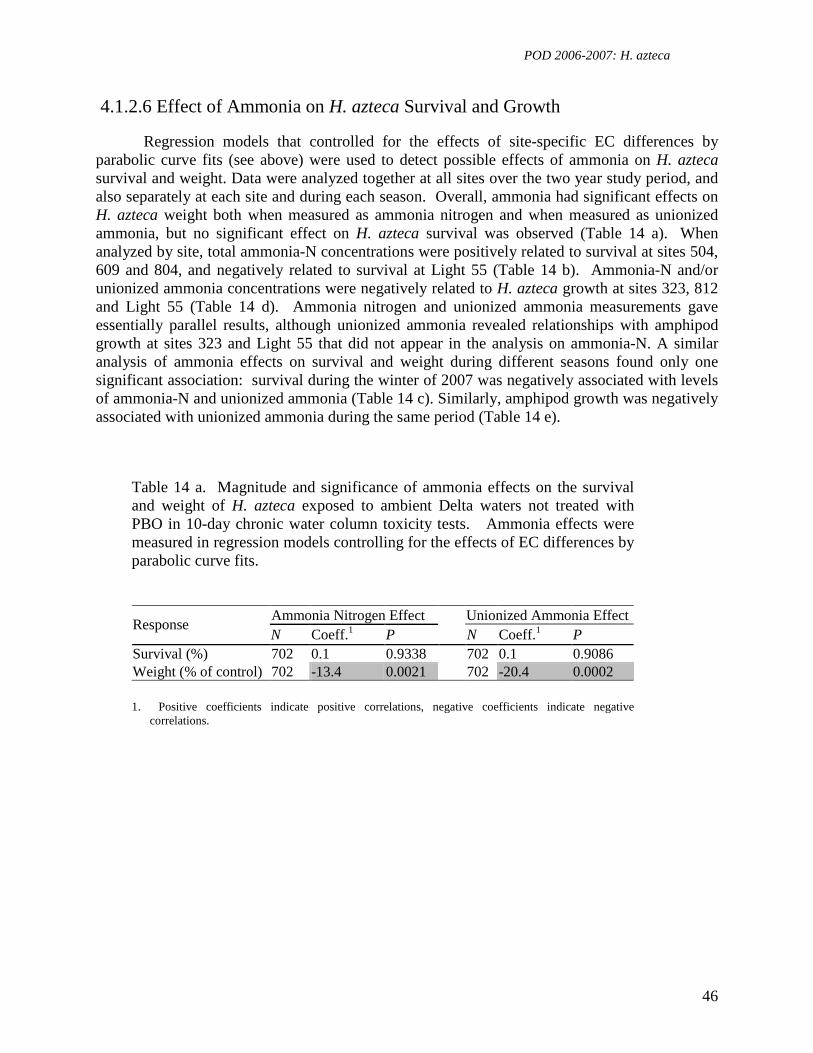
POD 2006-2007: H. azteca
46
4.1.2.6 Effect of Ammonia on H. azteca Survival and Growth
Regression models that controlled for the effects of site-specific EC differences by parabolic curve fits (see above) were used to detect possible effects of ammonia on H. azteca survival and weight. Data were analyzed together at all sites over the two year study period, and also separately at each site and during each season. Overall, ammonia had significant effects on H. azteca weight both when measured as ammonia nitrogen and when measured as unionized ammonia, but no significant effect on H. azteca survival was observed (Table 14 a). When analyzed by site, total ammonia-N concentrations were positively related to survival at sites 504, 609 and 804, and negatively related to survival at Light 55 (Table 14 b). Ammonia-N and/or unionized ammonia concentrations were negatively related to H. azteca growth at sites 323, 812 and Light 55 (Table 14 d). Ammonia nitrogen and unionized ammonia measurements gave essentially parallel results, although unionized ammonia revealed relationships with amphipod growth at sites 323 and Light 55 that did not appear in the analysis on ammonia-N. A similar analysis of ammonia effects on survival and weight during different seasons found only one significant association: survival during the winter of 2007 was negatively associated with levels of ammonia-N and unionized ammonia (Table 14 c). Similarly, amphipod growth was negatively associated with unionized ammonia during the same period (Table 14 e).
Table 14 a. Magnitude and significance of ammonia effects on the survival and weight of H. azteca exposed to ambient Delta waters not treated with PBO in 10-day chronic water column toxicity tests. Ammonia effects were measured in regression models controlling for the effects of EC differences by parabolic curve fits.
Ammonia Nitrogen Effect Unionized Ammonia Effect Response
N Coeff.1 P N Coeff.1 P Survival (%) 702 0.1 0.9338 702 0.1 0.9086 Weight (% of control) 702 -13.4 0.0021 702 -20.4 0.0002
1. Positive coefficients indicate positive correlations, negative coefficients indicate negative correlations.
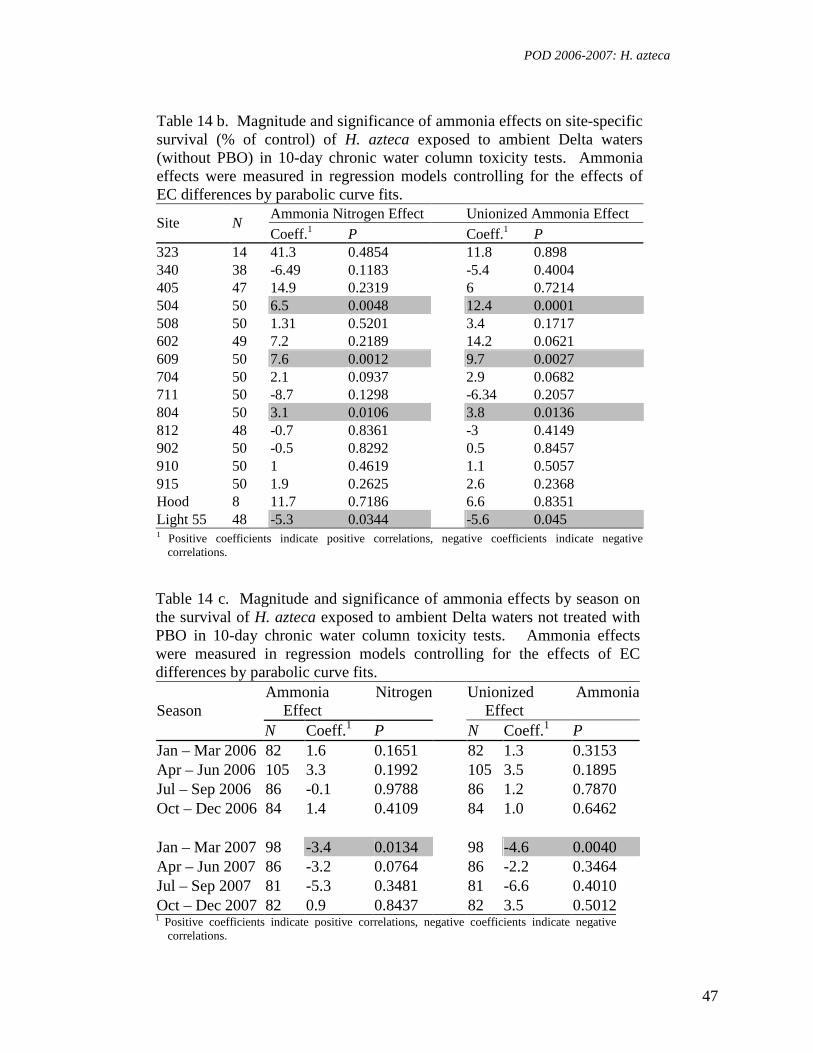
POD 2006-2007: H. azteca
47
Table 14 b. Magnitude and significance of ammonia effects on site-specific survival (% of control) of H. azteca exposed to ambient Delta waters (without PBO) in 10-day chronic water column toxicity tests. Ammonia effects were measured in regression models controlling for the effects of EC differences by parabolic curve fits.
Ammonia Nitrogen Effect Unionized Ammonia Effect Site N
Coeff.1 P Coeff.1 P 323 14 41.3 0.4854 11.8 0.898 340 38 -6.49 0.1183 -5.4 0.4004 405 47 14.9 0.2319 6 0.7214 504 50 6.5 0.0048 12.4 0.0001 508 50 1.31 0.5201 3.4 0.1717 602 49 7.2 0.2189 14.2 0.0621 609 50 7.6 0.0012 9.7 0.0027 704 50 2.1 0.0937 2.9 0.0682 711 50 -8.7 0.1298 -6.34 0.2057 804 50 3.1 0.0106 3.8 0.0136 812 48 -0.7 0.8361 -3 0.4149 902 50 -0.5 0.8292 0.5 0.8457 910 50 1 0.4619 1.1 0.5057 915 50 1.9 0.2625 2.6 0.2368 Hood 8 11.7 0.7186 6.6 0.8351 Light 55 48 -5.3 0.0344 -5.6 0.045 1 Positive coefficients indicate positive correlations, negative coefficients indicate negative
correlations.
Table 14 c. Magnitude and significance of ammonia effects by season on the survival of H. azteca exposed to ambient Delta waters not treated with PBO in 10-day chronic water column toxicity tests. Ammonia effects were measured in regression models controlling for the effects of EC differences by parabolic curve fits.
Ammonia Nitrogen Effect
Unionized Ammonia Effect Season
N Coeff.1 P N Coeff.1 P Jan – Mar 2006 82 1.6 0.1651 82 1.3 0.3153 Apr – Jun 2006 105 3.3 0.1992 105 3.5 0.1895 Jul – Sep 2006 86 -0.1 0.9788 86 1.2 0.7870 Oct – Dec 2006 84 1.4 0.4109 84 1.0 0.6462 Jan – Mar 2007 98 -3.4 0.0134 98 -4.6 0.0040 Apr – Jun 2007 86 -3.2 0.0764 86 -2.2 0.3464 Jul – Sep 2007 81 -5.3 0.3481 81 -6.6 0.4010 Oct – Dec 2007 82 0.9 0.8437 82 3.5 0.5012 1 Positive coefficients indicate positive correlations, negative coefficients indicate negative
correlations.
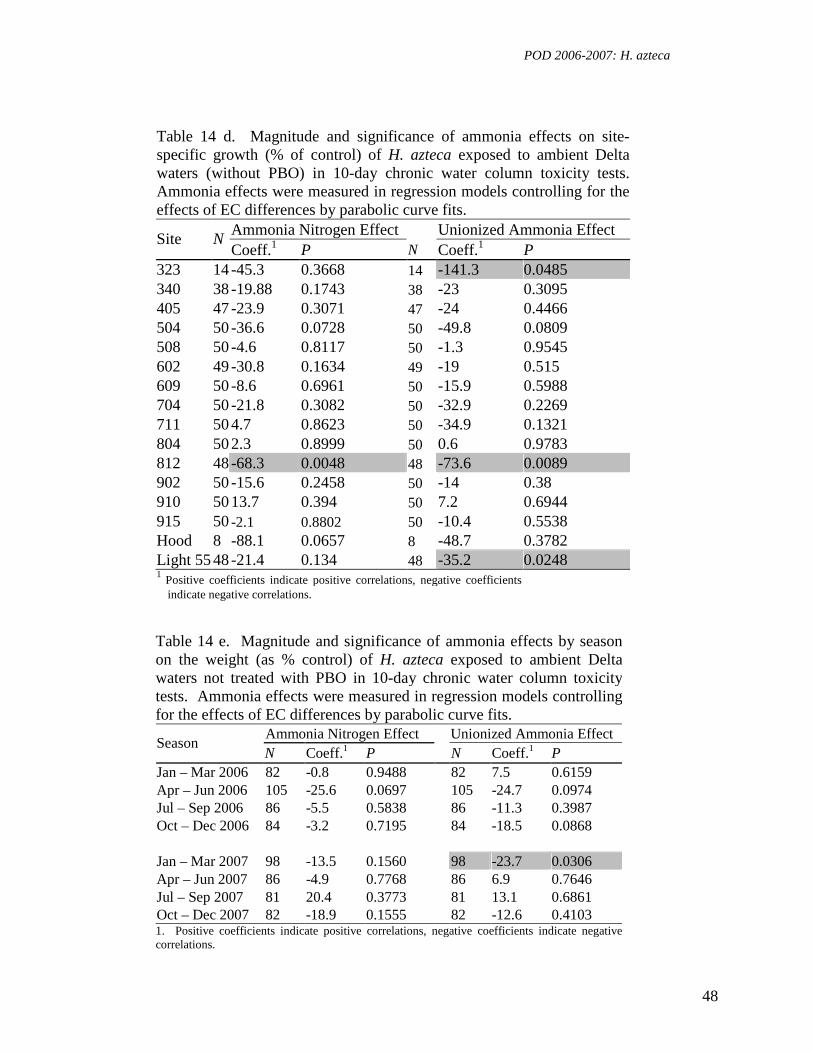
POD 2006-2007: H. azteca
48
Table 14 d. Magnitude and significance of ammonia effects on site-specific growth (% of control) of H. azteca exposed to ambient Delta waters (without PBO) in 10-day chronic water column toxicity tests. Ammonia effects were measured in regression models controlling for the effects of EC differences by parabolic curve fits.
Ammonia Nitrogen Effect Unionized Ammonia Effect Site N
Coeff.1 P N Coeff.1 P 323 14 -45.3 0.3668 14 -141.3 0.0485 340 38 -19.88 0.1743 38 -23 0.3095 405 47 -23.9 0.3071 47 -24 0.4466 504 50 -36.6 0.0728 50 -49.8 0.0809 508 50 -4.6 0.8117 50 -1.3 0.9545 602 49 -30.8 0.1634 49 -19 0.515 609 50 -8.6 0.6961 50 -15.9 0.5988 704 50 -21.8 0.3082 50 -32.9 0.2269 711 50 4.7 0.8623 50 -34.9 0.1321 804 50 2.3 0.8999 50 0.6 0.9783 812 48 -68.3 0.0048 48 -73.6 0.0089 902 50 -15.6 0.2458 50 -14 0.38 910 50 13.7 0.394 50 7.2 0.6944 915 50 -2.1 0.8802 50 -10.4 0.5538 Hood 8 -88.1 0.0657 8 -48.7 0.3782 Light 55 48 -21.4 0.134 48 -35.2 0.0248 1
Positive coefficients indicate positive correlations, negative coefficients indicate negative correlations.
Table 14 e. Magnitude and significance of ammonia effects by season on the weight (as % control) of H. azteca exposed to ambient Delta waters not treated with PBO in 10-day chronic water column toxicity tests. Ammonia effects were measured in regression models controlling for the effects of EC differences by parabolic curve fits.
Ammonia Nitrogen Effect Unionized Ammonia Effect Season
N Coeff.1 P N Coeff.1 P Jan – Mar 2006 82 -0.8 0.9488 82 7.5 0.6159 Apr – Jun 2006 105 -25.6 0.0697 105 -24.7 0.0974 Jul – Sep 2006 86 -5.5 0.5838 86 -11.3 0.3987 Oct – Dec 2006 84 -3.2 0.7195 84 -18.5 0.0868 Jan – Mar 2007 98 -13.5 0.1560 98 -23.7 0.0306 Apr – Jun 2007 86 -4.9 0.7768 86 6.9 0.7646 Jul – Sep 2007 81 20.4 0.3773 81 13.1 0.6861 Oct – Dec 2007 82 -18.9 0.1555 82 -12.6 0.4103 1. Positive coefficients indicate positive correlations, negative coefficients indicate negative correlations.
POD 2006-2007: H. azteca
49
4.2 Laboratory Experiments
Pyrethroid Toxicity at Environmentally Relevant Concentrations: Lethal and Sublethal Effects in the Amphipod Hyalella azteca Susanne M Brander*, Inge Werner, Linda A Deanovic;
Introduction Pyrethroid pesticide use during 2000-2003 in the Central Valley of California (San
Joaquin & Sacramento) was doubled from 1990 levels, mainly due to the phasing out of the more toxic OPs for both agricultural and residential applications (Epstein et al. 2000; Oros and Werner 2005). However, over the past decade it has been discovered that while pyrethroids are not acutely toxic to mammals, they are very toxic to fish and aquatic invertebrates (Oros and Werner 2005). This is due to a combination of factors, including the similar physiology of aquaticinvertebrates to insects and the potential for disruption of osmoregulation in fish (Clark and Matsumura 1982; Oros and Werner 2005). Pyrethroids disrupt the nervous system by binding to and prolonging the opening of voltage-dependent ion channels, mainly those controlling the passage of sodium, but sometimes chloride and calcium channels as well (Burr and Ray 2004; Marshalonis et al. 2006; Shafer and Meyer 2004). Because the opening of these channels controls the firing of neurons, the consequence of extended opening is convulsions, paralysis and eventually death (Shafer & Meyer 2004; Oros & Werner 2005).
Pyrethroids are highly lipophilic and tend to bind to sediments, and therefore it has been
argued that this decreases their toxicity substantially (Leahey 1985). However, these compounds can remain in the water column for days to weeks and are soluble enough to render biological harm to vulnerable organisms, especially considering that pyrethroids are toxic in the ppb range (Oros & Werner 2005). Due to their unique chemical properties, pyrethroids may be harmful to both pelagic and benthic species. Hyalella azteca, an epibenthic organism prevalent in the Sacramento / San Joaquin Delta which receives run-off from the CA Central Valley, may be exposed to these pesticides via both routes and has already been found to be highly sensitive to sediment-bound pyrethroids (Weston et al. 2005; Weston et al. 2004). Hence it was chosen for this study.
Permethrin and cyfluthrin, two pyrethroid pesticides found in the SSJ Delta, are toxic to
Hyalella azteca at the ppb range, well within levels measured in the region (Amweg et al. 2005; Amweg et al. 2006b). In recent studies, sediment-bound cyfluthrin and permethrin had LC50s as low as 12.5 ng/g (ppb) and 57 ng/g, respectively, in Hyalella (Amweg et al. 2005; Amweg et al. 2006b; Weston et al. 2004). Permethrin toxicity has been observed at the ppb level in other crustaceans, fish and amphibians as well (DeLorenzo et al. 2006; Oros and Werner 2005).
Newer generation “type II” pyrethroids, which degrade more slowly, bind more
effectively to sodium channels and therefore prolong firing longer than older “type I” pyrethroids. This results in higher toxicity at lower concentrations (Leahey 1985). Of the top
POD 2006-2007: H. azteca
50
five pyrethroids in use in this region, permethrin (type I) is the most frequently used and least toxic, and cyfluthrin (type II) is the fifth most used but ranks second in toxicity (Oros & Werner 2005). As a result of the mechanistic enhancements endowed upon type II pyrethroids (such as cyfluthrin), they may have a toxic potency up to 20-fold that of a type I pyrethroid like permethrin (Oros and Werner 2005).
The toxicity of both type I and II pyrethroids is further amplified by the pesticide
synergist piperonyl butoxide (PBO), which can increase the toxicity of pyrethroids 10 to 150-fold, depending on the formulation (Wheelock et al. 2004), through inhibition of the enzymes that metabolically deactivate the pyrethroid molecules (Amweg et al. 2006a). In addition to the threat posed by PBO, classes of pesticides commonly found together in aquatic ecosystems that have different targets, such as pyrethroids and organophosphates, or pyrethroids and carbamates, have been found to be synergistic (Corbel et al. 2004; Denton et al. 2003). However, little is known about the combined toxicity of specific type I and II pyrethroids.
The objective of this study was to use a local, sensitive species to evaluate the toxicity of
environmentally relevant concentrations and mixtures of two pyrethroid pesticides detected in the water column of the SSJ Delta, in Old River at the mouth of Holland Cut (Figure 1). Although a number of studies have utilized Hyalella azteca to examine the toxicity of pyrethroids bound to sediments (Weston et al. 2004; Weston et al. 2005; Amweg et al. 2005; Amweg et al. 2006), this is one of the first studies to evaluate the combined toxicity of permethrin (type I) and cyfluthrin (type II) to H. azteca in the water column at levels measured in the SSJ Delta water column.
Methods A water sample collected on August 22, 2006 at Site 902 (Old River at the mouth of
Holland Cut, 38-01-09.1N, 121-34-55.9W) caused a significant reduction (52%) of H. azteca growth after PBO addition. (Werner I., unpublished data). Chemical analysis of whole water samples revealed the presence of two pyrethroid pesticides: 0.005 µg/L (ppb) cyfluthrin, and 0.024 µg/L (ppb) permethrin. To verify if these compounds could be responsible for the observed toxic effects, a laboratory experiment was performed in 2007 and repeated in 2008.
Cyfluthrin (BaythroidTM, 98% mix of isomers; Figure 1) and permethrin (31.8% cis,
67.4% trans; Figure 2) were purchased from Chem Service, Inc. in West Chester, PA. Stock solutions were made in methanol and cyfluthrin and permethrin stocks were spiked into laboratory control water consisting of deionized water amended to US EPA moderately hard standards (DIEPAMHR) to yield the following nominal concentrations:
Cyfluthrin: 0.0025, 0.005, 0.01 µg/L (ppb) Permethrin: 0.012, 0.024, 0.048 µg/L (ppb) Cyfluthrin + Permethrin: 0.0025 + 0.012, 0.005+0.024, 0.01+0.048 µg/L Confirmatory chemistry was performed at the California Department of Fish & Game
Laboratory in Sacramento, CA. Nominal and measured concentrations can be found in Table 1.
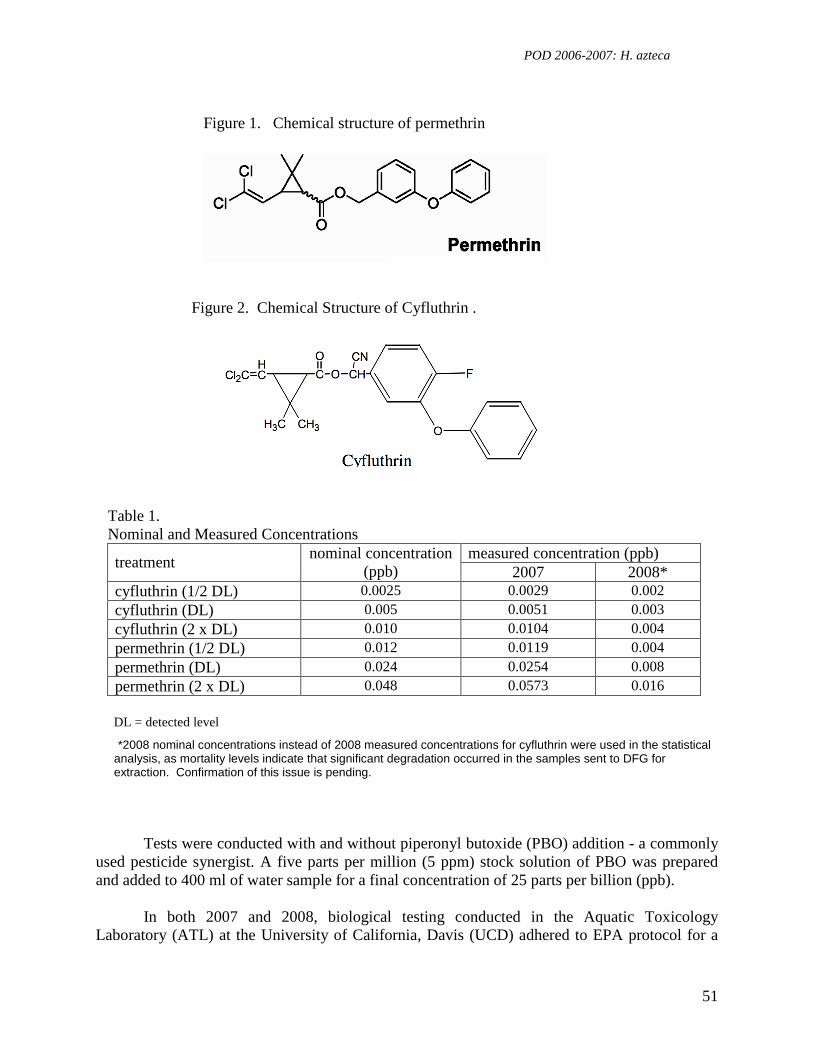
POD 2006-2007: H. azteca
51
Figure 1. Chemical structure of permethrin
Figure 2. Chemical Structure of Cyfluthrin .
Table 1. Nominal and Measured Concentrations
measured concentration (ppb) treatment
nominal concentration (ppb) 2007 2008*
cyfluthrin (1/2 DL) 0.0025 0.0029 0.002 cyfluthrin (DL) 0.005 0.0051 0.003 cyfluthrin (2 x DL) 0.010 0.0104 0.004 permethrin (1/2 DL) 0.012 0.0119 0.004 permethrin (DL) 0.024 0.0254 0.008 permethrin (2 x DL) 0.048 0.0573 0.016
DL = detected level
*2008 nominal concentrations instead of 2008 measured concentrations for cyfluthrin were used in the statistical analysis, as mortality levels indicate that significant degradation occurred in the samples sent to DFG for extraction. Confirmation of this issue is pending.
Tests were conducted with and without piperonyl butoxide (PBO) addition - a commonly
used pesticide synergist. A five parts per million (5 ppm) stock solution of PBO was prepared and added to 400 ml of water sample for a final concentration of 25 parts per billion (ppb).
In both 2007 and 2008, biological testing conducted in the Aquatic Toxicology
Laboratory (ATL) at the University of California, Davis (UCD) adhered to EPA protocol for a
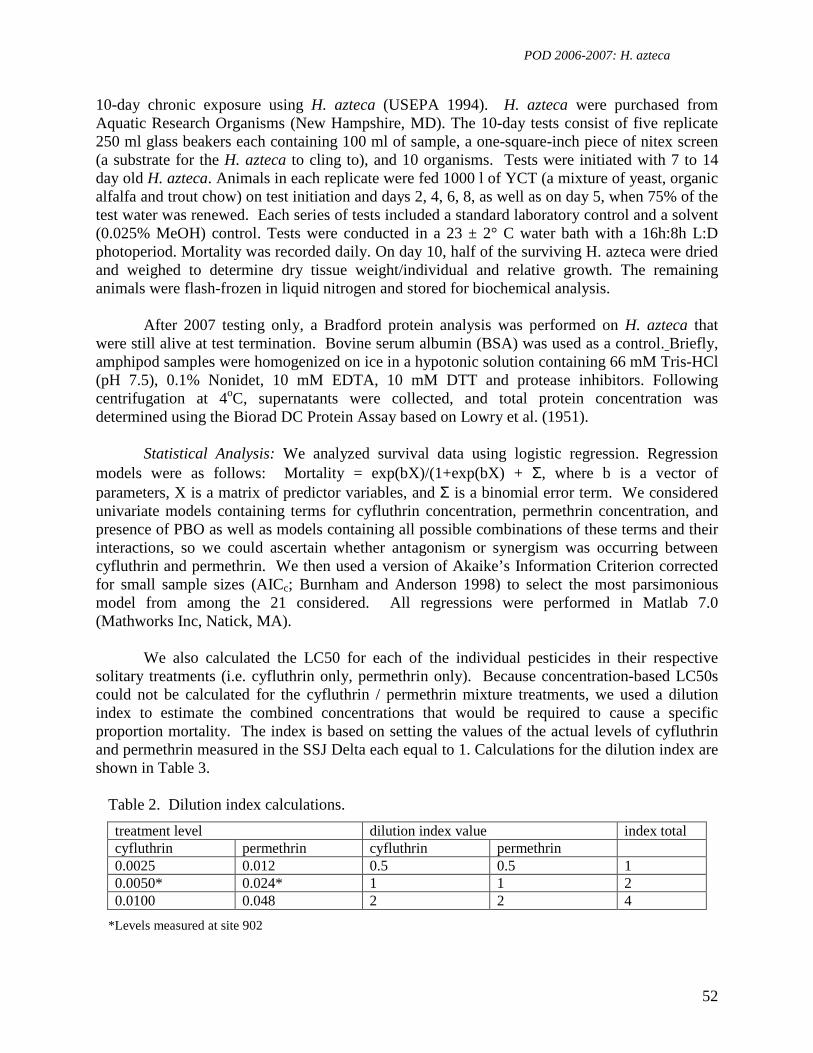
POD 2006-2007: H. azteca
52
10-day chronic exposure using H. azteca (USEPA 1994). H. azteca were purchased from Aquatic Research Organisms (New Hampshire, MD). The 10-day tests consist of five replicate 250 ml glass beakers each containing 100 ml of sample, a one-square-inch piece of nitex screen (a substrate for the H. azteca to cling to), and 10 organisms. Tests were initiated with 7 to 14 day old H. azteca. Animals in each replicate were fed 1000 l of YCT (a mixture of yeast, organic alfalfa and trout chow) on test initiation and days 2, 4, 6, 8, as well as on day 5, when 75% of the test water was renewed. Each series of tests included a standard laboratory control and a solvent (0.025% MeOH) control. Tests were conducted in a 23 ± 2° C water bath with a 16h:8h L:D photoperiod. Mortality was recorded daily. On day 10, half of the surviving H. azteca were dried and weighed to determine dry tissue weight/individual and relative growth. The remaining animals were flash-frozen in liquid nitrogen and stored for biochemical analysis.
After 2007 testing only, a Bradford protein analysis was performed on H. azteca that were still alive at test termination. Bovine serum albumin (BSA) was used as a control. Briefly, amphipod samples were homogenized on ice in a hypotonic solution containing 66 mM Tris-HCl (pH 7.5), 0.1% Nonidet, 10 mM EDTA, 10 mM DTT and protease inhibitors. Following centrifugation at 4oC, supernatants were collected, and total protein concentration was determined using the Biorad DC Protein Assay based on Lowry et al. (1951).
Statistical Analysis: We analyzed survival data using logistic regression. Regression models were as follows: Mortality = exp(bX)/(1+exp(bX) + Σ, where b is a vector of parameters, X is a matrix of predictor variables, and Σ is a binomial error term. We considered univariate models containing terms for cyfluthrin concentration, permethrin concentration, and presence of PBO as well as models containing all possible combinations of these terms and their interactions, so we could ascertain whether antagonism or synergism was occurring between cyfluthrin and permethrin. We then used a version of Akaike’s Information Criterion corrected for small sample sizes (AICc; Burnham and Anderson 1998) to select the most parsimonious model from among the 21 considered. All regressions were performed in Matlab 7.0 (Mathworks Inc, Natick, MA).
We also calculated the LC50 for each of the individual pesticides in their respective
solitary treatments (i.e. cyfluthrin only, permethrin only). Because concentration-based LC50s could not be calculated for the cyfluthrin / permethrin mixture treatments, we used a dilution index to estimate the combined concentrations that would be required to cause a specific proportion mortality. The index is based on setting the values of the actual levels of cyfluthrin and permethrin measured in the SSJ Delta each equal to 1. Calculations for the dilution index are shown in Table 3.
Table 2. Dilution index calculations.
treatment level dilution index value index total cyfluthrin permethrin cyfluthrin permethrin 0.0025 0.012 0.5 0.5 1 0.0050* 0.024* 1 1 2 0.0100 0.048 2 2 4
*Levels measured at site 902
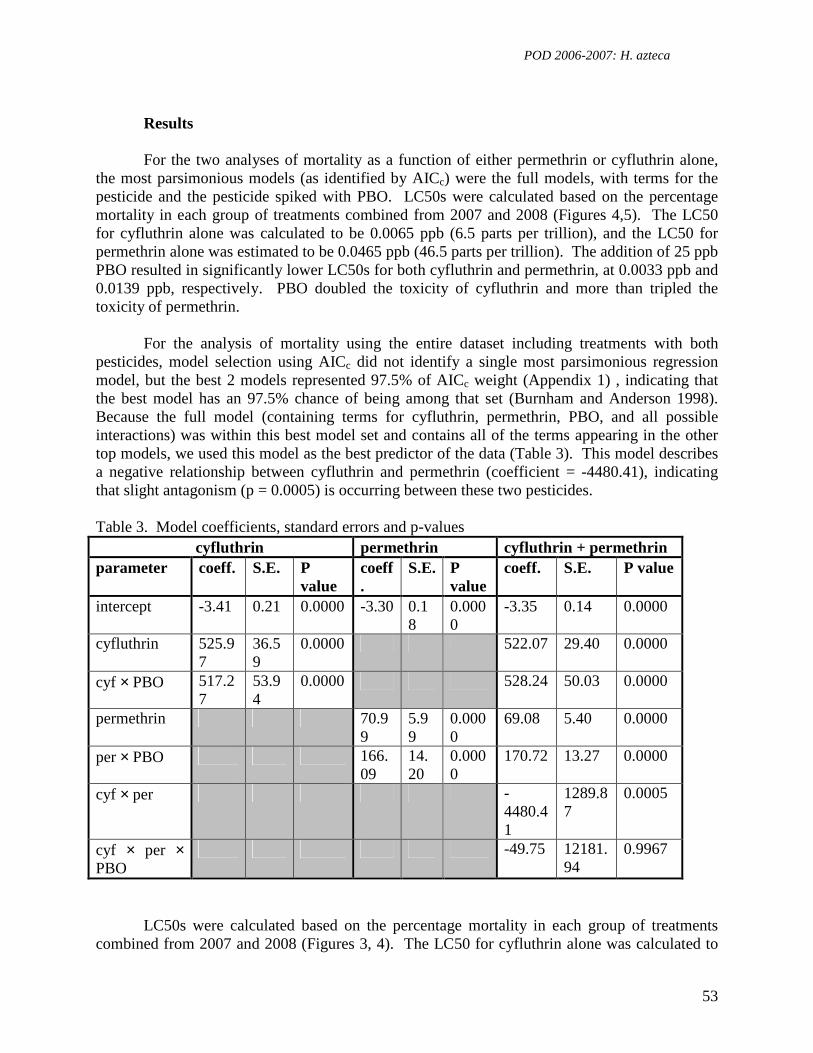
POD 2006-2007: H. azteca
53
Results For the two analyses of mortality as a function of either permethrin or cyfluthrin alone,
the most parsimonious models (as identified by AICc) were the full models, with terms for the pesticide and the pesticide spiked with PBO. LC50s were calculated based on the percentage mortality in each group of treatments combined from 2007 and 2008 (Figures 4,5). The LC50 for cyfluthrin alone was calculated to be 0.0065 ppb (6.5 parts per trillion), and the LC50 for permethrin alone was estimated to be 0.0465 ppb (46.5 parts per trillion). The addition of 25 ppb PBO resulted in significantly lower LC50s for both cyfluthrin and permethrin, at 0.0033 ppb and 0.0139 ppb, respectively. PBO doubled the toxicity of cyfluthrin and more than tripled the toxicity of permethrin.
For the analysis of mortality using the entire dataset including treatments with both
pesticides, model selection using AICc did not identify a single most parsimonious regression model, but the best 2 models represented 97.5% of AICc weight (Appendix 1) , indicating that the best model has an 97.5% chance of being among that set (Burnham and Anderson 1998). Because the full model (containing terms for cyfluthrin, permethrin, PBO, and all possible interactions) was within this best model set and contains all of the terms appearing in the other top models, we used this model as the best predictor of the data (Table 3). This model describes a negative relationship between cyfluthrin and permethrin (coefficient = -4480.41), indicating that slight antagonism (p = 0.0005) is occurring between these two pesticides. Table 3. Model coefficients, standard errors and p-values cyfluthrin permethrin cyfluthrin + permethrin parameter coeff. S.E. P
value coeff.
S.E. P value
coeff. S.E. P value
intercept -3.41 0.21 0.0000 -3.30 0.18
0.0000
-3.35 0.14 0.0000
cyfluthrin 525.97
36.59
0.0000 522.07 29.40 0.0000
cyf × PBO 517.27
53.94
0.0000 528.24 50.03 0.0000
permethrin 70.99
5.99
0.0000
69.08 5.40 0.0000
per × PBO 166.09
14.20
0.0000
170.72 13.27 0.0000
cyf × per -4480.41
1289.87
0.0005
cyf × per × PBO
-49.75 12181.94
0.9967
LC50s were calculated based on the percentage mortality in each group of treatments combined from 2007 and 2008 (Figures 3, 4). The LC50 for cyfluthrin alone was calculated to

POD 2006-2007: H. azteca
54
be 0.0065 ppb (6.5 parts per trillion), and the LC50 for permethrin alone was estimated to be 0.0465 ppb (46.5 parts per trillion). The addition of 25 ppb PBO resulted in significantly lower LC50s for both cyfluthrin and permethrin, at 0.0033 ppb and 0.0139 ppb, respectively. PBO doubled the toxicity of cyfluthrin and more than tripled the toxicity of permethrin.
Figure 3. Cyfluthrin dose-response
0
0.1
0.2
0.3
0.4
0.5
0.6
0.7
0.8
0.9
1
0 0.005 0.01 0.015
cyfluthrin (ppb)
Figure 4. Permethrin dose-response
0
0.1
0.2
0.3
0.4
0.5
0.6
0.7
0.8
0.9
1
0 0.01 0.02 0.03 0.04 0.05 0.06
permethrin (ppb)
no PBO w/PBO
no PBO w/PBO
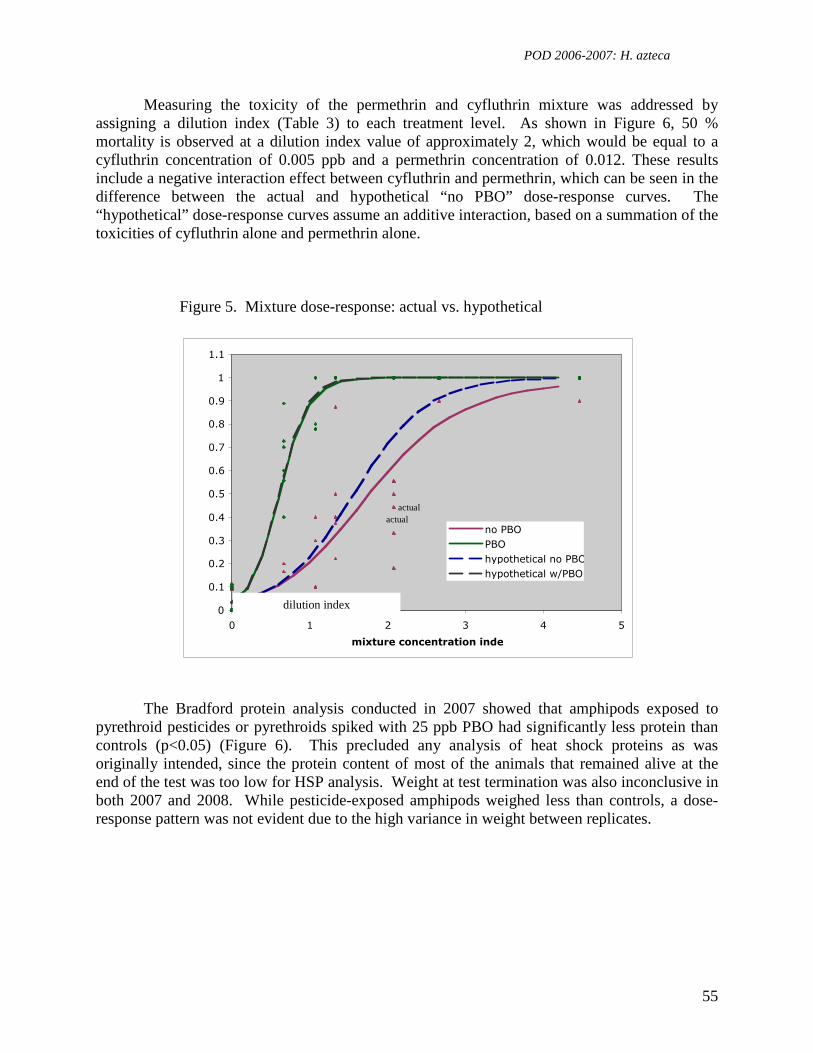
POD 2006-2007: H. azteca
55
Measuring the toxicity of the permethrin and cyfluthrin mixture was addressed by assigning a dilution index (Table 3) to each treatment level. As shown in Figure 6, 50 % mortality is observed at a dilution index value of approximately 2, which would be equal to a cyfluthrin concentration of 0.005 ppb and a permethrin concentration of 0.012. These results include a negative interaction effect between cyfluthrin and permethrin, which can be seen in the difference between the actual and hypothetical “no PBO” dose-response curves. The “hypothetical” dose-response curves assume an additive interaction, based on a summation of the toxicities of cyfluthrin alone and permethrin alone.
Figure 5. Mixture dose-response: actual vs. hypothetical
0
0.1
0.2
0.3
0.4
0.5
0.6
0.7
0.8
0.9
1
1.1
0 1 2 3 4 5
mixture concentration index
no PBO
PBO
hypothetical no PBO
hypothetical w/PBO
The Bradford protein analysis conducted in 2007 showed that amphipods exposed to pyrethroid pesticides or pyrethroids spiked with 25 ppb PBO had significantly less protein than controls (p<0.05) (Figure 6). This precluded any analysis of heat shock proteins as was originally intended, since the protein content of most of the animals that remained alive at the end of the test was too low for HSP analysis. Weight at test termination was also inconclusive in both 2007 and 2008. While pesticide-exposed amphipods weighed less than controls, a dose-response pattern was not evident due to the high variance in weight between replicates.
actual actual
dilution index
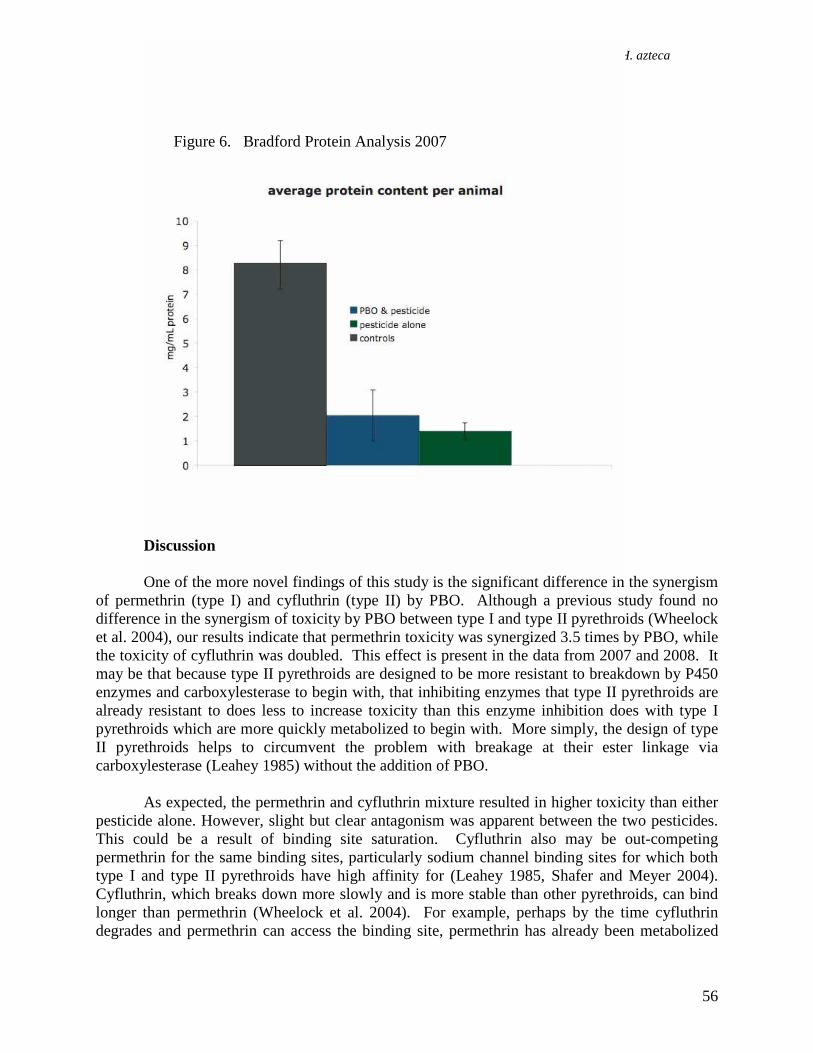
POD 2006-2007: H. azteca
56
Figure 6. Bradford Protein Analysis 2007
Discussion One of the more novel findings of this study is the significant difference in the synergism
of permethrin (type I) and cyfluthrin (type II) by PBO. Although a previous study found no difference in the synergism of toxicity by PBO between type I and type II pyrethroids (Wheelock et al. 2004), our results indicate that permethrin toxicity was synergized 3.5 times by PBO, while the toxicity of cyfluthrin was doubled. This effect is present in the data from 2007 and 2008. It may be that because type II pyrethroids are designed to be more resistant to breakdown by P450 enzymes and carboxylesterase to begin with, that inhibiting enzymes that type II pyrethroids are already resistant to does less to increase toxicity than this enzyme inhibition does with type I pyrethroids which are more quickly metabolized to begin with. More simply, the design of type II pyrethroids helps to circumvent the problem with breakage at their ester linkage via carboxylesterase (Leahey 1985) without the addition of PBO.
As expected, the permethrin and cyfluthrin mixture resulted in higher toxicity than either
pesticide alone. However, slight but clear antagonism was apparent between the two pesticides. This could be a result of binding site saturation. Cyfluthrin also may be out-competing permethrin for the same binding sites, particularly sodium channel binding sites for which both type I and type II pyrethroids have high affinity for (Leahey 1985, Shafer and Meyer 2004). Cyfluthrin, which breaks down more slowly and is more stable than other pyrethroids, can bind longer than permethrin (Wheelock et al. 2004). For example, perhaps by the time cyfluthrin degrades and permethrin can access the binding site, permethrin has already been metabolized

POD 2006-2007: H. azteca
57
and is therefore inactive. This could contribute to our observing of a less-than-additive effect. Interestingly, PBO seems to negate any antagonism between cyfluthrin and permethrin. Because both pyrethroids are less resistant to metabolic enzymes in the presence of PBO, perhaps this enhancement overrides any slight antagonism introduced by competition for the same binding sites.
Regardless of whether slight antagonism may be occurring, the single and combined
toxicity of permethrin and cyfluthrin at pptr concentrations is cause for concern, as these levels have been detected in the SSJ Estuary and its tributaries (Oros and Werner 2005). And although pyrethroid toxicity may be mitigated by the presence of organic material or fine-grained sediment (Yang et al. 2006), it is clear from the water samples on which this study was based that concentrations high enough to elicit an LC50 level response are periodically present in the water column. Considering the number of other pyrethroids in use in the Central Valley, some of which are more soluble in water and the potential for synergistic interactions with other pesticides (Corbel et al. 2004), and/or residual PBO present in the water column (Amweg et al. 2006a), this is cause for concern.
Heat shock proteins, which are a valuable biomarker in amphipods (Werner and Nagel
1997), should be measured in future studies to examine the sublethal effects of pyrethroids and pyrethroid mixtures. This was one of the original intentions of this study, however, the small size of H. azteca results in the requirement of a sample size at least double the size used for this analysis, especially considering the greater than expected mortality and the large reduction in protein content observed in animals exposed to pyrethroids (Figure 6). Further studies using sublethal concentrations should be performed to evaluate the capacity of single pyrethroids and pyrethroid mixtures to cause disruption of cellular homeostasis and other sublethal effects, such as immunotoxicity or endocrine disruption, at part per trillion concentrations. In addition, studies examining the interactions between three or more pyrethroid pesticide mixtures should be conducted, as these types of treatments would more closely mimic conditions in the wild.
4.3 References
Amweg EL, Weston DP, Johnson CS, You J, Lydy MJ. 2006a. Effect of piperonyl butoxide on permethrin toxicity in the amphipod Hyalella azteca. Environmental Toxicology and Chemistry 25:1817-1825.
Amweg EL, Weston DP, You J, Lydy MJ. 2006b. Pyrethroid insecticides and sediment toxicity in urban creeks from California and Tennessee. Environmental Science and Technology 40:1700-1706.
Amweg EL, Weston DP, Ureda NM. 2005. Use and toxicity of pyrethroid pesticides in the Central Valley, California, USA. Environmental Toxicology and Chemistry 24:966-972
Amweg EL, Weston DP, You J, Lydy MJ. 2006. Pyrethroid insecticides and sediment toxicity in urban creeks from California and Tennessee. Environmental Science and Technology 40:1700-1706
POD 2006-2007: H. azteca
58
Burnham KP, Anderson DR. 1998. Model selection and inference: A practical information-theoretic approach. Springer-Verlag, New York, NY USA
Burr SA, Ray DE. 2004. Structure-activity and interaction effects of 14 different pyrethroids on voltage-gated chloride ion channels. Toxicological Sciences 77:341-346
Bryant, M., Souza, K., 2004. Summer Townet and Fall Midwater Trawl Survey Status and Trends. Interagency Ecological Program Newsletter 17(2), 14-17.
Clifford M.A., Eder K.J., Werner I., Hedrick R.P.. 2005. Synergistic effects of esfenvalerate and infectious hematopoietic necrosis virus on juvenile Chinook salmon mortality. Environmental Toxicology and Chemistry 24(7):1766-1772.
Clark JM, Matsumura F. 1982. Two different types of inhibitory effects of pyrethroids on nerve Ca- and Ca+ Mg ATPase in the squid, Loligo pealea. Pesticide Biochemical Physiology
Corbel V, Raymond M, Chandre F, Darriet F, Hougard JM (2004) Efficacy of insecticide mixtures against larvae of Culex quinquefaciatus (Say) (Diptera: Culicidae) resistant to pyrethroids and carbamates. Pest Management Science 60:375-380
Denton D, Wheelock C, Murray S, Deanovic LA, Hammock B, Hinton D. 2003. Joint acute toxicity of esfenvalerate and diazinon to larval fathead minnows (Pimephales promelas). Environmental Toxicology and Chemistry 22:336-341
DeLorenzo ME, Serrano L, Chung KW, Hoguet J, Key PB (2006) Effects of the insecticide permethrin on three life stages of the grass shrimp, Palaemonetes pugio. Ecotoxicology and Environmental Safety 64:122-127
De Vlaming, V., Connor, V., DiGiorgio, C., Bailey, H.C., Deanovic, L.A., Hinton, D.E., 2000. Application of whole effluent toxicity test procedures to ambient water quality assessment. Environ. Toxicol. Chem. 19, 42-62.
Domagalski, J.L., Knifong, D.L., Dileanis, P.D., Brown, L.R., May, J.T., Connor, V., Alpers, C.N., 2000. Water quality in the Sacramento River Basin, California, 1994-98. U.S.Geological Survey Circular 1215. U.S. Geological Survey, Sacramento, CA, USA.
Dubrovsky, N., Kratzer, C., Brown, L., Gronberg, J., Burow, K., 1998. Water quality in the San Joaquin–Tulare Basins, California, 1992–95. U.S. Geological Survey Circular 1159. U.S. Geological Survey, Sacramento, CA, USA.
Epstein L, Bassein S, Zalom FG (2000) Almond and stone fruit growers reduce OP, increase pyrethroid use in dormant sprays. California Agriculture 54:14-19
Feyrer F., Nobriga M.L., Sommer T.R., 2007. Multidecal trends for three declining fish species: habitat patterns and mechanisms in the San Francisco Estuary, California, USA. Can. J. Fish. Aquat. Sci. 64, 723-734.
Floyd E.Y., Geist J.P., Werner I. (in press). Short-term exposure of the fathead minnow (Pimephales promelas) to a pyrethroid insecticide: Implications for growth, behavior, and predation risk. Environmental Toxicology and Chemistry.
Hieb, K., Bryant, M., Souza, K., Greiner, T., Slater, S., 2005. Place Holder for Bay and Estuary Species 2004 Status and Trends Report. Interagency Ecological Program Newsletter 18(2), 6-10.
POD 2006-2007: H. azteca
59
Leahey JP (1985) The Pyrethroid Insecticides. Taylor & Francis Inc., London:440 pp
Lowry OH, Rosebrough NJ, Farr AL, Randall RJ. 1951. Protein measurement with the folin phenol reagent. J Biol Chem 193:265-275.
Marshalonis D, Knowlton RE, Merchant H., 2006. Acute toxicity of permethrin to four population of ovigerous grass shrimp, Palaemonetes pugio Holthuis. Bulletin of Environmental Contamination and Toxicology 77:543-550
Moyle, P.B., Williams, J.E., 1990. Biodiversity loss in the temperate zone: decline of the native fish fauna of California. Conserv. Biol. 4 (3), 275-284.
Moyle, P.B., Herbold, B., Stevens, D.E., Miller, L.W., 1992. Life-History and Status of Delta Smelt in the Sacramento-San-Joaquin Estuary, California. Trans. Am. Fish. Soc. 121(1), 67-77.
Huggett, R.J., Kimerle, R.A., Mehrle, P.M., Berman, Jr. and H.L., 1992. Biomarkers: Biochemical, Physiological, and Histological Markers of Anthropogenic Stress. Lewis Publishers, Chelsea, MI, USA.
Oros DR, Werner I. 2005. Pyrethroid insecticides: an analysis of use patterns, distributions, potential toxicity and fate in the Sacramento-San Joaquin Delta and Central Valley. White Paper for the Interagency Ecological Program SFEI Contribution 415, San Francisco Estuary Institute, Oakland, CA
Rand, G.M., 1995. “Fundamentals of Aquatic Toxicology”, Taylor and Francis, Bristol, PA, pp. 1125.
Sandahl, J.F., Baldwin, D.H., Jenkins, J.J., Scholz, N.L., 2005. Comparative thresholds for acetylcholinesterase inhibition and behavioral impairment in coho salmon exposed to chlorpyrifos. Environ. Toxicol. Chem. 24, 136-45.
Scholz, N.L., Truelove, N.K., French, B.L., Berejikian, B.A., Quinn, T.P., Casillas, E., Collier, T.K., 2000. Diazinon disrupts antipredator and homing behaviors in chinook salmon (Oncorhynchus tshawytscha). Can. J. Fish. Aquat. Sci. 57(9), 1911-1918.
Shafer TJ, Meyer DA. 2004. Effects of pyrethroids on voltage-sensitive calcium channels: a critical evaluation of strengths, weaknesses, data needs, and relationship to assessment of cumulative neurotoxicity. . Toxicology and Applied Pharmacology 196:303-318
Sorensen, E.M., 1991. Metal poisoning in fish. CRC Press, Boca Raton, FL, USA.
Stevens, D.E., Miller, L.W., 1983. Effects of River Flow on Abundance of Young Chinook Salmon, American Shad, Longfin Smelt, AND Delta Smelt in the Sacramento-San Joaquin River System. North Am. J. Fish. Manage. 3(4), 425-437.
Stevens, D.E., Kohlhorst, D.W., Miller, L.W., Kelley, D.W., 1985. The decline of striped bass in the Sacramento-San Joaquin Estuary, California. Trans. Am. Fish. Soc. 114, 12-30. U.S.
U.S. EPA, 2002. Short-term Methods for Estimating the Chronic Toxicity of Effluents and Receiving Waters to Freshwater Organisms, 4th Ed. USEPA Office of Water, Washington, DC. EPA-821-R-02-013.
U.S. EPA, 2000. Pesticide Ecotoxicity Database. 43358311. Office of Pesticide Programs, Environmental Fate and Effects Division, U.S. EPA, Washington, D.C., USA
POD 2006-2007: H. azteca
60
U.S. EPA. 1994. Short-term methods for estimating the chronic toxicity of effluents and receiving water to freshwater organisms. Third ed. USEPA-60-4-91-002.
U.S. EPA, 1991. Methods for Aquatic Toxicity Identification Evaluations. Phase I Toxicity Characterization Procedures, Second Edition. Norberg-King, T.J., D.I. Mount /et al/. (eds.). /EPA/600/6-91/003/. Environmental Research Laboratory, Office of Research and Development. US Environmental Protection Agency, Duluth, MN.
U.S. EPA, 1989a. Methods for Aquatic Toxicity Identification Evaluations: Phase II Toxicity Identification Procedures. /EPA/600/3-88/035/. Environmental Research Laboratory, Duluth, MN.
U.S. EPA, 1989b. Methods for Aquatic Toxicity Identification Evaluations: Phase III Toxicity Confirmation Procedures. /EPA/600/3-88/036/. Environmental Research Laboratory, Duluth, MN.
Werner I., Deanovic L.A., Connor V., De Vlaming V., Bailey H.C., Hinton, D.E., 2000. Insecticide-caused toxicity to Ceriodaphnia dubia (Cladocera) in the Sacramento-San Joaquin River Delta, California, USA. Environ. Toxicol. Chem. 19(1): 215-227.
Werner I, Nagel R. 1997. Stress proteins HSP60 and HSP70 in three species of amphipods exposed to acdmium, diazinon, dieldrin and fluoranthene. Environmental Toxicology and Chemistry 16:2392-2403
Weston DP, Holmes BW, You J, Lydy MJ. 2005. Aquatic toxicity due to residential use of pyrethroid insecticides. Environmental Science and Technology 39:9778-9784
Weston DP, You J, Lydy MJ. 2004. Distribution and toxicity of sediment-associated pesticides in agriculture-dominated water bodies of California's central valley. Environmental Science and Technology 38:2752-2759
Wheelock CE, Miller JL, Miller MJ, Gee SJ, Shan G, Hammock BD. 2004. Development of toxicity identification evaluation procedures for pyrethroid detection using esterase activity. Environmental Toxicology and Chemistry 23:2699-2708
Yang W, Gan J, Hunter W, Spurlock F. 2006. Effect of suspended solids on bioavailability of pyrethroid insecticides. Environmental Toxicology and Chemistry 25:1585-1591.
POD 2006-2007: M. saxatilis
61
5. Tests with Striped Bass (Morone saxatilis) 5.1 Methods 5.1.1 Toxicity Testing
To date, only an initial pilot test and one test with ambient samples from Delta sites have been performed with larval striped bass due to the difficulties in obtaining larvae of this particular strain of striped bass. Two tests with juvenile (80-90 d old) fish were conducted, one in 2005 and one in 2006. We included the 2005 tests in this report, because biomarker data for this test is presented in Chapter 7. The sensitivity of juvenile striped bass to two individual toxicants, copper and the pyrethroid insecticide esfenvalerate was investigated. The methods used for each test are described below.
Test 1 – Juvenile striped bass, test setup date 7/30/2005. Juvenile striped bass (approximately 3 months old, fork length: 5-5.4 cm) were purchased from Professional Aquaculture Services (Chico, CA), and acclimated to laboratory conditions for 2 days before tests were initiated. Upon arrival, fish were placed into 10-gallon aquaria (30-50 fish per aquarium) containing well water, which had been brought to a salinity of 8 ppt to match the salinity of the water in which the fish were transported. The well water at the UC Davis Center for Aquatic Biology and Aquaculture (UCD CABA) is obtained from a local well approximately 60 m in depth, passed through a packed column aerator to remove excess nitrogen and re-oxygenate, and pumped either directly to the animals or to appropriate cooling and heating equipment. The next day, approximately 80% of the water was replaced with well water salinity-adjusted to 4 ppt, and later in the day with well water diluted with deionized water to a hardness of 200mg/L CaCO3. This diluted well water was used as control water throughout the experiment.
This 7-day chronic toxicity test measured the effects of Delta water samples on the survival and growth of juvenile M. saxatilis. Samples were collected on July 27/28, 2005 from CDFG stations 340, 711, 340 and 915 (see Chapter 3.1), and 7-d tests were initiated on July 30, 2005. Treatments consisted of 5 replicate aquaria, each containing 5 L of aerated water and 5 fish. Water temperature was maintained at 20±1oC. Fish were fed daily (Silver Cup 2.0 mm pellets). The light:dark cycle was 16h:8h. Approximately 80 percent of the water in each replicate was renewed on days 2, 4, and 6 of the test. On days 1, 3, and 5 the numbers of live, dead, and missing fish were recorded. Water temperature, pH, and DO were measured daily. Ammonia nitrogen was measured prior to each water renewal. At test termination, temperature, pH, DO, EC, and ammonia were measured, and one fish per replicate was measured for mass and fork length, and frozen for analysis of tissue chemistry. The remaining 4 fish were measured and individual tissues (brain, kidney, spleen, liver, muscle, gill) dissected, snap-frozen and stored at –80oC for subsequent analyses of sublethal biomarkers.
Test 2 - Larval striped bass test development, test setup date: 6/20/2006. This
pilot test was performed using laboratory control water (diluted well water) and 19-d old striped bass larvae obtained from David Ostrach, UC Davis, CA. Striped bass are believed to be highly sensitive to fluorescent light. In order to minimize exposure to fluorescent light, a specialized enclosure was built around an environmental chamber set
POD 2006-2007: M. saxatilis
62
to a temperature of 20ºC. The tent-like enclosure constructed for this test was assembled with large, black plastic sheets attached to the top and sides of the chamber extending outward to form a large area blocked from light. This allowed the chamber doors to be opened and all necessary test procedures to be performed without leaving the darkened area. To further reduce the risk of exposing the animals to light, the inside of the chamber was lined with black plastic sheets, and illuminated by two night lights.
Fish were transported from adjacent buildings at UCD CABA to UCD ATL in
black plastic buckets with closed lids. Tests were performed using four replicate one-liter glass beakers per treatment. Each beaker contained 500ml of well water and ten larvae. Two different loading techniques were tested in an effort to determine the least stressful means of handling the fish, ideally further reducing stress-induced mortality. One treatment was loaded using a modified 5ml glass pipette and the other loaded with an unmodified 5 ml pipette and a pipette pump. The fish were fed approximately 50 artemia twice daily. Water changes (80%) were performed on days two, four and six. Mortality was recorded daily and dead fish were removed. Initial temperature, DO, EC and pH measurements were recorded upon test setup (day 0) and on days 2, 4 and 6. Final temperature, DO and pH measurements (i.e. before exposure water was exchanged) were recorded on days 2, 4 and 6. Final ammonia nitrogen was measured on day 2 and at test takedown.
Test 3 – Larval striped bass, test setup date: 7/14/2006. This test was performed
on water samples collected from CDFG stations 340, 508, 609, 711, 910 and 915 on July 11-13, 2006, using 30-d old striped bass larvae obtained from David Ostrach, UC Davis, CA. To avoid exposing the animals to fluorescent light, the entire test was performed in a windowless room, with the lights shut off. Windows to adjacent rooms were covered with black plastic to reduce light entering the room, and entry and exit into the room was restricted. The fluorescent lights were covered with thick black plastic to prevent exposure to light should they accidentally be turned on. Night lights were placed around the 20ºC water bath to allow all necessary testing procedures to be performed, while minimizing light-related stress to the animals. Additionally, the exterior door was propped open approximately four inches to allow a small amount of natural light into the room.
Upon receipt, the fish were transferred to four 10-gallon aquaria containing
control (diluted well) water. Photos of the gut contents of the larvae were taken under a microscope to monitor feeding before acclimating the animals overnight. Photos were taken daily for the remainder of the test. The following day, all dead fish were removed from the holding tanks. Ten fish were transfered into each of 4 replicate tanks each containing 5 L of control water, then fed 2 ml of artemia/tank and held overnight. Remaining animals were placed in a 10-gallon holding tank for continued monitoring of feeding behavior. At test initiation, 80% of the control water was removed from the treatment tanks and replaced with 5 L of Delta water sample or respective control water. Three controls were included in this test: local well water, a low conductivity control prepared by dilution of well water with glass distilled water to attain a measured conductivity of 100 µS/cm, as well as a high conductivity control of well water, salted up
POD 2006-2007: M. saxatilis
63
with Instant Ocean aquarium salt to measure approximately 18.5 mS. Eighty percent water changes were performed on days two, four and six. Mortality was scored daily and dead fish were removed. Initial temperature, DO, EC and pH measurements were recorded upon test setup (day 0) and on days 2, 4 and 6. Final temperature, DO and pH measurements (i.e. before exposure water was exchanged) were recorded on days 2, 4 and 6. Final ammonia nitrogen was measured on day 2 and at test takedown.
Test 4 – Juvenile striped bass, test setup date: July 11-13, 2006. This 7-day
chronic toxicity test measured the effects of Delta water samples collected on August 22/23, 2006, from CDFG stations 340, 508, 609, 711, 910 and 915 on the survival and growth of juvenile M. saxatilis. Juvenile striped bass (approx. 80 d old, fork length: 5.3 – 8.0 cm) were obtained from David Ostrach, UC Davis. These fish were reared in well water at the UCD CABA facility. Fish were acclimated to laboratory conditions for 1 day before tests were initiated. Upon arrival, fish were placed into 10-gallon aquaria (approximately 30 fish/tank) containing well water for acclimation. Well water was also used as control water throughout the experiment. On the day of test initiation (day 0), tanks filled with 5 L ambient water sample were aerated and brought to the experimental temperature of 20oC. Five fish were then transferred into each of five replicate tanks per treatment. Fish were fed daily with Silver Cup 2.0 mm pellets. The light:dark cycle was 16h:8h. Approx. 80 percent of the water in each replicate was renewed on days 2, 4, and 6. On days 1, 3, and 5, water was not renewed, but the numbers of live, dead, and missing fish were recorded for each replicate. Water temperature, pH, and DO were measured daily. Ammonia nitrogen (NH3-N) was measured prior to each water renewal. At test termination, temperature, pH, DO, EC, and ammonia were measured for each treatment. On Day 7, fish from each replicate were measured for weight and fork length, and individual tissues (brain, anterior kidney, spleen, liver, muscle, gill) dissected, snap-frozen and stored at –80oC for subsequent analyses of sublethal biomarkers.
Tests 5 and 6 - Exposures to individual toxicants: copper and esfenvalerate.
Juvenile striped bass were exposed to copper or the pyrethroid insecticide esfenvalerate [(S)-α-cyano-3-phenoxybenzyl-(S)-2-(4-chlorophenyl)-3-methylbutyrate] in two separate tests. Fish were exposed to CuCl2*2 H2O for 7 days, and to esfenvalerate for 24 h, and mortality as well as sublethal endpoints (growth, swimming behavior, transcription of stress response genes) were quantified. The shorter exposure time for the esfenvalerate study is based on the hypothesis that this hydrophobic chemical tends to quickly adsorb to particulate and organic matter in a typical field situation (Yang et al. 2006 a, b; Brady et al. 2006) thus rendering exposure times for fish relatively short.
Juvenile striped bass used in the Cu exposure (90 days old, fork lengths 5.0 – 5.4 cm) were purchased from Professional Aquaculture Services (Chico, CA). Slightly larger, but only 81-day old offspring from the same broodstock (fork lengths 5.3 – 8.0 cm; provided by D. J. Ostrach, UC Davis) were used for the esfenvalerate exposure. Fish used in the copper exposure were slowly acclimated to experimental conditions (conductivity: 890 +/- 20 µS/cm; hardness: 200 mg/L CaCO3) over the course of 3 days before tests were initiated. The acclimation and control water was obtained from a local, approx. 60 m deep well, passed through a packed column aerator to remove excess nitrogen and re-oxygenate. Striped bass used in the esfenvalerate exposure were maintained in flow-
POD 2006-2007: M. saxatilis
64
through circular tanks containing well water treated as described above for 2 weeks before the tests. Previous fish exposures have shown that stress due to transport and maintenance in the laboratory following the procedures described above is minimal. Fish were loaded into experimental 2.5-gallon aquaria 24 hours prior to testing. Each experimental treatment was comprised of five replicate aquaria containing five animals each. Each tank contained 5L of water at 20°C and was aerated throughout the experiment. Tests were initiated by replacing 80% of the water with experimental copper or esfenvalerate solutions, or control water to yield nominal concentrations of 0 (control), 50, 200, 500 and 1000 µg/L Cu2+, or 0 (control), 200 µL/L MeOH (solvent control), 1, 3, 7 and 10 µg/L esfenvalerate. Measured copper concentrations on day 0 were 42, 160, 470, and 900 ppb total Cu2+, and 42, 160, 440, and 810 ppb dissolved Cu2+. Measured esfenvalerate concentrations on day 0 were 0.64 µg/L, 2.20 µg/L, 4.40 µg/L and 6.50 µg/L.
Experiments were conducted using a light:dark cycle of 16h:8h. During the 7-day copper exposure, fish were fed daily (Silver Cup 2.0 mm pellets). Approximately 80 percent of the water in each replicate was renewed on days two, four and six. On days one, three and five, the numbers of live, dead, and missing fish were scored for each replicate. For the 24 h esfenvalerate exposure, fish were not fed and no water exchange was carried out.
Water temperature, pH, and dissolved oxygen (DO) were measured daily. Ammonia nitrogen (NH3-N) was measured prior to each water renewal. At test termination, temperature, pH, DO, electric conductivity (EC), and ammonia were measured for each treatment. Overall, no significant deviations between measured water parameters among treatments or replicates were detected.
The number of dead fish was counted at the end of the experiment and surviving fish were sacrificed using an overdose of the anaesthetic MS-222 (Sigma, St Louis, MO, USA) in ice water to minimize degradation of RNA. Fork length (to nearest mm) and weight (to nearest 0.1 g) of each fish were recorded. No significant differences in length or weight were detected between individual treatment groups and controls. During the esfenvalerate exposure, swimming behavior and mortality endpoints were assessed after 4 and 24 h. Swimming behavior was assessed by observing each tank for five minutes. Any pronounced deviation (>1 min) from normal (control) swimming patterns was assessed to be abnormal, e.g. when fish were not able to maintain buoyancy, flipped to their sides, lay on the ground, or repeatedly swam in small circles.
5.1.2 Statistical Analysis For the test initiated on 7/30/05, modified USEPA standard statistical methods
were used to compare the ambient samples to the control (USEPA 2002). These methods were the same as those used to analyze H. azteca data in 2006 (see section 4.1.1). The test initiated 6/20/06 examining two alternative methods for transferring the animals was also analyzed using this protocol.
The tests performed in 2006 to examine ambient samples were analyzed using
POD 2006-2007: M. saxatilis
65
ANOVA with Tukey’s Multiple Comparison procedure to allow comparisons of test organism performance among sample waters, as well as between the controls and the ambient samples. The dilution series examining copper and esfenvalerate toxicity in 2006 were analyzed using USEPA standard protocols, including standard methods of calculating lethal and effective concentrations (USEPA 2002). Statistics for all single-concentration and ambient sample tests were performed using the statistical software JMP v5.0.1. Dilution series data were analyzed with CETIS v1.1.
5.2 Results
Test 1 – Juvenile striped bass, test setup date 7/30/2005. Results of this test are
shown in tables C1-1 and C1-2 (Appendix C). There was 100% survival, and no significant effect on body weight and fork length in all treatments. Survival was slightly reduced in water from site 711 (Sacramento River near Rio Vista). Fish exposed to water from site 711 had 96% survival however the effect was not significantly different from controls.
Test 2 - Larval striped bass test development, test setup date: 6/20/2006. Results
for our pilot test are shown in tables C3-1 and C3-2 (Appendix C). Survival of striped bass larvae was poor beyond the first 24 h of the test. There was no significant difference between the two transfer methods.
Test 3 – Larval striped bass, test setup date: 7/14/2006. Results for our test on
Delta water samples are shown in tables C4-1 and C4-2 (Appendix C). Mean control survival after 96 h was 33% at the low EC (128 µS/cm), 45% at a moderate EC (675 µS/cm) and 75% at the high EC (16,490 µS/cm). Larvae showed highest survival rates in water from site 340 (82%; Napa River). Percent survival in water from this site was significantly higher than percent survival in water from site 915 (28%; Old River-Western arm at railroad bridge) and was likely related to the EC. The EC was 146 µmhos/cm at site 915, and 15,750 µmhos/cm at site 340.
Test 4 – Juvenile striped bass, test setup date: 8/25/2006. No significant acute toxicity to juvenile (80-d old) striped bass was observed in samples collected on August 22/23, 2006 from CDFG stations 340, 508, 609, 711, 910 and 915 (Tables C5-1, C5-2, C3-3, Appendix C). Results from the analysis of sublethal biomarker endpoints in striped bass tissues are presented in Chapter 7.
Tests 5 and 6 - Exposures to individual toxicants: copper and esfenvalerate. -
Summaries of the effect concentrations of Cu and esfenvalerate on survival of striped bass juveniles are provided in Tables 5-1 and 5-2. Detailed test results are presented in Table C2 (Appendix C). For the Cu exposure, 100% mortality was observed at 470 and 900 µg/L Cu (440 and 810 µg/L dissolved Cu), whereas all fish survived in control water and at 42 µg/L Cu (40 µg/L dissolved Cu). At a concentration of 160 µg/L Cu, survival was 92%. The NOEC and LOEC for 96 h and 7 days were the same. No significant effects of Cu exposure on growth or swimming behavior were observed. LC50 and EC25
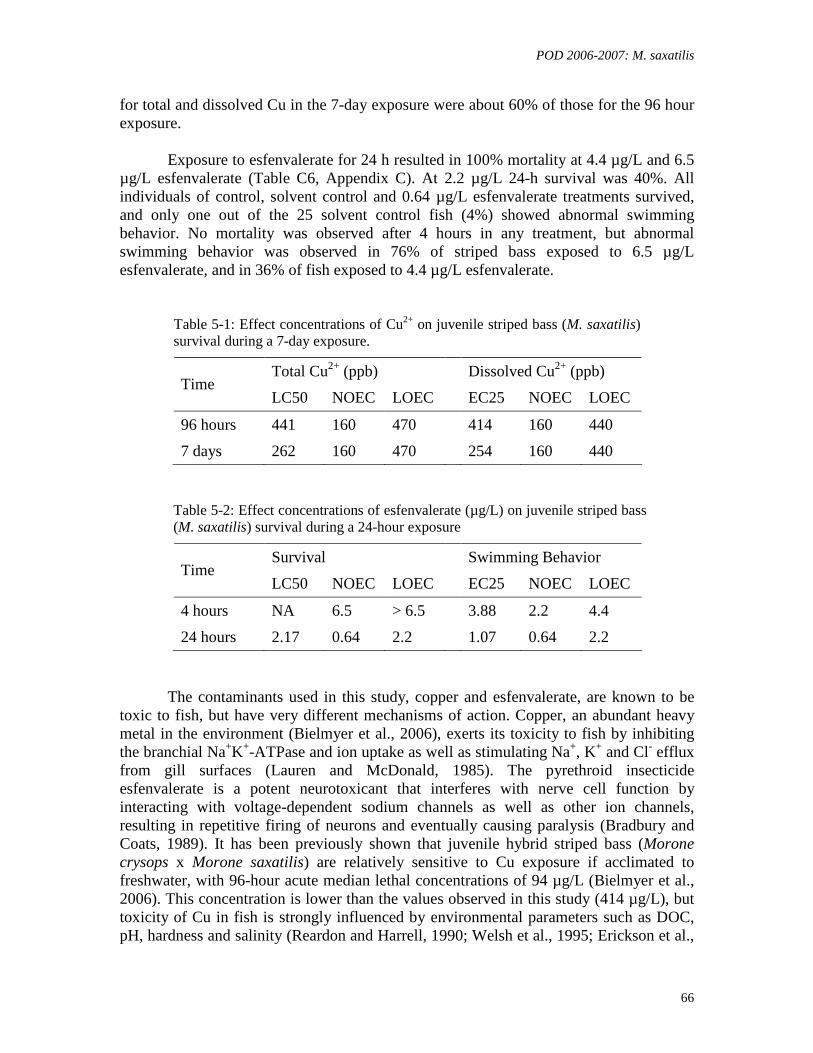
POD 2006-2007: M. saxatilis
66
for total and dissolved Cu in the 7-day exposure were about 60% of those for the 96 hour exposure.
Exposure to esfenvalerate for 24 h resulted in 100% mortality at 4.4 µg/L and 6.5 µg/L esfenvalerate (Table C6, Appendix C). At 2.2 µg/L 24-h survival was 40%. All individuals of control, solvent control and 0.64 µg/L esfenvalerate treatments survived, and only one out of the 25 solvent control fish (4%) showed abnormal swimming behavior. No mortality was observed after 4 hours in any treatment, but abnormal swimming behavior was observed in 76% of striped bass exposed to 6.5 µg/L esfenvalerate, and in 36% of fish exposed to 4.4 µg/L esfenvalerate.
Table 5-1: Effect concentrations of Cu2+ on juvenile striped bass (M. saxatilis) survival during a 7-day exposure.
Total Cu2+ (ppb) Dissolved Cu2+ (ppb) Time
LC50 NOEC LOEC EC25 NOEC LOEC
96 hours 441 160 470 414 160 440
7 days 262 160 470 254 160 440
Table 5-2: Effect concentrations of esfenvalerate (µg/L) on juvenile striped bass (M. saxatilis) survival during a 24-hour exposure
Survival Swimming Behavior Time
LC50 NOEC LOEC EC25 NOEC LOEC
4 hours NA 6.5 > 6.5 3.88 2.2 4.4
24 hours 2.17 0.64 2.2 1.07 0.64 2.2
The contaminants used in this study, copper and esfenvalerate, are known to be
toxic to fish, but have very different mechanisms of action. Copper, an abundant heavy metal in the environment (Bielmyer et al., 2006), exerts its toxicity to fish by inhibiting the branchial Na+K+-ATPase and ion uptake as well as stimulating Na+, K+ and Cl- efflux from gill surfaces (Lauren and McDonald, 1985). The pyrethroid insecticide esfenvalerate is a potent neurotoxicant that interferes with nerve cell function by interacting with voltage-dependent sodium channels as well as other ion channels, resulting in repetitive firing of neurons and eventually causing paralysis (Bradbury and Coats, 1989). It has been previously shown that juvenile hybrid striped bass (Morone crysops x Morone saxatilis) are relatively sensitive to Cu exposure if acclimated to freshwater, with 96-hour acute median lethal concentrations of 94 µg/L (Bielmyer et al., 2006). This concentration is lower than the values observed in this study (414 µg/L), but toxicity of Cu in fish is strongly influenced by environmental parameters such as DOC, pH, hardness and salinity (Reardon and Harrell, 1990; Welsh et al., 1995; Erickson et al.,
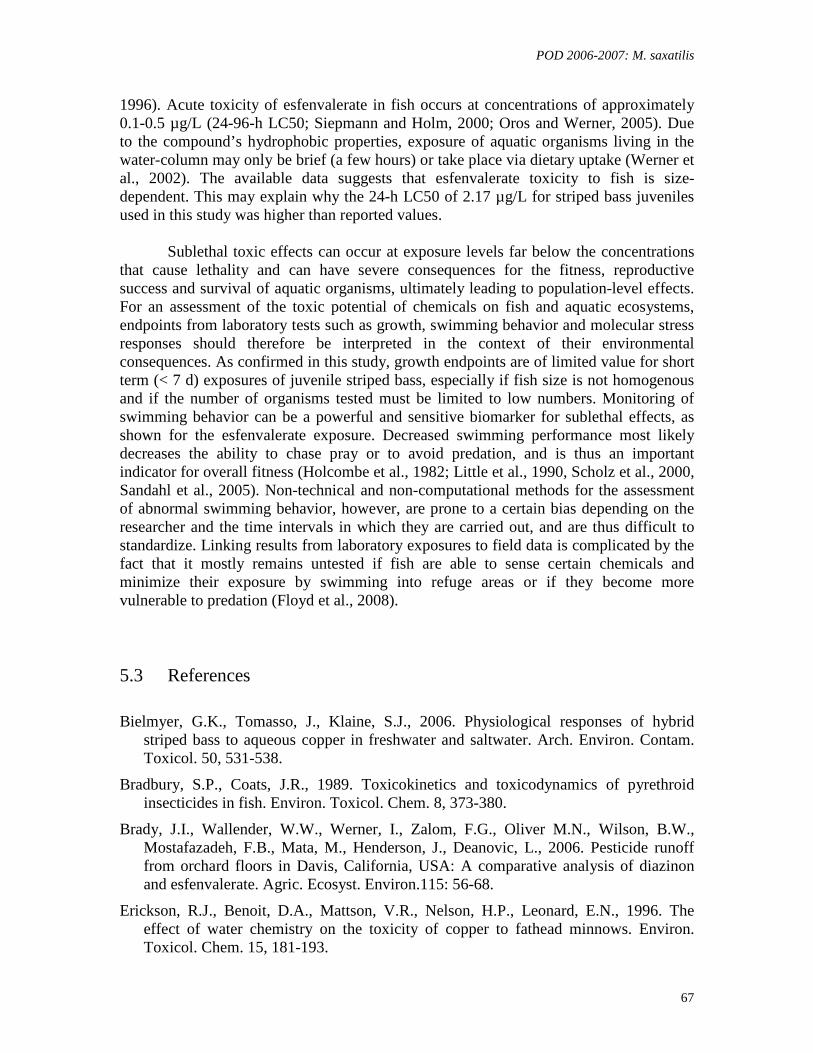
POD 2006-2007: M. saxatilis
67
1996). Acute toxicity of esfenvalerate in fish occurs at concentrations of approximately 0.1-0.5 µg/L (24-96-h LC50; Siepmann and Holm, 2000; Oros and Werner, 2005). Due to the compound’s hydrophobic properties, exposure of aquatic organisms living in the water-column may only be brief (a few hours) or take place via dietary uptake (Werner et al., 2002). The available data suggests that esfenvalerate toxicity to fish is size-dependent. This may explain why the 24-h LC50 of 2.17 µg/L for striped bass juveniles used in this study was higher than reported values.
Sublethal toxic effects can occur at exposure levels far below the concentrations that cause lethality and can have severe consequences for the fitness, reproductive success and survival of aquatic organisms, ultimately leading to population-level effects. For an assessment of the toxic potential of chemicals on fish and aquatic ecosystems, endpoints from laboratory tests such as growth, swimming behavior and molecular stress responses should therefore be interpreted in the context of their environmental consequences. As confirmed in this study, growth endpoints are of limited value for short term (< 7 d) exposures of juvenile striped bass, especially if fish size is not homogenous and if the number of organisms tested must be limited to low numbers. Monitoring of swimming behavior can be a powerful and sensitive biomarker for sublethal effects, as shown for the esfenvalerate exposure. Decreased swimming performance most likely decreases the ability to chase pray or to avoid predation, and is thus an important indicator for overall fitness (Holcombe et al., 1982; Little et al., 1990, Scholz et al., 2000, Sandahl et al., 2005). Non-technical and non-computational methods for the assessment of abnormal swimming behavior, however, are prone to a certain bias depending on the researcher and the time intervals in which they are carried out, and are thus difficult to standardize. Linking results from laboratory exposures to field data is complicated by the fact that it mostly remains untested if fish are able to sense certain chemicals and minimize their exposure by swimming into refuge areas or if they become more vulnerable to predation (Floyd et al., 2008). 5.3 References
Bielmyer, G.K., Tomasso, J., Klaine, S.J., 2006. Physiological responses of hybrid striped bass to aqueous copper in freshwater and saltwater. Arch. Environ. Contam. Toxicol. 50, 531-538.
Bradbury, S.P., Coats, J.R., 1989. Toxicokinetics and toxicodynamics of pyrethroid insecticides in fish. Environ. Toxicol. Chem. 8, 373-380.
Brady, J.I., Wallender, W.W., Werner, I., Zalom, F.G., Oliver M.N., Wilson, B.W., Mostafazadeh, F.B., Mata, M., Henderson, J., Deanovic, L., 2006. Pesticide runoff from orchard floors in Davis, California, USA: A comparative analysis of diazinon and esfenvalerate. Agric. Ecosyst. Environ.115: 56-68.
Erickson, R.J., Benoit, D.A., Mattson, V.R., Nelson, H.P., Leonard, E.N., 1996. The effect of water chemistry on the toxicity of copper to fathead minnows. Environ. Toxicol. Chem. 15, 181-193.
POD 2006-2007: M. saxatilis
68
Floyd E.Y., Geist J.P., Werner I. (in press). Short-term exposure of the fathead minnow (Pimephales promelas) to a pyrethroid insecticide: Implications for growth, behavior, and predation risk. Environmental Toxicology and Chemistry.
Holcombe, G.W., Phipps, G.L., Tanner, D.K., 1982. The acute toxicity of kelthane, dursban, disulfoton pydrin and permethrin to fathead minnows (Pimephales-promelas) and rainbow trout (Salmo-gairdneri). Environ. Pollut. A 29, 167-178.
Lauren D.J., McDonald, D.G., 1985. Effects of copper on branchial ionoregulation in the rainbow trout, Salmo gairdneri. Richardson: Modulation by water hardness and pH. J. Comp. Physiol., B (1985) 155, 635-644.
Little, E.E., Archeski, R.D., Flerov, B.A., Kozlovskaya, V.I., 1990. Behavioral indicators of sublethal toxicity in rainbow trout. Arch. Environ. Contam. Toxicol. 19, 380-385.
Oros, D.R., Werner I., 2005. Pyrethroid Insecticides: An Analysis of Use Patterns, Distributions, Potential Toxicity and Fate in the Sacramento-San Joaquin Delta and Central Valley. White Paper for the Interagency Ecological Program. SFEI Contribution 415. San Francisco Estuary Institute, Oakland, CA
Reardon, I.S., Harrell, R.M., 1990. Acute toxicity of formalin and copper sulfate to striped bass fingerlings held in varying salinities. Aquaculture 87, 255-270.
Sandahl, J.F., Baldwin, D.H., Jenkins, J.J., Scholz, N.L., 2005. Comparative thresholds for acetylcholinesterase inhibition and behavioral impairment in coho salmon exposed to chlorpyrifos. Environ. Toxicol. Chem. 24, 136-45.
Scholz, N.L., Truelove, N.K., French, B.L., Berejikian, B.A., Quinn, T.P., Casillas, E., Collier, T.K., 2000. Diazinon disrupts antipredator and homing behaviors in chinook salmon (Oncorhynchus tshawytscha). Can. J. Fish. Aquat. Sci. 57(9), 1911-1918.
Siepmann, S., Holm, S., 2000. Hazard assessment of the synthetic pyrethroid insecticides bifenthrin, cypermethrin, esfenvalerate, and permethrin to aquatic organisms in the Sacramento-San Joaquin River system. Administrative Report 00-6. California Department of Fish and Game, Pesticide Investigations Unit, Rancho Cordova, CA, USA.
US EPA, 2002. Short-term Methods for Estimating the Chronic Toxicity of Effluents and Receiving Waters to Freshwater Organisms, 4th Ed. USEPA Office of Water, Washington, DC. EPA-821-R-02-013.
Welsh, P.G., Parrott, J.L., Dixon, D.G., Hodson, P.V., Spry, D.J., Mierle, G., 1995. Estimating acute copper toxicity to larval fathead minnow (Pimephales promelas) (Pimephales promelas) in soft water from measurements of dissolved organic carbon, calcium, and pH. Can. J. Fish. Aquat. Sci. 53, 1263-1271.
Werner, I., Geist, J., Okihiro, M., Rosenkranz, P., Hinton, D.E., 2002. Effects of dietary exposure to the pyrethroid pesticide esfenvalerate on medaka (Oryzias latipes). Mar. Environ. Res. 54 (3-5), 609-614.
Yang, W.; Spurlock, F.; Liu, W.; Gan, J. 2006a. Inhibition of aquatic toxicity of pyrethroid insecticides by suspended sediment. Environ. Toxicol. Chem. 25(7), 1913-1919.

POD 2006-2007: M. saxatilis
69
Yang, W.; Spurlock, F.; Liu, W.; Gan, J. 2006b. Effects of dissolved organic matter on permethrin bioavailability to Daphnia species. J. Agric. Food Chem. 54(11), 3967-3972.
POD 2006-2007: H. transpacificus
70
6. Tests with Delta Smelt (Hypomesus transpacificus)
Test protocols were developed at UCD-ATL for toxicity tests using delta smelt larvae at different stages of development. While static renewal tests were performed in 2006, a flow-through system was constructed for testing during the 2007 season. This flow-through system proved to be superior to the static renewal method. We included the tests performed in 2005 in this report, because biomarker data for this test is presented in Chapter 7. The sensitivity of delta smelt larvae and juveniles to two individual toxicants, copper and the pyrethroid insecticide esfenvalerate, was investigated. The methods for each test are described below.
6.1 Methods 6.1.1 2005 Toxicity Testing
Juvenile delta smelt 7-day toxicity test: This 7-day chronic toxicity test measured the effects of Delta water samples on the survival and growth of juvenile H. transpacificus. Samples were collected on August 30/31, 2005 from CDFG stations 340, 711, 910 and 915, and tests were initiated on September 1, 2005. Each experimental treatment was comprised of 4 replicates of 10 animals each, and each replicate tank contained 7 L of water at 20oC. Fish were fed twice daily with artemia (< 48 hrs old). The light:dark cycle was 16h:8h.
Fish were received 2 days prior to test initiation. Upon arrival, fish were placed into dilute well water in gently aerated test tanks, 10 fish in each 7 liter tank. Reserve fish were placed in a 10 gallon aquarium containing dilute well water (< 100 fish). The day after arrival, 80 percent of the water in each tank was replaced with new dilute well water. This dilute well water was used as control water throughout the experiment.
On the day of test initiation (day 0), 80 percent of the water in each replicate tank was replaced with test water. Fish from the reserve tank were transferred to tanks in which mortality had occurred over the 2 day acclimation period to bring the total number of fish in each replicate to 10. 80 percent of the water in each replicate was renewed on days 2, 4, and 6. On days 1, 3, and 5, water was not renewed, but the numbers of live, dead, and missing fish were scored for each replicate. Water temperature, pH, and DO were measured daily. Ammonia nitrogen (NH3-N) was measured prior to each water renewal. On Day 7, mass and fork length of 4 fish per replicate were measured and individual tissues (brain, kidney, spleen, liver, gonads, muscle, gill) were dissected, snap-frozen and stored at –80oC for subsequent analyses of sublethal biomarkers. The remaining fish from were measured and frozen whole for chemical analysis. At test termination, temperature, pH, DO, EC, and ammonia were measured for each treatment. 6.1.2 2006 Toxicity Testing
During the 2006 testing season, materials and methods for delta smelt test protocols were refined continuously to incorporate new findings and observations. Control tests were performed to determine the influence of light, water turbidity and conductivity on larval feeding behavior and survival. Methods used are presented below

POD 2006-2007: H. transpacificus
71
for each test.
Test organisms: We performed tests using larval delta smelt ranging in age from 9 days old to 92 days old. Delta Smelt were hatched and raised in large tanks at the UC Davis Fish Conservation and Culture Laboratory, Tracy, CA. At this facility, the delta smelt were kept in water pumped directly from the Delta. Nannochloropsis algae were added to increase turbidity and Artemia were added for food. Younger animals were also fed rotifers.
Control water: Laboratory control water (deionized water amended to US EPA moderately hard specifications, US EPA, 2002) was initially used in control treatments. Since delta smelt larvae did not do well, subsequent tests used water from the delta smelt hatchery for all control treatments. This water is pumped directly from the intake channel of the H.O Banks Pumping Facility near Byron, CA, then passed through a series of sedimentation beds containing natural vegetation to allow any suspended solids in the water to precipitate. This less turbid water is then exposed to an ozonation system to kill any potentially harmful microbes. One day before fish were collected, about 340 gallons of ozonated water were transported to UCD-ATL, and appropriate control waters were prepared for the test.
Fish collection: Fish were maintained in large flow-through tanks at the Byron Hatchery. Using a drain valve, the water was dropped to approximately 1/3 the intial volume of water to increase fish density and thus facilitate collection of the fish. One liter beakers were used to scoop up fish. These were then gently poured into a 27 x 38 cm metal pan containing water at a depth of approximately 2 cm. When the pan contained 30- 40 fish they were then gently poured into black plastic buckets containing hatchery water at a depth of 8-10 cm. Once the desired fish number was reached, the transport bucket was filled to the brim with hatchery water and bucket lids were sealed to prevent water leakage. Dissolved oxygen content was initially monitored during transport. It was not necessary to aerate the water during transport. Buckets were then loaded into coolers packed very lightly with ice to keep temperature at 14-16º C. Small pieces of foam were placed around buckets to reduce vibration. EC and SC were measured in hatchery water. Fish were then transported to the UCD-ATL in Davis. Ice in coolers was replenished periodically during transport to maintain a water temperature of 14-16º C.
Sampling sites: Delta water samples were collected from sites 711, 910, 915, 609,
508 and 340.
Test 1, setup date: 4/5/2006: This seven day test was performed using 9-day old delta smelt larvae. Fish were transported to UCD-ATL in cooled, black 2-gallon buckets with 200 fish per bucket. Upon arrival at the laboratory, fish were placed directly into 2-L test beakers. Larvae were carefully transferred from the black bucket into a glass bread pan using a 250 ml beaker then transferred from there into the test beakers using a 100 ml beaker. Each treatment (six ambient samples, plus control) consisted of four replicate 2-L beakers, each containing 1500 ml of water and ten fish. The fish were fed 1 ml of artemia daily. Tests were performed at 8h:16h D:L cycle, and at a water temperature of 16oC. On
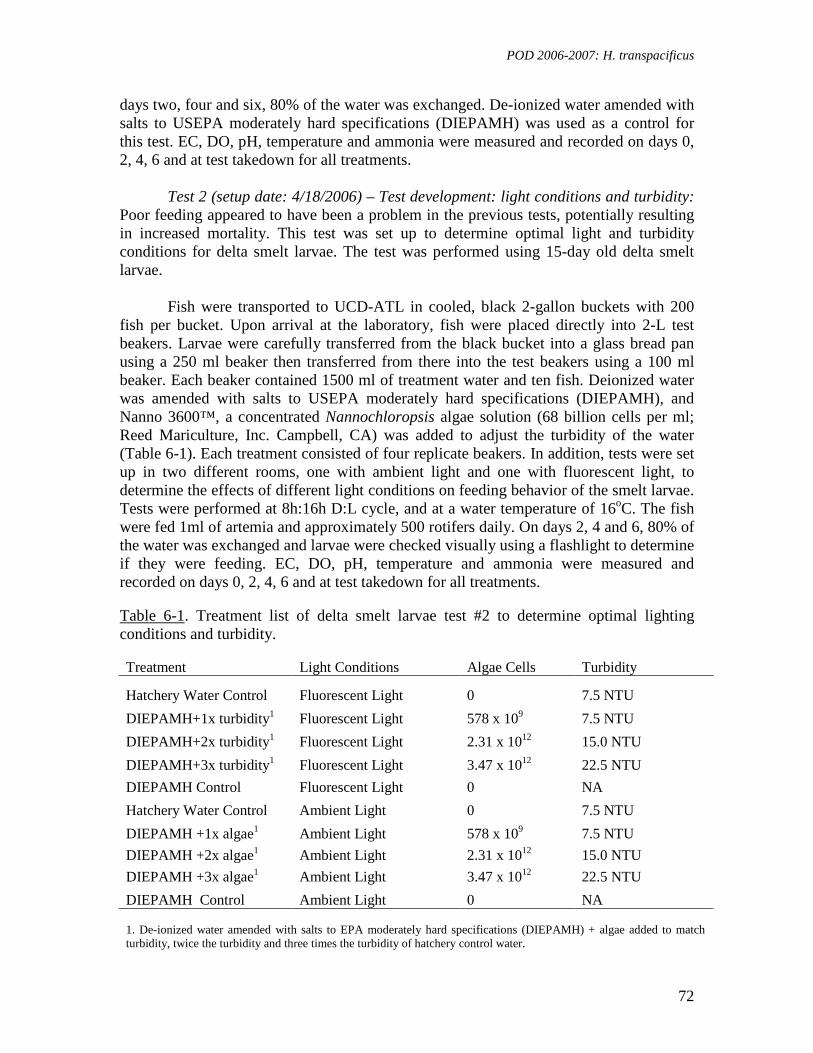
POD 2006-2007: H. transpacificus
72
days two, four and six, 80% of the water was exchanged. De-ionized water amended with salts to USEPA moderately hard specifications (DIEPAMH) was used as a control for this test. EC, DO, pH, temperature and ammonia were measured and recorded on days 0, 2, 4, 6 and at test takedown for all treatments.
Test 2 (setup date: 4/18/2006) – Test development: light conditions and turbidity:
Poor feeding appeared to have been a problem in the previous tests, potentially resulting in increased mortality. This test was set up to determine optimal light and turbidity conditions for delta smelt larvae. The test was performed using 15-day old delta smelt larvae.
Fish were transported to UCD-ATL in cooled, black 2-gallon buckets with 200
fish per bucket. Upon arrival at the laboratory, fish were placed directly into 2-L test beakers. Larvae were carefully transferred from the black bucket into a glass bread pan using a 250 ml beaker then transferred from there into the test beakers using a 100 ml beaker. Each beaker contained 1500 ml of treatment water and ten fish. Deionized water was amended with salts to USEPA moderately hard specifications (DIEPAMH), and Nanno 3600™, a concentrated Nannochloropsis algae solution (68 billion cells per ml; Reed Mariculture, Inc. Campbell, CA) was added to adjust the turbidity of the water (Table 6-1). Each treatment consisted of four replicate beakers. In addition, tests were set up in two different rooms, one with ambient light and one with fluorescent light, to determine the effects of different light conditions on feeding behavior of the smelt larvae. Tests were performed at 8h:16h D:L cycle, and at a water temperature of 16oC. The fish were fed 1ml of artemia and approximately 500 rotifers daily. On days 2, 4 and 6, 80% of the water was exchanged and larvae were checked visually using a flashlight to determine if they were feeding. EC, DO, pH, temperature and ammonia were measured and recorded on days 0, 2, 4, 6 and at test takedown for all treatments. Table 6-1. Treatment list of delta smelt larvae test #2 to determine optimal lighting conditions and turbidity.
Treatment Light Conditions Algae Cells Turbidity
Hatchery Water Control Fluorescent Light 0 7.5 NTU
DIEPAMH+1x turbidity1 Fluorescent Light 578 x 109 7.5 NTU
DIEPAMH+2x turbidity1 Fluorescent Light 2.31 x 10¹² 15.0 NTU
DIEPAMH+3x turbidity1 Fluorescent Light 3.47 x 10¹² 22.5 NTU
DIEPAMH Control Fluorescent Light 0 NA
Hatchery Water Control Ambient Light 0 7.5 NTU
DIEPAMH +1x algae1 Ambient Light 578 x 109 7.5 NTU
DIEPAMH +2x algae1 Ambient Light 2.31 x 10¹² 15.0 NTU
DIEPAMH +3x algae1 Ambient Light 3.47 x 10¹² 22.5 NTU
DIEPAMH Control Ambient Light 0 NA
1. De-ionized water amended with salts to EPA moderately hard specifications (DIEPAMH) + algae added to match turbidity, twice the turbidity and three times the turbidity of hatchery control water.
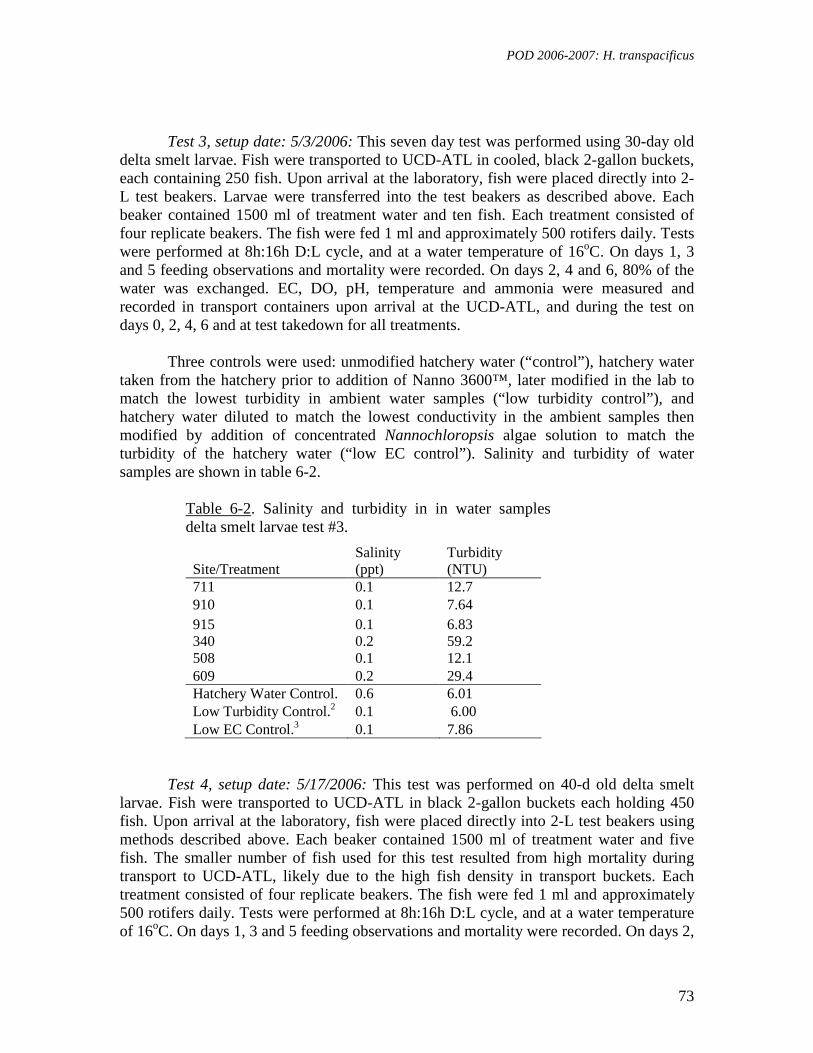
POD 2006-2007: H. transpacificus
73
Test 3, setup date: 5/3/2006: This seven day test was performed using 30-day old
delta smelt larvae. Fish were transported to UCD-ATL in cooled, black 2-gallon buckets, each containing 250 fish. Upon arrival at the laboratory, fish were placed directly into 2-L test beakers. Larvae were transferred into the test beakers as described above. Each beaker contained 1500 ml of treatment water and ten fish. Each treatment consisted of four replicate beakers. The fish were fed 1 ml and approximately 500 rotifers daily. Tests were performed at 8h:16h D:L cycle, and at a water temperature of 16oC. On days 1, 3 and 5 feeding observations and mortality were recorded. On days 2, 4 and 6, 80% of the water was exchanged. EC, DO, pH, temperature and ammonia were measured and recorded in transport containers upon arrival at the UCD-ATL, and during the test on days 0, 2, 4, 6 and at test takedown for all treatments.
Three controls were used: unmodified hatchery water (“control”), hatchery water
taken from the hatchery prior to addition of Nanno 3600™, later modified in the lab to match the lowest turbidity in ambient water samples (“low turbidity control”), and hatchery water diluted to match the lowest conductivity in the ambient samples then modified by addition of concentrated Nannochloropsis algae solution to match the turbidity of the hatchery water (“low EC control”). Salinity and turbidity of water samples are shown in table 6-2.
Table 6-2. Salinity and turbidity in in water samples delta smelt larvae test #3.
Site/Treatment Salinity (ppt)
Turbidity (NTU)
711 0.1 12.7 910 0.1 7.64 915 0.1 6.83 340 0.2 59.2 508 0.1 12.1 609 0.2 29.4 Hatchery Water Control. 0.6 6.01 Low Turbidity Control.2 0.1 6.00 Low EC Control.3 0.1 7.86
Test 4, setup date: 5/17/2006: This test was performed on 40-d old delta smelt larvae. Fish were transported to UCD-ATL in black 2-gallon buckets each holding 450 fish. Upon arrival at the laboratory, fish were placed directly into 2-L test beakers using methods described above. Each beaker contained 1500 ml of treatment water and five fish. The smaller number of fish used for this test resulted from high mortality during transport to UCD-ATL, likely due to the high fish density in transport buckets. Each treatment consisted of four replicate beakers. The fish were fed 1 ml and approximately 500 rotifers daily. Tests were performed at 8h:16h D:L cycle, and at a water temperature of 16oC. On days 1, 3 and 5 feeding observations and mortality were recorded. On days 2,
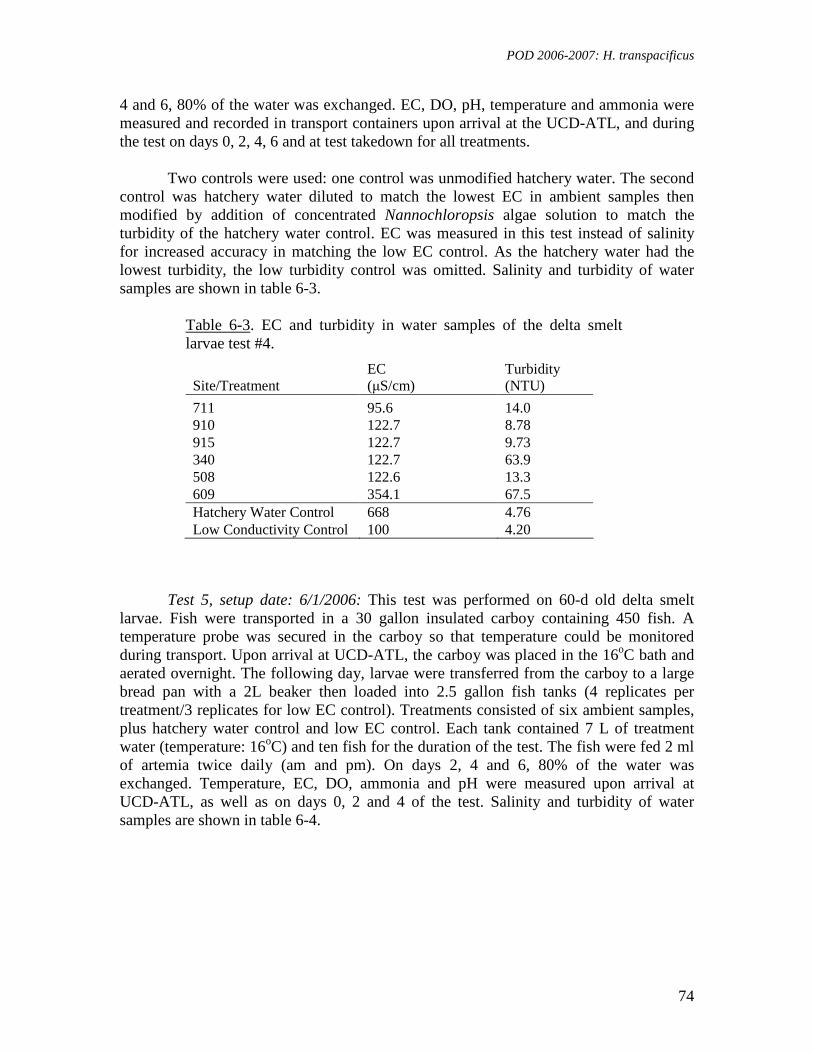
POD 2006-2007: H. transpacificus
74
4 and 6, 80% of the water was exchanged. EC, DO, pH, temperature and ammonia were measured and recorded in transport containers upon arrival at the UCD-ATL, and during the test on days 0, 2, 4, 6 and at test takedown for all treatments.
Two controls were used: one control was unmodified hatchery water. The second
control was hatchery water diluted to match the lowest EC in ambient samples then modified by addition of concentrated Nannochloropsis algae solution to match the turbidity of the hatchery water control. EC was measured in this test instead of salinity for increased accuracy in matching the low EC control. As the hatchery water had the lowest turbidity, the low turbidity control was omitted. Salinity and turbidity of water samples are shown in table 6-3.
Table 6-3. EC and turbidity in water samples of the delta smelt larvae test #4.
Site/Treatment EC (µS/cm)
Turbidity (NTU)
711 95.6 14.0 910 122.7 8.78 915 122.7 9.73 340 122.7 63.9 508 122.6 13.3 609 354.1 67.5 Hatchery Water Control 668 4.76 Low Conductivity Control 100 4.20
Test 5, setup date: 6/1/2006: This test was performed on 60-d old delta smelt
larvae. Fish were transported in a 30 gallon insulated carboy containing 450 fish. A temperature probe was secured in the carboy so that temperature could be monitored during transport. Upon arrival at UCD-ATL, the carboy was placed in the 16oC bath and aerated overnight. The following day, larvae were transferred from the carboy to a large bread pan with a 2L beaker then loaded into 2.5 gallon fish tanks (4 replicates per treatment/3 replicates for low EC control). Treatments consisted of six ambient samples, plus hatchery water control and low EC control. Each tank contained 7 L of treatment water (temperature: 16oC) and ten fish for the duration of the test. The fish were fed 2 ml of artemia twice daily (am and pm). On days 2, 4 and 6, 80% of the water was exchanged. Temperature, EC, DO, ammonia and pH were measured upon arrival at UCD-ATL, as well as on days 0, 2 and 4 of the test. Salinity and turbidity of water samples are shown in table 6-4.
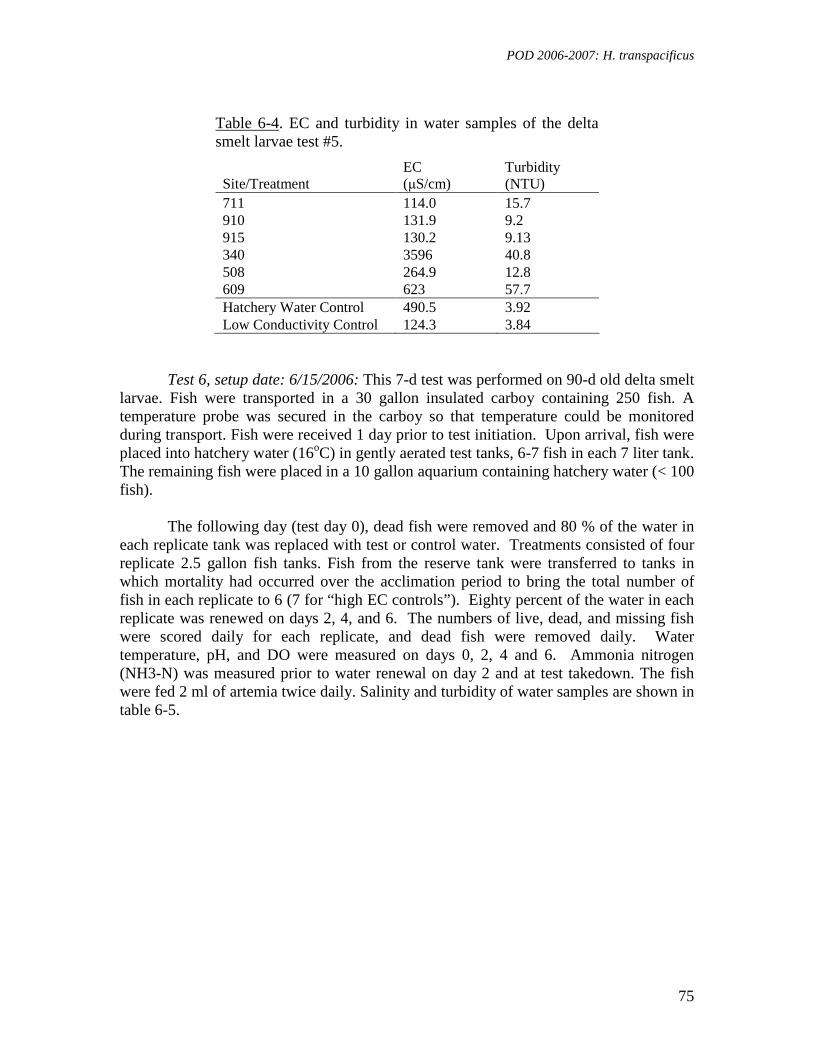
POD 2006-2007: H. transpacificus
75
Table 6-4. EC and turbidity in water samples of the delta smelt larvae test #5.
Site/Treatment EC (µS/cm)
Turbidity (NTU)
711 114.0 15.7 910 131.9 9.2 915 130.2 9.13 340 3596 40.8 508 264.9 12.8 609 623 57.7 Hatchery Water Control 490.5 3.92 Low Conductivity Control 124.3 3.84
Test 6, setup date: 6/15/2006: This 7-d test was performed on 90-d old delta smelt
larvae. Fish were transported in a 30 gallon insulated carboy containing 250 fish. A temperature probe was secured in the carboy so that temperature could be monitored during transport. Fish were received 1 day prior to test initiation. Upon arrival, fish were placed into hatchery water (16oC) in gently aerated test tanks, 6-7 fish in each 7 liter tank. The remaining fish were placed in a 10 gallon aquarium containing hatchery water (< 100 fish).
The following day (test day 0), dead fish were removed and 80 % of the water in
each replicate tank was replaced with test or control water. Treatments consisted of four replicate 2.5 gallon fish tanks. Fish from the reserve tank were transferred to tanks in which mortality had occurred over the acclimation period to bring the total number of fish in each replicate to 6 (7 for “high EC controls”). Eighty percent of the water in each replicate was renewed on days 2, 4, and 6. The numbers of live, dead, and missing fish were scored daily for each replicate, and dead fish were removed daily. Water temperature, pH, and DO were measured on days 0, 2, 4 and 6. Ammonia nitrogen (NH3-N) was measured prior to water renewal on day 2 and at test takedown. The fish were fed 2 ml of artemia twice daily. Salinity and turbidity of water samples are shown in table 6-5.
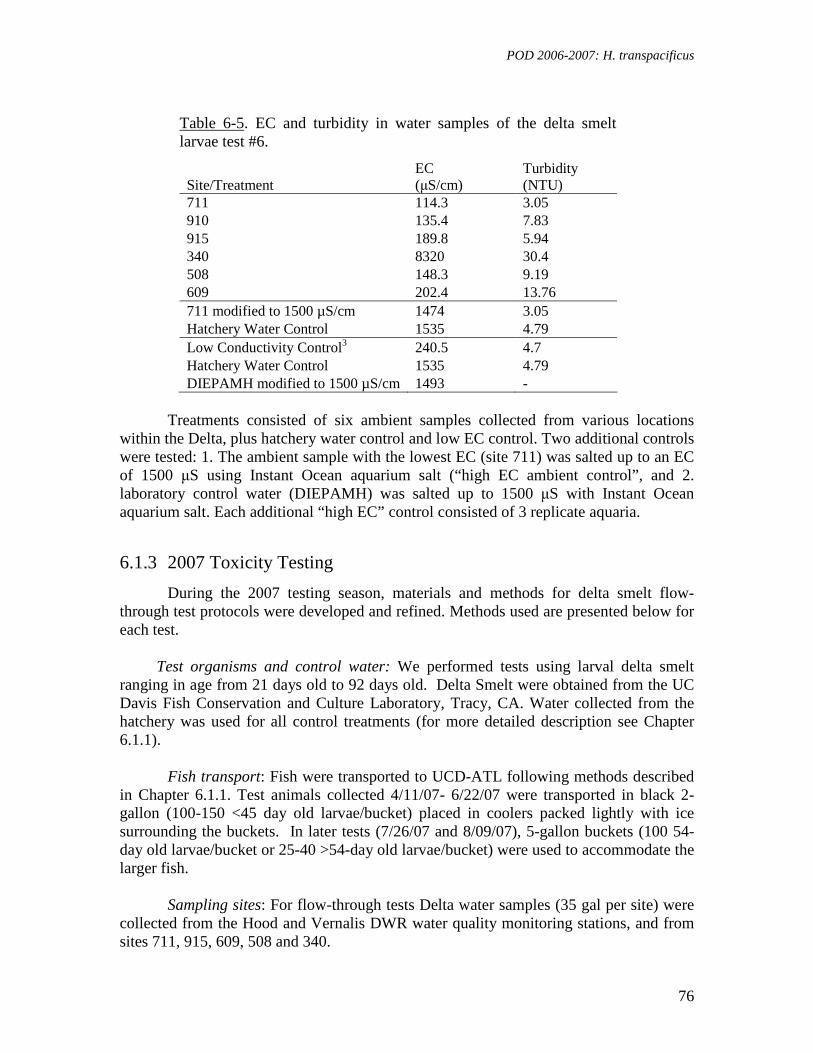
POD 2006-2007: H. transpacificus
76
Table 6-5. EC and turbidity in water samples of the delta smelt larvae test #6.
Site/Treatment EC (µS/cm)
Turbidity (NTU)
711 114.3 3.05 910 135.4 7.83 915 189.8 5.94 340 8320 30.4 508 148.3 9.19 609 202.4 13.76 711 modified to 1500 µS/cm 1474 3.05 Hatchery Water Control 1535 4.79 Low Conductivity Control3 240.5 4.7 Hatchery Water Control 1535 4.79 DIEPAMH modified to 1500 µS/cm 1493 -
Treatments consisted of six ambient samples collected from various locations
within the Delta, plus hatchery water control and low EC control. Two additional controls were tested: 1. The ambient sample with the lowest EC (site 711) was salted up to an EC of 1500 µS using Instant Ocean aquarium salt (“high EC ambient control”, and 2. laboratory control water (DIEPAMH) was salted up to 1500 µS with Instant Ocean aquarium salt. Each additional “high EC” control consisted of 3 replicate aquaria.
6.1.3 2007 Toxicity Testing
During the 2007 testing season, materials and methods for delta smelt flow-through test protocols were developed and refined. Methods used are presented below for each test.
Test organisms and control water: We performed tests using larval delta smelt ranging in age from 21 days old to 92 days old. Delta Smelt were obtained from the UC Davis Fish Conservation and Culture Laboratory, Tracy, CA. Water collected from the hatchery was used for all control treatments (for more detailed description see Chapter 6.1.1).
Fish transport: Fish were transported to UCD-ATL following methods described in Chapter 6.1.1. Test animals collected 4/11/07- 6/22/07 were transported in black 2-gallon (100-150 <45 day old larvae/bucket) placed in coolers packed lightly with ice surrounding the buckets. In later tests (7/26/07 and 8/09/07), 5-gallon buckets (100 54-day old larvae/bucket or 25-40 >54-day old larvae/bucket) were used to accommodate the larger fish.
Sampling sites: For flow-through tests Delta water samples (35 gal per site) were collected from the Hood and Vernalis DWR water quality monitoring stations, and from sites 711, 915, 609, 508 and 340.

POD 2006-2007: H. transpacificus
77
Testing procedures: Upon arrival at UCD-ATL, the transport containers with fish
were placed into a temperature-regulated water bath maintained at 16º C. One-liter beakers were used to collect fish from the buckets, and fish were gently poured into a metal pan containing water at a depth of approximately 2 cm. The fish were gently scooped up using 100 mL beakers and released into the replicate exposure tanks at random, submerging the beaker and allowing fish to swim freely into the tanks. Twelve fish were placed into each of the test tanks containing 7 L of water for 48-h EC acclimation (Figures 6-1 to 6-3). Sacramento River water, hatchery water and EC-adjusted hatchery water was used as acclimation and control water. EC is adjusted with distilled water (Low EC Control) to match the Sacramento River water samples. When the turbidity of the hatchery water was below 11 NTUs, Nanno 3600™, a concentrated Nannochloropsis algae solution (68 billion cells per ml; Reed Mariculture, Inc. Campbell, CA) was added to increase turbidity. Two methods development tests were performed prior to the commencement of ambient testing. Ambient water testing occurred from 5/03/07 to 8/09/07. During acclimation and testing, fish were fed three times a day with 1mL of Artemia and 1mL of rotifers. At test initiation, the EC-adjusted control water is drawn down from 7 liters to approximately two liters to allow for an accurate count of living fish. Water quality parameters (EC, pH, temperature, DO and ammonia concentration) were measured twice daily, and dead fish were counted and removed daily. The feeding behavior of fish was monitored throughout the duration of the test. At test termination, surviving fish were counted.
EC Change During Acclimation
hours0 10 20 30 40 50
EC
(m
icro
S/c
m)
0
500
1000
1500
2000
2500
3000
3500
4000
4500
5000
5500
6000
6500
7000
7500
Low EC Control High EC Control
Figure 6-1. EC change in exposure tank during delta smelt 48-h acclimation period to low EC. The flow-through drip system (1.5 ml/min) is used to gradually add EC modified hatchery (control) water to adjust the lowest sample EC.
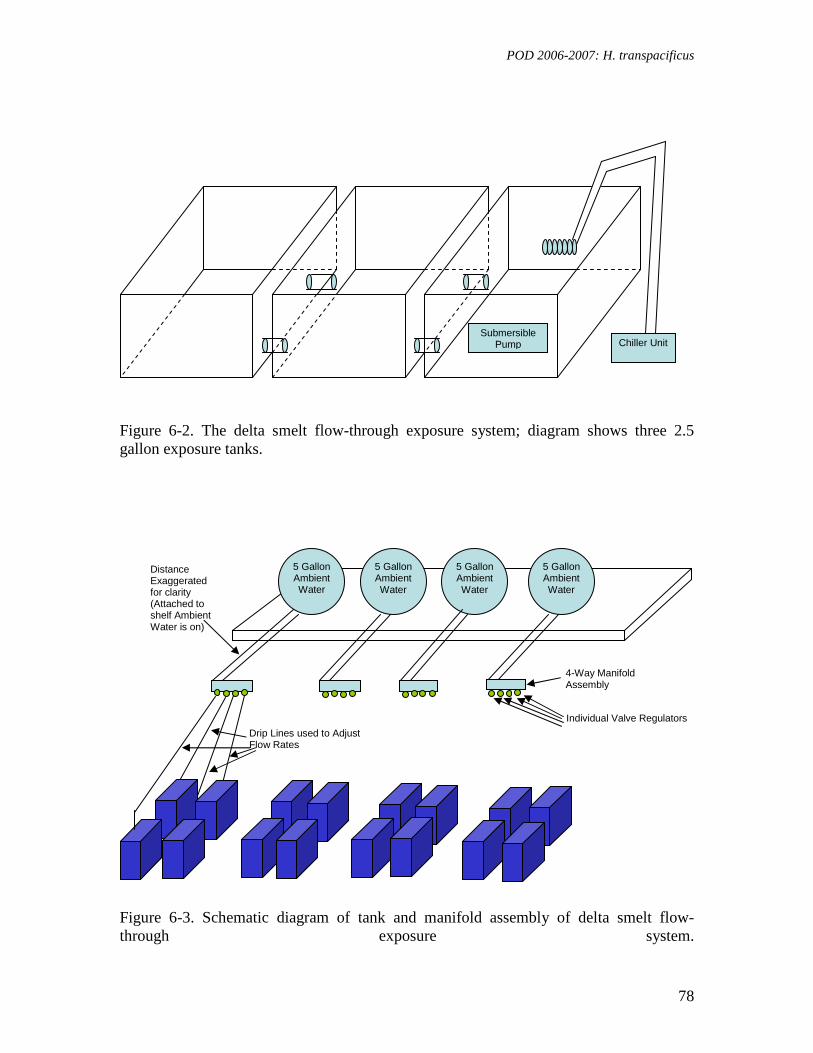
POD 2006-2007: H. transpacificus
78
Figure 6-2. The delta smelt flow-through exposure system; diagram shows three 2.5 gallon exposure tanks.
Figure 6-3. Schematic diagram of tank and manifold assembly of delta smelt flow-through exposure system.
Chiller Unit Chiller Unit
Submersible Pump
Submersible Pump
5 Gallon Ambient Water
5 Gallon Ambient Water
5 Gallon Ambient Water
5 Gallon Ambient Water
4-Way Manifold Assembly
Distance Exaggerated for clarity (Attached to shelf Ambient Water is on)
Individual Valve Regulators
Drip Lines used to Adjust Flow Rates

POD 2006-2007: H. transpacificus
79
Test 1, setup date: 04/26/07: This test was performed using 23-day-old fish
collected from the hatchery on 4/26/07. The test was performed in the 16 ºC flow-through-system where fish were held in fish breeding nets in 2.5 gallon aquariums containing 7 liters of hatchery water and a small submersible pump. Fish were fed three times a day, with 1mL of Artemia and 1mL of rotifers at each feeding. Upon receipt 10 fish were placed directly into each test apparatus for electrical conductivity acclimation. The flow-through drip system (1.5 ml/min) was used to gradually add EC modified hatchery water in order to alter the electrical conductivity of each treatment to match the electrical conductivity of their respective ambient testing waters for 48 hours, after which the ambient waters would be introduced into the drip system. Periodic electrical conductivity measurements were taken during acclimation. High mortality in the breeding baskets led to the test being terminated during the acclimation phase.
Test 2, setup date: 05/03/07: This test was setup with 28 day old fish collected from the hatchery on 5/01/07. Two replicate tanks were used with 5 fish in each of 2 coffee filter baskets in 2.5 gallon aquariums. Each aquarium contained 7 liters of hatchery water and a small submersible pump in the flow through system. Fish were fed three times a day, with 1mL of Artemia and 1mL of rotifers at each feeding. A second batch of fish was tested in two replicate 600 ml beakers, each containing 250 ml of hatchery water. Fish were fed three times a day, with 100uL of Artemia and 500uL of rotifers at each feeding. After electrical conductivity acclimation, the ambient water samples were introduced to the flow through system via the drip system and to the beakers via an 80% water renewal. In beakers, 80% water changes were performed in every other day. Water chemistry measurements were recorded for all replicates daily.
Test 3, setup date: 05/12/07: This test was set up with 36 day old fish collected from the hatchery on 5/10/07. To minimize handling stress, fish were not loaded directly into the testing tanks, rather were acclimated to the test water ECs in the transport containers modified to fit into the flow through system. Modifications made consisted of a hole in the lid for the drip system and a hole in the side of the buckets for drainage during the EC acclimation period. Fish were fed three times a day, with 5mL of Artemia and 5mL of rotifers during acclimation. Three batches of fish were acclimated over a 2 day period to low EC (matching the EC at sites 711 and Hood, 180 uS/cm), medium EC (500 uS/cm), and a high EC (4,700 uS/cm; matching the sites farthest West). One bucket was used to determine if any parts of the flow-through system were inherently toxic to the fish. After two days of acclimation, 10 fish were transferred to 4 replicate 1 liter beakers containing 400 mL of water from Delta sites. For the duration of 7 days, fish were fed three times a day, with 100uL of Artemia and 500uL of rotifers. Mortality was recorded daily. Water renewals (80%) and water quality measurements were performed every other day; ammonia-nitrogen was measured on days 2, 4, 5, 6, and 7. In addition to the beaker exposures, two experimental procedures were performed. One experimental treatment of tanks tested coffee filter containment units and was not exposed to ambient water samples. These fish were fed three times a day, with 1mL of Artemia and 1mL of rotifers at each feeding. Each tank contained 2 coffee filters, each
POD 2006-2007: H. transpacificus
80
containing 7 fish. Two of the replicates (A and B) had a submersible pump to re-circulate the water; the other two replicates (C and D) were set up with air-stones for aeration. The second treatment was set up in similar fashion (four replicates exposed to hatchery water in 2.5 gallon tanks) with a second manifold system consisting of airline tubing connected to a simple flow regulator rather than the 4-way manifold with I.V. drip lines used for flow regulation in previous tests. Replicates A and B tested the second manifold with an air-bar with an air-stone in the tank. Fish in these replicates were loose in the tank with no secondary containment. The other two replicates (C and D) had the modified manifold and air-bar assembly, contained 2 coffee filters, each holding 7 fish. At test termination, surviving fish were dried and weighed to determine biomass endpoints. .
Test 4, setup date: 05/24/07: This test was set up with 30 day old fish collected from the hatchery on 5/22/07. Upon arrival at the laboratory, 12 fish were immediately placed into the test tanks with no secondary holding units, for EC acclimation. Fish were fed three times a day, with 1mL of Artemia and 1mL of rotifers at each feeding. The changes in electrical conductivity were measured during acclimation. Turbidity was not adjusted for any of the treatments as the hatchery water was higher than 15 NTU. At test initiation, the salinity adjusted control water was drawn down from 7 liters to approximately two liters to allow for an accurate count of living fish. Dead fish were counted and removed daily. At test termination, surviving fish were counted, dried and weighed to determine survival and biomass endpoints.
Test 5, setup date: 06/07/07: This test was set up with 44 day old fish collected from the hatchery on 6/05/07 and brought into the laboratory using transport methods described above. The test used the same methods as the previous test of 052407, with the exception of the addition of Nannochloropsis algae and the monitoring of the animals’ feeding behavior. Nannochloropsis algae concentrate was added to all of the treatments for the entire 2 day acclimation period. After initiation of the ambient water test, Nannochloropsis algae were only added to control treatments while ambient sites were completely unaltered. At test initiation the feeding behavior of all the fish was observed and was periodically monitored throughout the duration of the test. At test termination, surviving fish were dried and weighed to determine biomass endpoints.
Test 6, setup date: 06/22/07: This test was set up with 59 day old fish collected from the hatchery on 6/20/07. Testing methods were identical those of the 060707 test. At test termination, the fish were placed into liquid nitrogen and snap frozen by replicate to be stored at – 80 º Celsius.
Test 7, setup date: 07/26/07: This test was set up with 54 day old fish collected from the hatchery on 7/24/07. Since fish were larger than before, and water quality was a concern, fish were now transported in 4.5-gallon black buckets, as opposed to the 2-gallon buckets used previously. Methods used for ambient sample testing were identical to those in the 5/24/07 test with the exception of the takedown procedures. Turbidity was not adjusted for any of the treatments as the hatchery water was higher than 15 NTU. Due to high mortality in both tests, the tests were taken down early on day 4.
POD 2006-2007: H. transpacificus
81
Test 8, setup date: 08/09/07: This test was set up with 92 day old fish collected
from the hatchery on 8/07/07. Animals were transported in 5 gallon black buckets. Methods used for this test were identical to those in the 6/07/07 test, with the exception of the termination procedures. After test termination fish were placed into liquid nitrogen and stored at -80oC.
6.1.4 Reference Toxicant Testing 6.1.4.1 Copper
This 7-day chronic toxicity test was conducted to determine the effects of copper on the survival and growth of juvenile H. transpacificus. We performed this test two times, once to find the general range of sensitivity of delta smelt to Cu+ (rangefinder test), and a second time to determine the LC50 for Cu+. Each experimental treatment was comprised of 4 replicates of 10 animals each, and each replicate tank contained 7 L of water at 20oC. The rangefinder test differed from the other test in that each treatment contained only 2 replicates. Fish were fed twice daily with artemia (< 48 hrs old). The light:dark cycle was 16h:8h.
Fish were received 2 days prior to test initiation. Upon arrival, fish were placed into dilute well water in gently aerated test tanks, 10 fish in each 7 liter tank. Reserve fish were placed in a 10 gallon aquarium containing dilute well water (< 100 fish). The day after arrival, 80 percent of the water in each tank was replaced with new dilute well water. This dilute well water was used as control water throughout the experiment.
On the day of test initiation (day 0), 80 percent of the water in each replicate tank was replaced with test water. Fish from the reserve tank were transferred to tanks in which mortality had occurred over the 2 day acclimation period to bring the total number of fish in each replicate to 10. Approximately 80 percent of the water in each replicate was renewed on days 2, 4, and 6. On days 1, 3, and 5, water was not renewed, but the numbers of live, dead, and missing fish were scored for each replicate. Water temperature, pH, and DO were measured daily. Ammonia nitrogen (NH3-N) was measured prior to each water renewal. On Day 7, 4 fish from each replicate were measured for mass and fork length and individual tissues (brain, kidney, spleen, liver, gonads, muscle, gill) were dissected, snap-frozen and stored at –80oC for subsequent analyses of sublethal biomarkers. The remaining fish from each replicate were measured and frozen for analysis of tissue chemistry. At test termination, temperature, pH, DO, EC, and ammonia were measured for each treatment. 6.1.4.2 Esfenvalerate
This series of experiments was performed to determine the stage-dependent
sensitivity of delta smelt larvae to a reference toxicant. The pyrethroid pesticide esfenvalerate was used as a reference toxicant. Delta smelt larvae aged 10 d, 31 d, 35 d, and 52 d were exposed to a range of concentrations for 24 h (see Table 6-6). Larvae were obtained from the UC Davis Fish Conservation and Culture Laboratory, Tracy, CA, and held overnight in the laboratory at 17oC and a 8h:16h D:L light cycle. The following day,
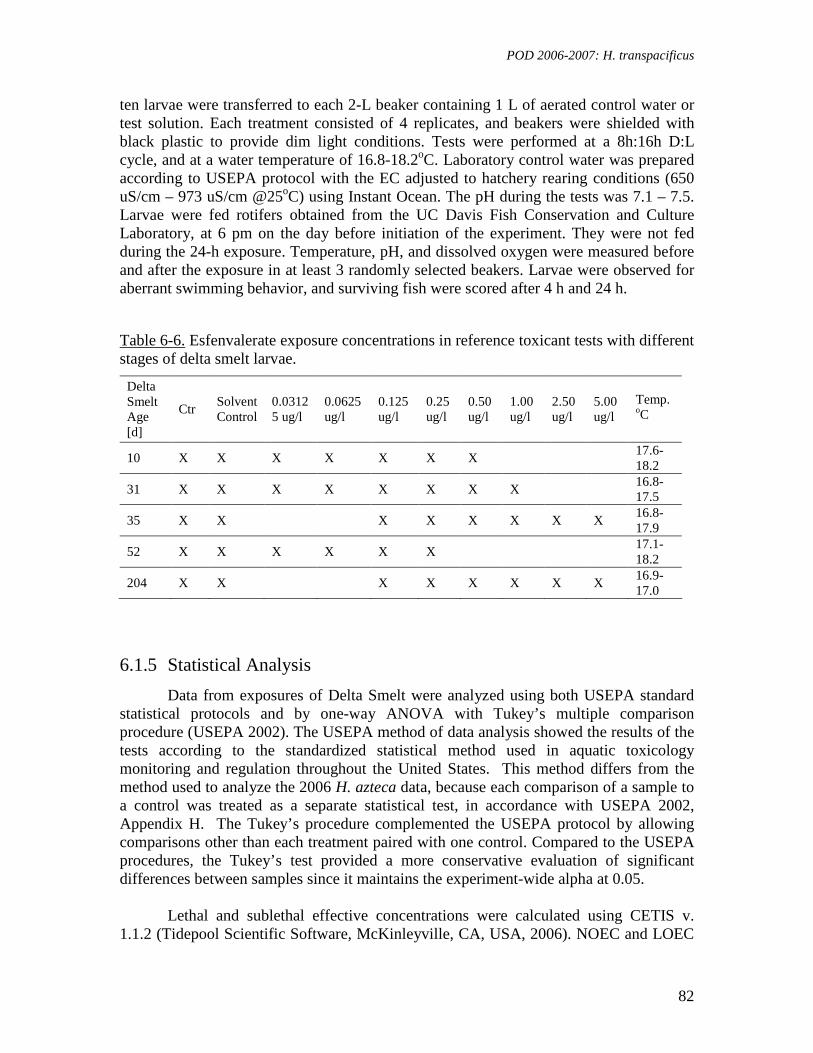
POD 2006-2007: H. transpacificus
82
ten larvae were transferred to each 2-L beaker containing 1 L of aerated control water or test solution. Each treatment consisted of 4 replicates, and beakers were shielded with black plastic to provide dim light conditions. Tests were performed at a 8h:16h D:L cycle, and at a water temperature of 16.8-18.2oC. Laboratory control water was prepared according to USEPA protocol with the EC adjusted to hatchery rearing conditions (650 uS/cm – 973 uS/cm @25oC) using Instant Ocean. The pH during the tests was 7.1 – 7.5. Larvae were fed rotifers obtained from the UC Davis Fish Conservation and Culture Laboratory, at 6 pm on the day before initiation of the experiment. They were not fed during the 24-h exposure. Temperature, pH, and dissolved oxygen were measured before and after the exposure in at least 3 randomly selected beakers. Larvae were observed for aberrant swimming behavior, and surviving fish were scored after 4 h and 24 h. Table 6-6. Esfenvalerate exposure concentrations in reference toxicant tests with different stages of delta smelt larvae.
Delta Smelt Age [d]
Ctr Solvent Control
0.03125 ug/l
0.0625 ug/l
0.125 ug/l
0.25 ug/l
0.50 ug/l
1.00 ug/l
2.50 ug/l
5.00 ug/l
Temp. oC
10 X X X X X X X 17.6-18.2
31 X X X X X X X X 16.8-17.5
35 X X X X X X X X 16.8-17.9
52 X X X X X X 17.1-18.2
204 X X X X X X X X 16.9-17.0
6.1.5 Statistical Analysis
Data from exposures of Delta Smelt were analyzed using both USEPA standard statistical protocols and by one-way ANOVA with Tukey’s multiple comparison procedure (USEPA 2002). The USEPA method of data analysis showed the results of the tests according to the standardized statistical method used in aquatic toxicology monitoring and regulation throughout the United States. This method differs from the method used to analyze the 2006 H. azteca data, because each comparison of a sample to a control was treated as a separate statistical test, in accordance with USEPA 2002, Appendix H. The Tukey’s procedure complemented the USEPA protocol by allowing comparisons other than each treatment paired with one control. Compared to the USEPA procedures, the Tukey’s test provided a more conservative evaluation of significant differences between samples since it maintains the experiment-wide alpha at 0.05.
Lethal and sublethal effective concentrations were calculated using CETIS v.
1.1.2 (Tidepool Scientific Software, McKinleyville, CA, USA, 2006). NOEC and LOEC
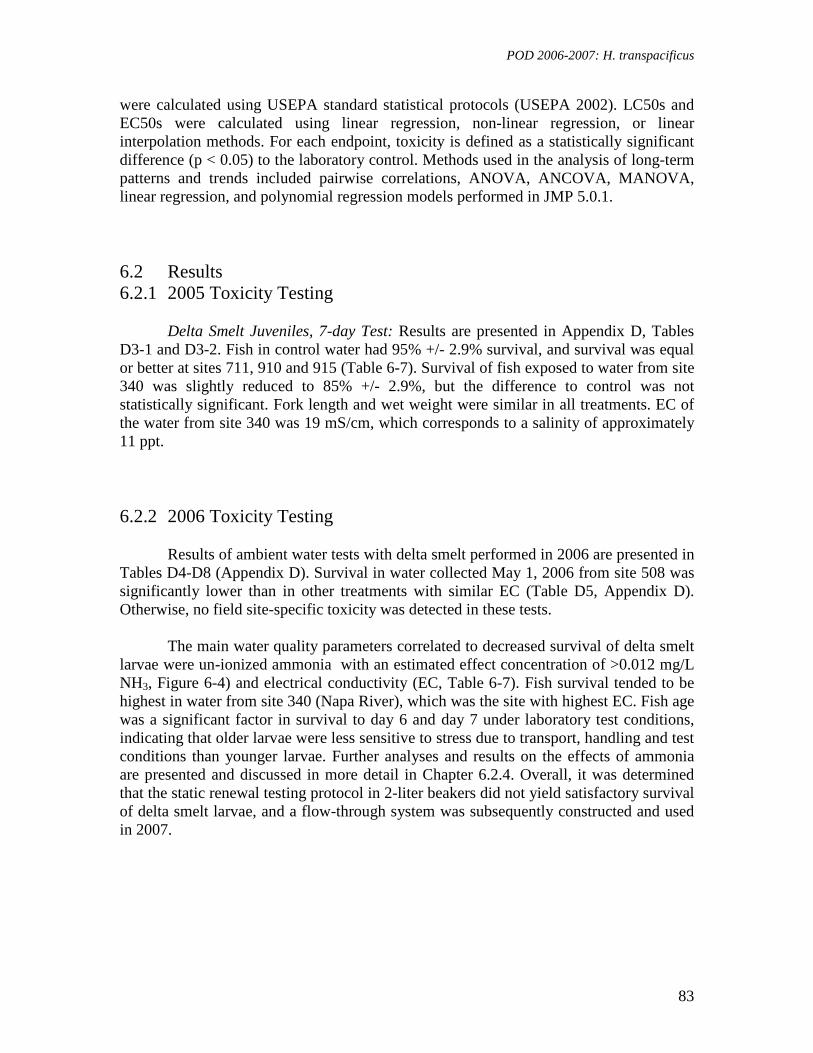
POD 2006-2007: H. transpacificus
83
were calculated using USEPA standard statistical protocols (USEPA 2002). LC50s and EC50s were calculated using linear regression, non-linear regression, or linear interpolation methods. For each endpoint, toxicity is defined as a statistically significant difference (p < 0.05) to the laboratory control. Methods used in the analysis of long-term patterns and trends included pairwise correlations, ANOVA, ANCOVA, MANOVA, linear regression, and polynomial regression models performed in JMP 5.0.1. 6.2 Results 6.2.1 2005 Toxicity Testing
Delta Smelt Juveniles, 7-day Test: Results are presented in Appendix D, Tables D3-1 and D3-2. Fish in control water had 95% +/- 2.9% survival, and survival was equal or better at sites 711, 910 and 915 (Table 6-7). Survival of fish exposed to water from site 340 was slightly reduced to 85% +/- 2.9%, but the difference to control was not statistically significant. Fork length and wet weight were similar in all treatments. EC of the water from site 340 was 19 mS/cm, which corresponds to a salinity of approximately 11 ppt.
6.2.2 2006 Toxicity Testing Results of ambient water tests with delta smelt performed in 2006 are presented in
Tables D4-D8 (Appendix D). Survival in water collected May 1, 2006 from site 508 was significantly lower than in other treatments with similar EC (Table D5, Appendix D). Otherwise, no field site-specific toxicity was detected in these tests.
The main water quality parameters correlated to decreased survival of delta smelt
larvae were un-ionized ammonia with an estimated effect concentration of >0.012 mg/L NH3, Figure 6-4) and electrical conductivity (EC, Table 6-7). Fish survival tended to be highest in water from site 340 (Napa River), which was the site with highest EC. Fish age was a significant factor in survival to day 6 and day 7 under laboratory test conditions, indicating that older larvae were less sensitive to stress due to transport, handling and test conditions than younger larvae. Further analyses and results on the effects of ammonia are presented and discussed in more detail in Chapter 6.2.4. Overall, it was determined that the static renewal testing protocol in 2-liter beakers did not yield satisfactory survival of delta smelt larvae, and a flow-through system was subsequently constructed and used in 2007.
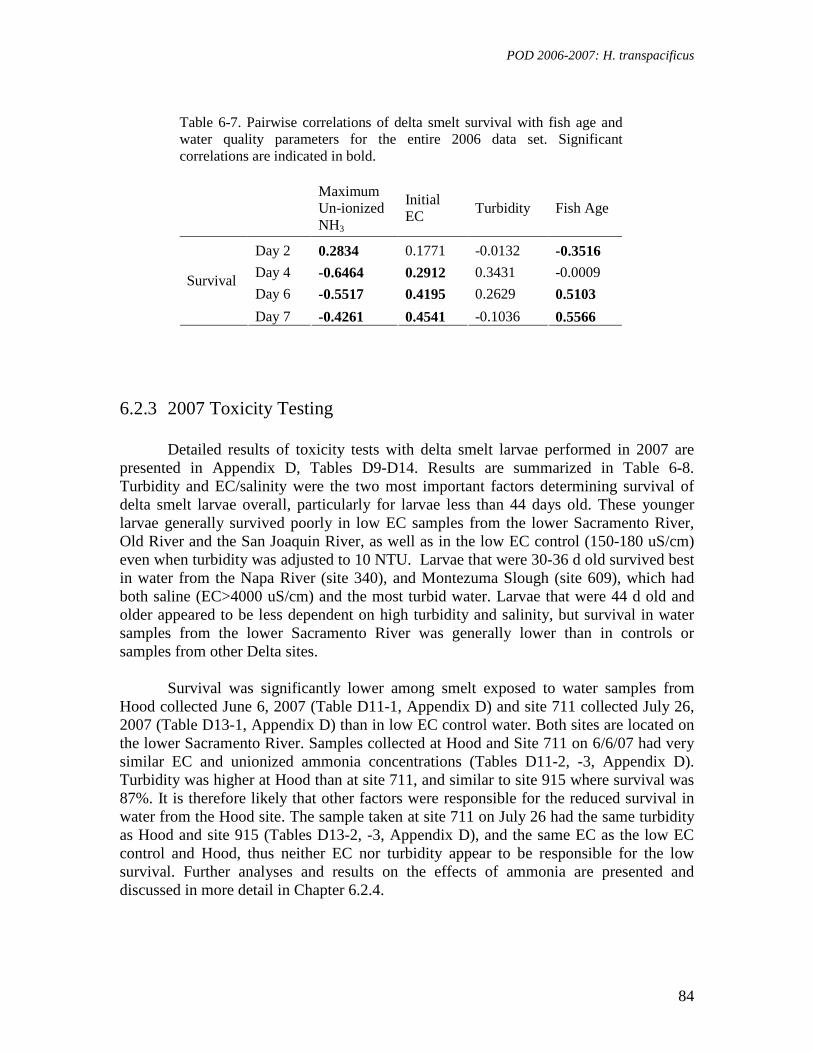
POD 2006-2007: H. transpacificus
84
Table 6-7. Pairwise correlations of delta smelt survival with fish age and water quality parameters for the entire 2006 data set. Significant correlations are indicated in bold.
Maximum Un-ionized NH3
Initial EC
Turbidity Fish Age
Day 2 0.2834 0.1771 -0.0132 -0.3516
Day 4 -0.6464 0.2912 0.3431 -0.0009
Day 6 -0.5517 0.4195 0.2629 0.5103 Survival
Day 7 -0.4261 0.4541 -0.1036 0.5566 6.2.3 2007 Toxicity Testing
Detailed results of toxicity tests with delta smelt larvae performed in 2007 are presented in Appendix D, Tables D9-D14. Results are summarized in Table 6-8. Turbidity and EC/salinity were the two most important factors determining survival of delta smelt larvae overall, particularly for larvae less than 44 days old. These younger larvae generally survived poorly in low EC samples from the lower Sacramento River, Old River and the San Joaquin River, as well as in the low EC control (150-180 uS/cm) even when turbidity was adjusted to 10 NTU. Larvae that were 30-36 d old survived best in water from the Napa River (site 340), and Montezuma Slough (site 609), which had both saline (EC>4000 uS/cm) and the most turbid water. Larvae that were 44 d old and older appeared to be less dependent on high turbidity and salinity, but survival in water samples from the lower Sacramento River was generally lower than in controls or samples from other Delta sites.
Survival was significantly lower among smelt exposed to water samples from
Hood collected June 6, 2007 (Table D11-1, Appendix D) and site 711 collected July 26, 2007 (Table D13-1, Appendix D) than in low EC control water. Both sites are located on the lower Sacramento River. Samples collected at Hood and Site 711 on 6/6/07 had very similar EC and unionized ammonia concentrations (Tables D11-2, -3, Appendix D). Turbidity was higher at Hood than at site 711, and similar to site 915 where survival was 87%. It is therefore likely that other factors were responsible for the reduced survival in water from the Hood site. The sample taken at site 711 on July 26 had the same turbidity as Hood and site 915 (Tables D13-2, -3, Appendix D), and the same EC as the low EC control and Hood, thus neither EC nor turbidity appear to be responsible for the low survival. Further analyses and results on the effects of ammonia are presented and discussed in more detail in Chapter 6.2.4.
POD 2006-2007: H. transpacificus
85
Table 6-8. Percent survival of delta smelt larvae after 7-day exposures in Delta water samples (unless indicated otherwise). Results indicated in bold/shaded box are significantly different from their respective control. Sites 711 and 915, Hood and Vernalis were compared to the Low EC Control, sites 609, 508 and 340 were compared to the High EC Control. Sampling Date: May
8-10 May 23-24
Jun 5-6
Jun 20-21
Jul 25-26
Aug 8-9
Age of DS Larvae: 36 d 30 d 44 d 59 d 54 d 92 d Treatment Mean 7-day Survival (%) [96 h] Low EC Control 21 32 89 85 61 82 Site 711 20 37 75 73 291 59 Hood 45 41 68 80 57 63 Site 915 45 32 87 75 52 75 Vernalis 45 39 87 - 66 97 Hatchery Control 39 53 98 82 41 92 High EC Control 73 51 94 94 272 94 Site 609 51 90 94 89 41 91 Site 508 43 70 94 92 33 93 Site 340 89 87 89 95 58 82 Low Turbidity Ctr (1.1-1.5 NTU)
83 252 71
1 Turbidity of site 711 sample was same as Hood sample (3.1 NTU) 2 Samples had lowest turbidity 1.3-1.6 NTU
6.2.4 Ammonia and Delta Smelt Survival 6.2.4.1 Testing Period 2006
Figure 6-4 shows the results of a regression analysis on 96-h survival of delta smelt larvae at different ages, and the maximum measured unionized ammonia (mg/L) during the static renewal tests (ambient samples and controls) performed in 2006. In order to measure the response of the healthiest animals possible, this analysis includes only data from experiments showing at least 50% survival in controls on day 7 of the test. Each point represents the mean 96-h survival (n=4 per treatment) of one treatment (i.e. control or ambient sample). Each symbol type corresponds to a different experiment. The experiments were initiated between 4/18/06 – 6/15/06. Results show a significant linear relationship between 4-day survival and unionized ammonia concentration with an estimated 96-h LC50 of 0.012 mg/L NH3. However, it is important to remember that the laboratory tests were carried out with delta smelt larvae of different ages (9-90 d old), and additional tests to determine ammonia toxicity for delta smelt larvae of single age groups are advisable.
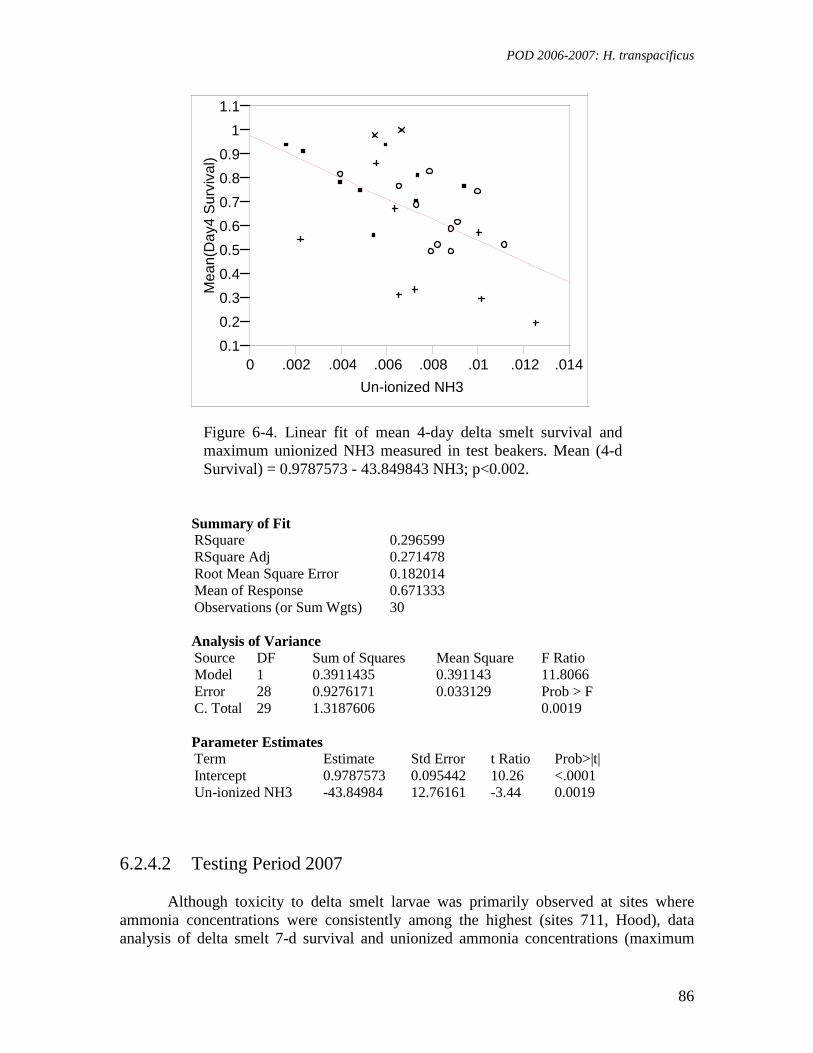
POD 2006-2007: H. transpacificus
86
0.1
0.2
0.3
0.4
0.5
0.6
0.7
0.8
0.9
1
1.1
Mea
n(D
ay4
Sur
viva
l)
0 .002 .004 .006 .008 .01 .012 .014
Un-ionized NH3
Figure 6-4. Linear fit of mean 4-day delta smelt survival and maximum unionized NH3 measured in test beakers. Mean (4-d Survival) = 0.9787573 - 43.849843 NH3; p<0.002.
Summary of Fit RSquare 0.296599 RSquare Adj 0.271478 Root Mean Square Error 0.182014 Mean of Response 0.671333 Observations (or Sum Wgts) 30
Analysis of Variance Source DF Sum of Squares Mean Square F Ratio Model 1 0.3911435 0.391143 11.8066 Error 28 0.9276171 0.033129 Prob > F C. Total 29 1.3187606 0.0019
Parameter Estimates Term Estimate Std Error t Ratio Prob>|t| Intercept 0.9787573 0.095442 10.26 <.0001 Un-ionized NH3 -43.84984 12.76161 -3.44 0.0019
6.2.4.2 Testing Period 2007
Although toxicity to delta smelt larvae was primarily observed at sites where ammonia concentrations were consistently among the highest (sites 711, Hood), data analysis of delta smelt 7-d survival and unionized ammonia concentrations (maximum
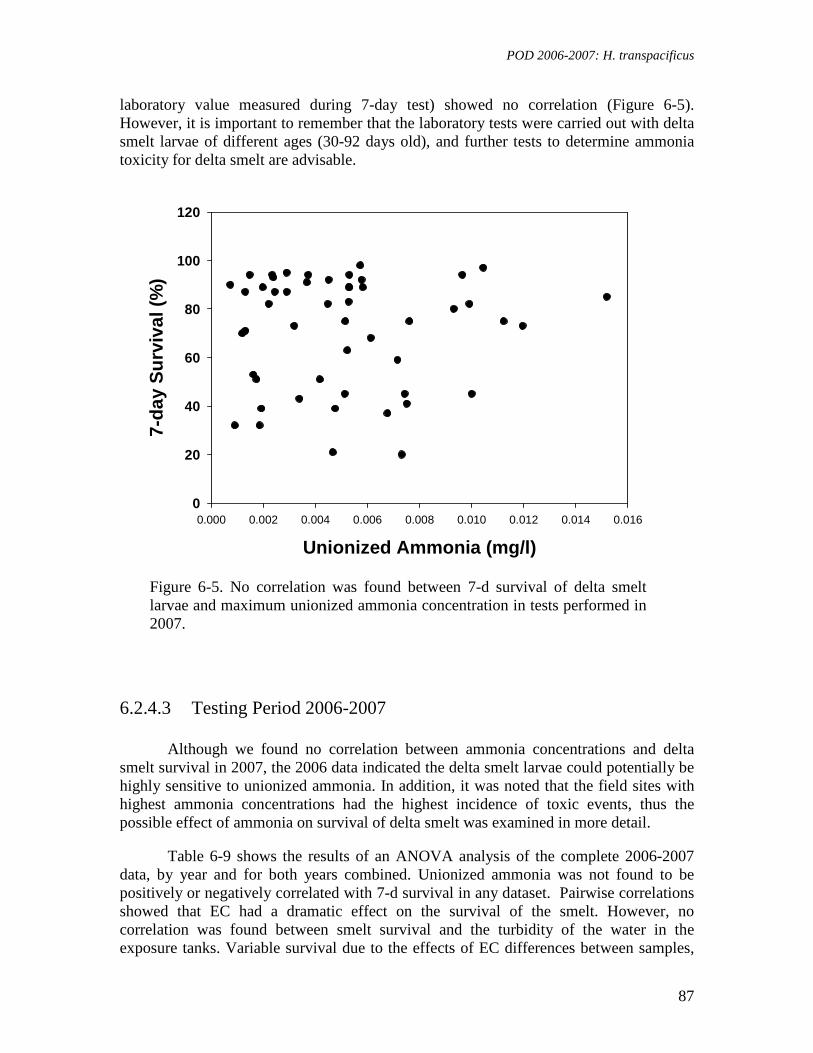
POD 2006-2007: H. transpacificus
87
laboratory value measured during 7-day test) showed no correlation (Figure 6-5). However, it is important to remember that the laboratory tests were carried out with delta smelt larvae of different ages (30-92 days old), and further tests to determine ammonia toxicity for delta smelt are advisable.
Unionized Ammonia (mg/l)
0.000 0.002 0.004 0.006 0.008 0.010 0.012 0.014 0.016
7-d
ay S
urv
ival
(%
)
0
20
40
60
80
100
120
Figure 6-5. No correlation was found between 7-d survival of delta smelt larvae and maximum unionized ammonia concentration in tests performed in 2007.
6.2.4.3 Testing Period 2006-2007
Although we found no correlation between ammonia concentrations and delta smelt survival in 2007, the 2006 data indicated the delta smelt larvae could potentially be highly sensitive to unionized ammonia. In addition, it was noted that the field sites with highest ammonia concentrations had the highest incidence of toxic events, thus the possible effect of ammonia on survival of delta smelt was examined in more detail.
Table 6-9 shows the results of an ANOVA analysis of the complete 2006-2007 data, by year and for both years combined. Unionized ammonia was not found to be positively or negatively correlated with 7-d survival in any dataset. Pairwise correlations showed that EC had a dramatic effect on the survival of the smelt. However, no correlation was found between smelt survival and the turbidity of the water in the exposure tanks. Variable survival due to the effects of EC differences between samples,
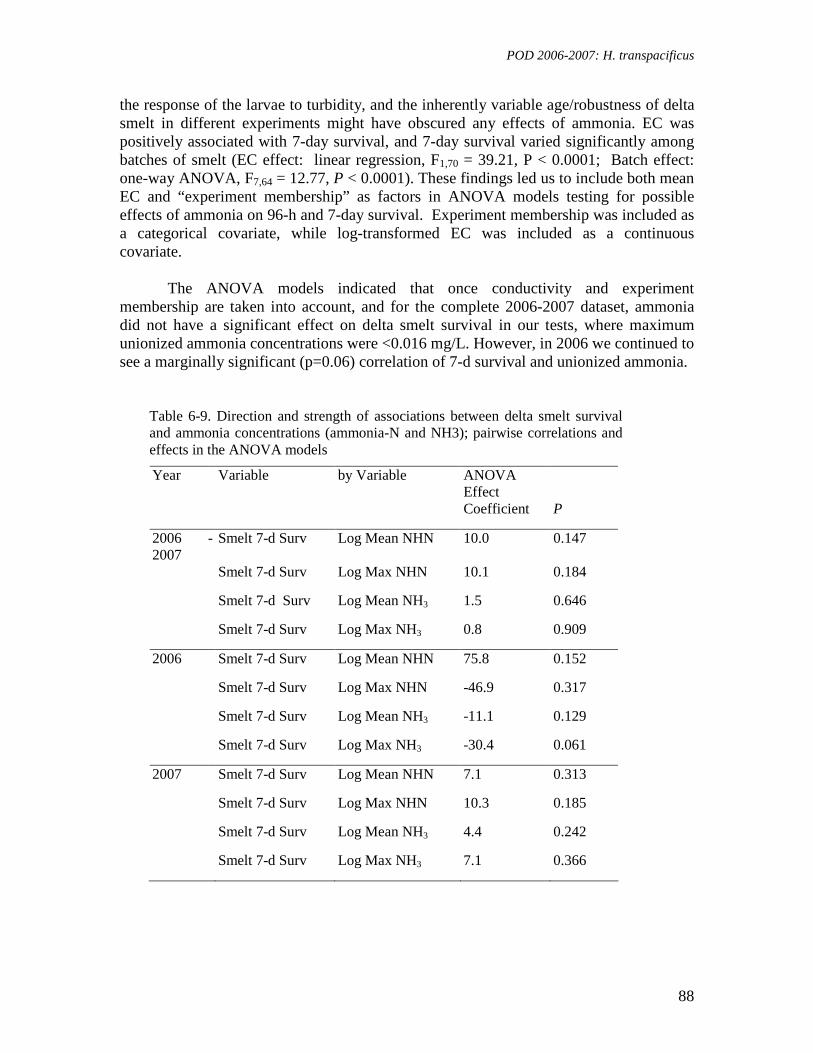
POD 2006-2007: H. transpacificus
88
the response of the larvae to turbidity, and the inherently variable age/robustness of delta smelt in different experiments might have obscured any effects of ammonia. EC was positively associated with 7-day survival, and 7-day survival varied significantly among batches of smelt (EC effect: linear regression, F1,70 = 39.21, P < 0.0001; Batch effect: one-way ANOVA, F7,64 = 12.77, P < 0.0001). These findings led us to include both mean EC and “experiment membership” as factors in ANOVA models testing for possible effects of ammonia on 96-h and 7-day survival. Experiment membership was included as a categorical covariate, while log-transformed EC was included as a continuous covariate.
The ANOVA models indicated that once conductivity and experiment
membership are taken into account, and for the complete 2006-2007 dataset, ammonia did not have a significant effect on delta smelt survival in our tests, where maximum unionized ammonia concentrations were <0.016 mg/L. However, in 2006 we continued to see a marginally significant (p=0.06) correlation of 7-d survival and unionized ammonia.
Table 6-9. Direction and strength of associations between delta smelt survival and ammonia concentrations (ammonia-N and NH3); pairwise correlations and effects in the ANOVA models
Year Variable by Variable ANOVA Effect
Coefficient P
2006 - 2007
Smelt 7-d Surv Log Mean NHN 10.0 0.147
Smelt 7-d Surv Log Max NHN 10.1 0.184
Smelt 7-d Surv Log Mean NH3 1.5 0.646
Smelt 7-d Surv Log Max NH3 0.8 0.909
2006 Smelt 7-d Surv Log Mean NHN 75.8 0.152
Smelt 7-d Surv Log Max NHN -46.9 0.317
Smelt 7-d Surv Log Mean NH3 -11.1 0.129
Smelt 7-d Surv Log Max NH3 -30.4 0.061
2007 Smelt 7-d Surv Log Mean NHN 7.1 0.313
Smelt 7-d Surv Log Max NHN 10.3 0.185
Smelt 7-d Surv Log Mean NH3 4.4 0.242
Smelt 7-d Surv Log Max NH3 7.1 0.366
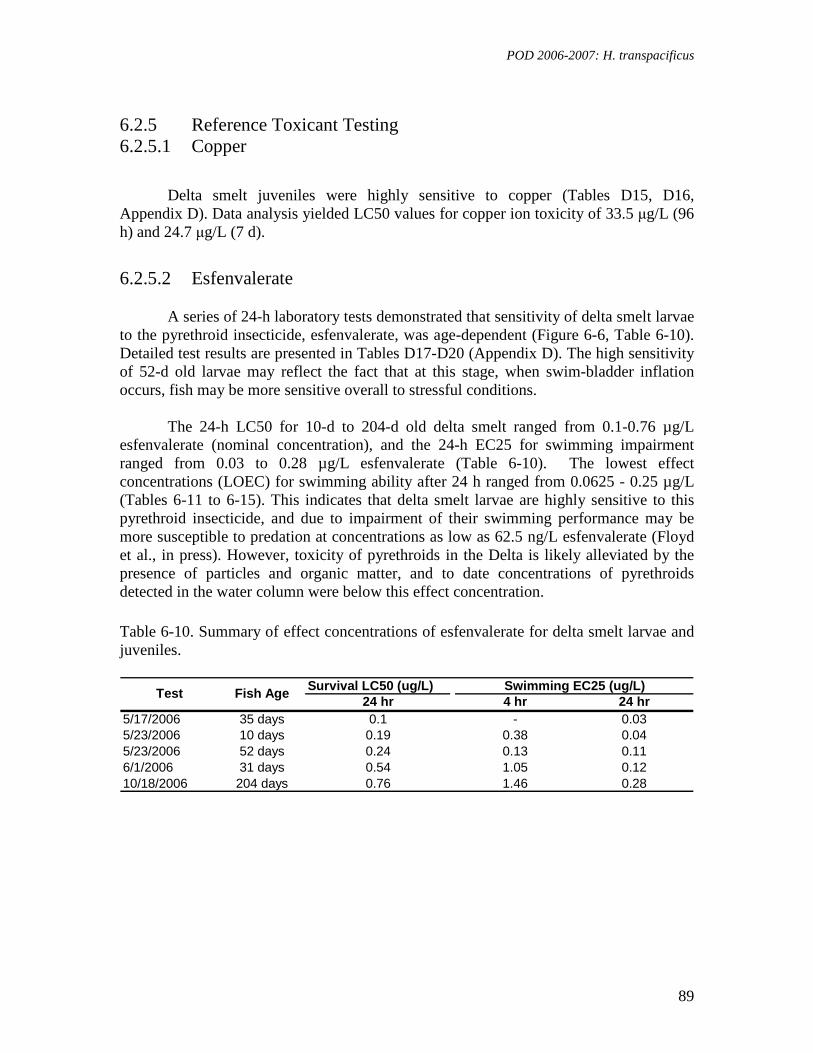
POD 2006-2007: H. transpacificus
89
6.2.5 Reference Toxicant Testing 6.2.5.1 Copper
Delta smelt juveniles were highly sensitive to copper (Tables D15, D16, Appendix D). Data analysis yielded LC50 values for copper ion toxicity of 33.5 µg/L (96 h) and 24.7 µg/L (7 d).
6.2.5.2 Esfenvalerate
A series of 24-h laboratory tests demonstrated that sensitivity of delta smelt larvae
to the pyrethroid insecticide, esfenvalerate, was age-dependent (Figure 6-6, Table 6-10). Detailed test results are presented in Tables D17-D20 (Appendix D). The high sensitivity of 52-d old larvae may reflect the fact that at this stage, when swim-bladder inflation occurs, fish may be more sensitive overall to stressful conditions.
The 24-h LC50 for 10-d to 204-d old delta smelt ranged from 0.1-0.76 µg/L
esfenvalerate (nominal concentration), and the 24-h EC25 for swimming impairment ranged from 0.03 to 0.28 µg/L esfenvalerate (Table 6-10). The lowest effect concentrations (LOEC) for swimming ability after 24 h ranged from 0.0625 - 0.25 µg/L (Tables 6-11 to 6-15). This indicates that delta smelt larvae are highly sensitive to this pyrethroid insecticide, and due to impairment of their swimming performance may be more susceptible to predation at concentrations as low as 62.5 ng/L esfenvalerate (Floyd et al., in press). However, toxicity of pyrethroids in the Delta is likely alleviated by the presence of particles and organic matter, and to date concentrations of pyrethroids detected in the water column were below this effect concentration.
Table 6-10. Summary of effect concentrations of esfenvalerate for delta smelt larvae and juveniles.
Survival LC50 (ug/L)24 hr 4 hr 24 hr
5/17/2006 35 days 0.1 - 0.035/23/2006 10 days 0.19 0.38 0.045/23/2006 52 days 0.24 0.13 0.116/1/2006 31 days 0.54 1.05 0.1210/18/2006 204 days 0.76 1.46 0.28
Swimming EC25 (ug/L)Test Fish Age
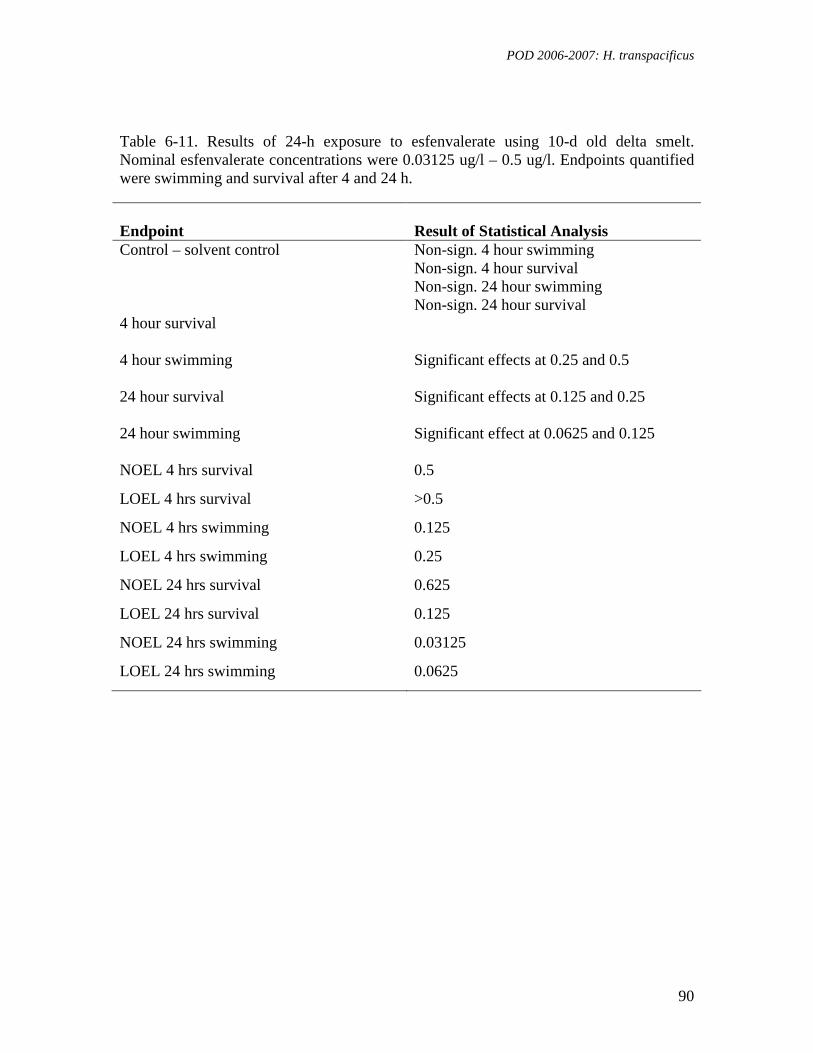
POD 2006-2007: H. transpacificus
90
Table 6-11. Results of 24-h exposure to esfenvalerate using 10-d old delta smelt. Nominal esfenvalerate concentrations were 0.03125 ug/l – 0.5 ug/l. Endpoints quantified were swimming and survival after 4 and 24 h.
Endpoint
Result of Statistical Analysis
Control – solvent control
Non-sign. 4 hour swimming Non-sign. 4 hour survival Non-sign. 24 hour swimming Non-sign. 24 hour survival
4 hour survival
4 hour swimming
Significant effects at 0.25 and 0.5
24 hour survival
Significant effects at 0.125 and 0.25
24 hour swimming
Significant effect at 0.0625 and 0.125
NOEL 4 hrs survival 0.5
LOEL 4 hrs survival >0.5
NOEL 4 hrs swimming 0.125
LOEL 4 hrs swimming 0.25
NOEL 24 hrs survival 0.625
LOEL 24 hrs survival 0.125
NOEL 24 hrs swimming 0.03125
LOEL 24 hrs swimming 0.0625
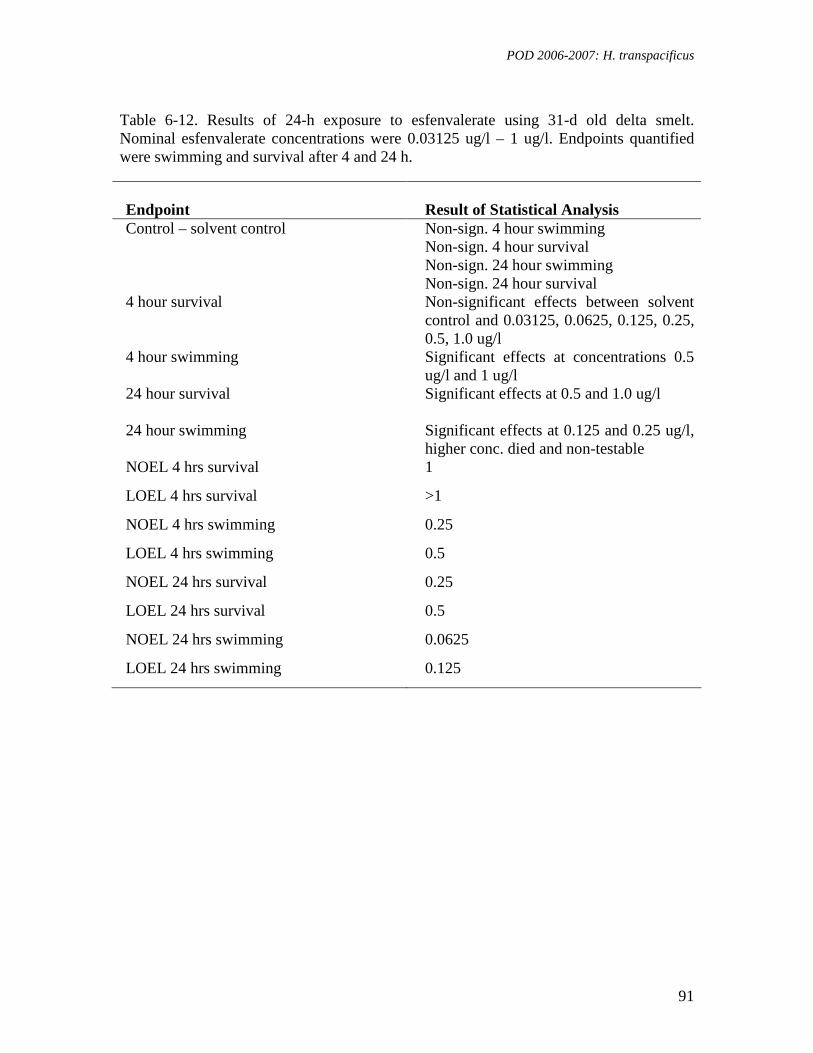
POD 2006-2007: H. transpacificus
91
Table 6-12. Results of 24-h exposure to esfenvalerate using 31-d old delta smelt. Nominal esfenvalerate concentrations were 0.03125 ug/l – 1 ug/l. Endpoints quantified were swimming and survival after 4 and 24 h.
Endpoint
Result of Statistical Analysis
Control – solvent control
Non-sign. 4 hour swimming Non-sign. 4 hour survival Non-sign. 24 hour swimming Non-sign. 24 hour survival
4 hour survival
Non-significant effects between solvent control and 0.03125, 0.0625, 0.125, 0.25, 0.5, 1.0 ug/l
4 hour swimming
Significant effects at concentrations 0.5 ug/l and 1 ug/l
24 hour survival
Significant effects at 0.5 and 1.0 ug/l
24 hour swimming
Significant effects at 0.125 and 0.25 ug/l, higher conc. died and non-testable
NOEL 4 hrs survival 1
LOEL 4 hrs survival >1
NOEL 4 hrs swimming 0.25
LOEL 4 hrs swimming 0.5
NOEL 24 hrs survival 0.25
LOEL 24 hrs survival 0.5
NOEL 24 hrs swimming 0.0625
LOEL 24 hrs swimming 0.125
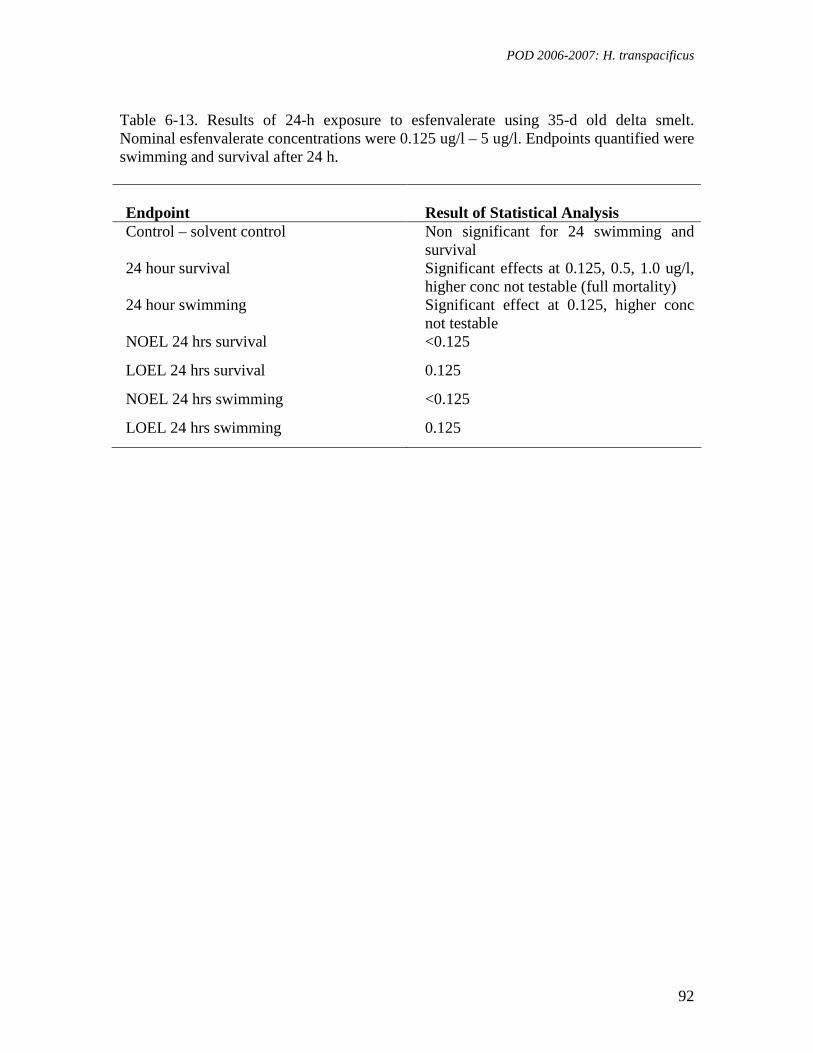
POD 2006-2007: H. transpacificus
92
Table 6-13. Results of 24-h exposure to esfenvalerate using 35-d old delta smelt. Nominal esfenvalerate concentrations were 0.125 ug/l – 5 ug/l. Endpoints quantified were swimming and survival after 24 h.
Endpoint
Result of Statistical Analysis Control – solvent control
Non significant for 24 swimming and survival
24 hour survival
Significant effects at 0.125, 0.5, 1.0 ug/l, higher conc not testable (full mortality)
24 hour swimming
Significant effect at 0.125, higher conc not testable
NOEL 24 hrs survival <0.125
LOEL 24 hrs survival 0.125
NOEL 24 hrs swimming <0.125
LOEL 24 hrs swimming 0.125
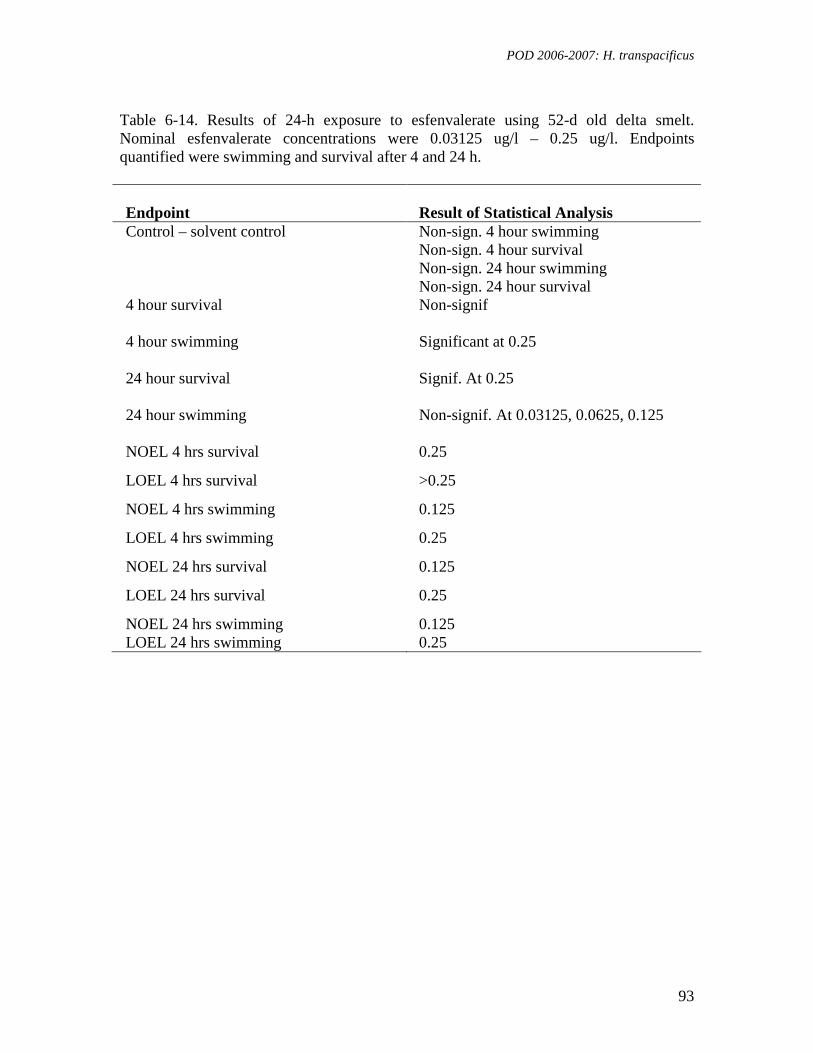
POD 2006-2007: H. transpacificus
93
Table 6-14. Results of 24-h exposure to esfenvalerate using 52-d old delta smelt. Nominal esfenvalerate concentrations were 0.03125 ug/l – 0.25 ug/l. Endpoints quantified were swimming and survival after 4 and 24 h.
Endpoint
Result of Statistical Analysis
Control – solvent control
Non-sign. 4 hour swimming Non-sign. 4 hour survival Non-sign. 24 hour swimming Non-sign. 24 hour survival
4 hour survival
Non-signif
4 hour swimming
Significant at 0.25
24 hour survival
Signif. At 0.25
24 hour swimming
Non-signif. At 0.03125, 0.0625, 0.125
NOEL 4 hrs survival 0.25
LOEL 4 hrs survival >0.25
NOEL 4 hrs swimming 0.125
LOEL 4 hrs swimming 0.25
NOEL 24 hrs survival 0.125
LOEL 24 hrs survival 0.25
NOEL 24 hrs swimming 0.125 LOEL 24 hrs swimming 0.25
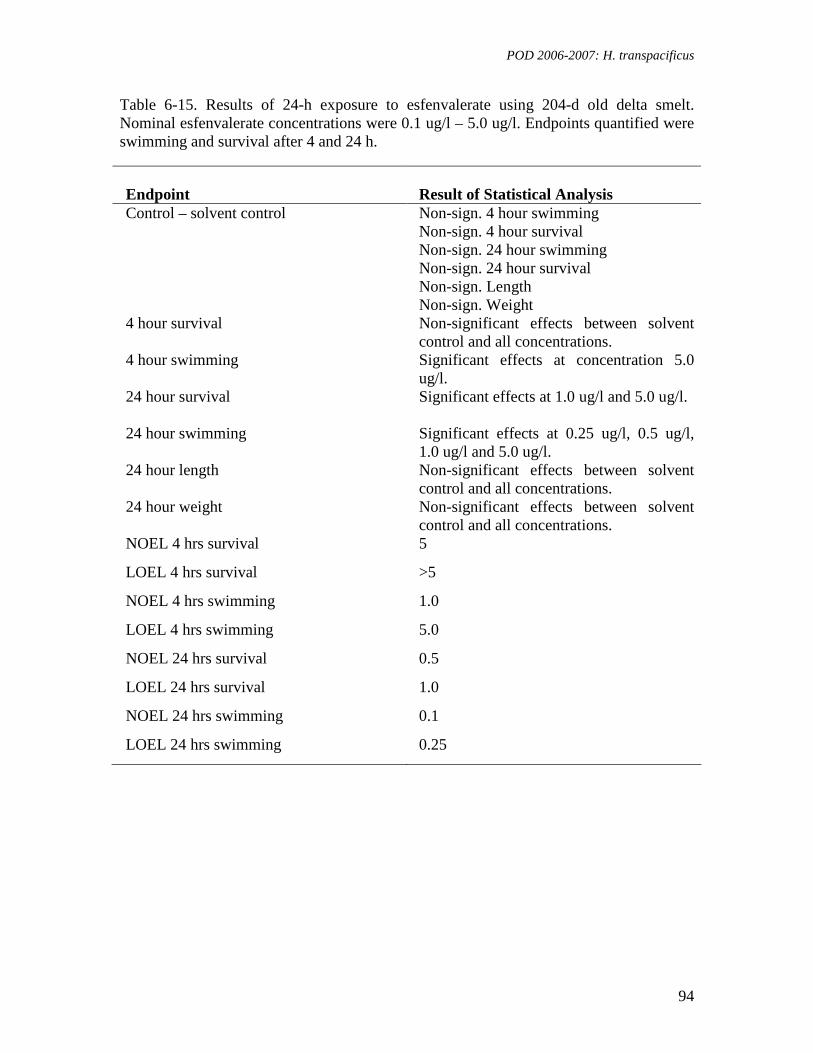
POD 2006-2007: H. transpacificus
94
Table 6-15. Results of 24-h exposure to esfenvalerate using 204-d old delta smelt. Nominal esfenvalerate concentrations were 0.1 ug/l – 5.0 ug/l. Endpoints quantified were swimming and survival after 4 and 24 h.
Endpoint
Result of Statistical Analysis
Control – solvent control
Non-sign. 4 hour swimming Non-sign. 4 hour survival Non-sign. 24 hour swimming Non-sign. 24 hour survival Non-sign. Length Non-sign. Weight
4 hour survival
Non-significant effects between solvent control and all concentrations.
4 hour swimming
Significant effects at concentration 5.0 ug/l.
24 hour survival
Significant effects at 1.0 ug/l and 5.0 ug/l.
24 hour swimming
Significant effects at 0.25 ug/l, 0.5 ug/l, 1.0 ug/l and 5.0 ug/l.
24 hour length Non-significant effects between solvent control and all concentrations.
24 hour weight Non-significant effects between solvent control and all concentrations.
NOEL 4 hrs survival 5
LOEL 4 hrs survival >5
NOEL 4 hrs swimming 1.0
LOEL 4 hrs swimming 5.0
NOEL 24 hrs survival 0.5
LOEL 24 hrs survival 1.0
NOEL 24 hrs swimming 0.1
LOEL 24 hrs swimming 0.25

POD 2006-2007: H. transpacificus
95
6.3 References
Floyd E.Y., Geist J.P., Werner I. (in press). Short-term exposure of the fathead minnow (Pimephales promelas) to a pyrethroid insecticide: Implications for growth, behavior, and predation risk. Environmental Toxicology and Chemistry.
US EPA, 2002. Short-term Methods for Estimating the Chronic Toxicity of Effluents and Receiving Waters to Freshwater Organisms, 4th Ed. USEPA Office of Water, Washington, DC. EPA-821-R-02-013.
.
POD 2006-2007: Sublethal Indicators
96
7. Sublethal Indicators of Contaminant Effects in Delta Species 7.1 Inhibition of Acetyl-Cholinesterase in Brain and Muscle Tissue of Juvenile
Striped Bass and Delta Smelt Exposed to Delta Water Samples and Copper
For organophosphate (OP) and carbamate insecticides, the primary mechanism of toxic action is the inhibition of the enzyme acetylcholinesterase (AChE), which is commonly used as a diagnostic tool for sublethal OP and carbamate exposure and effect. Studies in fish have shown that brain AChE inhibition in excess of 70% is strongly correlated with imminent mortality (Fulton and Key, 2001) however fish are far less sensitive to these groups of insecticides than invertebrates such as crustaceans and insects. For example, Wheelock et al. (2005) report that exposure to 7.3 µg/L CP, a concentration that caused 20% mortality in juvenile Chinook salmon, severely inhibited AChE activity in brain (by 85%) and muscle (by 92%). While all fish survived an exposure to 1.2 µg/L CP, AChE activity in the brain was reduced by 8%. Monitoring studies performed in the 1990s linked toxicity to aquatic life in the Sacramento-San Joaquin Delta and the San Joaquin River basin to OP insecticides (Werner et al., 2000; Domagalski et al., 2000; Dubrovsky et al., 1998), and CP was among the most commonly detected toxicants (Werner et al., 2000) with concentrations of ≤0.52 µg/L in the Delta. Elsewhere, concentrations of up to 3.2 µg/L CP have been reported (Salinas River, CA; Hunt et al., 2003). For this study, we quantified AChE activity in brain and muscle of juvenile striped bass and delta smelt exposed to water samples from the Delta or to different concentrations of copper. 7.1.1 Methods
Juvenile delta smelt and striped bass were exposed to Delta water samples, as well as a range of copper concentrations in 2005 (see Chapters 5 and 6), and tissues were dissected, flash-frozen and stored at -80oC. Fish brains were removed entirely, whereas muscle samples consisted of one piece of epaxial white muscle taken from behind the head. Each sample was weighed, diluted 1:10 (mg:l) in 0.1M sodium phosphate buffer (pH 8.0) with 0.5% Triton X-100. Tissues were homogenized for 1 min using a glass douncer on ice. Homogenates were centrifuged at 4oC for 10 min at 7000×g to remove large particulate material. The supernatant fraction was transferred to a separate tube and the total protein concentration was determined with the Biorad DC Protein Assay (Bio-Rad Laboratories, Hercules, CA) using methods of Lowry et al. (1951). For the AChE assay, 0.1M sodium phosphate buffer (pH 8.0) with 0.5% Triton X-100 was added to the supernatant fractions to produce final dilutions of 1:500 (mg:L) for muscle samples and 1:200 (mg:_l) for brain samples. Assay optimization was performed with brain and muscle tissue from unexposed juvenile fish. Acetylthiocholine iodide (AtChI) concentrations between 0.1 and 5mM were tested for optimal substrate concentration, and samples were incubated with tetraisopropylpyrophosphoramide (iso-OMPA, a selectiveAChE inhibitor) to measure butyrylcholinesterase-mediated substrate hydrolysis. Results showed negligible butyryl-cholinesterase activity in muscle tissue, therefore subsequent assays were performed without the AChE inhibitor. AChE activity in brain and muscle was analyzed using modified methods of Ellman et al. (1961). AChE activity for each sample was determined by adding 30l of diluted supernatant to a microplate well (Costar 96 well EIA/RIA Plate; Corning Inc., New York, NY)

POD 2006-2007: Sublethal Indicators
97
containing 250 l of 0.1M sodium phosphate buffer (pH 8.0), 10µl of 5,5-dithiobis-2-nitrobenzoic acid (DTNB, 10.3 mM), and 30 µL of AtChI (21.4 mM). Final assay concentrations were 0.32 mM DTNB and 2mM AtChI. Final protein concentrations ranged from 10.8 to 17.1µg/L for muscle and 7.0 to 10.7µg/L for brain. All assays were performed in triplicate. Absorbance at 412 nm was measured at 2 min intervals for 10 min at 25 ◦C with an automated microplate reader (Model EL3401; Bio-Tek Instruments, Winooski, VT) and all samples were corrected for background hydrolysis. AChE activity was calculated as mol/min/g wet weight, and then normalized to the amount of protein in the homogenate (mol/min/mg protein). 7.1.2 Results 7.1.2.1 Striped Bass
Ambient Samples: Exposure (7 d) of juvenile striped bass to water samples collected from sites 915 (Old River), 711 (Sacramento River at Rio Vista), 609 (Montezuma Slough) and 340 (Napa River) on July 27/28, 2005, did not affect AChE activity in brain tissue of striped bass (Table 7-1). These fish also showed 100% survival and no significant effect on body weight and fork length in all treatments.
Table 7-1. AChE activity in brain tissue of juvenile striped bass (3 months old) exposed to water samples collected on July 27/28, 2005 at CDFG stations 340, 711, 609 and 915. SD=standard deviation of the mean.
Treatment
Mean Activity (µmol/min/g wet weight)
SD
n
0-Time Control 0.168 0.065 5 Control 0.199 0.022 10 Site 915 0.172 0.060 10 Site 711 0.170 0.086 10 Site 609 0.202 0.081 10 Site 340 0.195 0.045 10
Copper: The highest copper concentration (200 ppb) where 100% of the fish survived the exposure did not have an effect on AChE activity in brain tissue of exposed fish (Table 7-2). The LC50 values determined for Cu+ were 348 µg/L (96 h) and 301 µg/L (7 d).
Table 7-2. AChE activity in brain tissue of juvenile striped bass (3 months old) exposed to different copper concentrations for 7 days. SD=standard deviation of the mean.
Treatment
Mean Activity (umol/min/g wet weight)
SD
n
Control 0.350 0.048 10 200 ppb Cu+ 0.374 0.053 10

POD 2006-2007: Sublethal Indicators
98
7.1.2.2 Delta Smelt
Ambient Samples: Water samples collected from sites 915 (Old River), 711 (Sacramento River at Rio Vista), 609 (Montezuma Slough) and 340 (Napa River) on August 30/31, 2005, did not affect AChE activity in brain tissue of delta smelt juveniles (Table 7-3). Fish in control water had 95% +/- 2.9% survival, and survival was equal or better at sites 711, 910 and 915. Survival of fish exposed to water from site 340 was slightly reduced to 85% +/- 2.9%, but the difference to control was not statistically significant. Fork length and wet weight were similar in all treatments.
Table 7-3. AChE activity in brain tissue of juvenile delta smelt (90-days old) exposed to water samples collected on August 30/31, 2005 from CDFG stations 340, 711, 910 and 915. SD=standard deviation of the mean.
Treatment
Mean Activity (umol/min/g wet weight)
SD
n
Control 0.227 0.063 8 Site 915 0.386 0.110 8 Site 711 0.291 0.093 8 Site 609 0.310 0.029 8 Site 340 0.276 0.144 7
Copper: Copper did not affect AChE activity at sublethal Cu+ concentrations, however, the 50 ppb Cu+, which was above the LC50 determined for juvenile delta smelt, significantly reduced enzyme activity in the brain (Table 7-4) but not in muscle tissue (Table 7-5).
Table 7-4. AChE activity in brain tissue of juvenile delta smelt (3 months old) exposed to different copper concentrations for 7 days. The LC50 values for copper ion toxicity were 33.5 µg/L (96 h) and 24.7 µg/L (7 d). SD=standard deviation of the mean.
Treatment
Mean Activity (umol/min/g wet weight)
SD
n
0-Time Control 0.228 0.092 5 Control 0.403 0.131 8 10 ppb Cu 0.388 0.124 8 25 ppb Cu 0.305 0.164 8 50 ppb Cu 0.093 0.103 5

POD 2006-2007: Sublethal Indicators
99
Table 7-5. AChE activity in muscle tissue of juvenile delta smelt (3 months old) exposed to different copper concentrations for 7 days. The LC50 values for copper ion toxicity were 33.5 µg/L (96 h) and 24.7 µg/L (7 d). SD=standard deviation of the mean.
Treatment
Mean Activity (umol/min/g wet weight)
SD
n
0-Time Control 0.333 0.127 5 Control 0.479 0.162 8 10 ppb Cu 0.532 0.172 10 25 ppb Cu 0.479 0.110 10 50 ppb Cu 0.452 0.126 5
7.2 Expression of Stress response Genes in Striped Bass 7.2.1 Comparisons of tissue-specific transcription of stress response genes with
whole animal endpoints of adverse effect in striped bass (Morone saxatilis) following treatment with copper and esfenvalerate.
Juergen Geist, Inge Werner, Kai J. Eder, Christian M. Leutenegger (2007); published in Aquatic Toxicology 85:28–39.
See Appendix G.
7.2.2 Tissue-Specific Expression of Stress response Genes in Striped Bass
Exposed to Water Samples from the Sacramento-San Joaquin Delta 7.2.2.1 Methods
Fish exposures: This 7-day chronic toxicity test measured the effects of Delta water
samples collected on August 22/23, 2006, from CDFG stations 340, 508, 609, 711, 910 and 915 on the survival and growth of juvenile M. saxatilis. Juvenile striped bass (approx. 80 d old, fork length: 5.3 – 8.0 cm) were obtained from David Ostrach, UC Davis. These fish were reared in well water at the UCD CABA facility. Well water was also used as acclimation and control water in the experiment. Laboratory water conditions were adjusted to match the conductivity (890 +/- 20 µS/cm) in which the striped bass were maintained and fish were additionally acclimated to experimental 10-gal aquaria (30 fish/aquarium) for 24 h before tests were initiated and then loaded into experimental tanks 24 hours prior to testing. Each experimental treatment was comprised of five replicate tanks containing five animals each. Each tank contained 5L of water at 20° C and was aerated throughout the experiment. Previous experience in fish exposures
POD 2006-2007: Sublethal Indicators
100
has shown that stress due to fish transport, maintenance of fish in the laboratory and practicability criteria for carrying out toxicological tests are matched well by this procedure. Tests were initiated the next day by replacing 80% of the water with ambient water samples. Experiments were conducted using a light:dark cycle of 16h:8h. During the 7-day copper exposure, fish were fed daily (Silver Cup 2.0 mm pellets). Approximately 80 percent of the water in each replicate was renewed on days two, four and six. On days one, three and five, the numbers of live, dead, and missing fish were scored for each replicate. Water temperature, pH, and dissolved oxygen (DO) were measured daily. Ammonia nitrogen (NH3-N) was measured prior to each water renewal. At test termination, temperature, pH, DO, electric conductivity (EC), and ammonia were measured for each treatment. Overall, no significant deviations between measured water parameters among treatments or replicates were detected. The number of dead fish was counted at the end of the experiment (day 7) and surviving fish were sacrificed using an overdose of the anaesthetic MS-222 (Sigma, St Louis, MO, USA) in icewater to minimize degradation of RNA. Fork length (to nearest mm) and weight (to nearest 0.1 g) of each fish were recorded. No significant differences in length or weight were detected between individual treatment groups of the exposure experiments. Surviving individuals were sampled for subsequent analyses of sublethal biomarkers. Fifteen fish per treatment (three fish per replicate) were dissected immediately after individuals were sacrificed and measured. The entire gill apparatus, brain, liver, spleen, anterior kidney and two pieces of epaxial muscle from the left flank (< 30 mg) were removed, placed in sterile, RNase and DNase free 1.5 mL Eppendorf vials, and immediately snap-frozen in liquid nitrogen. Samples were stored at –80°C until RNA extraction and cDNA synthesis.
Quantitative real-time PCR: Frozen tissue samples (approximately 10 mg of liver,
muscle and gill, brain, 9 mg total spleen and four mg total anterior kidney) were transferred to 1.5 mL collection tubes (RNeasy Mini Kit, Qiagen Inc., Valencia, CA), re-immersed in liquid nitrogen and ground to a fine powder with a sterile pestle. Subsequently, 350 µL of RNeasy lysis buffer (RLT, RNeasy Mini Kit, Qiagen Inc.) were added, and lysates were homogenized by pestle and by passing them through a pipette tip approximately 10 times. After incubation for three minutes at room temperature, the RNA was extracted according to the manufacturer´s recommendations (RNeasy Mini Kit, Qiagen Inc.). Thereafter, 20 µL of each freshly extracted nucleic acid sample was digested with 10 U of RNase free DNase I (Roche, Mannheim, Germany) for 15 min at 37°C to remove genomic DNA. DNase digested RNA was quality controlled for absence of genomic DNA contamination. All samples had a minimal difference of 7 CT values between the cDNA and digested total RNA (tRNA), indicating that remaining gDNA contamination in the tRNA was 1% or less. Complementary DNA (cDNA) was synthesized using 100 units of SuperScript III (Invitrogen, Carlsbad, CA, USA), 600 ng random hexadeoxyribonucleotide (pd(N)6) primers (random hexamer primer), 10 U RNaseOut (RNase inhibitor), and 1 mM dNTPs (all Invitrogen, Carlsbad, CA, USA) in a final volume of 40 µL. The reverse transcription reaction proceeded for 50 min at 50°C. After addition of 60 µL of water, the reaction was terminated by heating for five min to 95°C and cooling on ice.
A suite of real-time TaqMan PCR systems for proteotoxicity (HSP70, HSP90), phase I
detoxification mechanism (CYP1A1), metal-binding (metallothionein), endocrine disruption (vitellogenin), immune-system functioning and pathogen-defense (TGF-B, Mx-protein, nRAMP) were used based on Geist et al. (2007) for studying sublethal stress response at the transcriptome
POD 2006-2007: Sublethal Indicators
101
level. L9 was quantified as internal reference. Real-time TaqMan PCR mixes contained 400 nM of each of two primers and 80 nM of the appropriate TaqMan probe. We used TaqMan Universal PCR Mastermix (Applied Biosystems, Foster City, CA, USA) containing 10 mM Tris-HCl (pH 8.3), 50 mM KCl, 5 mM MgCl2, 2.5 mM deoxynucleotide triphosphates, 0.625 U AmpliTaq Gold DNA polymerase per reaction, 0.25 U AmpErase UNG per reaction and 5 µL of the diluted cDNA sample in a final volume of 12 µL. The samples were placed in 384 well plates and cDNA was amplified in an automated fluorometer (ABI PRISM 7900 Sequence Detection System, Applied Biosystems). Amplification conditions were two min at 50°C, 10 min at 95°C, 40 cycles of 15 s at 95°C and 60 s at 60°C. Fluorescence of samples was measured every 7 s and signals were considered positive if fluorescence intensity exceeded 10 times the standard deviation of the baseline fluorescence (threshold cycle, CT). SDS 2.2.1 software (Applied Biosystems) was used to quantify transcription.
Relative quantification of stress response gene transcription: The comparative CT
method was applied to quantify gene transcription of investigated stress response genes (User Bulletin #2, Applied Biosystems). Values are reported as relative transcription or the n-fold difference relative to a calibrator cDNA (i.e. average target gene transcription of control fish). Three housekeeping genes (18S, L9, GAPDH) were tested and the one revealing smallest standard deviation and most stable transcription levels over all treatments (L9) was used to normalize the target gene signals (∆CT) for the differences in the amount of nucleic acid added to each reaction and the efficiency of the reverse transcriptase step. The ∆CT for each experimental sample from the exposed fish was subtracted from the ∆CT of the calibrator, the mean target gene signal of control fish. Finally, the linear amount of target molecules relative to the calibrator was calculated by 2-∆∆Ct. Therefore, all stress response gene transcriptions are expressed as an n-fold difference relative to the calibrator. For comparisons of basic linearized transcription values between tissues of all pooled control fish, muscle tissue revealed lowest transcription levels in all stress response genes and average transcription of each stress response gene in muscle was thus used as a calibrator for other tissues.
Statistical Analyses: Gene transcription data were first tested for normality and equality
of variances. Since more than the randomly expected number of data sets was either not normally distributed or failed equality of variance tests, we generally used non-parametric methods for comparisons between treatments and tissues. Kruskal-Wallis One Way Analysis of Variance on Ranks (K-W ANOVA) was used to detect differences in linearized mean responses between treatments and tissues. In case of significance (p < 0.05), we tested for (i) differences in gene transcription between control and treatment groups and (ii) differences in gene transcription between the tissue with the weakest transcription level and other tissues by using non-parametric Mann-Whitney U-test. For comparisons between tissue types, Bonferroni corrections were applied to adjust p-values for multiple comparisons. We decided to use a conservative and non-parametric statistical approach throughout the dataset for simplicity and in order to reduce the number of false-positives. It should be noted, however, that the robustness of data interpretation is strengthened by the fact that these results were very similar to those obtained by using parametric tests (One Way Analysis of Variance, ANOVA and Dunn´s or Tukey´s Post-Hoc tests) with the limitation that some comparisons could not have been carried out under the requirements for equality of variances and normal distribution. Statistical analyses were carried out using the statistical programs Statistica 6.0 (StatSoft Inc., Tulsa, OK, USA), SPSS 7.0 and

POD 2006-2007: Sublethal Indicators
102
SigmaStat 2.0 (SPSS, Inc., Chicago, Illinois).
7.2.2.2 Results
Results of quantitative PCR analysis for each tissue analyzed are shown in Table 7-6. While temperature (20oC), pH (7.17-7.88), dissolve oxygen concentration (7.9-9.2 mg/L) during the 7-d test varied little between treatments, but the EC/salinity showed a wide range of values across sampling sites. Thus, results obtained for site 340 with an EC of 16,070 µS/cm at 20oC need to be compared to the “high-EC control” (EC=18,800 µS/cm at 20oC). Sites 508 and 609 had ECs of 3007 and 4887 µS/cm at 20oC, respectively, and were thus compared to both control and high-EC control. Sites 711, 910 and 915 were compared to the control only.
Table 7-6: Changes in stress-response gene expressions in the liver, brain, kidney, gills, spleen and muscle of the striped bass (Morone saxatilis) exposed to Delta water samples collected on August 22/23, 2006. Results are presented as n-fold linear differences to ribosomal-L9 control gene expression with respective standard errors (S.E.). Boxed data containing the symbols *, ** and *** refer to significant differences to High EC (black) and Reference (blue) controls, at p-values of <0.05, <0.01 and <0.001 respectively; Kruskal-Wallis analysis of variance (GraphPadPrism 5.01). Outliers were removed using Grubb’s Test; extreme studentized deviate methods.
LIVER
Hig
h EC
Con
trol
(Ref
)
508
609
915
910
711
340
HSP 70 Mean 2.12 0.07 2.18 0.30 0.28 3.03 -1.19 3.06S.E. 0.76 0.63 1.02 0.16 0.65 1.07 0.47 1.25
HSP 90 Mean 1.27 -0.11 1.31 0.93 0.35 3.46 -0.90 3.60S.E. 0.67 0.71 0.89 0.59 0.65 1.36 0.53 1.23
CYP 1a Mean 5.84 -0.04 2.69 2.22 1.51 6.88 0.15 9.31S.E. 2.12 0.69 1.53 0.88 0.83 2.07 0.50 2.58
TGF-B Mean -8.72 -0.74 -2.75 1.10 0.85 -5.68 -0.03 2.51S.E. 8.87 1.93 1.49 0.31 0.57 3.66 0.41 0.51
MT Mean 3.27 0.12 2.39 0.90 3.47 4.36 1.85 2.70S.E. 1.15 0.94 2.12 0.25 0.75 1.47 0.53 1.43
MX Mean 0.76 0.52 -0.36 1.22 6.88 14.10 0.76 24.74S.E. 3.60 1.55 1.34 0.32 3.91 6.04 1.89 8.85
nRAMP Mean -9.14 -0.26 0.86 3.29 4.41 -6.40 1.69 2.40S.E. 3.67 1.13 1.11 0.22 1.77 5.33 0.50 1.39
Vtg Mean -156.26 -66.82 -276.28 -326.20 -130.42 -76.39 -252.41 -169.14S.E. 47.22 206.53 107.04 6.88 37.24 19.50 35.81 45.68
***
**
*
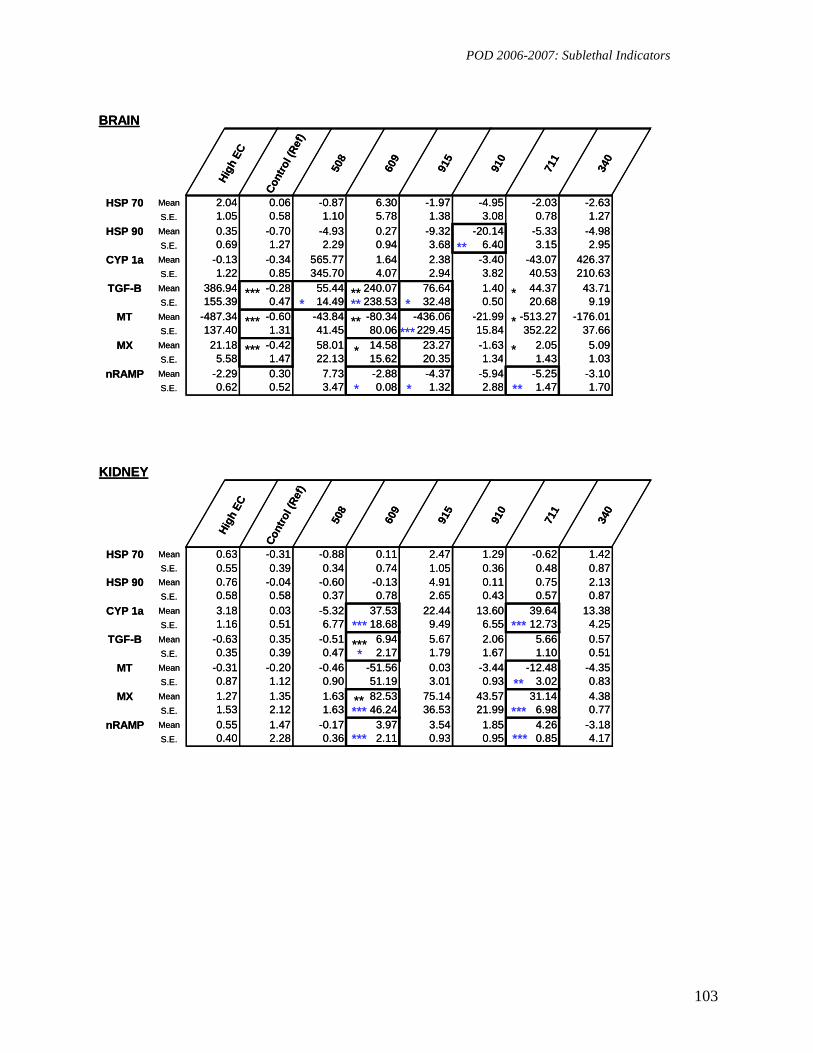
POD 2006-2007: Sublethal Indicators
103
BRAIN
Hig
h EC
Con
trol
(Ref
)
508
609
915
910
711
340
HSP 70 Mean 2.04 0.06 -0.87 6.30 -1.97 -4.95 -2.03 -2.63S.E. 1.05 0.58 1.10 5.78 1.38 3.08 0.78 1.27
HSP 90 Mean 0.35 -0.70 -4.93 0.27 -9.32 -20.14 -5.33 -4.98S.E. 0.69 1.27 2.29 0.94 3.68 6.40 3.15 2.95
CYP 1a Mean -0.13 -0.34 565.77 1.64 2.38 -3.40 -43.07 426.37S.E. 1.22 0.85 345.70 4.07 2.94 3.82 40.53 210.63
TGF-B Mean 386.94 -0.28 55.44 240.07 76.64 1.40 44.37 43.71S.E. 155.39 0.47 14.49 238.53 32.48 0.50 20.68 9.19
MT Mean -487.34 -0.60 -43.84 -80.34 -436.06 -21.99 -513.27 -176.01S.E. 137.40 1.31 41.45 80.06 229.45 15.84 352.22 37.66
MX Mean 21.18 -0.42 58.01 14.58 23.27 -1.63 2.05 5.09S.E. 5.58 1.47 22.13 15.62 20.35 1.34 1.43 1.03
nRAMP Mean -2.29 0.30 7.73 -2.88 -4.37 -5.94 -5.25 -3.10S.E. 0.62 0.52 3.47 0.08 1.32 2.88 1.47 1.70
***
***
***
**
**
***
*
*
*
***
**
**
*
*
*
*
KIDNEY
Hig
h EC
Con
trol
(Ref
)
508
609
915
910
711
340
HSP 70 Mean 0.63 -0.31 -0.88 0.11 2.47 1.29 -0.62 1.42S.E. 0.55 0.39 0.34 0.74 1.05 0.36 0.48 0.87
HSP 90 Mean 0.76 -0.04 -0.60 -0.13 4.91 0.11 0.75 2.13S.E. 0.58 0.58 0.37 0.78 2.65 0.43 0.57 0.87
CYP 1a Mean 3.18 0.03 -5.32 37.53 22.44 13.60 39.64 13.38S.E. 1.16 0.51 6.77 18.68 9.49 6.55 12.73 4.25
TGF-B Mean -0.63 0.35 -0.51 6.94 5.67 2.06 5.66 0.57S.E. 0.35 0.39 0.47 2.17 1.79 1.67 1.10 0.51
MT Mean -0.31 -0.20 -0.46 -51.56 0.03 -3.44 -12.48 -4.35S.E. 0.87 1.12 0.90 51.19 3.01 0.93 3.02 0.83
MX Mean 1.27 1.35 1.63 82.53 75.14 43.57 31.14 4.38S.E. 1.53 2.12 1.63 46.24 36.53 21.99 6.98 0.77
nRAMP Mean 0.55 1.47 -0.17 3.97 3.54 1.85 4.26 -3.18S.E. 0.40 2.28 0.36 2.11 0.93 0.95 0.85 4.17
***
***
***
*
***
**
***
***
***
**
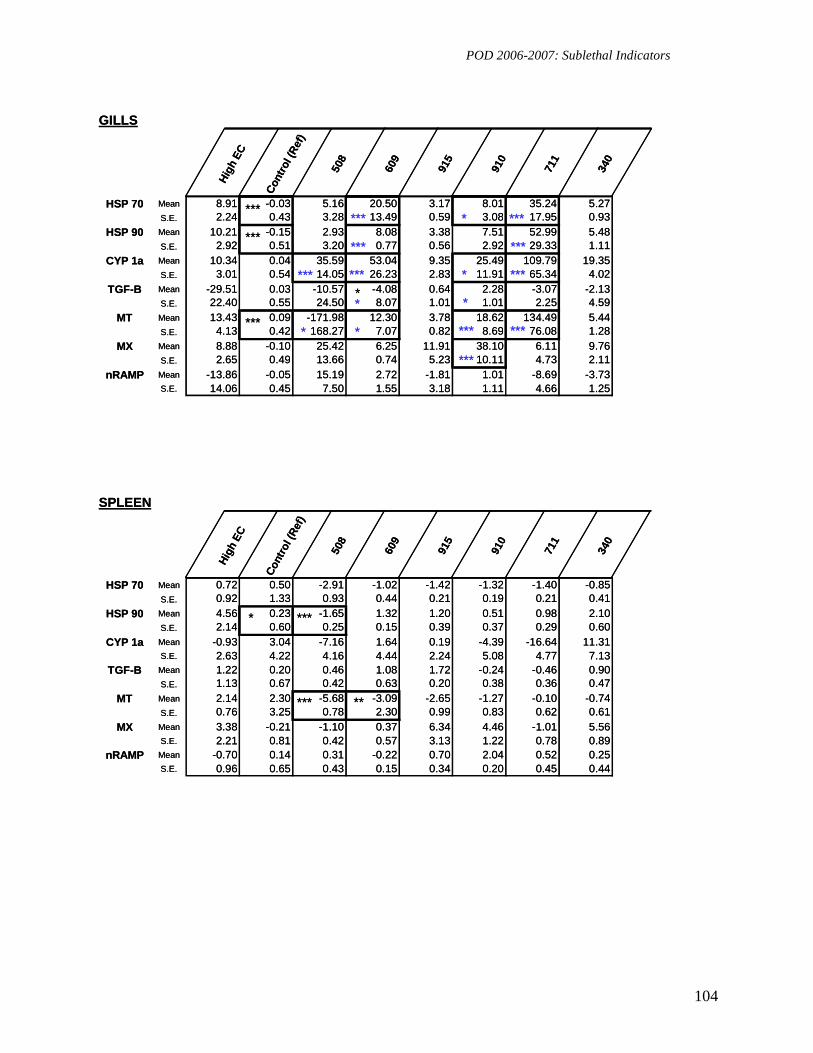
POD 2006-2007: Sublethal Indicators
104
GILLS
Hig
h EC
Con
trol
(Ref
)
508
609
915
910
711
340
HSP 70 Mean 8.91 -0.03 5.16 20.50 3.17 8.01 35.24 5.27S.E. 2.24 0.43 3.28 13.49 0.59 3.08 17.95 0.93
HSP 90 Mean 10.21 -0.15 2.93 8.08 3.38 7.51 52.99 5.48S.E. 2.92 0.51 3.20 0.77 0.56 2.92 29.33 1.11
CYP 1a Mean 10.34 0.04 35.59 53.04 9.35 25.49 109.79 19.35S.E. 3.01 0.54 14.05 26.23 2.83 11.91 65.34 4.02
TGF-B Mean -29.51 0.03 -10.57 -4.08 0.64 2.28 -3.07 -2.13S.E. 22.40 0.55 24.50 8.07 1.01 1.01 2.25 4.59
MT Mean 13.43 0.09 -171.98 12.30 3.78 18.62 134.49 5.44S.E. 4.13 0.42 168.27 7.07 0.82 8.69 76.08 1.28
MX Mean 8.88 -0.10 25.42 6.25 11.91 38.10 6.11 9.76S.E. 2.65 0.49 13.66 0.74 5.23 10.11 4.73 2.11
nRAMP Mean -13.86 -0.05 15.19 2.72 -1.81 1.01 -8.69 -3.73S.E. 14.06 0.45 7.50 1.55 3.18 1.11 4.66 1.25
***
***
***
***
*
***
***
***
*
*
*
*
*
*
***
***
***
***
***
***
SPLEEN
Hig
h EC
Con
trol
(Ref
)
508
609
915
910
711
340
HSP 70 Mean 0.72 0.50 -2.91 -1.02 -1.42 -1.32 -1.40 -0.85S.E. 0.92 1.33 0.93 0.44 0.21 0.19 0.21 0.41
HSP 90 Mean 4.56 0.23 -1.65 1.32 1.20 0.51 0.98 2.10S.E. 2.14 0.60 0.25 0.15 0.39 0.37 0.29 0.60
CYP 1a Mean -0.93 3.04 -7.16 1.64 0.19 -4.39 -16.64 11.31S.E. 2.63 4.22 4.16 4.44 2.24 5.08 4.77 7.13
TGF-B Mean 1.22 0.20 0.46 1.08 1.72 -0.24 -0.46 0.90S.E. 1.13 0.67 0.42 0.63 0.20 0.38 0.36 0.47
MT Mean 2.14 2.30 -5.68 -3.09 -2.65 -1.27 -0.10 -0.74S.E. 0.76 3.25 0.78 2.30 0.99 0.83 0.62 0.61
MX Mean 3.38 -0.21 -1.10 0.37 6.34 4.46 -1.01 5.56S.E. 2.21 0.81 0.42 0.57 3.13 1.22 0.78 0.89
nRAMP Mean -0.70 0.14 0.31 -0.22 0.70 2.04 0.52 0.25S.E. 0.96 0.65 0.43 0.15 0.34 0.20 0.45 0.44
* ***
*** **
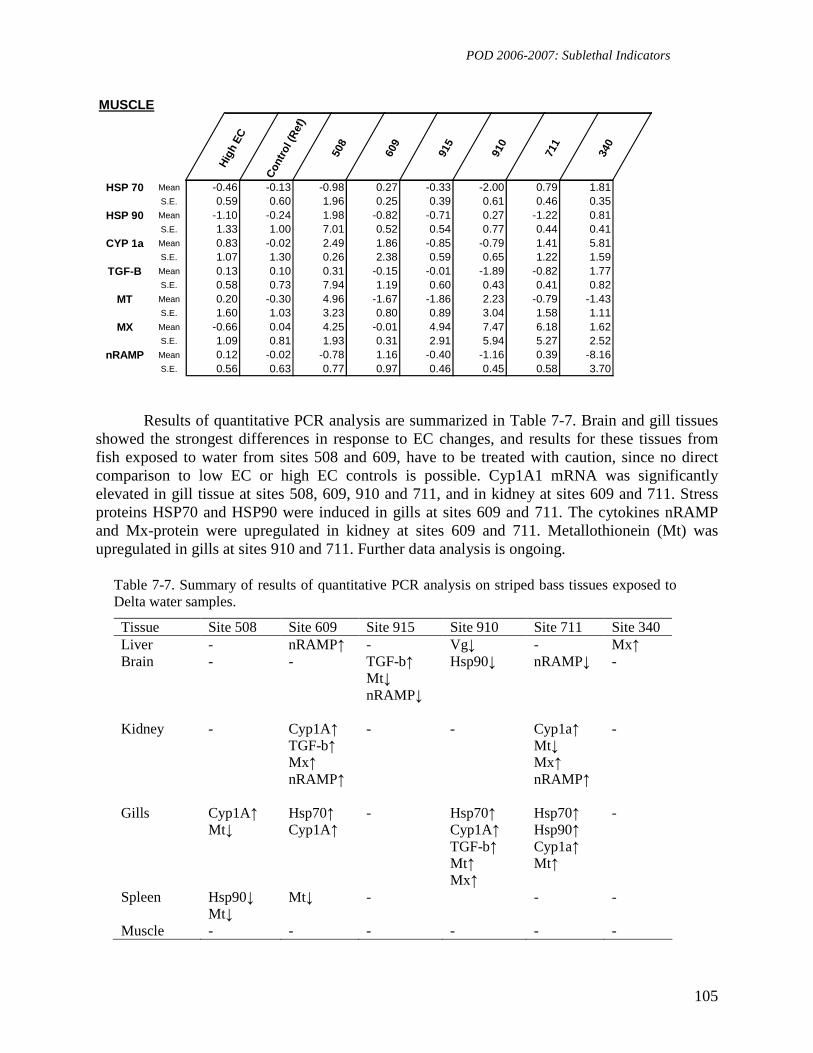
POD 2006-2007: Sublethal Indicators
105
Results of quantitative PCR analysis are summarized in Table 7-7. Brain and gill tissues showed the strongest differences in response to EC changes, and results for these tissues from fish exposed to water from sites 508 and 609, have to be treated with caution, since no direct comparison to low EC or high EC controls is possible. Cyp1A1 mRNA was significantly elevated in gill tissue at sites 508, 609, 910 and 711, and in kidney at sites 609 and 711. Stress proteins HSP70 and HSP90 were induced in gills at sites 609 and 711. The cytokines nRAMP and Mx-protein were upregulated in kidney at sites 609 and 711. Metallothionein (Mt) was upregulated in gills at sites 910 and 711. Further data analysis is ongoing.
Table 7-7. Summary of results of quantitative PCR analysis on striped bass tissues exposed to Delta water samples.
Tissue Site 508 Site 609 Site 915 Site 910 Site 711 Site 340 Liver - nRAMP↑ - Vg↓ - Mx↑ Brain - - TGF-b↑
Mt↓ nRAMP↓
Hsp90↓ nRAMP↓ -
Kidney - Cyp1A↑ TGF-b↑ Mx↑ nRAMP↑
- - Cyp1a↑ Mt↓ Mx↑ nRAMP↑
-
Gills Cyp1A↑ Mt↓
Hsp70↑ Cyp1A↑
- Hsp70↑ Cyp1A↑ TGF-b↑ Mt↑ Mx↑
Hsp70↑ Hsp90↑ Cyp1a↑ Mt↑
-
Spleen Hsp90↓ Mt↓
Mt↓ - - -
Muscle - - - - - -
MUSCLE
Hig
h EC
Con
trol
(Ref
)
508
609
915
910
711
340
HSP 70 Mean -0.46 -0.13 -0.98 0.27 -0.33 -2.00 0.79 1.81S.E. 0.59 0.60 1.96 0.25 0.39 0.61 0.46 0.35
HSP 90 Mean -1.10 -0.24 1.98 -0.82 -0.71 0.27 -1.22 0.81S.E. 1.33 1.00 7.01 0.52 0.54 0.77 0.44 0.41
CYP 1a Mean 0.83 -0.02 2.49 1.86 -0.85 -0.79 1.41 5.81S.E. 1.07 1.30 0.26 2.38 0.59 0.65 1.22 1.59
TGF-B Mean 0.13 0.10 0.31 -0.15 -0.01 -1.89 -0.82 1.77S.E. 0.58 0.73 7.94 1.19 0.60 0.43 0.41 0.82
MT Mean 0.20 -0.30 4.96 -1.67 -1.86 2.23 -0.79 -1.43S.E. 1.60 1.03 3.23 0.80 0.89 3.04 1.58 1.11
MX Mean -0.66 0.04 4.25 -0.01 4.94 7.47 6.18 1.62S.E. 1.09 0.81 1.93 0.31 2.91 5.94 5.27 2.52
nRAMP Mean 0.12 -0.02 -0.78 1.16 -0.40 -1.16 0.39 -8.16S.E. 0.56 0.63 0.77 0.97 0.46 0.45 0.58 3.70

POD 2006-2007: Sublethal Indicators
106
7.2.3 Tissue-Specific Expression of Stress Response Genes in Striped Bass
Exposed to Extracts of Semi-Permeable Membrane Devices (SPMD) Deployed in the Sacramento-San Joaquin Delta
7.2.3.1 Methods
To assess the presence and effects of bioavailable lipophilic contaminants in the estuary Semi-Permeable Membrane Devices (SPMDs) were deployed in three locations in the Delta on August 16, 2005, and retrieved on September 13, 2005, by D. Ostrach, UC Davis. SPMDs bind nonionic organic compounds with Kow's >1 (in practice, a chemical's Kow should be greater than 200) and some neutral organo-metal complexes (Table 7-8). One SPMD was deployed in the Napa River (Napa) just below the new bridge, a second device was placed off Collinsville attached to the Bureau of Reclamation pier (Collinsville) and the third device deployed in Sand Mound Slough where high concentrations of Microcystis aeruginosa have been recorded (Sand Mound).
Upon retrieval, the devices were frozen and sent to Environmental Sampling Technologies (EST) Labs Inc. (http://www.est-lab.com) for processing within 24 hours. Extracts were then submitted to the California Department of Fish and Games Wildlife Water Pollution Control Laboratory, Rancho Cordova, CA, for chemical analyses and to process SPMD extracts for use in fish injection experiments. Results from the chemical analysis of the SPMDs indicated the presence of elevated levels of polycyclic aromatic hydrocarbons (PAHs) at all three Delta sites (see POD report to IEP by D. Ostrach, UC Davis) during the deployment period (mid-August to mid-September 2005).
Table 7-8. Common contaminates bound by SPMDs.
Acronym Name Possible Source
PAH Polycyclic Aromatic Hydrocarbons Combustion by-product
OC OrganoChlorides Pesticide
PCB Polychlorinated Biphenyls Industrial and electrical
Pyrethroids Insecticide
Dioxins Combustion, industrial
Furans Industrial by-product
Nonyl Phenols Industrial
Alkylated Selenide Fossil fuels
POD 2006-2007: Sublethal Indicators
107
On March 6, 2006 the SPMD extracts (100 µL/fish) were injected into juvenile striped bass (10 fish/treatment) in an attempt to determine potential effects of the bioavailable, lipophilic contaminants on juvenile striped bass (see POD Report to IEP, D. Ostrach). In addition to injecting SPMD extracts several negative and positive control treatments were run concurrently using the same injection volume of 100 µL/fish: an unhandled control, peanut oil-only injection (carrier control), a dialysis blank (method blank), field blank (SPMD device opened at the field site during deployment then extracted to control for atmospheric contamination), beta-napthoflavone at a dose of 2.5 mg/kg (positive control for P4501A1 induction), estradiol at a dose of 3.0 mg per kg (positive control for exposure to estrogenic compounds) and chlorpyrifos at a dose of 0.5 mg per kilogram (positive control for AChE inhibition). The experiment was terminated on March 9, 2006. Only 1 of 100 fish died during the experiment. Upon termination of the experiment fish were euthanized with MS-222, dissected and organs snap-frozen in liquid nitrogen and stored at -80oC for biochemical and molecular assays. Spleen and liver samples were analyzed for molecular biomarkers following methods described in Chapter 7.2.2. 7.2.3.2 Results
Changes in the expression of stress-response genes in the liver and spleen of juvenile striped bass (M. saxatilis) are presented in Table 7-9 below. Control treatments (oil only, non-handled, field blank) did not induce any of the stress response genes quantified here. The positive control for estrogen-inducing chemicals (estradiol) significantly increased vitellogenin transcription in the liver. The “dialysis blank” did increase transcription of Mt in the liver and Cyp1a in the spleen. SPMD extracts from all three field sites produced gene responses in the liver, but not the spleen, of exposed fish. Extract from the Collinsville site down-regulated transcription of Cyp1at and Mt, while extracts from Sand Mound and Napa down-regulated transcription of Mt only. Vitellogenin was slightly increased in fish exposed to SPMD extracts from Collinsville. Further analysis of the data is ongoing.
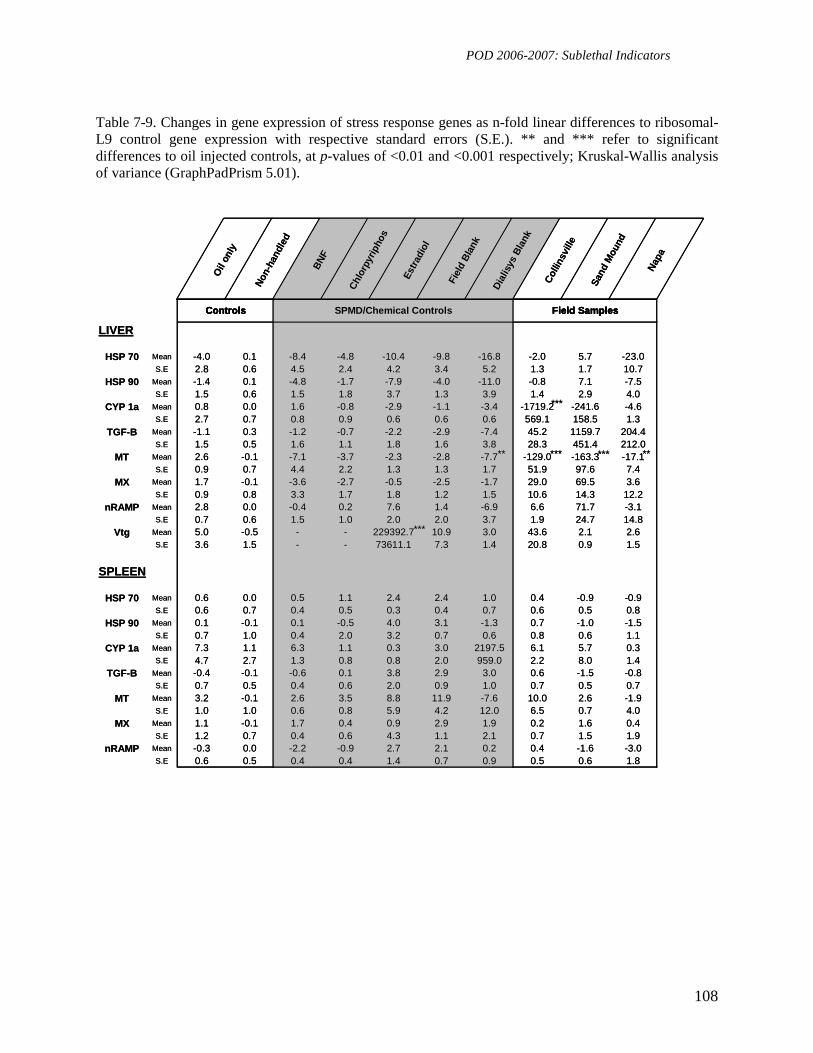
POD 2006-2007: Sublethal Indicators
108
Table 7-9. Changes in gene expression of stress response genes as n-fold linear differences to ribosomal-L9 control gene expression with respective standard errors (S.E.). ** and *** refer to significant differences to oil injected controls, at p-values of <0.01 and <0.001 respectively; Kruskal-Wallis analysis of variance (GraphPadPrism 5.01).
Oil
only
Non
-han
dled
BN
F
Chl
orpy
ripho
s
Estr
adio
l
Fiel
d B
lank
Dia
lisys
Bla
nk
Col
linsv
ille
Sand
Mou
nd
Nap
a
Controls SPMD/Chemical Controls Field Samples
LIVER
HSP 70 Mean -4.0 0.1 -8.4 -4.8 -10.4 -9.8 -16.8 -2.0 5.7 -23.0S.E 2.8 0.6 4.5 2.4 4.2 3.4 5.2 1.3 1.7 10.7
HSP 90 Mean -1.4 0.1 -4.8 -1.7 -7.9 -4.0 -11.0 -0.8 7.1 -7.5S.E 1.5 0.6 1.5 1.8 3.7 1.3 3.9 1.4 2.9 4.0
CYP 1a Mean 0.8 0.0 1.6 -0.8 -2.9 -1.1 -3.4 -1719.2 -241.6 -4.6S.E 2.7 0.7 0.8 0.9 0.6 0.6 0.6 569.1 158.5 1.3
TGF-B Mean -1.1 0.3 -1.2 -0.7 -2.2 -2.9 -7.4 45.2 1159.7 204.4S.E 1.5 0.5 1.6 1.1 1.8 1.6 3.8 28.3 451.4 212.0
MT Mean 2.6 -0.1 -7.1 -3.7 -2.3 -2.8 -7.7 -129.0 -163.3 -17.1S.E 0.9 0.7 4.4 2.2 1.3 1.3 1.7 51.9 97.6 7.4
MX Mean 1.7 -0.1 -3.6 -2.7 -0.5 -2.5 -1.7 29.0 69.5 3.6S.E 0.9 0.8 3.3 1.7 1.8 1.2 1.5 10.6 14.3 12.2
nRAMP Mean 2.8 0.0 -0.4 0.2 7.6 1.4 -6.9 6.6 71.7 -3.1S.E 0.7 0.6 1.5 1.0 2.0 2.0 3.7 1.9 24.7 14.8
Vtg Mean 5.0 -0.5 - - 229392.7 10.9 3.0 43.6 2.1 2.6S.E 3.6 1.5 - - 73611.1 7.3 1.4 20.8 0.9 1.5
SPLEEN
HSP 70 Mean 0.6 0.0 0.5 1.1 2.4 2.4 1.0 0.4 -0.9 -0.9S.E 0.6 0.7 0.4 0.5 0.3 0.4 0.7 0.6 0.5 0.8
HSP 90 Mean 0.1 -0.1 0.1 -0.5 4.0 3.1 -1.3 0.7 -1.0 -1.5S.E 0.7 1.0 0.4 2.0 3.2 0.7 0.6 0.8 0.6 1.1
CYP 1a Mean 7.3 1.1 6.3 1.1 0.3 3.0 2197.5 6.1 5.7 0.3S.E 4.7 2.7 1.3 0.8 0.8 2.0 959.0 2.2 8.0 1.4
TGF-B Mean -0.4 -0.1 -0.6 0.1 3.8 2.9 3.0 0.6 -1.5 -0.8S.E 0.7 0.5 0.4 0.6 2.0 0.9 1.0 0.7 0.5 0.7
MT Mean 3.2 -0.1 2.6 3.5 8.8 11.9 -7.6 10.0 2.6 -1.9S.E 1.0 1.0 0.6 0.8 5.9 4.2 12.0 6.5 0.7 4.0
MX Mean 1.1 -0.1 1.7 0.4 0.9 2.9 1.9 0.2 1.6 0.4S.E 1.2 0.7 0.4 0.6 4.3 1.1 2.1 0.7 1.5 1.9
nRAMP Mean -0.3 0.0 -2.2 -0.9 2.7 2.1 0.2 0.4 -1.6 -3.0S.E 0.6 0.5 0.4 0.4 1.4 0.7 0.9 0.5 0.6 1.8
Controls SPMD/Chemical Controls Field Samples
***
***
*** *** ****

POD 2006-2007: Sublethal Indicators
109
7.3 Identification of Molecular Biomarkers in the Delta Smelt (Hypomesus transpacificus) Using Microarray Technology.
Connon, R.E.1; Geist, J.1a; Pfeiff, J.2; Loguinov A.S.3; Wintz, H.3; Vulpe C.D.3 & Werner, I.1*
1 School of Veterinary Medicine, Department of Anatomy, Physiology and Cell Biology, University of California, Davis, California 95616, USA. 2 School of Veterinary Medicine, Molecular Biosciences, University of California, Davis, California 95616, USA. 3 School of Nutritional Sciences and Toxicology, University of California, Berkeley, California 94720, USA. Current addresses: a Fish Biology Unit, Department of Animal Science, Technische Universität München, D-85350 Freising, Germany. *Corresponding author: Tel.: +1-530-752-8060, Fax: +1-752-7690. E-mail: [email protected] (Werner, I.)
In order to understand the effects of contaminants upon Hypomesus transpacificus we have constructed a microarray with over 8,000 Expressed Sequence Tags (ESTs). We applied this tool to measure gene responses on 60-day old juveniles exposed to 50 µg/L copper for 7 days. The sublethal effects of copper exposure in the delta smelt appear to be on neuro-muscular activity, respiration and metabolism, and we have identified a number of affected genes involved in cardio-muscular contraction, neuro-transmission, oxidative stress, metal ion binding, immunity and systemic inflammation, and digestion. Amongst the responding genes there was a significant up-regulation of osteonectin, a source of copper-binding peptides, which may be indicative of tissue damage caused by excess copper. Future work will include further microarray analyses of delta smelt exposed to different toxicants, and investigation of a selected suite of genes from these microarray assessments, using real-time quantitative PCR to develop informative molecular biomarkers of stress and exposure in the delta smelt. 7.3.1 Introduction
The Delta smelt (H. transpacificus) is a pelagic fish species endemic to the Northern Sacramento-San Joaquin Estuary, California, and considered an “indicator species” for ecosystem health in this system. Abundance has dramatically declined since the 1980s and it was listed as threatened in 1993, under both the Federal Endangered Species Act (ESA) and California Endangered Species Act (CESA). Delta smelt have been reared since 1992 at the Fish Conservation and Culture Laboratory (FCCL), UC Davis, providing a refuge population as well as a supply for research. A more recent step decline of the delta smelt population (Sommer et al.
POD 2006-2007: Sublethal Indicators
110
2007) has prompted considerable efforts to understand the causative factors of this decline. A number of complex factors, known and unknown have potentially been affecting populations of delta smelt in its native habitat. Pollution, in the form of agricultural, pharmaceutical and industrial chemicals, along with the effects of water exports for agricultural irrigation and urban uses, toxic algal blooms and habitat destruction, are among the potential causes for the decline in pelagic organisms.
Identifying the impacts of such stressors and their mechanistic effects on individuals and populations is a main challenge in ecotoxicology. Stress responses to toxic chemicals are often preceded by alterations in gene expression, thus gene expression studies offer insights into the overall health of an organism. Microarray gene profiling is a powerful tool for defining genome-wide effects of environmental change on biological function. This technology is being applied successfully to the field of ecotoxicology in a number of other species and links are being forged between what is measured at the gene expression level and life history parameters, such as metabolism, growth and reproduction (Connon et al, 2008, Heckmann et al, 2008). The predictive value of microarrays as screening tools is becoming more powerful as our understanding of these responses grows. Gene expression studies carried out over short-term exposures allow for the prediction of chronic effects that stressors may have on the health of the individual, their survival capacity, fecundity and somatic growth. Specific gene responses in individual delta smelt, indicative of their health status, could highlight potential causes for the population decline.
Our aims are to determine specific and general responses to a suite of stressors and develop molecular biomarkers applicable in the delta smelt and relevant to the varying contaminants found in the Californian watersheds. In order to understand the effects of contaminants upon H. transpacificus we have constructed a microarray with over 8,000 Expressed Sequence Tags (ESTs). No sequence information was available on any database at the time this project was started. We describe here, the construction and first application of this tool to measure gene responses to copper in juvenile delta smelt. We used copper to generate stress because biochemical responses to this metal, and adverse effects on the whole organism are relatively well understood and therefore would aid interpretation of results in this “proof of principle” test. Furthermore, copper is a contaminant of concern in Californian waterways, it is a common contaminant in urban storm-water runoff, is present from mining activities and is regularly used as a pesticide in agricultural areas. We expect neurological responses, respiration, growth and metabolism to be affected by exposure to this neurotoxin. We investigate relatively high levels of copper (50µgCu+L-1) in order to establish confidence in significant responses. Reported concentrations of copper in the Sacramento River are above 6µg Cu+ L-1 (USGS, 1998) though there are seasonal fluctuations due to its application as a pesticide, where concentrations have been reported to exceed 500µg Cu+ L-1 in rice field effluents, following copper application (Department of Fish and Game, California, 1998). 7.3.2 Methods
Microarray construction and hybridization. We constructed a delta smelt microarray using 8448 PCR amplified fragments from a normalized cDNA library. To ensure presence of
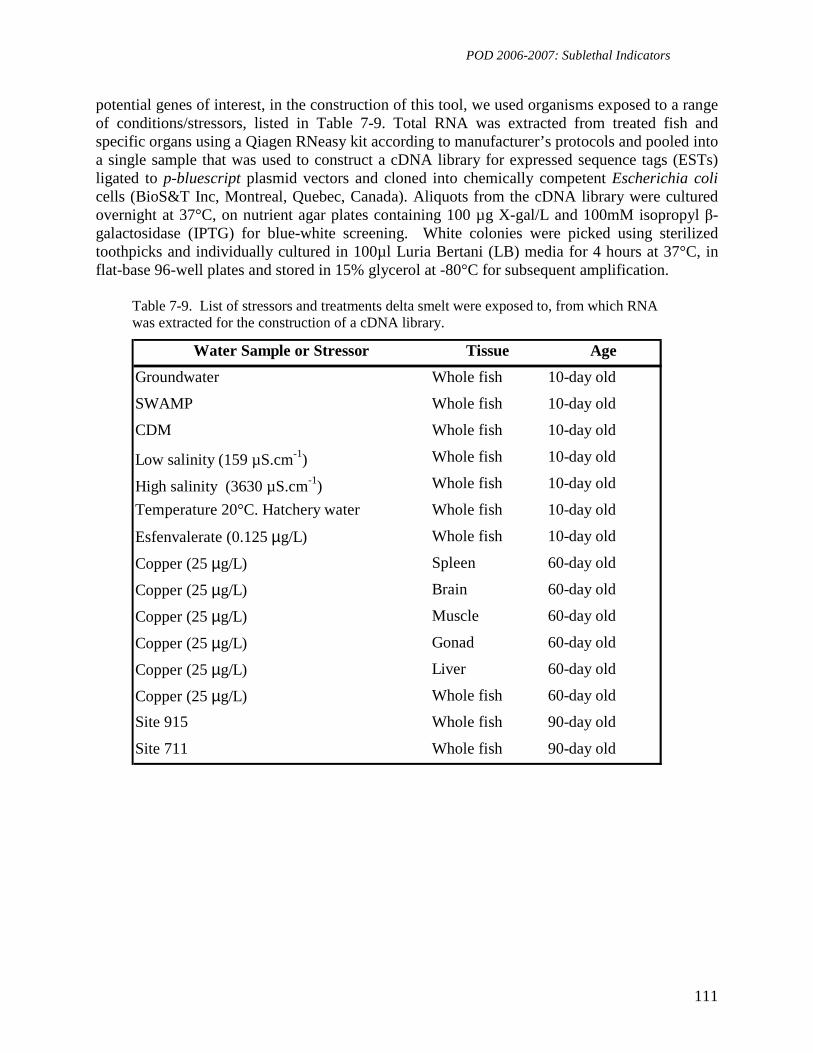
POD 2006-2007: Sublethal Indicators
111
potential genes of interest, in the construction of this tool, we used organisms exposed to a range of conditions/stressors, listed in Table 7-9. Total RNA was extracted from treated fish and specific organs using a Qiagen RNeasy kit according to manufacturer’s protocols and pooled into a single sample that was used to construct a cDNA library for expressed sequence tags (ESTs) ligated to p-bluescript plasmid vectors and cloned into chemically competent Escherichia coli cells (BioS&T Inc, Montreal, Quebec, Canada). Aliquots from the cDNA library were cultured overnight at 37°C, on nutrient agar plates containing 100 µg X-gal/L and 100mM isopropyl β-galactosidase (IPTG) for blue-white screening. White colonies were picked using sterilized toothpicks and individually cultured in 100µl Luria Bertani (LB) media for 4 hours at 37°C, in flat-base 96-well plates and stored in 15% glycerol at -80°C for subsequent amplification.
Table 7-9. List of stressors and treatments delta smelt were exposed to, from which RNA was extracted for the construction of a cDNA library.
Water Sample or Stressor Tissue Age
Groundwater Whole fish 10-day old
SWAMP Whole fish 10-day old
CDM Whole fish 10-day old
Low salinity (159 µS.cm-1) Whole fish 10-day old
High salinity (3630 µS.cm-1) Whole fish 10-day old
Temperature 20°C. Hatchery water Whole fish 10-day old
Esfenvalerate (0.125 µg/L) Whole fish 10-day old
Copper (25 µg/L) Spleen 60-day old
Copper (25 µg/L) Brain 60-day old
Copper (25 µg/L) Muscle 60-day old
Copper (25 µg/L) Gonad 60-day old
Copper (25 µg/L) Liver 60-day old
Copper (25 µg/L) Whole fish 60-day old
Site 915 Whole fish 90-day old
Site 711 Whole fish 90-day old
POD 2006-2007: Sublethal Indicators
112
A total of 8,448 ESTs (88 x 96-well plates) were PCR amplified directly from the bacterial colonies, using 1µl bacterial suspension with M13 long primers (MWG Biotech):
• M13 rev (-49) 5'-GAGCGGATAACAATTTCACACAGG-3' • M13 uni (-43 5'-AGGGTTTTCCCAGTCACGACGTT-3'
Following a cycling program with an initial denaturation of 95°C for 15 min, 35 cycles of denaturation at 95°C for 45 sec, primer annealing at 53°C for 30 sec and elongation at 72°C for 3 min, followed by a final extension at 72°C for 10 min. Amplified PCR products were visualized on agarose gels and ranged in size from 1- 4kb. Products were vacuum purified using Minelute 96 UF PCR Purification System (Qiagen) as per manufacturers’ protocol and transferred to 22 x 384-well plates. Plates were desiccated using a vacuum centrifuge and products resuspended at concentrations between 0.1-0.5µM required for printing, in a 1x phosphate buffer solution (Nexterion).
PCR fragments and controls were pin-printed on glass slides in a 20 x 19 block format, with 48 blocks per microarray [Grid = 18,240 spots (8448 clones in duplicate = 16,895, plus 576 control spots (1,152 control) and 96 (192 blank) blank spots, also printed in duplicate and repeated throughout the array in each block)]. Microarrays were printed at the Array Core facility at Robbins Hall, UC Davis (http://array.ucdavis.edu/home/). Microarray control spots included a number of hybridization tags comprised of a pooled PCR product from all spots on the array, H. transpacificus DNA, and four Spot Report System of alien PCR products from Arabidopsis thaliana; CAB, RCA, RBCL and LPT4 (Stratagene, USA). Blank control spots consisting of 1x Nexterion buffer solution were printed interspaced with the above controls and as the last 12 spots in each block, and used to assess printing quality and potential cross contamination resulting from printing.
Fish Exposures. Procedures and methods for the copper exposure are described in Chapter 6.1.3.2. Briefly, fish obtained from the Fish Conservation and Culture Laboratory, UC Davis, were exposed to a control and four concentrations of copper chloride (CuCl2); equivalent to nominal concentrations of 5, 10, 25 and 50µg Cu+ L-1 for 7 days. Replicate experimental treatment (n=4) were initiated with 10, 60-day old juveniles in 7L of water at 20oC. Fish were fed twice daily with artemia (<48 h old). The light:dark cycle was 16h:8h. Approximately 80 percent of the water in each replicate was renewed on days 2, 4, and 6. On days 1, 3, and 5, water was not renewed, but the numbers of live, dead, and missing fish were scored for each replicate. Water temperature, pH, and DO were measured daily. Ammonia nitrogen (NH3-N) was measured prior to each water renewal. On Day 7, 4 fish from each replicate were measured for mass and fork length recorded for surviving fish prior to snap-freezing and storage at –80oC for subsequent analyses. Only controls and the highest exposure concentration (50µg Cu+ L-1) were assessed with the microarray.
RNA isolation, cDNA synthesis and fluorescence labeling. RNA was extracted using a standard phenol:chloroform protocol with Trizol Reagent (Invitrogen). Fifteen micrograms of total RNA was used cDNA synthesis, spiked with control RNA (CAB, RCA, rbcl and LTP4 (SpotReport, Stratagene) and labeled with Alexa fluor dyes, using SuperScripttm Plus Indirect cDNA labeling System (Invitrogen). The fluorescently labeled probes were purified using QIAGEN PCR “Qiaquick” columns according to the manufacturer’s instructions, and were
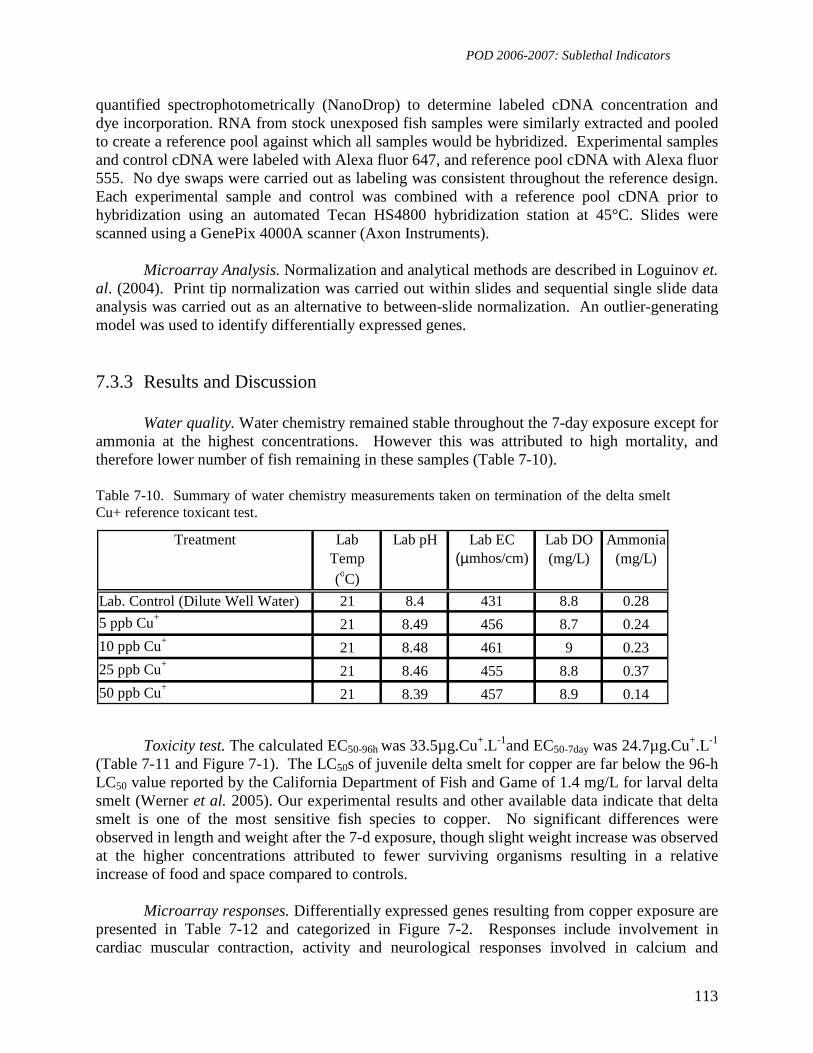
POD 2006-2007: Sublethal Indicators
113
quantified spectrophotometrically (NanoDrop) to determine labeled cDNA concentration and dye incorporation. RNA from stock unexposed fish samples were similarly extracted and pooled to create a reference pool against which all samples would be hybridized. Experimental samples and control cDNA were labeled with Alexa fluor 647, and reference pool cDNA with Alexa fluor 555. No dye swaps were carried out as labeling was consistent throughout the reference design. Each experimental sample and control was combined with a reference pool cDNA prior to hybridization using an automated Tecan HS4800 hybridization station at 45°C. Slides were scanned using a GenePix 4000A scanner (Axon Instruments).
Microarray Analysis. Normalization and analytical methods are described in Loguinov et. al. (2004). Print tip normalization was carried out within slides and sequential single slide data analysis was carried out as an alternative to between-slide normalization. An outlier-generating model was used to identify differentially expressed genes. 7.3.3 Results and Discussion
Water quality. Water chemistry remained stable throughout the 7-day exposure except for ammonia at the highest concentrations. However this was attributed to high mortality, and therefore lower number of fish remaining in these samples (Table 7-10). Table 7-10. Summary of water chemistry measurements taken on termination of the delta smelt Cu+ reference toxicant test.
Treatment Lab Lab pH Lab EC Lab DO AmmoniaTemp (µmhos/cm) (mg/L) (mg/L)(oC)
Lab. Control (Dilute Well Water) 21 8.4 431 8.8 0.28
5 ppb Cu+ 21 8.49 456 8.7 0.24
10 ppb Cu+ 21 8.48 461 9 0.23
25 ppb Cu+ 21 8.46 455 8.8 0.37
50 ppb Cu+ 21 8.39 457 8.9 0.14
Toxicity test. The calculated EC50-96h was 33.5µg.Cu+.L-1and EC50-7day was 24.7µg.Cu+.L-1
(Table 7-11 and Figure 7-1). The LC50s of juvenile delta smelt for copper are far below the 96-h LC50 value reported by the California Department of Fish and Game of 1.4 mg/L for larval delta smelt (Werner et al. 2005). Our experimental results and other available data indicate that delta smelt is one of the most sensitive fish species to copper. No significant differences were observed in length and weight after the 7-d exposure, though slight weight increase was observed at the higher concentrations attributed to fewer surviving organisms resulting in a relative increase of food and space compared to controls.
Microarray responses. Differentially expressed genes resulting from copper exposure are presented in Table 7-12 and categorized in Figure 7-2. Responses include involvement in cardiac muscular contraction, activity and neurological responses involved in calcium and
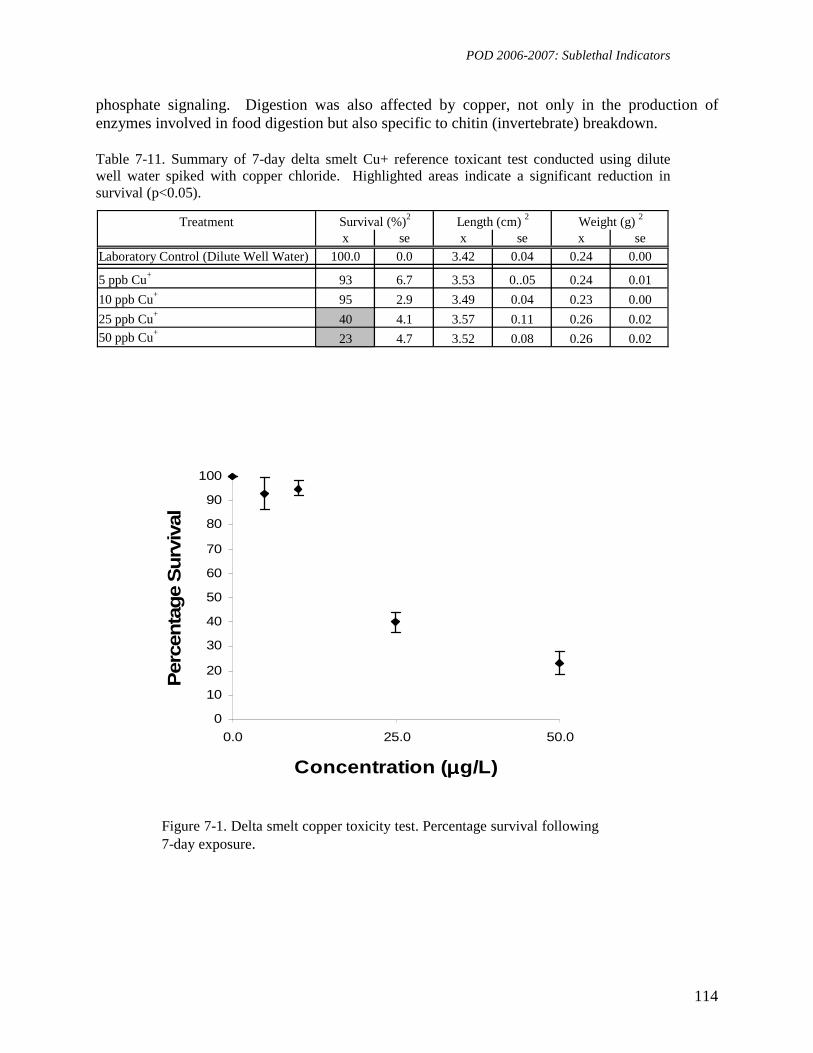
POD 2006-2007: Sublethal Indicators
114
phosphate signaling. Digestion was also affected by copper, not only in the production of enzymes involved in food digestion but also specific to chitin (invertebrate) breakdown. Table 7-11. Summary of 7-day delta smelt Cu+ reference toxicant test conducted using dilute well water spiked with copper chloride. Highlighted areas indicate a significant reduction in survival (p<0.05).
Treatment Survival (%)2 Length (cm) 2 Weight (g) 2
x se x se x se
Laboratory Control (Dilute Well Water) 100.0 0.0 3.42 0.04 0.24 0.00
5 ppb Cu+ 93 6.7 3.53 0..05 0.24 0.01
10 ppb Cu+ 95 2.9 3.49 0.04 0.23 0.00
25 ppb Cu+ 40 4.1 3.57 0.11 0.26 0.0250 ppb Cu+
23 4.7 3.52 0.08 0.26 0.02
0
10
20
30
40
50
60
70
80
90
100
0.0 25.0 50.0
Concentration (µµµµg/L)
Per
centa
ge
Surv
ival
Figure 7-1. Delta smelt copper toxicity test. Percentage survival following 7-day exposure.
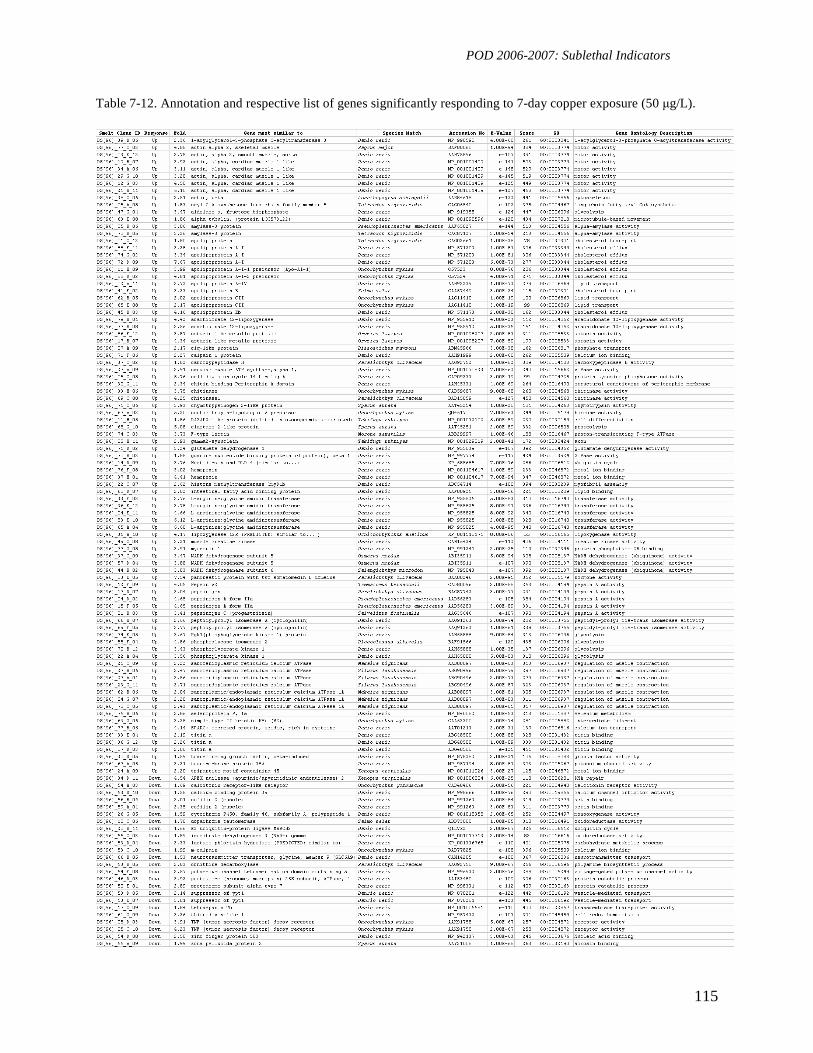
POD 2006-2007: Sublethal Indicators
115
Table 7-12. Annotation and respective list of genes significantly responding to 7-day copper exposure (50 µg/L).
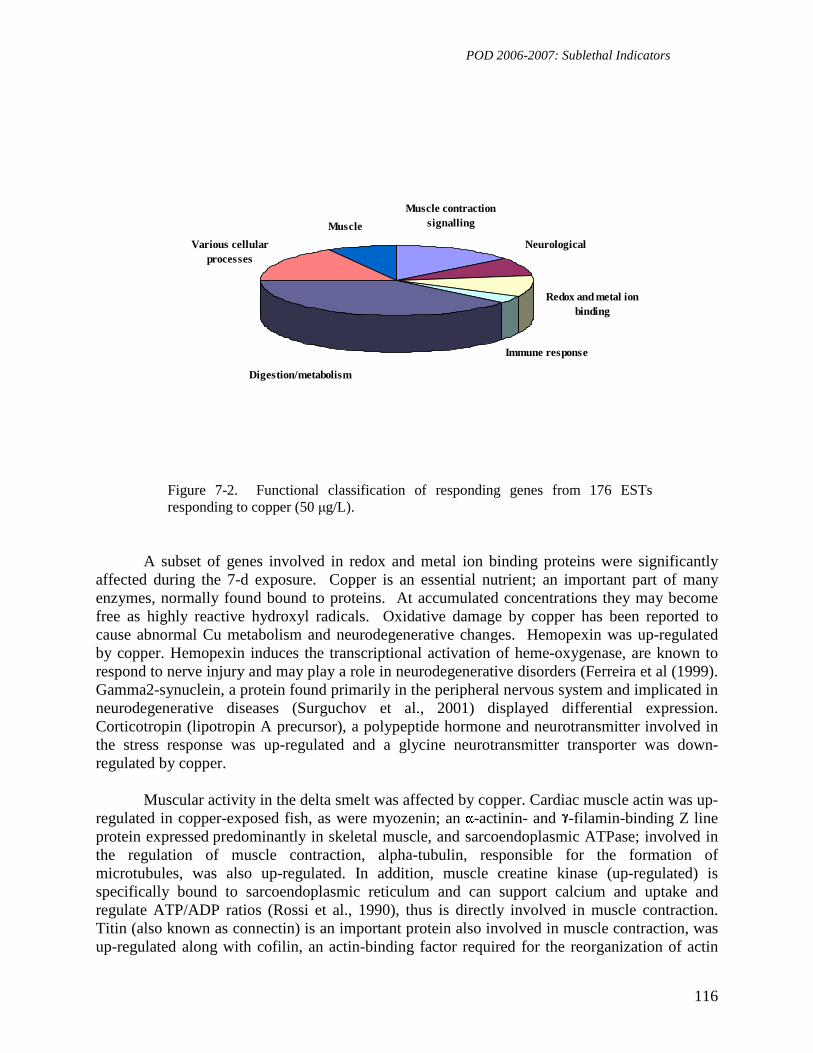
POD 2006-2007: Sublethal Indicators
116
Muscle
Various cellular processes
Digestion/metabolism
Immune response
Redox and metal ion binding
Neurological
Muscle contraction signalling
Figure 7-2. Functional classification of responding genes from 176 ESTs responding to copper (50 µg/L).
A subset of genes involved in redox and metal ion binding proteins were significantly affected during the 7-d exposure. Copper is an essential nutrient; an important part of many enzymes, normally found bound to proteins. At accumulated concentrations they may become free as highly reactive hydroxyl radicals. Oxidative damage by copper has been reported to cause abnormal Cu metabolism and neurodegenerative changes. Hemopexin was up-regulated by copper. Hemopexin induces the transcriptional activation of heme-oxygenase, are known to respond to nerve injury and may play a role in neurodegenerative disorders (Ferreira et al (1999). Gamma2-synuclein, a protein found primarily in the peripheral nervous system and implicated in neurodegenerative diseases (Surguchov et al., 2001) displayed differential expression. Corticotropin (lipotropin A precursor), a polypeptide hormone and neurotransmitter involved in the stress response was up-regulated and a glycine neurotransmitter transporter was down-regulated by copper.
Muscular activity in the delta smelt was affected by copper. Cardiac muscle actin was up-
regulated in copper-exposed fish, as were myozenin; an -actinin- and -filamin-binding Z line protein expressed predominantly in skeletal muscle, and sarcoendoplasmic ATPase; involved in the regulation of muscle contraction, alpha-tubulin, responsible for the formation of microtubules, was also up-regulated. In addition, muscle creatine kinase (up-regulated) is specifically bound to sarcoendoplasmic reticulum and can support calcium and uptake and regulate ATP/ADP ratios (Rossi et al., 1990), thus is directly involved in muscle contraction. Titin (also known as connectin) is an important protein also involved in muscle contraction, was up-regulated along with cofilin, an actin-binding factor required for the reorganization of actin
POD 2006-2007: Sublethal Indicators
117
filaments.
Further genes involved in muscular activity and responding to copper exposure include those involved in calcium ion binding and potassium channel activity. Calcitonin receptor activity was up-regulated. Calcitonin is a hormone involved in bone mineral metabolism protecting the skeleton from calcium loss, and is also concerned with vitamin D regulation. Osteonectin (secreted protein acidic and rich in cystein - SPARC) is a calcium-binding glycoprotein secreted by osteoblasts during bone formation, and was significantly up-regulated by copper in the delta smelt. Osteonectin is also a source of copper-binding peptides that are known to accumulate at sites of tissue repair (Lane et al., 1994). Elevated osteonectin expression has been reported to occur in a number of malignant tumors, and has been linked with inhibition of cancer cell metastasis (Koblinski et al., 2005) and has also been correlated with chronic pancreatitis (Bloomston et al., 2007). Interestingly, a gene encoding for a pancreatic protein with two somatomedin B domains was also up-regulated.
A number of digestive genes encoding for proteins involved in glycolysis, cholesterol
efflux, lipid transport, chymotrypsin activity, proteolysis and other forms of digestion and metabolism were also seen to be affected by copper. Chitinase, a digestive enzyme that breaks down chitin was found to be up-regulated and is probably associated with food digestion (artemia exoskeleton in this test).
Lastly, immune responses were also seen to be affected. Down-regulated were
tetraspanins; known to modulate the immune system and tumor necrosis factors (TNFs) involved in the regulation of immune cells and systemic inflammation. Changes in expression of these genes have been implicated in a variety of diseases. C1q complex genes, involved in immunoglobulin peptide fixation were up-regulated by copper exposure.
In summary, the overall responses to copper exposure in the delta smelt appear to be on
neuro-muscular activity, respiration and metabolism as hypothesized. The immune system was also affected, and elevated expression of osteonectin may indicate tissue damage caused by excess copper. Confirmation tests are still required to verify the measured expression differences in greater detail. Real-time quantitative PCR will be undertaken to further investigate these responses.
Biomarker development, future work. Copper is the first of a suite of reference toxicants
that are currently being assessed with the developed microarrays. From the responding genes, molecular biomarkers will be selected to quantitatively measure specific and general stress responses in the delta smelt to monitor the effect of water samples from the Sacramento San Joaquin watersheds and estuary upon their overall health. Chitinase and chymotrypsin for example, could give an indication of feeding activity and food digestion, whilst neurological impairments could be assessed using gamma synuclein and muscle activity by creatine kinase. Tetraspanin and TNFs would be an indicator of affected immune responses.
Real-time Quantitative PCR. A suite of real-time TaqMan PCR systems will be designed
for selected ESTs responding significantly to copper exposure. For each target gene, two primers and an internal, fluorescent-labeled TaqMan probe (5’ end, reporter dye FAM (6-carboxyfluorescein), 3’ end, quencher dye TAMRA (6-carboxytetramethylrhodamine)) will be

POD 2006-2007: Sublethal Indicators
118
designed using Primer Express software (Applied Biosystems, Foster City, USA). Relative gene expression (Livak and Schmittgen, 2001) or sequential normalization of target genes (Heckmann et al., 2006) will be used if no house-keeping genes are designated.
Genes for quantitative PCR currently selected form copper exposure: • Gamma2-synuclein • Hemopexin • Creatine kinase • myozenin • Corticotropin • Osteonectin • Chitinase • Tetraspanin • Tumor Necrosis Factor (TNF) • Cardiac muscle -actin
We expect to assess these and genes from future microarray assessments in order to
develop informative molecular biomarkers of stress and exposure in the delta smelt. We intend to carry out behavioral tests along with measurements of growth and survival for selected stressors.
Acknowledgments. The authors would like to thank Elsie Campbell, Section of Microbiology, University of California, Davis, for assistance with the microarray development and aspects of analyses. We also thank Joan Lindberg and Bradd Baskerville-Bridges (FCCL) for supplying the delta smelt and for their invaluable knowledge on culture and handling. The facilities at the Aquatic Toxicology Laboratories, University of California, Davis, were used for all exposure tests.

POD 2006-2007: Sublethal Indicators
119
7.4 References
Bloomston M., Ellison E.C., Muscarella P., Al-Saif O., Martin E.W., Melvin W.S., and Frankel W.L. (2007). Stromal Osteonectin Overexpression Is Associated with Poor Outcome in Patients with Ampullary Cancer. Surgical Oncology.
California Department of Fish and Game (1998). Environmental monitoring for chemical control of Egeria densa in the Sacramento-San Joaquin Delta. Report 3. State of California, The Resourses Agency, Department of Fish and Game.
Connon R.E., Hooper H.L., Sibly R.M., Lim F-L., Heckmann L-H., Moore D.J., Watanabe W., Soetaert A., Cook K., Maund S.J., Hutchinson T.H., Moggs J., De Coen W., Iguchi T. and Callaghan A. (2008) Linking Molecular and Population Stress Responses in Daphnia magna exposed to cadmium. Environmental Science and Technology.
Domagalski, J.L., Knifong, D.L., Dileanis, P.D., Brown, L.R., May, J.T., Connor, V., Alpers, C.N., 2000. Water quality in the Sacramento River Basin, California, 1994-98. U.S. Geological Survey Circular 1215. U.S. Geological Survey, Sacramento, CA, USA.
Dubrovsky, N., Kratzer, C., Brown, L., Gronberg, J., Burow, K., 1998. Water quality in the San Joaquin–Tulare Basins, California, 1992–95. U.S. Geological Survey Circular 1159. U.S. Geological Survey, Sacramento, CA, USA.
Ferreira G.C., Moura J.J.G. and Franco R. (1999). Iron metabolism: inorganic biochemistry and regulatory mechanisms (eds.) Wiley-VCH, Germany. Chapter 5, 65-93.
Fulton, M.H., Key, P.B., 2001. Acetylcholinesterase inhibition in estuarine fish and invertebrates as an indicator of organophosphorus insecticide exposure and effects. Environ. Toxicol. Chem. 20, 37-45.
Geist, J., Werner, I., Eder, K.J., Leutenegger, C.M., 2007. Comparisons of tissue-specific transcription of stress response genes with whole animal endpoints of adverse effect in striped bass (Morone saxatilis) following treatment with copper and esfenvalerate. Aquat. Toxicol. 85, 28-39.
Heath A.G. (1987). Effects of waterborne copper or zinc on the osmoregulatory response of bluegill to a hypertonic NaCl challenge. Comp Biochem Physiol 88C:307-311.
Heckmann L-H., Connon R.E., Hutchinson T.H., Maund S.J., Sibly R.M. and Callaghan A. (2006). Expression of target and reference genes in Daphnia magna exposed to ibuprofen. BMC genomics.
Heckmann L-H., Sibly R.M., Connon R.E., Hooper H.L., Hutchinson T.H., Maund S.J., Hill C.J., Bouetard A. and Callaghan A. (2008). Systems biology meets stress ecology: Linking molecular and organismal stress responses in Daphnia magna. Genome Biology.
Hunt, J.W., Anderson, B.S., Phillips, B.M., Nicely, P.N., Tjeerdema, R.S., Puckett, H.M., Stephenson, M., Worcester, K., De Vlaming, V., 2003. Ambient toxicity due to chlorpyrifos and diazinon in a central California coastal watershed. Environ. Monit. Assess. 82, 83-112.
POD 2006-2007: Sublethal Indicators
120
Koblinski J.E., Kaplan-Singer B.R., VanOsdol S.J., Wu M., Engbring J.A., Wang S., Goldsmith C.M., Piper J.T., Vostal J.G., Harms J. F., Welch D.R. and Kleinman H.K. (2005). Endogenous Osteonectin/SPARC/BM-40 Expression Inhibits MDA-MB-231 Breast Cancer Cell Metastasis. Cancer Research.
Lane, T.F., Iruela-Arispe, M.L., Johnson, R.S., Sage, E.H., (1994). SPARC is a source of copper-binding peptides that stimulate angiogenesis. Journal of Cell Biology.
Livak K.J. and Schmittgen T.D. (2001) Analysis of relative gene expression data using real time quantitative PCR and the 2-Ct method. Methods.
Loguinov, A.V.; Mian, I.S. and Vulpe, C.D. (2004). Exploratory differential gene expression analysis in microarray experiments with no or limited replication. Genome Biology.
Lowry OH, Rosebrough NJ, Farr AL, Randall RJ. 1951. Protein measurement with the folin phenol reagent. J Biol Chem 193:265-275.
Rossi A.M., Eppenberger, H.M., Volpe P., Cortufo R. and Willimann T. (1990). Muscle-type MM creatine kinase is specifically bound to sarcoplasmic reticulum and can support Ca2+ uptake and regulate local ATP/ADP ratios. The Journal of Biological Chemistry.
SAS. 2003. JMP Professional edition version 5.0.1. Cary, NC, SAS Institute Inc.
Surguchov A., Palazzo R.E. and Surgucheva I. (2001) gamma synuclein: subcellular localization in neuronal and non-neuronal cells and effect on signal transduction. Cell Motility and the Cytoskeleton.
USEPA. 2002. Methods for Measuring the Chronic Toxicity of Effluents and Receiving Waters to Freshwater Organisms. 4th Edition. Washington, DC 20460: U.S. Environmental Protection Agency, Office of Water.
USGS (1998) Water-quality assessment of the Sacramento river basin, California – Water quality of fixed sites, 1996-1998. Water-resources investigations report 00-4247. U.S. Department of the Interior, U.S. Geological Survey.
Werner I., (2005). Acute and Chronic Invertebrate and Fish Toxicity Testing. Pelagic Organism Decline (POD) Progress Report.
Werner, I., Deanovic, L.A., Connor, V., de Vlaming, V., Bailey, H.C., Hinton, D.E., 2000. Insecticide-caused toxicity to Ceriodaphnia dubia (Cladocera) in the Sacramento-San Joaquin River Delta, California, USA. Environ. Toxicol. Chem. 19, 215-227.
Wheelock, C.E., Eder, K.J., Werner, I., Huang, H., Jones, P.D., Brammell, B.F., Elskus, A.A., Hammock, B.D., 2005. Individual variability in esterase activity and CYP1A levels in Chinook salmon (Oncorhynchus tshawytscha) exposed to esfenvalerate and chlorpyrifos. Aquat. Toxicol. 74, 172–192.

POD 2006-2007: QA/QC
121
8. Quality Assurance/Quality Control Quality Assurance/Quality Control (QA/QC) measures were included in this project to assess the reliability of the data collected. UCD ATL conducts approximately 10% of samples for QA/QC determinations. In 2006-2007, 9.6% of samples collected were slated for QA/QC (68 QA/QC samples were initiated in toxicity testing out of 710 total samples collected). These QA/QC procedures include positive control tests (i.e., reference toxicant tests), and QC samples such as field duplicates, bottle blanks and trip blanks. The components of these QA/QC measures are outlined below. 8.1 Reference Toxicant Tests
Positive control reference toxicant (RT) tests with H. azteca using NaCl as the
toxicant were performed once a month to ascertain whether organism response fell within the acceptable range as dictated by US EPA. Each RT test consists of a dilution series made up for five different concentrations of the toxicant and a control. A 20-month running mean control chart is continuously updated with the results of these RT test endpoints. Acceptable range for US EPA is within the 95% confidence interval of a running mean. If the LC50 or EC25 falls out of the 95% confidence interval, test organism sensitivity is considered atypical and results of tests conducted during that month are considered suspect. Statistically speaking, one data point out of 20 will fall out of range by chance alone.
There were two months where H. azteca did not perform typically within the 95%
confidence interval: February and June 2007 reference toxicant EC25 values in weight exceeded the upper limit of the range. These outliers were instances in which an organism in the highest toxicant concentration survived, providing weight data where there previously was none, and normal EC25 distribution was not obtained. Anomalous organism survival in higher RT toxicant concentrations for these months has not readily been explained, but the results indicate that H. azteca obtained for testing in the months of February and June could be less sensitive to potential contaminant(s) in ambient samples.
It is unlikely that test results in February and June, 2007 were affected by
potentially less sensitive organisms, for survival LC50 RT data consistently fell within the EPA RT range, and there were no statistically significant differences in organism survival among ambient samples and appropriate controls in tests conducted in the aforementioned months. Moreover, organisms utilized in toxicity tests conducted in February and June were sensitive enough to exhibit statistically significant differences in weight among ambient samples and the appropriate controls, and between PBO and non-manipulated ambient samples. However, it is understood that changes in organism sensitivity to a particular constituent such as NaCl may not necessarily affect an organism’s sensitivity to other toxicant(s) that may be present in ambient samples utilized in toxicity testing. Therefore, February and June toxicity test data are considered reliable.
POD 2006-2007: QA/QC
122
8.2 Field Duplicates Field duplicate samples were collected to assess laboratory precision. A field
duplicate sample is a second sample collected in a separate container(s), immediately after the primary test sample. Field duplicates are tested concurrently with its primary sample and the results are evaluated to determine precision of field and laboratory staff. Field duplicates were selected from H. azteca-specific sampling sites because QA/QC comparisons were not included in the developmental fish species bioassays. Field duplicate samples are in agreement when the primary sample and its duplicate are either statistically similar or statistically different from the control.
Twenty-one samples were collected as field duplicates in 2006; 18 samples were collected as field duplicates in 2007. In all instances, field duplicate samples were in agreement with their primary samples. Precision was determined by calculating the relative percent difference (RPD) between field duplicates and their primary samples in sample measurements. RPD is calculated by using the following equation:
[ ][ ] 100*
21
21*2
+−
=DupDup
DupDupRPD
Individual and average RPDs have been calculated for field duplicate samples
collected in 2006 and 2007. Although this project does not fall under the Surface Water Ambient Monitoring Program (SWAMP), UCD ATL uses SWAMP QC guidelines in order to be comparable to other laboratories in California. SWAMP guidelines have a RPD limit of < 35% between duplicates. Field duplicate samples sharing equivalent results are listed in Table F1, and RPDs are listed in Tables F2-F10 (Appendix F). 8.3 Bottle Blanks
Bottle blank samples were included to evaluate potential incidental contamination due to the sampling container. Bottle blanks are analyte-free water samples that are transferred to a clean sample container that is prepared in the laboratory. For this project, bottle blanks were comprised of de-ionized water amended with dry salts to EPA moderately hard reconstituted specifications (DIEPAMHR). A bottle blank sample is in agreement when it is statistically similar to the control.
Six bottle blank samples were tested in 2006; 10 bottle blank samples were tested
in 2007. With the exception of a bottle blank sample tested September 6, 2006; all bottle blanks shared equivalent results with the appropriate control. The bottle blank sample that was prepared in September, 2006 was not triple-rinsed prior to being filled with control water, and negatively affected the H. azteca weight endpoint. This was due to technician error. All laboratory staff were notified of the importance of triple-rinsing sample containers prior to use. Bottle blanks sharing equivalent results are outlined in Table F1 (Appendix F). .
POD 2006-2007: QA/QC
123
8.4 Trip Blanks
Trip blank samples were included to evaluate potential incidental contamination that can occur during field sampling and sample processing. A trip blank is an analyte-free water sample that is transferred into a clean sample container that is prepared in the laboratory, brought out into the field, and treated like any other collected sample throughout the course of the trip. For this project, trip blanks were comprised of DIEPAMHR. A trip blank sample is in agreement when it is statistically similar to the control.
Three trip blank samples were tested in 2006; 10 trip blanks were tested in 2007.
All trip blank samples shared equivalent results with the appropriate control. Trip blanks sharing equivalent results are outlined in Table F1 (Appendix F). 8.5 Test Acceptability Criteria
Test acceptability criteria for H. azteca toxicity tests require 80% control survival. All H. azteca toxicity tests conducted in 2006 met all test acceptability criteria. All but two H. azteca toxicity tests conducted in 2007 met all test acceptability criteria. Tests in which control mortality exceeded 20% occurred with samples collected January 30/31, and April 11, 2007. In both cases the samples were re-initiated in secondary toxicity tests in which all test acceptability criteria were met. These data were considered reliable.
Test acceptability criteria for M. saxatilis and H. transpacificus require 80% control survival. These control limits were designated at the beginning of the project and were modeled after EPA chronic fish toxicity tests. After conducting two years of developmental toxicity testing with these species, it has been determined that these fish species are extremely sensitive at the ages utilized at UCD ATL and 80% control survival is not an attainable control limit. Therefore, only data in which control survival is less than 50% was rejected. All other data were considered reliable. 8.6 Deviations
Fourteen deviations occurred throughout the duration of the 2006-2007 POD project. Six deviations took place in 2006; 8 deviations occurred during 2007. The most frequent deviation were protocol deviations (4/14 or 29%), missed chemistry measurements (5/14 or 36%), high sample receiving temperatures (3/14 or 21%), and exceeded test initiation holding time (2/14 or 14%). Corrective actions were initiated whenever possible.
It is unlikely that these deviations had any negative impact on the data. Protocol deviations typically consisted of a reduced number of replicates; however there were
POD 2006-2007: QA/QC
124
enough replicates initiated to achieve the statistical power needed to make comparisons between ambient treatments and appropriate controls. Missed chemistry measurements did not have an impact on the data, as organisms in those toxicity tests performed normally. High sample receiving temperatures had little to no effect on test data. While warm temperatures increase the chances of sample toxicant degradation, sample temperatures were close to the EPA criterion of 0-6 ºC, and samples were placed in cold storage in the dark immediately upon receipt to negate any further degradation. Exceeded test initiation holding times were due to initial screening toxicity tests not meeting test acceptability criteria. In such cases, the samples were reinitiated in secondary toxicity tests, which exceeded test initiation holding time. This extended holding time may have resulted in loss of toxicant(s) due to sample degradation. However, samples were kept in the dark between 0-6 ºC to minimize such degradation. 8.7 Completeness
Completeness is a measure of the data obtained compared to the amount of data expected in a project. The toxicity data acquisition phase of a project is considered complete when all sites specified in a contract have been visited the number of times designated in a contract, the number of samples designated in a contract has been collected, and the number of toxicity tests designated in the contract has been successfully completed. UCD ATL strives for a minimum of 90% completeness.
Over the course of 2006-2007, 100 H. azteca initial screening toxicity tests were conducted. Of those 100 tests, 98 passed all test acceptability criteria. The two tests which exhibited unacceptable control mortality were re-initiated and those retests met all test acceptability criteria. Therefore, 100% completeness was obtained for H. azteca toxicity testing.
As there are no standardized toxicity tests or completeness criteria established for M. saxatilis and H. transpacificus at this time, the completeness criterion cannot be determined for these species. Additional logistical factors make it difficult to determine completeness for these species. Large volumes of water are needed to initiate toxicity testing – up to 35 gallons of water are needed per sample. Such large volumes of water are difficult to obtain a second time if a test fails to meet test acceptability criteria, as samples are collected by boat through an external agency, which requires additional coordination. Manpower, boat availability and water storage can be problematic. Moreover, organisms are obtained through a commercial source. Due to the limited number of organisms available for testing (with H. transpacificus especially, as it is considered an endangered species), obtaining additional organisms to repeat a test is difficult. Additionally, UCD ATL is limited to the particular hatchery batch culture of organisms available for testing. As the commercial batch culture increases in age, it becomes nearly impossible to repeat a test if organisms utilized in that test were younger than the organisms available in the commercial batch. These species’ sensitivity, combined with the aforementioned factors, make it nearly impossible to achieve a 90%

POD 2006-2007: QA/QC
125
completeness criterion. Such logistical considerations should be taken into account in future project planning in order to maintain acceptable QA/QC criteria.