pektin & gelatin
TRANSCRIPT
������� �� �������� � ������������������ ����� ��� ������
����� �� ������� ������� �� �������
���������� �� ������� ��� ������������ ���� ����������� ��� ������ ��������� ���������� ����� �� �� !"� � �
�����!� � "��� #$$$% ������� & ����' #$$�
��������
�'� ������� � �������('��'����'���� ������ ����� ��� )� *�����+� �� ����������� �� ����� ���'��*�� �� �'��� ��������������
������� �� ���'� �� ��������� �������� ���������� �������(,� ������ ��� ��������� ��� -..�/0 ����� �� #1�20 /# �3 ���� ����
���4 )��' .�$� /�&� �� 5�$0 ������� �� $�$� $�&� ��$� �� ��&0 ,� ������ )��� ���� ���� �!���'��� ����� �� ������� �� �������
��������!� ����� �!�������� )� ��� �� �!�� � �'�� ��� �� �������� �� �$ ���������� ������� ���� ��� �'���� ���+����� �'�
������ � ������ ����� �'� ����� �� ������� � ������� ���� 6��� �� ������� ���� �� ������ �� ����� �� ��)�� ���� ��'�!����
�������������� ������ ������ �'�� �� '��' ����� ������� �� ������ �������������� ������� �'�� !������ �� ���� � ��������
��7����� �������� �� ���!������ ���������� � �'� ����� �����������' �'��� ���������' ������ �'�� ������� �� �'� ����������'
�'�� )� ����������� �����' �� ��� �� ���������� �� ���� ��� ���������� ��� )��� ������ !������� � � � �� +�� �� ������� ��
�������� ���� ��� )��� ���� ������ )���� �� ���� �'�� ���� ������� ���� ��� )��' � '��' ����� � ���������� � �'� ����� �'��
)��� ������ � ������ 6����� ������� +�� ��������� ��������� !���� ��������� )��' ����� �� ������� -�� $�1$4� ��� 8��� �� �������9
-�� $�2:4� �� 7�!�� +�� ��������� ��������� !���� -�� $�2.4� � #$$� 3��!��� 6������ ��� ;�� ���'� ����!��
#��$���( �������% <�����% ���� ���% �������% =��!��% =��� �'���� ���+����
� ���� ������
6��������� ������ �������'���� �� ������� ���!��
���� ��������� ��������� �� � )�� ����� � ��
->������� ������� ? <'������ �11/4� �� ���� � ��'
'��������� '�!� ������ ���� �'� ��@��� � �� ���������
������ � ��!��������� ������ � �'� ������� � ��
��!����� �� �� ��������� � ��� -A���� �11&4� �'�
������' '� ����� �� ��������� '�) �'����� ���������
� ���� ��� �� ������ �� �'�� ����'����� -B)�� ?
"���� �1124� ; ������ � � ����� ���������� �������'�
'�!� ���� ������� �� �������� ��������� ������� �����
����'�� -C�������� �115% ���D���� ? ��E�������
�11&% >����� ;�����F�@��� ? ������� �11&% �������'��
�11/4� ���� �� -#$$$4 ������ �'�� �� ������ '���
�����) ��� �'� ������ � ��������� ���'���� ��
����������� �� ������ ���������� ���� �'�� '�) �'� ������
�� ��������'�� �� �'� ���������� � ������� �� �'� ����'�
E�� ��������� ������ ��� ���� �� ��' ���� �'�� ���
����� �����' � � �� �!�� ��� � �'� ���������� ��'���
��� �� ���������� ����� ��� ��� ���� �� ������� G���
�'������� ��� ��������� ������ ��� �������'� ���
��� ����'��� �� � ����� ������� �� �'� ��� � �'��� ��������
����� ������� ������ � ������ ���������� �����
��� ������ ��� ��� � �'� ���� ���)��� ���� ���D��
�� �'� �������� B����������� ���� �� �����!��� �� ��� ��
��� �'��� �������� ���� ������ � �����!� �� '����� �'� ������
������� � ����������� ����� ��� ������ -<����� �11&4%
'�)�!��� �'� �������� ������� '�!� ��!�� ���� ��*������
�+�� �� *�����+�� H���D� ������ �������� ����
����� ����� ��� ������� ������ ������� -�#$04 ��
� ����+���� ���������� � ��) ��������� )���'� ������
'����� -����� �� ���� ����4�
��'���D� F�@�������� �� �������I�! -�1:54 ����
�������� � ������� �� ��)����'���� ������ �� ��) �,
�� ��� �'�� �'� ������� ����������� ���� �� �� ��
��� �'��������� ���� �������I�! -�11$4 ���� �'�
������������� � ����� �*���� ������� � ������� ��
������ �� �!����� �'�� ������ �� !������ ��������
� G�E�� �,� ������������ �� ������ ����� � �����+���
����� E��)��)� ��)�� �� ���� -�11&�4% E��)��)� E���D�
��)�� �� ���� -�11&�4 '�!� ��� ��!������� �'� �'��
��'�!��� � �������������� �������� <���� -�11&4 ����
'��' ���� ��� �� ��) �, �������('��'����'���� -,�4
������ ��� �� ��� �'�� �'� ����������� '����
������� )��'( ��������� ������������� � ������� ������
=�� ,��������� �& -#$$�4 5/.J5&.
$#52�$$&K�$��L � �� ���� ������ � #$$� 3��!��� 6������ ��� ;�� ���'� ����!��
<AA( 6$#52�$$&K-$�4$$$//�.
)))����!��������������� ��'�
E���������� ���'��� ����(���2�/�25.�#15$% ��(���2�/�25.�5�.#�
%&���� �������' ��I�M����� -���� �������4�� E������ ���( >�� � A���� ����!��)� A��
�������� �, ���)��� .�.& �� .�#&� 5$ �3 !���N�!�
/$ �3 ���� ����� �� �������� ��������� ���� �����
����) /$�5$ )'�� /$ �3 ���� ���� )� ���
������� � ���� ��� ��� �� *�����+� �� ��������
������� ���������� ,��'�� ������ ��� ��� ��� ������� ��
��������� �� ������ ���� � ������ ��� ��� �� �'�
��� ����������� -,����� ? =�������� �11/% ��������
������ ? C���D��� �11�4� ��3!��� �������'�� ��
E���D -�12&�4 ������� ����(������� ��� �� ������ ����
�������� �����'��� ����� -������ �1:.4 �����'�
���)��� �)�� ���� B!���'��� ����� )��� �� ��
����� �� F�����D -�1:/4�
�'� ���'� � �����'���� ���+���� -=E<4 -F������ ?
�������� �12/4 '� ���� �� �� ������ �������
������� �� )'�� ����� *������ � �� ���������
������ �� �������� ������� �������� ��������7�!�� ������
������ �� ������� ���� -"����� ����� ? C����'���� �11.4�
=E< ��*���� �������� ���'�� ���������� �� ����� ����
��� �� ������������� �� �!���� �'��� �)� ��� � ��������
�� ����� � ������ �� �� ���������� ���� ����� �'�
���'� ����!���� ������� ������ ��� ���� ���������
���)��� ������� �� ����� �������� ���� �� ���
��!��!� �� �!������� � ������� ��������I� <�������
;����� -��)��� �1:&4 � �� �� �����I� �'� ����
�'� ������ ��� )� ������� �� *����� � �'� �������
� � ����� � ��������,� ���������� ����� ��� ��
����������� �� ����� ������� �� �� ������ �'� *�������
��!��� �� ��� ������������� )��' �'� ���� � ������'���
���������������������������� ��������'���
� ��������� �� ����� �
"(�( )��������
�'� ����)��� ��������� )��� �� �� �'� ���������� �
����� ���( ������� #&$ ; .$ ������� -6���� C���
A������� A���� F��D�'�� FA4� H�������� O����) ������
'��'����'���� ������ -6���� C���A������� A����
F��D�'�� FA4� ����� -��+�� 6����� A���� O��D���
GO4� /# �3 ���� ���� -;�� E��� <�������� ��������
A�4� �� ���� ������ ��� ����'����� -;�� =�� ;��
��!� ��!����� �������� A�4� �� ��*�� E���� $.#&
-F����� "��D���� E������� 6� ����� �B4� �� G;�
E'���� =��!�� FBG= F6 H6��.#21& -6���� C���
A������� A���� ���!��� <;4�
������� ������� � ������� �� ������ ��)�� )� �����
���� �� �� :�$. �� ���1&0 �� )���'�� �������!���� ��
!����� �!�� ����� ���� ;�B�;�E� ���'� �/�$$.
-;�B�;�E�� �12$4� <����� ������������� �� �'� H��������
O����) ������ ����� )� *�����+� �� �� ::�/� $�#0�
�� ������������� )��' �'��� !����� � 2$�$0 ��'����� +�����
����� ����� �� �$$�E �� & '� �� )���'��� ->����I� �1&�%
��� ? ,������� �1:24� �'� ����� � �����+������ �� �'�
H�������� O����) ������ ������ )� &1J5&0 -6����
C���A������� A���� F��D�'�� FA4� <������ ��� � �'�
���� ���� )� �������� �� �� 2��10 ���� �� ;CC3
���D AA ������� �� ���������� -E������� A���������
A���� C� ���� GO4�
"("( ���������� *+��� *���
"("(�( %,���������� ����*�
; ���������� ������I� . � / �������� ���� )�
������ )��' �)� �����( ������������� � �������
-.�$ )�0� /�& )�0� �� 5�$ )�04 �� ������������� �
'��'����'���� ������ -$�$ )�0� $�& )�0� ��$ )�0� ��
��& )�04� ,�)�!��� �'� ��������� ���������� 5�$ )�0 �����
��� �� ��& )�0 ������ )� ������ ������ �������� ���
������ ���� ��� �� ����� ����!� �� ����� ��� )��'
�'��������� ����������� �)� ��������� ����'� � ���'
��� )��� ��������
"("("( ���+����� ��� ���+����
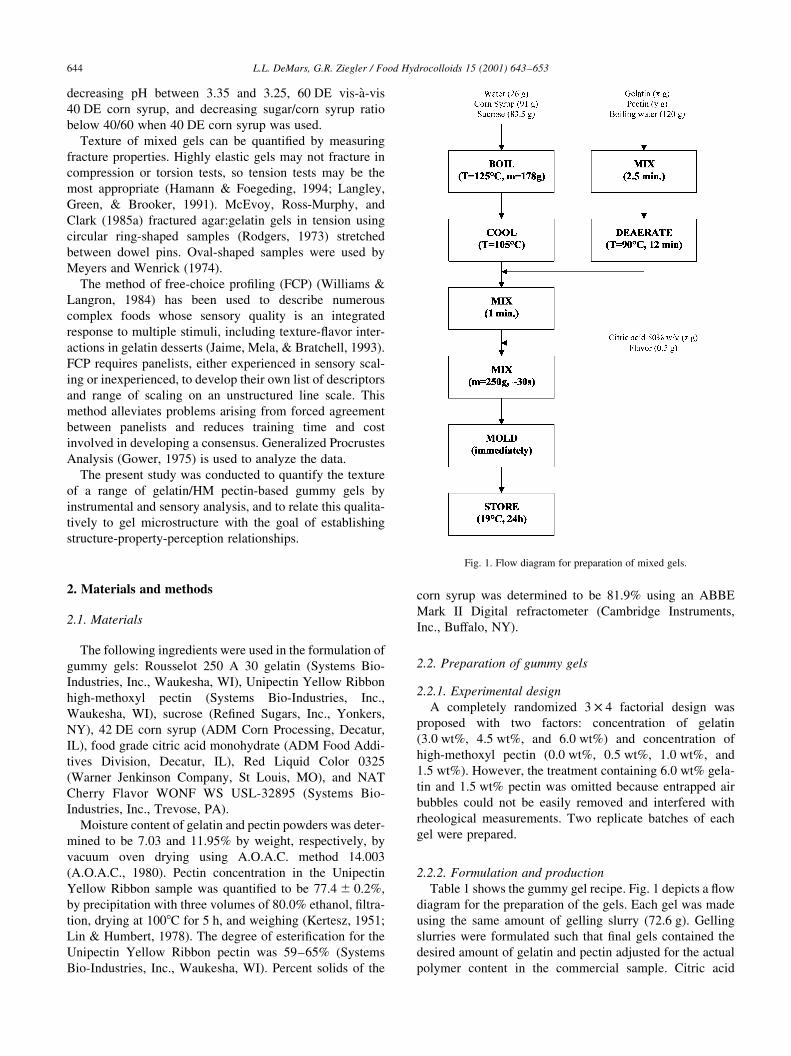
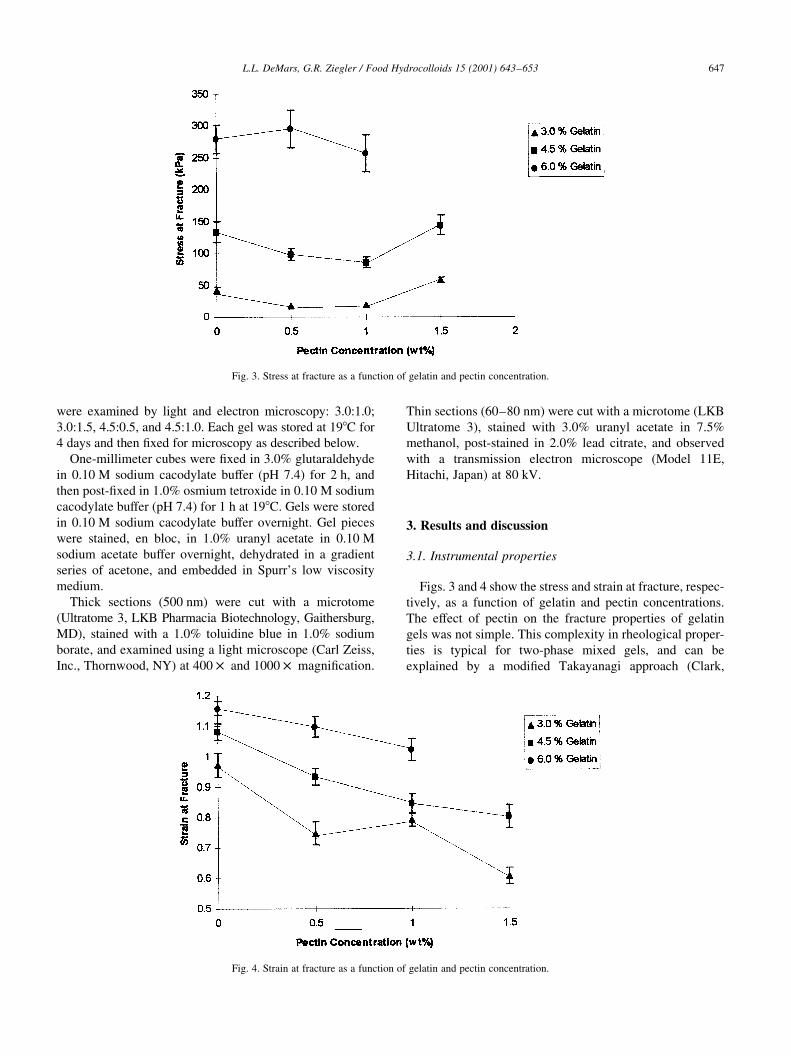
����� � '�) �'� ����� ��� ������� =��� � ����� � 7�)
������ �� �'� ����������� � �'� ���� 3��' ��� )� ���
���� �'� ��� ������ � ������� ����� -:#�5 �4� �������
������ )��� �������� ��' �'�� +��� ��� �������� �'�
���� ������ � ������� �� ������ �@��� �� �'� ������
������� ������� �� �'� ���������� ������ E����� ���
�(�( ��)���� -(.( /��*��� 0 �� 1��������� �2 3"!!�4 �567�265//
=��� �� =��) ������ �� ����������� � ���� ����
������� -&$0 )�!4 )� �� �� ������ � +��� �, �
.�.&� $�$&�
������� �� ������ ��)�� )��� ���� �����'�� ��
�� �� �#$�$ � ������� )���� �� � F����� E���������
C����� -������� E���� � ;������� G�) ,��� ��� E�4�
�'� ������ )� �� �� ��) ��� �� �������� �� � �#$ P
�'����� -6���� 3����� <����� E��� ������� B,4� ���������
�� �� /2 P �� ����� �)� �� #2 P � ��� & � �'� ����� )�
������� �� ������ ��!��� ��� @�� �� 1$�E �� � )����
���' -���� F�1� ,��D�� >�����'�� �������4� ������
����� ���������� ���� ����� ������ �� )���� )���
�����'� �� � ����� �� � �:2 � �� ��#&�E� 3!���������� ��� �'� ������ � ������� ������ ������ ���� �� 7�!��
�����'� �'� ������� �� �'� +��� ���� �� � #&$�$ ��
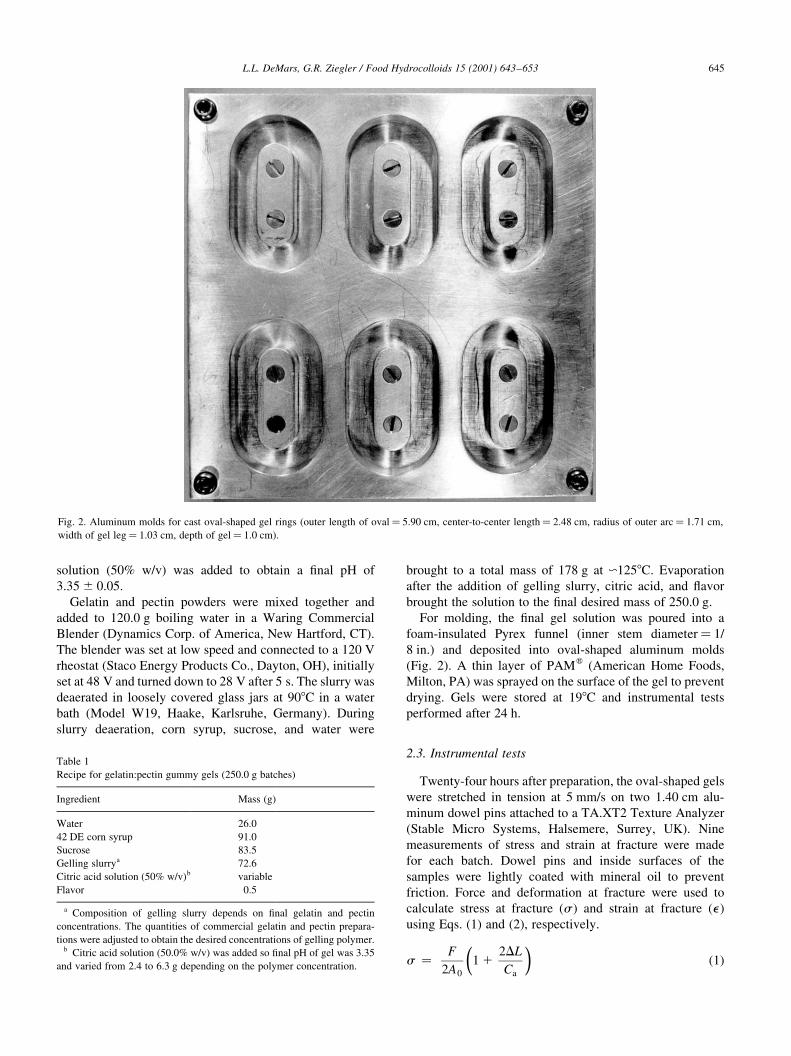
=�� ������� �'� +��� ��� ������� )� ����� ���� �
����������� <���� ����� -����� ��� �������� ��
2 ���4 �� ������ ���� �!���'��� �������� ���
-=��� #4� ; �'�� ����� � <;�� -;������� ,��� =���
������� <;4 )� ����� �� �'� �� ��� � �'� ��� �� ���!���
������ ��� )��� ���� �� �1�E �� ����������� ���
��� ���� � ��� #/ '�
"(6( 8����+������ �����
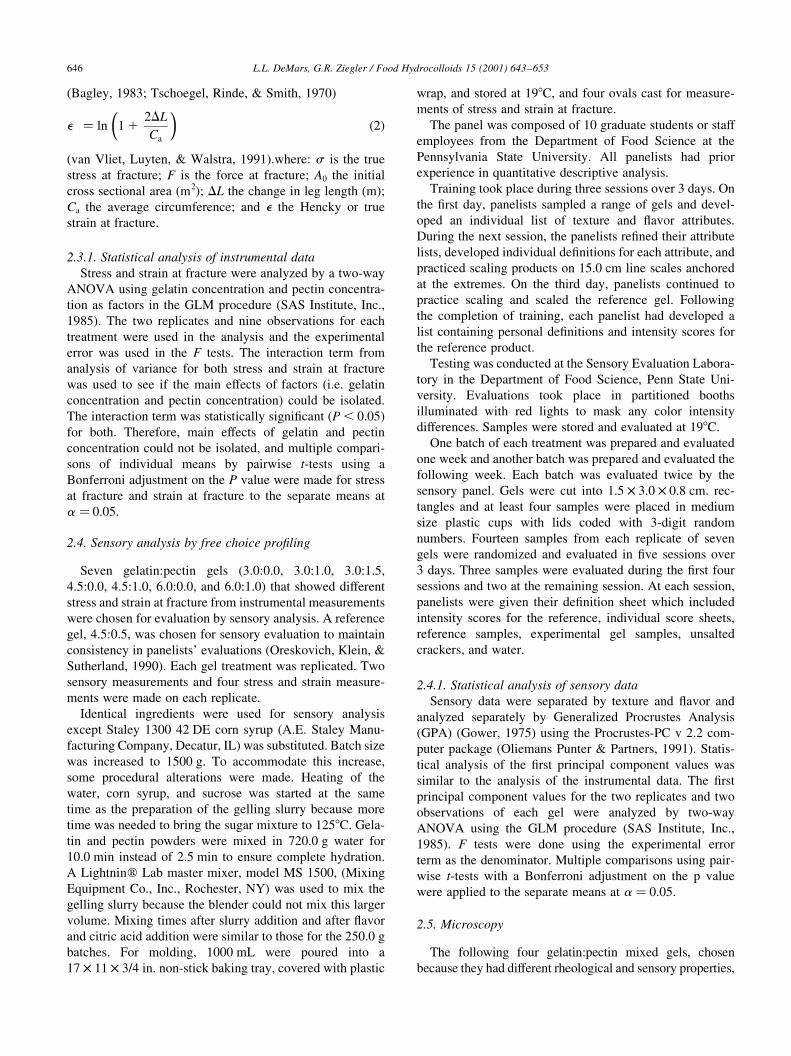
�)����� ��� '��� � ��� ������������ �'� �!���'��� ���
)��� �����'� �� ������ �� & ��� �� �)� ��/$ �� ����
����� �)�� ��� �����'� �� � �;�K�# ������� ;����I��
-6����� ����� 6����� ,�������� 6������ H>4� G���
���������� � ��� �� ����� �� ������� )��� ���
�� ���' ����'� ��)�� ��� �� ���� �� ��� � �'�
����� )��� ���'��� ����� )��' ������� ��� �� ���!���
�������� =���� �� � �������� �� ������� )��� �� ��
��������� ��� �� ������� -� 4 �� ����� �� ������� -� 4���� 3*� -�4 �� -#4� �������!����
� � �
#�$
��#��
9�
� ����
�(�( ��)���� -(.( /��*��� 0 �� 1��������� �2 3"!!�4 �567�26 5/&
=��� #� ;������� ��� �� ��� �!���'��� ��� ���� -����� �����' � �!��� &�1$ ��� ���������������� �����'� #�/2 ��� ���� � ����� ���� ��:� ���
)��' � ��� ���� ��$. ��� ���' � ���� ��$ ��4�
����� �
������ �� �������(������ ����� ��� -#&$�$ � ����'�4
A�������� �� -�4
F���� #5�$
/# �3 ���� ���� 1��$
6����� 2.�&
������� ������ :#�5
E����� ��� ������� -&$0 )�!4� !�������
=��!�� $�&
� E��������� � ������� ����� ���� �� +��� ������� �� ������
�������������� �'� *�������� � ���������� ������� �� ������ ��������
���� )��� �@��� �� ������ �'� ���� ������������� � ������� ��������� E����� ��� ������� -&$�$0 )�!4 )� �� � +��� �, � ��� )� .�.&
�� !���� ��� #�/ �� 5�. � ������� �� �'� ������� ��������������
-C������ �12.% ��'������ ����� ? 6���'� �1:$4
� � �� ��#��
9�
� ��#�
-!�� P����� ������� ? F������ �11�4�)'���( � � �'� ����
��� �� �������% � � �'� ���� �� �������% �$ �'� �������
��� �������� ���� -�#4% �� �'� �'���� �� ��� �����' -�4%
9� �'� �!����� ������ ������% �� � �'� ,���D� �� ����
����� �� ��������
"(6(�( ���������� �������� �����+������ ����
6��� �� ����� �� ������� )��� �����I� �� � �)��)��
;GBP; ���� ������� ������������� �� ������ ����������
���� � ����� �� �'� ��� �������� -6;6 A�������� A����
�12&4� �'� �)� ��������� �� ���� ����!����� �� ���'
��������� )��� �� �� �'� ������ �� �'� ������������
����� )� �� �� �'� � ���� �'� ����������� ���� ���
������ � !������� �� ���' ��� �� ����� �� �������
)� �� �� �� � �'� ���� � ��� � ����� -���� �������
������������� �� ������ �������������4 ���� �� �������
�'� ����������� ���� )� ����������� ����+���� -�� $�$&4
�� ���'� �'��� ���� ���� � ��� � ������� �� ������
������������� ���� ��� �� ������� �� �������� ��������
�� � ���!���� ���� �� ����)�� ����� ���� �
C�� ������ �@������ �� �'� � !���� )��� ��� �� ���
�� ������� �� ����� �� ������� �� �'� ������� ���� ��
� � $�$&�
"(5( ����� �������� �� ��� ����� ��:���*
6�!�� �������(������ ��� -.�$($�$� .�$(��$� .�$(��&�
/�&($�$� /�&(��$� 5�$($�$� �� 5�$(��$4 �'�� '�)� � �����
��� �� ����� �� ������� ��� ����������� ����������
)��� �'��� �� �!�������� �� ����� ������� ; �� ������
���� /�&($�&� )� �'��� �� ����� �!�������� �� ��������
��������� �� �������Q �!�������� -B��D�!��'� >����� ?
6��'������ �11$4� 3��' ��� ��������� )� ���������� �)�
����� ���������� �� ��� ��� �� ����� �������
���� )��� ��� �� ���' ����������
A������� ��������� )��� �� �� ����� ������
������ 6����� �.$$ /# �3 ���� ���� -;�3� 6����� �����
�������� E������� �������� A�4 )� ��������� C���' �I�
)� ������� �� �&$$ �� �� ���������� �'� ��������
��� ��������� ���������� )��� ���� ,������ � �'�
)����� ���� ����� �� ����� )� ����� �� �'� ���
���� � �'� ����������� � �'� ������� ����� ������ ����
���� )� ���� �� ����� �'� ���� ������� �� �#&�E� �������� �� ������ ��)�� )��� ���� �� :#$�$ � )���� ��
�$�$ ��� ����� � #�& ��� �� ����� �������� '��������
; ���'����� ��� ����� ������ ���� �6 �&$$� -������
3*������� E��� A���� ���'����� GO4 )� �� �� ��� �'�
������� ����� ������ �'� ������ ���� ��� ��� �'� ������
!������ ������ ���� � ��� ����� ������ �� � ��� 7�!��
�� ������ ��� ������ )��� ������ �� �'�� �� �'� #&$�$ �
����'�� =�� ������� �$$$ �� )��� ����� ���� �
�: � �� � .�/ ��� �������D ��D��� ����� ��!��� )��' ������
)���� �� ���� �� �1�E� �� ��� �!�� ��� �� �������
���� � ��� �� ����� �� ��������
�'� ����� )� ������ � �$ ������� ����� �� ��
�������� ��� �'� ���������� � =�� 6������ �� �'�
<�����!���� 6���� H��!������ ;�� ������� '� �����
���������� �� *���������!� �������!� �������
�������� ���D ����� ����� �'��� ���� �!�� . ��� B�
�'� +�� ��� ������� ����� � ����� � ��� �� �!���
��� �� ���!���� ��� � ������� �� 7�!�� ����������
������ �'� ���� ����� �'� ������� ��+�� �'��� ���������
���� �!����� ���!���� �+������ �� ���' ���������� ��
�������� ������ ������ �� �&�$ �� ���� ���� ���'���
�� �'� �������� B� �'� �'�� ��� ������� �������� ��
�������� ������ �� ���� �'� �� ������ ���� =����)���
�'� ���������� � ��������� ���' ������� '� �!����� �
��� ���������� ������� �+������ �� �������� ���� ��
�'� �� ������ �������
������ )� ������� �� �'� 6����� 3!�������� �������
���� �� �'� ���������� � =�� 6������� <��� 6���� H���
!������ 3!�������� ���D ����� �� ���������� ����'
���������� )��' �� ���'� �� ��D ��� ����� ��������
� ������� 6����� )��� ���� �� �!������ �� �1�E�B�� ����' � ���' ��������� )� ������� �� �!������
��� )��D �� ����'�� ����' )� ������� �� �!������ �'�
����)��� )��D� 3��' ����' )� �!������ �)��� �� �'�
����� ������ ��� )��� ��� ���� ��& � .�$ � $�2 ��� ����
������ �� �� ���� ��� ����� )��� ����� �� �����
�I� ������ ��� )��' �� ��� )��' .����� �����
������� =������� ����� ��� ���' ��������� � �!��
��� )��� ������I� �� �!������ �� +!� ���� �!��
. ��� �'��� ����� )��� �!������ ����� �'� +�� ���
���� �� �)� �� �'� ��������� ����� ;� ���' �����
������� )��� ��!�� �'��� �+������ '��� )'��' ������
�������� ���� �� �'� �� ������� ���!���� ���� '����
�� ������ ������ ������������ ��� ������ ������
����D��� �� )�����
"(5(�( ���������� �������� ������ ����
6����� ��� )��� ������� �� ������� �� 7�!�� ��
�����I� ��������� �� ��������I� <������� ;�����
-�<;4 -��)��� �1:&4 ���� �'� <��������<E ! #�# ����
����� ���D��� -B������ <����� ? <������� �11�4� 6�����
����� ������ � �'� +�� ��������� ��������� !���� )�
������ �� �'� ������ � �'� ����������� ���� �'� +��
��������� ��������� !���� �� �'� �)� ��������� �� �)�
����!����� � ���' ��� )��� �����I� �� �)��)��
;GBP; ���� �'� ��� �������� -6;6 A�������� A����
�12&4� � ��� )��� ��� ���� �'� ������������ �����
���� � �'� ����������� �������� ��������� ���� �����
)�� ����� )��' � C�� ������ �@������ �� �'� � !����
)��� ������ �� �'� ������� ���� �� � � $�$&�
"(2( )�������
�'� ����)��� ��� �������(������ ���� ���� �'���
������ �'�� '� � ����� �'��������� �� ����� ����������
�(�( ��)���� -(.( /��*��� 0 �� 1��������� �2 3"!!�4 �567�265/5
)��� ������� �� ���'� �� �������� ���������( .�$(��$%
.�$(��&� /�&($�&� �� /�&(��$� 3��' ��� )� ���� �� �1�E ��
/ �� �� �'�� +�� �� ��������� � ������ ����)�
B������������� ���� )��� +�� �� .�$0 ���������'��
�� $��$ � ���� ��������� �� �� -�, :�/4 �� # '� ��
�'�� ����+�� �� ��$0 ����� �������� �� $��$ � ����
��������� �� �� -�, :�/4 �� � ' �� �1�E� ��� )��� ������ $��$ � ���� ��������� �� �� �!�����'�� ��� �����
)��� ������ �� ����� �� ��$0 ������ ������� �� $��$ �
���� ������� �� �� �!�����'�� �'����� �� � �������
���� � �������� �� ����� �� 6����Q ��) !������
������
�'��D ������ -&$$ ��4 )��� ��� )��' � ���������
-H�������� .� �>C <'������� C�����'������� ����'�������
��4� ����� )��' � ��$0 �������� ���� �� ��$0 ����
������� �� ������� ���� � ���'� ��������� -E��� ����
A���� �'���)��� GO4 �� /$$ � �� �$$$ � �����+�������
�'�� ������ -5$J2$ ��4 )��� ��� )��' � ��������� -�>C
H�������� .4� ����� )��' .�$0 ������ ������� �� :�&0
���'����� ��������� �� #�$0 ��� �������� �� ����!�
)��' � ��������� �������� ��������� -���� ��3�
,����'�� "����4 �� 2$ DP�
� ������� �� ���������
6(�( 8����+������ ���������
=��� . �� / '�) �'� ��� �� ����� �� �������� ������
��!���� � � ������� � ������� �� ������ ��������������
�'� � ��� � ������ �� �'� ������� ��������� � �������
��� )� ��� ������ �'� ���������� �� �'��������� �������
��� � ������� �� �)���'�� ���� ���� �� ��� ��
�������� �� � ���+� ��D������� �������' -E���D�
�(�( ��)���� -(.( /��*��� 0 �� 1��������� �2 3"!!�4 �567�26 5/:
=��� .� 6��� �� ������� � � ������� � ������� �� ������ ��������������
=��� /� 6����� �� ������� � � ������� � ������� �� ������ ��������������
���'����� �������'�� ? 6����� �12.% >�����
������ G������ ? E���D� �11.% ��3!��� �������'�� ?
E���D� �12&�% F��D������ �� ,�������� �11/% �������
? ��I!�� �1214� �'��������� ��������� � ���� ��� ����)
����� ���� ��'�!��� )'�� �'� ������� ��� ��� �'�
��������� �'��� ����) ��)�� ���� ��'�!��� )'�� �'�
)��D�� ��� ��� �'� ��������� �'��� �� ��� �� ���)���
���� �� �� ���� �'� �'�� ��!����� ������
F'�� ��� �� �� ���� ��� =��� .� � �'�� �� . �� /�&0
�������� �'� ������ � �!�� $�&0 ������ ���� �'��
��!����� ��� � ��������������� ���)��D �� � �������
������� ���)��D �� � ��������� �� �'� ��)�� �����
C��)��� � �� ��&0 ������� �'� ��������� )� ���������
�� �'� ��� �� ������� ����� �� ������� ������ ;� 50
�������� �'� ��� �� ������� ������� ���)��� $ �� $�&0
������ ������ �� ������� ����� ���� ��'�!���� �'� ���
�'�� ������ ���)��� $�& �� ��$0 ������ � �'�� ��!���
��� ������ �'� � ������ ���� ��� )��� ������ � �������
������ � ������ �� �� ��*���� �� ���� �'�� ��!����� ��
'��'�� ������� �������������� ,�)�!��� R�'������ )��'���
����'����� � �'������Q -6����� ������� �������������4�
=��� / ��!��� �'�� �'� ����� �� ������� ������ �
������ )� �� �� � ������� ���� �'� )��� ��� ��
���+�� �'� ���������� �'�� ������ R'�����Q � �������
���)��D -<����� �11&4� �'� �������� �� ����� �� �������
��� 5�$($�$ �� 5($�& � ������ �� �'� ��'�!��� � ����������
��� ��� -��3!�� �� ���� �12&�4� �'�� ��� �'�� � �'�
���������� � ������� �� �'� �����������' �'�� ������
��)�� �'�� ��!������ �'� ����� �� ������� � �'� ����
��� ��� ������� �'� �������� ����� �� ������� ������
��� )��' �'� �������� � <���� -�11&4 �'�� �������(,�
������ ��� '�!� ��������� ����������� ���)��� ������
������� ��� �� ������� ������ ����
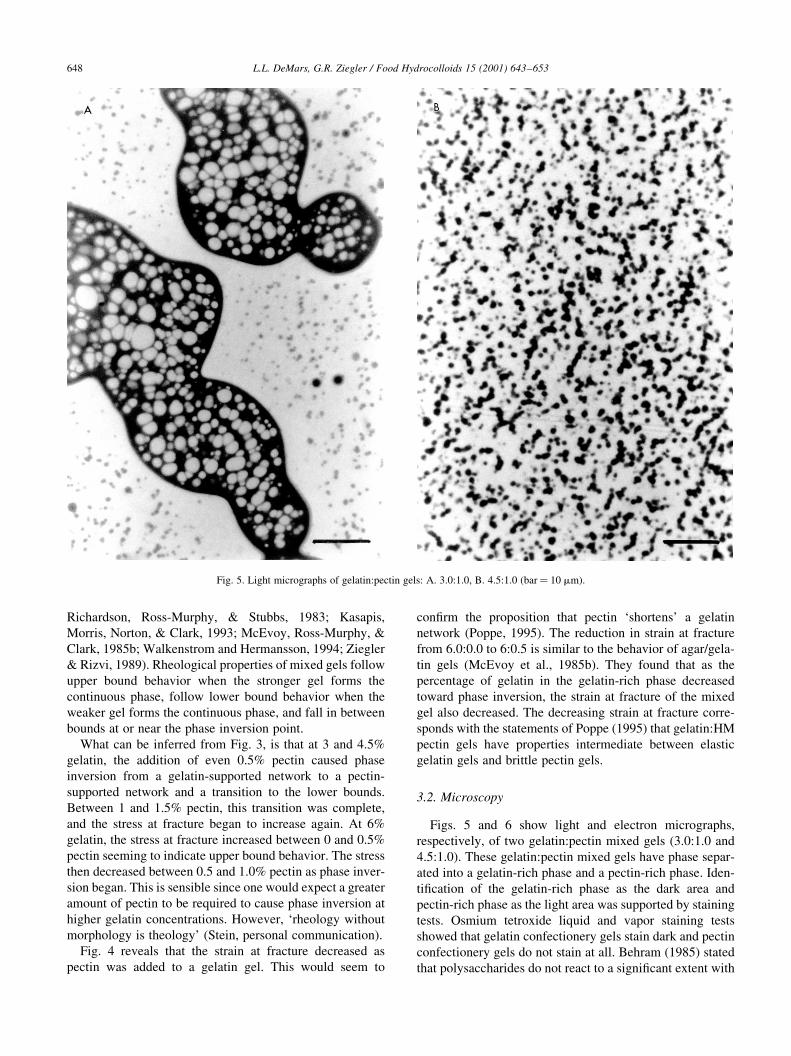
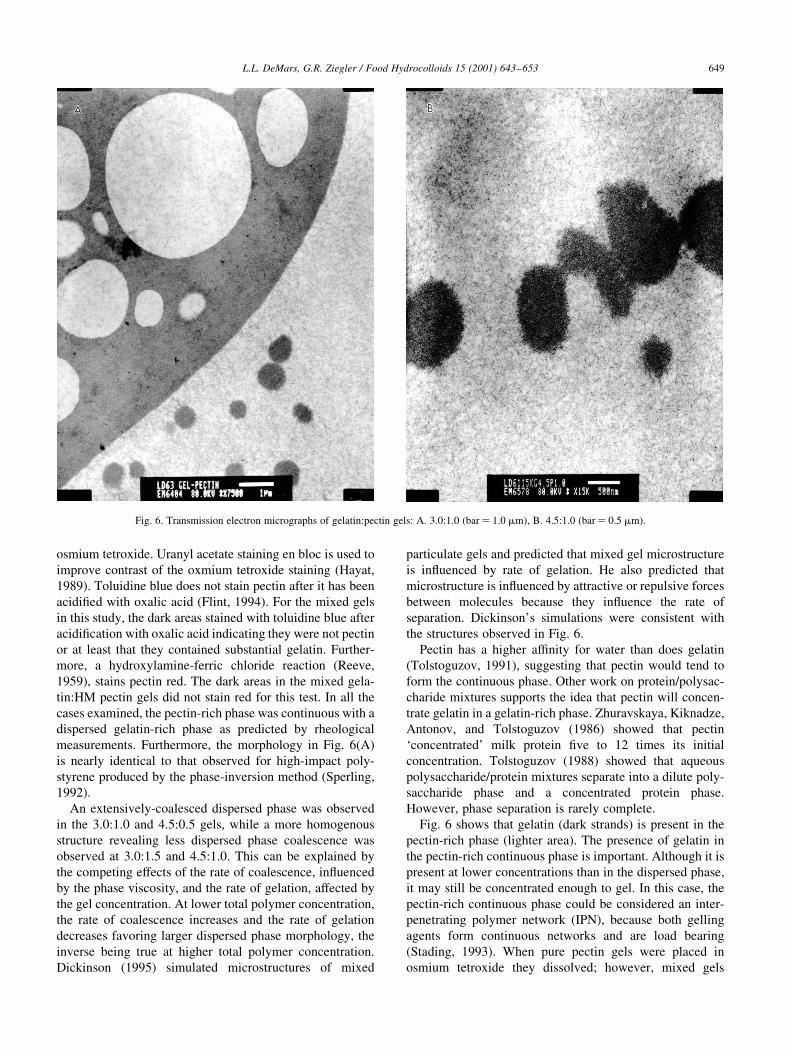
6("( )�������
=��� & �� 5 '�) ���'� �� �������� ���������'�
�������!���� � �)� �������(������ ���� ��� -.�$(��$ ��
/�&(��$4� �'�� �������(������ ���� ��� '�!� �'�� �����
��� ���� � �����������' �'�� �� � ����������' �'��� A���
��+������ � �'� �����������' �'�� � �'� ��D ���� ��
����������' �'�� � �'� ���'� ���� )� ������� �� �������
���� B���� �������� ��*�� �� !���� ������� ���
'�)� �'�� ������� ��� ��������� ��� ���� ��D �� ������
��� ��������� ��� � ��� ���� �� ���� C�'��� -�12&4 ����
�'�� �������'���� � ��� ����� �� � ����+���� ������ )��'
�(�( ��)���� -(.( /��*��� 0 �� 1��������� �2 3"!!�4 �567�265/2
=��� &� ���'� ���������' � �������(������ ���( ;� .�$(��$� C� /�&(��$ -���� �$ ��4�
����� ��������� H����� ������� ������� �� ���� � �� ��
�����!� ������� � �'� ������ �������� ������� -,�����
�1214� �������� ���� �� ��� ���� ������ � ��� �� '� ����
����+� )��' ������ ��� -=����� �11/4� =�� �'� ���� ���
�� �'� ���� �'� ��D ���� ����� )��' �������� ���� � ���
����+������ )��' ������ ��� ��������� �'�� )��� ��� ������
�� �� ���� �'�� �'�� �������� ��������� �������� =���'���
����� � '������������ ����� �'����� �������� -���!��
�1&14� ���� ������ ��� �'� ��D ���� �� �'� ���� �����
���(,� ������ ��� � ��� ���� �� �� �'� ���� A� ��� �'�
��� �������� �'� ����������' �'�� )� ��������� )��' �
����� �����������' �'�� � ������� �� �'���������
����������� =���'������� �'� ����'����� �� =��� 5-;4
� ������ �������� �� �'�� ����!� �� '��'������� �����
������ ������ �� �'� �'�����!����� ���'� -6��������
�11#4�
;� ������!����������� ����� �'�� )� ����!�
�� �'� .�$(��$ �� /�&($�& ���� )'��� � ���� '��������
�������� ��!������ �� ����� �'�� ���������� )�
����!� �� .�$(��& �� /�&(��$� �'� ��� �� �������� ��
�'� ��������� � ��� � �'� ���� � ����������� ��7�����
�� �'� �'�� !������� �� �'� ���� � ��������� � ���� ��
�'� ��� �������������� ;� ��)�� ����� ������� ��������������
�'� ���� � ���������� ������� �� �'� ���� � ��������
������ �!����� ������ ����� �'�� ����'������ �'�
��!��� ����� ���� �� '��'�� ����� ������� ��������������
���D���� -�11&4 ������� ������������� � ����
����������� ��� �� ������� �'�� ���� ��� �������������
� ��7����� �� ���� � ��������� ,� ��� ������� �'��
������������� � ��7����� �� ��������!� �� ������!� ����
���)��� �������� ������ �'�� ��7����� �'� ���� �
���������� ���D����Q ��������� )��� �������� )��'
�'� �������� ����!� �� =��� 5�
<����� '� � '��'�� � +���� �� )���� �'�� �� �������
-�������I�!� �11�4� �������� �'�� ������ )��� ��� ��
��� �'� ��������� �'��� B�'�� )��D �� ���������������
�'���� ������� ������ �'� ��� �'�� ������ )��� �������
����� ������� �� � �����������' �'��� �'���!D���� >�D��I��
;�����!� �� �������I�! -�1254 '�)� �'�� ������
R�����������Q ���D ������� +!� �� �# ���� �� �������
�������������� �������I�! -�1224 '�)� �'�� �*����
�������'������������ ������� ������� ���� � ����� �����
���'���� �'�� �� � ����������� ������� �'���
,�)�!��� �'�� ��������� � ������ ���������
=��� 5 '�) �'�� ������� -��D ����4 � ������ �� �'�
����������' �'�� -���'��� ����4� �'� ������� � ������� ��
�'� ����������' ��������� �'�� � ���������� ;��'���' �� �
������ �� ��)�� ������������� �'�� �� �'� ����� �'���
�� ��� ���� �� ����������� �����' �� ���� A� �'� ���� �'�
����������' ��������� �'�� ���� �� ������� �� ������
����������� ������� ���)��D -A<G4� ������ ���' �������
����� ��� ��������� ���)��D �� ��� ��� �������
-6������ �11.4� F'�� ���� ������ ��� )��� ����� ��
����� �������� �'�� ���!�% '�)�!��� ���� ���
�(�( ��)���� -(.( /��*��� 0 �� 1��������� �2 3"!!�4 �567�26 5/1
=��� 5� ��������� �������� ���������' � �������(������ ���( ;� .�$(��$ -���� ��$ ��4� C� /�&(��$ -���� $�& ��4�
������� ������� �� ������ �'�� ������� ��� � ���������
���)��D )��'�� �'� ����������' �'��� �'� ����� ��� ���)���
�'� ����� �����������' �'�� �� �'� ��������� �������
���' �'�� ���D ����� ��������� � '�)� �� =��� 5�
6������� ������ ���)��� �'� +���� �� ������ '� ����
'�)� �� ������� �'� ��� �� ����� �� ������� -C��)����
3���� ������ ? ����� �12:4�
�'� ����������' �'�� ��� �'� ��������� �'�� �!�� ��
��) ������ ������������� �������� ������ �� ������� ����
��!��� �� ��� �� � '��'�� ������������ C����� �'�
��������� �'�� ���� ��� � �'� ��� ����� � ���������
�� ���������� ��� �� �'� ���� ��� ��������� -E���D�
���'����� �������� �������'�� ? F��!��� �12#%
F��D������ ? ,������� �11/% ������� ? ��I!��
�1214� �'��� ���� �'� ���������������� ������� ���)��D
)��'�� �'� ����������' �'�� ��� '��� ������� �'� �������
���� �'��������� ������� ���������� C��' �'� ������� ������
���)��D �� �'� ���� ������ ������� ���)��D ���������� ��
�'� ���� ��� ����������
6(6( ����� ��������
>��)���� � �������� �� �'������ ���� �� �� )'�� ��
��� �� ������ �� '���� ����� ����������� ; ��� �'�
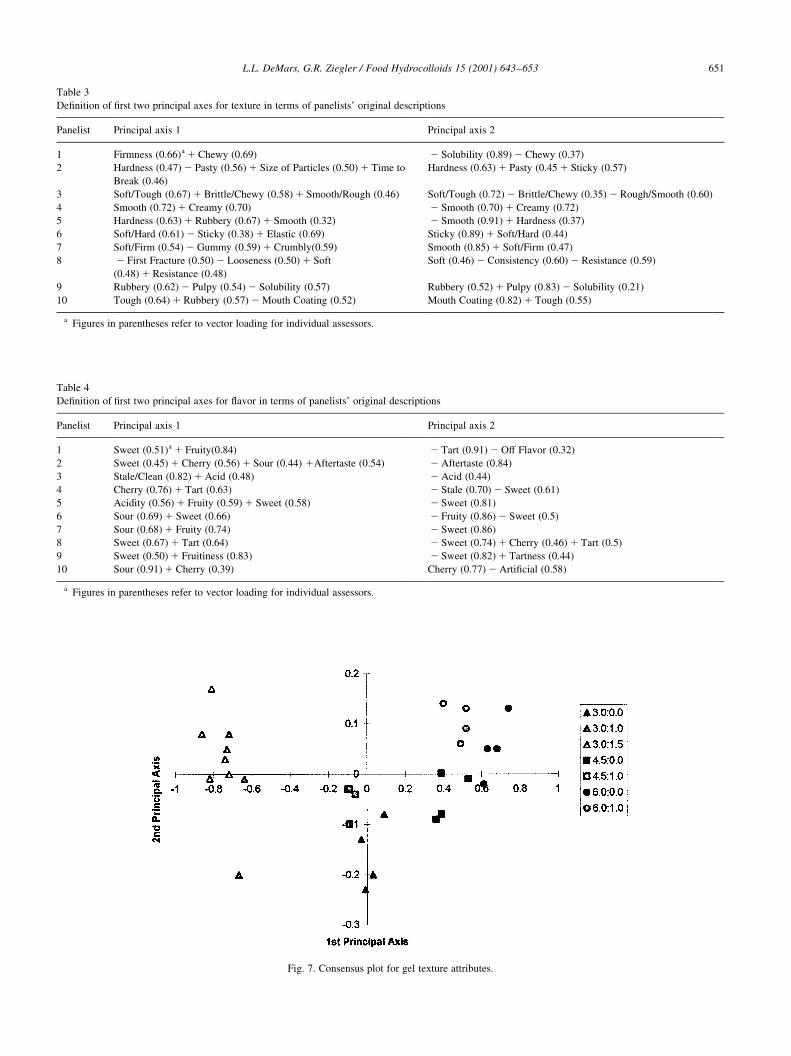
���'� � =��� E'���� <��+���� -=E<4� �'� �$ �������
�!����� �'��� �)� ��� � �������� -����� #4� B�� �����
���� �� =E< � �'�� ������� ���������� ������ ���������
�'����� �'������� ������� � �'� ���!�������� )��
�� �� ������ ��'� ��������I� �������� ������ � �'��
�� �� ����������� ���!� �'� ����������� �� �'� ��� �
��������� ����������
=�� �������� �'� +�� �)� ��������� ��� �������� ��
2#�&0 � �'� !������� �� �'� ���� ���� ���� ����� .
'�) �'� ������ !���� �� ��������� � ���!���� ������
�� �� =��� : ����� �'� ������ ���� �� ������� ������
��������� � �'� +�� ��������� ���� �'� ������ � ��$0
������ �� ��� �'��� ������������� � ������� ������ �� ���
������ !������� � � ���� ���� �������� ����� �� ����D
������ '�!��� ������ ��������� �� ���� ��������� �'��
���� ������� ���� � '�)� �� �'� ��)�� +�� ���������
��� ����� �'� ������� � �'� .�$(��$ �� .�$(��& ��� )�
��� ����+������ � ����� -�� $�$&4� B�� �������������� �
�'� ������ �� ����!� � ����+���� � ������ � �'�� �'�
+���� �� ��������� � �'�� �)� ��� )��� �������
���'����� ��� �'�� �'� ������ ���� �� ������ ���������
�'�� ��� � �'� ������� ��� �� ���� �� �'� ����� �������
����������� �� �'� .�$(��$ ���� �'� ������ � ��$0 ������
� ���� ������� ��� �� /�& �� 5�$0 � �'�� �'�� )���
���������'���� ��� .�$ �� /�&0 ������� ����� �� �'�
+�� ��������� ���� ,�)�!��� �'� ���� ��������� ���
)� � ����!� �� �������'��� .�$($�$ ��� /�&(��$ ���
�� /�&($�$ ��� 5�$(��$ ����
=�� 7�!��� �'� +�� �)� ��������� ��� �������� ��
&2�#0 � �'� !������� �� �'� ���� ���� ���� ����� /
�� =��� 2 ����� �'� ������ !���� �� ������ ����
�� 7�!��� �'� +�� ��������� ��� � ����!��� � ���������
��� ��� �� �'� �������(������ ������ )��' �'�� '�!���
������!��� ���� ������ ������ � ���� ������ ����
)��� �� ���� ����� ���� ��������� ���� ������ 7�!�� �!���
���� <���� ������� ��� )��� � ��������� ����� �'� ����
��������� ��� ��������� �� �'� � ������ �� )����� ������
���� 6)����� �������� )� ��!����� ������������ �� �����
��� ��������������
�'� +�� ��������� ��������� !���� �� ����� �������
��������� )��' ����� �� ������� -�� $�1$4� ��� -��� ��
�(�( ��)���� -(.( /��*��� 0 �� 1��������� �2 3"!!�4 �567�265&$
����� #
;@����!� ���� �� �'� ������ � ��� �� �'� �$ �������
<������ =��!�� �������
� 6)��� 6� ��=���
���� E'�)�
=����� 6���������
B 7�!�� 6���D�
# 6)��� ,����
E'���� <���
6��� 6�I� � ��������
; ������� 6���D�
���� �� ����D ���� ��������
. ;�� 6� ������'
=����� C�������E'�)�
6)��� 6����'�����'
6�����E����
/ E'���� 6����' C��������' ����
6������ E������E�����
6)���
����
& ;������6����� ,���� -=�����4
=����� E'�)��� -�������4
6)����� 6����'��
6���D���
E����
5 6��� 6� ��,��
6)��� 6���D�
=����� 3�����
: 6)��� 6� ��=���
6��� �����
=����� E������
6����'�������
2 6)��� =���� �� +�� �������
E'���� ������
���� 6� �
E��������
��������
1 6)����� �������
=������� <����
������ 6���������
E'������
�$ 6��� ����'��
E'���� �������
6)����� ����' �������
�(�( ��)���� -(.( /��*��� 0 �� 1��������� �2 3"!!�4 �567�26 5&�
����� .
��+������ � +�� �)� ��������� ��� �� ������� �� ���� � �������Q �������� ���������
<������ <�������� ��� � <�������� ��� #
� =����� -$�554� � E'�)� -$�514 � 6��������� -$�214� E'�)� -$�.:4
# ,���� -$�/:4� <��� -$�&54� 6�I� � <������� -$�&$4� ���� ��
C���D -$�/54
,���� -$�5.4� <��� -$�/&� 6���D� -$�&:4
. 6� ������' -$�5:4� C�������E'�)� -$�&24� 6����'�����' -$�/54 6� ������' -$�:#4� C�������E'�)� -$�.&4� ����'�6����' -$�5$4
/ 6����' -$�:#4� E����� -$�:$4 � 6����' -$�:$4� E����� -$�:#4
& ,���� -$�5.4� ������� -$�5:4� 6����' -$�.#4 � 6����' -$�1�4� ,���� -$�.:4
5 6� ��,�� -$�5�4� 6���D� -$�.24� 3����� -$�514 6���D� -$�214� 6� ��,�� -$�//4
: 6� ��=��� -$�&/4� ����� -$�&14� E������-$�&14 6����' -$�2&4� 6� ��=��� -$�/:4
2 � =��� =������� -$�&$4� ������ -$�&$4� 6� �
-$�/24� �������� -$�/24
6� � -$�/54� E�������� -$�5$4� �������� -$�&14
1 ������� -$�5#4� <���� -$�&/4� 6��������� -$�&:4 ������� -$�� <���� -$�2.4� 6��������� -$�#�4
�$ ����' -$�5/4� ������� -$�&:4�����' E������ -$� ����' E������ -$�2#4� ����' -$�&&4
� =����� �� ������'�� �� �� �� !����� ������ �� ���!���� �����
=��� :� E����� ���� �� ��� ������� ����������
����� /
��+������ � +�� �)� ��������� ��� �� 7�!�� �� ���� � �������Q �������� ���������
<������ <�������� ��� � <�������� ��� #
� 6)��� -$�&�4� � =�����-$�2/4 � ���� -$�1�4�B =��!�� -$�.#4
# 6)��� -$�/&4� E'���� -$�&54� 6��� -$�//4 �; ������� -$�&/4 � ; ������� -$�2/4
. 6�����E���� -$�2#4�;�� -$�/24 � ;�� -$�//4
/ E'���� -$�:54� ���� -$�5.4 � 6���� -$�:$4� 6)��� -$�5�4
& ;����� -$�&54� =����� -$�&14� 6)��� -$�&24 � 6)��� -$�2�4
5 6��� -$�514� 6)��� -$�554 � =����� -$�254� 6)��� -$�&4
: 6��� -$�524� =����� -$�:/4 � 6)��� -$�254
2 6)��� -$�5:4� ���� -$�5/4 � 6)��� -$�:/4� E'���� -$�/54� ���� -$�&4
1 6)��� -$�&$4� =������� -$�2.4 � 6)��� -$�2#4� ������ -$�//4
�$ 6��� -$�1�4� E'���� -$�.14 E'���� -$�::4�;���+���� -$�&24
� =����� �� ������'�� �� �� �� !����� ������ �� ���!���� �����
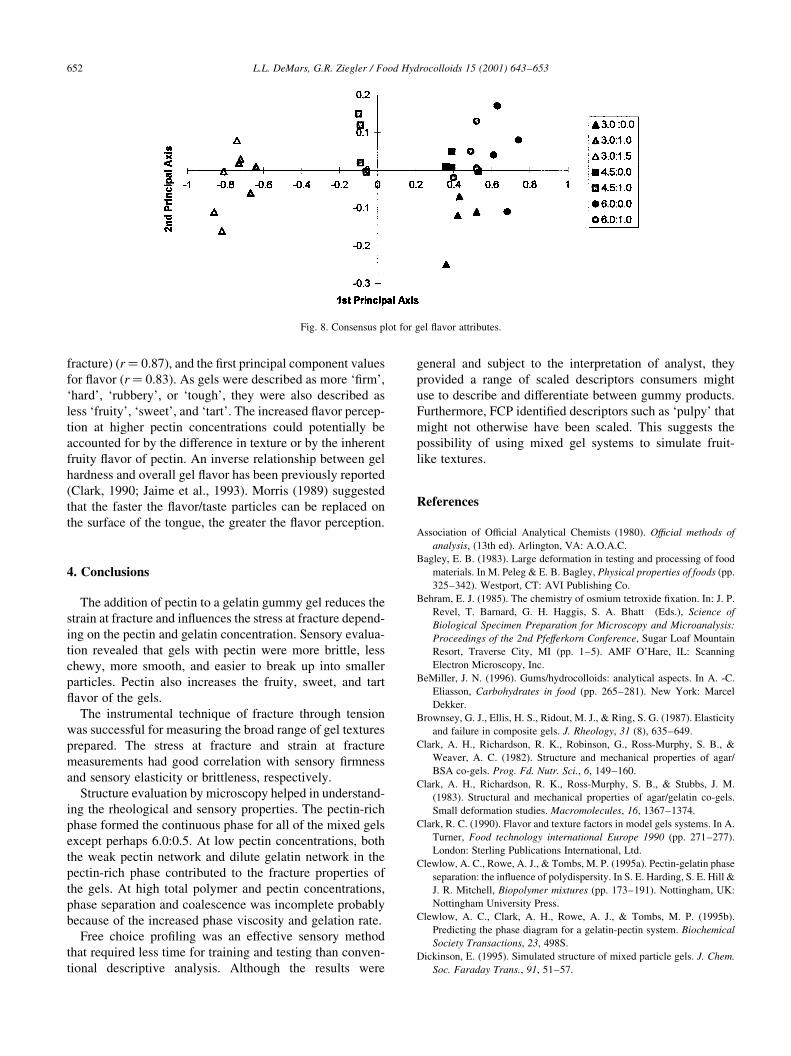
�������4 -�� $�2:4� �� �'� +�� ��������� ��������� !����
�� 7�!�� -�� $�2.4� ; ��� )��� ������ � ���� R+��Q�
R'��Q� R�������Q� �� R����'Q� �'�� )��� ��� ������ �
�� R �����Q� R)���Q� �� R����Q� �'� ������� 7�!�� �������
���� �� '��'�� ������ ������������� ���� ����������� ��
�������� �� �� �'� � ������ �� ������� �� �� �'� ��'�����
����� 7�!�� � ������� ;� ��!��� ��������'�� ���)��� ���
'���� �� �!����� ��� 7�!�� '� ���� ���!����� �������
-E���D� �11$% "���� �� ���� �11.4� ����� -�1214 ������
�'�� �'� ���� �'� 7�!������� �������� ��� �� ������� ��
�'� �� ��� � �'� ������� �'� ������� �'� 7�!�� �����������
� �����������
�'� ������ � ������ �� � ������� ����� ��� ����� �'�
����� �� ������� �� ��7����� �'� ��� �� ������� �����
��� �� �'� ������ �� ������� �������������� 6����� �!�����
���� ��!���� �'�� ��� )��' ������ )��� ���� �������� ��
�'�)�� ���� ����'� �� ����� �� ����D �� ���� ������
��������� <����� ��� ������� �'� ������ )���� �� ����
7�!�� � �'� ����
�'� ����������� ���'��*�� � ������� �'����' ������
)� ���� �� �� �������� �'� ���� ����� � ��� �������
�������� �'� ��� �� ������� �� ����� �� �������
���������� '� ��� ����������� )��' ����� +����
�� ����� ��������� �� ���������� �������!����
6�������� �!�������� �� ��������� '���� �� ��������
��� �'� �'��������� �� ����� ���������� �'� ����������'
�'�� ���� �'� ��������� �'�� �� ��� � �'� ���� ���
������ ���'�� 5�$($�&� ;� ��) ������ �������������� ���'
�'� )��D ������ ���)��D �� ����� ������� ���)��D �� �'�
����������' �'�� ���������� �� �'� ������� ��������� �
�'� ���� ;� '��' ����� ������� �� ������ ��������������
�'�� ��������� �� ���������� )� ���������� ��������
������ � �'� ������� �'�� !������ �� �������� �����
=��� �'���� ���+���� )� �� � ����!� ����� ���'�
�'�� ��*���� �� ���� �� �������� �� ������ �'�� ���!���
������ �������!� ������� ;��'���' �'� ����� )���
������� �� ��@��� �� �'� �������������� � ������� �'��
���!�� � ����� � ���� �������� ������� ���'�
�� �� ������ �� � ��������� ���)��� ����� �������
=���'������� =E< �����+� �������� ��' � R�����Q �'��
���'� ��� ��'��)�� '�!� ���� ����� �'� ����� �'�
��������� � ���� ���� ��� ���� �� ������� �����
��D� ��������
����������
;�������� � B +���� ;��������� E'���� -�12$4� ;:���� ������
��������� -�.�' �4� ;��������� P;( ;�B�;�E�
C������ 3� C� -�12.4� ����� � �������� �� ������ �� �������� � ��
��������� A� �� <���� ? 3� C� C������ �������� ��������� �� -���
.#&J./#4� F������� E�( ;PA <����'��� E��
C�'���� 3� "� -�12&4� �'� �'������ � ����� �������� +������� A�( "� <�
��!��� �� C������ �� ,� ,����� 6� ;� C'��� -3�4� ������
���*���� ������� ���������� � )������� ��� )�����������'
��������*� ��� "�� ������� 9�������� 6���� ��� ��������
������ ���!��� E���� �A -��� �J&4� ;�= BQ,���� A�( 6�������
3������� ���������� A���
C�������� "� G� -�1154� ����'���������( ���������� ������ A� ;� �E�
3������ 9����������� �� � -��� #5&J#2�4� G�) O��D( ������
��DD���
C��)���� �� "�� 3���� ,� 6�� ������ �� "�� ? ����� 6� �� -�12:4� 3��������
�� ������ �� �������� ���� <( .���*�� 6� -24� 5.&J5/1�
E���D� ;� ,�� ���'����� �� >�� �������� ��� �������'�� 6� C�� ?
F��!��� ;� E� -�12#4� 6�������� �� ���'������ ��������� � �����
C6; ������� ��*( ��( =+��( ��(� �� �/1J�5$�
E���D� ;� ,�� ���'����� �� >�� �������'�� 6� C�� ? 6����� "� ��
-�12.4� 6��������� �� ���'������ ��������� � ������������ �������
6���� � �������� ����� )�������+���� ��� �.5:J�.:/�
E���D� �� E� -�11$4� =��!�� �� ������� ����� �� ���� ��� ����� A� ;�
������� �� ������*� ������������ %+��� �>>! -��� #:�J#::4�
�����( 6������� <���������� A������������� ���
E��)��)� ;� E�� ��)�� ;� "�� ? ����� �� <� -�11&�4� <������������� �'��
���������( �'� ��7����� � ������������ A� 6� 3� ,������ 6� 3� ,��� ?
"� �� ����'���� �������� ��,�+��� -��� �:.J�1�4� G������'��� H>(
G������'�� H��!����� <���
E��)��)� ;� E�� E���D� ;� ,�� ��)�� ;� "�� ? ����� �� <� -�11&�4�
<�������� �'� �'�� ������ �� � �������������� ����� ����������
����� ������������ "6� /126�
���D����� 3� -�11&4� 6������� �������� � ���� �������� ���� <( 9���(
�( ������� �����(� >�� &�J&:�
�(�( ��)���� -(.( /��*��� 0 �� 1��������� �2 3"!!�4 �567�265&#
=��� 2� E����� ���� �� ��� 7�!�� ����������
���D����� 3�� ?��E������� �� "� -�11&4� �������� �� � ������� G�)
O��D( C���D�� ;������ ? <�� �������
=����� B� -�11/4� �� ��������' � ���+�� ��������� ������ +���*
������ ��������� B� ��� H>( CAB6 6������+� <����'���
��)��� "� E� -�1:&4� ��������I� �������� ������� ������������ 5! -�4�
..J&��
,������ �� ��� ? =�������� 3� ;� -�11/4� ;����� � ������� �������
���� �� ������ �� ������ �� ��� ������� ���������� A�( .���*�
�� �������� -���' � ��������� �������� ������' <��D ���������
GE( ���������� � =�� 6������ G���' E������� 6���� H��!������
,����� �� ;� -�1214� ���������� ��� ������?+�� ������� ��������
���*���� ������������ C��� ������ =�( E�E <��� A���
A���� �� -�11&4� ���� ��� ��� ��� ������� �� D�����������������
9���������� ����(� " -/4� ..:J..1�
"����� A�� ����� �� "�� ? C����'���� G� -�11.4� ; ��� � ��������7�!��
����������� ���� �����'���� ���+����� <( ����� �+�(� � �::J�22�
>����� ��� ;�����F�@��� <�� ? ������� 6� 6� -�11&4� ��������� �� ��'��
������� ���'��*�� �� �� �������� ������� ������ �� �� ������
��� ������*�� �� �::J�25�
>����� 6�� ������ 3� ��� G������ A� ��� ? E���D� ;� ,� -�11.4� <'��
�*�������� �� �������� �� ������������������� ����S<��� AP(
������������������� � �������� ������ 9���������� ����(�
"�� #51J#:5�
>����I� �� A� -�1&�4� ��� ������ �+��������� G�) O��D( A����������
<����'��� A���
>������� "� 3�� ������� �� "�� ? <'������ �� �� -�11/4� <'�����'������
��������� � �������( �������I����� !�� ��������� ��� �� +�� �����
����� A� �� O� O��� �� �� "��D��� ? "� �� 6���'� ������ ���+��+��&
+����� ������������ �� �� -��� �J#�4� G�) O��D( C���D��
;������ ? <�� �������
�������� >� ��� ������ �� ��� ? C���D��� C� 3� -�11�4� ���'������ �������
��� �� �������� � ���� �������� ��� A� 3� ���D����� ��
�������� *���� ��� ������ -��� .2.J/$.4� G��)��'( �'� �����
6������ � E'�������
���� ��� <� "� -#$$$4� =�� ��������� A� "� 3� ��I���� E� ;�T�U�� 3� <�����
;��� ? �� P� C������E�U��!�� ������ �� � ��*�������* -��� 5&J
:&4� ��������� <;( ���'����� <����'��� E�������
���� �� "�� ? ,������� 3� 6� -�1:24� �������� �'����������� � ����
����������� ������ ��� ��7�)�� '��� 9��( 8���( �� ��( ������(
<(� �� -.4� ��.J��5�
��3!��� ,�� �������'�� 6� C�� ? E���D� ;� ,� -�12&�4� ����� � �����
���� �� �������� ��������� � ���������� ���( �� 6����� ����������
��������� ����� ������� "�� �/2.J�/1#�
��3!��� ,�� �������'�� 6� C�� ? E���D� ;� ,� -�12&�4� ����� � �����
���� �� �������� ��������� � ���������� ���( #� ���� ��� �����
������� "�� �/1.J�&$$�
������ =� 6�� ? F�����D� "� �� -�1:/4� ; ��������� � ������ ���J
����� ��� ��� �������� ���� �� �!�� �������� .+���� 9���(
������(� 5@� �#�.J�#..�
������ 3� �� -�1214� <������'���� ������� ���������( ������� �'���������
�'��������I������ �� ����������� �� �� ����� A� "� C������� ?
�� E� >����� �������� �� ����������� ��������( 8( �� �����������
-��� �.#J�5.4� G�) O��D( 3��!��� ;����� 6�������
B������ <����� ? <������ -�11�4� ����+����&�9 �("("� H����'��
G��'�����( B<?< 6� �)��� ��!���������
B��D�!��'� �� E�� >����� C� <�� ? 6��'������ "� F� -�11$4� <�������
������ �� �� ����������� �� �����'���� �� ��'�� ����� ���+�����
A� ,� �� ��)�� ? C� <� >����� ����� ������� ����� A �����������
�� �� -��� .&.J.1.4� G�) O��D( ������ ���D��� A���
B)��� ;� "�� ? "���� �� ;� �� -�1124� �'������ � � ������������
�'������������ �� ������� ���������� �������� )�������+����
6�� :..5J:..1�
<����� "� -�11&4� G�) �������'� �� ������� ����� �� ��� ���������� A�(
3������� 6�� � �'� ���� �������� E�� �������� -3�4� ��������*�
��� 5>�� ���+�� ���+���� 9�������� ,��'��� <; -��� 52J:24�
E����� P������ <;( <�����!���� ���� �������� E�� ��������Q
;���������
���!�� �� �� -�1&14� ; ����+� '������������ ����� �'����� �������� ��
'����'������ ������I����� � ������� ���� ������*�� 6�� #$1J#���
������ F� ;� -�1:.4� ������ ��� )��' ��� ���� �������� .+����
9���( ������(� 5�� &25�
�������'�� C� 6� -3�4� -�11/4� <'����� ���'��*�� �� �'� ��� � ��
����������� G�) O��D( C���D�� ;������ ? <�� �������
6;6 A�������� A��� -�12&4� ����B� *+���' ���������� E���� GE( 6;6 A����
����� A���
6�������� �� ,� -�11#4� =��� /��/� ���/.� 8����+���� � �������� ������
�������� -#� �4� G�) O��D( "�'� F���� ? 6���
6������ �� -�11.4� .���*���� ������� �������� *��� �� ������� �
���+��+��� ��������( E'����� ��D��D� ,��D����
6����� �� H��!����� � ����'����� ������� ������������� �� ����'
E�����
�������I�!� P� C� -�1224� 6��� �'������'������ ���� � �������
�������� ���� ���� � �� 1���������� " -&4� ..1J.:$�
�������I�!� P� C� -�11$4� A���������� � ������� )��' �������'����� A�
�� B� <'������ -+�� ��� �������C��� � ��� � ���+���� -���
�&:J�:&4� P��� &� �����( 3��!��� ;����� 6������ <����'���
�������I�!� P� C� -�11�4� =��������� ��������� � �� ������� �� ����
� ���������������'���� ������������ �� 1���������� 5 -54�
/#1J/52�
��'������ G� F�� ����� "� ;�� ? 6���'� �� �� -�1:$4� �'���������
��������� � )'��� 7��� ���' AS���'� �� ���������� �'� �����
� �������� �� ������� ��������� �� ����� ������� <( ��( ��( �*���(�
"� -#4� 5&J:$�
��'���D� "� ;�� F�@�������� 3� 6�� ? �������I�!� P� C� -�1:54� �'�
�������� �� ��������� � ������� ��� � ������� �� ������� ���
=���+�*� "!� .#�J.#2�
!�� P����� ��� ������� ,�� ? F������ <� -�11�4� =������� �� ������� �
���� A� 3� ���D����� �� �������� *���� ��� ������ -��� .1#J/$.4�
G��)��'( �'� ����� 6������ � E'�������
F��D������� <�� ? ,�������� ;� �� -�11/4� ���� ��� � +��������
�� ����������� ���)��D � ������� �� )'�� �������� �� 1���&
������� -54� &21J5$:�
F������� ;� ;�� ? �������� 6� <� -�12/4� �'� �� � �����'���� ���+����
�� �'� �!�������� � ���������� ����� <( ��( �� �*���(� 62�
&&2J&52�
�'���!D���� G� ;�� >�D��I�� 3� P�� ;�����!� O�� ;�� ? �������I�!� P�
C� -�1254� E������������ � ������� � � ����� � �'� �'�� ���������
� )��������������������'���� ����� <��� #� ������������� � ���D
�������� ��� =���+�*� 6!� 5$�J5�.�
�������� �� ��� ? ��I!�� 6� 6� ,� -�1214� <�������� �'� ������ ������
����� � ���� ����������� )'��� ���� <( �� ��(� 25 -#4� /.$J/.5�
�(�( ��)���� -(.( /��*��� 0 �� 1��������� �2 3"!!�4 �567�26 5&.
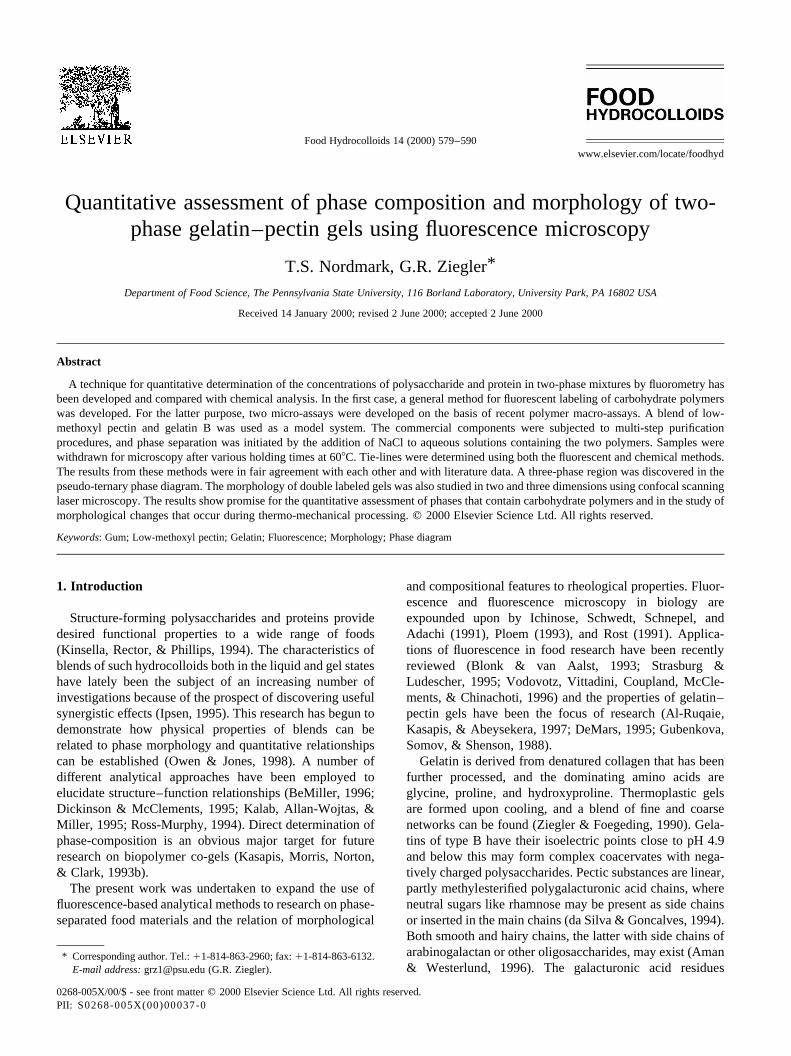
Quantitative assessment of phase composition and morphology of two-phase gelatin–pectin gels using fluorescence microscopy
T.S. Nordmark, G.R. Ziegler*
Department of Food Science, The Pennsylvania State University, 116 Borland Laboratory, University Park, PA 16802 USA
Received 14 January 2000; revised 2 June 2000; accepted 2 June 2000
Abstract
A technique for quantitative determination of the concentrations of polysaccharide and protein in two-phase mixtures by fluorometry hasbeen developed and compared with chemical analysis. In the first case, a general method for fluorescent labeling of carbohydrate polymerswas developed. For the latter purpose, two micro-assays were developed on the basis of recent polymer macro-assays. A blend of low-methoxyl pectin and gelatin B was used as a model system. The commercial components were subjected to multi-step purificationprocedures, and phase separation was initiated by the addition of NaCl to aqueous solutions containing the two polymers. Samples werewithdrawn for microscopy after various holding times at 608C. Tie-lines were determined using both the fluorescent and chemical methods.The results from these methods were in fair agreement with each other and with literature data. A three-phase region was discovered in thepseudo-ternary phase diagram. The morphology of double labeled gels was also studied in two and three dimensions using confocal scanninglaser microscopy. The results show promise for the quantitative assessment of phases that contain carbohydrate polymers and in the study ofmorphological changes that occur during thermo-mechanical processing.q 2000 Elsevier Science Ltd. All rights reserved.
Keywords: Gum; Low-methoxyl pectin; Gelatin; Fluorescence; Morphology; Phase diagram
1. Introduction
Structure-forming polysaccharides and proteins providedesired functional properties to a wide range of foods(Kinsella, Rector, & Phillips, 1994). The characteristics ofblends of such hydrocolloids both in the liquid and gel stateshave lately been the subject of an increasing number ofinvestigations because of the prospect of discovering usefulsynergistic effects (Ipsen, 1995). This research has begun todemonstrate how physical properties of blends can berelated to phase morphology and quantitative relationshipscan be established (Owen & Jones, 1998). A number ofdifferent analytical approaches have been employed toelucidate structure–function relationships (BeMiller, 1996;Dickinson & McClements, 1995; Kalab, Allan-Wojtas, &Miller, 1995; Ross-Murphy, 1994). Direct determination ofphase-composition is an obvious major target for futureresearch on biopolymer co-gels (Kasapis, Morris, Norton,& Clark, 1993b).
The present work was undertaken to expand the use offluorescence-based analytical methods to research on phase-separated food materials and the relation of morphological
and compositional features to rheological properties. Fluor-escence and fluorescence microscopy in biology areexpounded upon by Ichinose, Schwedt, Schnepel, andAdachi (1991), Ploem (1993), and Rost (1991). Applica-tions of fluorescence in food research have been recentlyreviewed (Blonk & van Aalst, 1993; Strasburg &Ludescher, 1995; Vodovotz, Vittadini, Coupland, McCle-ments, & Chinachoti, 1996) and the properties of gelatin–pectin gels have been the focus of research (Al-Ruqaie,Kasapis, & Abeysekera, 1997; DeMars, 1995; Gubenkova,Somov, & Shenson, 1988).
Gelatin is derived from denatured collagen that has beenfurther processed, and the dominating amino acids areglycine, proline, and hydroxyproline. Thermoplastic gelsare formed upon cooling, and a blend of fine and coarsenetworks can be found (Ziegler & Foegeding, 1990). Gela-tins of type B have their isoelectric points close to pH 4.9and below this may form complex coacervates with nega-tively charged polysaccharides. Pectic substances are linear,partly methylesterified polygalacturonic acid chains, whereneutral sugars like rhamnose may be present as side chainsor inserted in the main chains (da Silva & Goncalves, 1994).Both smooth and hairy chains, the latter with side chains ofarabinogalactan or other oligosaccharides, may exist (Aman& Westerlund, 1996). The galacturonic acid residues
Food Hydrocolloids 14 (2000) 579–590
0268-005X/00/$ - see front matterq 2000 Elsevier Science Ltd. All rights reserved.PII: S0268-005X(00)00037-0
www.elsevier.com/locate/foodhyd
* Corresponding author. Tel.:11-814-863-2960; fax:11-814-863-6132.E-mail address:[email protected] (G.R. Ziegler).
contain vicinal diols, which we employ in the protocol forfluorescent labeling.
There are fewer alternatives for the fluorescent labeling ofpolysaccharides than for the labeling of proteins, in parti-cular for general and quantitative purposes. Food proteinsare frequently labeled with FITC (fluorescein isothiocya-nate), Rhodamine, or Texas Red (Blonk & van Aalst,1993). Traditional dyes such as Calcofluor White and AnilinBlue often attach to specific carbohydrate residues orlinkages (Fulcher, Faubion, Ruan, & Miller, 1994). Thelectins from pea tree (Caragana arborescens) have beenshown to bind agarose beads and can be marked withFITC (EY Laboratories, 1990). Polysaccharide side chainscan be made more reactive by using transferases (Brossmer& Gross, 1994; Gahmberg & Tolvanen, 1994) or by usinggalactose oxidase (EC 1.1.3.9), which predominantly, butnot always exclusively, acts upon terminal, non-reducingd-galactose residues (Goudsmit, Matsuura, & Blake, 1984;Mazur, 1991; Wilchek & Bayer, 1987).
In this paper we present a protocol for covalent labelingof pectin and many other carbohydrate polymers with thefluorescent probe BODIPY FL hydrazide. This probe hasrecently been used for the quantification of progesteroneand other 3-keto steroids by HPLC (Katayama et al.,1998). We labeled gelatin covalently with the succinimidy-lester of carboxytetramethylrhodamine by slightly modify-ing an existing protocol for labeling of globular proteins thatcontain aliphatic amines. This probe has lately been conju-gated with peptides for inclusion and detection in degrad-able poly(lactic acid) (PLA) microspheres (Brunner,Minamitake, & Gopferich, 1998).
The phase behavior of mixed polysaccharides andproteins has been investigated by employing centrifugationof the phases, chemical analyses, osmotic pressure measure-ments, light scattering, FTIR, and turbidimetry (Antonov,Lashko, Glotova, Malovikova, & Markovich, 1996; Clew-low, Rowe, & Tombs, 1995b; Durrani, Prystupa, Donald, &Clark, 1993; Vinches, Parker, & Reed, 1997). Improve-ments in most of these techniques cannot compensate forthe difficulties that arise due to increased viscosity in moreconcentrated mixes. Accordingly, there is an interest in thedevelopment of methods that could be used in situ, e.g.Blonk, van Eendenburg, Koning, Weisenborn, and Winkel(1995) discussed the use of confocal scanning laser micro-scopy in combination with fluorescent double-labeling ofalginate and caseinate (max. 2 and 10%, respectively) inthe liquid state. The objective of this work was the devel-opment of a method for the in situ measurement of phasecomposition and morphology in highly viscous biopolymermixtures.
2. Materials
The water was treated in a NANOpure water purificationsystem (Barnstead/Thermolyne, Inc., Dubuque, IO) to
remove electrolytes and particles. Commercial low-meth-oxyl citrus pectin (LM290 NA95 from SKW Biosystems,Inc., Waukesha, WI) with 31.9% degree of esterification andgelatin type B (Sigma Chemical Co., St. Louis, MO) madefrom bovine skin tissue were used as polymeric raw materi-als. Polymers were purified from cations and sugars usingthe following procedure. The pectin and gelatin weredispersed in cold 25 and 40% aqueous ethanol, respectively,diafiltered 4 times, and treated batch-wise with stirredAG50W-X8 (20/50 mesh) cation exchange resin (Bio-RadLaboratories, Hercules, CA). The desalted pectin and gela-tin dispersions were decanted, the resin was washed withaqueous ethanol until clean of polymer, and the used washliquid was added to the polymer dispersions. The disper-sions were then filtered through a 50mm fritted glass filterfunnel, diafiltered with 100 ml aq. ethanol (40 and 25%concentration for gelatin and pectin, respectively), titratedto pH 5.5 (using 100 mM hydrochloric acid or sodiumhydroxide), slowly precipitated with ethanol, freeze-driedfor 48 h, ground in an analytical mill, and stored in a dessi-cator at 208C (Berth, 1988; Doner & Douds, 1995; Walter &Sherman, 1983). The fluorescent probes D-2371 (BODIPYFL hydrazide), C-1171 (TAMRA succinimidylester), and T-6105 were purchased from Molecular Probes, Inc. (Eugene,OR).
Supor-450 polysulfone membrane filters (0.45mm) fromGelman Sciences (Ann Arbor, MI) were used when filteringthe polymer solutions. Warm, gas tight syringes (HamiltonCo., Reno, NV) were utilized for the quantitative transfer ofhigh viscosity polymer solutions at 508C. Disposable 10 DGpolyacrylamide size exclusion chromatography (SEC)columns (Bio-Rad Laboratories, Hercules, CA) and Centri-con-10 centrifugal concentrators (Amicon, Inc., Beverly,MA) were used in the protocols for fluorescent labeling.
An LSM 410 inverted Laser Scan Microscope (CarlZeiss, Inc., Thornwood, NY) with argon- and helium–neon lasers and photomultiplier tube detectors wasemployed for confocal fluorescence microscopy. A NikonDiaphot 300 inverted fluorescence microscope (Nikon Inc.,Melville, NY), a 75 W xenon lamp, and a liquid cooledCCD-camera of type CH 250 (Photometrics Ltd., Tucson,AZ) were used for wide-angle fluorescence microscopy.Cytoseal 60 (Stephens Scientific, Riverdale, NJ) was gener-ally employed as sealant for gels mounted for microscopy.The image processing software was IPLab Spectrum H-SU2, v. 2.5.7 (Signal Analytics Corporation, Vienna, VA).An IEC Model CL centrifuge (International EquipmentCompany, Needham Heights, MA) was employed in thereference experiments of the quantitative study.
3. Methods
Purified pectin and gelatin were covalently labeled withfluorescent probes as described below. The concentrationof the fluorescent solution was estimated using
T.S. Nordmark, G.R. Ziegler / Food Hydrocolloids 14 (2000) 579–590580
spectrophotometry before the start of each labeling pro-cedure. Purified and labeled polymer was characterizedusing the micro-assays described below.
3.1. Pectin
Pectin was fluorescently labeled with the non-ionic dyeBODIPY FL (4,4-difluoro-5,7-dimethyl-4-bora-3a,4a-diaza-s-indacene-3-propionylhydrazide), which is morephotostable than fluorescein and has high extinction coeffi-cient and quantum yield (Haugland, 1996). Its emissionspectrum is reasonably distant from the excitation spectrumof the TAMRA dye, which was used for labeling of gelatin.The hydrazide group forms conjugates with ketogroups(Hermanson, 1996). A fluorochrome concentration of250mg/ml in the reaction mixture was chosen (in similaritywith the work by Katayma et al., 1998).Reagent solutions.Periodate solution: Take 0.5 ml of a 10 mM stock solutionof sodium metaperiodate, and add 1.75 ml deionized waterand 65 mg PBS (phosphate buffered saline)-powder asbuffer salt (Sigma Chemical Co., St. Louis, MO).
Fluorescent solution: Dissolve 5 mg fluorescent probe(D-2371) in 500ml methanol (Omnisolv from EM Indus-tries, Inc., Gibbstown, NJ) by vortexing. Dimethylforma-mide (DMF) (ACS Reagent from Sigma Chemical Co., St.Louis, MO) may be employed as solvent if the probe solu-tion will be used within one day. This solvent was used inthe qualitative study.
Fluorescent labeling: See Fig. 1.
3.2. Gelatin
Gelatin was fluorescently labeled with mixed isomers ofTAMRA SE (5- and 6-carboxytetramethylrhodaminesuccinimidylester), which are among the most photostablefluorescent dyes available and emit fluorescent light ofhigh intensity. A protein conjugate made from a succini-midyl ester of TAMRA is considered to be more chemi-cally stable than a conjugate made from the isothiocyanatederivatives commonly used (Haugland, 1996). The over-lap between its excitation spectrum and the emissionspectrum of the BODIPY FL dye is reasonably small.The CSLM helium–neon laser delivers light at 543 nm,which closely matches the 546 nm excitation wavelengthof the TAMRA SE. It may form non-fluorescent dimerswhen attached to proteins and is more prone to degrade inmoist environments (liquid or solid state) than theBODIPY probe is (Molecular Probes, Inc. Eugene, OR).The protocol below was followed.Reagent solutions.Fluorescent solution: Make a solution of 10 mg probeC-1171/ml DMF in a conical microcentrifuge tube andvortex it until the probe is dissolved.
Hydroxylamine solution: Dissolve 420 mg dry freshhydroxylamine hydrochloride in 2 ml deionized water andcarefully adjust the pH to 8.5 while stirring. Dilute the solu-tion with water so that the final concentration will be 1.5 M.
Fluorescent labeling: See Fig. 2. All treatments of thegelatin solution were carried out in a 408C environment inorder to avoid gelation.
T.S. Nordmark, G.R. Ziegler / Food Hydrocolloids 14 (2000) 579–590 581
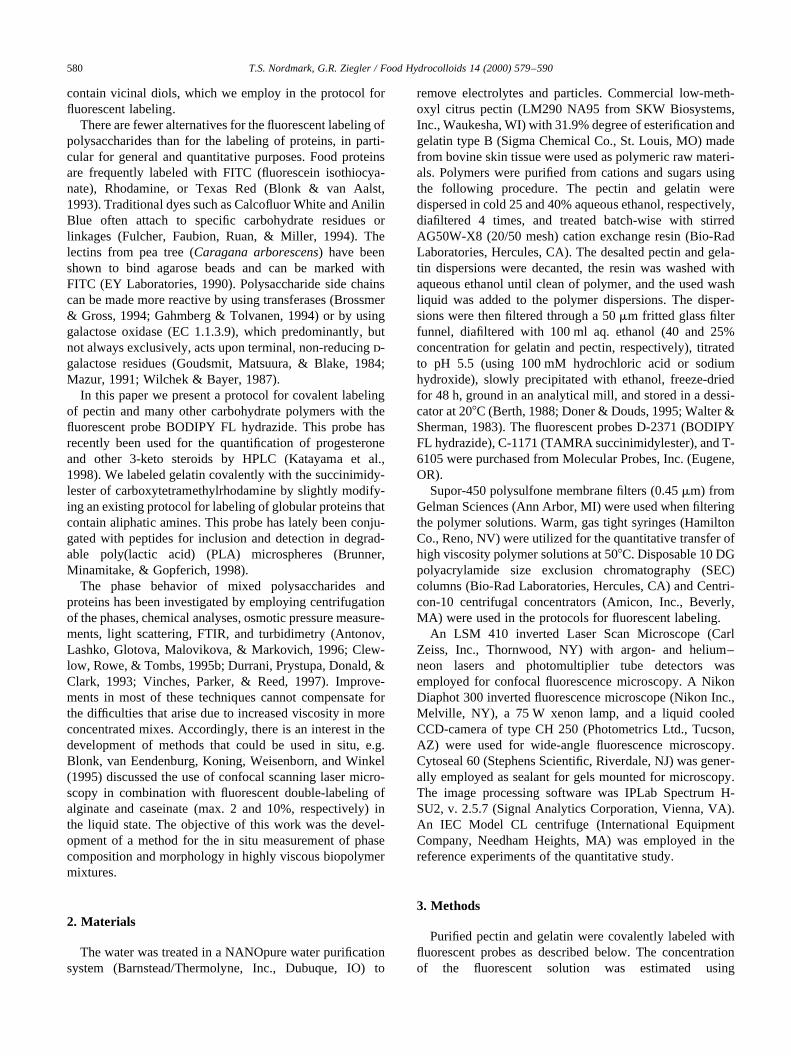
Concentrate to 1.2 ml by centrifugation at 5,000 g
Add 1-2 mg sodium cyanoborohydride and stir at low speed for 40 minutes
Heat to 60 ˚C; evaporate to 1.0 ml; solution may be stored in a refrigerator
Concentrate and deaerate to 1.1 ml by centrifugation at 5,000 g
Filter twice through 6 kD SEC columns and elute with deionized water
Stir at low speed for 3 hours in darkness and overnight in a refrigerator
Add 50 µL solvent, stir, and slowly add 33 µL of fluorescent solution
Filter through a 6 kD SEC column and elute with 10 mM PBS buffer pH 7.4
Add 50 µL of 2 M aq. glycerol while stirring and wait for 5 minutes
Add 0.5 ml periodate solution while using a stir bar at moderate speed andcontinue stirring at low speed for 30 minutes in darkness
Cool to 20 ˚C
Cool to 60 ¡ C and filter 1 ml
Boil for 30 seconds
Disperse 30 mg purified LM pectin in 2 ml cold deionized water while usinga stir bar at high speed and continue stirring at moderate speed for 1 hour
Fig. 1. Fluorescent labeling of LM pectin.
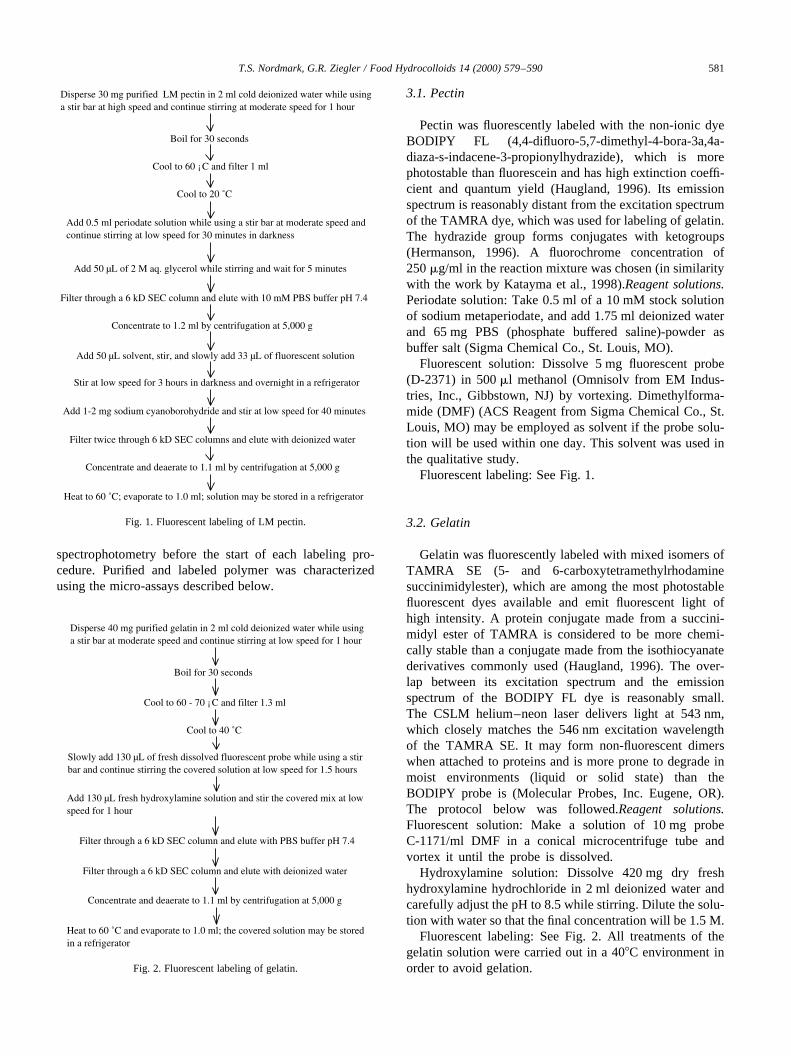
Disperse 40 mg purified gelatin in 2 ml cold deionized water while usinga stir bar at moderate speed and continue stirring at low speed for 1 hour
Heat to 60 ˚C and evaporate to 1.0 ml; the covered solution may be storedin a refrigerator
Slowly add 130 µL of fresh dissolved fluorescent probe while using a stirbar and continue stirring the covered solution at low speed for 1.5 hours
Filter through a 6 kD SEC column and elute with deionized water
Cool to 40 ˚C
Cool to 60 - 70 ¡ C and filter 1.3 ml
Boil for 30 seconds
Add 130 µL fresh hydroxylamine solution and stir the covered mix at lowspeed for 1 hour
Filter through a 6 kD SEC column and elute with PBS buffer pH 7.4
Concentrate and deaerate to 1.1 ml by centrifugation at 5,000 g
Fig. 2. Fluorescent labeling of gelatin.
3.3. Phase diagrams: making standards and mixed gels
Duplicate standards for microscopy were made fromaqueous dispersions of labeled polymer. Concentrationswere determined using the micro-assays described below.Desired concentrations were obtained by evaporation in aconvection oven at 50–608C. Calibration points in theconcentration ranges between 0–4% (pectin) and 0–10%(gelatin) were employed. The linear correlation betweenfluorescence intensity and concentration was higher forpectin (averageR2 � 0:982� than for gelatin (averageR2 �0:848�:
Phase-separated mixes of labeled materials for micro-scopy were made by adding an aqueous solution of sodiumchloride to the stirred polymer mix above the gelationtemperature of,308C. The desired final concentrations(including 1 M sodium chloride) were obtained by evapor-ating the mix as described above. The mix was held coveredat 608C for additional 0.5–3 h to allow the separation toproceed further. During the quantitative study, sampleswere placed between horizontal, parallel, pre-heated cover
glasses (thickness #1, rectangular bottom 35× 50 mm2;
circular top 25 mm).Standards and mixed gels were prepared under red light
to prevent photobleaching. The sample size was 2–5ml.The mix compositions (unlabeled pectin and gelatin,
respectively, per 2.5 ml of 1 M aq. sodium chloride)employed for the construction of quasi-ternary phasediagram from chemical assay were (mix ‘a’:) 0.75%/5.3%,(mix ‘b’:) 1.25%/5.7%, (mix ‘c’:) 1.75%/6%, and (mix ‘d’:)4.12%/4.6%.
3.4. Centrifuged gel mixes
Procedure when making gels for chemical assay: See Fig. 3.
3.5. Micro-assays
The ISO hydroxyproline assay (ISO, 1994) based on theapproach by Stegemann and Stalder (1967) was modifiedfor the analysis of microgram quantities of gelatin as trans-4-hydroxy-l-proline. Modifications included the withdra-wal of only 10ml sample solution, hydrolysis for 24 h in abath, elimination of the filtration step, and neutralization ofthe added acid. A potential problem was that the absorptionpeaks of the assay chromogen and the fluorochrome are veryclose (555 and 562 nm, respectively). Separate experimentsshowed that the fluorochrome is chemically destroyed underassay conditions before the absorption is recorded and, thus,no interference takes place. While paying attention to thestability of the reagents, we found our assay well reprodu-cible and relied on one calibration graph during all experi-ments. The coefficient of variation for any determination ofgelatin samples was 1.7%. We have also successfully usedthis assay for the assessment of collagen in egg shellmembranes. The micro-assay, which was linear up to600mg gelatin, should, with a changed dilution factor,permit a determination of less than 1mg gelatin.
The method by Scott (1979) for determination of poly-galacturonic acid was adopted by AOAC in 1995 as a part ofthe Official First Action analysis of total dietary fiber(Theander, Aman, Westerlund, Andersson, & Pettersson,1995). We modified this assay to allow a quantitationlimit of 30 mg LM pectin asd-galacturonic acid residues.Modifications included the withdrawal of only 20ml samplesolution, use of cold and relatively less acid, pre-heating ofthe acidified sample before hydrolysis for 70 min, and elim-ination of the filtration step. We found this micro-assay to belinear up to at least 900mg pectin and well reproducible.The coefficient of variation for any determination of pectinsamples was 1.3%.
4. Results and discussion
The procedure for fluorescent labeling of pectin describedin Section 3 should function for all carbohydrate polymersthat contain vicinal diols (cisor transisomers) or when such
T.S. Nordmark, G.R. Ziegler / Food Hydrocolloids 14 (2000) 579–590582
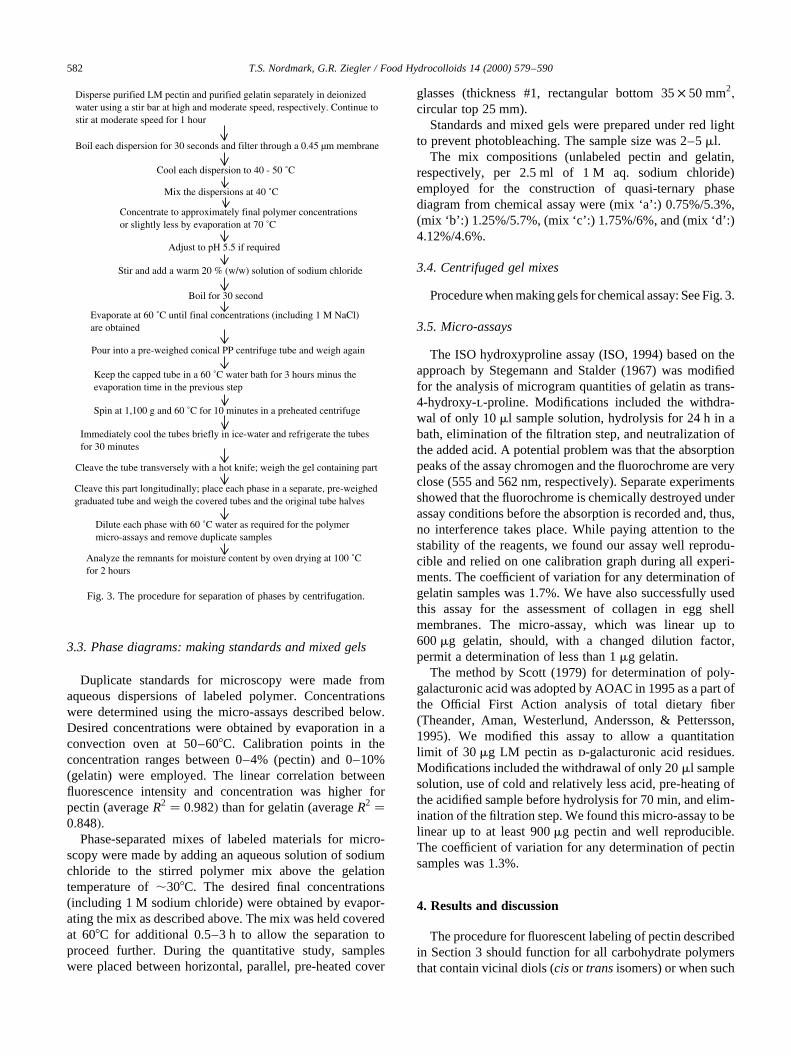
Disperse purified LM pectin and purified gelatin separately in deionizedwater using a stir bar at high and moderate speed, respectively. Continue tostir at moderate speed for 1 hour
Mix the dispersions at 40 ˚C
Stir and add a warm 20 % (w/w) solution of sodium chloride
Keep the capped tube in a 60 ˚C water bath for 3 hours minus theevaporation time in the previous step
Spin at 1,100 g and 60 ˚C for 10 minutes in a preheated centrifuge
Cleave the tube transversely with a hot knife; weigh the gel containing part
Analyze the remnants for moisture content by oven drying at 100 ˚Cfor 2 hours
Dilute each phase with 60 ˚C water as required for the polymermicro-assays and remove duplicate samples
Cleave this part longitudinally; place each phase in a separate, pre-weighedgraduated tube and weigh the covered tubes and the original tube halves
Immediately cool the tubes briefly in ice-water and refrigerate the tubesfor 30 minutes
Pour into a pre-weighed conical PP centrifuge tube and weigh again
Evaporate at 60 ˚C until final concentrations (including 1 M NaCl)are obtained
Boil for 30 second
Adjust to pH 5.5 if required
Concentrate to approximately final polymer concentrationsor slightly less by evaporation at 70 ˚C
Cool each dispersion to 40 - 50 ˚C
Boil each dispersion for 30 seconds and filter through a 0.45 µm membrane
Fig. 3. The procedure for separation of phases by centrifugation.
groups can be introduced into the molecule. The first step isthe oxidation with periodate (Guthrie, 1962; Jackson, 1944),which has been employed for the oxidation of, for instance,corn- and potato-starch (Jackson, 1944). The periodic acidreaction has been used in combination with the Schiff’sreagent, but histochemical and molecular modeling studieshave shown that this combined reaction (called the PASreaction) is not a quantitative test for polysaccharides (Puch-tler, Meloan, & Brewton, 1974). We hypothesized that theuse of a bright, less bulky reagent with a spacer and care-fully controlled reaction conditions would allow quantita-tive results. The protocol discussed in this paper results in a6-atom spacer being located between the fluorochrome andthe polysaccharide chain, whereby both steric constraint andtransfer of light energy to the chain should be considerablyreduced. Katayama et al. (1998) mention that hydrochloricand trifluoroacetic acid have been used as catalysts for theconjugation of hydrazide and steroids in methanol or etha-nol solution. However, the use of DMF followed by stabi-lization of the bonds by treatment with cyanoborohydrideresulted in very bright labeling of the pectin without theemployment of catalysts. The use of methanol, without cata-lyst, in the quantitative protocol resulted in a lower butacceptable extent of labeling for quantitative purposes.Commercial DMF was found to have an amine-containingcontaminant that slowly reacted with the hydrazide-contain-ing probe to form a dark brown compound. Thus, solutionsof BODIPY in DMF should be made fresh for each experi-ment. Heat treatment in excess of 948C for 1–2 min. wasavoided during the making of fluorescent gels, since theBODIPY probe may otherwise not remain stable.
The labeling of gelatin and the preparation of samples formicroscopy was performed at elevated temperature to avoidgelation and lower the viscosity to facilitate phase separa-tion and handling of the gelatin solutions. A raised tempera-ture was also necessary for phase separation to occur sincethe phase diagram is inverted with a lower critical solutiontemperature above the gelation temperature of gelatin(Antonov et al., 1996; Tolstoguzov, 1990). Environmentaltemperatures in the range 50–608C satisfied the liquefac-tion, phase separation, and viscosity requirements. Although
the solvent DMF tends to precipitate gelatin out of aqueoussolutions, no such problems were observed.
The use of only two SEC columns in the labeling protocolappeared adequate, since only a very small amount of fluor-escent probe remained after the first column. Most of theTAMRA probe could not be eluted from the columns,implying that the probe reacted with the column packing.In addition, gelatin yields lower than 100% indicated thatsome gelatin was trapped in the column.
The procedure for fluorescent labeling of gelatin was, asan alternative, also carried out using a derivative (T-6105)of TAMRA SE with a 7-atom aminohexanoyl spacerbetween the fluorophore and the reactive group. However,the spacer-equipped fluorophore offered no advantagescompared to the standard fluorophore in terms of brightness,gelation, or stability.
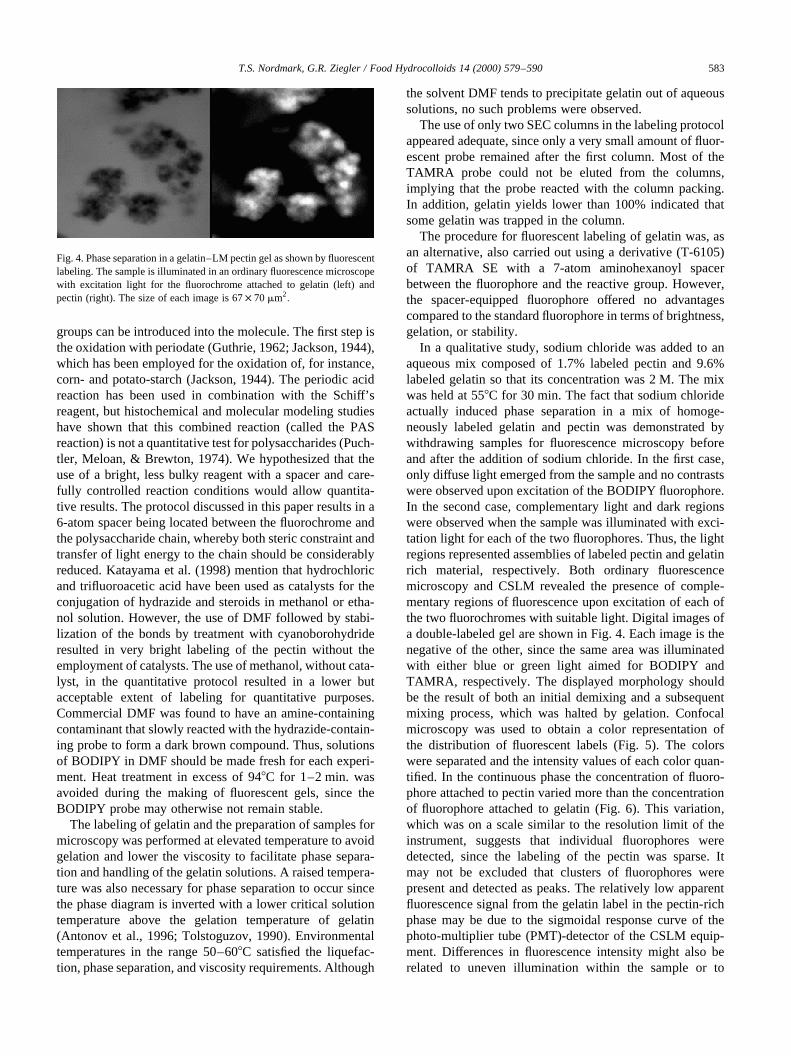
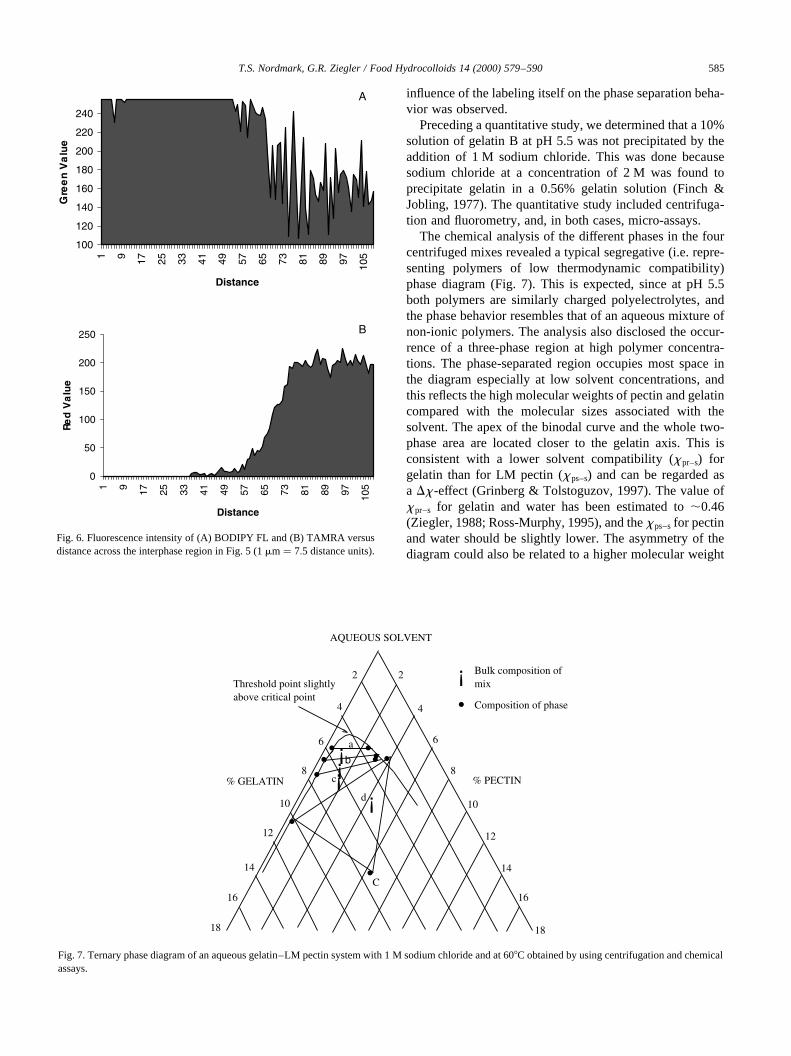
In a qualitative study, sodium chloride was added to anaqueous mix composed of 1.7% labeled pectin and 9.6%labeled gelatin so that its concentration was 2 M. The mixwas held at 558C for 30 min. The fact that sodium chlorideactually induced phase separation in a mix of homoge-neously labeled gelatin and pectin was demonstrated bywithdrawing samples for fluorescence microscopy beforeand after the addition of sodium chloride. In the first case,only diffuse light emerged from the sample and no contrastswere observed upon excitation of the BODIPY fluorophore.In the second case, complementary light and dark regionswere observed when the sample was illuminated with exci-tation light for each of the two fluorophores. Thus, the lightregions represented assemblies of labeled pectin and gelatinrich material, respectively. Both ordinary fluorescencemicroscopy and CSLM revealed the presence of comple-mentary regions of fluorescence upon excitation of each ofthe two fluorochromes with suitable light. Digital images ofa double-labeled gel are shown in Fig. 4. Each image is thenegative of the other, since the same area was illuminatedwith either blue or green light aimed for BODIPY andTAMRA, respectively. The displayed morphology shouldbe the result of both an initial demixing and a subsequentmixing process, which was halted by gelation. Confocalmicroscopy was used to obtain a color representation ofthe distribution of fluorescent labels (Fig. 5). The colorswere separated and the intensity values of each color quan-tified. In the continuous phase the concentration of fluoro-phore attached to pectin varied more than the concentrationof fluorophore attached to gelatin (Fig. 6). This variation,which was on a scale similar to the resolution limit of theinstrument, suggests that individual fluorophores weredetected, since the labeling of the pectin was sparse. Itmay not be excluded that clusters of fluorophores werepresent and detected as peaks. The relatively low apparentfluorescence signal from the gelatin label in the pectin-richphase may be due to the sigmoidal response curve of thephoto-multiplier tube (PMT)-detector of the CSLM equip-ment. Differences in fluorescence intensity might also berelated to uneven illumination within the sample or to
T.S. Nordmark, G.R. Ziegler / Food Hydrocolloids 14 (2000) 579–590 583
Fig. 4. Phase separation in a gelatin–LM pectin gel as shown by fluorescentlabeling. The sample is illuminated in an ordinary fluorescence microscopewith excitation light for the fluorochrome attached to gelatin (left) andpectin (right). The size of each image is 67× 70mm2
:
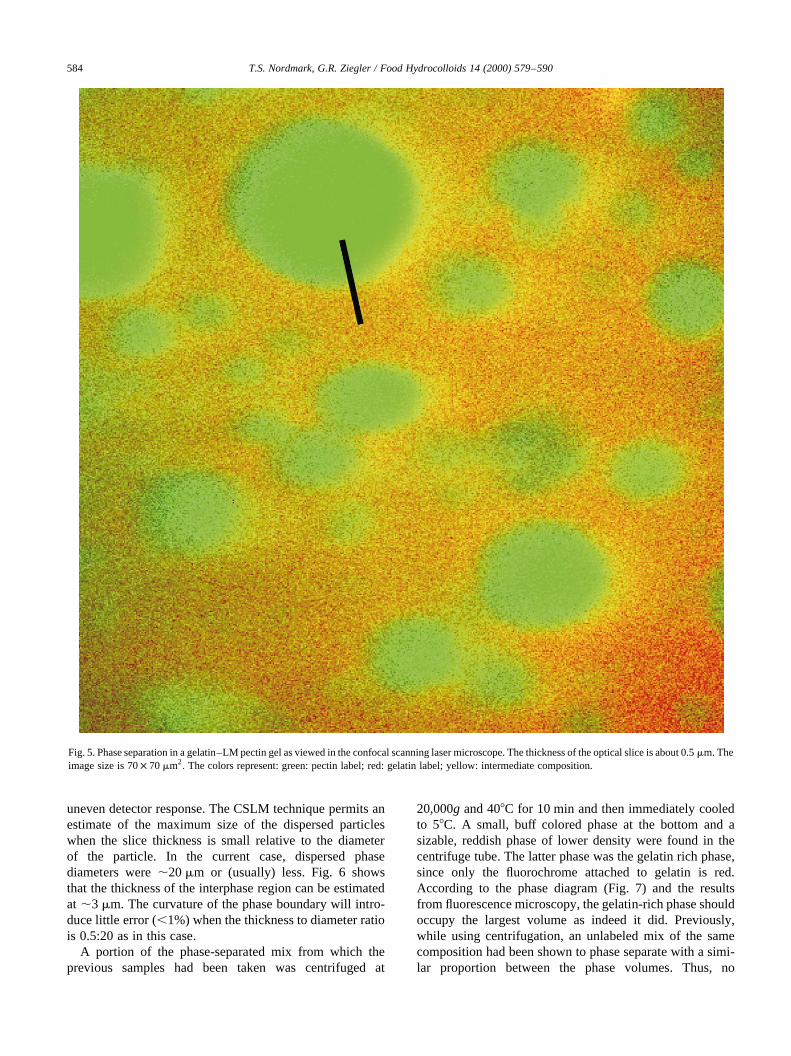
uneven detector response. The CSLM technique permits anestimate of the maximum size of the dispersed particleswhen the slice thickness is small relative to the diameterof the particle. In the current case, dispersed phasediameters were,20mm or (usually) less. Fig. 6 showsthat the thickness of the interphase region can be estimatedat ,3 mm. The curvature of the phase boundary will intro-duce little error (,1%) when the thickness to diameter ratiois 0.5:20 as in this case.
A portion of the phase-separated mix from which theprevious samples had been taken was centrifuged at
20,000g and 408C for 10 min and then immediately cooledto 58C. A small, buff colored phase at the bottom and asizable, reddish phase of lower density were found in thecentrifuge tube. The latter phase was the gelatin rich phase,since only the fluorochrome attached to gelatin is red.According to the phase diagram (Fig. 7) and the resultsfrom fluorescence microscopy, the gelatin-rich phase shouldoccupy the largest volume as indeed it did. Previously,while using centrifugation, an unlabeled mix of the samecomposition had been shown to phase separate with a simi-lar proportion between the phase volumes. Thus, no
T.S. Nordmark, G.R. Ziegler / Food Hydrocolloids 14 (2000) 579–590584
Fig. 5. Phase separation in a gelatin–LM pectin gel as viewed in the confocal scanning laser microscope. The thickness of the optical slice is about 0.5mm. Theimage size is 70× 70mm2
: The colors represent: green: pectin label; red: gelatin label; yellow: intermediate composition.
influence of the labeling itself on the phase separation beha-vior was observed.
Preceding a quantitative study, we determined that a 10%solution of gelatin B at pH 5.5 was not precipitated by theaddition of 1 M sodium chloride. This was done becausesodium chloride at a concentration of 2 M was found toprecipitate gelatin in a 0.56% gelatin solution (Finch &Jobling, 1977). The quantitative study included centrifuga-tion and fluorometry, and, in both cases, micro-assays.
The chemical analysis of the different phases in the fourcentrifuged mixes revealed a typical segregative (i.e. repre-senting polymers of low thermodynamic compatibility)phase diagram (Fig. 7). This is expected, since at pH 5.5both polymers are similarly charged polyelectrolytes, andthe phase behavior resembles that of an aqueous mixture ofnon-ionic polymers. The analysis also disclosed the occur-rence of a three-phase region at high polymer concentra-tions. The phase-separated region occupies most space inthe diagram especially at low solvent concentrations, andthis reflects the high molecular weights of pectin and gelatincompared with the molecular sizes associated with thesolvent. The apex of the binodal curve and the whole two-phase area are located closer to the gelatin axis. This isconsistent with a lower solvent compatibility (xpr–s) forgelatin than for LM pectin (xps–s) and can be regarded asa Dx -effect (Grinberg & Tolstoguzov, 1997). The value ofxpr–s for gelatin and water has been estimated to,0.46(Ziegler, 1988; Ross-Murphy, 1995), and thexps–sfor pectinand water should be slightly lower. The asymmetry of thediagram could also be related to a higher molecular weight
T.S. Nordmark, G.R. Ziegler / Food Hydrocolloids 14 (2000) 579–590 585
0
50
100
150
200
250
1 9 17 25 33 41 49 57 65 73 81 89 97 105
Distance
Red
Va
lue
100
120
140
160
180
200
220
2401 9 17 25 33 41 49 57 65 73 81 89 97 105
Distance
Gre
en
Va
lue
A
B
Fig. 6. Fluorescence intensity of (A) BODIPY FL and (B) TAMRA versusdistance across the interphase region in Fig. 5 (1mm� 7:5 distance units).
AQUEOUS SOLVENT
2 2
4 4
6 6
8 8
10 10
12 12
14 14
16 16
18 18
% GELATIN % PECTIN
C•
•
••
•• ••
•¡
¡
¡¡
a
b
c
d
¡•
Bulk composition ofmix
Composition of phase
Threshold point slightlyabove critical point
Fig. 7. Ternary phase diagram of an aqueous gelatin–LM pectin system with 1 M sodium chloride and at 608C obtained by using centrifugation and chemicalassays.
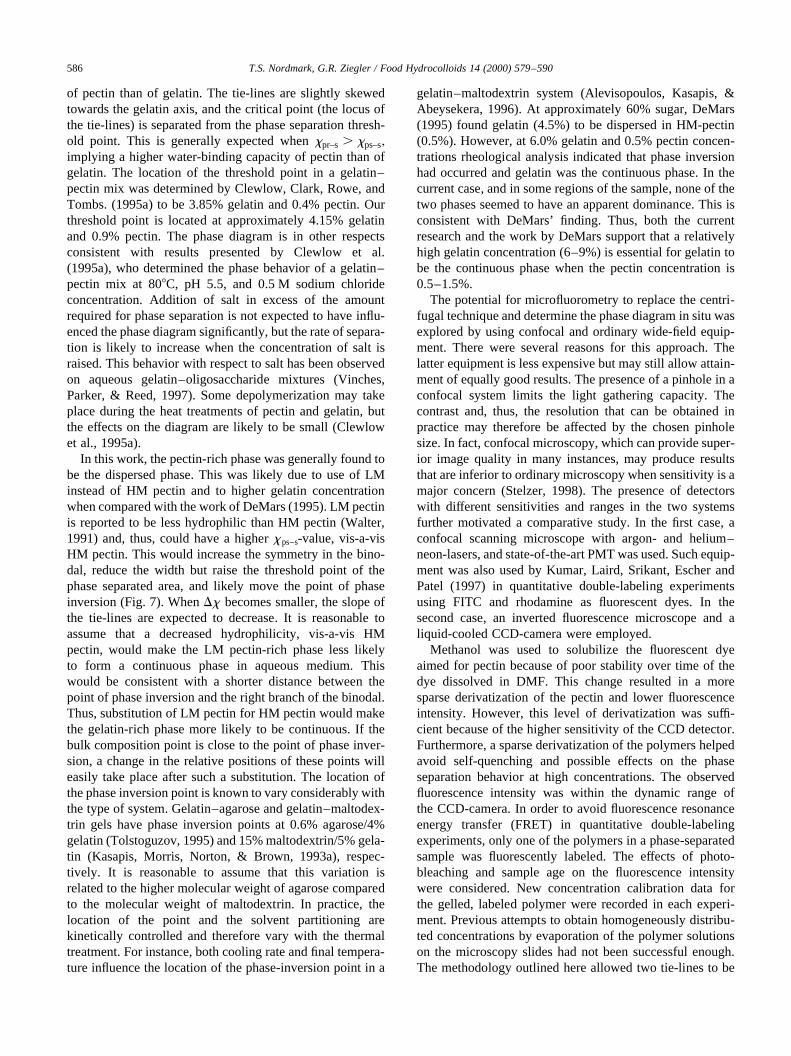
of pectin than of gelatin. The tie-lines are slightly skewedtowards the gelatin axis, and the critical point (the locus ofthe tie-lines) is separated from the phase separation thresh-old point. This is generally expected whenxpr–s . xps–s;
implying a higher water-binding capacity of pectin than ofgelatin. The location of the threshold point in a gelatin–pectin mix was determined by Clewlow, Clark, Rowe, andTombs. (1995a) to be 3.85% gelatin and 0.4% pectin. Ourthreshold point is located at approximately 4.15% gelatinand 0.9% pectin. The phase diagram is in other respectsconsistent with results presented by Clewlow et al.(1995a), who determined the phase behavior of a gelatin–pectin mix at 808C, pH 5.5, and 0.5 M sodium chlorideconcentration. Addition of salt in excess of the amountrequired for phase separation is not expected to have influ-enced the phase diagram significantly, but the rate of separa-tion is likely to increase when the concentration of salt israised. This behavior with respect to salt has been observedon aqueous gelatin–oligosaccharide mixtures (Vinches,Parker, & Reed, 1997). Some depolymerization may takeplace during the heat treatments of pectin and gelatin, butthe effects on the diagram are likely to be small (Clewlowet al., 1995a).
In this work, the pectin-rich phase was generally found tobe the dispersed phase. This was likely due to use of LMinstead of HM pectin and to higher gelatin concentrationwhen compared with the work of DeMars (1995). LM pectinis reported to be less hydrophilic than HM pectin (Walter,1991) and, thus, could have a higherxps–s-value, vis-a-visHM pectin. This would increase the symmetry in the bino-dal, reduce the width but raise the threshold point of thephase separated area, and likely move the point of phaseinversion (Fig. 7). WhenDx becomes smaller, the slope ofthe tie-lines are expected to decrease. It is reasonable toassume that a decreased hydrophilicity, vis-a-vis HMpectin, would make the LM pectin-rich phase less likelyto form a continuous phase in aqueous medium. Thiswould be consistent with a shorter distance between thepoint of phase inversion and the right branch of the binodal.Thus, substitution of LM pectin for HM pectin would makethe gelatin-rich phase more likely to be continuous. If thebulk composition point is close to the point of phase inver-sion, a change in the relative positions of these points willeasily take place after such a substitution. The location ofthe phase inversion point is known to vary considerably withthe type of system. Gelatin–agarose and gelatin–maltodex-trin gels have phase inversion points at 0.6% agarose/4%gelatin (Tolstoguzov, 1995) and 15% maltodextrin/5% gela-tin (Kasapis, Morris, Norton, & Brown, 1993a), respec-tively. It is reasonable to assume that this variation isrelated to the higher molecular weight of agarose comparedto the molecular weight of maltodextrin. In practice, thelocation of the point and the solvent partitioning arekinetically controlled and therefore vary with the thermaltreatment. For instance, both cooling rate and final tempera-ture influence the location of the phase-inversion point in a
gelatin–maltodextrin system (Alevisopoulos, Kasapis, &Abeysekera, 1996). At approximately 60% sugar, DeMars(1995) found gelatin (4.5%) to be dispersed in HM-pectin(0.5%). However, at 6.0% gelatin and 0.5% pectin concen-trations rheological analysis indicated that phase inversionhad occurred and gelatin was the continuous phase. In thecurrent case, and in some regions of the sample, none of thetwo phases seemed to have an apparent dominance. This isconsistent with DeMars’ finding. Thus, both the currentresearch and the work by DeMars support that a relativelyhigh gelatin concentration (6–9%) is essential for gelatin tobe the continuous phase when the pectin concentration is0.5–1.5%.
The potential for microfluorometry to replace the centri-fugal technique and determine the phase diagram in situ wasexplored by using confocal and ordinary wide-field equip-ment. There were several reasons for this approach. Thelatter equipment is less expensive but may still allow attain-ment of equally good results. The presence of a pinhole in aconfocal system limits the light gathering capacity. Thecontrast and, thus, the resolution that can be obtained inpractice may therefore be affected by the chosen pinholesize. In fact, confocal microscopy, which can provide super-ior image quality in many instances, may produce resultsthat are inferior to ordinary microscopy when sensitivity is amajor concern (Stelzer, 1998). The presence of detectorswith different sensitivities and ranges in the two systemsfurther motivated a comparative study. In the first case, aconfocal scanning microscope with argon- and helium–neon-lasers, and state-of-the-art PMT was used. Such equip-ment was also used by Kumar, Laird, Srikant, Escher andPatel (1997) in quantitative double-labeling experimentsusing FITC and rhodamine as fluorescent dyes. In thesecond case, an inverted fluorescence microscope and aliquid-cooled CCD-camera were employed.
Methanol was used to solubilize the fluorescent dyeaimed for pectin because of poor stability over time of thedye dissolved in DMF. This change resulted in a moresparse derivatization of the pectin and lower fluorescenceintensity. However, this level of derivatization was suffi-cient because of the higher sensitivity of the CCD detector.Furthermore, a sparse derivatization of the polymers helpedavoid self-quenching and possible effects on the phaseseparation behavior at high concentrations. The observedfluorescence intensity was within the dynamic range ofthe CCD-camera. In order to avoid fluorescence resonanceenergy transfer (FRET) in quantitative double-labelingexperiments, only one of the polymers in a phase-separatedsample was fluorescently labeled. The effects of photo-bleaching and sample age on the fluorescence intensitywere considered. New concentration calibration data forthe gelled, labeled polymer were recorded in each experi-ment. Previous attempts to obtain homogeneously distribu-ted concentrations by evaporation of the polymer solutionson the microscopy slides had not been successful enough.The methodology outlined here allowed two tie-lines to be
T.S. Nordmark, G.R. Ziegler / Food Hydrocolloids 14 (2000) 579–590586
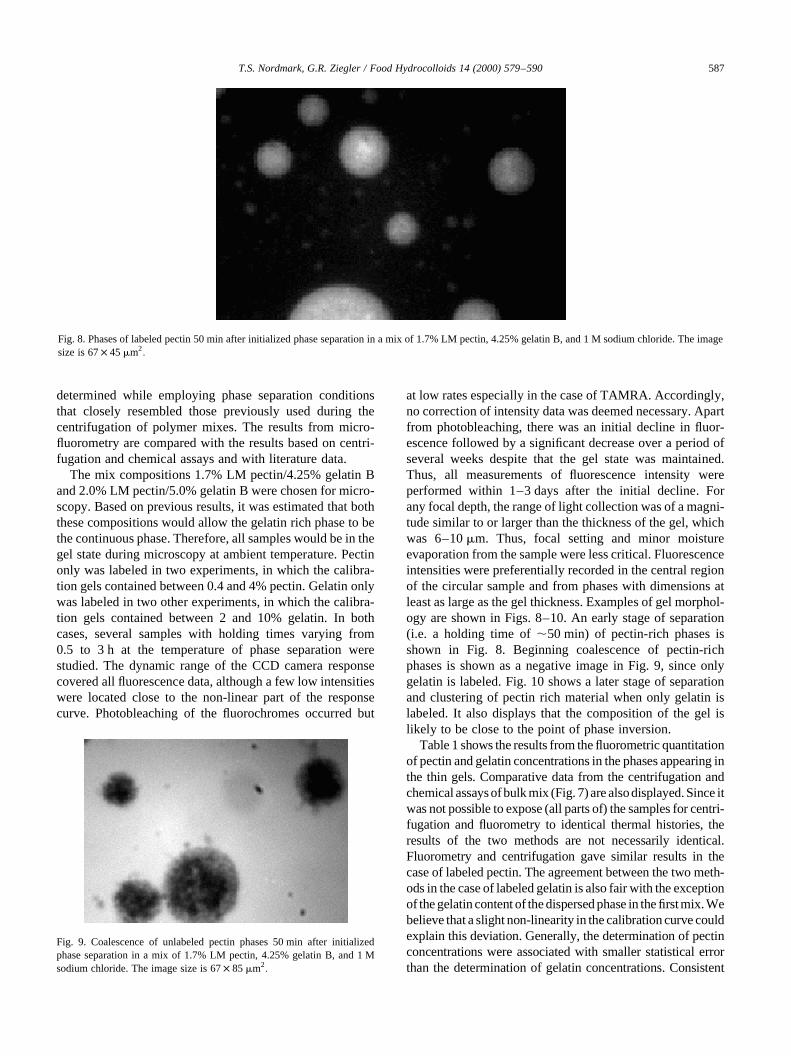
determined while employing phase separation conditionsthat closely resembled those previously used during thecentrifugation of polymer mixes. The results from micro-fluorometry are compared with the results based on centri-fugation and chemical assays and with literature data.
The mix compositions 1.7% LM pectin/4.25% gelatin Band 2.0% LM pectin/5.0% gelatin B were chosen for micro-scopy. Based on previous results, it was estimated that boththese compositions would allow the gelatin rich phase to bethe continuous phase. Therefore, all samples would be in thegel state during microscopy at ambient temperature. Pectinonly was labeled in two experiments, in which the calibra-tion gels contained between 0.4 and 4% pectin. Gelatin onlywas labeled in two other experiments, in which the calibra-tion gels contained between 2 and 10% gelatin. In bothcases, several samples with holding times varying from0.5 to 3 h at the temperature of phase separation werestudied. The dynamic range of the CCD camera responsecovered all fluorescence data, although a few low intensitieswere located close to the non-linear part of the responsecurve. Photobleaching of the fluorochromes occurred but
at low rates especially in the case of TAMRA. Accordingly,no correction of intensity data was deemed necessary. Apartfrom photobleaching, there was an initial decline in fluor-escence followed by a significant decrease over a period ofseveral weeks despite that the gel state was maintained.Thus, all measurements of fluorescence intensity wereperformed within 1–3 days after the initial decline. Forany focal depth, the range of light collection was of a magni-tude similar to or larger than the thickness of the gel, whichwas 6–10mm. Thus, focal setting and minor moistureevaporation from the sample were less critical. Fluorescenceintensities were preferentially recorded in the central regionof the circular sample and from phases with dimensions atleast as large as the gel thickness. Examples of gel morphol-ogy are shown in Figs. 8–10. An early stage of separation(i.e. a holding time of,50 min) of pectin-rich phases isshown in Fig. 8. Beginning coalescence of pectin-richphases is shown as a negative image in Fig. 9, since onlygelatin is labeled. Fig. 10 shows a later stage of separationand clustering of pectin rich material when only gelatin islabeled. It also displays that the composition of the gel islikely to be close to the point of phase inversion.
Table 1 shows the results from the fluorometric quantitationof pectin and gelatin concentrations in the phases appearing inthe thin gels. Comparative data from the centrifugation andchemical assaysofbulk mix (Fig. 7)are alsodisplayed.Since itwas not possible to expose (all parts of) the samples for centri-fugation and fluorometry to identical thermal histories, theresults of the two methods are not necessarily identical.Fluorometry and centrifugation gave similar results in thecase of labeled pectin. The agreement between the two meth-ods in the case of labeled gelatin is also fair with the exceptionof the gelatin content of the dispersed phase in the firstmix.Webelieve that a slight non-linearity in the calibration curve couldexplain this deviation. Generally, the determination of pectinconcentrations were associated with smaller statistical errorthan the determination of gelatin concentrations. Consistent
T.S. Nordmark, G.R. Ziegler / Food Hydrocolloids 14 (2000) 579–590 587
Fig. 8. Phases of labeled pectin 50 min after initialized phase separation in a mix of 1.7% LM pectin, 4.25% gelatin B, and 1 M sodium chloride. The imagesize is 67× 45mm2
:
Fig. 9. Coalescence of unlabeled pectin phases 50 min after initializedphase separation in a mix of 1.7% LM pectin, 4.25% gelatin B, and 1 Msodium chloride. The image size is 67× 85mm2
:
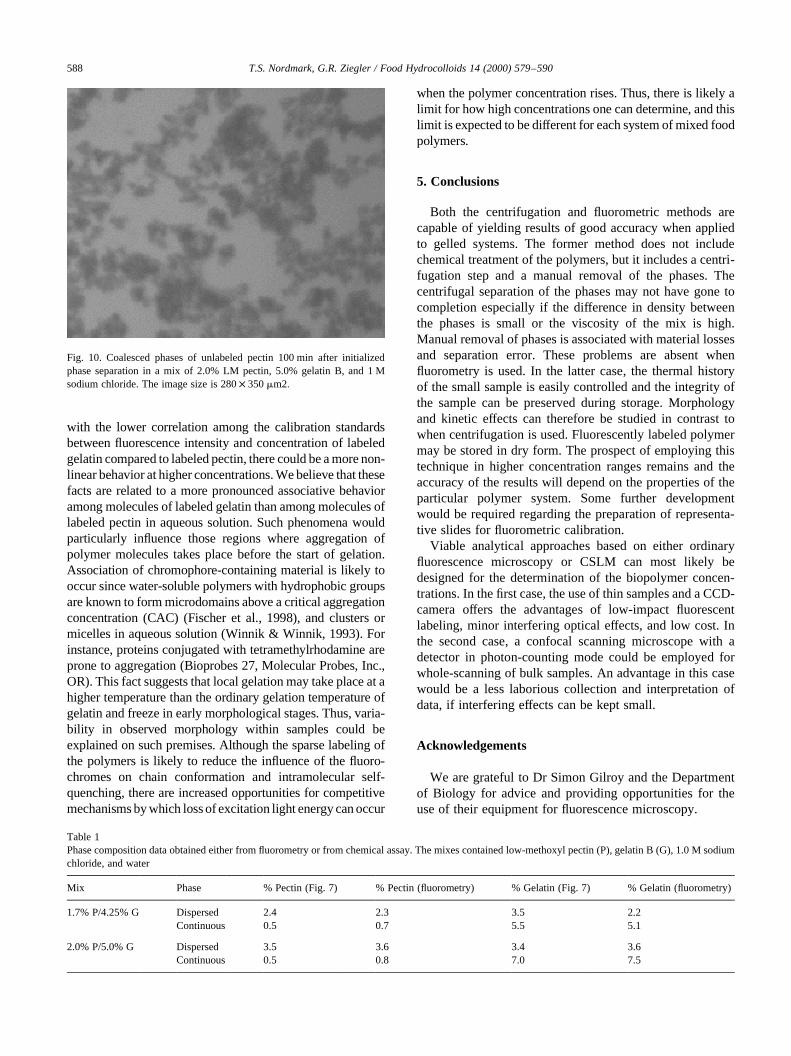
with the lower correlation among the calibration standardsbetween fluorescence intensity and concentration of labeledgelatin compared to labeled pectin, there could be a more non-linear behavior at higher concentrations. We believe that thesefacts are related to a more pronounced associative behavioramong molecules of labeled gelatin than among molecules oflabeled pectin in aqueous solution. Such phenomena wouldparticularly influence those regions where aggregation ofpolymer molecules takes place before the start of gelation.Association of chromophore-containing material is likely tooccur since water-soluble polymers with hydrophobic groupsare known to form microdomains above a critical aggregationconcentration (CAC) (Fischer et al., 1998), and clusters ormicelles in aqueous solution (Winnik & Winnik, 1993). Forinstance, proteins conjugated with tetramethylrhodamine areprone to aggregation (Bioprobes 27, Molecular Probes, Inc.,OR). This fact suggests that local gelation may take place at ahigher temperature than the ordinary gelation temperature ofgelatin and freeze in early morphological stages. Thus, varia-bility in observed morphology within samples could beexplained on such premises. Although the sparse labeling ofthe polymers is likely to reduce the influence of the fluoro-chromes on chain conformation and intramolecular self-quenching, there are increased opportunities for competitivemechanisms by which loss of excitation light energy can occur
when the polymer concentration rises. Thus, there is likely alimit for how high concentrations one can determine, and thislimit is expected to be different for each system of mixed foodpolymers.
5. Conclusions
Both the centrifugation and fluorometric methods arecapable of yielding results of good accuracy when appliedto gelled systems. The former method does not includechemical treatment of the polymers, but it includes a centri-fugation step and a manual removal of the phases. Thecentrifugal separation of the phases may not have gone tocompletion especially if the difference in density betweenthe phases is small or the viscosity of the mix is high.Manual removal of phases is associated with material lossesand separation error. These problems are absent whenfluorometry is used. In the latter case, the thermal historyof the small sample is easily controlled and the integrity ofthe sample can be preserved during storage. Morphologyand kinetic effects can therefore be studied in contrast towhen centrifugation is used. Fluorescently labeled polymermay be stored in dry form. The prospect of employing thistechnique in higher concentration ranges remains and theaccuracy of the results will depend on the properties of theparticular polymer system. Some further developmentwould be required regarding the preparation of representa-tive slides for fluorometric calibration.
Viable analytical approaches based on either ordinaryfluorescence microscopy or CSLM can most likely bedesigned for the determination of the biopolymer concen-trations. In the first case, the use of thin samples and a CCD-camera offers the advantages of low-impact fluorescentlabeling, minor interfering optical effects, and low cost. Inthe second case, a confocal scanning microscope with adetector in photon-counting mode could be employed forwhole-scanning of bulk samples. An advantage in this casewould be a less laborious collection and interpretation ofdata, if interfering effects can be kept small.
Acknowledgements
We are grateful to Dr Simon Gilroy and the Departmentof Biology for advice and providing opportunities for theuse of their equipment for fluorescence microscopy.
T.S. Nordmark, G.R. Ziegler / Food Hydrocolloids 14 (2000) 579–590588
Fig. 10. Coalesced phases of unlabeled pectin 100 min after initializedphase separation in a mix of 2.0% LM pectin, 5.0% gelatin B, and 1 Msodium chloride. The image size is 280× 350mm2:
Table 1Phase composition data obtained either from fluorometry or from chemical assay. The mixes contained low-methoxyl pectin (P), gelatin B (G), 1.0 M sodiumchloride, and water
Mix Phase % Pectin (Fig. 7) % Pectin (fluorometry) % Gelatin (Fig. 7) % Gelatin (fluorometry)
1.7% P/4.25% G Dispersed 2.4 2.3 3.5 2.2Continuous 0.5 0.7 5.5 5.1
2.0% P/5.0% G Dispersed 3.5 3.6 3.4 3.6Continuous 0.5 0.8 7.0 7.5
References
Alevisopoulos, S., Kasapis, S., & Abeysekera, R. (1996). Formation ofkinetically trapped gels in the maltodextrin–gelatin system.Carbohy-drate Research, 293, 79–99.
Al-Ruqaie, I. M., Kasapis, S., & Abeysekera, R. (1997). Structural proper-ties of gelatin–pectin gels. Part II: effect of sucrose/glucose syrup.Carbohydrate Polymers, 34, 309–321.
Aman, P., & Westerlund, E. (1996). Cell wall polysaccharides: structural,chemical, and analytical aspects. In A. -C. Eliasson,Carbohydrates infood (pp. 207–208). New York: Marcel Dekker.
Antonov, Y. A., Lashko, N. P., Glotova, Y. K., Malovikova, A., & Marko-vich, O. (1996). Effect of the structural features of pectins and alginateson their thermodynamic compatibility with gelatin in aqueous media.Food Hydrocolloids, 10 (1), 1–9.
BeMiller, J. N. (1996). Gums/Hydrocolloids: analytical aspects. In A. -C.Eliasson,Carbohydrates in food(pp. 265–281). New York: MarcelDekker.
Berth, G. (1988). Studies on the heterogeneity of citrus pectin by gelpermeation chromatography on Sepharose 2 B/Sepharose 4 B.Carbo-hydrate Polymers, 8, 105–117.
Blonk, J. C. G., & van Aalst, H. (1993). Confocal scanning light micro-scopy in food research.Food Research International, 26 (4), 297–311.
Blonk, J. C. G., van Eendenburg, J., Koning, M. M. G., Weisenborn, P. C.M., & Winkel, C. (1995). A new CSLM-based method for determina-tion of the phase behaviour of aqueous mixtures of biopolymers.Carbo-hydrate Polymers, 28, 287–295.
Brossmer, R., & Gross, H. J. (1994). Fluorescent and photoactivatable sialicacids.Methods in enzymology, Vol. 247. New York: Academic Press(pp. 177–193).
Brunner, A., Minamitake, Y., & Gopferich, A. (1998). Labeling peptides withfluorescent probes for incorporation into degradable polymers.EuropeanJournal of Pharmaceutics and Biopharmaceutics, 45 (3), 265–273.
Clewlow, A. C., Clark, A. H., Rowe, A. J., & Tombs, M. P. (1995a).Predicting the phase diagram for a gelatin–pectin system.BiochemicalSociety Transactions, 23, 498S.
Clewlow, A. C., Rowe, A. J., & Tombs, M. P. (1995b). Pectin–gelatinphase separation: the influence of polydispersity. In S. E. Harding, S.E. Hill & J. R. Mitchell, Biopolymer mixtures(pp. 173–191). Notting-ham: Nottingham University Press.
da Silva, J. A. L., & Goncalves, M. P. (1994). Rheological study into theageing process of high methoxyl pectin/sucrose aqueous gels.Carbo-hydrate Polymers, 24, 235–245.
DeMars, L. L. (1995).Texture and structure of gelatin/pectin-based gummyconfections.MSc thesis, The Pennsylvania State University.
Dickinson, E., & McClements, D. J. (1995).Advances in food colloids, NewYork: Blackie Academic and Professional (pp. 11–12).
Doner, L. W., & Douds, D. D. (1995). Purification of commercial gellan tomonovalent cation salts results in acute modification of solution andgel-forming properties.Carbohydrate Research, 273, 225–233.
Durrani, M., Prystupa, D., Donald, A., & Clark, A. H. (1993). Phasediagram of mixtures of polymers in aqueous solution using Fouriertransform infrared spectroscopy.Macromolecules, 26, 981–987.
EY-Laboratories. (1990).Biotechs.San Mateo, CA: EY Laboratories.Finch, C. A., & Jobling, A. (1977). The physical properties of gelatin. In A.
G. Ward & A. Courts,The science and technology of gelatin(pp. 249–294). New York: Academic Press.
Fischer, A., Houzelle, M. C., Hubert, P., Axelos, M. A. V., Geoffroy-Chapotot, C., Carre´, M. C., Viriot, M. L., & Dellacherie, E. (1998).Detection of intramolecular associations in hydrophobically modifiedpectin derivatives using fluorescent probes.Langmuir, 14 (16), 4482–4488.
Fulcher, R. G., Faubion, J. M., Ruan, R., & Miller, S. S. (1994). Quantita-tive microscopy in carbohydrate analysis.Carbohydrate Polymers, 25,285–293.
Gahmberg, C. G., & Tolvanen, M. (1994). Nonmetabolic radiolabeling and
tagging of glycoconjugates.Methods in enzymology, Vol. 230. NewYork: Academic Press (pp. 32–44).
Goudsmit, E. M., Matsuura, F., & Blake, D. A. (1984). Substrate specificityof d-galactose oxidase.The Journal of Biological Chemistry, 259 (5),2875–2878.
Grinberg, V. Y., & Tolstoguzov, V. B. (1997). Thermodynamic incompat-ibility of proteins and polysaccharides in solutions.Food Hydrocol-loids, 11 (2), 145–158.
Gubenkova, A. A., Somov, V. K., & Shenson, V. A. (1988). Physicochem-ical properties of pectin and pectin-based solutions and jellies.Pishche-vaya Promyshlennost’, USSR, 5, 13–16 (abstract in English).
Guthrie, R. D. (1962). Periodate oxidation experimental conditions. In R. L.Whistler & M. L. Wolfrom, Methods in carbohydrate chemistry(pp. 432–435). New York: Academic Press.
Haugland, R. P. (1996).Handbook of fluorescent probes and researchchemicals, . (6th ed.)Eugene, OR: Molecular Probes (pp. 14, 30).
Hermanson, G. T. (1996).Bioconjugate techniques, San Diego: AcademicPress.
Ichinose, N., Schwedt, G., Schnepel, F. M., & Adachi, K. (1991). Fluoro-metric analysis in biomedical chemistry, trends and techniques includ-ing HPLC applications.Chemical analysis series, Vol. 109. New York:Wiley.
Ipsen, R. (1995). Mixed gels made from protein and kappa-carrageenan.Carbohydrate Polymers, 28 (4), 337–339.
ISO. (1994).Meat and meat products — determination of hydroxyprolinecontent.ISO 3496:1994(E). Geneve, Switzerland: International Orga-nization for Standardization.
Jackson, E. L. (1944). Periodic acid oxidation. In R. Adams,Organicreactions(pp. 341–375). , Vol. 2. New York: Wiley.
Kalab, M., Allan-Wojtas, P., & Miller, S. S. (1995). Microscopy and otherimaging techniques in food structure analysis.Trends in Food Scienceand Technology, 6, 177–186.
Kasapis, S., Morris, E. R., Norton, I. T., & Brown, R. T. (1993a). Phaseequilibria and gelation in gelatin/maltodextrin systems — part III:phase separation in mixed gels.Carbohydrate Polymers, 21, 261–268.
Kasapis, S., Morris, E. R., Norton, I. T., & Clark, A. H. (1993b). Phaseequilibria and gelation in gelatin/maltodextrin systems — part IV:composition-dependence of mixed-gel moduli.Carbohydrate Poly-mers, 21, 269–276.
Katayama, M., Nakane, R., Matsuda, Y., Kaneko, S., Hara, I., & Sato, H.(1998). Determination of progesterone and 17-hydroxyprogesterone byhigh performance liquid chromatography after pre-column derivatiza-tion with 4,4-difluoro-5,7-dimethyl-4-bora-3a,4a-diaza-s-indacene-3-propiono-hydrazide.Analyst, 123, 2339–2342.
Kinsella, J. E., Rector, D. J., & Phillips, L. G. (1994). Physicochemicalproperties of proteins: texturization via gelation, glass and film forma-tion. In R. Y. Yada, R. L. Jackman & J. L. Smith,Protein structure–function relationships in foods(pp. 1–21). New York: BlackieAcademic and Professional.
Kumar, U., Laird, D., Srikant, C. B., Escher, E., & Patel, Y. C. (1997).Expression of the five somatostatin receptor (SSTR1-5) subtypes in ratpituitary somatotrophes: quantitative analysis by double-label immuno-fluorescence confocal microscopy.Endocrinology, 138 (10), 4473–4474.
Mazur, A. W. (1991). Galactose oxidase — selected properties andsynthetic applications.ACS symposium series, Vol. 466 (pp. 99–110).
Owen, A. J., & Jones, R. A. L. (1998). Rheology of a simultaneously phase-separating and gelling biopolymer mixture.Macromolecules, 31, 7336–7339.
Ploem, J. S. (1993). Fluorescence microscopy. In W. T. Mason,Fluorescentand luminescent probes for biological activity. Biological techniques(pp. 1–11). New York: Academic Press.
Puchtler, H., Meloan, S. N., & Brewton, B. R. (1974). On the binding ofSchiff’s reagent in the PAS reaction: effects of molecular configurationsin models.Histochemistry, 40, 291–299.
Ross-Murphy, B. S. (1994). Physical techniques for the study of foodbiopolymers New York: Blackie Academic and Professional.
T.S. Nordmark, G.R. Ziegler / Food Hydrocolloids 14 (2000) 579–590 589
Ross-Murphy, S. B. (1995). Small deformation rheological behavior of bio-polymer mixtures. In S. E. Harding, S. E. Hill & J. R. Mitchell,Biopolymermixtures(p. 95). Nottingham: Nottingham University Press.
Rost, F. W. D. (1991).Quantitative fluorescence microscopy, Cambridge:Cambridge University Press.
Scott, R. W. (1979). Colorimetric determination of hexuronic acids in plantmaterials.Analytical Chemistry, 51 (7), 936–941.
Stegemann, H., & Stalder, K. (1967). Determination of hydroxyproline.Clinica Chimica Acta, 18, 267–273.
Stelzer, E. H. K. (1998). Contrast, resolution, pixelation, dynamic range andsignal-to-noise ratio: fundamental limits to resolution in fluorescencelight microscopy.Journal of Microscopy, 189 (1), 15–24.
Strasburg, G. M., & Ludescher, R. D. (1995). Theory and applications offluorescence spectroscopy in food research.Trends in Food Science andTechnology, 6, 69–75.
Theander, O., Aman, P., Westerlund, E., Andersson, R., & Pettersson, D.(1995). Total dietary fiber determined as neutral sugar residues, uronicacid residues, and Klason lignin (The Uppsala Method): collaborativestudy.Journal of AOAC International, 78 (4), 1030–1041.
Tolstoguzov, V. B. (1990). Interactions of gelatin with polysaccharides. InG. Phillips, P. A. Williams & D. Wedlock,Gums and stabilisers for thefood industry(pp. 157–175). , Vol. 5. Wrexham, UK: IRL Press.
Tolstoguzov, V. B. (1995). Some physico-chemical aspects of proteinprocessing in foods. Multicomponent gels.Food Hydrocolloids, 9 (4),317–332.
Vinches, C., Parker, A., & Reed, W. F. (1997). Phase behavior of aqueousgelatin/oligosaccharide mixtures.Biopolymers, 41 (6), 607–622.
Vodovotz, Y., Vittadini, E., Coupland, J., McClements, D. J., & Chinachoti,P. (1996). Bridging the gap: use of confocal microscopy in foodresearch.Food Technology, 50 (6), 74–82.
Walter, R. H. (1991). Analytical and graphical methods for pectin. In R. H.Walter, The chemistry and technology of pectin(pp. 207–208). SanDiego: Academic Press (pp. 215–216).
Walter, R. H., & Sherman, R. M. (1983). The induced stabilization ofaqueous pectin dispersions by ethanol.Journal of Food Science, 48,1235–1237 (see also p. 1241).
Wilchek, M., & Bayer, E. A. (1987). Labeling glycoconjugates with hydra-zide reagents.Methods in enzymology, Vol. 138. New York: AcademicPress (pp. 429–442).
Winnik, M. A., & Winnik, F. M. (1993). Fluorescence studies of polymerassociation in water. In M. W. Urban & C. D. Craver,Structure-prop-erty relations in polymers. Spectroscopy and performanceAdvances inchemistry series(pp. 485–505). , Vol. 236. Washington, DC: AmericanChemical Society.
Ziegler, G. R. (1988).Relationship between the dynamic shear modulus ofmixed gelatin–egg white gels and their thermodynamic compatibility inan aqueous solvent.PhD thesis, Cornell University.
Ziegler, G. R., & Foegeding, E. A. (1990). The gelation of proteins. In J. E.Kinsella, Advances in food and nutrition research(pp. 203–298).Vol. 34. New York: Academic Press.
T.S. Nordmark, G.R. Ziegler / Food Hydrocolloids 14 (2000) 579–590590
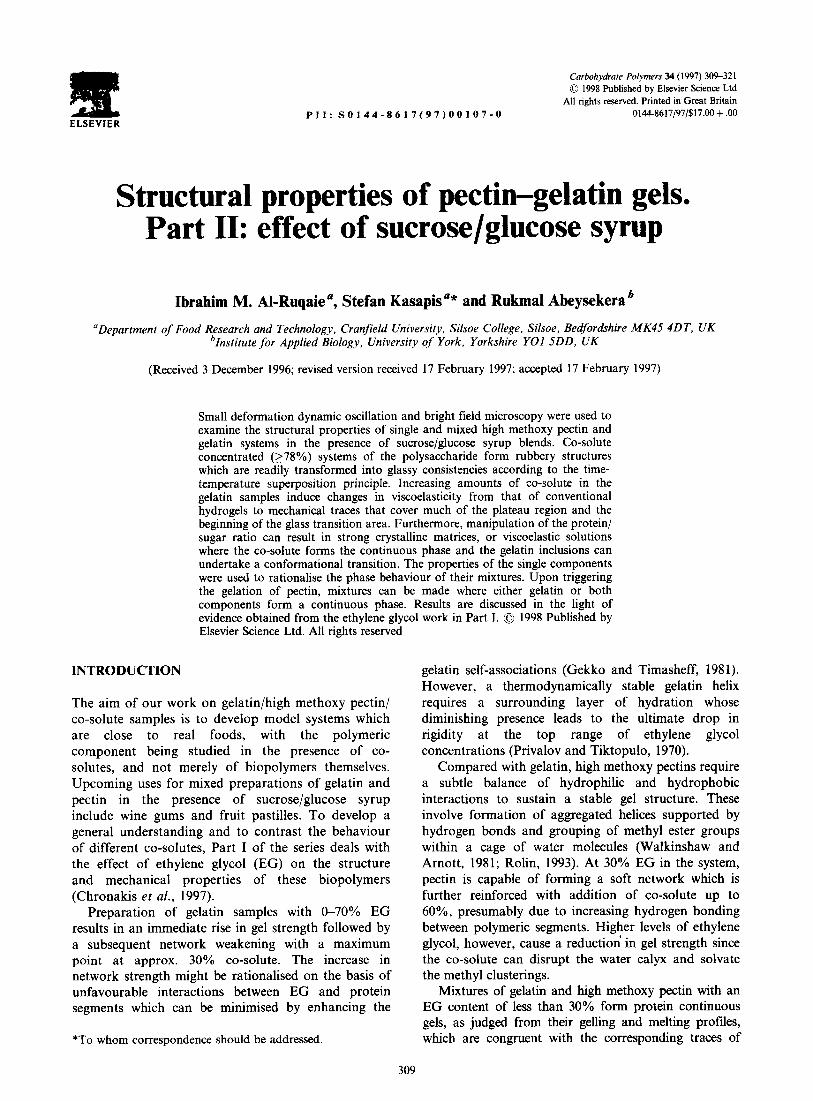
PII: SO144-8617(97)00107-O
Carbohydrate Polymers 34 (1997) 309-321 0 1998 Published by Elsevier Science Ltd
All rights reserved. Printed in Great Britain Oh&l-8617/97/%17.00 + .OO
ELSEVIER
Structural properties of pectin-gelatin gels. Part II: effect of sucrose/glucose syrup
Ibrahim M. Al-Ruqaie”, Stefan Kasapis”* and Rukmal AbeysekeraB
‘Department of Food Research and Technology, Cranfield University, Silsoe College, Silsoe, Bedfordshire h4K45 4DT, UK bInstitute for Applied Biology, University of York, Yorkshire YOI 5DD, UK
(Received 3 December 1996; revised version received 17 February 1997; accepted 17 February 1997)
Small deformation dynamic oscillation and bright field microscopy were used to examine the structural properties of single and mixed high methoxy pectin and gelatin systems in the presence of sucrose/glucose syrup blends. Co-solute concentrated (278%) systems of the polysaccharide form rubbery structures which are readily transformed into glassy consistencies according to the time- temperature superposition principle. Increasing amounts of co-solute in the gelatin samples induce changes in viscoelasticity from that of conventional hydrogels to mechanical traces that cover much of the plateau region and the beginning of the glass transition area. Furthermore, manipulation of the protein/ sugar ratio can result in strong crystalline matrices, or viscoelastic solutions where the co-solute forms the continuous phase and the gelatin inclusions can undertake a conformational transition. The properties of the single components were used to rationalise the phase behaviour of their mixtures. Upon triggering the gelation of pectin, mixtures can be made where either gelatin or both components form a continuous phase. Results are discussed in the light of evidence obtained from the ethylene glvcol work in Part I. 0 1998 Published by Elsevier Science Ltd. All rightsreserv&l
INTRODUCTION
The aim of our work on gelatin/high methoxy pectin/ co-solute samples is to develop model systems which are close to real foods, with the polymeric component being studied in the presence of co- solutes, and not merely of biopolymers themselves. Upcoming uses for mixed preparations of gelatin and pectin in the presence of sucrose/glucose syrup include wine gums and fruit pastilles. To develop a general understanding and to contrast the behaviour of different co-solutes, Part I of the series deals with the effect of ethylene glycol (EG) on the structure and mechanical properties of these biopolymers (Chronakis et al., 1997).
Preparation of gelatin samples with O-70% EG results in an immediate rise in gel strength followed by a subsequent network weakening with a maximum point at approx. 30% co-solute. The increase in network strength might be rationalised on the basis of unfavourable interactions between EG and protein segments which can be minimised by enhancing the
*To whom correspondence should be addressed.
gelatin self-associations (Gekko and Timasheff, 198 1). However, a thermodynamically stable gelatin helix requires a surrounding layer of hydration whose diminishing presence leads to the ultimate drop in rigidity at the top range of ethylene glycol concentrations (Privalov and Tiktopulo, 1970).
Compared with gelatin, high methoxy pectins require a subtle balance of hydrophilic and hydrophobic interactions to sustain a stable gel structure. These involve formation of aggregated helices supported by hydrogen bonds and grouping of methyl ester groups within a cage of water molecules (Walkinshaw and Arnott, 1981; Rolin, 1993). At 30% EG in the system, pectin is capable of forming a soft network which is further reinforced with addition of co-solute up to 60%, presumably due to increasing hydrogen bonding between polymeric segments. Higher levels of ethylene glycol, however, cause a reduction in gel strength since the co-solute can disrupt the water calyx and solvate the methyl clusterings.
Mixtures of gelatin and high methoxy pectin with an EG content of less than 30% form protein continuous gels, as judged from their gelling and melting profiles, which are congruent with the corresponding traces of
309
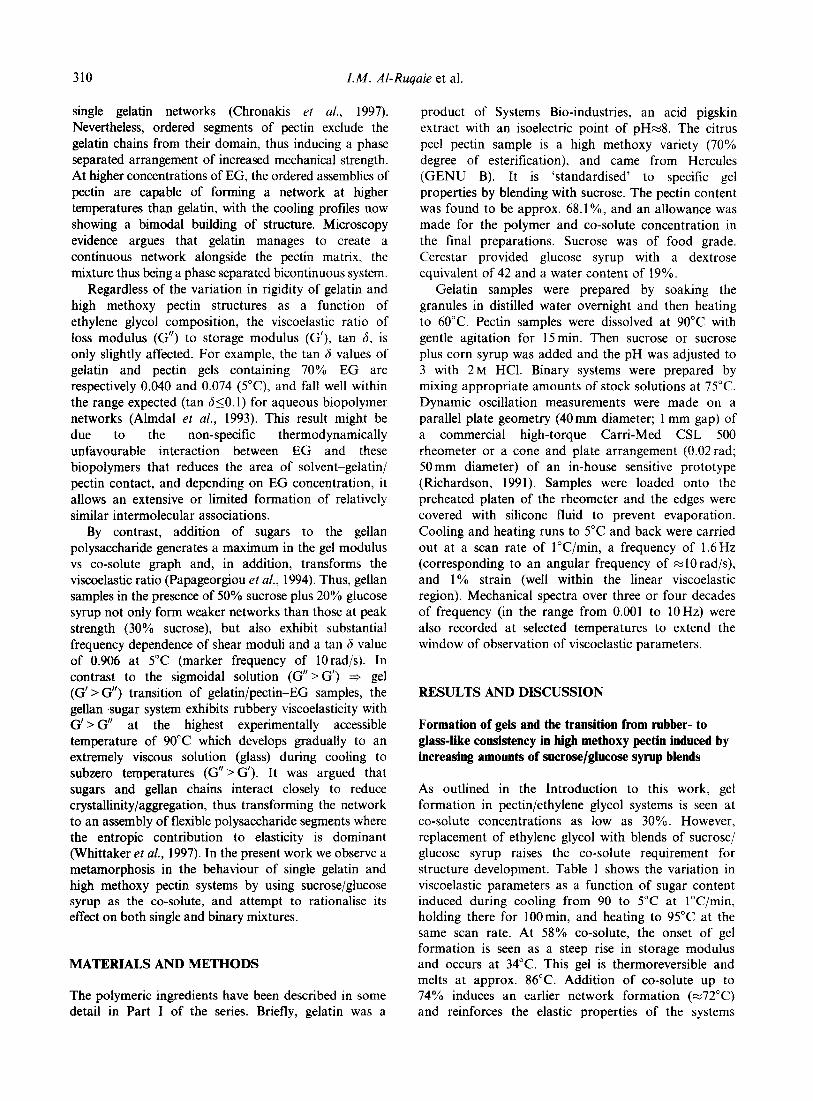
310 I.M. Al-Ruqaie et al.
single gelatin networks (Chronakis et al., 1997). product of Systems Bio-industries, an acid pigskin Nevertheless, ordered segments of pectin exclude the extract with an isoelectric point of pHx8. The citrus gelatin chains from their domain, thus inducing a phase peel pectin sample is a high methoxy variety (70% separated arrangement of increased mechanical strength. degree of esterification), and came from Hercules At higher concentrations of EG, the ordered assemblies of (GENU B). It is ‘standardised’ to specific gel pectin are capable of forming a network at higher properties by blending with sucrose. The pectin content temperatures than gelatin, with the cooling profiles now was found to be approx. 68.1%, and an allowance was showing a bimodal building of structure. Microscopy made for the polymer and co-solute concentration in evidence argues that gelatin manages to create a the final preparations. Sucrose was of food grade. continuous network alongside the pectin matrix, the Cerestar provided glucose syrup with a dextrose mixture thus being a phase separated bicontinuous system. equivalent of 42 and a water content of 19%.
Regardless of the variation in rigidity of gelatin and high methoxy pectin structures as a function of ethylene glycol composition, the viscoelastic ratio of loss modulus (G”) to storage modulus (G’), tan 6, is only slightly affected. For example, the tan 6 values of gelatin and pectin gels containing 70% EG are respectively 0.040 and 0.074 (YC), and fall well within the range expected (tan S<O.l) for aqueous biopolymer networks (Almdal et al., 1993). This result might be due to the non-specific thermodynamically unfavourable interaction between EG and these biopolymers that reduces the area of solvent-gelatin/ pectin contact, and depending on EG concentration, it allows an extensive or limited formation of relatively similar intermolecular associations.
By contrast, addition of sugars to the gellan polysaccharide generates a maximum in the gel modulus vs co-solute graph and, in addition, transforms the viscoelastic ratio (Papageorgiou et al., 1994). Thus, gellan samples in the presence of 50% sucrose plus 20% glucose syrup not only form weaker networks than those at peak strength (30% sucrose), but also exhibit substantial frequency dependence of shear moduli and a tan 6 value of 0.906 at 5°C (marker frequency of lOrad/s). In contrast to the sigmoidal solution (G” > G’) + gel (G’ > G”) transition of gelatin/pectin-EG samples, the gellan-sugar system exhibits rubbery viscoelasticity with G’ > G” at the highest experimentally accessible temperature of 90°C which develops gradually to an extremely viscous solution (glass) during cooling to subzero temperatures (G” > G’). It was argued that sugars and gellan chains interact closely to reduce crystallinity/aggregation, thus transforming the network to an assembly of flexible polysaccharide segments where the entropic contribution to elasticity is dominant (Whittaker et al., 1997). In the present work we observe a metamorphosis in the behaviour of single gelatin and high methoxy pectin systems by using sucrose/glucose syrup as the co-solute, and attempt to rationalise its effect on both single and binary mixtures.
Gelatin samples were prepared by soaking the granules in distilled water overnight and then heating to 60°C. Pectin samples were dissolved at 90°C with gentle agitation for I5 min. Then sucrose or sucrose plus corn syrup was added and the pH was adjusted to 3 with 2~ HCl. Binary systems were prepared by mixing appropriate amounts of stock solutions at 75°C. Dynamic oscillation measurements were made on a parallel plate geometry (40mm diameter; 1 mm gap) of a commercial high-torque Carri-Med CSL 500 rheometer or a cone and plate arrangement (0.02 rad; 50mm diameter) of an in-house sensitive prototype (Richardson, 1991). Samples were loaded onto the preheated platen of the rheometer and the edges were covered with silicone fluid to prevent evaporation. Cooling and heating runs to 5°C and back were carried out at a scan rate of l”C/min, a frequency of 1.6 Hz (corresponding to an angular frequency of M 10 rad/s), and 1% strain (well within the linear viscoelastic region). Mechanical spectra over three or four decades of frequency (in the range from 0.001 to 10Hz) were also recorded at selected temperatures to extend the window of observation of viscoelastic parameters.
RESULTS AND DISCUSSION
Formation of gels and the transition from rubber- to glass-like consistency in high methoxy pectin induced by increasing amounts of sucrose/&Iucose syrup blends
MATERIALS AND METHODS
The polymeric ingredients have been described in some detail in Part I of the series. Briefly, gelatin was a
As outlined in the Introduction to this work, gel formation in pectin/ethylene glycol systems is seen at co-solute concentrations as low as 30%. However, replacement of ethylene glycol with blends of sucrose/ glucose syrup raises the co-solute requirement for structure development. Table 1 shows the variation in viscoelastic parameters as a function of sugar content induced during cooling from 90 to 5°C at l”C/min, holding there for lOOmin, and heating to 95°C at the same scan rate. At 58% co-solute, the onset of gel formation is seen as a steep rise in storage modulus and occurs at 34°C. This gel is thermoreversible and melts at approx. 86°C. Addition of co-solute up to 74% induces an earlier network formation (~72°C) and reinforces the elastic properties of the systems
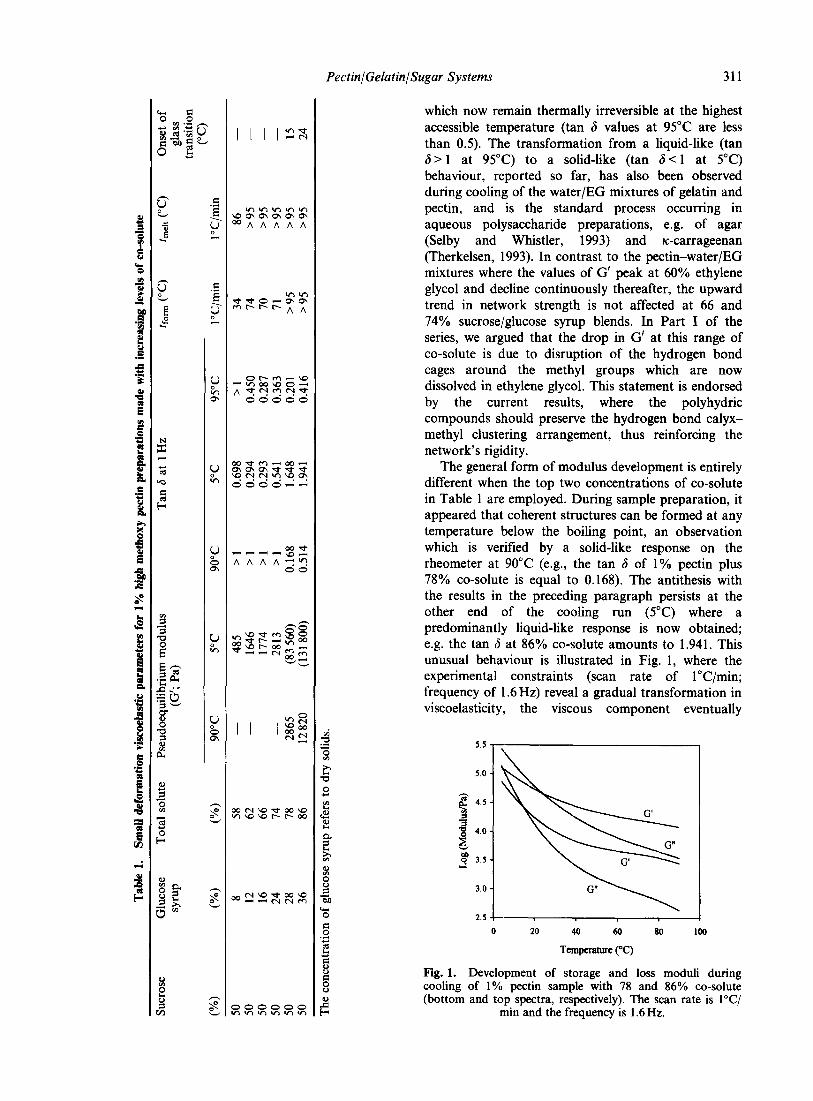
Pectin/Gelatin/Sugar Systems 311
which now remain thermally irreversible at the highest accessible temperature (tan 6 values at 95°C are less than 0.5). The transformation from a liquid-like (tan 6 > 1 at 95°C) to a solid-like (tan 6 < 1 at 5°C) behaviour, reported so far, has also been observed during cooling of the water/EG mixtures of gelatin and pectin, and is the standard process occurring in aqueous polysaccharide preparations, e.g. of agar (Selby and Whistler, 1993) and rc-carrageenan (Therkelsen, 1993). In contrast to the pectin-water/EG mixtures where the values of G’ peak at 60% ethylene glycol and decline continuously thereafter, the upward trend in network strength is not affected at 66 and 74% sucrose/glucose syrup blends. In Part I of the series, we argued that the drop in G’ at this range of co-solute is due to disruption of the hydrogen bond cages around the methyl groups which are now dissolved in ethylene glycol. This statement is endorsed by the current results, where the polyhydric compounds should preserve the hydrogen bond calyx- methyl clustering arrangement, thus reinforcing the network’s rigidity.
The general form of modulus development is entirely different when the top two concentrations of co-solute in Table 1 are employed. During sample preparation, it appeared that coherent structures can be formed at any temperature below the boiling point, an observation which is verified by a solid-like response on the rheometer at 90°C (e.g., the tan 6 of 1% pectin plus 78% co-solute is equal to 0.168). The antithesis with the results in the preceding paragraph persists at the other end of the cooling run (5°C) where a predominantly liquid-like response is now obtained; e.g. the tan 6 at 86% co-solute amounts to 1.941. This unusual behaviour is illustrated in Fig. 1, where the experimental constraints (scan rate of l”C/min; frequency of 1.6 Hz) reveal a gradual transformation in viscoelasticity, the viscous component eventually
5.5 -
5.0 -
ii 4’5 g 4.0 -
E
EJ 3.5 -
3.0 -
2.5 +
0 20 40 60 80 100
Tempexature (‘T)
Fig. 1. Development of storage and loss moduli during cooling of 1% pectin sample with 78 and 86% co-solute (bottom and top spectra, respectively). The scan rate is l”C/
min and the frequency is 1.6Hz.
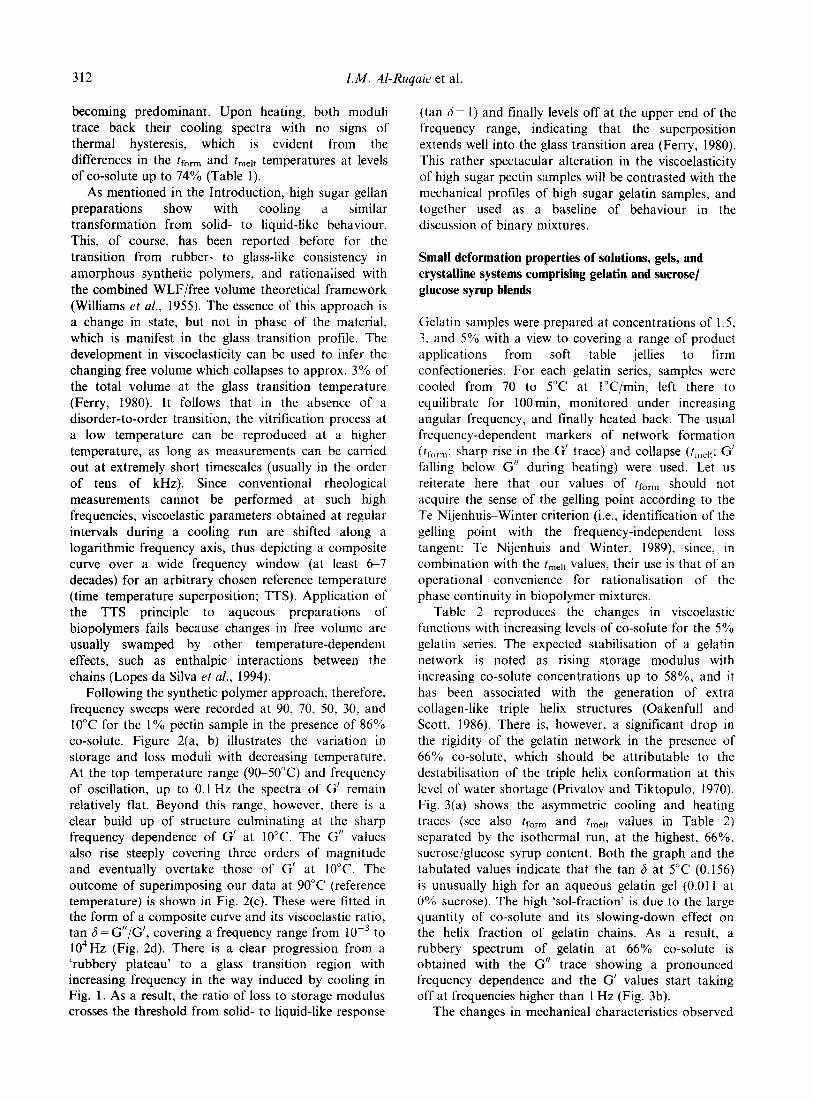
312 I.M. Al-Ruqaie et al.
becoming predominant. Upon heating, both moduli trace back their cooling spectra with no signs of
thermal hysteresis, which is evident from the differences in the trorm and t,,it temperatures at levels of co-solute up to 74% (Table 1).
As mentioned in the Introduction, high sugar gellan
preparations show with cooling a similar transformation from solid- to liquid-like behaviour.
This, of course, has been reported before for the
transition from rubber- to glass-like consistency in
amorphous synthetic polymers, and rationalised with
the combined WLF/free volume theoretical framework
(Williams et al., 1955). The essence of this approach is a change in state, but not in phase of the material,
which is manifest in the glass transition prolile. The development in viscoelasticity can be used to infer the
changing free volume which collapses to approx. 3% of the total volume at the glass transition temperature
(Ferry, 1980). It follows that in the absence of a disorder-to-order transition, the vitrification process at
a low temperature can be reproduced at a higher temperature, as long as measurements can be carried
out at extremely short timescales (usually in the order of tens of kHz). Since conventional rheological
measurements cannot be performed at such high
frequencies, viscoelastic parameters obtained at regular intervals during a cooling run are shifted along a
logarithmic frequency axis, thus depicting a composite curve over a wide frequency window (at least 6-7 decades) for an arbitrary chosen reference temperature
(time-temperature superposition; TTS). Application of the TTS principle to aqueous preparations of biopolymers fails because changes in free volume are
usually swamped by other temperature-dependent effects, such as enthalpic interactions between the
chains (Lopes da Silva et al., 1994). Following the synthetic polymer approach, therefore,
frequency sweeps were recorded at 90, 70, 50, 30, and 10°C for the 1% pectin sample in the presence of 86%
co-solute. Figure 2(a, b) illustrates the variation in storage and loss moduli with decreasing temperature.
At the top temperature range (90-50°C) and frequency of oscillation, up to 0.1 Hz the spectra of G’ remain relatively flat. Beyond this range, however, there is a clear build up of structure culminating at the sharp frequency dependence of G’ at 10°C. The G” values
also rise steeply covering three orders of magnitude and eventually overtake those of G’ at 10°C. The
outcome of superimposing our data at 90°C (reference temperature) is shown in Fig. 2(c). These were fitted in the form of a composite curve and its viscoelastic ratio, tan 6 = G”/G’, covering a frequency range from 10-s to 104Hz (Fig. 2d). There is a clear progression from a ‘rubbery plateau’ to a glass transition region with increasing frequency in the way induced by cooling in Fig. 1. As a result, the ratio of loss to storage modulus crosses the threshold from solid- to liquid-like response
(tan (5 = 1) and finally levels off at the upper end of the
frequency range, indicating that the superposition extends well into the glass transition area (Ferry, 1980). This rather spectacular alteration in the viscoelasticity
of high sugar pectin samples will be contrasted with the
mechanical profiles of high sugar gelatin samples, and together used as a baseline of behaviour in the discussion of binary mixtures.
Small deformation properties of solutions, gels, and crystalline systems comprising gelatin and sucrose/ glucose syrup blends
Gelatin samples were prepared at concentrations of 1.5, 3. and 5% with a view to covering a range of product applications from soft table jellies to firm
confectioneries. For each gelatin series, samples were
cooled from 70 to 5°C at l”C/min, left there to equilibrate for 100 min, monitored under increasing angular frequency, and finally heated back. The usual
frequency-dependent markers of network formation
(fii,& sharp rise in the G’ trace) and collapse (tmelt; G’ falling below G” during heating) were used. Let us
reiterate here that our values of tform should not
acquire the sense of the gelling point according to the Te Nijenhuis-Winter criterion (i.e., identification of the
gelling point with the frequency-independent loss tangent; Te Nijenhuis and Winter, 1989) since, in
combination with the tmelt values, their use is that of an operational convenience for rationalisation of the
phase continuity in biopolymer mixtures. Table 2 reproduces the changes in viscoelastic
functions with increasing levels of co-solute for the 5%
gelatin series. The expected stabilisation of a gelatin network is noted as rising storage modulus with
increasing co-solute concentrations up to 58%, and it has been associated with the generation of extra collagen-like triple helix structures (Oakenfull and
Scott, 1986). There is, however, a significant drop in the rigidity of the gelatin network in the presence of
66% co-solute, which should be attributable to the destabilisation of the triple helix conformation at this
level of water shortage (Privalov and Tiktopulo, 1970). Fig. 3(a) shows the asymmetric cooling and heating traces (see also tform and r,,it values in Table 2)
separated by the isothermal run, at the highest, 66%, sucrose/glucose syrup content. Both the graph and the tabulated values indicate that the tan 6 at 5°C (0.156)
is unusually high for an aqueous gelatin gel (0.011 at 0% sucrose). The high ‘sol-fraction’ is due to the large quantity of co-solute and its slowing-down effect on the helix fraction of gelatin chains. As a result, a rubbery spectrum of gelatin at 66% co-solute is obtained with the G” trace showing a pronounced frequency dependence and the G’ values start taking off at frequencies higher than 1 Hz (Fig. 3b).
The changes in mechanical characteristics observed
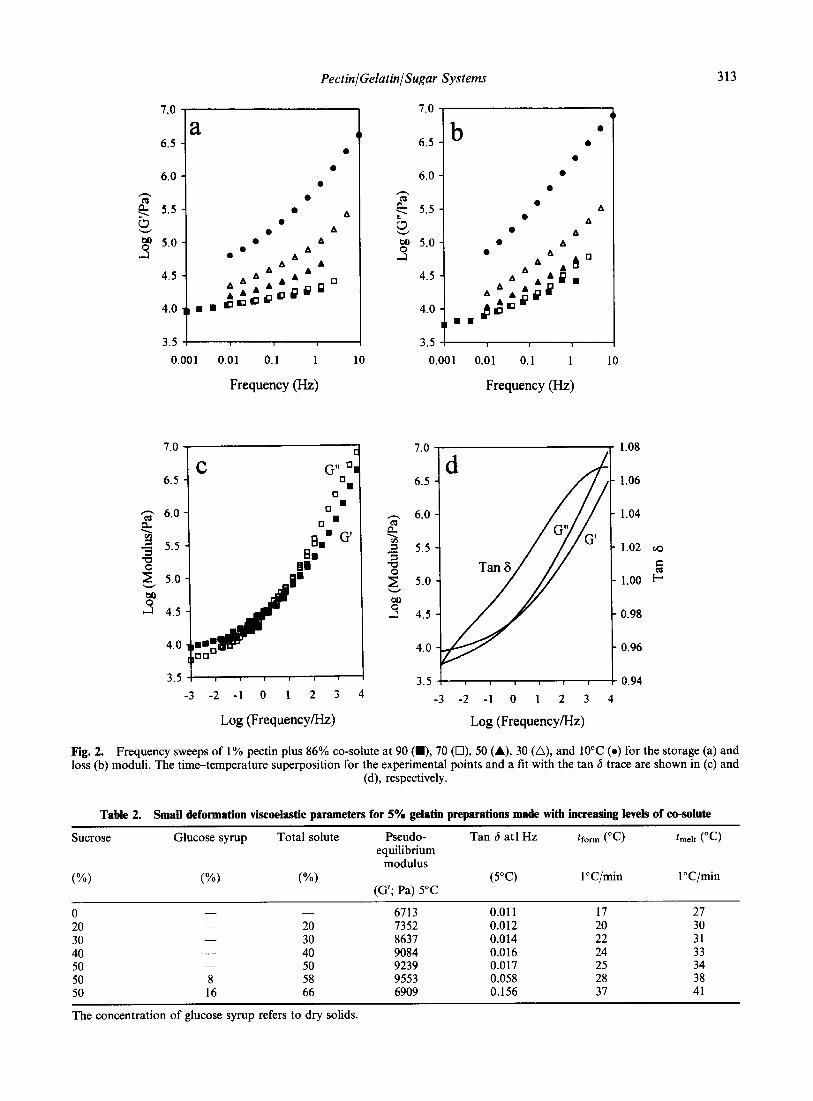
Pectin/Gelatin/Sugar Systems 313
7.0
6.5
6.0
$ 5.5
V 3 5.0 IJ
4.5
4.0
3.5
i 1. l
l
l
l
l A 0
l A
0.001 0.01 0.1 1 10 0.001 0.01 0.1 1 10
Frequency (Hz) Frequency (Hz)
6.5
3 6.0
$
2 5.5
2 5.0
C
3.5 I
-3 -2 -1 0 1 2 3 4
Log (Frequency/Hz)
6.5
6.0
$ 5.5
V 8 5.0
-1
4.5
4.0
3.5
l
l
l
l
l
l A
l A l A
6.5
6.0
1.08
1.06
0.96
3.5 I 1 1 I I I I : 0.94
-3 -2 -1 0 I 2 3 4
Log (Frequency/Hz)
Fig. 2. Frequency sweeps of 1% pectin plus 86% co-solute at 90 (m), 70 (Cl), 50 (A), 30 (A), and 10°C (0) for the storage (a) and loss (b) moduli. The time-temperature superposition for the experimental points and a fit with the tan 6 trace are shown in (c) and
(d), respectively.
Table 2. Small deformation viscoelastic parameters for 5% gelatin preparations made with increasing levels of co-solute
Sucrose Glucose syrup Total solute Pseudo- Tan 6 at1 Hz tfcm (“(3 GneJt (“(3
equilibrium modulus
(%) (%) (%) (5OC) l”C/min l”C/min (G’; Pa) 5°C
0 - - 6713 0.011 17 27 20 20 7352 0.012 20 30 30 30 8637 0.014 22 31 40 - 40 9084 0.016 24 33 50 50 9239 0.017 25 34 50 8 58 9553 0.058 28 38 50 16 66 6909 0.156 37 41
The concentration of glucose syrup refers to dry solids.
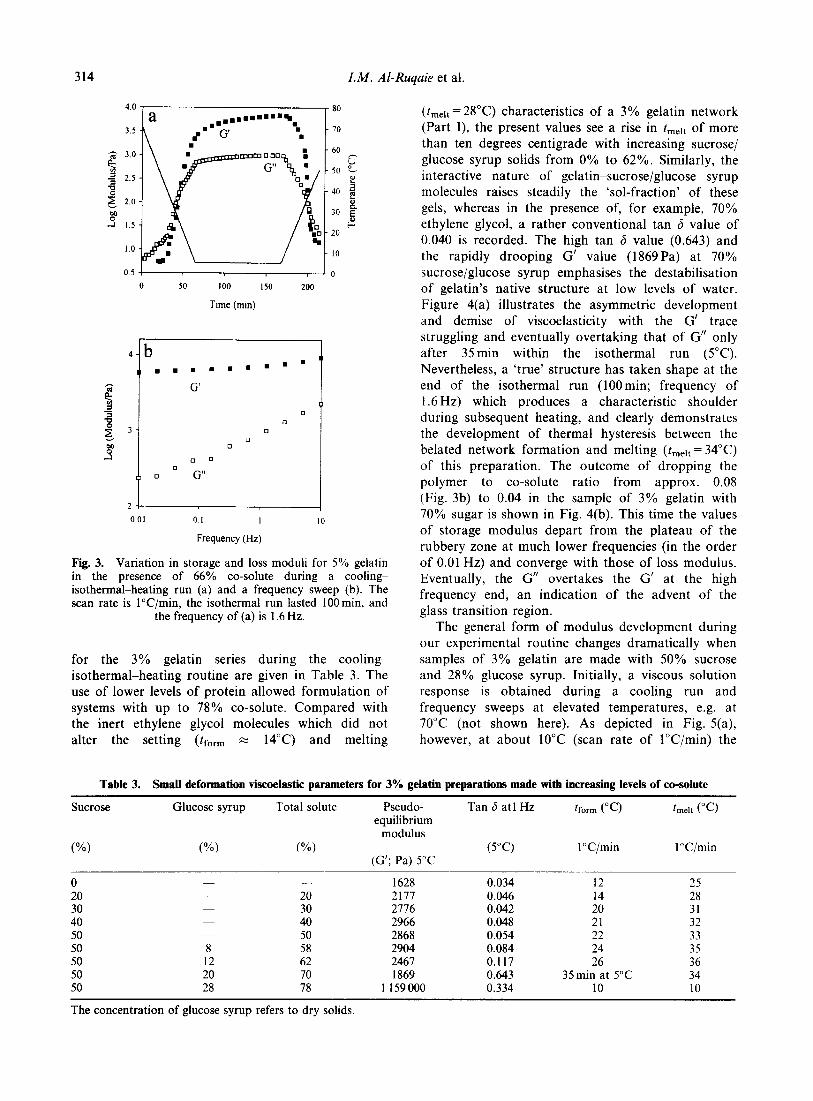
314 I.M. Al-Ruqaie et al.
0.5 -I 0 50 100 150 200
Time (min)
0.01 01 I
Frequency (Hz)
IO
Fig. 3. Variation in storage and loss moduli for 5% gelatin in the presence of 66% co-solute during a cooling- isothermal-heating run (a) and a frequency sweep (b). The scan rate is l”C/min, the isothermal run lasted lOOmin, and
the frequency of (a) is 1.6 Hz.
for the 3% gelatin series during the cooling-
isothermal-heating routine are given in Table 3. The use of lower levels of protein allowed formulation of systems with up to 78% co-solute. Compared with the inert ethylene glycol molecules which did not alter the setting (trorm z 14°C) and melting
(tmeit=2S0C) characteristics of a 3% gelatin network (Part I), the present values see a rise in tmelt of more than ten degrees centigrade with increasing sucrose/ glucose syrup solids from 0% to 62%. Similarly, the interactive nature of gelatin-sucrose/glucose syrup molecules raises steadily the ‘sol-fraction’ of these gels, whereas in the presence of, for example, 70% ethylene glycol, a rather conventional tan 6 value of 0.040 is recorded. The high tan 6 value (0.643) and the rapidly drooping G’ value (1869 Pa) at 70% sucrose/glucose syrup emphasises the destabilisation of gelatin’s native structure at low levels of water. Figure 4(a) illustrates the asymmetric development and demise of viscoelasticity with the G’ trace struggling and eventually overtaking that of G” only after 35min within the isothermal run (5°C). Nevertheless, a ‘true’ structure has taken shape at the end of the isothermal run (lOOmin; frequency of 1.6 Hz) which produces a characteristic shoulder during subsequent heating, and clearly demonstrates the development of thermal hysteresis between the belated network formation and melting (tmeit = 34°C) of this preparation. The outcome of dropping the polymer to co-solute ratio from approx. 0.08 (Fig. 3b) to 0.04 in the sample of 3% gelatin with 70% sugar is shown in Fig. 4(b). This time the values of storage modulus depart from the plateau of the rubbery zone at much lower frequencies (in the order of 0.01 Hz) and converge with those of loss modulus. Eventually, the G” overtakes the G’ at the high frequency end, an indication of the advent of the glass transition region.
The general form of modulus development during our experimental routine changes dramatically when samples of 3% gelatin are made with 50% sucrose and 28% glucose syrup. Initially, a viscous solution response is obtained during a cooling run and frequency sweeps at elevated temperatures, e.g. at 70°C (not shown here). As depicted in Fig. S(a), however, at about 10°C (scan rate of l”C/min) the
Table 3. Small deformation viscoelastic parameters for 3% gelatin preparations made with increasing levels of co-solute
Sucrose Glucose syrup Total solute Pseudo- Tan 6 at1 Hz tform (“Cl Gnelt (“C)
equilibrium modulus
W) W) W) (5°C) 1 “C/min 1 “C/min (G’; Pa) 5°C
0 20 30 40 50 50 50 50 50
20 30 40 50
8 58 12 62 20 70 28 78
1628 0.034 12 25 2177 0.046 14 28 2776 0.042 20 31 2966 0.048 21 32 2868 0.054 22 33 2904 0.084 24 35 2467 0.117 26 36 1869 0.643 35min at 5°C 34
1159000 0.334 10 10
The concentration of glucose syrup refers to dry solids.
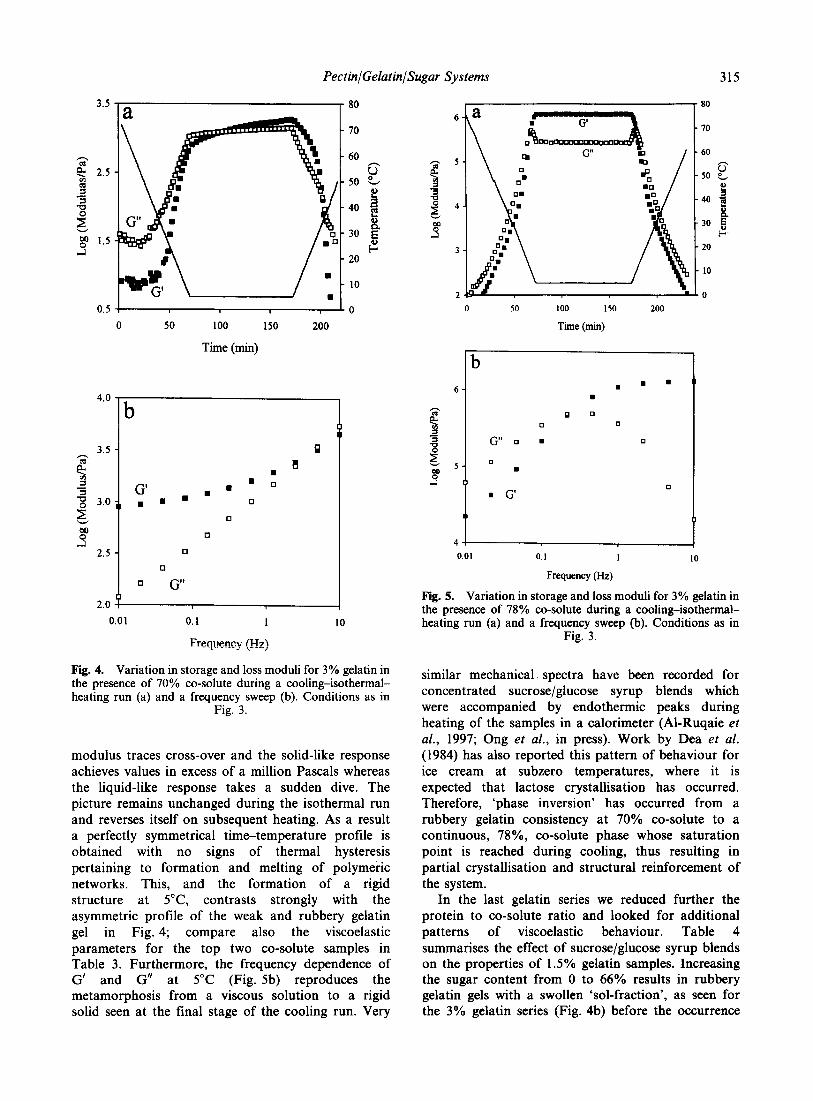
Pectin/Gelatin/Sugar Systems 315
4.0
3.5 ‘;;i‘
%
3 3.0
E
B a
2.5
2.0
80
0 50 100 150 200
Time (mm)
0
q
0 G"
0.01 10
Fig. 4. Variation in storage and loss moduli for 3% gelatin in the presence of 70% co-solute during a cooling-isothermal- heating run (a) and a frequency sweep (b). Conditions as in
Fig. 3.
modulus traces cross-over and the solid-like response achieves values in excess of a million Pascals whereas the liquid-like response takes a sudden dive. The picture remains unchanged during the isothermal run and reverses itself on subsequent heating. As a result a perfectly symmetrical time-temperature profile is obtained with no signs of thermal hysteresis pertaining to formation and melting of polymeric networks. This, and the formation of a rigid structure at 5”C, contrasts strongly with the asymmetric profile of the weak and rubbery gelatin gel in Fig. 4; compare also the viscoelastic parameters for the top two co-solute samples in Table 3. Furthermore, the frequency dependence of G’ and G” at 5°C (Fig. 5b) reproduces the metamorphosis from a viscous solution to a rigid solid seen at the final stage of the cooling run. Very
,la
I\ t 70
I 60
I 0
- 40 B zt
-30 E g
- 20
6
3
?i
is
-1
4 -I 0.01 0. I I IO
0 50 100 150 200
Time. (min)
Frew=y 0-W
Fig. 5. Variation in storage and loss moduli for 3% gelatin in the presence of 78% co-solute during a cooling-isothermal- heating run (a) and a frequency sweep (b). Conditions as in
Fig. 3.
similar mechanical. spectra have been recorded for concentrated sucrose/glucose syrup blends which were accompanied by endothermic peaks during heating of the samples in a calorimeter (Al-Ruqaie et al., 1997; Ong et al., in press). Work by Dea et al. (1984) has also reported this pattern of behaviour for ice cream at subzero temperatures, where it is expected that lactose crystallisation has occurred. Therefore, ‘phase inversion’ has occurred from a rubbery gelatin consistency at 70% co-solute to a continuous, 78%, co-solute phase whose saturation point is reached during cooling, thus resulting in partial crystallisation and structural reinforcement of the system.
In the last gelatin series we reduced further the protein to co-solute ratio and looked for additional patterns of viscoelastic behaviour. Table 4 summarises the effect of sucrose/glucose syrup blends on the properties of 1.5 % gelatin samples. Increasing the sugar content from 0 to 66% results in rubbery gelatin gels with a swollen ‘sol-fraction’, as seen for the 3% gelatin series (Fig. 4b) before the occurrence
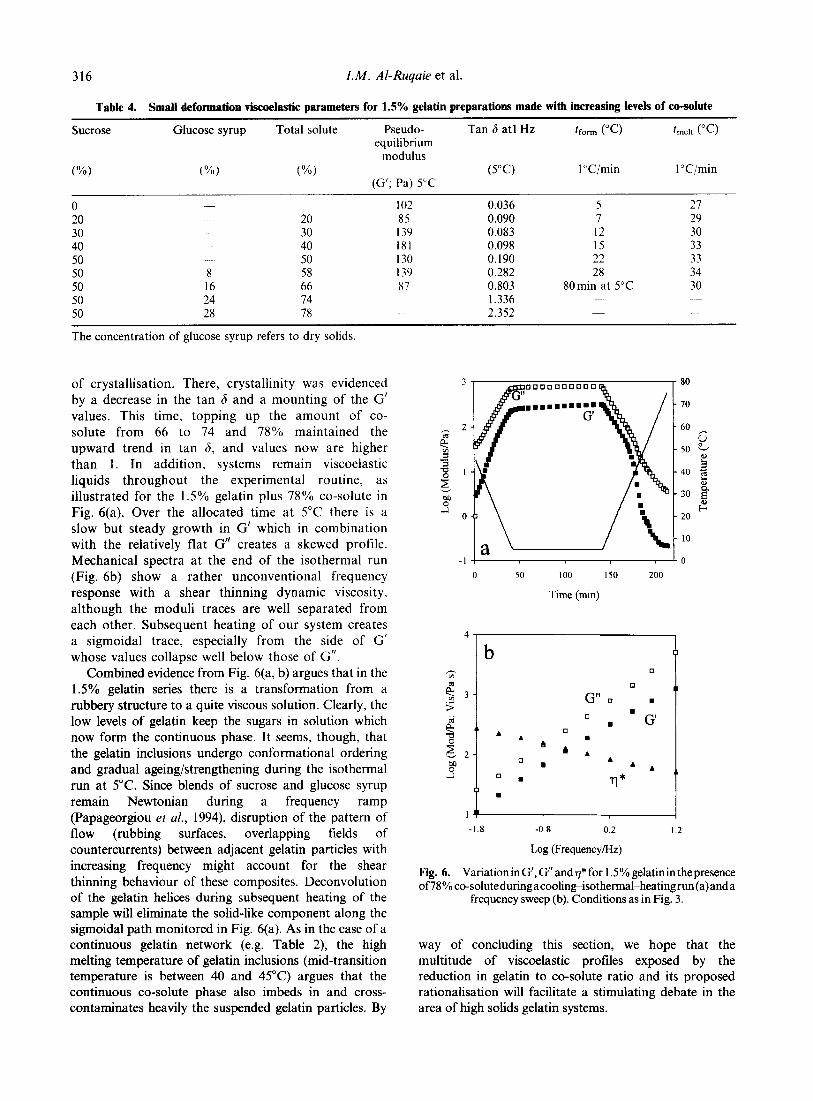
316 I.M. Al-Ruqaie et al.
Table 4. Small deformation viscoelastic parameters for 1.5% gelatin preparations made with increasing levels of co-solute
Sucrose Glucose syrup Total solute Pseudo- Tan 6 at1 Hz tfcm P-7 Gnelt (“C) equilibrium
modulus
W) (%) (%) (5°C) I “C/min 1 “C/min (G’; Pa) 5°C
0 102 0.036 5 21 20 20 85 0.090 7 29 30 30 139 0.083 12 30 40 40 181 0.098 15 33 50 50 130 0.190 22 33 50 8 58 139 0.282 28 34 50 16 66 87 0.803 80min at 5°C 30 50 24 74 1.336 50 28 78 2.352
The concentration of glucose syrup refers to dry solids.
of crystallisation. There, crystallinity was evidenced by a decrease in the tan 6 and a mounting of the G’ values. This time, topping up the amount of co- solute from 66 to 74 and 78% maintained the upward trend in tan 6, and values now are higher than 1. In addition, systems remain viscoelastic liquids throughout the experimental routine, as illustrated for the 1.5% gelatin plus 78% co-solute in Fig. 6(a). Over the allocated time at 5°C there is a slow but steady growth in G’ which in combination with the relatively flat G” creates a skewed profile. Mechanical spectra at the end of the isothermal run (Fig. 6b) show a rather unconventional frequency response with a shear thinning dynamic viscosity, although the moduli traces are well separated from each other. Subsequent heating of our system creates a sigmoidal trace, especially from the side of G’ whose values collapse well below those of G”.
Combined evidence from Fig. 6(a, b) argues that in the 1.5% gelatin series there is a transformation from a rubbery structure to a quite viscous solution. Clearly, the low levels of gelatin keep the sugars in solution which now form the continuous phase. It seems, though, that the gelatin inclusions undergo conformational ordering and gradual ageing/strengthening during the isothermal run at 5°C. Since blends of sucrose and glucose syrup remain Newtonian during a frequency ramp (Papageorgiou et al., 1994), disruption of the pattern of flow (rubbing surfaces, overlapping fields of countercurrents) between adjacent gelatin particles with increasing frequency might account for the shear thinning behaviour of these composites. Deconvolution of the gelatin helices during subsequent heating of the sample will eliminate the solid-like component along the sigmoidal path monitored in Fig. 6(a). As in the case of a continuous gelatin network (e.g. Table 2), the high melting temperature of gelatin inclusions (mid-transition temperature is between 40 and 45°C) argues that the continuous co-solute phase also imbeds in and cross- contaminates heavily the suspended gelatin particles. By
0 50 100 150 200
Time (min)
b
G” q ’ .
.
-1.8 -0.8 0.2 1.2
Log (Frequency/Hz)
Fig. 6. Variation in G’, G” and n* for I .5% gelatin in the presence of78%co-soluteduringacooling-isothermal-heatingrun(a)anda
frequency sweep (b). Conditions as in Fig. 3.
way of concluding this section, we hope that the multitude of viscoelastic profiles exposed by the reduction in gelatin to co-solute ratio and its proposed rationalisation will facilitate a stimulating debate in the area of high solids gelatin systems.
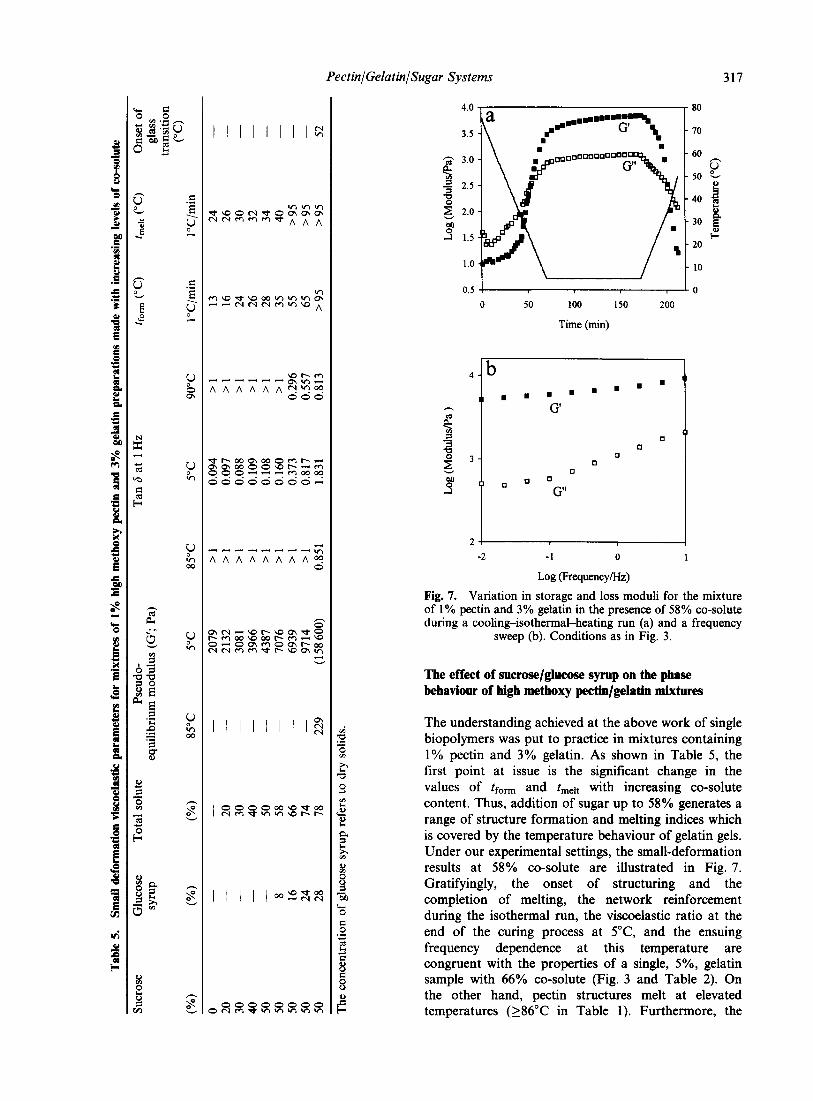
Pectin/Gelatin/Sugar Systems 317
I I I I I I I IZ
I I I I I=JZzi%
4.0 80
3.5 70
3 3.0 60
2 50 fi e
a 2.5 $
g 40 2.0 z 30
2 8. E
il 1.5 F 20
1.0 10
0.5 0
0 50 100 150 200
_l
II
II
f
Time (min)
-2 -1 0 1
Log (Frequency/Hz)
Fig. 7. Variation in storage and loss moduli for the mixture of 1% pectin and 3% gelatin in the presence of 58% co-solute during a cooling-isothermal-heating run (a) and a frequency
sweep (b). Conditions as in Fig. 3.
The effect of sucrose/glucose syrup on the phase behaviour of high methoxy pectin/gelatin mixtures
The understanding achieved at the above work of single biopolymers was put to practice in mixtures containing 1% pectin and 3% gelatin. As shown in Table 5, the first point at issue is the significant change in the values of tfom and tmert with increasing co-solute content. Thus, addition of sugar up to 58% generates a range of structure formation and melting indices which is covered by the temperature behaviour of gelatin gels. Under our experimental settings, the small-deformation results at 58% co-solute are illustrated in Fig. 7. Gratifyingly, the onset of structuring and the completion of melting, the network reinforcement during the isothermal run, the viscoelastic ratio at the end of the curing process at YC, and the ensuing frequency dependence at this temperature are congruent with the properties of a single, 5%, gelatin sample with 66% co-solute (Fig. 3 and Table 2). On the other hand, pectin structures melt at elevated temperatures (L86”C in Table 1). Furthermore, the
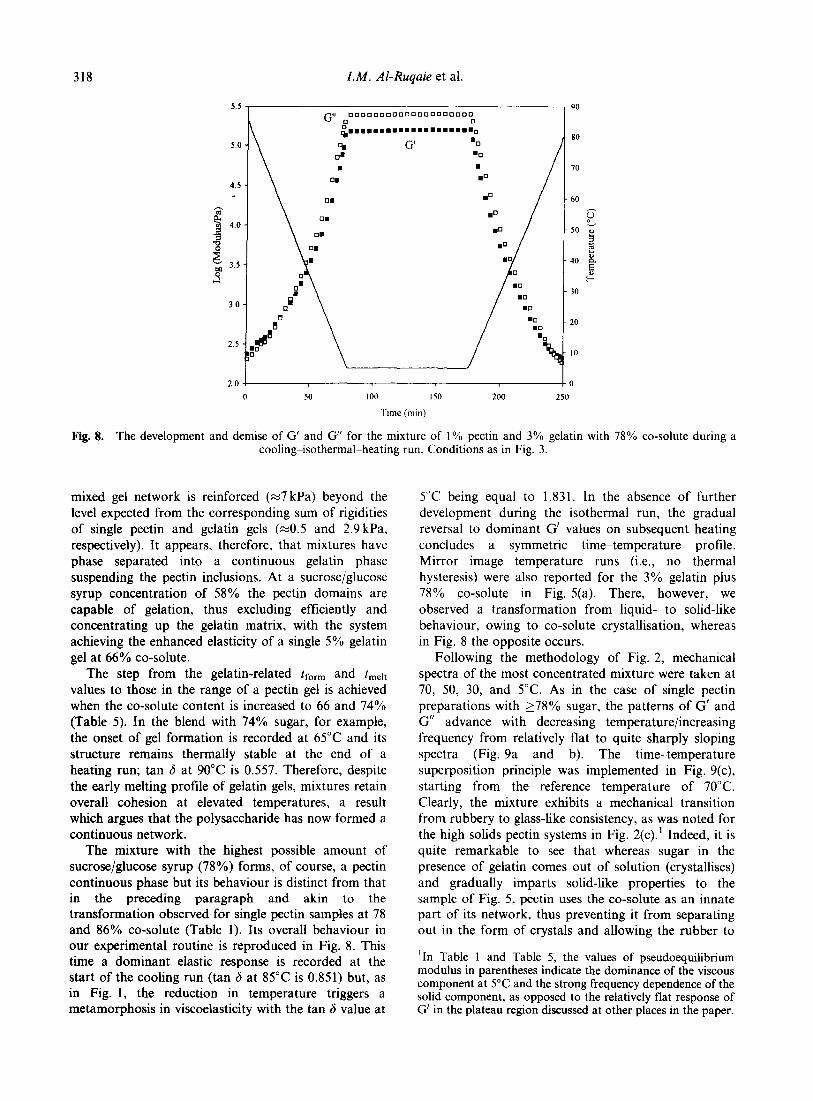
318
2.0 -r r0
0 50 100 I50 200 250
Time (mm)
Fig. 8. The development and demise of G’ and G” for the mixture of 1% pectin and 3% gelatin with 78% co-solute during a cooling-isothermal-heating run. Conditions as in Fig. 3.
mixed gel network is reinforced (~7 kPa) beyond the level expected from the corresponding sum of rigidities of single pectin and gelatin gels (~0.5 and 2.9 kPa, respectively). It appears, therefore, that mixtures have phase separated into a continuous gelatin phase suspending the pectin inclusions. At a sucrose/glucose syrup concentration of 58% the pectin domains are capable of gelation, thus excluding efficiently and concentrating up the gelatin matrix, with the system achieving the enhanced elasticity of a single 5% gelatin gel at 66% co-solute.
The step from the gelatin-related tf,, and t,,lt values to those in the range of a pectin gel is achieved when the co-solute content is increased to 66 and 74% (Table 5). In the blend with 74% sugar, for example, the onset of gel formation is recorded at 65°C and its structure remains thermally stable at the end of a heating run; tan 6 at 90°C is 0.557. Therefore, despite the early melting profile of gelatin gels, mixtures retain overall cohesion at elevated temperatures, a result which argues that the polysaccharide has now formed a continuous network.
The mixture with the highest possible amount of sucrose/glucose syrup (78%) forms, of course, a pectin continuous phase but its behaviour is distinct from that in the preceding paragraph and akin to the transformation observed for single pectin samples at 78 and 86% co-solute (Table 1). Its overall behaviour in our experimental routine is reproduced in Fig. 8. This time a dominant elastic response is recorded at the start of the cooling run (tan 6 at 85°C is 0.851) but, as in Fig. 1, the reduction in temperature triggers a metamorphosis in viscoelasticity with the tan 6 value at
5°C being equal to 1.831. In the absence of further development during the isothermal run, the gradual reversal to dominant G’ values on subsequent heating concludes a symmetric time-temperature profile. Mirror image temperature runs (i.e., no thermal hysteresis) were also reported for the 3% gelatin plus 78% co-solute in Fig. 5(a). There, however, we observed a transformation from liquid- to solid-like behaviour, owing to co-solute crystallisation, whereas in Fig. 8 the opposite occurs.
Following the methodology of Fig. 2, mechanical spectra of the most concentrated mixture were taken at 70, 50, 30, and 5°C. As in the case of single pectin preparations with 278% sugar, the patterns of G’ and G” advance with decreasing temperature/increasing frequency from relatively flat to quite sharply sloping spectra (Fig. 9a and b). The time-temperature superposition principle was implemented in Fig. 9(c), starting from the reference temperature of 70°C. Clearly, the mixture exhibits a mechanical transition from rubbery to glass-like consistency, as was noted for the high solids pectin systems in Fig. 2(c).’ Indeed, it is quite remarkable to see that whereas sugar in the presence of gelatin comes out of solution (crystallises) and gradually imparts solid-like properties to the sample of Fig. 5, pectin uses the co-solute as an innate part of its network, thus preventing it from separating out in the form of crystals and allowing the rubber to
‘In Table 1 and Table 5, the values of pseudoequilibrium modulus in parentheses indicate the dominance of the viscous component at 5°C and the strong frequency dependence of the solid component, as opposed to the relatively flat response of G’ in the plateau region discussed at other places in the paper.
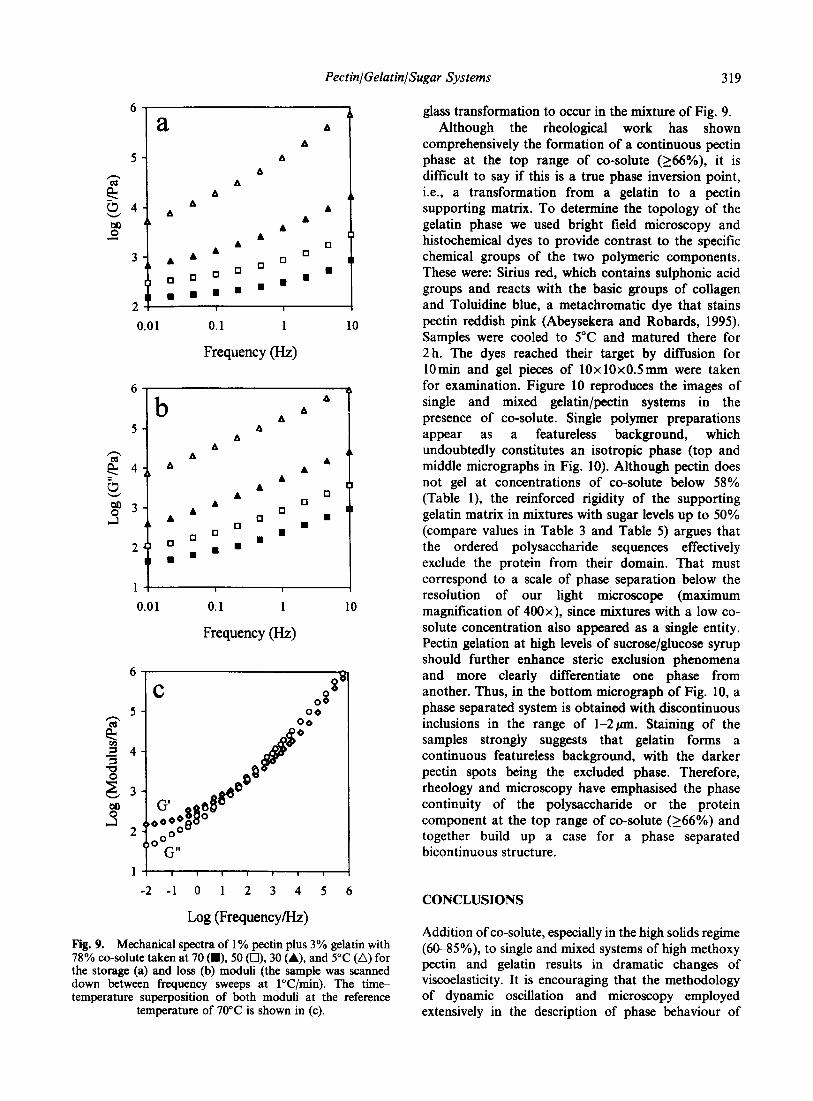
Pectin/Gelatin/Sugar Systems 319
6
3
2
A A
AL
A A A
A A c
A A 0
A A 0
0 q I
0 q n 0 0 n ’ n n n
n n
0.01 0.1 1
Frequency (Hz)
10
6 , a
A 2 A & A A
2 q
i
0 lJ
n m n ’
I I
0.1 1
Frequency (Hz)
0,
()(
C 08 2
00 06
-2 -1 0 1 2 3 4 5 6
Log (Frequency/Hz)
Fig. 9. Mechanical spectra of 1% pectin plus 3% gelatin with 78% co-solute taken at 70 (D), 50 (El), 30 (A), and 5°C (A) for the storage (a) and loss (b) moduli (the sample was scanned down between frequency sweeps at l”C/min). The time- temperature superposition of both moduli at the reference
temperature of 70°C is shown in (c).
glass transformation to occur in the mixture of Fig. 9. Although the rheological work has shown
comprehensively the formation of a continuous pectin phase at the top range of co-solute (>66%), it is difficult to say if this is a true phase inversion point, i.e., a transformation from a gelatin to a pectin supporting matrix. To determine the topology of the gelatin phase we used bright field microscopy and histochemical dyes to provide contrast to the specific chemical groups of the two polymeric components. These were: Sirius red, which contains sulphonic acid groups and reacts with the basic groups of collagen and Toluidine blue, a metachromatic dye that stains pectin reddish pink (Abeysekera and Robards, 1995). Samples were cooled to 5°C and matured there for 2 h. The dyes reached their target by diffusion for 10min and gel pieces of 10x10x0.5mm were taken for examination. Figure 10 reproduces the images of single and mixed gelatin/pectin systems in the presence of co-solute. Single polymer preparations appear as a featureless background, which undoubtedly constitutes an isotropic phase (top and middle micrographs in Fig. 10). Although pectin does not gel at concentrations of co-solute below 58% (Table l), the reinforced rigidity of the supporting gelatin matrix in mixtures with sugar levels up to 50% (compare values in Table 3 and Table 5) argues that the ordered polysaccharide sequences effectively exclude the protein from their domain. That must correspond to a scale of phase separation below the resolution of our light microscope (maximum magnification of 400x), since mixtures with a low co- solute concentration also appeared as a single entity. Pectin gelation at high levels of sucrose/glucose syrup should further enhance steric exclusion phenomena and more clearly differentiate one phase from another. Thus, in the bottom micrograph of Fig. 10, a phase separated system is obtained with discontinuous inclusions in the range of 1-2~. Staining of the samples strongly suggests that gelatin forms a continuous featureless background, with the darker pectin spots being the excluded phase. Therefore, rheology and microscopy have emphasised the phase continuity of the polysaccharide or the protein component at the top range of co-solute (266%) and together build up a case for a phase separated bicontinuous structure.
CONCLUSIONS
Addition of co-solute, especially in the high solids regime (60-85%), to single and mixed systems of high methoxy pectin and gelatin results in dramatic changes of viscoelasticity. It is encouraging that the methodology of dynamic oscillation and microscopy employed extensively in the description of phase behaviour of
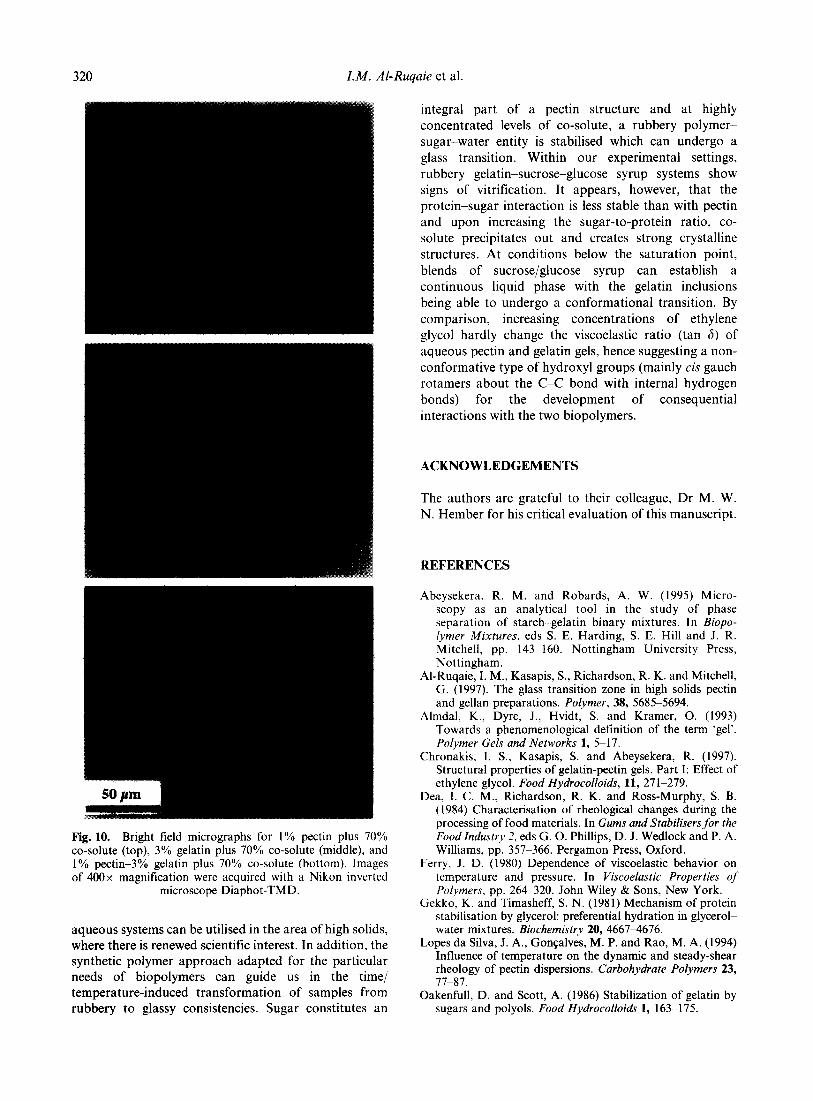
320 I.M. Al-Ruqaie et al.
50pm ’
Fig. 10. Bright field micrographs for 1% pectin plus 70% co-solute (top), 3% gelatin plus 70% co-solute (middle), and 1% pectin-3% gelatin plus 70% co-solute (bottom). Images of 400x magnification were acquired with a Nikon inverted
microscope Diaphot-TMD.
aqueous systems can be utilised in the area of high solids, where there is renewed scientific interest. In addition, the synthetic polymer approach adapted for the particular needs of biopolymers can guide us in the time/ temperature-induced transformation of samples from rubbery to glassy consistencies. Sugar constitutes an
integral part of a pectin structure and at highly
concentrated levels of co-solute, a rubbery polymer- sugar-water entity is stabilised which can undergo a
glass transition. Within our experimental settings,
rubbery gelatin-sucrose-glucose syrup systems show signs of vitrification. It appears, however, that the
protein-sugar interaction is less stable than with pectin and upon increasing the sugar-to-protein ratio, co-
solute precipitates out and creates strong crystalline structures. At conditions below the saturation point,
blends of sucrose/glucose syrup can establish a
continuous liquid phase with the gelatin inclusions being able to undergo a conformational transition. By
comparison, increasing concentrations of ethylene
glycol hardly change the viscoelastic ratio (tan S) of aqueous pectin and gelatin gels, hence suggesting a non-
conformative type of hydroxyl groups (mainly cis gauch rotamers about the C-C bond with internal hydrogen bonds) for the development of consequential
interactions with the two biopolymers.
ACKNOWLEDGEMENTS
The authors are grateful to their colleague, Dr M. W. N. Hember for his critical evaluation of this manuscript.
REFERENCES
Abeysekera. R. M. and Robards, A. W. (1995) Micro- scopy as an analytical tool in the study of phase separation of starch-gelatin binary mixtures. In Biopo- lymer Mixtures, eds S. E. Harding, S. E. Hill and J. R. Mitchell, pp. 143-160. Nottingham University Press, Nottingham.
Al-Ruqaie, I. M., Kasapis, S., Richardson, R. K. and Mitchell, G. (1997). The glass transition zone in high solids pectin and gellan preparations. Polymer, 38, 5685-5694.
Almdal, K., Dyre, J., Hvidt, S. and Kramer, 0. (1993) Towards a phenomenological definition of the term ‘gel’. Polymer Gels and Networks 1, 5517.
Chronakis, I. S., Kasapis, S. and Abeysekera, R. (1997). Structural properties of gelatin-pectin gels. Part I: Effect of ethylene glycol. Food Hydrocolloids, 11, 271-279.
Dea, I. C. M., Richardson, R. K. and Ross-Murphy, S. B. (1984) Characterisation of rheological changes during the processing of food materials. In Gums and Stabilisers for the Food Industry 2, eds G. 0. Phillips, D. J. Wedlock and P. A. Williams, pp. 3577366. Pergamon Press, Oxford.
Ferry, J. D. (1980) Dependence of viscoelastic behavior on temperature and pressure. In Viscoelastic Properties of Pol,vmers, pp. 264320. John Wiley & Sons, New York.
Gekko, K. and Timasheff, S. N. (1981) Mechanism of protein stabilisation by glycerol: preferential hydration in glyceroll water mixtures. Biochemistry 20, 46674676.
Lopes da Silva, J. A., Goncalves, M. P. and Rao, M. A. (1994) Influence of temperature on the dynamic and steady-shear rheology of pectin dispersions. Carbohydrate Polymers 23, 77-87.
Oakenfull, D. and Scott, A. (1986) Stabilization of gelatin by sugars and polyols. Food HydrocoIloids 1, 163-175.
Pectin/Gelatin/Sugar Systems 321
Ong, M. H., Whitehouse, S., Abeysekera, R., Al-Ruqaie, I. M. and Kasapis, S. (1997) Glass transition-related or crystal- line forms in the structural properties of gelatin/oxidised starch/glucose syrup mixtures. Food Hydrocolloidr;, in press.
Papageorgiou, M., Kasapis, S. and Richardson, R. K. (1994) Glassy-state phenomena in gellan-sucrose-corn syrup mixtures. Carbohydrate Polymers 25, 101-109.
Privalov, P. L. and Tiktopulo, E. I. (1970) Thermal conformational transformation of tropocollagen. I. Calori- metric study. Biopolymers 9, 127-139.
Richardson, R. K. (1991) Rheological characterisation of biopolymer systems. PhD Thesis, Cranfield Institute of Technology.
Rolin, C. (1993). Pectin. In Industrial Gums, eds R. L. Whistler and J. N. BeMiller, pp. 257-293. Academic Press, London.
Selby, H. H. and Whistler, R. L. (1993) Agar. In Industrial Gums, eds R. L. Whistler and J. N. BeMiller, pp. 87-103. Academic Press, London.
Te Nijenhuis, K. and Winter, H. H. (1989) Mechanical properties at the gel point of a crystallizing poly(viny1 chloride) solution. Macromolecules 22, 411414.
Therkelsen, G. H. (1993) Carrageenan. In Industrial Gums, eds R. L. Whistler and J. N. BeMiller, pp. 145-180. Academic Press, London.
Walkinshaw, M. D. and Arnott, S. (198 1) Conformations and interactions of pectins II. Models for junction zones in pectinic acid and calcium pectate gels. Journal of Molecular Biology 153, 1075-1085.
Whittaker, L. E., Al-Ruqaie, I. M., Kasapis, S. and Richardson, R. K. (1997) Development of composite structures in the gellan polysaccharide/sucrose system. Carbohydrate Polymers, 33, 39-46.
Williams, M. L., Landel, R. F. and Ferry, J. D. (1955) Temperature dependence of relaxation mechanism in amorphous polymers and other glass-forming liquids. Journal of the American Chemical Society 77, 3701- 3706.
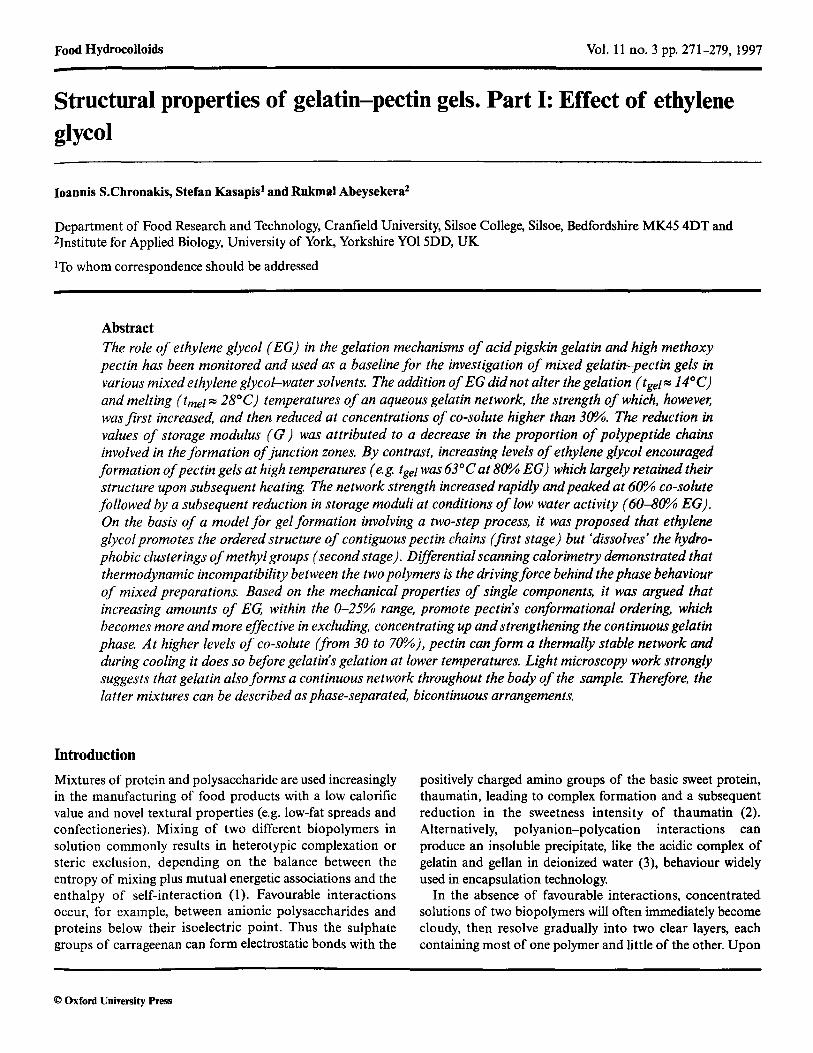
Food Hydrocolloids
-Vol. 11 no. 3 pp. 271-279, 1997
Structural properties of gelatin-pectin gels. Part I: Effect of ethylene
glycol
Joannis S.Chronakis, Stefan Kasapis! and Rukmal Abeysekera>
Department of Food Research and Technology, Cranfield University, SilsoeCollege, Silsoe,Bedfordshire MK45 4DT and2Institute for Applied Biology, University of York, Yorkshire YOISOD, UK
ITowhom correspondence should be addressed
AbstractThe role of ethylene glycol (EG) in the gelation mechanisms of acid pigskin gelatin and high methoxypectin has been monitored and used as a baseline for the investigation of mixed gelatin-pectin gels invarious mixed ethylene glycol-water solvents. The addition ofEG did not alter the gelation (tgelr::! 14°C)and melting (tmel r::! 28°C) temperatures ofan aqueous gelatin network, the strength of which, however,was first increased, and then reduced at concentrations of co-solute higher than 30%. The reduction invalues of storage modulus (G) was attributed to a decrease in the proportion of polypeptide chainsinvolved in the formation ofjunction zones. By contrast, increasing levels of ethylene glycol encouragedformation ofpectin gels at high temperatures (e.g. tgel was 63°C at 800/0 EG) which largely retained theirstructure upon subsequent heating. The network strength increased rapidly and peaked at 60% co-solutefollowed by a subsequent reduction in storage moduli at conditions of low water activity (60-800/0 EG).On the basis of a model for gel formation involving a two-step process, it was proposed that ethyleneglycol promotes the ordered structure of contiguous pectin chains (first stage) but 'dissolves' the hydrophobic clusterings ofmethyl groups (second stage). Differential scanning calorimetry demonstrated thatthermodynamic incompatibility between the two polymers is the driving force behind the phase behaviourof mixed preparations. Based on the mechanical properties of single components, it was argued thatincreasing amounts of EO, within the 0-25% range, promote pectin's conformational ordering, whichbecomes more and more effective in excluding, concentrating up and strengthening the continuous gelatinphase. At higher levels of co-solute (from 30 to 70%), pectin can form a thermally stable network andduring cooling it does so before gelatin's gelation at lower temperatures. Light microscopy work stronglysuggests that gelatin also forms a continuous network throughout the body of the sample. Therefore, thelatter mixtures can be described as phase-separated, bicontinuous arrangements.
Introduction
Mixtures of protein and polysaccharide are used increasinglyin the manufacturing of food products with a low calorificvalue and novel textural properties (e.g. low-fat spreads andconfectioneries). Mixing of two different biopolymers insolution commonly results in heterotypic complexation orsteric exclusion, depending on the balance between theentropy of mixing plus mutual energetic associations and theenthalpy of self-interaction (1). Favourable interactionsoccur, for example, between anionic polysaccharides andproteins below their isoelectric point. Thus the sulphategroups of carrageenan can form electrostatic bonds with the
© Oxford University Press
positively charged amino groups of the basic sweet protein,thaumatin, leading to complex formation and a subsequentreduction in the sweetness intensity of thaumatin (2).Alternatively, polyanion-polycation interactions canproduce an insoluble precipitate, like the acidic complex ofgelatin and gellan in deionized water (3), behaviour widelyused in encapsulation technology.
In the absence of favourable interactions, concentratedsolutions of two biopolymers will often immediately becomecloudy, then resolve gradually into two clear layers, eachcontaining most of one polymer and little of the other. Upon
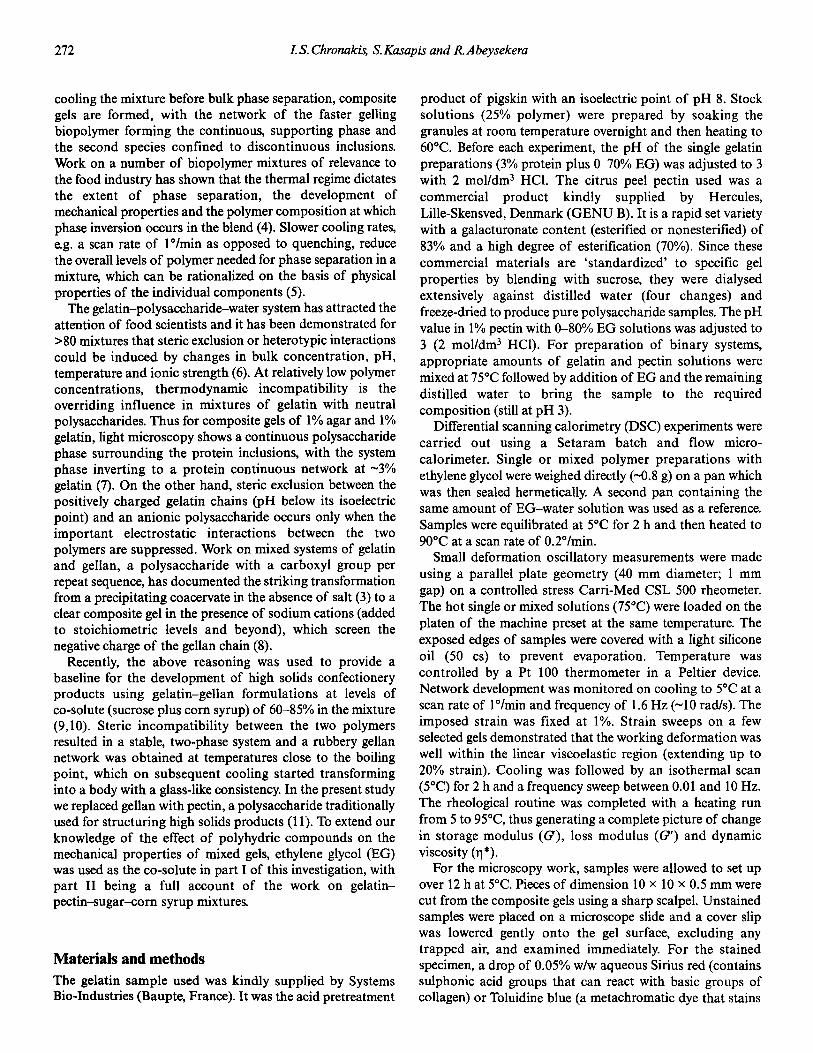
272 IS. Chronakis. S.Kasapis and R.Abeysekera
cooling the mixture before bulk phase separation, compositegels are formed, with the network of the faster gellingbiopolymer forming the continuous, supporting phase andthe second species confined to discontinuous inclusions.Work on a number of biopolymer mixtures of relevance tothe food industry has shown that the thermal regime dictatesthe extent of phase separation, the development ofmechanical properties and the polymer composition at whichphase inversion occurs in the blend (4). Slower cooling rates,e.g. a scan rate of l°/min as opposed to quenching, reducethe overall levels of polymer needed for phase separation in amixture, which can be rationalized on the basis of physicalproperties of the individual components (5).
The gelatin-polysaccharide-water system has attracted theattention of food scientists and it has been demonstrated for>80 mixtures that steric exclusion or heterotypic interactionscould be induced by changes in bulk concentration, pH,temperature and ionic strength (6). At relatively low polymerconcentrations, thermodynamic incompatibility is theoverriding influence in mixtures of gelatin with neutralpolysaccharides. Thus for composite gels of 1%agar and 1%gelatin, light microscopy shows a continuous polysaccharidephase surrounding the protein inclusions, with the systemphase inverting to a protein continuous network at -3%gelatin (7). On the other hand, steric exclusion between thepositively charged gelatin chains (pH below its isoelectricpoint) and an anionic polysaccharide occurs only when theimportant electrostatic interactions between the twopolymers are suppressed. Work on mixed systems of gelatinand gellan, a polysaccharide with a carboxyl group perrepeat sequence, has documented the striking transformationfrom a precipitating coacervate in the absence of salt (3) to aclear composite gel in the presence of sodium cations (addedto stoichiometric levels and beyond), which screen thenegative charge of the gellan chain (8).
Recently, the above reasoning was used to provide abaseline for the development of high solids confectioneryproducts using gelatin-gellan formulations at levels ofco-solute (sucrose plus corn syrup) of 60-85% in the mixture(9,10). Steric incompatibility between the two polymersresulted in a stable, two-phase system and a rubbery gellannetwork was obtained at temperatures close to the boilingpoint, which on subsequent cooling started transforminginto a body with a glass-like consistency. In the present studywe replaced gellan with pectin, a polysaccharide traditionallyused for structuring high solids products (l I). To extend ourknowledge of the effect of polyhydric compounds on themechanical properties of mixed gels, ethylene glycol (EG)was used as the co-solute in part I of this investigation, withpart II being a full account of the work on gelatinpectin-sugar-corn syrup mixtures.
MaterialsandmethodsThe gelatin sample used was kindly supplied by SystemsBio-Industries (Baupte, France). It was the acid pretreatment
product of pigskin with an isoelectric point of pH 8. Stocksolutions (25% polymer) were prepared by soaking thegranules at room temperature overnight and then heating to60°C. Before each experiment, the pH of the single gelatinpreparations (3% protein plus 0-70% EG) was adjusted to 3with 2 mol/dm! HCl. The citrus peel pectin used was acommercial product kindly supplied by Hercules,LilIe-Skensved, Denmark (GENU B). It is a rapid set varietywith a galacturonate content (esterified or nonesterified) of83% and a high degree of esterification (70%). Since thesecommercial materials are 'standardized' to specific gelproperties by blending with sucrose, they were dialysedextensively against distilled water (four changes) andfreeze-dried to produce pure polysaccharide samples. The pHvalue in 1%pectin with 0-80% EG solutions was adjusted to3 (2 mol/dm! HCl). For preparation of binary systems,appropriate amounts of gelatin and pectin solutions weremixed at 75°C followedby addition of EG and the remainingdistilled water to bring the sample to the requiredcomposition (stilI at pH 3).
Differential scanning calorimetry (DSC) experiments werecarried out using a Setaram batch and flow microcalorimeter. Single or mixed polymer preparations withethylene glycolwere weighed directly (-0.8 g) on a pan whichwas then sealed hermetically. A second pan containing thesame amount of EG-water solution was used as a reference.Samples were equilibrated at 5°C for 2 h and then heated to90°C at a scan rate of 0.2°/min.
Small deformation oscillatory measurements were madeusing a parallel plate geometry (40 mm diameter; I mmgap) on a controlled stress Carri-Med CSL 500 rheometer.The hot single or mixed solutions (75°C) were loaded on theplaten of the machine preset at the same temperature. Theexposed edges of samples were covered with a light siliconeoil (50 cs) to prevent evaporation. Temperature wascontrolled by a Pt 100 thermometer in a Peltier device.Network development was monitored on cooling to 5°C at ascan rate of l°/min and frequency of 1.6 Hz (-10 rad/s). Theimposed strain was fixed at 1%. Strain sweeps on a fewselected gelsdemonstrated that the working deformation waswell within the linear viscoelastic region (extending up to20% strain). Cooling was followed by an isothermal scan(5°C) for 2 h and a frequency sweep between 0.01 and 10 Hz.The rheological routine was completed with a heating runfrom 5 to 95°C, thus generating a complete picture of changein storage modulus (G), loss modulus (G') and dynamicviscosity (n").
For the microscopy work, samples were allowed to set upover 12 h at 5°C. Pieces of dimension 10 x 10 x 0.5 mm werecut from the composite gels using a sharp scalpel. Unstainedsamples were placed on a microscope slide and a cover slipwas lowered gently onto the gel surface, excluding anytrapped air, and examined immediately. For the stainedspecimen, a drop of 0.05% w/w aqueous Sirius red (containssulphonic acid groups that can react with basic groups ofcollagen) or Toluidine blue (a metachromatic dye that stains
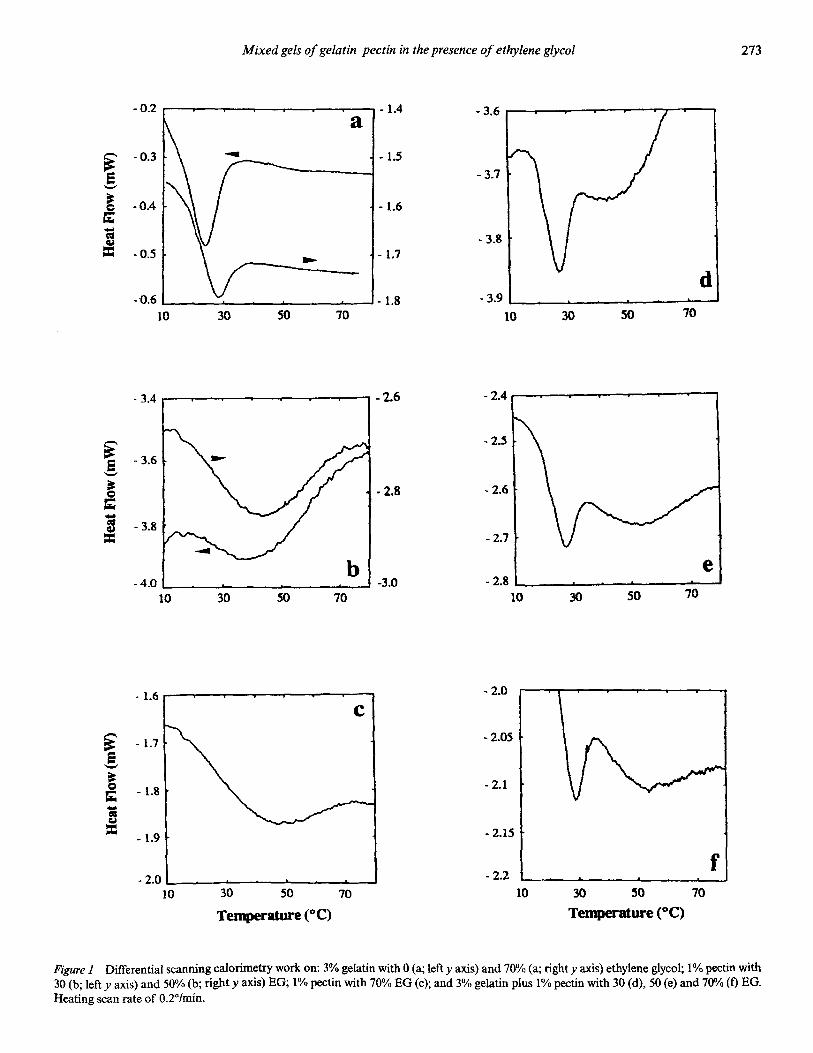
Mixed gels of gelatin-pectin in the presence of ethylene glycol 273
- 0.2 - 1.4 - 3.6a
~- 0.3 - 1.5
- 3.7S--~ -0.4 - 1.6Q
G:~ - 3.8Q,I
= - 0.5 - 1.7
d- 0.6 - 1.8 - 3.9
10 30 SO 70 10 30 50 10
- 3.4 - 2.6 - 2.4
~· 2.5
§ - 3.6
~ ·2.8 - 2.6;:s - 3.8
= - 2.7
e- 4.0 -3.0 - 2.8
10 30 50 70 10 30 50 10
- 1.6 - 2.0
C
~ - 1.7 - 2.05
E--~- 2.1Q
- 1.8;:....~= - 1.9 - 2.15
- 2.2f
- 2.010 30 50 70 10 30 50 70
Temperature (0C) Temperature (OC)
Figure 1 Differential scanning calorimetry work on: 3% gelatin with 0 (a; left y axis) and 70% (a; right y axis) ethylene glycol; 1% pectin with30 (b; left y axis) and 50% (b; righty axis) EG; 1% pectin with 70% EG(c); and 3% gelatin plus 1% pectin with 30 (d), 50 (e) and 70%(f) EO.Heating scan rate of O.2°/min.
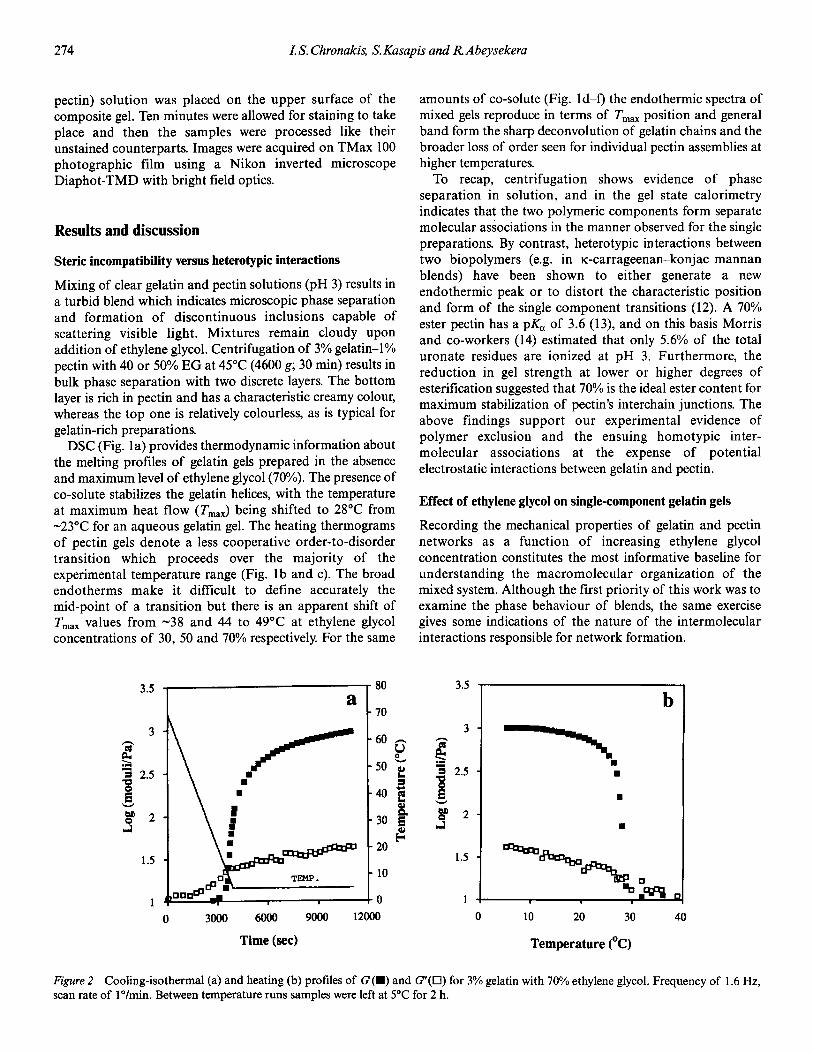
274 I.S. Chronakis. SiKasapis and RAbeysekera
pectin) solution was placed on the upper surface of thecomposite gel. Ten minutes were allowed for staining to takeplace and then the samples were processed like theirunstained counterparts. Images were acquired on TMax 100photographic film using a Nikon inverted microscopeDiaphot-TMD with bright field optics.
Results and discussion
Steric incompatibility versus heterotypic interactions
Mixing of clear gelatin and pectin solutions (pH 3) results ina turbid blend which indicates microscopic phase separationand formation of discontinuous inclusions capable ofscattering visible light. Mixtures remain cloudy uponaddition of ethylene glycol. Centrifugation of 3% gelatin-l%pectin with 40 or 50% EG at 45°C (4600 g; 30 min) results inbulk phase separation with two discrete layers. The bottomlayer is rich in pectin and has a characteristic creamy colour,whereas the top one is relatively colourless, as is typical forgelatin-rich preparations.
DSC (Fig . la) provides thermodynamic information aboutthe melting profiles of gelatin gels prepared in the absenceand maximum level of ethylene glycol (70%). The presence ofco-solute stabilizes the gelatin helices, with the temperatureat maximum heat flow (Tmax) being shifted to 28°C from-23°C for an aqueous gelatin gel. The heating thermogramsof pectin gels denote a less cooperative order-to-disordertransition which proceeds over the majority of theexperimental temperature range (Fig. lb and c). The broadendotherms make it difficult to define accurately themid-point of a transition but there is an apparent shift ofTmax values from -38 and 44 to 49°C at ethylene glycolconcentrations of 30, 50 and 70% respectively. For the same
amounts of co-solute (F ig. ld-f) the endothermic spectra ofmixed gels reproduce in terms of Tmax position and generalband form the sharp deconvolution of gelatin chains and thebroader loss of order seen for individual pectin assemblies athigher temperatures.
To recap, centrifugation shows evidence of phaseseparation in solution, and in the gel state calorimetryindicates that the two polymeric components form separatemolecular associations in the manner observed for the singlepreparations. By contrast, heterotypic interactions betweentwo biopolymers (e.g. in x-carrageenan-konjac mannanblends) have been shown to either generate a newendothermic peak or to distort the characteristic positionand form of the single component transitions (12). A 70%ester pectin has a pKa of 3.6 (13), and on this basis Morrisand co-workers (14) estimated that only 5.6% of the totaluronate residues are ionized at pH 3. Furthermore, thereduction in gel strength at lower or higher degrees ofesterification suggested that 70% is the ideal ester content formaximum stabilization of pectin's interchain junctions. Theabove findings support our experimental evidence ofpolymer exclusion and the ensuing homotypic intermolecular associations at the expense of potentialelectrostatic interactions between gelatin and pectin.
Effect of ethylene glycol on single-component gelatin gels
Recording the mechanical properties of gelatin and pectinnetworks as a function of increasing ethylene glycolconcentration constitutes the most informative baseline forunderstanding the macromolecular organization of themixed system. Although the first priority of this work was toexamine the phase behaviour of blends, the same exercisegives some indications of the nature of the intermolecularinteractions responsible for network formation.
3.5 80 3.5a b
70
3 3
~- 60 - -~ o ~c:l.o °;;:; so '-' •~ 2.5
ll.I 12.SL. •::I
40..
e E •'-' 8-'-'
~ 2 30 ~ 2= e...:l ll.I ...:l •Eo<
20~~1.5 1.5
TEMP. 10 ~c0 1Ie.!Vi 1"1
0 3000 6000 9000 12000 0 10 20 30 40
Time (sec) Temperature ('C)
Figure2 Cooling-isothermal (a) and heating (b) profiles of G(.) and G'(O) for 3% gelatin with 70% ethylene glycol. Frequency of 1.6 Hz,scan rate of l°/min. Between temperature runs samples were left at SoCfor 2 h.
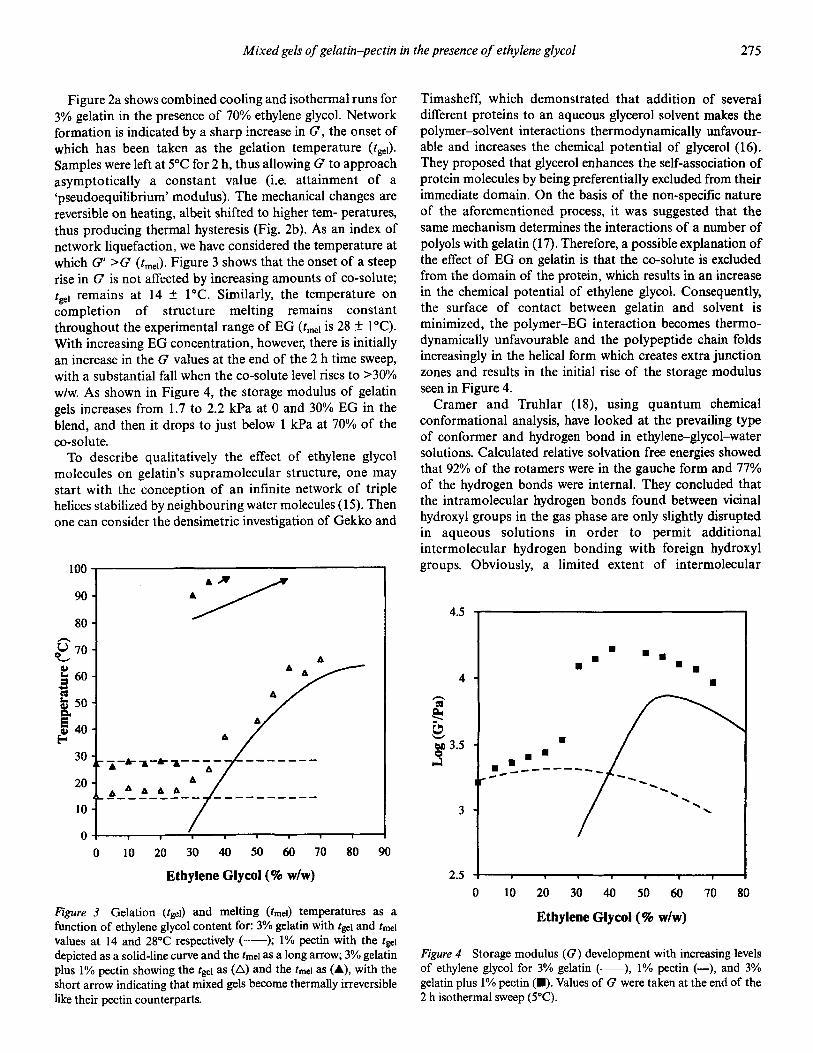
Mixed gels ofgelatin-pectin in the presence ofethylene glycol 275
Figure 4 Storage modulus (G) development with increasing levelsof ethylene glycol for 3% gelatin (--), 1% pectin (-), and 3%gelatin plus 1% pectin (.). Values of G were taken at the end of the2 h isothermal sweep (SoC).
•• •• ••••
•• •• •---
o 10 20 30 40 50 60 70 80
Ethylene Glycol (% w/w)
4
3
4.5
2.5
Timasheff, which demonstrated that addition of severaldifferent proteins to an aqueous glycerol solvent makes thepolymer-solvent interactions thermodynamically unfavourable and increases the chemical potential of glycerol (16).They proposed that glycerol enhances the self-association ofprotein molecules by being preferentially excluded from theirimmediate domain. On the basis of the non-specific natureof the aforementioned process, it was suggested that thesame mechanism determines the interactions of a number ofpolyolswith gelatin (17). Therefore, a possible explanation ofthe effect of EG on gelatin is that the co-solute is excludedfrom the domain of the protein, which results in an increasein the chemical potential of ethylene glycol. Consequently,the surface of contact between gelatin and solvent isminimized, the polymer-EG interaction becomes thermodynamically unfavourable and the polypeptide chain foldsincreasingly in the helical form which creates extra junctionzones and results in the initial rise of the storage modulusseen in Figure 4.
Cramer and Truhlar (18), using quantum chemicalconformational analysis, have looked at the prevailing typeof conformer and hydrogen bond in ethylene-glycol-watersolutions. Calculated relative solvation free energies showedthat 92% of the rotamers were in the gauche form and 77%of the hydrogen bonds were internal. They concluded thatthe intramolecular hydrogen bonds found between vicinalhydroxyl groups in the gas phase are only slightly disruptedin aqueous solutions in order to permit additionalintermolecular hydrogen bonding with foreign hydroxylgroups. Obviously, a limited extent of intermolecular
Figure 2a shows combined cooling and isothermal runs for3% gelatin in the presence of 70% ethylene glycol. Networkformation is indicated by a sharp increase in G, the onset ofwhich has been taken as the gelation temperature (tgel).Samples were left at 5°C for 2 h, thus allowing G to approachasymptotically a constant value (i.e. attainment of a'pseudoequilibrium' modulus). The mechanical changes arereversible on heating, albeit shifted to higher tem- peratures,thus producing thermal hysteresis (Fig. 2b). As an index ofnetwork liquefaction, we have considered the temperature atwhich G' >G (tmel)' Figure 3 shows that the onset of a steeprise in G is not affected by increasing amounts of co-solute;tgel remains at 14 ± I"C. Similarly, the temperature oncompletion of structure melting remains constantthroughout the experimental range of EG (tmel is 28 ± I"C).With increasing EG concentration, however, there is initiallyan increase in the G values at the end of the 2 h time sweep,with a substantial fall when the co-solute level rises to >30%w/w. As shown in Figure 4, the storage modulus of gelatingels increases from 1.7 to 2.2 kPa at 0 and 30% EG in theblend, and then it drops to just below I kPa at 70% of theco-solute.
To describe qualitatively the effect of ethylene glycolmolecules on gelatin's supramolecular structure, one maystart with the conception of an infinite network of triplehelicesstabilized by neighbouring water molecules (15). Thenone can consider the densimetric investigation of Gekko and
100
90 ->:80-U 70
"L- 4U5 60...~... 508-!4O 4
30
20~_':~-~~--
10
0
0 10 20 30 40 50 60 70 80 90
Ethylene Glycol (% w/w)
Figure 3 Gelation (tgel) and melting (tmel) temperatures as afunction of ethylene glycol content for: 3% gelatin with tgel and tmel
values at 14 and 28°C respectively (--); 1% pectin with the tgeldepicted as a solid-line curve and the tmel as a long arrow; 3% gelatinplus 1% pectin showing the tgel as (~) and the tmel as (A), with theshort arrow indicating that mixed gels become thermally irreversiblelike their pectin counterparts.
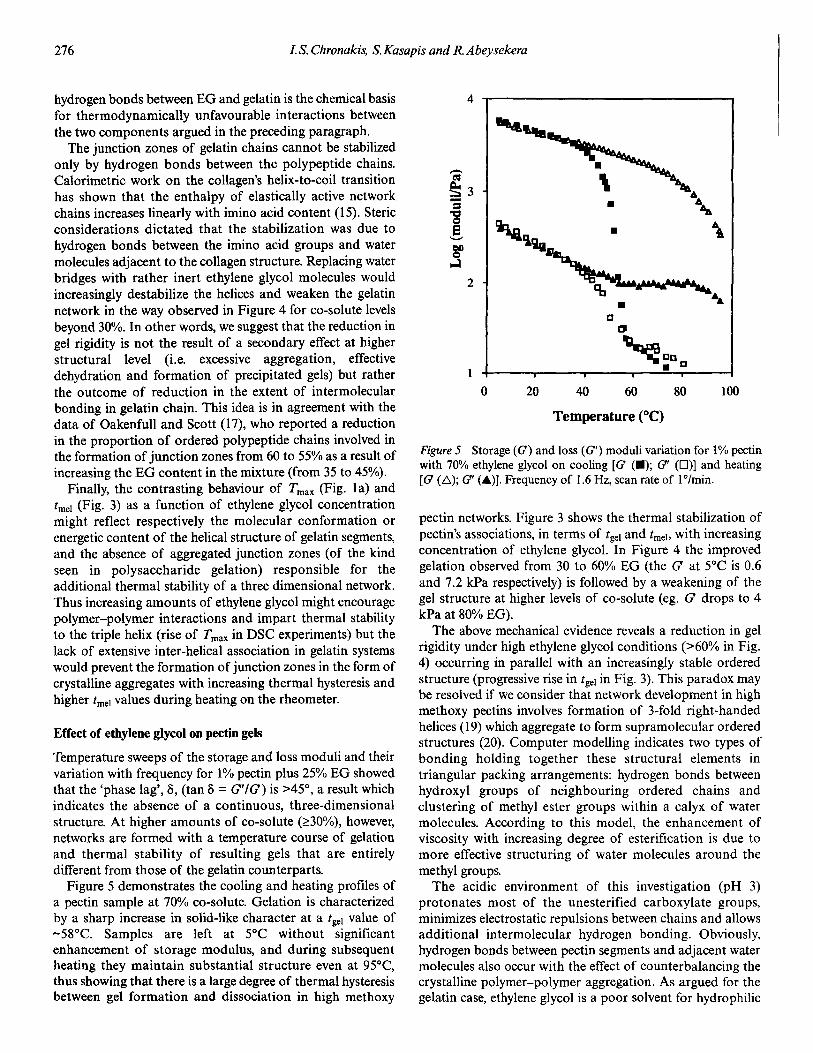
276 IS. Chronakis, S.Kasapis and RAbeysekera
4,-------------...,
Figure 5 Storage (G) and loss (G') moduli variation for 1% pectinwith 70% ethylene glycol on cooling [G (.); G' (D)] and heating(G (L); G' (A)]. Frequency of 1.6 Hz, scan rate of IOlmin.
tOO8060
•ao~
~aa• a
40
Temperature (DC)
20o
pectin networks. Figure 3 shows the thermal stabilization ofpectin's associations, in terms of tgel and tme!> with increasingconcentration of ethylene glycol. In Figure 4 the improvedgelation observed from 30 to 60% EG (the G at 5°C is 0.6and 7.2 kPa respectively) is followed by a weakening of thegel structure at higher levels of co-solute (eg. G drops to 4kPa at 80% EG).
The above mechanical evidence reveals a reduction in gelrigidity under high ethylene glycol conditions (>60% in Fig.4) occurring in parallel with an increasingly stable orderedstructure (progressiverise in tgel in Fig. 3). This paradox maybe resolved if we consider that network development in highmethoxy pectins involves formation of 3-fold right-handedhelices (19) which aggregate to form supramolecular orderedstructures (20). Computer modelling indicates two types ofbonding holding together these structural elements intriangular packing arrangements: hydrogen bonds betweenhydroxyl groups of neighbouring ordered chains andclustering of methyl ester groups within a calyx of watermolecules. According to this model, the enhancement ofviscosity with increasing degree of esterification is due tomore effective structuring of water molecules around themethyl groups.
The acidic environment of this investigation (pH 3)protonates most of the unesterified carboxylate groups,minimizes electrostatic repulsions between chains and allowsadditional intermolecular hydrogen bonding. Obviously,hydrogen bonds between pectin segments and adjacent watermolecules also occur with the effect of counterbalancing thecrystalline polymer-polymer aggregation. As argued for thegelatin case, ethylene glycol is a poor solvent for hydrophilic
hydrogen bonds between EG and gelatin is the chemical basisfor thermodynamically unfavourable interactions betweenthe two components argued in the preceding paragraph.
The junction zones of gelatin chains cannot be stabilizedonly by hydrogen bonds between the polypeptide chains.Calorimetric work on the collagen's helix-to-coil transitionhas shown that the enthalpy of elastically active networkchains increases linearly with imino acid content (15). Stericconsiderations dictated that the stabilization was due tohydrogen bonds between the imino acid groups and watermolecules adjacent to the collagen structure. Replacing waterbridges with rather inert ethylene glycol molecules wouldincreasingly destabilize the helices and weaken the gelatinnetwork in the way observed in Figure 4 for co-solute levelsbeyond 30%. In other words, we suggest that the reduction ingel rigidity is not the result of a secondary effect at higherstructural level (i.e. excessive aggregation, effectivedehydration and formation of precipitated gels) but ratherthe outcome of reduction in the extent of intermolecularbonding in gelatin chain. This idea is in agreement with thedata of Oakenfull and Scott (17), who reported a reductionin the proportion of ordered polypeptide chains involved inthe formation of junction zones from 60 to 55% as a result ofincreasing the EG content in the mixture (from 35 to 45%).
Finally, the contrasting behaviour of Tmax (Fig. la) andtmel (Fig. 3) as a function of ethylene glycol concentrationmight reflect respectively the molecular conformation orenergetic content of the helical structure of gelatin segments,and the absence of aggregated junction zones (of the kindseen in polysaccharide gelation) responsible for theadditional thermal stability of a three dimensional network.Thus increasing amounts of ethylene glycol might encouragepolymer-polymer interactions and impart thermal stabilityto the triple helix (rise of Tmax in DSC experiments) but thelack of extensive inter-helical association in gelatin systemswould prevent the formation of junction zones in the form ofcrystalline aggregates with increasing thermal hysteresis andhigher tmel values during heating on the rheometer.
Effect of ethylene glycol on pectin gels
Temperature sweeps of the storage and loss moduli and theirvariation with frequency for 1% pectin plus 25% EG showedthat the 'phase lag', 8, (tan 8 =G'IG) is >45°, a result whichindicates the absence of a continuous, three-dimensionalstructure. At higher amounts of co-solute (~30%), however,networks are formed with a temperature course of gelationand thermal stability of resulting gels that are entirelydifferent from those of the gelatin counterparts.
Figure 5 demonstrates the cooling and heating profiles ofa pectin sample at 70% co-solute. Gelation is characterizedby a sharp increase in solid-like character at a tgel value of-58°C. Samples are left at 5°C without significantenhancement of storage modulus, and during subsequentheating they maintain substantial structure even at 95°C,thus showing that there is a large degree of thermal hysteresisbetween gel formation and dissociation in high methoxy
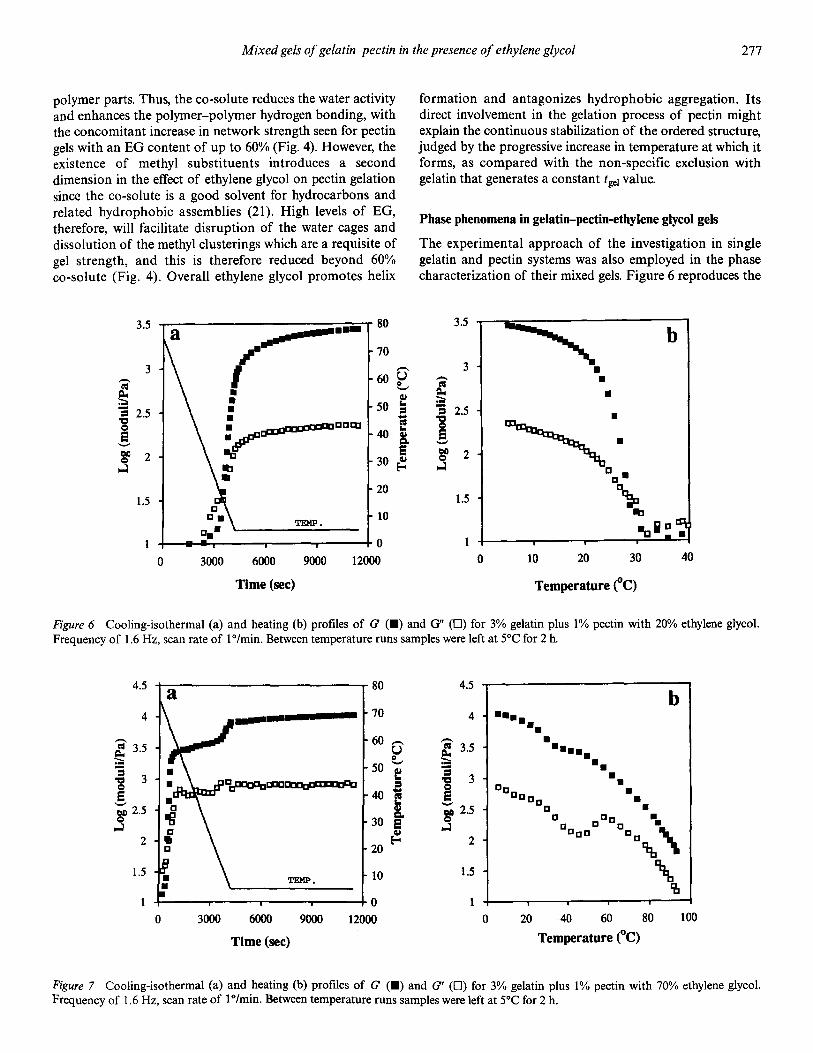
Mixed gels ofgelatin-pectin in the presence of ethylene glycol 277
polymer parts. Thus, the co-solute reduces the water activityand enhances the polymer-polymer hydrogen bonding , withthe concomitant increase in network strength seen for pectingels with an EG content of up to 60% (Fig. 4). However, theexistence of methyl substituents introduces a seconddimension in the effect of ethylene glycol on pectin gelationsince the co-solute is a good solvent for hydrocarbons andrelated hydrophobic assemblies (21). High levels of EG,therefore, will facilitate disruption of the water cages anddissolution of the methyl clusterings which are a requisite ofgel strength, and this is therefore reduced beyond 60%co-solute (Fig. 4). Overall ethylene glycol promotes helix
formation and antagonizes hydrophobic aggregation . Itsdirect involvement in the gelation process of pectin mightexplain the continuous stabilization of the ordered structure,judged by the progressive increase in temperature at which itforms, as compared with the non-specific exclusion withgelatin that generates a constant t gel value.
Phase phenomena in gelatin-pectin-ethyIene glycol gels
The experimental approach of the investigation in singlegelatin and pectin systems was also employed in the phasecharacterization of their mixed gels. Figure 6 reproduces the
3.5 ..- 80 3.5a b
~..... 703 I
,-... 3 •,-... 60 U ,-... •ell 0 ell'-'g., • ~ ~ •~ • 50~ 2.5 • = i 2.5• - •Q • ca::JCP"
,mCCa:J E
~.s .~40 8- s
'-' '-'OIl 2 lID S ~ 2Q 30 <U..J ItI Eo- ..J
C •• c20
~1.5 1.510 ItI
TEMP. lIgi c •0
0 3000 6000 9000 12000 0 10 20 30 40
Time (sec) Temperature ~C)
Figure 6 Cooling-isothermal (a) and heating (b) profiles of G (_) and 0" (D) for 3% gelatin plus 1% pectin with 20% ethylene glycol.Frequency of 1.6 Hz, scan rate of la/min . Between temperature runs samples were left at SoC for 2 h.
4.5 a 80 4.5b
4 --- 70 4 ••••••- 60 - ~ •CIl 3.5 U 3.5 ••••g.,0 •::.
50 '-' ;;;. ••"3 e "3'C 3 'g 3 •Q = Cc •S 40 - S •E ccc •'-' i 2.5 DC~ 2.5 <U •
30Cl. C Cc •..J S ..J cCaa C a •
2 ~ 2 CC~ \20
1.5 10 1.5 ,TEMP.
IlJ0
0 3000 6000 9000 12000 0 20 40 60 80 100
Time (sec) Temperature ~C)
Figure 7 Cooling-isothermal (a) and heating (b) profiles of G (_) and G' (D) for 3% gelatin plus 1% pectin with 70% ethylene glycol.Frequency of 1.6 Hz, scan rate of la/min . Between temperature runs samples were left at 5°C for 2 h.
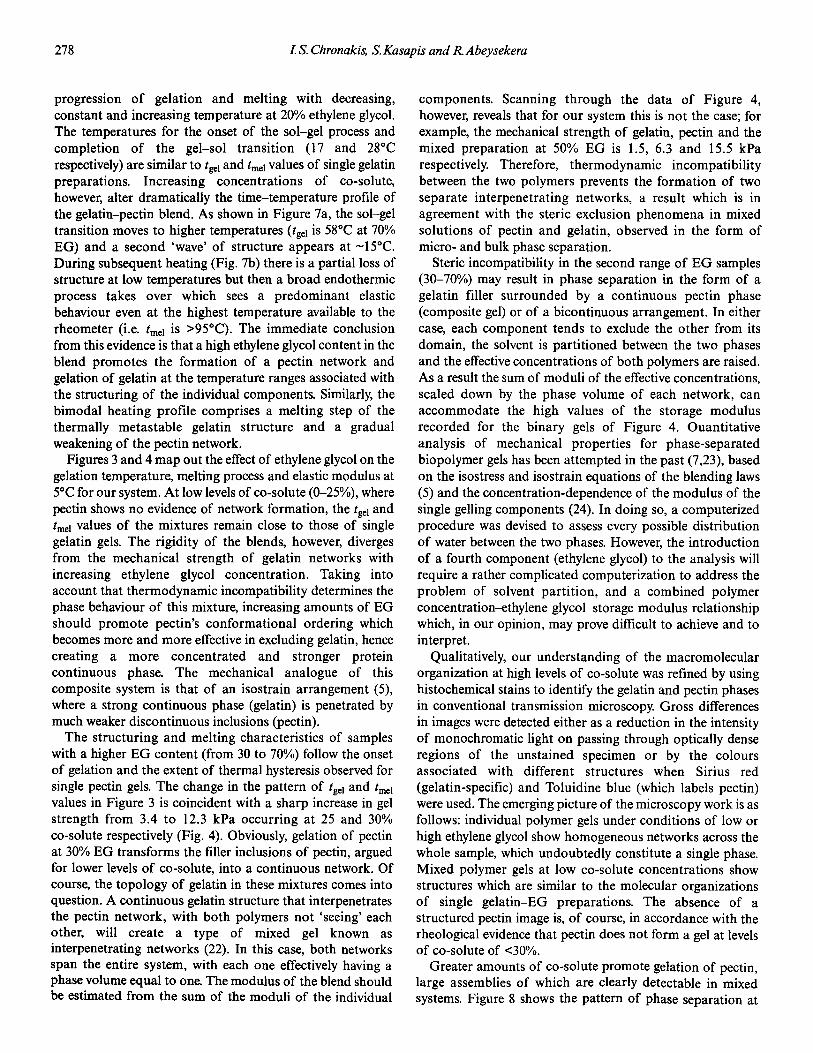
278 IS. Chronakis, S.Kasapis and R Abeysekera
progression of gelation and melting with decreasing,constant and increasing temperature at 20% ethylene glycol.The temperatures for the onset of the sol-gel process andcompletion of the gel-sol transition (17 and 28°Crespectively) are similar to tgel and tmel values of single gelatinpreparations. Increasing concentrations of co-solute,however, alter dramatically the time-temperature profile ofthe gelatin-pectin blend. As shown in Figure 7a, the sol-geltransition moves to higher temperatures (tgel is 58°C at 70%EG) and a second 'wave' of structure appears at -15°C.During subsequent heating (Fig. 7b) there is a partial loss ofstructure at low temperatures but then a broad endothermicprocess takes over which sees a predominant elasticbehaviour even at the highest temperature available to therheometer (i.e. tmel is >95°C). The immediate conclusionfrom this evidence is that a high ethylene glycol content in theblend promotes the formation of a pectin network andgelation of gelatin at the temperature ranges associated withthe structuring of the individual components. Similarly, thebimodal heating profile comprises a melting step of thethermally metastable gelatin structure and a gradualweakening of the pectin network.
Figures 3 and 4 map out the effectof ethylene glycolon thegelation temperature, melting process and elastic modulus at5°C for our system. At low levelsof co-solute (0-25%), wherepectin shows no evidence of network formation, the tgel andtmel values of the mixtures remain close to those of singlegelatin gels. The rigidity of the blends, however, divergesfrom the mechanical strength of gelatin networks withincreasing ethylene glycol concentration. Taking intoaccount that thermodynamic incompatibility determines thephase behaviour of this mixture, increasing amounts of EGshould promote pectin's conformational ordering whichbecomes more and more effectivein excluding gelatin, hencecreating a more concentrated and stronger proteincontinuous phase. The mechanical analogue of thiscomposite system is that of an isostrain arrangement (5),where a strong continuous phase (gelatin) is penetrated bymuch weaker discontinuous inclusions (pectin).
The structuring and melting characteristics of sampleswith a higher EG content (from 30 to 70%) follow the onsetof gelation and the extent of thermal hysteresis observed forsingle pectin gels. The change in the pattern of tgel and tmel
values in Figure 3 is coincident with a sharp increase in gelstrength from 3.4 to 12.3 kPa occurring at 25 and 30%co-solute respectively (Fig. 4). Obviously, gelation of pectinat 30% EG transforms the filler inclusions of pectin, arguedfor lower levels of co-solute, into a continuous network. Ofcourse, the topology of gelatin in these mixtures comes intoquestion. A continuous gelatin structure that interpenetratesthe pectin network, with both polymers not 'seeing' eachother, will create a type of mixed gel known asinterpenetrating networks (22). In this case, both networksspan the entire system, with each one effectively having aphase volume equal to one. The modulus of the blend shouldbe estimated from the sum of the moduli of the individual
components. Scanning through the data of Figure 4,however, reveals that for our system this is not the case; forexample, the mechanical strength of gelatin, pectin and themixed preparation at 50% EG is 1.5, 6.3 and 15.5 kParespectively. Therefore, thermodynamic incompatibilitybetween the two polymers prevents the formation of twoseparate interpenetrating networks, a result which is inagreement with the steric exclusion phenomena in mixedsolutions of pectin and gelatin, observed in the form ofmicro- and bulk phase separation.
Steric incompatibility in the second range of EG samples(30-70%) may result in phase separation in the form of agelatin filler surrounded by a continuous pectin phase(composite gel) or of a bicontinuous arrangement. In eithercase, each component tends to exclude the other from itsdomain, the solvent is partitioned between the two phasesand the effective concentrations of both polymers are raised.As a result the sum of moduli of the effective concentrations,scaled down by the phase volume of each network, canaccommodate the high values of the storage modulusrecorded for the binary gels of Figure 4. Ouantitativeanalysis of mechanical properties for phase-separatedbiopolymer gels has been attempted in the past (7,23), basedon the isostress and isostrain equations of the blending laws(5) and the concentration-dependence of the modulus of thesingle gelling components (24). In doing so, a computerizedprocedure was devised to assess every possible distributionof water between the two phases. However, the introductionof a fourth component (ethylene glycol) to the analysis willrequire a rather complicated computerization to address theproblem of solvent partition, and a combined polymerconcentration-ethylene glycol-storage modulus relationshipWhich, in our opinion, may prove difficult to achieve and tointerpret.
Qualitatively, our understanding of the macromolecularorganization at high levels of co-solute was refined by usinghistochemical stains to identify the gelatin and pectin phasesin conventional transmission microscopy. Gross differencesin images were detected either as a reduction in the intensityof monochromatic light on passing through optically denseregions of the unstained specimen or by the coloursassociated with different structures when Sirius red(gelatin-specific) and Toluidine blue (which labels pectin)were used. The emerging picture of the microscopy work is asfollows: individual polymer gels under conditions of low orhigh ethylene glycol show homogeneous networks across thewhole sample, which undoubtedly constitute a single phase.Mixed polymer gels at low co-solute concentrations showstructures which are similar to the molecular organizationsof single gelatin-EG preparations. The absence of astructured pectin image is, of course, in accordance with therheological evidence that pectin does not form a gel at levelsof co-solute of <30%.
Greater amounts of co-solute promote gelation of pectin,large assemblies of which are clearly detectable in mixedsystems. Figure 8 shows the pattern of phase separation at
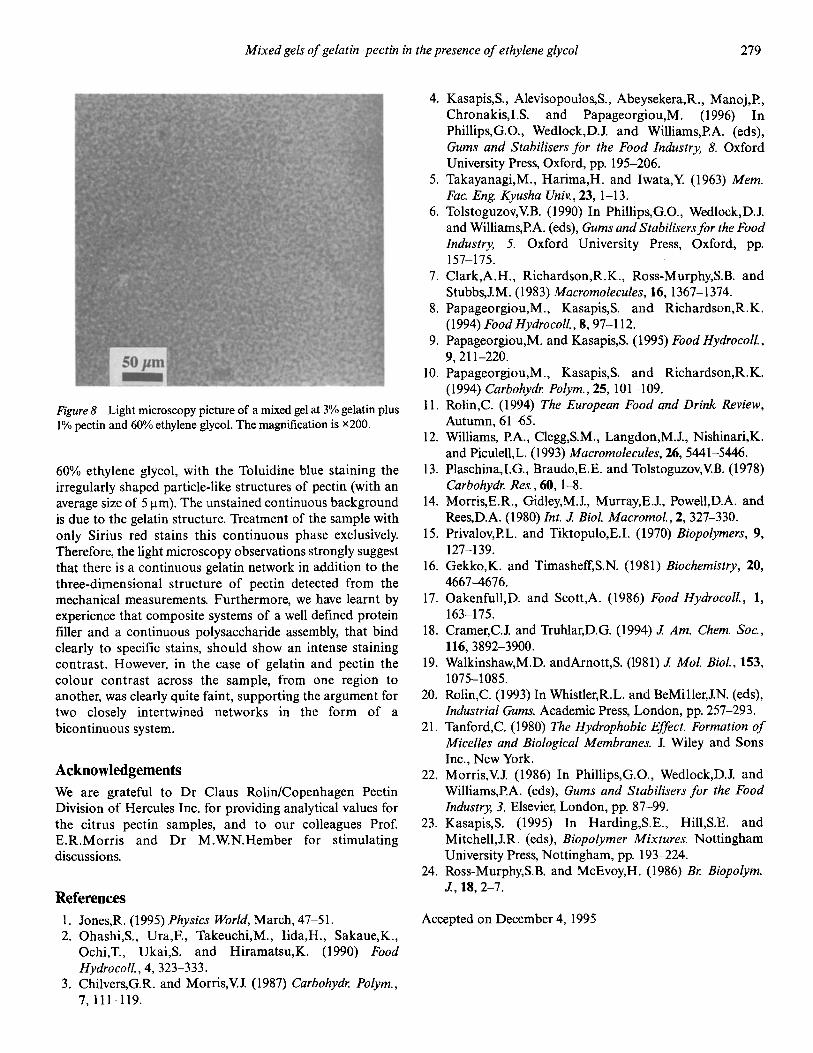
Mixed gels ofgelatin-pectin in the presence of ethylene glycol 279
Figure 8 Light microscopy picture of a mixed gel at 3% gelatin plus1% pectin and 60% ethylene glycol. The magnification is x200 .
60% ethylene glycol, with the Toluidine blue staining theirregularly shaped particle-like structures of pectin (with anaverage size of Sum). The unstained continuous backgroundis due to the gelatin structure. Treatment of the sample withonly Sirius red stains this continuous phase exclusively.Therefore, the light microscopy observations strongly suggestthat there is a continuous gelatin network in addition to thethree-dimensional structure of pectin detected from themechanical measurements. Furthermore, we have learnt byexperience that composite systems of a well defined proteinfiller and a continuous polysaccharide assembly, that bindclearly to specific stains, should show an intense stainingcontrast. However, in the case of gelatin and pectin thecolour contrast across the sample, from one region toanother, was clearly quite faint, supporting the argument fortwo closely intertwined networks in the form of abicontinuous system.
Acknowledgements
We are grateful to Dr Claus Rolin/Copenhagen PectinDivision of Hercules Inc. for providing analytical values forthe citrus pectin samples, and to our colleagues Prof.E.R.Morris and Dr M.WN.Hember for stimulatingdiscussions.
References
1. Jones,R. (1995) Physics World, March, 47-51.2. Ohashi,S., Ura ,F., Takeuchi,M., Iida,H., Sakaue,K.,
Ochi,T., Ukai,S. and Hiramatsu.K. (1990) FoodHydro coll., 4, 323-333 .
3. Chilvers,G.R. and Morris,Y.l (1987) Carbohydr. Polym.,7, 111-119.
4. Kasapis,S., Alevisopoulos,S., Abeysekera,R., Manoj,P.,Chronakis,I.S. and Papageorgiou,M. (1996) InPhillips,G.O., Wedlock,D.l and Williams,P.A. (eds),Gums and Stabilisers for the Food Industry, 8. OxfordUniversity Press, Oxford, pp. 195-206.
5. Takayanagi,M., Harima,H. and Iwata,Y. (1963) Mem.Fac. Eng. Kyusha Univ. , 23, 1-13 .
6. Tolstoguzov.Vb. (1990) In Phillips,G.O., Wedlock,D.land Williams,P.A. (eds), Gums and Stabilisers for the FoodIndustry, 5. Oxford University Press, Oxford, pp.157-175.
7. Clark,A.H., Richardson,R.K., Ross-Murphy,S.B. andStubbs,lM. (1983) Macromolecules, 16, 1367-1374.
8. Papageorgiou,M., Kasapis,S. and Richardson,R.K.(1994) Food Hydro coli., 8, 97-112.
9. Papageorgiou,M. and Kasapis,S. (1995) Food Hydrocoll.,9,211-220.
10. Papageorgiou,M., Kasapis,S. and Richardson,R.K.(1994) Carbohydr. Polym., 25, 101-109.
11. Rolin,C. (1994) The European Food and Drink Review,Autumn, 61-65.
12. Williams, P.A., Clegg,S.M., Langdon,M.l, Nishinari,K.and Piculell,L. (1993) Macromolecules, 26,5441-5446.
13. Plaschina,I.G. , Braudo,E.E. and Tolstoguzov.VB. (1978)Carbohydr. Res. , 60, 1-8.
14. Morris,E.R., Gidley,M.l, Murray,E.l, Powell,D.A. andRees,D.A. (1980) Int. 1 Bioi. Macromol., 2, 327-330.
15. Privalov,P.L. and Tiktopulo,E.I. (1970) Biopolymers, 9,127-139.
16. Gekko,K. and Timasheff,S.N. (1981) Biochemistry, 20,4667-4676.
17. Oakenfull,D. and Scott,A. (1986) Food Hydrocoll., 1,163-175.
18. Cramer,C.l and Truhlar,D.G. (1994) 1 Am. Chem. Soc.,116, 3892-3900.
19. Walkinshaw,M.D. andArnott,S. (1981) 1 Mol. Bioi., 153,1075-1085.
20. Rolin,C. (1993) In Whistler,R.L. and BeMiller,lN. (eds),Industrial Gums. Academic Press, London, pp. 257-293.
21. Tanford,C. (1980) The Hydrophobic Effect. Formation ofMicelles and Biological Membranes. 1 Wiley and SonsInc., New York.
22. Morris,V.I (1986) In Phillips,G.O., Wedlock,D.l andWilliams,P.A. (eds), Gums and Stabilisers for the FoodIndustry, 3. Elsevier, London, pp. 87-99.
23. Kasapis,S. (1995) In Harding,S.E., Hill,S.E. andMitchell,lR. (eds), Biopolymer Mixtures. NottinghamUniversity Press, Nottingham, pp. 193-224.
24. Ross-Murphy,S.B. and McEvoy,H. (1986) Br. Biopolym.1 ,18,2-7.
Accepted on December 4, 1995