peer-reviewed article bioresources polymeric plasticizers can be reader-processed easier without the...
TRANSCRIPT
PEER-REVIEWED ARTICLE bioresources.com
Li et al. (2012). “EVA and properties of WPCs,” BioResources 7(3), 2916-2932. 2916
EFFECTS OF ETHYLENE VINYL ACETATE CONTENT ON PHYSICAL AND MECHANICAL PROPERTIES OF WOOD-PLASTIC COMPOSITES
Dongfang Li, Jianzhang Li, Xiaohong Hu, and Li Li*
To investigate the effects of different ethylene vinyl acetate (EVA) contents on the performance of wood plastic composites (WPCs) made from poplar wood flour (PWF) and high density polyethylene (HDPE), physical properties tests, mechanical properties tests, and scanning electron microscope (SEM) tests were employed. The thermal stability and functional groups of PWF treated by EVA were evaluated by thermogravimetric analysis (TGA), differential thermal analysis (DTA), and Fourier transform infrared spectroscopy (FTIR), respectively. The results showed that the hardness, water uptake, and thickness swelling of the WPCs was reduced with increasing content of EVA. The MOR and tensile strength of the WPC treated by 15% EVA content were enhanced by 17.48% and 9.97%, respectively, compared with those of the WPC without EVA. TGA results showed that the thermal stability of PWF treated by EVA was improved. FTIR analysis indicated that PWF was reacted and coated with EVA. SEM results showed that gaps and voids hardly existed in the sections of the WPCs treated by EVA. This research suggests that the flexibility and mechanical properties of WPCs could be improved by adding EVA. The best condition of EVA content could be 15%.
Keywords: Wood plastic composites; Ethylene vinyl acetate; Thermogravimetric analysis;
Physical properties; Mechanical properties
Contact information: College Material Science and Technology, Beijing Forestry University, Beijing,
10083, PR China; *Corresponding author: [email protected]
INTRODUCTION
Wood-plastic composites (WPCs) are important environmentally friendly
materials used in the construction industry. They are popular for residential and outdoor
applications, because they combine favorable performance and cost attributes that come
with the use of wood (and non-wood agricultural fibers) with the processability of
thermoplastic polymers (Smith and Wolcott 2006). Increasing attention has been focused
on their industrial production in China, after WPC products had been used in the various
constructions for public facilities, such as in the 2010 World Exposition.
It is only recently that extruded WPCs have entered the mainstream of the wood
product industry and thus improved the WPCs properties and manufacture (Smith and
Wolcott 2006). In the extrusion process, either a single screw extruder or a twin screw
extruder can be employed for pilot scale tests in order to study the process of WPC
fabrication. Although the new machines require stricter controlled condition of
processing and more precise formulation of WPCs in comparison with what hot-press
PEER-REVIEWED ARTICLE bioresources.com
Li et al. (2012). “EVA and properties of WPCs,” BioResources 7(3), 2916-2932. 2917
machines do, extrusion is becoming the preferred industrial processing method. This is
because extruded WPC products exhibit excellent appearance during the continuous
processing. Thus, in the present work, extruders were employed to make WPCs.
It has been found in many studies that wood-fiber-filled plastic achieved higher
mechanical properties than unfilled plastics (Wolcott 2003; Stark et al. 2004; Clemons
and Ibach 2004; Stark 2006; Bengtsson et al. 2007). However, added wood fiber also
increases the modulus of elasticity (MOE) of plastic matrix and thus increases the
difficulty of process steps in the manufacture of WPCs.
To improve the extrusion process, ethylene vinyl acetate (EVA) could be used to
reduce the MOE of WPCs. This is due to a low softening point and excellent flexibility of
EVA (Yang et al. 2009; Weng 2010; Li et al. 2010). EVA was used as a polymeric
plasticizer and also as an impact modifier in the study of Marathe and Joshi (2010),
because polymeric plasticizers can be reader-processed easier without the disadvantages
of low-molecular-weight plasticizers, which include leaching over a period of time
(Marathe and Joshi 2010).
In the meantime, various species of wood fibers have been considered for use as
reinforcing fillers in WPCs. Such fibers include wood fiber, rice hull, wheat straw, corn
stem, sisal, flax, hemp, kenaf, jute, and oil palm empty fruit bunches (Jayaraman 2003;
Arbelaiz et al. 2005; Panthapulakkal and Sain 2006; Santiagoo et al. 2011; Ismail et al.
2011). The usage of varied fibers expands the range of raw materials and the market of
WPC products. However, a basic problem still exists. Problems related to incompatibility
and immiscibility within WPCs is due to the fact that the polyolefin matrix material is
typically non-polar and hydrophobic, whereas the lignocellulosic material is typically
polar and hydrophilic (Santiagoo et al. 2011). Many researchers have been attempting to
solve this problem by using three main methods, i.e. modifying plastic, modifying wood
powder, and adding coupling agents (Yin and Ren 2002). Considering the cost and scale
of production and the recent technology, the latter two methods are easier to achieve.
More than 40 kinds of coupling agents have been researched to improve the
bonding properties of WPCs. They include silanes, titanates, aluminate, polypropylene
glycol (PPG), poly [methylene (polyphenyl isocyanate)] (PMPPIC), and maleic
anhydride grafted polymer (Colom et al. 2003; Qin et al. 2005; Marti-Ferrer et al. 2006;
Kim et al. 2007). Ly and his followers employed elemental analysis, Fourier transform
infrared spectroscopy (FTIR), X-ray photoelectron spectroscopy, scanning electron
microscopy (SEM), and contact angle measurements to investigate the surface
functionalization of cellulose fibers treated by six kinds of coupling agents. They found
that coupling agents could be used to improve the bonding of wood fiber and polymer.
The achievement of the aim was due to the fact that the functional groups of coupling
agents react with the cellulose surface and the remaining moieties of coupling agents are
compatible with the polymer matrix. So coupling agents provide a covalent linkage
between the matrix and the reinforcing elements, which enable WPCs to obtain an
improved stress transfer (Ly et al. 2008).
EVA also has a carboxyl group that can react with the hydroxyl of cellulose and
a polyvinyl group which could associate in a cooperative manner with the long chains of
high density polyethylene (HDPE). So, EVA might be used to treat wood flour for
improving the bonding of poplar wood flour filled HDPE composites. This work aimed to

PEER-REVIEWED ARTICLE bioresources.com
Li et al. (2012). “EVA and properties of WPCs,” BioResources 7(3), 2916-2932. 2918
find whether EVA could be used to reduce the MOE of WPCs in order to ease processing
and improve mechanical properties of WPCs. Detailed studies were carried out to
evaluate the effects of EVA content on performance of WPCs.
EXPERIMENTAL
Materials HDPE Grade 5000S was obtained from Daqing Company of China National
Petroleum Corporation with a melt index of 1.2 g/10min at 133°C and a density of
0.953 g/cm3. Poplar wood flour was supplied by Gaocheng Xingda wood flour factory in
Hebei with a size over 100 mesh. EVA Grade 40W was obtained from Japan Mitsui
Petrochemical Corporation with a melt index of 65 g/10min at 58°C and 40% vinyl
acetate content. Stearic acid and stearic zinc were lubricants obtained from Xilong
Chemical Company in Shantou and Jinke Institute of Fine Chemicals in Tianjin,
respectively. Calcium carbonate was supplied by Xilong Chemical Company in Shantou.
Formulations of poplar wood flour filled HDPE composites are given in Table 1.
Table 1. Formulations of Poplar Wood Flour Filled HDPE Composites
Sample HDPE
(wt%)
Poplar
wood flour
(wt%)
EVA
(wt%)
Stearic
Acid
(wt%)
Stearic
Zinc
(wt%)
Calcium
Carbonate
(wt%)
PWF 34.60 51.90 0 1.56 1.56 10.38
EVA-5 33.72 50.59 2.53 1.52 1.52 10.12
EVA-10 32.89 49.34 4.94 1.48 1.48 9.87
EVA-15 32.10 48.15 7.22 1.45 1.45 9.63
EVA-20 31.35 47.03 9.40 1.41 1.41 9.40
EVA Treatment Prior to compounding, poplar wood flour was dried in an oven at 120°C for 3h
to reduce moisture. Four levels of EVA content were 5, 10, 15, and 20 wt% relative to the
poplar wood flour. After EVA and the poplar wood flour were mixed, the EVA treatment
reaction for the poplar wood flour was carried out in a twin screw extruder (Giant
SHJ-20B, China) at 15Hz. The temperatures of five zones in the twin screw extruder
were 60, 80, 90, 90, and 65°C in sequence.
WPCs Processing Firstly, HDPE, stearic acid, stearic zinc, and calcium carbonate were mixed
together. Secondly, the five different kinds of untreated and treated poplar wood flour
were mixed with them, respectively. Then, the five different kinds of mixture were
respectively granulated by the twin screw extruder at 15Hz. The temperatures of five
zones in the twin screw extruder were 125, 145, 155, 155, and 130°C in sequence. Next,
the five different kinds of granulations were processed by a single screw extruder (Giant
SJ-45, China) at 6Hz. The temperatures of five zones in the single screw extruder were

PEER-REVIEWED ARTICLE bioresources.com
Li et al. (2012). “EVA and properties of WPCs,” BioResources 7(3), 2916-2932. 2919
125, 145, 155, 155, and 130°C in sequence. The cross section of the samples was 50 mm
× 5 mm. Finally, the samples were cut according to the requirements of different tests.
Thermogravimetric Analysis (TGA) The thermogravimetric behaviors of the poplar wood flour untreated and treated
by EVA were characterized by a TGA instrument (Shimadzu TGA-600, Japan). The
samples were placed in an oven at 90°C for 5h. The test temperature ranged from 40°C to
840°C with a heating rate of 10°C/min. The test was carried out under nitrogen
atmosphere (20 mL/min) in order to prevent poplar wood flour from thermal oxidative
degradations.
Differential Thermal Analysis (DTA) The differential thermal behavior of the pure poplar wood flour was
characterized by a TGA device (Shimadzu TGA-600, Japan). The samples were placed in
an oven at 90°C for 5h. The test temperature ranged from 40°C to 840°C with a heating
rate of 10°C/min. The test was carried out under nitrogen atmosphere (20 mL/min) in
order to prevent poplar wood flour from thermal oxidative degradations.
Fourier Transform Infrared Spectroscopy (FTIR) Test The samples were placed in an oven at 105°C until a constant weight was
obtained. FTIR spectra of untreated and treated poplar wood flour were recorded using an
infrared spectrometer (Nicolet 6700 FT-IR, USA) over the range of 400 to 4000 cm-1
. 32
scans were accumulated at a resolution of 4 cm-1
.
Shore Hardness Measurement The shore hardness of the WPCs were measured by a durometer (TimeGroup
TH210, China), according to GB/T 2411-2008 (Plastics and ebonite-Determination of
indentation hardness by means of a durometer, China). Test specimen dimensions were
50 mm × 50 mm × 5 mm. At least 15 replicates of three samples were tested to obtain the
average value for each sample, according to GB/T 24137-2009 (wood-plastic composites
decorative boards, China).
Density Measurement The dimensions of the WPCs were measured to 0.01 mm precision by use of a
vernier caliper, and the mass of the WPCs was measured by balance with a resolution of
0.01 g, according to GB/T 17657-1999 (test methods of evaluating the properties of
wood-based panels and surface decorated wood-based panels, China). Test specimen
dimensions were 150 mm × 50 mm × 5 mm. At least six replicates were tested to obtain
the average value for each sample.
Density was calculated according to the following equation,
1000m
a b h
(1)

PEER-REVIEWED ARTICLE bioresources.com
Li et al. (2012). “EVA and properties of WPCs,” BioResources 7(3), 2916-2932. 2920
where ρ is the density of the sample (g/cm3), m is the weight of the sample (g), a is the
length of the sample (mm), b is the width of the sample (mm), and h is the thickness of
the sample (mm).
Flexural Property Test The flexural properties of the WPCs were measured by an electronic universal
mechanical testing machine (ShiJin WDW-50D, China) controlled by a microcomputer,
and the speed of the pressure-head was 10 mm/min, according to GB/T 1449-2005
(fiber-reinforced plastic composites-determination of flexural properties, China). Test
specimen dimensions were 150 mm × 27 mm × 5 mm. At least six replicates were tested
to obtain the average value for each sample.
Modulus of rupture (MOR) was calculated according to the following equation,
2
3
2f
P l
b h
(2)
where σf is the MOR of the sample (MPa), P is the maximum load of the sample (N), l is
the span of the machine (mm), b is the width of the sample (mm), and h is the thickness
of the sample (mm).
Modulus of elasticity (MOE) was calculated according to the following
equation,
3
34f
l PE
b h S
(3)
where Ef is the MOE of the sample (MPa), P is the increment of the load in the initial
straight segment (N), S is the increment of the deflection in the same initial straight
segment (mm), l is the span of the machine (mm), b is the width of the sample (mm), and
h is the thickness of the sample (mm).
Tensile Property Test The tensile properties of the WPCs were measured by an electronic universal
mechanical testing machine (ShiJin WDW-50D, China) controlled by a microcomputer at
the cross-head speed of 10 mm/min, according to GB/T 1447-2005 (fiber-reinforced
plastic composites-determination of tensile properties, China). Test specimen dimensions
were 150 mm × 20 mm × 5 mm. At least six replicates were tested to obtain the average
value for each sample.
Tensile strength was calculated according to the following equation,
t
F
b d
(4)
where σt is the tensile strength of the sample (MPa), F is the maximum load of the sample
(N), b is the width of the sample (mm), and d is the thickness of the sample (mm).

PEER-REVIEWED ARTICLE bioresources.com
Li et al. (2012). “EVA and properties of WPCs,” BioResources 7(3), 2916-2932. 2921
Water Uptake Test The water uptake tests of the WPCs were carried out by immersing the samples
in distilled water at room temperature (20°C) for 24h, according to GB/T 17657-1999
(test methods of evaluating the properties of wood-based panels and surface decorated
wood-based panels, China). Test specimen dimension was 50 mm × 50 mm × 5 mm. At
least six replicates were tested to obtain the average value for each sample.
Water uptake was calculated according to the following equation,
2 1
1
100m m
Wm
(5)
where W is the water uptake of the sample (%), m1 is the original weight of the sample
(g), and m2 is the final weight of the sample (g).
Thickness Swelling Test The thickness swelling tests of the WPCs were carried out by immersing the
samples in distilled water at room temperature (20°C) for 72 h, according to GB/T
17657-1999 (test methods of evaluating the properties of wood-based panels and surface
decorated wood-based panels, China) and GB/T 24137-2009 (wood-plastic composites
decorative boards, China). Test specimen dimensions were 50 mm × 50 mm × 5 mm. At
least six replicates were tested to obtain the average value for each sample.
Thickness swelling was calculated according to the following equation,
2 1
1
100h h
Th
(6)
where T is the thickness swelling of the sample (%), h1 is the original thickness of the
sample (mm), and h2 is the final thickness of the sample (mm).
Scanning Electron Microscope (SEM) Test The samples were placed in an oven at 105°C until a constant weight was
obtained. The fracture surfaces of the untreated and treated WPCs were observed by a
scanning electron microscope (Hitachi S-3400N II, Japan). Samples to be observed under
the SEM were mounted on conductive adhesive tape, sputter coated with gold, and
observed in the SEM using a voltage of 10 kV.
RESULTS AND DISCUSSION
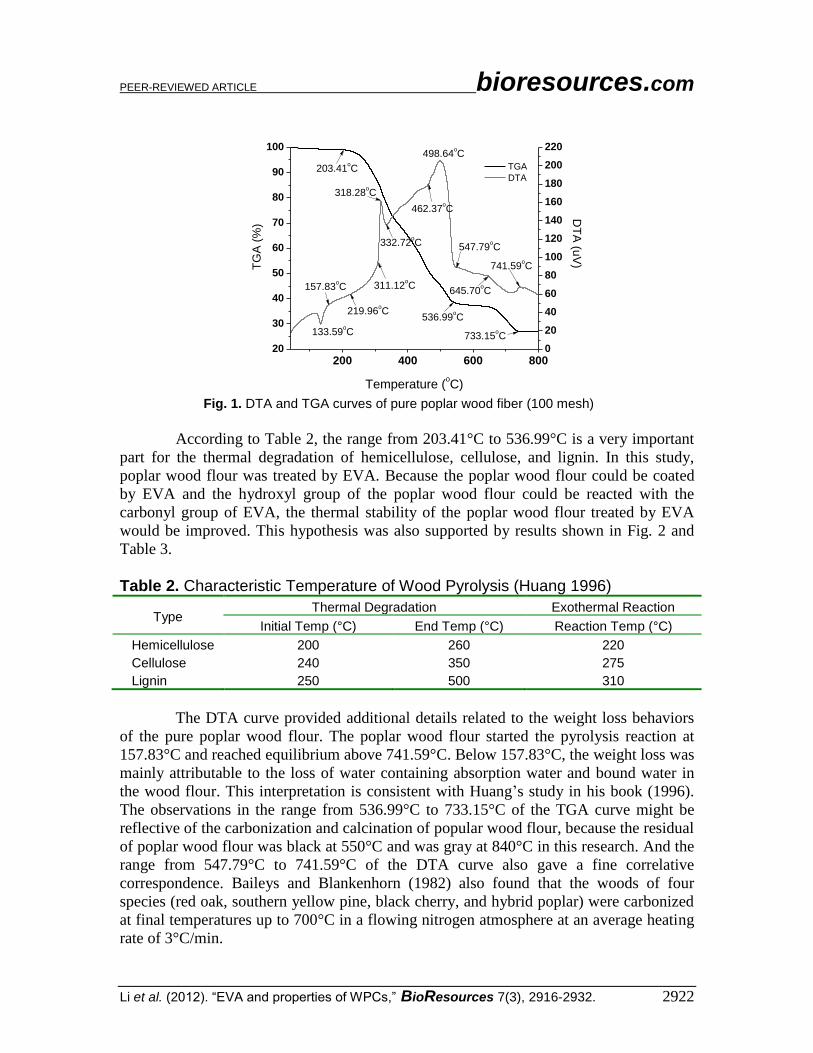
Thermal Properties Figure 1 shows the DTA and TGA curves of pure poplar wood flour. The TGA
curve revealed that there were four main stages of the weight loss of the poplar wood
flour. They were attributed to the loss of water, the thermal degradation of wood flour,
the carbonization and calcination of wood flour, and the equilibrium of remainder.
PEER-REVIEWED ARTICLE bioresources.com
Li et al. (2012). “EVA and properties of WPCs,” BioResources 7(3), 2916-2932. 2922
200 400 600 80020
30
40
50
60
70
80
90
100
741.59oC
645.70oC
462.37oC
547.79oC
311.12oC
203.41oC
219.96oC
318.28oC
TGA
DTA
Temperature (oC)
TG
A (
%)
157.83oC
498.64oC
133.59oC
0
20
40
60
80
100
120
140
160
180
200
220
332.72oC
733.15oC
536.99oC
DT
A (u
V)
Fig. 1. DTA and TGA curves of pure poplar wood fiber (100 mesh)
According to Table 2, the range from 203.41°C to 536.99°C is a very important
part for the thermal degradation of hemicellulose, cellulose, and lignin. In this study,
poplar wood flour was treated by EVA. Because the poplar wood flour could be coated
by EVA and the hydroxyl group of the poplar wood flour could be reacted with the
carbonyl group of EVA, the thermal stability of the poplar wood flour treated by EVA
would be improved. This hypothesis was also supported by results shown in Fig. 2 and
Table 3.
Table 2. Characteristic Temperature of Wood Pyrolysis (Huang 1996)
Type Thermal Degradation Exothermal Reaction
Initial Temp (°C) End Temp (°C) Reaction Temp (°C)
Hemicellulose 200 260 220
Cellulose 240 350 275
Lignin 250 500 310
The DTA curve provided additional details related to the weight loss behaviors
of the pure poplar wood flour. The poplar wood flour started the pyrolysis reaction at
157.83°C and reached equilibrium above 741.59°C. Below 157.83°C, the weight loss was
mainly attributable to the loss of water containing absorption water and bound water in
the wood flour. This interpretation is consistent with Huang’s study in his book (1996).
The observations in the range from 536.99°C to 733.15°C of the TGA curve might be
reflective of the carbonization and calcination of popular wood flour, because the residual
of poplar wood flour was black at 550°C and was gray at 840°C in this research. And the
range from 547.79°C to 741.59°C of the DTA curve also gave a fine correlative
correspondence. Baileys and Blankenhorn (1982) also found that the woods of four
species (red oak, southern yellow pine, black cherry, and hybrid poplar) were carbonized
at final temperatures up to 700°C in a flowing nitrogen atmosphere at an average heating
rate of 3°C/min.

PEER-REVIEWED ARTICLE bioresources.com
Li et al. (2012). “EVA and properties of WPCs,” BioResources 7(3), 2916-2932. 2923
100 200 300 400 500 60030
40
50
60
70
80
90
100
4PWF
3PWF
2PWF
1PWF
4EVA
3EVA
2EVA
Ma
ss R
esid
ua
l R
atio
(%
)
Temperature (oC)
PWF
EVA-5
EVA-10
EVA-15
EVA-20
1EVA
Fig. 2. Effect of EVA Content on thermal behavior of poplar wood flour
Figure 2 shows the pattern of the weight loss behaviors of the poplar wood flour
with and without EVA. Both the curve of the poplar wood flour without EVA and the
curves of the poplar wood flour with various EVA contents exhibited four inflection
points. But, the TGA curves of the poplar wood flour treated by EVA had distinct
difference during the thermal degradation of hemicellulose and cellulose compared with
that of the pure poplar wood flour. Pyrolysis characteristic values of the poplar wood
flour with and without EVA are shown in Table 3. The initial temperatures of the poplar
wood flour with different EVA contents in the first weight loss process were delayed at
least 22°C in comparison with that of the pure poplar wood flour without EVA. This
suggested that the thermal stability of the poplar wood flour treated by EVA was
improved.
Table 3. Pyrolysis Characteristic Values of Wood Flour With and Without EVA
Type
The first weight loss process The second weight loss process
Initial
Temp
(°C)
End
Temp
(°C)
Mass Residual
Ratio (%)
Initial
Temp
(°C)
End
Temp
(°C)
Mass Residual
Ratio (%)
PWF 203.14 360.52 27.91 360.52 466.64 29.59
EVA-5 225.07 367.83 24.14 367.83 476.28 33.82
EVA-10 230.42 362.35 23.92 362.35 483.74 35.38
EVA-15 234.21 367.43 23.62 367.43 487.96 37.07
EVA-20 238.49 364.02 23.21 364.02 484.64 39.02

PEER-REVIEWED ARTICLE bioresources.com
Li et al. (2012). “EVA and properties of WPCs,” BioResources 7(3), 2916-2932. 2924
In Table 3, from 220°C to 370°C, the weight loss of the treated wood flour
decreased with the increment of the EVA content. So the weight loss of the poplar wood
flour might contribute to the total weight loss of the treated poplar wood flour. From
380°C to 500°C, the weight loss of the treated wood flour increased with the increment of
the EVA content. So the weight loss of EVA might contribute to the total weight loss of
the treated poplar wood flour. This indicated that the poplar wood flour might have
reacted with EVA. This hypothesis will be supported by infrared spectroscopy analysis.
Similar findings were reported by Qi et al. who employed infrared, TGA, and SEM to
investigate poplar wood flour treated by EVA (Qi 2008).
Chemical Properties Specific absorption peaks can be used to identify particular chemical groups in
the FTIR spectra. Figure 3 shows the spectra of the pure poplar wood flour (PWF), the
poplar wood flour with 5% EVA content (EVA-5), the poplar wood flour with 15% EVA
content (EVA-15), and pure EVA (EVA). In the spectrum of PWF there was a strong
stretching vibration band of hydroxyl group at 3391 cm-1
, a moderate stretching vibration
band of methylene group at 2912 cm-1
, an absorption band of C-O at 1024 cm-1
, and the
weak absorption band of carbonyl groups from 1600 cm-1
to 1650 cm-1
, representing
characteristic peaks of cellulose and lignin.
4000 3500 3000 2500 2000 1500 1000 500
PWF
EVA-5
EVA-15
Wave Number (cm-1)
EVA
Fig. 3. FTIR of pure wood flour, wood flour with 5% EVA, and wood flour with 15% EVA
Compared to the spectra for PWF and EVA, the spectra for EVA-5 and EVA-15
showed that the strong stretching vibration band of carbonyl group at 1743 cm-1
, the
absorption band of methyl group at 2940 cm-1
, and the absorption band of methylene
group at 2850 cm-1
were related to characteristic peaks of EVA. It can be concluded that
the poplar wood fiber was coated by EVA.
Compared to the spectrum of PWF, the spectra for EVA-5 and EVA-15 did not
exhibit the strong stretching vibration band of hydroxyl group at 3391 cm-1
. This
suggested that the hydroxyl group of the poplar wood flour was reacted with the carbonyl

PEER-REVIEWED ARTICLE bioresources.com
Li et al. (2012). “EVA and properties of WPCs,” BioResources 7(3), 2916-2932. 2925
group of EVA. This reaction would reduce the polarity of the poplar wood flour and
increase the compatibility between the poplar wood flour and HDPE. It would be
represented by the increasing mechanical properties and the decreasing water uptake
properties.
Hardness Figure 4 shows that hardness of the WPCs decreased with increasing content of
EVA. Decreasing hardness was due to the soft and flexible property of EVA (Yang et al.
2009) and the decreasing weight fraction of poplar wood flour. In this experiment, the
WPC products become easier to flex by increasing content of EVA. This suggests that the
flexibility of the WPCs was improved by adding EVA.
0 5 10 15 200
10
20
30
40
50
60
70
80
52.755.2
57.162.1
Ha
rdn
ess o
f W
PC
(S
H)
EVA Content (%)
63.7
Fig. 4. Effect of EVA content on hardness of WPCs
But, it could not be concluded that the process of extrusion also followed the
same tendency. Since EVA is a strong adhesion resin (Weng 2010), the extruding
pressure became higher by increasing content of EVA in this research. An attempt was
made to process WPC with 25% EVA content, but the process could not be completed
successfully. Because the extrude pressure was so high, the machine ceased to run.
Density Figure 5 shows that the densities of the WPCs were hardly influenced by the
change of EVA contents. Bledzki and Faruk (2004) found a similar result when they
compared injection and extrusion WPCs made from hardwood powder and a
polyethylene matrix. In their study, the tensile strength of the injection products was
higher than that of the extrusion products. However, the densities of both products were
similar (Bledzki and Faruk 2004). Therefore, it might be concluded that the density of
WPCs was only affected by the formulation, especially the ratio of wood flour to plastic.
The density of WPCs with the same formula under the same process condition would
have no obvious difference. Also, the density of WPCs would be decreased by the
decreasing weight fraction of wood flour.

PEER-REVIEWED ARTICLE bioresources.com
Li et al. (2012). “EVA and properties of WPCs,” BioResources 7(3), 2916-2932. 2926
0 5 10 15 200.0
0.2
0.4
0.6
0.8
1.0
1.2
1.4
1.6
1.341.341.311.32
De
nsity o
f W
PC
(g
/cm
3)
EVA Content (%)
1.32
Fig. 5. Effect of EVA content on density of WPCs
In this study, although the weight fraction of poplar wood flour was decreasing,
the density of the WPCs showed a tiny increase. It might be concluded that gaps and
voids between the poplar wood flour and HDPE were decreased by increasing content of
EVA. This hypothesis will be supported by the decreasing water uptake properties and
the SEM results of the WPCs.
Flexural Property and Tensile Property The molecular formula of EVA (Fig. 6) shows that there are two main parts of
EVA. One part is a polyvinyl chain, which could wind in parallel with a long chain of
HDPE; the other part is carboxyl, which could react with the hydroxyl of cellulose.
Therefore, it could be concluded that the mechanical properties of WPCs could be
improved by adding EVA. And this hypothesis will be supported by Figs. 7 and 9.
C
H2
C
H2
HC
n
CH2
O
C CH3O
n
Fig. 6. The molecular formula of EVA
The MOR (Fig. 7), the MOE (Fig. 8), and tensile strength (Fig. 9) of the WPCs
with various EVA contents showed a similar tendency in that they were all increased
initially and then decreased by increasing content of EVA. And there was a maximum in
the mechanical properties at 15% EVA content.

PEER-REVIEWED ARTICLE bioresources.com
Li et al. (2012). “EVA and properties of WPCs,” BioResources 7(3), 2916-2932. 2927
0 5 10 15 200
5
10
15
20
25
30
35
40
28.56
32.87
29.1428.66
MO
R o
f W
PC
(M
Pa
)
EVA Content (%)
27.98
0 5 10 15 200
500
1000
1500
2000
2500
3000
1861
22242100
1900
MO
E o
f W
PC
(M
Pa
)
EVA Content (%)
2653
Fig. 7. Effect of EVA content on MOR of WPCs Fig. 8. Effect of EVA content on MOE of WPCs
0 5 10 15 200
2
4
6
8
10
12
14
16
12.7213.79
12.8012.63
Te
nsile
Str
en
gth
of
WP
C (
MP
a)
EVA Content (%)
12.54
Fig. 9. Effect of EVA content on tensile strength of WPCs
Figures 7 and 9 show that the MOR and tensile strength of the WPCs added
EVA were improved compared with that of the WPC without EVA. The MOR and
tensile strength of the WPC treated by 15% EVA content were enhanced by 17.48% and
9.97%, respectively. By contrast, Chen et al. (2010) used poplar wood flour treated by
EVA to fill polypropylene (PP) and found that 10% EVA content might be the best. That
disagreement implied that EVA content should be adjusted according to the different
plastic matrix.
The MOR and tensile strength of WPC is increased by decreasing weight
fraction of wood flour. In this experiment, the decreasing weight fraction of the poplar
wood flour also had influence on the mechanical properties. But WPC with 20% EVA
had the least weight fraction of the poplar wood flour and did not achieve the highest
mechanical properties. It might conclude that the different content of EVA was the main
reason for the change of the mechanical properties of the WPCs.
Figure 8 shows that MOE of the WPCs treated by EVA was lower than that of
the WPC without EVA. This was due to the soft and flexible nature of EVA. The result
was consistent with the hardness data, which suggested that the flexibility of the WPCs
was improved by adding EVA.

PEER-REVIEWED ARTICLE bioresources.com
Li et al. (2012). “EVA and properties of WPCs,” BioResources 7(3), 2916-2932. 2928
Water Uptake and Thickness Swelling Figures 10 and 11 exhibit dimensional stabilities of the WPCs with and without
EVA, including water uptake and thickness swelling. It was found that water uptake and
thickness swelling were decreased with increasing content of EVA. Because hydroxyl
groups of cellulose were reacted with the carboxyl of EVA, the hydrophilic behavior of
the poplar wood flour was weakened. Similar results were found by using other coupling
agents, such as silanes, titanates, aluminate, and maleic anhydride-grafted polymer (Qin
et al. 2005; Xu et al. 2006; Song et al. 2011). Furthermore, the poplar wood flour was
coated by EVA. The polarity of the poplar wood flour was decreased by the increasing
content of EVA. So water uptake and thickness swelling of WPCs were decreased by the
increasing content of EVA.
0 5 10 15 200.0
0.2
0.4
0.6
0.8
1.0
1.2
0.700.710.81
0.89
Wa
ter
Up
take
of
WP
C (
%)
EVA Content (%)
0.95
0 5 10 15 200.0
0.2
0.4
0.6
0.8
1.0
1.2
1.4
1.6
0.850.950.98
1.08
Th
ickn
ess S
we
llin
g o
f W
PC
(%
)
EVA Content (%)
1.14
Fig. 10. Effect of EVA content on water uptake of WPCs
Fig. 11. Effect of EVA content on thickness swelling of WPCs
Morphology Figure 12(a-c) presents SEM micrographs of the WPCs untreated and treated by
EVA (1000×), respectively. In Fig. 12a, some fiber fragment and many gaps and voids
were noticeable between the HDPE matrix and the poplar wood flour on the section of
the WPC without EVA, and there was almost no filament of the polymer on the surface
of the poplar wood flour. These observations constituted evidence of poor bonding
between HDPE and the poplar wood flour untreated by EVA.
Figures 12b and 12c show almost no gap or void between the HDPE matrix and
the poplar wood flour on the sections of the WPCs with EVA. The difference between the
two pictures involved whether filaments of the polymer existed. Figure 12b shows some
filaments of the polymer on the section of the WPC with 15% EVA content, but Fig. 12c
does not show similar phenomena on the section of the WPC with 20% EVA content.
This indicates that the bonding between HDPE and the poplar wood flour treated by 15%
EVA was enhanced. So the MOR and tensile strength of the WPC with 15% EVA
content was increased. And it can imply that the poplar wood flour with 20% EVA
content was excessively coated. This might be due to the fact that the force transmission
form HDPE to the poplar wood flour was weakened. So the MOR and tensile strength of
the WPC with 20% EVA content was decreased in comparison with that of WPC with
15% EVA content. But the polarity of the poplar wood flour was decreased with the

PEER-REVIEWED ARTICLE bioresources.com
Li et al. (2012). “EVA and properties of WPCs,” BioResources 7(3), 2916-2932. 2929
increasing content of EVA. So water uptake and thickness swelling of the WPCs were
increased by increasing content of EVA.
(a) Section of WPC with 0% EVA content
(b) Section of WPC with 15% EVA content
(c) Section of WPC with 20% EVA content
Fig. 12. Effect of EVA Content on Morphology of WPCs
CONCLUSIONS
1. The TGA results and the FTIR results indicated that the poplar wood flour was coated
by EVA and the hydroxyl group of the poplar wood flour could be reacted with the
carbonyl group of EVA. So the thermal stability of the poplar wood flour treated by
EVA was improved, and the polarity of the poplar wood flour treated by EVA was
reduced. This treatment contributed to a better interfacial bonding of WPCs.
2. The fact that the hardness of the WPCs was decreased with increasing content of
EVA implied that the flexibility of the WPCs was improved by adding EVA. The
similar conclusion was supported by the fact that MOE of the WPCs with EVA were
lower than that of the WPC without EVA. The almost unchanged density of the
WPCs suggested that the density of WPCs was only influenced by the formulation
and the process condition of WPCs.

PEER-REVIEWED ARTICLE bioresources.com
Li et al. (2012). “EVA and properties of WPCs,” BioResources 7(3), 2916-2932. 2930
3. The MOR and tensile strength of the WPCs with EVA were enhanced in comparison
with those of the WPC without EVA. This indicated that the mechanical properties of
WPCs were improved by using EVA. The fact that the water uptake and thickness
swelling of the WPCs was decreased by increasing content of EVA indicated that the
water uptake properties of WPCs were reduced by using EVA.
4. The SEM results showed that there was almost no gap or void between the HDPE
matrix and the poplar wood flour on the sections of the WPCs with EVA. This
phenomenon explained the reason of increasing mechanical properties and decreasing
water uptake properties of the WPCs with EVA. It also was found that the poplar
wood flour with 20% EVA content was excessively coated. So the decreasing
mechanical properties of the WPC with 20% EVA content was due to the fact that the
force transmission form HDPE to the poplar wood flour was weakened.
ACKNOWLEDGMENTS
The authors are very grateful for financial support from Special Fund for
Forestry Research in the Public Interest (Project 201204702).
REFERENCES CITED
Arbelaiz, A., Fernandez, B., Ramos, J. A., Retegi, A., Liano-Ponte, R., and Mondragon, I.
(2005). “Mechanical properties of short flax fibre bundle/polypropylene composites:
Influence of matrix/fibre modification, fibre content, water uptake and recycling,”
Compos. Sci. Technol. 65(10), 1582-1592.
Baileys, R. T., and Blankenhorn, P. R. (1982). “Calorific and porosity development in
carbonized wood,” J. Wood Sci. 15(1), 19-28.
Bengtsson, M., Baillif, M. L., and Oksman, K. (2007). “Extrusion and mechanical
properties of highly filled cellulose fibre-polypropylene composites,” Composites:
Part A. 38(8), 1922-1931
Bledzki, A. K., and Faruk, O. (2004). “Extrusion and injection moulded microcellular
wood fibre reinforced polypropylene composites” Cell. Polym. 23(4), 211-227.
Chen, Y. F., Gong, J. Y., Han, C., and Ye, Y. (2010). “Preparation and mechanical
properties of PP/poplar wood flour composites modified by EVA,” Materials Review
24(8), 104-107.
Clemons, C. M., and Ibach, R. E. (2004). “Effects of processing method and moisture
history on laboratory fungal resistance of wood-HDPE composites,” Forest Prod. J.
54(4), 50-57.
Colom, X., Carrasco, F., Pages, P., and Canavate, J. (2003). “Effects of different
treatments on the interface of HDPE/lignocellulosic fiber composites,” Compos. Sci.
Technol. 63(2), 161-169.
Huang, L. X. (1996). Textbook of Wood Pyrolysis Technology, Second ed., Lvxian
Huang, Beijing.

PEER-REVIEWED ARTICLE bioresources.com
Li et al. (2012). “EVA and properties of WPCs,” BioResources 7(3), 2916-2932. 2931
Ismail, H., Omar, N. F., and Othman, N. (2011). “The effect of kenaf fibre loading on
curing characteristics and mechanical properties of waste tyre dust kenaf fibre hybrid
filler filled natural rubber compounds,” BioResources 6(4), 3742-3756.
Jayaraman, K. (2003). “Manufacturing sisal-polypropylene composites with minimum
fibre degradation,” Compos. Sci. Technol. 63(3), 367-374.
Kim, H. S., Lee, B. H., Choi, S. W., Kim, S., and Kim, H. J. (2007). “The effect of types
of maleic anhydride-grafted polypropylene (MAPP) on the interfacial adhesion
properties of bio-flour-filled polypropylene composites,” Composites: Part A. 38(6),
1473-1482.
Li, X. F., Huang, L. G., Hu, H. W., Jiang, A. Y., Meng, C. C., Niu, M. J., and Chen, J. Z.
(2010). “Studies on rheological properties of ethylene vinyl-acetate copolymer,”
Polymer Materials Science and Engineering 23(6), 124-126.
Ly, B., Thielemans, W., Dufresne, A., Chaussy, D., and Belgacem, M. N. (2008).
“Surface functionalization of cellulose fibres and their incorporation in renewable
polymeric matrices,” Compos. Sci. Technol. 68(15), 3193-3201.
Marathe, D. S., and Joshi, P. S. (2010). “Characterization of highly filled wood
flour-polyvinyl chloride composites: Dynamic mechanical and dielectric analysis,”
Polym. Eng. Sci. 1-8.
Marti-Ferrer, F., Vilaplana, F., Ribes-Greus, A., Benedito-Borras, A., and Sanz-Box, C.
(2006). “Flour rice husk as filler in block copolymer polypropylene: effect of
different coupling agents,” J. Appl. Polum. Sci. 99, 1823-1831.
Panthapulakkal, S., and Sain, M. (2006). “Injection molded wheat straw and corn stem
filled polypropylene composites,” J. Polym. Environ. 14, 265-272.
Qi, Z., Xue, P., Ding, J., Jia, M. Y., and Li, J. L. (2008) “A study of ethylene-vinyl
acetate copolymer modified wood-flour,” China Plastics 22(2), 24-27.
Qin, T. F., Huang, L. H., and Li, G. Y. (2005). “Effect of chemical modification on the
properties of wood/polypropylene composites,” Journal of Forestry Research 16(3),
241-244.
Santiagoo, R., Ismail, H., and Hussin, K. (2011). “Mechanical properties, water
absorption, and swelling behaviour of rice husk powder filled polypropy recycled
acrylonitrile butadiene rubber (PP NBRr RHP) biocomposites using silane as a
coupling agent,” BioResources 6(4), 3714-3726.
Smith, P. M., and Wolcott, M. P. (2006). “Opportunities for wood/natural fiber-plastic
composites in residential and industrial applications,” Forest Prod. J. 56(3), 4-11.
Song, Y. M., Li, C. Y., Wang, W. H., Wang, Q. W., and Xie, Y. J. (2011). “Coupling
effects of silane on the mechanical properties and water absorption of wood flour
/HDPE composites,” Scientia Silvae Sinicae 47(6), 122-127.
Stark, N. M. (2006). “Effect of weathering cycle and manufacturing method on
performance of wood flour and high-density polyethylene composites,” J. Appl.
Polym. Sci. 100, 3131-3140.
Stark, N. M., Matuana, L. M., and Clemons, C. M. (2004). “Effect of processing method
on surface and weathering characteristics of wood–flour/HDPE composites,” J. Appl.
Polym. Sci. 93, 1021-1030.
Weng, J. G. (2010). “Preliminary study on EVA,” China Adhesives 19(7), 66-67.

PEER-REVIEWED ARTICLE bioresources.com
Li et al. (2012). “EVA and properties of WPCs,” BioResources 7(3), 2916-2932. 2932
Wolcott, M. P. (2003). “Production methods and platforms for wood plastic composites,”
In: Proceedings of the non-wood substitutes for solid wood products conference,
October 2003, Melbourne, 12pp.
Xu, M., Fu, W. S., Li, J., and Li, S. (2006). “The effect of coupling agent on properties of
wheat straw/PP composites,” Wood Processing Machinery 1, 10-14.
Yang, G., Li, Q. C., Li, Y. M., Lu, W., Xu, L. P., and Wang, Y. X. (2009). “Capability
and application of poly (ethylene-co-vinyl acetate) (EVA),” Chinese Journal of
Colloid & polymer 27(3), 45-46.
Yin, X. C., and Ren, H. L. (2002). “Investigation of the factors improving the interfacial
compatibilities in wood-polymer composites,” Plastic 31(4), 25-28.
Article submitted: February 15, 2012; Peer review completed: April 20, 2012; Revised
version received and accepted: May 16, 2012; Published: May 22, 2012.