peer review only - personal homepages for the...
TRANSCRIPT

Peer Review O
nlyHigher Order Compact Simulation of Double-diffusive Natural Convection
in a Vertical Porous Annulus
Journal: International Journal for Numerical Methods in Engineering
Manuscript ID: NME-Nov-06-0718
Wiley - Manuscript type: Research Article
Date Submitted by the Author:
13-Nov-2006
Complete List of Authors: kalita, jiten; Indian Institute of Technology Guwahati, Mathematics Dass, Anoop; Indian Institute of Techmology Guwahati, Mechanical Engineering
Keywords: HOC, double-diffusive, convection, porous
http://mc.manuscriptcentral.com/nme
International Journal for Numerical Methods in Engineering

Peer Review O
nly
Higher Order Compact Simulation of
Double-diffusive Natural Convection in a Vertical
Porous Annulus
Jiten C Kalita∗1 and Anoop K. Dass†
∗ Assistant Professor, Department of Mathematics
Indian Institute of Technology, Guwahati 781 039, India
E-mail: [email protected], jiten [email protected]
Phone: +91 361 2582614, Fax: +91 361 2690762
† Professor, Department of Mechanical Engineering
Indian Institute of Technology, Guwahati 781 039, India
E-mail: [email protected]
1Corresponding author, email : [email protected]
1
Page 1 of 42
http://mc.manuscriptcentral.com/nme
International Journal for Numerical Methods in Engineering
Peer Review O
nly
Abstract
A numerical study is carried out on the double-diffusive natural convection in
a vertical porous annulus between two concentric cylinders maintained at constant
temperatures and concentrations. A higher order compact scheme of fourth order
spatial and second order temporal accuracy has been employed to investigate the
flow in the regime −50 ≤ N ≤ 50, 1 ≤ A ≤ 10, 1 ≤ κ ≤ 50, 0 ≤ Ra ≤ 5000
and 1 ≤ Le ≤ 500, where N , A, κ, Ra and Le are the buoyancy ratio, aspect
ratio, radius ratio, thermal Rayleigh number and the Lewis number respectively.
Comparison with established results is generally good. Some hitherto unreported
parameter domains have been investigated. For the first time a higher order compact
algorithm has been extended to a problem of combined heat and mass transfer.
Keywords: HOC, double-diffusive, convection, porous.
PACS numbers: 44.30.+v, 47.11.+j, 83.85.pt, 44.25.+f.
1 INTRODUCTION
The phenomenon of natural convection in fluid saturated porous medium due to the com-
bined effects of temperature and concentration gradients can be found quite extensively,
both in nature and technology. Technological applications include grain storage installa-
tions, migration of moistures through air contained in fibrous insulation, energy storage
in solar ponds, contaminant transport in saturated soils and underground disposal of nu-
clear waste. Double-diffusive flows in porous media are also seen in geophysical systems,
electrochemistry and metallurgy. All these factors have contributed to the recent growth
of interest in the study of this phenomenon, either experimental or theoretical. Since
2
Page 2 of 42
http://mc.manuscriptcentral.com/nme
International Journal for Numerical Methods in Engineering
Peer Review O
nly
analytical results could be found only for a very small range of the large numbers of
parameters present in the governing equations, numerical simulation has been the most
popular choice for this physical configuration. Moreover, recent advances in numerical
techniques has made possible computations for those range of parameters, which have so
far been beyond the reach of analytical or numerical studies.
Earlier, most of the theoretical, experimental or numerical studies in natural convec-
tion in porous media were confined mainly to double-diffusion in rectangular cavities.
For example, Trevisan and Bejan [14, 15] investigated heat and mass transfer by natu-
ral convection in a rectangular cavity subjected to various boundary conditions. They
developed an analytical Oseen-linearized solution for the boundary layer regime valid for
Lewis number Le = 1, and a similarity solution for heat-transfer-driven flows for Le > 1.
Apart from these, an extensive series of numerical experiments had also been carried
out by them to validate the analytical results and provide heat and mass transfer data
for the domain not covered by analysis. Recently, Alavyoon and his co-workers have re-
investigated the case considered in ref. [15] for aiding (N > 0) [1] and opposing (N < 0)
[2] heat and mass fluxes, N being the buoyancy ratio. Besides applying scale analysis to
the two extreme cases of heat- and solute-driven natural convection, they also obtained
analytical solutions, valid for stratified flow in slender cavities. More recently, Mamou et
al. [5] have demonstrated the existence of multiple steady solutions for square cavities
for opposing flows. They have further discussed the effect of the governing parameters on
the domain of existence of these multiple solutions. Also, flow structure and convective
heat transfer in a vertical porous annulus under the condition of constant heat flux or
isothermal heating or cooling along the vertical side walls have been analyzed earlier both
experimentally and numerically, but only for a single component (i.e., either temperature
3
Page 3 of 42
http://mc.manuscriptcentral.com/nme
International Journal for Numerical Methods in Engineering
Peer Review O
nly
or concentration gradient). For example, theoretical and numerical studies of Havstad and
Burns [4], the experimental studies of Reda [11] and the series of experimental [9, 10] and
numerical [7, 8] studies by Prasad and co-workers were all confined to natural convection
due to temperature gradients only.
Thus, it is seen that most of the earlier investigatiors mainly focussed their attention
either on the study of double-diffusive natural convection in two-dimensional rectangular
cavities or of natural convection due to temperature gradient only in a vertical porous
annulus. However, the rectangular models do not always adequately represent the more
practical situations in which the cavity is a porous annulus bounded by two vertical
concentric cylinders. Likewise, in fluid mixtures saturating the porous media, where the
variation of fluid density is induced by both temperature and solute, the dynamics of heat
and mass transfer can be very different from those driven by temperature distribution
only. The present study investigates numerically the double-diffusive natural convection
in a porous medium bounded by two vertical coaxial cylinders for a wide range of the
parameters governing the flow. Special emphasis has been given to simulation of the flow
in the annulus for an aspect ratio A = 5. It is seen that, in most of the numerical studies
for this physical configuration [12, 13, 6, 3], spatially second-order accurate schemes, with
some form of the pressure-correction algorithms by Patankar [16] have been used. The
present study which uses a (9, 9) transient higher-order compact (HOC) scheme [20] is
the only attempt till date where an HOC algorithm has been applied to simulate flow
involving both heat and mass transfer. The work has two main objectives: firstly, to test
the efficiency of the present HOC scheme for the flow configuration under consideration
and secondly to compute the flow features for certain domains of the flow parameters not
explored earlier. It is found that the results obtained here on relatively coarser grids, as
4
Page 4 of 42
http://mc.manuscriptcentral.com/nme
International Journal for Numerical Methods in Engineering
Peer Review O
nly
can be expected of an HOC scheme, compare very well with numerical results wherever
available.
This paper is organized in five sections. Section 2 describes the problem, section 3
briefly describes the basic numerical scheme and discretization of the governing equations,
section 4 deals with results and discussion, and section 5 includes the concluding remarks.
2 THE PROBLEM
The problem considered here is the flow in a rigid cylindrical annulus of height H, whose
inner and outer radii are r′i and r
′o respectively, as shown in figure 1. The annulus is filled
with a fluid saturated porous medium. All boundaries of the annular cavity are imper-
meable and the inner and outer walls are maintained at different uniform temperatures
T′h and T
′c (T
′h > T
′c), and concentrations S
′h and S
′c (S
′h > S
′c) respectively. The top and
bottom boundaries of the enclosure are insulated and in the porous medium Darcy’s law
is assumed to hold. The classical hypotheses used in this study are: (i) the Dufour effect
(heat flux produced by concentration gradient) is ignored, (ii) the Soret effect (mass flux
produced by temperature gradient) is ignored and (iii) the fluid is assumed to be a Boussi-
nesq fluid, i.e. both the porous matrix and the saturating fluid are incompressible, and
all thermo-physical properties of the medium are constant, except density of the mixture
which varies linearly with temperature and concentration as:
ρ(T′, S
′) = ρr
[1− βT
(T′ − T
′r
)− βS
(S′ − S
′r
)](1)
where ρr is the density at T′= T
′r and S
′= S
′r and, βT , βS are the thermal and solutal
expansion coefficients respectively.
Under these assumptions, the equations governing the conservation of mass, momen-
5
Page 5 of 42
http://mc.manuscriptcentral.com/nme
International Journal for Numerical Methods in Engineering
Peer Review O
nly
tum, heat and concentration in cylindrical polar co-ordinates (r′, z
′) can be written (see
[3]) as
∂
∂r′(r′u′)
+∂
∂z′(r′w′)
= 0, (2)
u′= −K
µ
∂p′
∂r′, (3)
w′= −K
µ
(∂p
′
∂z′+ ρg
), (4)
σ∂T
′
∂t′+ u
′ ∂T′
∂r′+ w
′ ∂T′
∂z′= α∇′2
T′, (5)
ε′ ∂S
′
∂t′+ u
′ ∂S′
∂r′+ w
′ ∂S′
∂z′= D∇′2
S′
(6)
where
∇′2=
∂
r′∂r′
(r′ ∂
∂r′
)+
∂2
∂z′2
and u′, w
′, K, µ, p
′, ρ, g, T
′, S
′, α, D and ε
′indicate r
′and z
′components of Darcy ve-
locity, permeability of the porous medium, fluid viscosity, pressure, fluid density, gravita-
tional acceleration, temperature, concentration, thermal diffusitivity, solutal diffusitivity
and porosity of the porous medium respectively. The heat capacity σ is defined as
σ =ε′(ρC)f +
(1− ε
′)(ρC)p
(ρC)f
where (ρC)f and (ρC)p are the heat capacity of the fluid and the saturated porous medium
respectively.
The boundary conditions for the governing equations are
r′= r
′i : T
′= T
′h, S
′= S
′h, u
′= 0. (7)
6
Page 6 of 42
http://mc.manuscriptcentral.com/nme
International Journal for Numerical Methods in Engineering
Peer Review O
nly
r′= r
′o : T
′= T
′c , S
′= S
′c, u
′= 0. (8)
z′= 0, H :
∂T′
∂z′=
∂S′
∂z′= 0, w
′= 0. (9)
Introducing the dimensionless variables,
(r, z) =(r′, z
′)
H,
(u, w) =(u
′, w
′)H
α,
t =t′α
H2σ,
p =p′H2
ρα2,
T =T′ − T
′r
∆T ′ , S =S′ − S
′r
∆S ′ ,
T′r =
T′h + T
′c
2, S
′r =
S′h + S
′c
2,
∆T′= T
′h − T
′c and ∆S
′= S
′h − S
′c,
the non-dimensional governing equations may be written as
∂
∂r(ru) +
∂
∂z(rw) = 0, (10)
u = −∂p
∂r, w = −∂p
∂z+ Ra (T + NS) , (11)
∂T
∂t+ u
∂T
∂r+ w
∂T
∂z= ∇2
1T, (12)
ε∂S
∂t+ u
∂S
∂r+ w
∂S
∂z=
1
Le∇2
1S (13)
7
Page 7 of 42
http://mc.manuscriptcentral.com/nme
International Journal for Numerical Methods in Engineering
Peer Review O
nly
with ∇21 =
1
r
∂
∂r
(r
∂
∂r
)+
∂2
∂z2. The dimensionless boundary conditions are
r =1
A(κ− 1): T = 0.5, S = 0.5, u = 0, (14)
r =κ
A(κ− 1): T = −0.5, S = −0.5, u = 0, (15)
z = 0, 1 :∂T
∂z=
∂S
∂z= 0, w = 0 (16)
where A =H
r′o − r′i
is the aspect ratio defining the slenderness of the cavity, κ =r′o
r′i
is the
radius ratio, Ra =KgβT ∆T
′H
να(ν being the kinematic viscosity) is the thermal Rayleigh
number, N =βS∆S
′
βT ∆T ′ is the buoyancy ratio measuring the relative significance of species
and thermal diffusion, Le =α
Dis the Lewis number representing the ratio between the
thermal and solutal diffusivities and lastly, ε =ε′
σis the normalized porosity of the porous
medium. It may be mentioned that in the expressions for N , the thermal expansion
coefficient βT is positive for most of the fluids at ordinary temperature and pressure,
whereas the solutal expansion coefficient βS can also be negative which indicates opposing
flow. Now introducing dimensionless stream-function ψ defined by
u = −1
r
∂ψ
∂z, w =
1
r
∂ψ
∂r, (17)
the equations (10) and (11) can be written as
∂2ψ
∂r2− 1
r
∂ψ
∂r+
∂2ψ
∂z2= rRa
(∂T
∂r+ N
∂S
∂r
)(18)
with ψ = 0 on the boundaries. Thus equations (12), (13), (17) and (18) together with the
boundary conditions (14)-(16) completely define the problem in terms of the dimensionless
parameters A, κ, Ra, Le, N and ε.
8
Page 8 of 42
http://mc.manuscriptcentral.com/nme
International Journal for Numerical Methods in Engineering
Peer Review O
nly
In most of the engineering applications, the overall heat and mass transfer characteris-
tics are summarized by the Nusselt number Nu and the Sherwood number Sh respectively.
The local Nu and Sh along the inner radial wall is defined by
Nui =∂T
∂r
∣∣∣∣∣r= 1
A(κ−1)
(19)
and
Shi =∂S
∂r
∣∣∣∣∣r= 1
A(κ−1)
(20)
Integrating these local Nu and Sh along the inner radial wall, the average Nusselt number
Nu and the average Sherwood number Sh are obtained as
Nui =∫ 1
0Nuidz (21)
and
Shi =∫ 1
0Shidz (22)
The corresponding values at the outer wall are given by
Nuo =Nui
κ(23)
and
Sho =Shi
κ. (24)
3 THE BASIC NUMERICAL SCHEME AND DIS-
CRETIZATION OF THE GOVERNING EQUA-
TIONS
The recently developed HOC scheme by Kalita et al. [20] for unsteady convection-diffusion
equation for variable convection coefficient has been specially adapted and employed to
9
Page 9 of 42
http://mc.manuscriptcentral.com/nme
International Journal for Numerical Methods in Engineering

Peer Review O
nly
discretize the governing equations, viz., (12), (13) and (18). The scheme is briefly dis-
cussed below.
The unsteady two-dimensional convection-diffusion equation for a transport variable φ
in some domain can be written as
a∂φ
∂t−∇2φ + c(x, y, t)
∂φ
∂x+ d(x, y, t)
∂φ
∂y= g(x, y, t), (25)
where a is a constant, c and d are the convection coefficients, and g is a forcing function.
The (9, 9) HOC scheme [20] for this equation with accuracy O ((∆t)2, h4, k4) is given by:
a
[1 +
h2
12(δ2
x − cijδx) +k2
12(δ2
y − dijδy)
]δ+t φn
ij −1
2
[αijδ
2x + βijδ
2y − Cijδx −Dijδy
+h2 + k2
12
(δ2xδ
2y − cijδxδ
2y − dijδ
2xδy − γijδxδy
)] (φn
ij + φn+1ij
)
=1
2
(Gn
ij + Gn+1ij
), (26)
where δ+t denotes the forward difference operator for time with step ∆t, and δx, δy are
the central difference operators in the space directions x and y with uniform step lengths
h and k respectively. The coefficients αij, βij , γij, Cij, Dij and Gij are given by:
αij = 1 +h2
12(c2
ij − 2δxcij), (27)
βij = 1 +k2
12(d2
ij − 2δydij), (28)
γij =2
h2 + k2
(h2δxdij + k2δycij
)− cijdij, (29)
Cij =
[1 +
h2
12(δ2
x − cijδx) +k2
12(δ2
y − dijδy)
]cij, (30)
Dij =
[1 +
h2
12(δ2
x − cijδx) +k2
12(δ2
y − dijδy)
]dij, (31)
Gij =
[1 +
h2
12(δ2
x − cijδx) +k2
12(δ2
y − dijδy)
]gij, (32)
10
Page 10 of 42
http://mc.manuscriptcentral.com/nme
International Journal for Numerical Methods in Engineering
Peer Review O
nly
Here, it is assumed that the convection coefficients c, d and the forcing function g are
sufficiently smooth, and either the analytical expressions for them or the discrete approx-
imations together with their derivatives are known a priori.
As the governing equations are in cylindrical polar co-ordinates, they are restructured
so as to fit into the unsteady HOC scheme [20]. For example, the concentration equation
(13) can be written as
εLe∂S
∂t+
(Leu− 1
r
)∂S
∂r+ Lew
∂S
∂z−∇2S = 0 (33)
where ∇2 =∂2
∂r2+
∂2
∂z2. Similar expressions can be found for the other governing equa-
tions as well. Firstly equation (18) is solved; then the value of ψ is used to calculate the
values of u and w from (17) using a fourth order compact approximation [20]. The values
of u and w found in this way are used in (12) and (13) to find T and S.
The boundary conditions for temperature and concentration in the present configura-
tion are Dirichlet for the vertical walls and Neumann for the horizontal ones. Jensen’s
4th order accurate one sided formula [18] is used for the Neumann boundary conditions
as well as for the derivatives appearing in the expressions for local Nu and Sh.
Flow simulations are carried out using grid sizes ranging from 21×21 to 65×641 depend-
ing upon the aspect ratio A. The time marching strategy is adopted till a steady-state is
reached. At every time step BiCG algorithm [17, 19] has been used for all the equations.
The convergence criterion for the inner iterations are set at maxij|φold − φnew| < 10−5 where
φ is a variable for which solution is sought. The steady-state is assumed to be reached
when for the outer iterations, maxij|φ(n+1) − φ(n)| < 10−7, n standing for the time level.
11
Page 11 of 42
http://mc.manuscriptcentral.com/nme
International Journal for Numerical Methods in Engineering
Peer Review O
nly
4 RESULTS AND DISCUSSIONS
For the present flow configuration, six non-dimensional parameters, viz. aspect ratio A,
radius ratio κ, Lewis number Le, buoyancy ratio N , normalized porosity ε and the thermal
Rayleigh number Ra are important. In the actual calculations, ε is set to unity. Because of
the presence of so many parameters, an extensive parametric investigation of the problem
is beyond the scope of this study. As such, the large number of computations that has
been reported in this paper for all the parameters involved, represents only a sample of
the full blown parametric investigation. It is found that, higher the absolute values of
the parameters, greater the complexities associated with the flow, both in physics and
numerics. This could be one of the reasons why the higher values of the parameters were
not attempted in the earlier computations, most of which were carried out with lower-order
accurate schemes. Contrary to this, the high accuracy of the present scheme coupled with
the compactness of the difference stencils affords highly efficient and accurate simulation
of the flow for a wide range of the parameters on relatively coarser grids. Computations
carried out in this paper are for −50 ≤ N ≤ 50, 1 ≤ A ≤ 10, 1 ≤ κ ≤ 50, 0 ≤ Ra ≤ 5000
and 1 ≤ Le ≤ 500. Some of the ranges of the parameters have not been explored earlier
probably because of computational difficulties.
4.1 Validation of Algorithm and Code
There are very few experimental or numerical data available for the parameters considered
in the present study. Therefore, the validation of the present algorithm is first done
through a comparison exercise for a range of parameters for which reliable qualitative and
quantitative numerical results [3, 8] are available. The parameters chosen are Ra = 500,
12
Page 12 of 42
http://mc.manuscriptcentral.com/nme
International Journal for Numerical Methods in Engineering

Peer Review O
nly
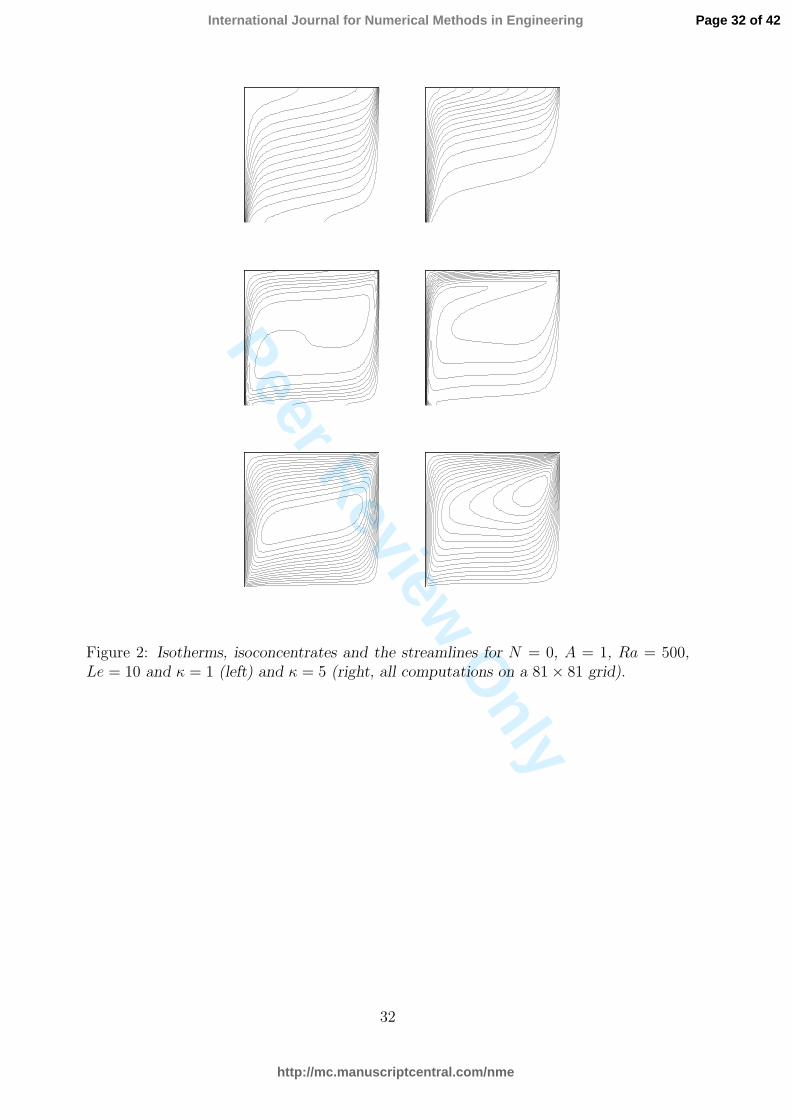
N = 0, Le = 10, A = 1, and κ = 1 and 5, which represents two cases for which
the validation exercise is carried out. Grid-independent results of the present algorithm
for the maximum stream-function value is compared with those of [3] in Table I. The
corresponding isotherms and, isoconcentration and stream-function contours for the two
cases are shown in figure 2 and they are very similar to those reported by, for example,
Beji et al. [3] and Prasad and Kulacki [7]. The close comparison thus lends confidence in
the present algorithm and code, which can be used now for the range of parameters not
explored earlier. Also demonstrated in Table I is a notable merit of the present algorithm
in that grid-independent results for the two cases are obtained on grids as coarse as 41×41.
4.2 Influence of Aspect Ratio
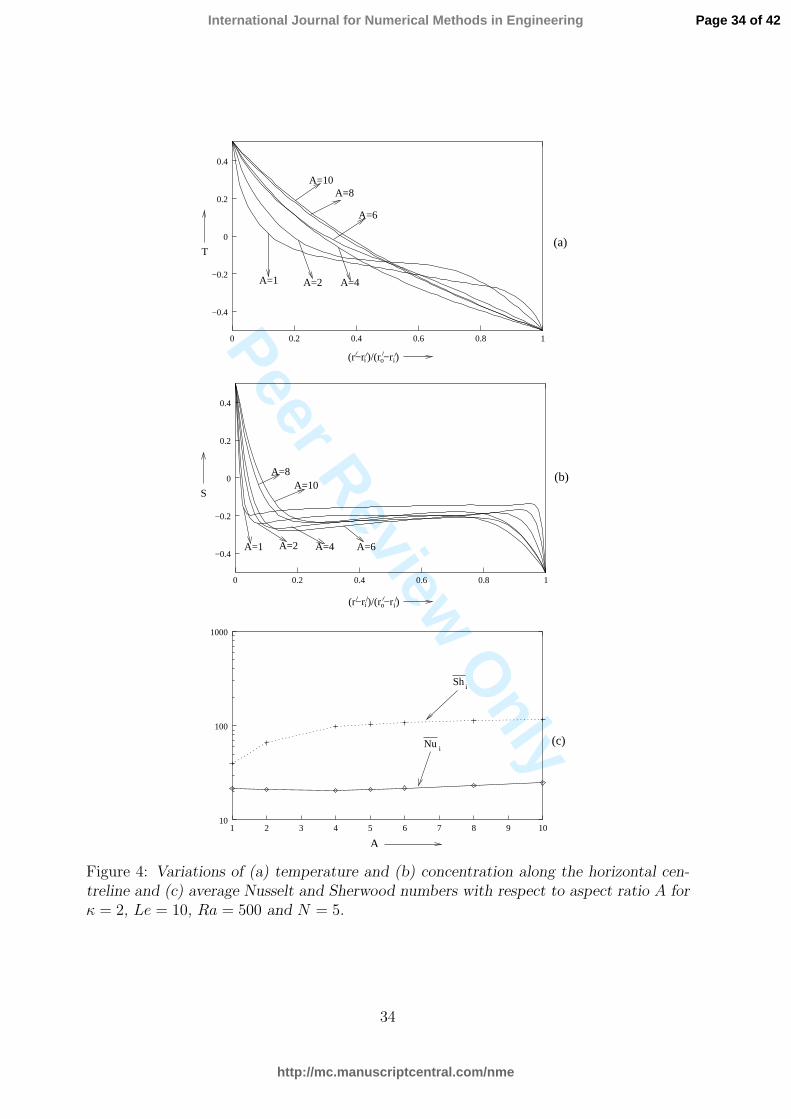
The results for aspect ratios varying from 1 to 10 are presented in figures 3 and 4 for
Ra = 500, κ = 2, Le = 10 and N = 5. For A > 5, Ra and N considered in the present
study are much higher than those of earlier studies [6, 7]. As the value of the buoyancy
ratio N signifies, the flow is driven by moderately high solutal gradients. At A = 1 and
2 [figures 3 (a) and (b), centre] the concentration field is rather uniform at the central
part of the cavity and gradients are sharper near the horizontal walls. Stratification of
the flow is observed as A increases [figure 3 (centre)]. Figure 4 (b) also confirms this
fact where it can be seen that isoconcentrates spread further away from the vertical walls
as A increases. It is seen from the same figure that as radius increases, concentration
sharply drops near the inner wall and remain more or less same thereafter until it drops
further in the vicinity of the outer wall. Obviously, the mass species boundary layers are
thinner than the thermal boundary layers because of the lower diffusivity of mass species
[figure 3 (top and centre)]. With the increase in A, the isotherms from a roughly diagonal
13
Page 13 of 42
http://mc.manuscriptcentral.com/nme
International Journal for Numerical Methods in Engineering
Peer Review O
nly
shape, become more and more vertical [figure 3 (top)]. At high aspect ratio (particularly
at A = 8 to 10), the temperature at the core of the cavity varies almost linearly in the
horizontal direction [figure 4 (a)]. Here, the temperature profile nearly looks like that of
pure conduction. Figure 4 (c) shows the variation of Nui and Shi numbers with aspect
ratio. It is seen that the Shi approaches a constant value asymptotically. Nui shows
a decreasing trend till about A = 4 and increasing trend thereafter. With the increase
in A, hydrodynamic boundary layers at the top and bottom walls become thicker and
the vortex centre shifts slightly toward the upper region [figures 3 (a)-(f)]. Also the flow
becomes weaker, which is indicated by the fall in the value of |ψmax|. Hydrodynamic
boundary layers grow at the vertical walls with the layer being more prominent at the
cold wall.
4.3 Influence of Radius Ratio
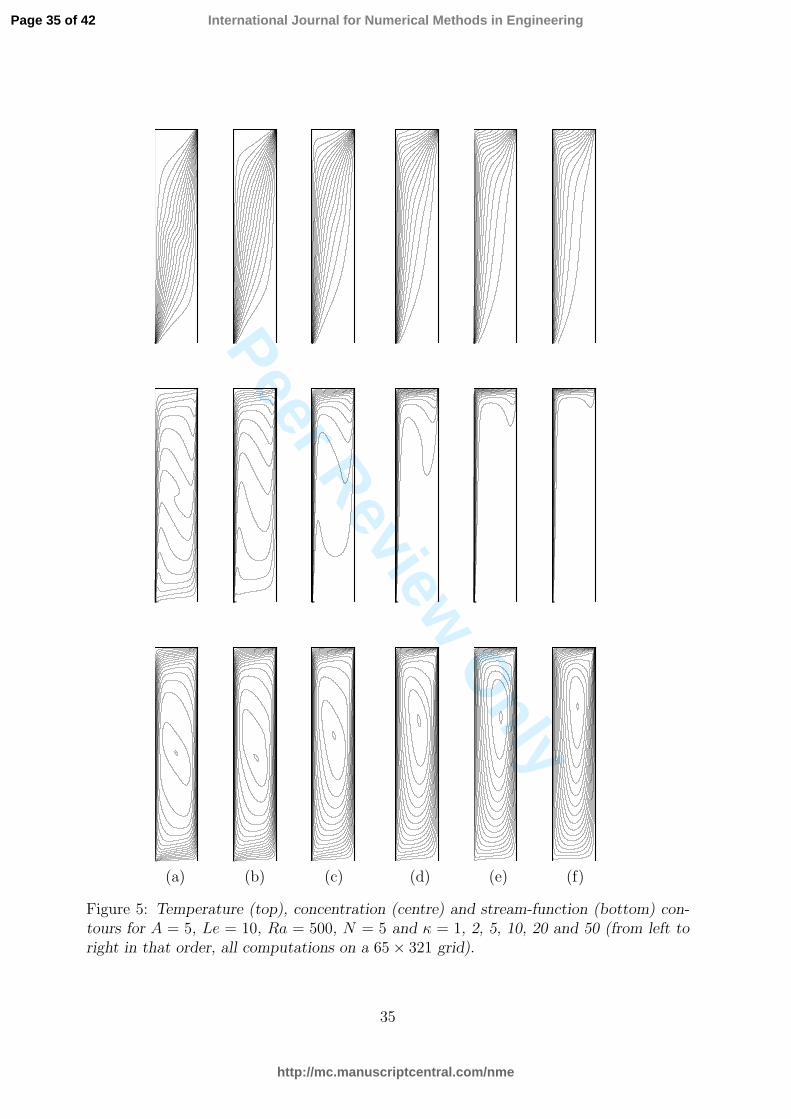
Computations are carried out in the range 1 ≤ κ ≤ 50 for A = 5, Le = 10, Ra = 500 and
N = 5. The influence of increasing radius ratio is to impart asymmetry to the flow. As
can be seen from figure 2 (left) and figure 5 (a), for κ=1, a centrosymmetry exists about
the geometric centre of the cavity. With the increase in κ the centre of the primary vortex
moves towards the top right of the cavity [figures 2 and 5 (bottom)]. Also, the strength
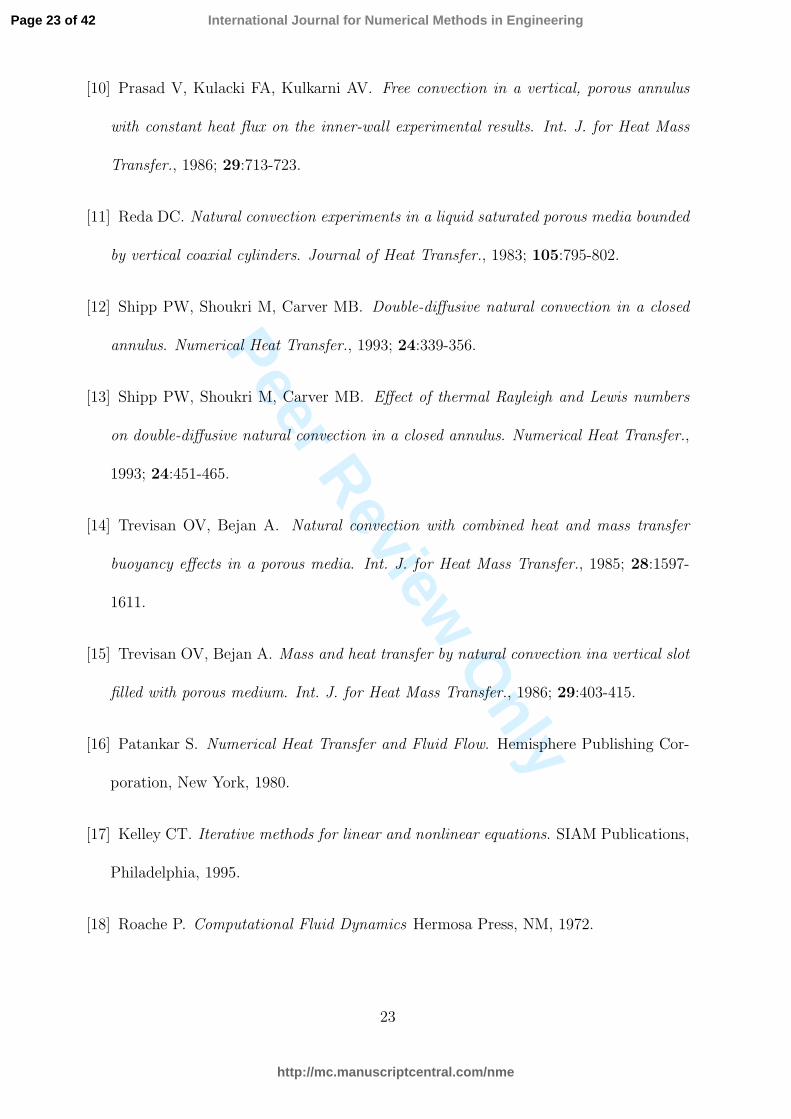
of the flow is reduced as seen from the value of |ψmax| shown in Table II. The increasingly
asymmetric behaviour of the temperature and concentration field shifts causes greater
changes in the stream-line pattern in the upper part of the annulus. As can be seen from
figure 5 (top), at κ = 1, the thermal boundary layers exist at the top right and bottom left
regions of the annulus. With the increase in κ they become more prominent on the hot
(inner) wall and less prominent on the cold (outer) wall. Also from the isoconcentrates
14
Page 14 of 42
http://mc.manuscriptcentral.com/nme
International Journal for Numerical Methods in Engineering

Peer Review O
nly
[figure 5 (centre)], it is seen that normal concentration gradients near the hot wall increase
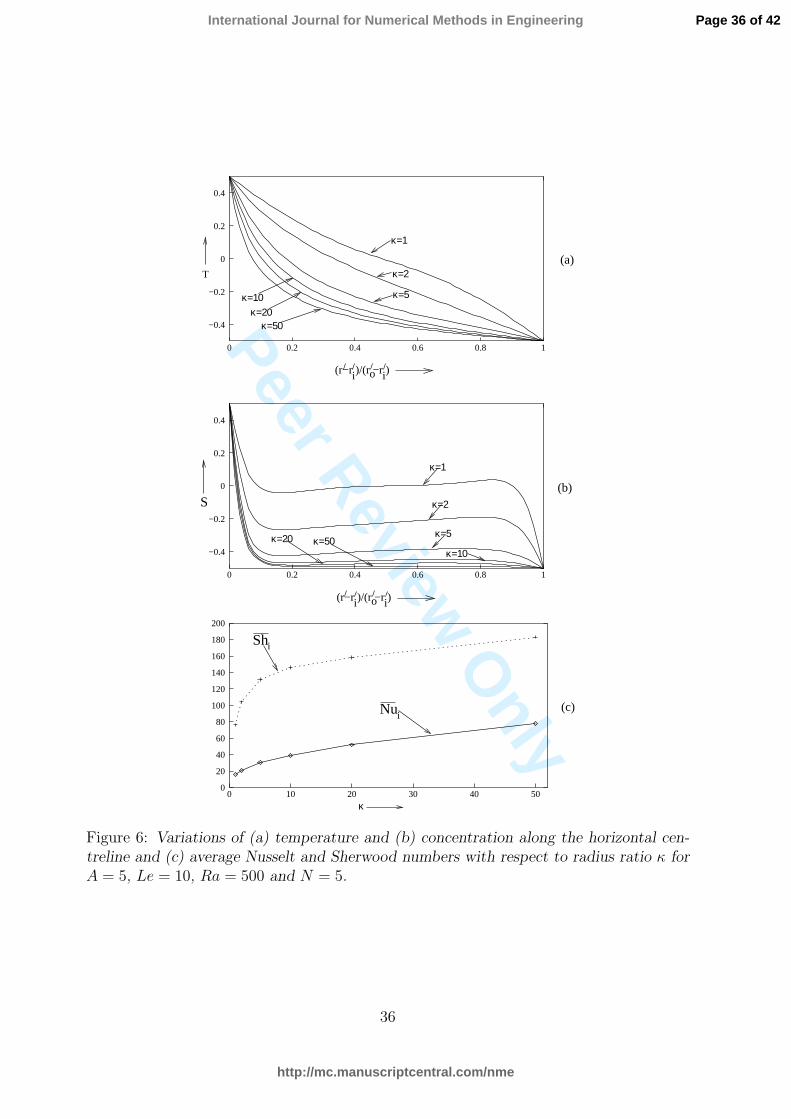
while the reverse happens at the cold wall. Temperature variation along the horizontal
centreline is found to be almost linear at the core of the annulus for small κ and the
curvature increases with κ [figure 6 (a)]. At the core, the concentration remains largely
constant and decreases sharply to the value of -0.5, as κ increases. The high concentration
gradients near the top and the hot walls [figure 5 (middle)] indicate high mass transfer, and
high temperature gradients near the hot wall [figure 5 (top)] indicates high heat transfer
in those regions and these effects increase with κ. This is confirmed by the increasing
values of Nui and Shi [figure 6 (c)] with κ. It may be mentioned that in the earlier
studies, the simulations were confined only up to κ = 10 [6, 3].
4.4 Influence of Lewis Number
The parameters other than Le, viz., N , Ra, κ and A have been kept constant at 1, 500,
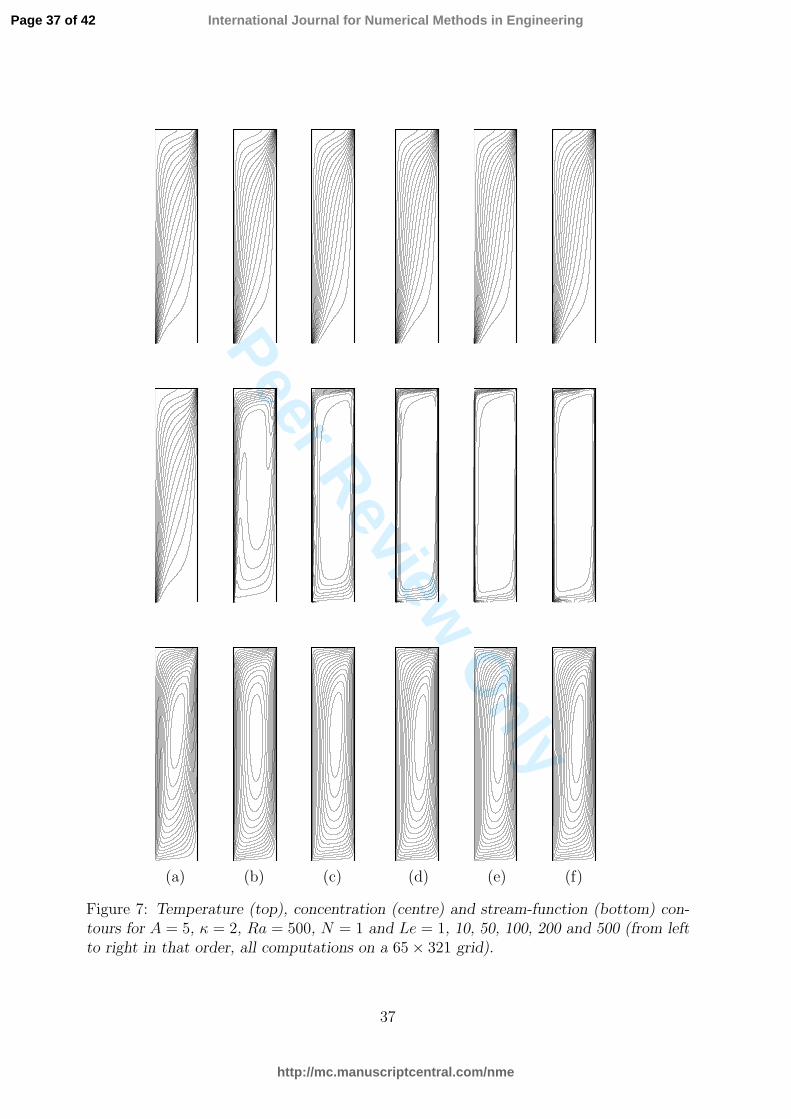
5 and 5 respectively. When Le = 1, the thermal diffusion equals the solutal diffusion and
the isotherms and isoconcentrates are identical [figure 7 (a)]. With increase in Le, concen-
tration boundary layers become sharper [figure 7 (centre)] whereas there is little change
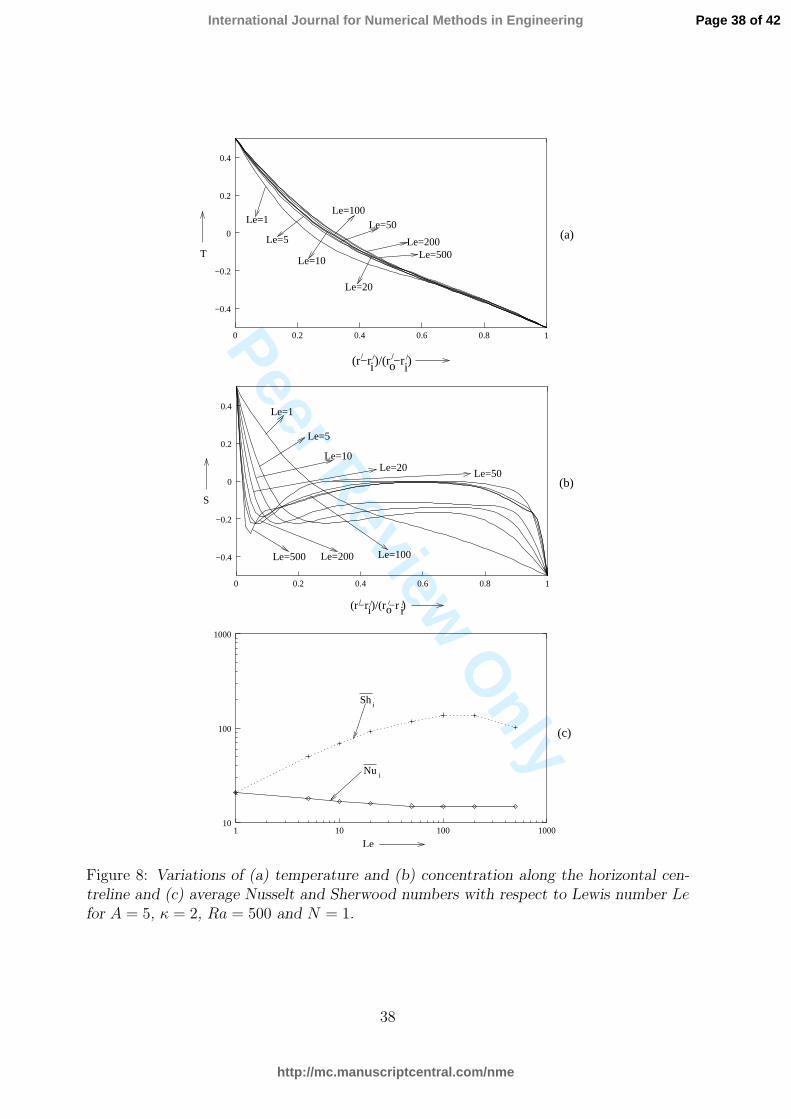
in the isotherm patterns [figure 7 (top)]. These facts are also evidenced in the centreline
temperature and concentration distributions [figures 8 (a) and (b)] where for Le ≥ 5, the
temperature distribution is almost identical whereas the concentration boundary layers
are seen thinning with increasing Le, particularly on the hot wall. At high Le’s, as the
mass diffusivity is much lower than the thermal diffusivity, the horizontal intrusion layers
of concentration at the top and the bottom are considerably sharper than their thermal
counterpart. As a result of this, the core of the concentration field at higher Le’s is in
a state of almost uniform concentration [figure 7 (b)-(f) (centre)]. Also, with increase in
15
Page 15 of 42
http://mc.manuscriptcentral.com/nme
International Journal for Numerical Methods in Engineering
Peer Review O
nly
Le, there is a shift of the vortex centre toward the cold wall and hydrodynamic bound-
ary layers thin down on the cold wall and thicken at the hot wall. The maximum Le
in the present study (viz., 500) is much greater than what was considered by the earlier
investigations [3, 1, 6] for this aspect ratio. From figure 8 (c) it is seen that up to about
Le = 100, Shi shows an increasing trend and a decreasing trend thereafter. Same fig-
ure shows that up to about Le = 50, Nui shows a decreasing trend and remains almost
constant thereafter.
4.5 Influence of Buoyancy Ratio
Results are presented here for a wide range of Buoyancy ratios, viz., −50 ≤ N ≤ 50 with
κ, Le, Ra and A fixed at 2, 10, 500 and 5 respectively. As a result of the thermal and
solutal boundary conditions assumed here, the direction of the thermal flow is clockwise,
whereas the direction of the solutal flow depends upon the sign of the expansion coefficient
βs, so that for N > 0 it is clockwise and for N < 0 it is anticlockwise. Though the range
of buoyancy ratios explored here is also claimed to have been investigated in ref. [3],
no qualitative or quantitative results are presented for |N | = 50 in that study. For
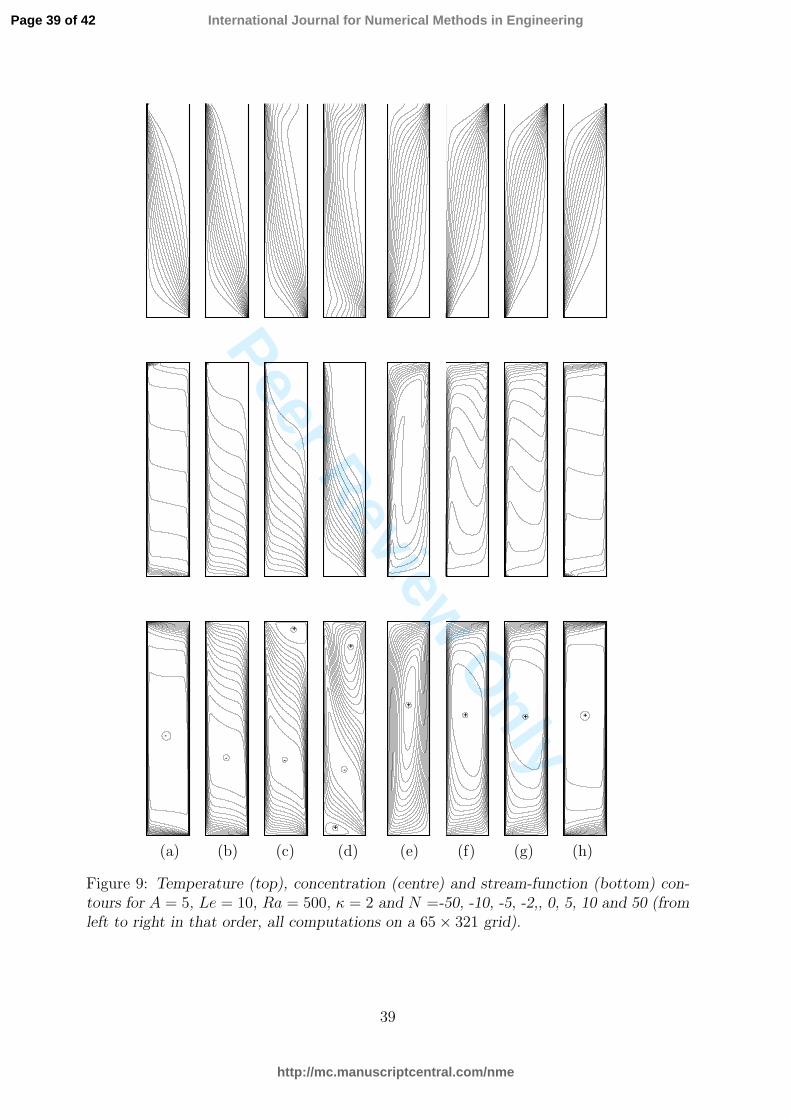
N ≥ 0, figures 9 (f)-(h) represent a selection of the simulated double-diffusive flows under
the influence of mutually aiding effects of both the temperature and solute gradients. For
|N | << 1, the buoyancy forces that drives the fluid motion are mainly due to the gradients
in temperature. At N = 0, effects of concentration does not exist [figure 9 (e)] and the
resulting flow pattern is that of pure heat transfer. That for N > 0, the mass species
and thermal buoyancy forces augment each other, is also seen from Table III through the
maximum and minimum values of ψ. Development of boundary layers is also seen with
increase in N . For larger values of N , a large portion of the core of the annulus is seen to
16
Page 16 of 42
http://mc.manuscriptcentral.com/nme
International Journal for Numerical Methods in Engineering
Peer Review O
nly
be stagnant [figure 9 (h)] because of the blocking effect of the combined effects of vertical
concentration and temperature gradients.
The typical features of opposing double-diffusive flow can be seen from figures 9 (a)-(d).
On lowering the buoyancy ratio to -2, one counterclockwise rotating cell in the core region
and two clockwise rotating cells develop on the top and bottom of the annulus. When N
is further decreased to -5, the lower clockwise cell is annihilated and with further decrease
in N , only the counterclockwise cell remains with development of boundary layers which
become prominent at N = −50. The effects of multiple cell formation at N = −2 are
seen to modify the pattern of the isotherms and isoconcentrates. With decreasing N ,
the isotherm pattern changes from vertical to diagonal. The vertical pattern at N = −2
indicates that the side-to-side heat transfer process is almost ruled by pure diffusion; at
N = −50, the thermal field at the upper and lower parts of the annulus is now fairly
homogeneous, whereas in the core, it is observed to be diagonal. The same can be said
about the isoconcentrates for N = −2. With further decrease in N , the flow becomes
more stratified.
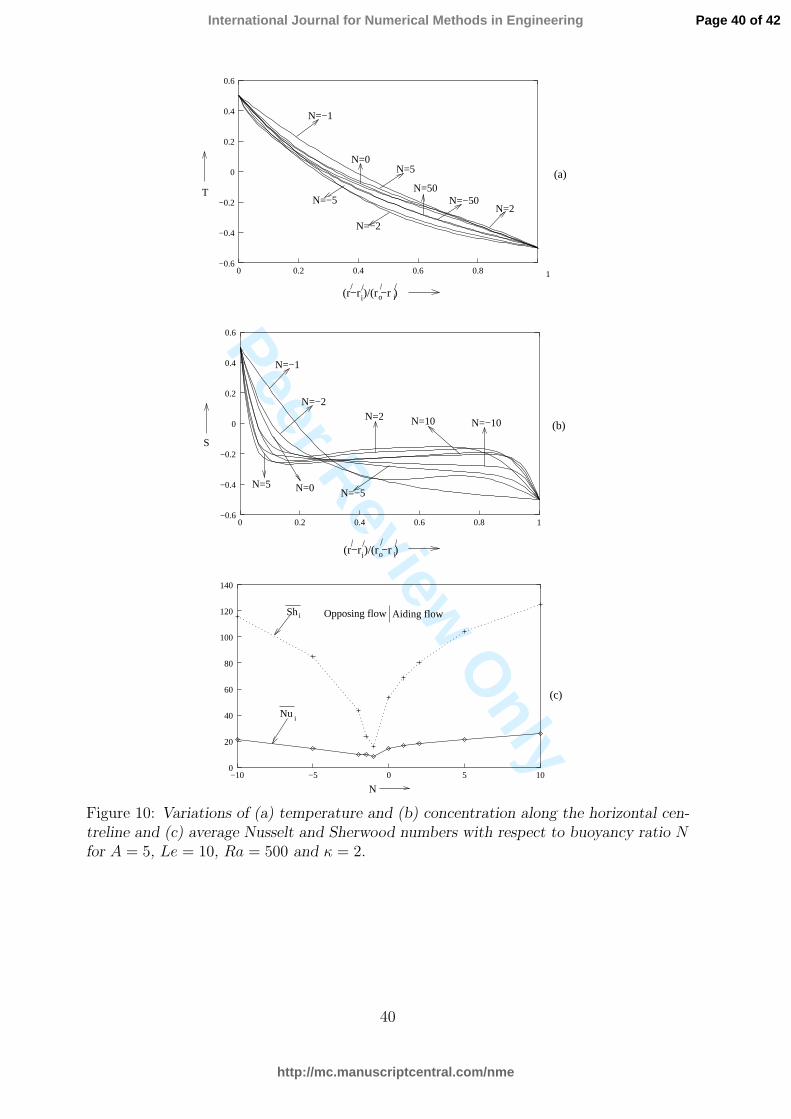
From the temperature distribution along the horizontal centreline [figure 10 (a)], it
is seen that as |N | increases the curves corresponding to the respective positive and
negative values come increasingly close to each other and for |N | = 50, they almost merge
into one. The temperature profile looks almost like that of a pure conduction regime.
This is because of the relatively stagnant core for this kind of flow. For high |N |, the
horizontal centreline concentration profile seems to remain constant within the core region
[figure 10 (b)]. This is because of weaker mass species diffusivity (Le = 10), in which the
mass species gradients cannot penetrate the stagnant core as far as the thermal gradients.
The effect of buoyancy ratio on Nui and Shi can be observed from figure 10 (c). They
17
Page 17 of 42
http://mc.manuscriptcentral.com/nme
International Journal for Numerical Methods in Engineering
Peer Review O
nly
tend to remain minimum in the transitional range of N , where the flow reversal is about
to take place. Expectedly, Nui for a certain |N | is less when the flow is opposing (N < 0)
than when it is aiding (N > 0). This is also true for Shi; however, the relative difference for
corresponding aiding and opposing buoyancy ratios is lower. This difference is attributed
to the fact that the opposing flow has a lower flow rate adjacent to the enclosure walls
than does the corresponding aiding flow.
Many of the trends observed for this configuration are in keeping with the observation
of earlier studies. For example, flow patterns in the sub-range −5 ≤ N ≤ 5 shown in
figures 9 (c)-(f) are very close to those presented in ref. [3]. This can also be seen in
Table III where the quantities within the parenthesis represent those available in ref. [3].
It can be seen that except for ψmax for N = −5, where there is a significant difference
between the results, elsewhere our results seem to be agreeing well with those of ref. [3].
Again, the trends for Nui and Shi distribution shown in figure 10 (c) resembles the ones
presented for rectangular annulus in [12].
4.6 Influence of Thermal Rayleigh Numbers
Computations are carried out for the range of Ra from 0 to 5000, keeping the other
parameters A, κ, Le and N fixed at 5, 2, 10 and 5 respectively. The strength of the
general convective movement increases with increasing Ra. This can be seen from the
Nui and Shi distribution in figure 12 (c), indicating increased heat and solute transfer
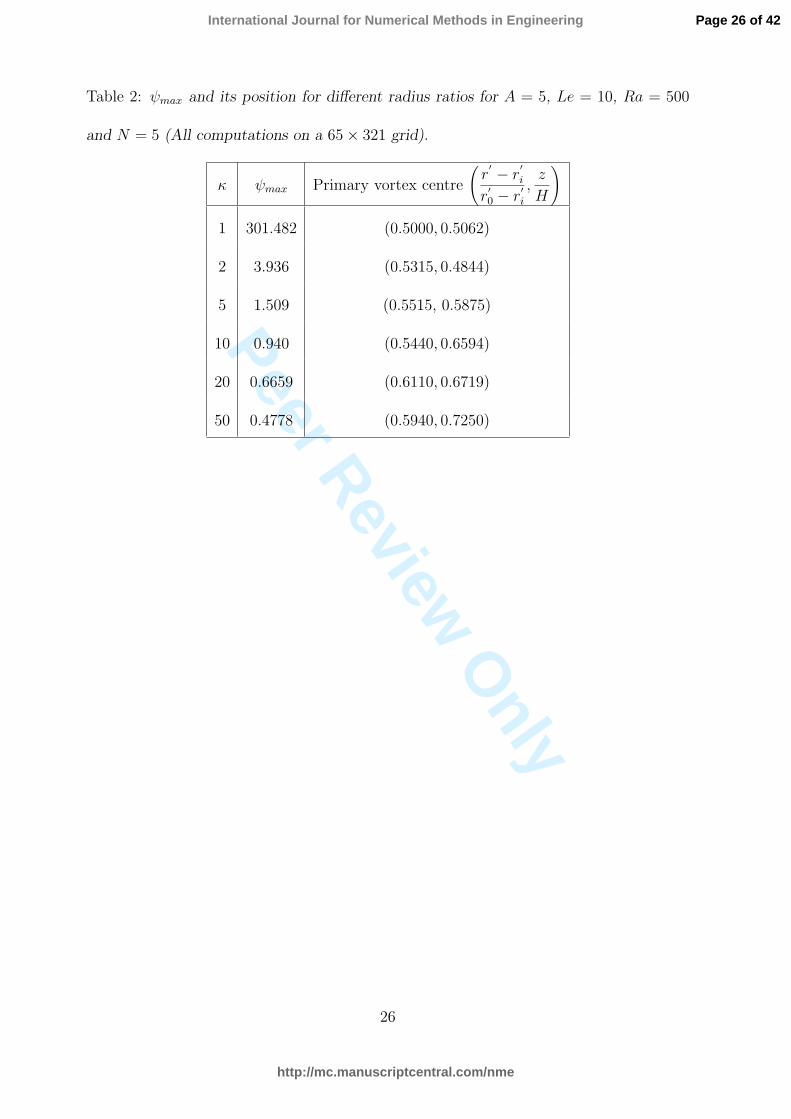
rates at the inner wall and also from the computed ψmax values of Table IV, which indicates
increased flow rate. With increase in Ra, development of hydrodynamic boundary layers
becomes increasingly obvious [figure 11 (bottom)]. The concentration boundary layers
become sharper in the inner wall compared to the outer [figures 11 (centre) and 12 (b)].
18
Page 18 of 42
http://mc.manuscriptcentral.com/nme
International Journal for Numerical Methods in Engineering
Peer Review O
nly
As Ra increases the isotherm pattern undergoes an interesting change [figure 11 (top)]. At
low Ra’s, the isotherms are almost vertical [figures 11 (a)-(c), top] indicating conduction
dominated heat transfer. This fact is also observed from figure 12 (a). As Ra increases
the isotherms become more and more diagonal [figures 11 (d) and (e), top] and at a high
Ra = 5000, they become almost horizontal in the central portion of the annulus. As
expected, with increase in Ra, Nu at the inner wall steadily increases, but Sh generally
approaches a constant value. It may be mentioned that at high Rayleigh numbers such as
Ra = 5000, the computational complexities increase drastically and time-step used must
necessarily be very small. This complexity could be one of the reasons why no results for
such high Ra has been seen for this configuration so far.
5 CONCLUSION
A numerical investigation has been carried out on the problem of thermosolutal convec-
tion in a concentric vertical annulus filled with a porous medium through a transient HOC
scheme of temporally second and spatially fourth order accuracy. The higher-order accu-
racy of the scheme coupled with compactness of the computational stencil affords efficient
computations for a wide range of the parameters governing the flow on relatively coarser
grids. The influences of the aspect ratio A, the radius ratio κ, the buoyancy ratio N , the
Lewis number Le and thermal Rayleigh number Ra on the flow have been investigated.
As the number and range of parameters are quite large, exact comparisons with earlier
work is not always possible. Wherever results of earlier investigations are available, com-
parisons are made and close agreement is observed. For some difficult cases, for example,
for large |N | and Ra, computations for the configuration have been carried out proba-
19
Page 19 of 42
http://mc.manuscriptcentral.com/nme
International Journal for Numerical Methods in Engineering

Peer Review O
nly
bly for the first time, highlighting the efficiency and robustness of the present algorithm.
As the algorithm and code has been carefully validated through a comparison exercise,
and considering the high order of accuracy of the scheme, the new results produced for
difficult cases are expected to be highly reliable. These results are quantified in several
tables which may be used by later investigators to advantage. Based on the study, many
observations can be made by varying one of the parameters κ, A, N , Ra or Le while
keeping the others constant. They are summarized below:
As radius ratio κ increases Nu and Sh increase indicating increased heat and mass
transfer. At κ = 1, there is a centrosymmetry of temperature, concentration and flow,
which is lost as κ increases.
As aspect ratio increases from A = 1, mass transfer indicated by Sh at the inner
wall increases gradually and at higher values like A = 5 and beyond, it remains almost
constant. Heat transfer represented by Nu exhibits almost a similar behaviour.
Lewis number Le is mainly seen to have an influence on the concentration field. At
lower values there is variation of concentration throughout the cavity; but as Le increases,
the gradients almost completely vanish from the core of the annulus.
Effect of buoyancy ratio N on the behaviour of the solution has been studied in some
details. The flow pattern undergoes some interesting change as the buoyancy ratio changes
sign. When N is positive, thermal and solutal gradients tend to drive the flow in the same
direction producing a clockwise flow pattern. At N = 0 the flow is still clockwise, but
completely thermally driven. As N decreases below zero, solutal gradients start opposing
thermally driven flow first giving rise to an interplay of counter-rotating cells and finally at
still lower values of N (or higher values of |N |) the clockwise rotating cells due to thermal
gradients are completely annihilated and a single anticlockwise flow cell is obtained. Hot
20
Page 20 of 42
http://mc.manuscriptcentral.com/nme
International Journal for Numerical Methods in Engineering
Peer Review O
nly
wall Nu and Sh also exhibit interesting behaviour with the values being minimum for
N close to -1, indicating that opposing effects of thermal and solutal gradients, being
comparable in magnitude, impedes heat and mass transfer greatly. Any increase of |N |
expectedly results in increased activity giving rise to gradual increase of Nu and Sh.
Also studied are the effects of Ra for an aiding flow. Expectedly, increase in Ra aids
heat transfer as seen from the steady rise of Nu with Ra at the inner wall. Mass transfer,
however, appears to stagnate beyond a certain Ra as indicated by an almost constant
value of Sh.
21
Page 21 of 42
http://mc.manuscriptcentral.com/nme
International Journal for Numerical Methods in Engineering
Peer Review O
nly
References
[1] Alavyoon F. On natural convection in vertical porous annulus due to prescribed fluxes
of heat and mass at the vertical boundaries. Int. J. for Heat and Mass Transfer., 1993;
36:2479-2498.
[2] Alavyoon F, Masuda Y, Kimura S. On natural convection in vertical porous annulus
due to opposing fluxes of heat and mass prescribed at the vertical boundaries. Int. J.
for Heat and Mass Transfer., 1994; 36:195-206.
[3] Beji H, Bennacer R, Duval R, Vasseur P. Double-diffusive natural convection in a
vertical porous annulus. Numerical Heat Transfer., 1999; 36:153-170.
[4] Havstad MA, Burns PJ. Convective heat transfer in a vertical cylindrical annuli filled
with a porous medium. Int. J. for Heat Mass Transfer., 1982; 25:1755-1766.
[5] Mamou M, Vasseur P, Bilgen E. Multiple solutions for double-diffusive convection in
a vertical porous annulus. Int. J. for Heat Mass Transfer., 1995; 38:1787-1798.
[6] Marcoux M, Charrier-Mojtabi M-C, Azaiez M. Double-diffusive convection in annular
vertical porous layer. Int. J. for Heat Mass Transfer., 1999; 42:2313-2325.
[7] Prasad V, Kulacki FA. Natural convection in a vertical porous annulus. Int. J. for
Heat Mass Transfer., 1984; 27:207-219.
[8] Prasad V, Kulacki FA. Natural convection in porous media bounded by short concentric
vertical cylinders. Int. J. for Heat Mass Transfer., 1985; 107:147-154.
[9] Prasad V, Kulacki FA, Keyhani M. Natural convection in porous media. Journal of
Fluid Mechanics., 1985; 150:89-119.
22
Page 22 of 42
http://mc.manuscriptcentral.com/nme
International Journal for Numerical Methods in Engineering
Peer Review O
nly
[10] Prasad V, Kulacki FA, Kulkarni AV. Free convection in a vertical, porous annulus
with constant heat flux on the inner-wall experimental results. Int. J. for Heat Mass
Transfer., 1986; 29:713-723.
[11] Reda DC. Natural convection experiments in a liquid saturated porous media bounded
by vertical coaxial cylinders. Journal of Heat Transfer., 1983; 105:795-802.
[12] Shipp PW, Shoukri M, Carver MB. Double-diffusive natural convection in a closed
annulus. Numerical Heat Transfer., 1993; 24:339-356.
[13] Shipp PW, Shoukri M, Carver MB. Effect of thermal Rayleigh and Lewis numbers
on double-diffusive natural convection in a closed annulus. Numerical Heat Transfer.,
1993; 24:451-465.
[14] Trevisan OV, Bejan A. Natural convection with combined heat and mass transfer
buoyancy effects in a porous media. Int. J. for Heat Mass Transfer., 1985; 28:1597-
1611.
[15] Trevisan OV, Bejan A. Mass and heat transfer by natural convection ina vertical slot
filled with porous medium. Int. J. for Heat Mass Transfer., 1986; 29:403-415.
[16] Patankar S. Numerical Heat Transfer and Fluid Flow. Hemisphere Publishing Cor-
poration, New York, 1980.
[17] Kelley CT. Iterative methods for linear and nonlinear equations. SIAM Publications,
Philadelphia, 1995.
[18] Roache P. Computational Fluid Dynamics Hermosa Press, NM, 1972.
23
Page 23 of 42
http://mc.manuscriptcentral.com/nme
International Journal for Numerical Methods in Engineering

Peer Review O
nly
[19] Sleijpen GLG, van der Vorst HA. Hybrid bi-conjugate gradient methods for CFD
problems. Computational Fluid Dynamics Review, edited by M. Hafez and K. Oshima,
1995; 457–476.
[20] Kalita JC, Dalal DC, Dass AK. A class of higher order compact schemes for the
unsteady two-dimensional convection-diffusion equations with variable convection co-
efficients. Int. J. Numer. Methods Fluids, 2002; 38:1111–1131.
[21] Kalita JC, Dass AK, Dalal DC. A transformation-free HOC scheme for steady
convection-diffusion on nonuniform grids. Int. J. Numer. Methods Fluids, 2004; 44:23–
53.
24
Page 24 of 42
http://mc.manuscriptcentral.com/nme
International Journal for Numerical Methods in Engineering

Peer Review O
nly
Table 1: Grid independence study for A = 1, Le = 10, N = 0 and Ra = 500.
κ Grid ψmax
21× 21 1381.63
1 41× 41 1364.39
81× 81 1363.24
Beji et al. [3] 1359.00
21× 21 7.9893
5 41× 41 7.8539
81× 81 7.8160
Beji et al. [3] 7.6310
25
Page 25 of 42
http://mc.manuscriptcentral.com/nme
International Journal for Numerical Methods in Engineering
Peer Review O
nly
Table 2: ψmax and its position for different radius ratios for A = 5, Le = 10, Ra = 500
and N = 5 (All computations on a 65× 321 grid).
κ ψmax Primary vortex centre
(r′ − r
′i
r′0 − r
′i
,z
H
)
1 301.482 (0.5000, 0.5062)
2 3.936 (0.5315, 0.4844)
5 1.509 (0.5515, 0.5875)
10 0.940 (0.5440, 0.6594)
20 0.6659 (0.6110, 0.6719)
50 0.4778 (0.5940, 0.7250)
26
Page 26 of 42
http://mc.manuscriptcentral.com/nme
International Journal for Numerical Methods in Engineering

Peer Review O
nly
Table 3: Maximum and minimum values of ψ for different buoyancy ratios for κ = 2,
Le = 10, Ra = 500 and A = 5 (All computations on a 65× 321 grid).
N ψmax ψmin
-50 0 -13.5306
-10 0 -4.1492
-5 0.1948 -2.6408
(0.2717) (-2.524)
-2 1.0462 -1.2397
(1.054) (-1.197)
-1.5 1.9720 -0.0412
-1 1.6016 -0.1661
-0.5 3.1688 0
0 3.1596 0
(3.102)
1 3.4990 0
2 3.6331 0
5 3.9362 0
(3.752)
10 5.0713 0
50 14.2914 0
27
Page 27 of 42
http://mc.manuscriptcentral.com/nme
International Journal for Numerical Methods in Engineering
Peer Review O
nly
Table 4: ψmax values for different Ra for A = 5, κ = 2, Le = 10 and N = 5 (All
computations on a 65× 321 grid).
Ra ψmax
0 0
10 0.3733
50 1.1771
100 1.7227
200 2.3909
500 3.9362
1000 6.1550
5000 20.5441
28
Page 28 of 42
http://mc.manuscriptcentral.com/nme
International Journal for Numerical Methods in Engineering

Peer Review O
nly
LIST OF FIGURE CAPTIONS
Figure 1. Schematic view of the vertical porous annulus.
Figure 2. Isotherms, isoconcentrates and the streamlines for N = 0, A = 1, Ra = 500,
Le = 10 and κ = 1 (left) and κ = 5 (right).
Figure 3. Temperature (top), concentration (centre) and stream-function (bottom) con-
tours for κ = 2, Le = 10, Ra = 500, N = 5 and A = 1, 2, 4, 6, 8 and 10 (from left to
right in that order).
Figure 4. Variations of (a) temperature and (b) concentration along the horizontal cen-
treline and (c) average Nusselt and Sherwood numbers with respect to aspect ratio A for
κ = 2, Le = 10, Ra = 500 and N = 5.
Figure 5. Temperature (top), concentration (centre) and stream-function (bottom) con-
tours for Le = 10, Ra = 500, N = 5 and κ = 1, 2, 5, 10, 20 and 50 (from left to right in
that order).
Figure 6. Variations of (a) temperature and (b) concentration along the horizontal cen-
treline and (c) average Nusselt and Sherwood numbers with respect to radius ratio κ for
A = 5, Le = 10, Ra = 500 and N = 5.
Figure 7. Temperature (top), concentration (centre) and stream-function (bottom) con-
tours for A = 5, κ = 2, Ra = 500, N = 1 and Le = 1, 10, 50, 100, 200 and 500 (from left
to right in that order).
Figure 8. Variations of (a) temperature and (b) concentration along the horizontal cen-
treline and (c) average Nusselt and Sherwood numbers with respect to Lewis number Le
for A = 5, κ = 2, Ra = 500 and N = 1.
Figure 9. Temperature (top), concentration (centre) and stream-function (bottom) con-
29
Page 29 of 42
http://mc.manuscriptcentral.com/nme
International Journal for Numerical Methods in Engineering
Peer Review O
nly
tours for A = 5, Le = 10, Ra = 500, κ = 2 and N =-50, -10, -5, -2,, 0, 5, 10 and 50 (from
left to right in that order).
Figure 10. Variations of (a) temperature and (b) concentration along the horizontal
centreline and (c) average Nusselt and Sherwood numbers with respect to buoyancy ratio
N for A = 5, Le = 10, Ra = 500 and κ = 2.
Figure 11. Temperature (top), concentration (centre) and stream-function (bottom) con-
tours for A = 5, Le = 10, κ = 2, N = 5 and Ra = 10, 50, 100, 200, 500 and 5000 (from
left to right in that order).
Figure 12. Variations of (a) temperature and (b) concentration along the horizontal
centreline and (c) average Nusselt and Sherwood numbers w. r. t. thermal Rayleigh
number Ra for A = 5, κ = 2, Le = 10 and N = 5.
30
Page 30 of 42
http://mc.manuscriptcentral.com/nme
International Journal for Numerical Methods in Engineering

Peer Review O
nlyz
rri
ro
ScSh
Th Tc
ro
ri
�����������������������������������������������������������������
�����������������������������������������������������������������
������������������������������������������������
������������������������������
����������������������������������������
�������������������
�������������������
��������������������������������������������������������������������������������������������������������������������������������������������������������������������������������������������������������
��������������������������������������������������������������������������������������������������������������������������������������������������������������������������������������������������������
������������������������������
H
z, w
r, u
HPorousmedium
(a) (b)
/
/
/
/
/ /
/
/
/
/
/
/
/ /
Figure 1: Schematic view of the vertical porous annulus.
31
Page 31 of 42
http://mc.manuscriptcentral.com/nme
International Journal for Numerical Methods in Engineering
Peer Review O
nly
Figure 2: Isotherms, isoconcentrates and the streamlines for N = 0, A = 1, Ra = 500,Le = 10 and κ = 1 (left) and κ = 5 (right, all computations on a 81× 81 grid).
32
Page 32 of 42
http://mc.manuscriptcentral.com/nme
International Journal for Numerical Methods in Engineering

Peer Review O
nly
(a) (b) (c) (d) (e) (f)
Figure 3: Temperature (top), concentration (centre) and stream-function (bottom) con-tours for κ = 2, Le = 10, Ra = 500, N = 5 and A = 1, 2, 4, 6, 8 and 10 (from left toright in that order, on 81× 81, 65× 129, 65× 257, 65× 385, 65× 513 and 65× 341 gridsrespectively).
33
Page 33 of 42
http://mc.manuscriptcentral.com/nme
International Journal for Numerical Methods in Engineering
Peer Review O
nlyT
Nu i
Shi
(r−r )/(r −r )oi i
(r−r )/(r −r )oi i
A=10
A=6
A=4A=2A=1
A
(a)
(c)
A=8
A=1 A=2 A=4 A=6
A=8A=10
(b)S
−0.4
−0.2
0
0.2
0.4
0 0.2 0.4 0.6 0.8 1
10
100
1000
1 2 3 4 5 6 7 8 9 10
−0.4
−0.2
0
0.2
0.4
0 0.2 0.4 0.6 0.8 1
Figure 4: Variations of (a) temperature and (b) concentration along the horizontal cen-treline and (c) average Nusselt and Sherwood numbers with respect to aspect ratio A forκ = 2, Le = 10, Ra = 500 and N = 5.
34
Page 34 of 42
http://mc.manuscriptcentral.com/nme
International Journal for Numerical Methods in Engineering
Peer Review O
nly
(a) (b) (c) (d) (e) (f)
Figure 5: Temperature (top), concentration (centre) and stream-function (bottom) con-tours for A = 5, Le = 10, Ra = 500, N = 5 and κ = 1, 2, 5, 10, 20 and 50 (from left toright in that order, all computations on a 65× 321 grid).
35
Page 35 of 42
http://mc.manuscriptcentral.com/nme
International Journal for Numerical Methods in Engineering
Peer Review O
nly
Nui
Shi
κ
(r−r )/(r −r )ioi
(r−r )/(r −r )ioi
κ=1
κ=2
κ=5
κ=10κ=50κ=20
T
κ=1
κ=2
κ=5
κ=50κ=20
κ=10
(a)
(b)
(c)
S
0
20
40
60
80
100
120
140
160
180
200
0 10 20 30 40 50
−0.4
−0.2
0
0.2
0.4
0 0.2 0.4 0.6 0.8 1
−0.4
−0.2
0
0.2
0.4
0 0.2 0.4 0.6 0.8 1
Figure 6: Variations of (a) temperature and (b) concentration along the horizontal cen-treline and (c) average Nusselt and Sherwood numbers with respect to radius ratio κ forA = 5, Le = 10, Ra = 500 and N = 5.
36
Page 36 of 42
http://mc.manuscriptcentral.com/nme
International Journal for Numerical Methods in Engineering
Peer Review O
nly
(a) (b) (c) (d) (e) (f)
Figure 7: Temperature (top), concentration (centre) and stream-function (bottom) con-tours for A = 5, κ = 2, Ra = 500, N = 1 and Le = 1, 10, 50, 100, 200 and 500 (from leftto right in that order, all computations on a 65× 321 grid).
37
Page 37 of 42
http://mc.manuscriptcentral.com/nme
International Journal for Numerical Methods in Engineering
Peer Review O
nly
Shi
Nu i
Le
T
(a)
(b)
(c)
Le=1
Le=5
Le=10
Le=200
Le=50
Le=500
Le=100
Le=20
Le=1
Le=5
Le=10Le=20
Le=500 Le=200 Le=100
Le=50
S
(r−r )/(r −r )oi i
(r−r )/(r −r )oi i
10
100
1000
1 10 100 1000
−0.4
−0.2
0
0.2
0.4
0 0.2 0.4 0.6 0.8 1
−0.4
−0.2
0
0.2
0.4
0 0.2 0.4 0.6 0.8 1
Figure 8: Variations of (a) temperature and (b) concentration along the horizontal cen-treline and (c) average Nusselt and Sherwood numbers with respect to Lewis number Lefor A = 5, κ = 2, Ra = 500 and N = 1.
38
Page 38 of 42
http://mc.manuscriptcentral.com/nme
International Journal for Numerical Methods in Engineering
Peer Review O
nly-
-
+
-
+
-
+
+
+ + +
(a) (b) (c) (d) (e) (f) (g) (h)
Figure 9: Temperature (top), concentration (centre) and stream-function (bottom) con-tours for A = 5, Le = 10, Ra = 500, κ = 2 and N =-50, -10, -5, -2,, 0, 5, 10 and 50 (fromleft to right in that order, all computations on a 65× 321 grid).
39
Page 39 of 42
http://mc.manuscriptcentral.com/nme
International Journal for Numerical Methods in Engineering
Peer Review O
nlyT
Nu i
iSh
(r−r )/(r −r )i io
(r−r )/(r −r )i io
N=−2
N=−5N=2
N=−1
N=0N=5
N=−10
N=−1
N=0N=5
N=−2
N=−5
N=2 N=10
N
Aiding flowOpposing flow
(a)
(b)
(c)
N=50N=−50
S
−0.6
−0.4
−0.2
0
0.2
0.4
0.6
0 0.2 0.4 0.6 0.8
−0.6
−0.4
−0.2
0
0.2
0.4
0.6
0 0.2 0.4 0.6 0.8 1
0
20
40
60
80
100
120
140
−10 −5 0 5 10
1
Figure 10: Variations of (a) temperature and (b) concentration along the horizontal cen-treline and (c) average Nusselt and Sherwood numbers with respect to buoyancy ratio Nfor A = 5, Le = 10, Ra = 500 and κ = 2.
40
Page 40 of 42
http://mc.manuscriptcentral.com/nme
International Journal for Numerical Methods in Engineering

Peer Review O
nly
(a) (b) (c) (d) (e) (f)
Figure 11: Temperature (top), concentration (centre) and stream-function (bottom) con-tours for A = 5, Le = 10, κ = 2, N = 5 and Ra = 10, 50, 100, 200, 500 and 5000 (fromleft to right in that order, all computations on a 65× 321 grid).
41
Page 41 of 42
http://mc.manuscriptcentral.com/nme
International Journal for Numerical Methods in Engineering

Peer Review O
nlyT
Shi
Nu i
(r−r )/(r −r )o ii
(r−r )/(r −r )o ii
=0Ra
Ra=10
Ra=50
Ra=200=500Ra
(b)
(a)
(c)
RaRa
Ra
Ra=200Ra=500
Ra=1000
=50=10
=0
S
=1000Ra
Ra
Ra=5000
Ra=5000
1
10
100
1000
1 10 100 1000 10000
−0.4
−0.2
0
0.2
0.4
0 0.2 0.4 0.6 0.8 1
−0.4
−0.2
0
0.2
0.4
0 0.2 0.4 0.6 0.8 1
−0.4
−0.2
0
0.2
0.4
0 0.2 0.4 0.6 0.8 1
−0.4
−0.2
0
0.2
0.4
0 0.2 0.4 0.6 0.8 1
Figure 12: Variations of (a) temperature and (b) concentration along the horizontal cen-treline and (c) average Nusselt and Sherwood numbers w. r. t. thermal Rayleigh numberRa for A = 5, κ = 2, Le = 10 and N = 5.
42
Page 42 of 42
http://mc.manuscriptcentral.com/nme
International Journal for Numerical Methods in Engineering