pediatric malnutrition: under the curve1cb444df-77c3-4d94-82fa... · - usually categorized as...
TRANSCRIPT

Pediatric Malnutrition: Under the
Curve Beth Scott, RD, CNSC

Objectives
• Discuss the prevalence of pediatric malnutrition and address the
challenges involved in collecting appropriate data.
• Review updated guidelines for the identification and classification
of pediatric malnutrition.
• Discuss the documentation of malnutrition and implications for
reimbursement.
• Case Study presentation
2

Prevalence
• 20 million children <5 years of age worldwide
• Contributes to ~45% of all child deaths globally
• Poverty, famine, and war are primary contributors to
global malnutrition
• A clear definition is lacking
– Lead to underestimating the prevalence
– Make it difficult to compare results among the few studies
there are because the definition varies
3

• Underdeveloped countries
- Historically thought to be exclusive to developing countries
- Acute/chronic infections and diarrheal diseases are major contributors
to malnutrition and high mortality rates
- Usually categorized as Kwashiorker or Marasmus
• Developed countries
- Occurs more frequently in acute and chronic illness
- Energy imbalance and excess is more common than nutrient deficiency
- There is a portion of the population that are victims of food insecurity
• Homeless, victims of abuse/neglect
• Reside in urban or rural areas where access to high quality food is
limited
• 1 in 10 families in the US struggle with food insecurity
-
4
Prevalence

Prevalence
• United States
– Energy imbalance vs. nutrient deficiency
– Prevalence of acute or chronic undernutrition in US children
unknown
– 1 in 10 families struggle with food insecurity
– Most frequently observed in hospitalized acute and/or chronically ill
children and in children with special healthcare needs
• Nutrition Screening for Malnutrition
– Should be done routinely in primary care settings
– Should be a an integral part of routine pediatric care
– Malnutrition can lead to more complicated hospitalizations
5

Acute vs. Chronic Undernutrition
• National Centers for Health Statistics (NCHS)
– Distinguish between based on time
• Acute <3 months
• Chronic >3 months
• Chronic condition may contribute to an acute illness
• An acute illness may evolve into a chronic condition if not
addressed
6
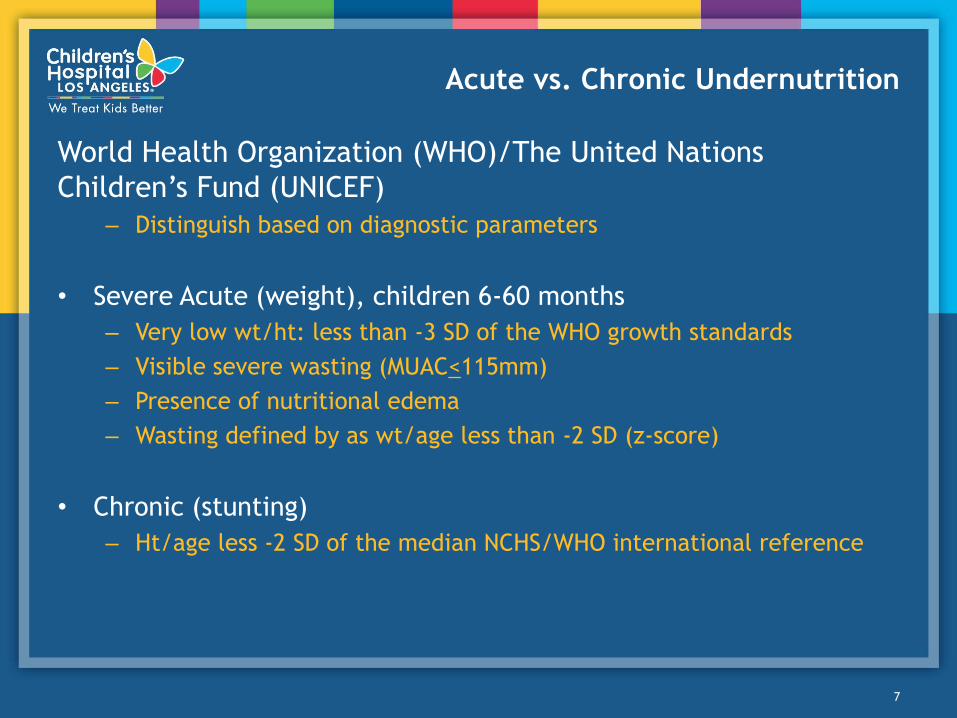
Acute vs. Chronic Undernutrition
World Health Organization (WHO)/The United Nations
Children’s Fund (UNICEF)
– Distinguish based on diagnostic parameters
• Severe Acute (weight), children 6-60 months
– Very low wt/ht: less than -3 SD of the WHO growth standards
– Visible severe wasting (MUAC<115mm)
– Presence of nutritional edema
– Wasting defined by as wt/age less than -2 SD (z-score)
• Chronic (stunting)
– Ht/age less -2 SD of the median NCHS/WHO international reference
7

Acute vs. Chronic Undernutrition
• Stunting
- Well-established indicator of chronic malnutrition
- Height- children >2yrs, taken in standing position
- Length- children <2yrs, taken in recumbent position
- Particularly related to environmental or socioeconomic circumstances
- May also be seen during adolescence as is a period of rapid growth and
development
• Children 0-4 years have the best potential outcomes from
comprehensive assessment for malnutrition because timely
intervention is highly likely to prevent adverse effects
8
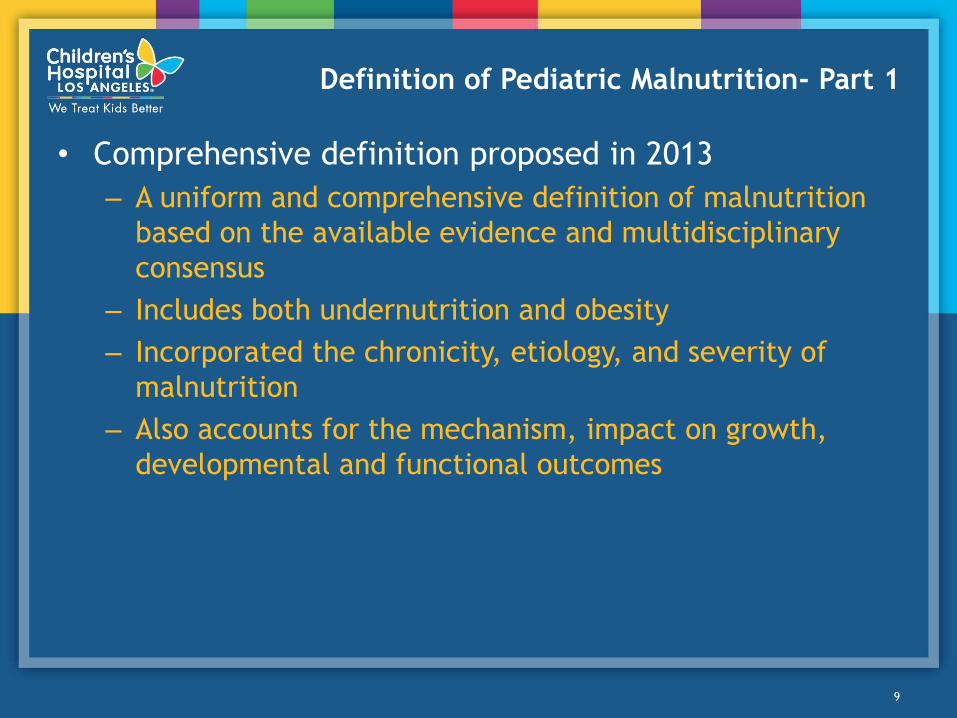
Definition of Pediatric Malnutrition- Part 1
• Comprehensive definition proposed in 2013
– A uniform and comprehensive definition of malnutrition
based on the available evidence and multidisciplinary
consensus
– Includes both undernutrition and obesity
– Incorporated the chronicity, etiology, and severity of
malnutrition
– Also accounts for the mechanism, impact on growth,
developmental and functional outcomes
9
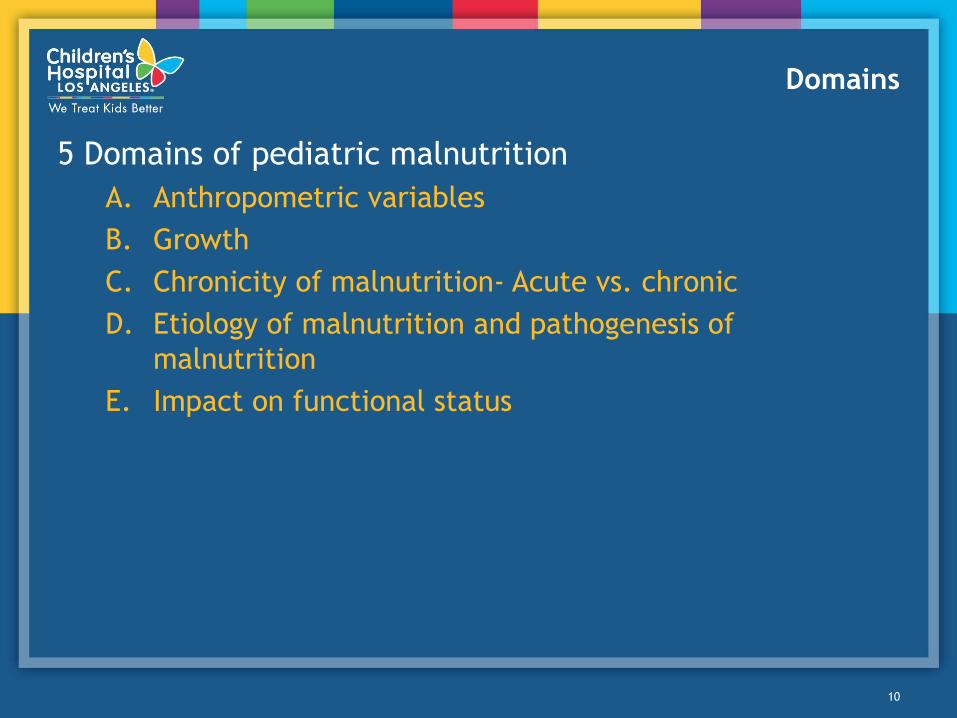
Domains
5 Domains of pediatric malnutrition
A. Anthropometric variables
B. Growth
C. Chronicity of malnutrition- Acute vs. chronic
D. Etiology of malnutrition and pathogenesis of
malnutrition
E. Impact on functional status
10
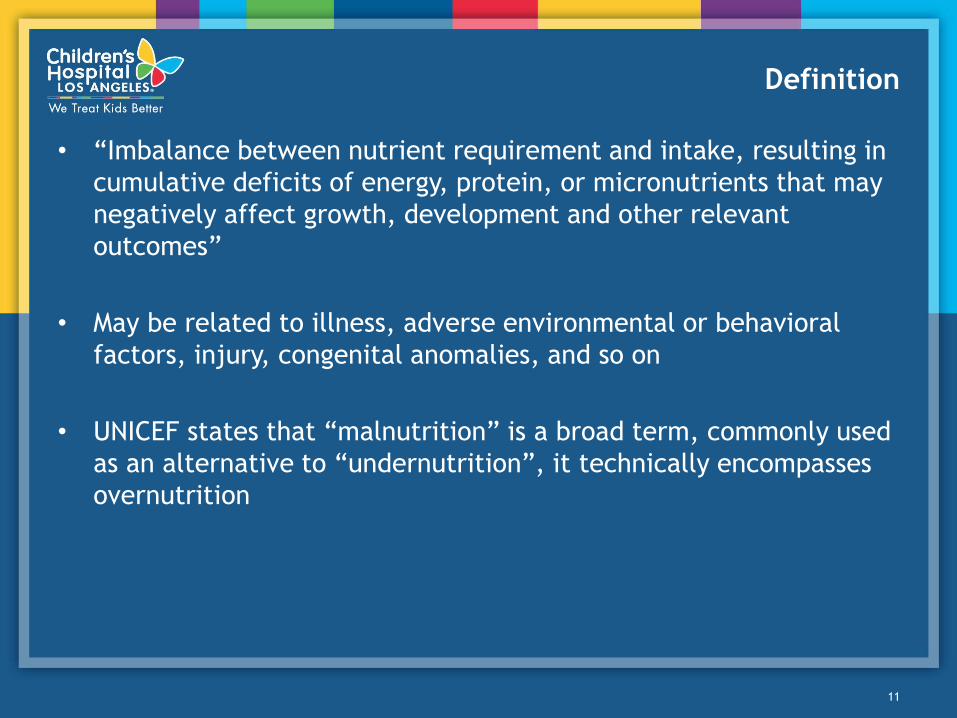
Definition
• “Imbalance between nutrient requirement and intake, resulting in
cumulative deficits of energy, protein, or micronutrients that may
negatively affect growth, development and other relevant
outcomes”
• May be related to illness, adverse environmental or behavioral
factors, injury, congenital anomalies, and so on
• UNICEF states that “malnutrition” is a broad term, commonly used
as an alternative to “undernutrition”, it technically encompasses
overnutrition
11

What?
• Lack of standardized approach to the recognition and diagnosis
• No agreement as to the best and most useful approach
• Routine assessment of nutritional status in high risk children in the US is
sporadic and inconsistent
• A consensus statement was produced by AAND and ASPEN to “identify a
basic set of indicators that can be used to diagnose and document
undernutrition in the pediatric population ages 1 month to 18 years” to be
used in routine clinical practice
• Intended for use in multiple settings
• Obesity is a form of malnutrition however the intention of the consensus
statement was to address only undernutrition

Why?
• The universal use of a single set of diagnostic parameters will:
– expedite the recognition of pediatric undernutrition, lead to the
development of more accurate estimates of its prevalence and
incidence, direct interventions, and promote improves outcomes.
– Allow a prediction of the human and financial responsibilities and
costs associated with the prevention and treatment of undernutrition
and help to further ensure the provision of high-quality, cost-effective
nutritional care.
13
Indicators of Pediatric
Undernutrition
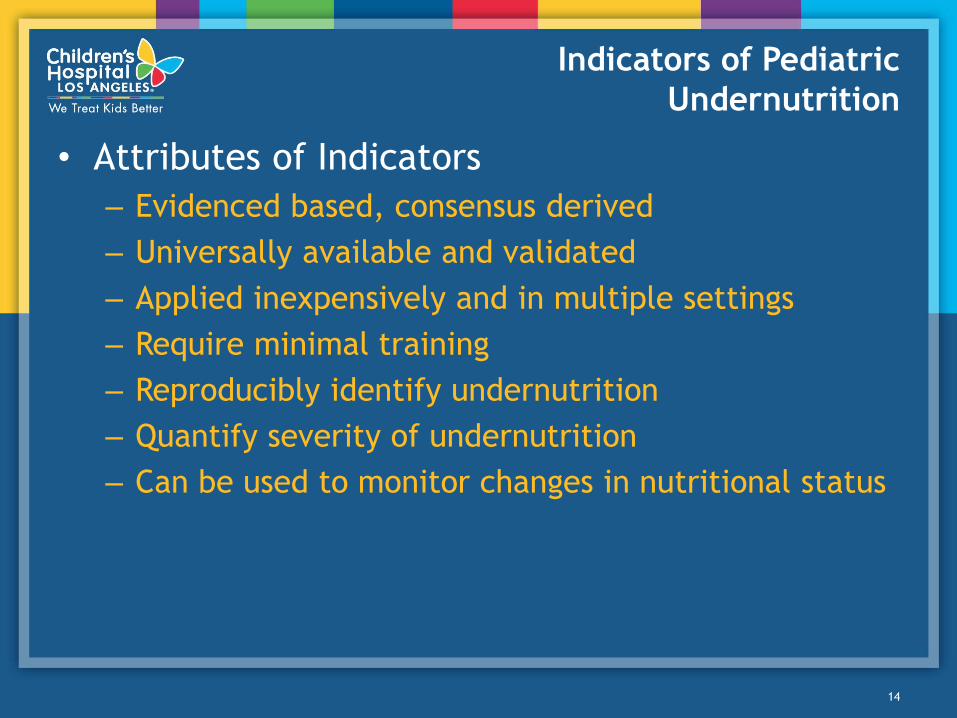
• Attributes of Indicators
– Evidenced based, consensus derived
– Universally available and validated
– Applied inexpensively and in multiple settings
– Require minimal training
– Reproducibly identify undernutrition
– Quantify severity of undernutrition
– Can be used to monitor changes in nutritional status
14
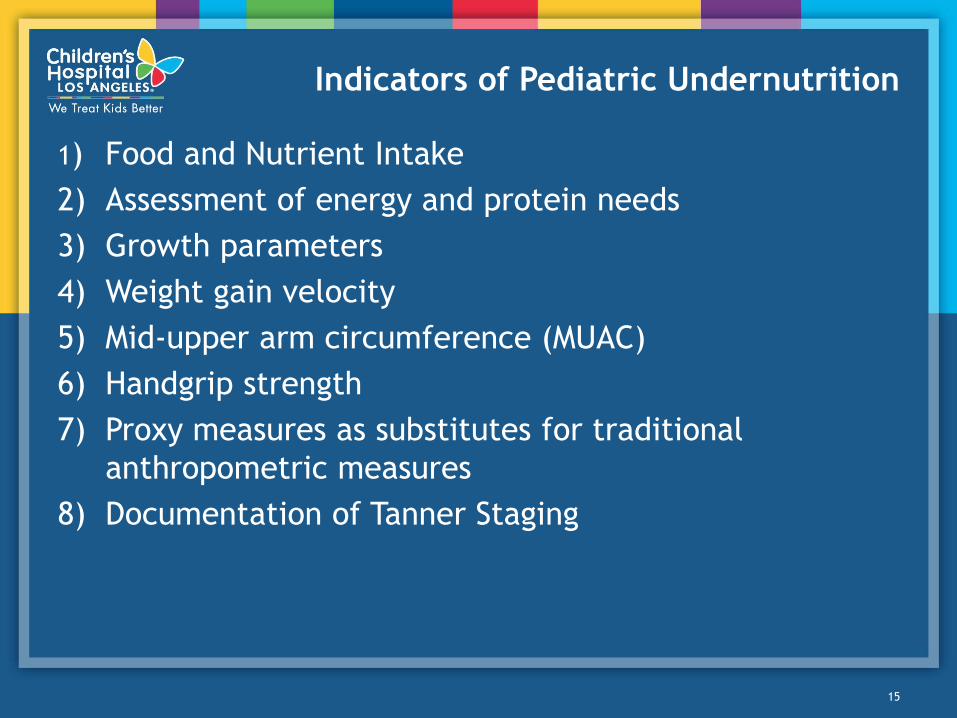
Indicators of Pediatric Undernutrition
1) Food and Nutrient Intake
2) Assessment of energy and protein needs
3) Growth parameters
4) Weight gain velocity
5) Mid-upper arm circumference (MUAC)
6) Handgrip strength
7) Proxy measures as substitutes for traditional
anthropometric measures
8) Documentation of Tanner Staging
15
1) Food and Nutrient Intake
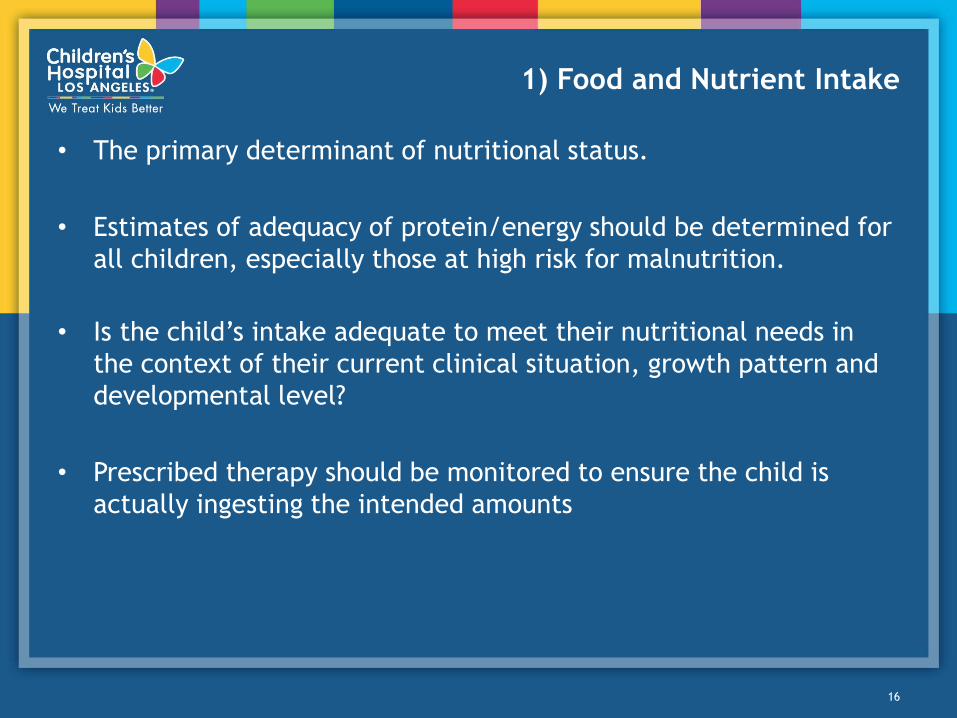
• The primary determinant of nutritional status.
• Estimates of adequacy of protein/energy should be determined for
all children, especially those at high risk for malnutrition.
• Is the child’s intake adequate to meet their nutritional needs in
the context of their current clinical situation, growth pattern and
developmental level?
• Prescribed therapy should be monitored to ensure the child is
actually ingesting the intended amounts
16
2) Assessment of Energy and Protein Needs
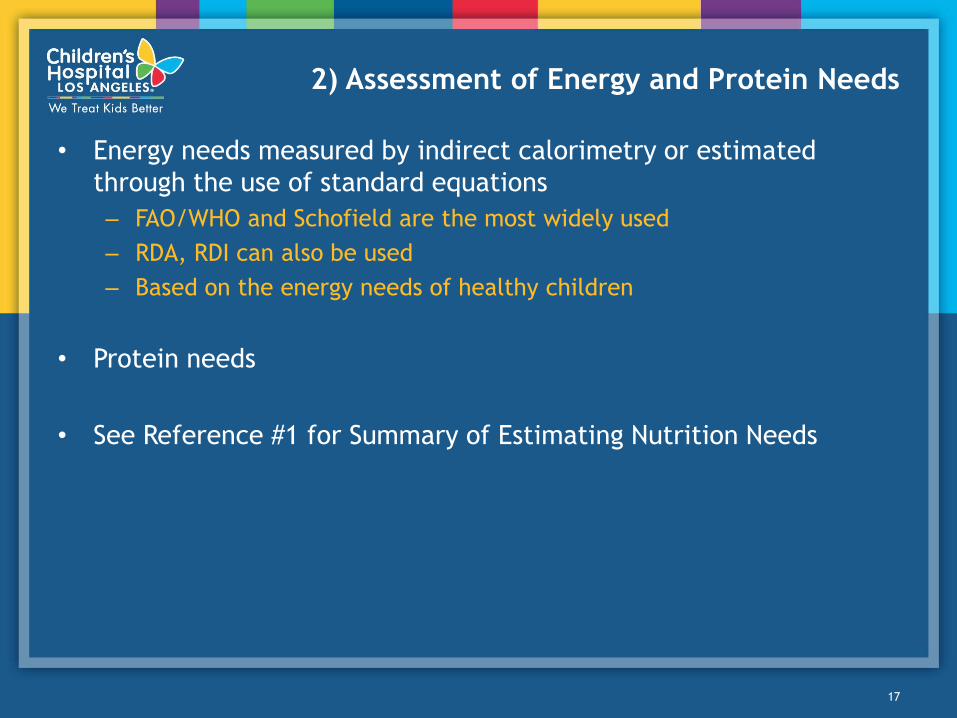
• Energy needs measured by indirect calorimetry or estimated
through the use of standard equations
– FAO/WHO and Schofield are the most widely used
– RDA, RDI can also be used
– Based on the energy needs of healthy children
• Protein needs
• See Reference #1 for Summary of Estimating Nutrition Needs
17
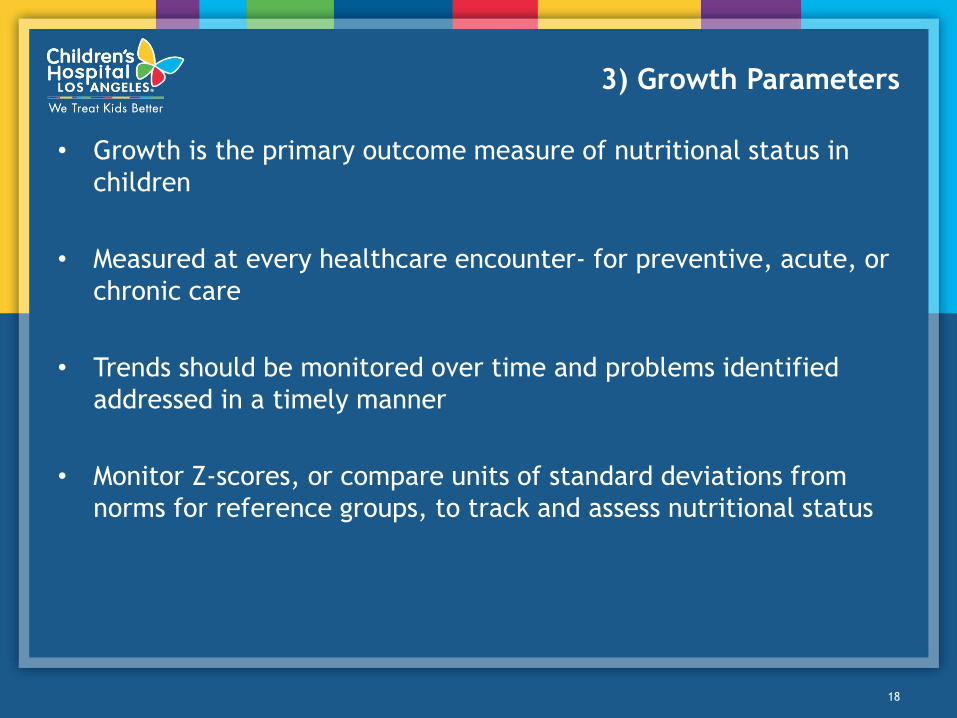
3) Growth Parameters
• Growth is the primary outcome measure of nutritional status in
children
• Measured at every healthcare encounter- for preventive, acute, or
chronic care
• Trends should be monitored over time and problems identified
addressed in a timely manner
• Monitor Z-scores, or compare units of standard deviations from
norms for reference groups, to track and assess nutritional status
18

Growth Parameters
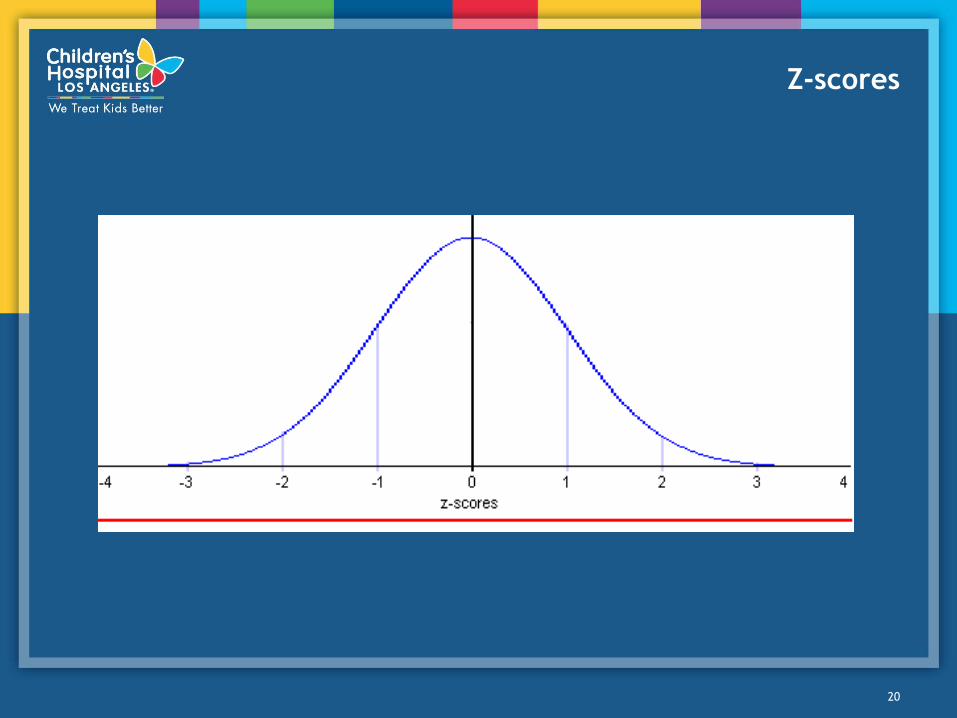
• A Z-score is a statistical measure that tells how a single data point
compares with normal data and, if above or below “average”, how
atypical the measurement is.
• Growth measurements that cross Z-score lines indicate possible
risk
• Normal growth/development will be on or between -1 and 1 z-
scores of a given indicator
• Interpretation of the significance of the Z-score data is based on
the point at which, in the child’s pattern of growth, the change
began and the childs’ health status relative to the point and
progression of the change.
19
Z-scores
20

4) Weight Gain Velocity
• Growth is defined as “an increase in size and the development to
maturity”
• Growth velocity is defined as “the rate of change in weight or
length/height over time”
– Early sign of healthy/unhealthy response to the nutritional
environment
– On initial presentation, length/height reflects the child’s nutritional
status over a prolonged period of time
– Negative z-score can be used to determine pediatric malnutrition
when only 1 set of measurements is available
– Over time, decreases in z-scores for linear growth can also be used as
a characteristic of malnutrition
• With adequate nutrient intake, average daily/monthly rates of
weight gain allow a child to remain on a stable growth curve.
21

Weight Gain Velocity
• Very low weight velocity has been noted to be
“independently and more closely related to mortality
than other indicators of malnutrition such as BMI for
age”
• In short term undernutrition/cessation of growth (as in
illness or trauma) there is an adaptive response that
allows the child to achieve “catch-up” growth
22

5) Mid-Upper Arm Circumference
• MUAC can be used as an independent anthropometric assessment
tool in standards developed by WHO.
– MUAC-for-age reference data in standard deviations is only available
for 6-59 months
– MUAC (“arm circumference”) data given in percentiles for ages 1-75
yrs
– When serial Z-scores are unavailable serial measurements are still
beneficial in monitoring changes in body composition by using the
child as her own control
• MUAC measures should be part of the anthropometric assessment
of all pts, but it is particularly helpful in those with fluid shifts
(edema, ascites, etc).
23
6) Handgrip Strength
• A dynamometer is a simple, noninvasive and low-cost instrument to
measure functional status.
• Measures baseline functional status, tracks progress
• Predicts post-op complications, length of hospitalization, readmission,
likelihood of returning to previous home setting, and mortality.
• BMI Z-scores correlate with the admission handgrip strength
measurement.
• Age-appropriate, gender-specific reference ranges must be used.
• Normal reference ranges in large populations not yet established
• Can identify the presence but not severity of malnutrition
24

7&8) Additional Indicators
• Proxy measures substitutes when unable to take direct
measurements
• Tanner Staging
– Can’t be used as a marker for nutritional status however may
be useful as an indicator in preteens and adolescents who have
entered puberty, when Tanner progression or stagnation may be
influenced by nutritional status
– Area for future research
25
Classification of Pediatric Malnutrition
• Past recommendations:
– Percent of ideal body weight
– Gomez Classification, Waterlow Criteria
– Other definitions used included decreases in percentiles, weight below
the 5th %tile, and deceleration of weight over time
• Current recommendations:
– Use of Z-scores, declines, and negative scores to identify and
document
• Children with wt/ht z-scores of less than -3 SD were at a 9-fold
greater risk of dying than children with a z-score of -1 SD
– MUAC measures (in children 6-60 months)
• Severe malnutrition <11.5cm
• Moderate malnutrition 11.5-12.4cm
• At risk of malnutrition 12.4-13.5cm
26

Classification of Pediatric Malnutrition
• Mild Malnutrition
– Usually the result of an acute event, either due to economic
circumstances or acute illness
– Presents with unintentional weight loss or weight gain velocity less
than expected
• Moderate Malnutrition
– Occurs due to undernutrition of a significant duration that results in
weight for length/height values or BMI for age values below the
normal range
• Severe Malnutriton
– Occurs as a result of prolonged undernutrition and is most frequently
quantified by declines in rates of linear growth that result in stunting
27

Classification of Pediatric Malnutrition
• Single data point
– Weight/height or length z score
– BMI/age z score
– length or height/age z score
– MUAC
• Two or more data points
– Weight gain velocity (<2 yrs of age)
– Weight loss (2-20 yrs)
– Deceleration in weight/length or height z-score
– Inadequate nutrient intake
28
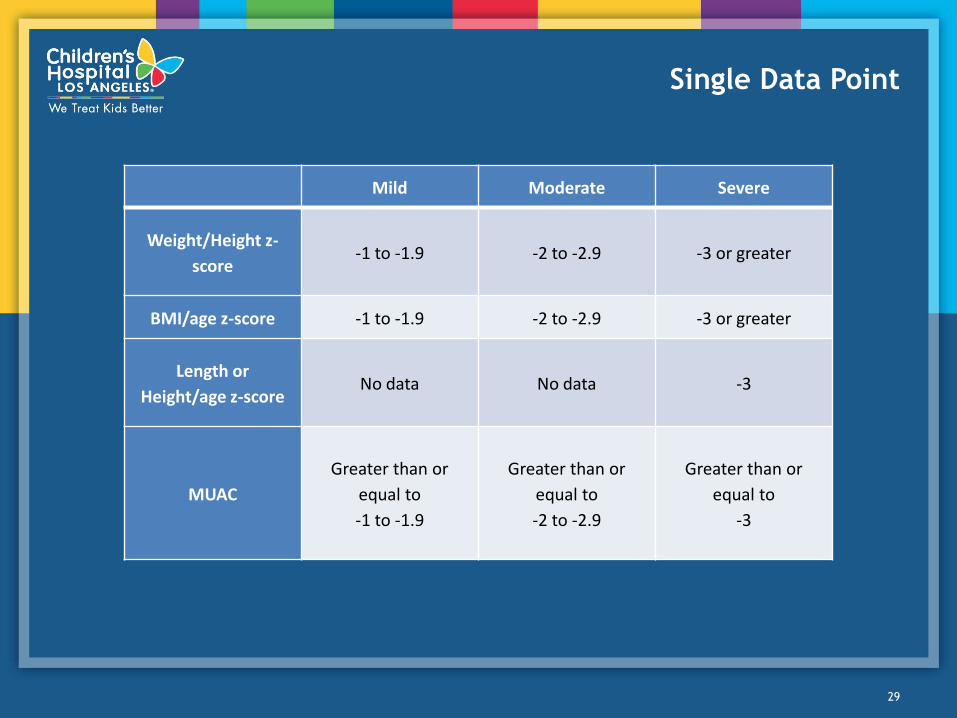
Single Data Point
29
Mild Moderate Severe
Weight/Height z-
score -1 to -1.9 -2 to -2.9 -3 or greater
BMI/age z-score -1 to -1.9 -2 to -2.9 -3 or greater
Length or
Height/age z-score No data No data -3
MUAC
Greater than or
equal to
-1 to -1.9
Greater than or
equal to
-2 to -2.9
Greater than or
equal to
-3
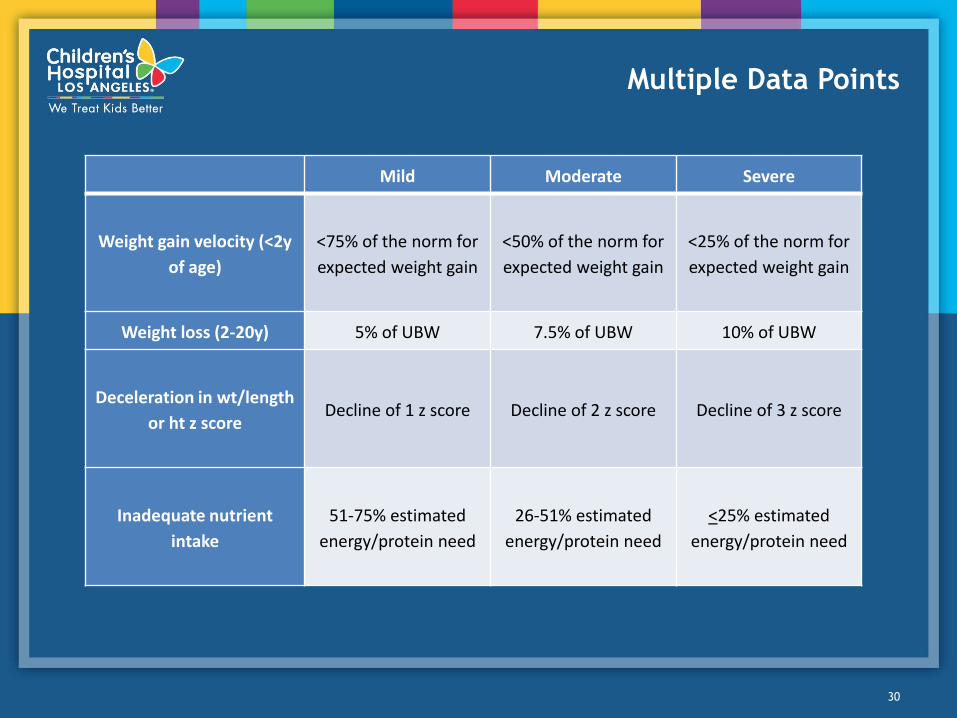
Multiple Data Points
Mild Moderate Severe
Weight gain velocity (<2y
of age)
<75% of the norm for
expected weight gain
<50% of the norm for
expected weight gain
<25% of the norm for
expected weight gain
Weight loss (2-20y) 5% of UBW 7.5% of UBW 10% of UBW
Deceleration in wt/length
or ht z score Decline of 1 z score Decline of 2 z score Decline of 3 z score
Inadequate nutrient
intake
51-75% estimated
energy/protein need
26-51% estimated
energy/protein need
<25% estimated
energy/protein need
30

Why is this important?
• Earlier identification
– Less severe malnutrition
– Identified earlier cost less to treat- shorter inpt stays, possible outpt
treatment, less disease-related complications
• Highlighting the problem may lead to:
– Increased allocation of resources
– Required universal screening
31
Importance
The universal use of a single set of diagnostic parameters
will :
– Expedite the recognition of pediatric malnutrition
– Lead to more accurate estimates of prevalence and incidence
– Promote improved outcomes
– Allow a prediction of the human/financial responsibilities and
costs associated with the prevention and treatment
– Help ensure the provision of high-quality, cost effective
nutritional care
32
References
33

Case Study
34