pediatric case studies - professional.diabetes.org · pediatric case studies ... pediatric...
TRANSCRIPT
5/16/2018
1
PHIL ZEITLER MD, PHD
SECTION OF ENDOCRINOLOGY
DEPARTMENT OF PEDIATRICS
UNIVERSITY OF COLORADO
DEPARTMENT OF ENDOCRINOLOGY
CHILDREN’S HOSPITAL COLORADO
Pediatric Case Studies
Blake
15 yo NHW male with long history of overweight and two year increase in weight gain
Denies change in eating or activity habits Small breakfast, school lunch, “large” dinner
Fast food once a week
PE at school every day
4-5 hours/day of screen time
No medications. Depakote two years ago (one year)
ROS: daytime sleepiness, snoring. Otherwise negative
Blake
Past Hx:
Uncomplicated pregnancy, BW 5lbs 12 oz, no GDM
Asperger’s syndrome
Fam Hx:
Paternal grandmother with T2DM
Father with elevated cholesterol
Mat uncle with HTN, MI at 45, elevated cholesterol
Maternal GF with MI at 61, HTN, elevated cholesterol
5/16/2018
2
Blake
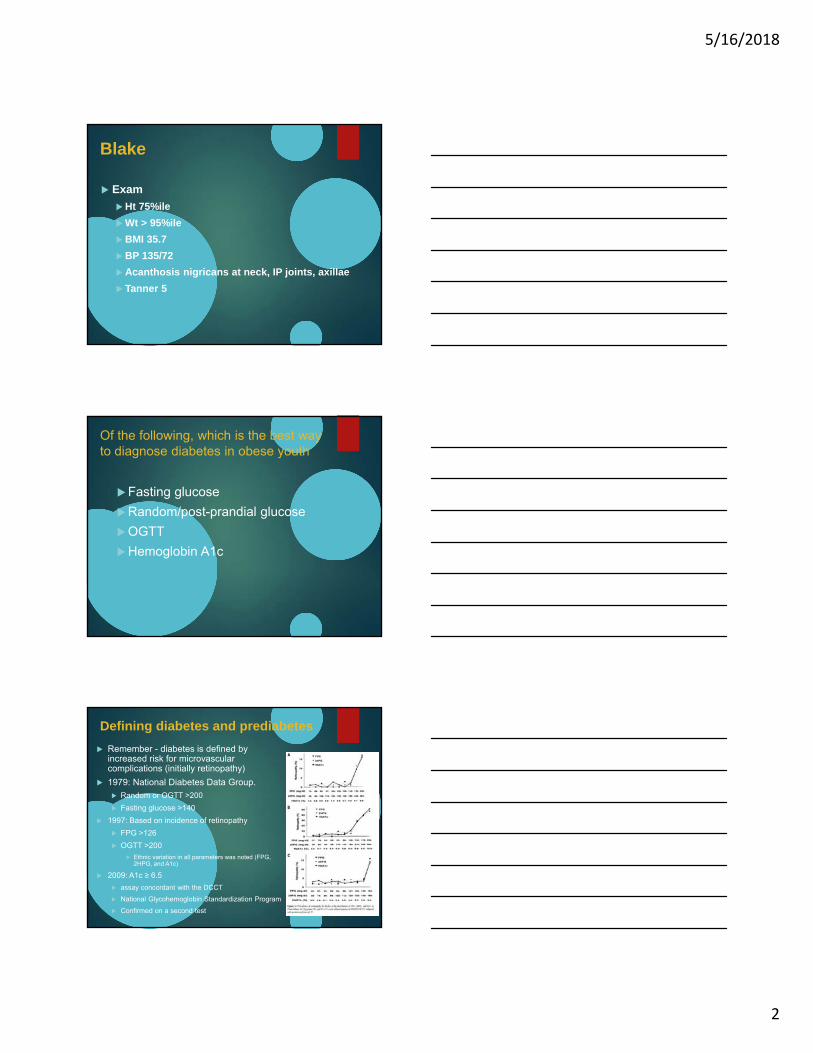
Exam
Ht 75%ile
Wt > 95%ile
BMI 35.7
BP 135/72
Acanthosis nigricans at neck, IP joints, axillae
Tanner 5
Of the following, which is the best way to diagnose diabetes in obese youth
Fasting glucose
Random/post-prandial glucose
OGTT
Hemoglobin A1c
Defining diabetes and prediabetes
Remember - diabetes is defined by increased risk for microvascular complications (initially retinopathy)
1979: National Diabetes Data Group.
Random or OGTT >200
Fasting glucose >140
1997: Based on incidence of retinopathy
FPG >126
OGTT >200
Ethnic variation in all parameters was noted (FPG, 2HPG, and A1c)
2009: A1c ≥ 6.5
assay concordant with the DCCT
National Glycohemoglobin Standardization Program
Confirmed on a second test
5/16/2018
3
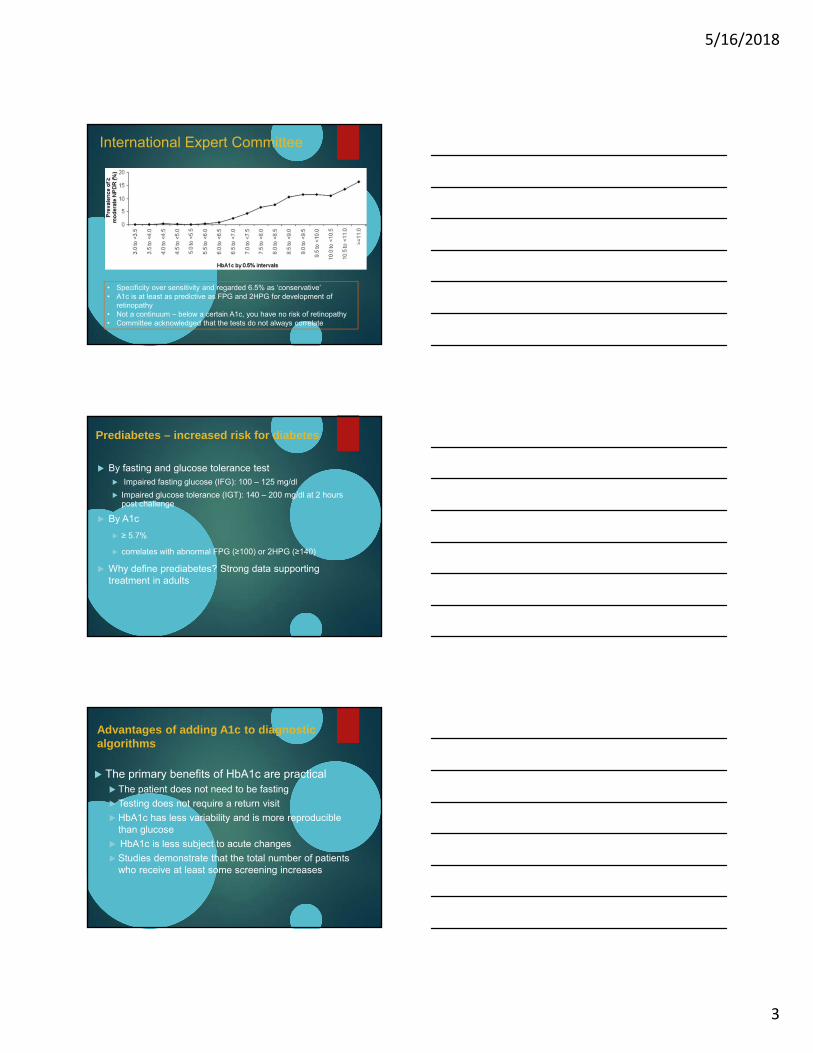
International Expert Committee
• Specificity over sensitivity and regarded 6.5% as ‘conservative’ • A1c is at least as predictive as FPG and 2HPG for development of
retinopathy• Not a continuum – below a certain A1c, you have no risk of retinopathy• Committee acknowledged that the tests do not always correlate
Prediabetes – increased risk for diabetes
By fasting and glucose tolerance test Impaired fasting glucose (IFG): 100 – 125 mg/dl
Impaired glucose tolerance (IGT): 140 – 200 mg/dl at 2 hours post challenge
By A1c
≥ 5.7%
correlates with abnormal FPG (≥100) or 2HPG (≥140)
Why define prediabetes? Strong data supporting treatment in adults
Advantages of adding A1c to diagnostic algorithms
The primary benefits of HbA1c are practical The patient does not need to be fasting
Testing does not require a return visit
HbA1c has less variability and is more reproducible than glucose
HbA1c is less subject to acute changes
Studies demonstrate that the total number of patients who receive at least some screening increases
5/16/2018
4
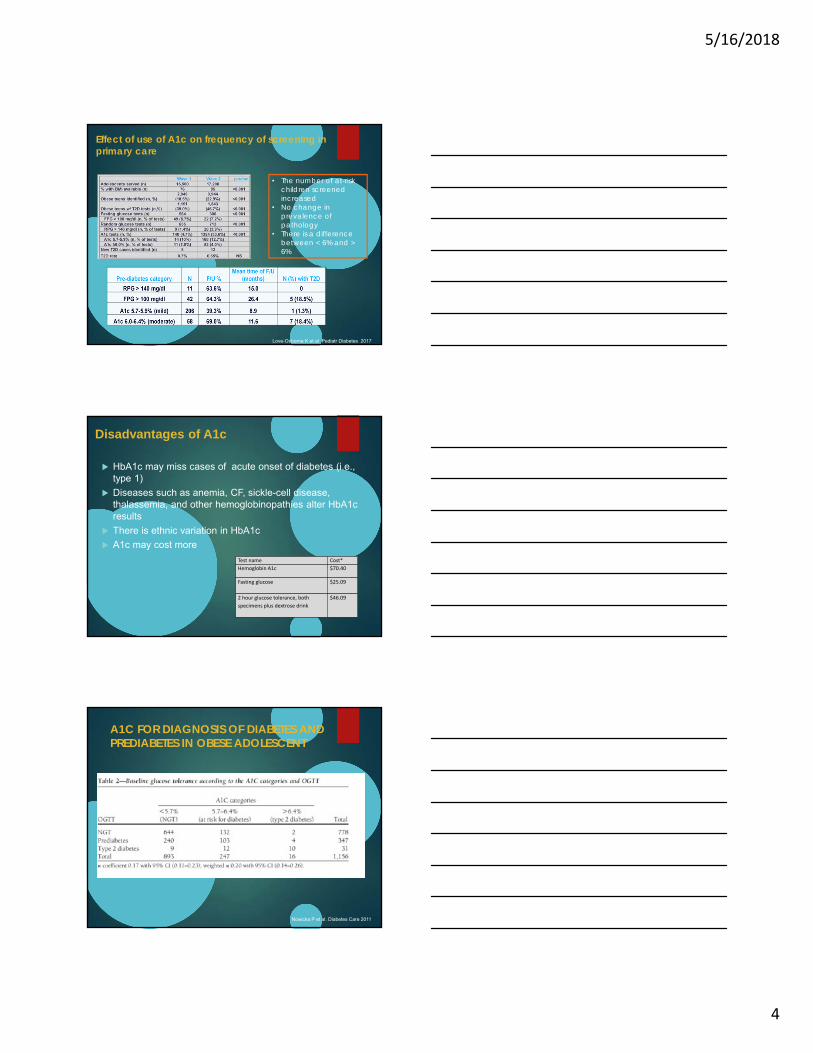
Effect of use of A1c on frequency of screening in primary care
• The number of at-risk children screened increased
• No change in prevalence of pathology
• There is a difference between < 6% and > 6%
Love-Osborne K et al Pediatr Diabetes 2017
Disadvantages of A1c
HbA1c may miss cases of acute onset of diabetes (i.e., type 1)
Diseases such as anemia, CF, sickle-cell disease, thalassemia, and other hemoglobinopathies alter HbA1c results
There is ethnic variation in HbA1c
A1c may cost more
Test name Cost*
Hemoglobin A1c $70.40
Fasting glucose $25.09
2 hour glucose tolerance, both
specimens plus dextrose drink
$46.09
Nowicka P et al. Diabetes Care 2011
A1C FOR DIAGNOSIS OF DIABETES AND PREDIABETES IN OBESE ADOLESCENT
5/16/2018
5
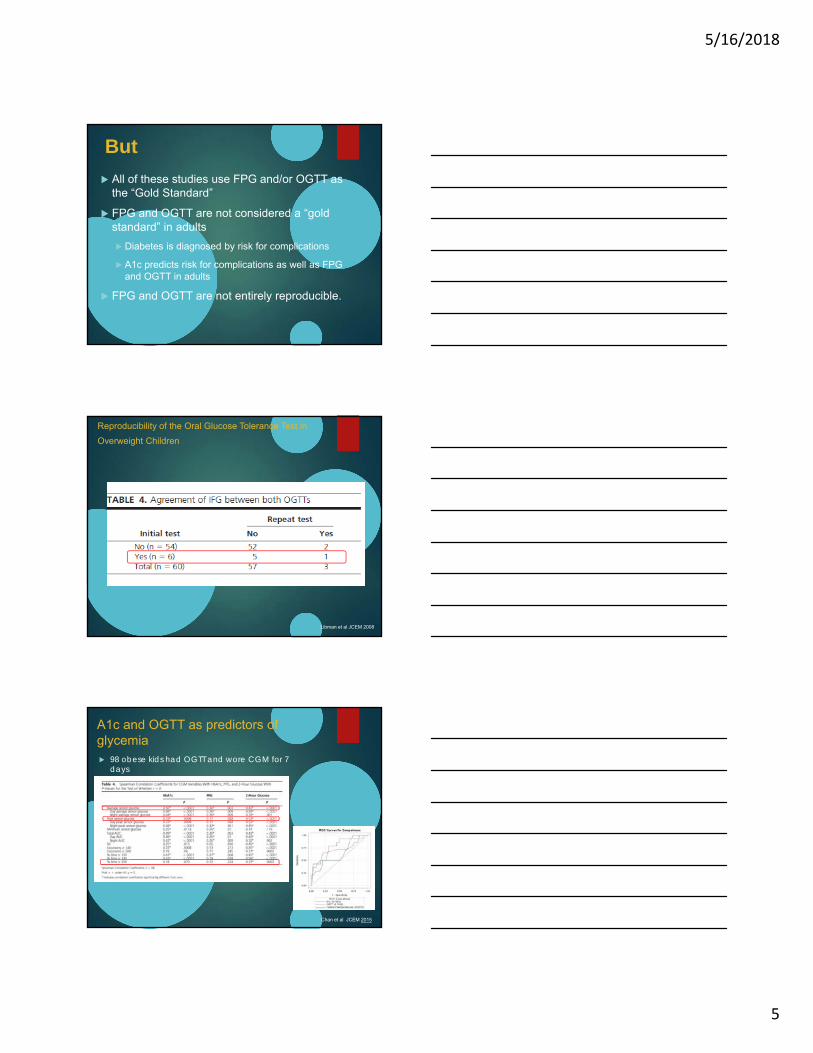
But
All of these studies use FPG and/or OGTT as the “Gold Standard”
FPG and OGTT are not considered a “gold standard” in adults
Diabetes is diagnosed by risk for complications
A1c predicts risk for complications as well as FPG and OGTT in adults
FPG and OGTT are not entirely reproducible.
Reproducibility of the Oral Glucose Tolerance Test in
Overweight Children
Libman et al JCEM 2008
A1c and OGTT as predictors of glycemia 98 obese kids had OGTT and wore CGM for 7
days
Chan et al JCEM 2015
5/16/2018
6
Using A1c for diagnosis of diabetes and prediabetes
Correlations among A1c, FPG ,and 2HPG may be less than in adults
A1c, FPG, and 2HPG are likely measuring different things Abnormalities in any of them likely indicate underlying abnormal
glycemia
Risk of complications correlates strongly with A1c in adults
A1c is not always reproducible: but neither is OGTT or FPG,
A1c is affected by ethnicity, underlying disease But so are FPG and 2HPG
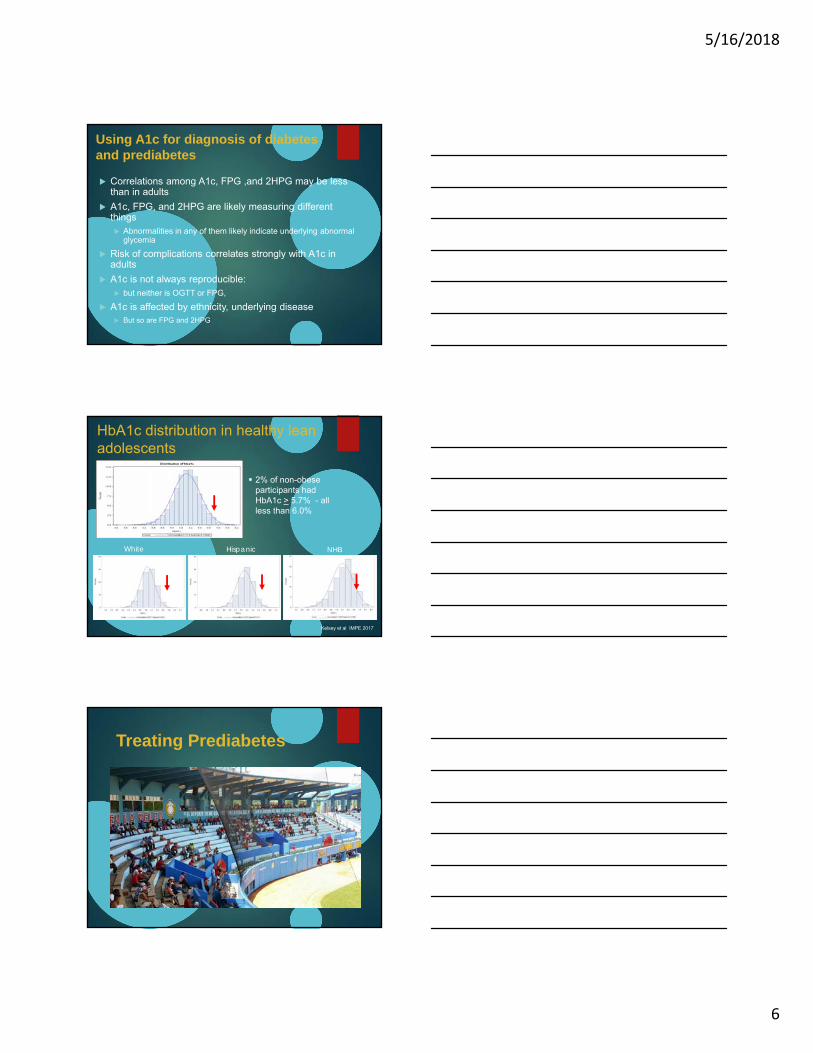
HbA1c distribution in healthy lean adolescents
2% of non-obese participants had HbA1c > 5.7% - all less than 6.0%
Kelsey et al IMPE 2017
White Hispanic NHB
Treating Prediabetes
5/16/2018
7
In principle, it’s easy! Reduce the accretion of visceral fat through lifestyle
modification Reverse the trends in the toxic environment
Reduce caloric intake
Increase caloric expenditure
AAP Expert Committee:
Evidence based dietary interventions
Eliminate liquid calories
Reduce or eliminate eating out
Reduce portion sizes
Evidence based activity interventions
Reduce sedentary time/screen time
Encourage attainment of recommended activity goals.
Barlow et al Pediatrics 2007
Effects of lifestyle intervention in obese children and adults
Godoy-Matos et al. JCEM 90: 1460, 2005Poston et al. Int J Obes 27: 1486, 2003Berkowitz et al. JAMA 289: 1805, 2003Nemet et al. Pediatrics 115: e443, 2005Chanoine et al. JAMA 293: 2873-2883, 2005
0 1 2 3 4 5-7.5
-5.0
-2.5
0.0Standard
Moderate
Intensive
Children Intensive
Children Standard
years
we
igh
t ch
an
ge
(kg
)
Tuomilehto, et al. N Eng J Med 344: 1343, 2001Knowler et al (DPP). N Eng J Med 346: 393, 2002Torgersen et al. Diab Care 27: 155, 2004
Van Gaal et al. Lancet 365: 1389, 2005Despres et al. N Eng J Med 353: 2121, 2005Pi-Sunyer et al. JAMA 295: 761, 2006
School Interventions

5/16/2018
8
Cochrane Meta-analyses
Summerbell 2007 – No evidence for effectiveness of school-based interventions for the prevention of obesity
Some evidence for reported changes in dietary habits
Summberbell 2007 – No evidence for effectiveness of school-based interventions for the treatment of obesity
The Healthy Study
42 middle schools randomized to multi-modal intervention or control. Baseline in 6th grade and retested in 8th grade
Small decrease in overweight/obesity in both intervention and control schools, with intervention slightly better
HEALTHY did not show:
Reduction in CVD risk factor rates
Except for BP in Black and White males
Improvements in fitness
23
Pharmacologic intervention
5/16/2018
9
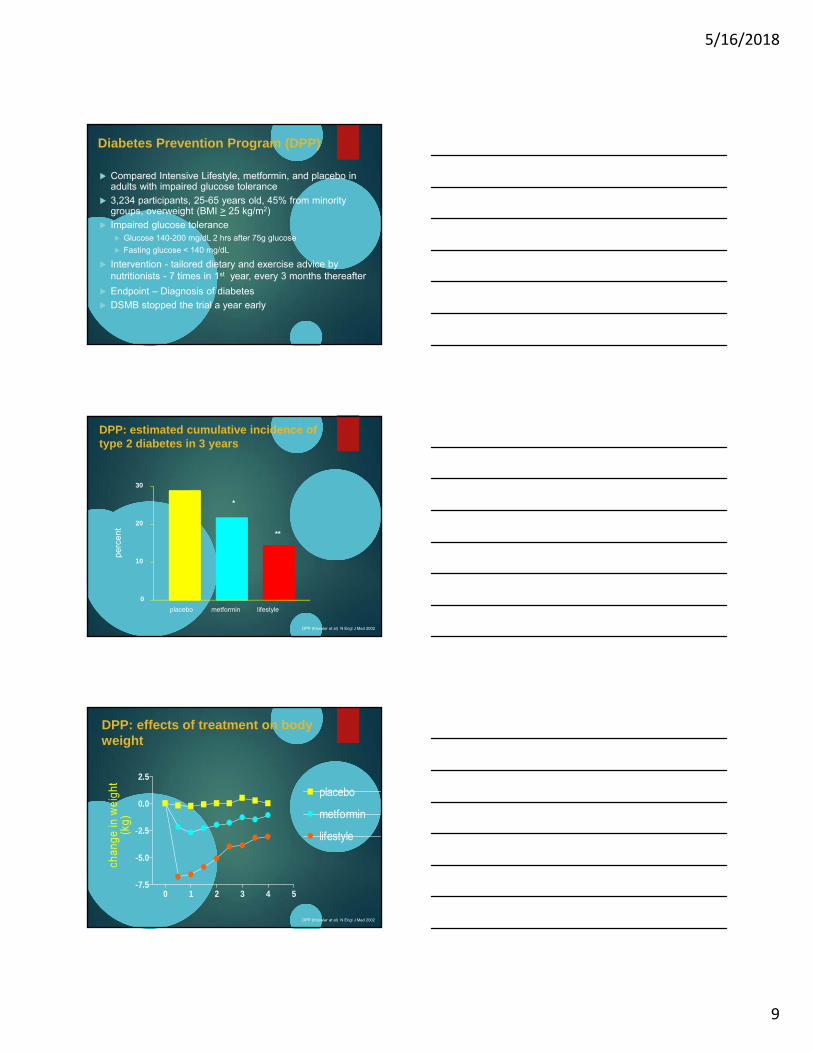
Compared Intensive Lifestyle, metformin, and placebo in adults with impaired glucose tolerance
3,234 participants, 25-65 years old, 45% from minority groups, overweight (BMI > 25 kg/m2)
Impaired glucose tolerance Glucose 140-200 mg/dL 2 hrs after 75g glucose
Fasting glucose < 140 mg/dL
Intervention - tailored dietary and exercise advice by nutritionists - 7 times in 1st year, every 3 months thereafter
Endpoint – Diagnosis of diabetes
DSMB stopped the trial a year early
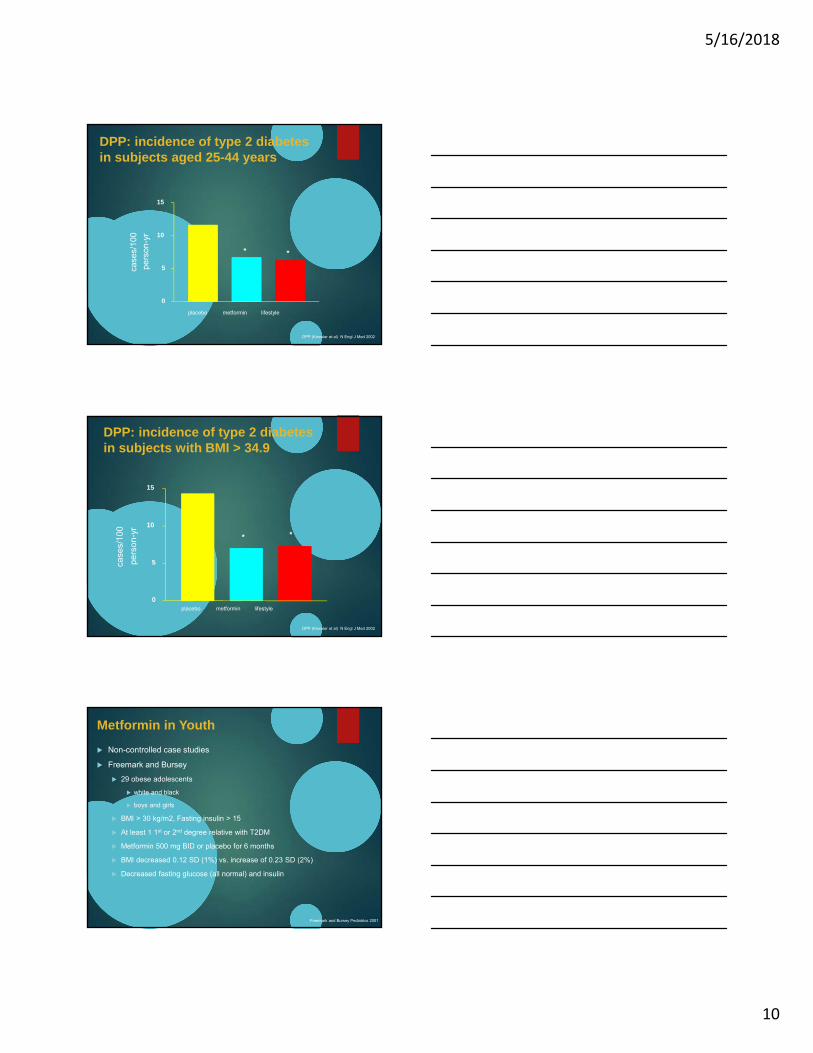
Diabetes Prevention Program (DPP)
DPP: estimated cumulative incidence of type 2 diabetes in 3 years
DPP (Knowler et al) N Engl J Med 2002
placebo metformin lifestyle
*
**
0
10
20
30
perc
ent
DPP: effects of treatment on body weight
0 1 2 3 4 5-7.5
-5.0
-2.5
0.0
2.5
placebo
metformin
lifestyle
chan
ge in
wei
ght
(kg)
DPP (Knowler et al) N Engl J Med 2002
5/16/2018
10
DPP: incidence of type 2 diabetesin subjects aged 25-44 years
placebo metformin lifestyle
* *
0
5
10
15
case
s/10
0
pers
on-y
r
DPP (Knowler et al) N Engl J Med 2002
DPP: incidence of type 2 diabetesin subjects with BMI > 34.9
placebo metformin lifestyle
* *
0
5
10
15
case
s/10
0
pers
on-y
r
DPP (Knowler et al) N Engl J Med 2002
Metformin in Youth
Non-controlled case studies
Freemark and Bursey
29 obese adolescents
white and black
boys and girls
BMI > 30 kg/m2, Fasting insulin > 15
At least 1 1st or 2nd degree relative with T2DM
Metformin 500 mg BID or placebo for 6 months
BMI decreased 0.12 SD (1%) vs. increase of 0.23 SD (2%)
Decreased fasting glucose (all normal) and insulin
Freemark and Bursey Pediatrics 2001
5/16/2018
11
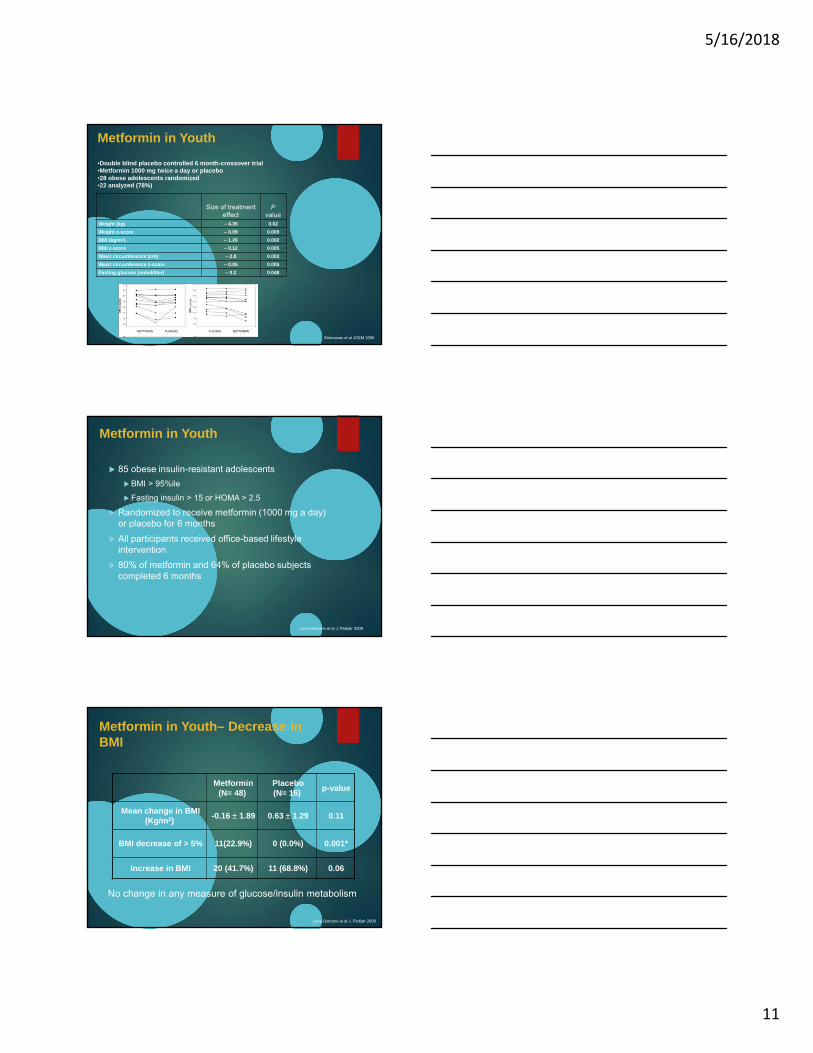
Metformin in Youth
Size of treatment effect
Pvalue
Weight (kg) – 4.35 0.02
Weight z-score – 0.09 0.009
BMI (kg/m2) – 1.26 0.002
BMI z-score – 0.12 0.005
Waist circumference (cm) – 2.8 0.003
Waist circumference z-score – 0.05 0.005
Fasting glucose (mmol/liter) – 0.2 0.048
Srinivasan et al JCEM 2006
•Double blind placebo controlled 6 month-crossover trial•Metformin 1000 mg twice a day or placebo•28 obese adolescents randomized•22 analyzed (78%)
Metformin in Youth
85 obese insulin-resistant adolescents
BMI > 95%ile
Fasting insulin > 15 or HOMA > 2.5
Randomized to receive metformin (1000 mg a day) or placebo for 6 months
All participants received office-based lifestyle intervention
80% of metformin and 64% of placebo subjects completed 6 months
Love-Osborne et al J. Pediatr 2008
Metformin (N= 48)
Placebo (N= 16)
p-value
Mean change in BMI(Kg/m2)
-0.16 1.89 0.63 1.29 0.11
BMI decrease of > 5% 11(22.9%) 0 (0.0%) 0.001*
Increase in BMI 20 (41.7%) 11 (68.8%) 0.06
Metformin in Youth– Decrease in BMI
Love-Osborne et al J. Pediatr 2008
No change in any measure of glucose/insulin metabolism
5/16/2018
12
DPP for Youth?
Progression to diabetes is ~10% in 2 years among obese NHB youth in 2 years
Progression to diabetes is ~ 7% in 8 years in insulin-resistant Hispanic adolescents with NGT
Assume metformin reduces progression by the same order of magnitude as in IGT adults (~0.3% progression vs ~0.5% every 6 months)
Assume 5% dropout every 6 months
Study would need 5000 kids and last 6 years to get 80% power to see the difference.
Implications
Prediabetes is a high risk state for progression to diabetes in adults, but implication in kids is unclear
“high-normal” glucose and A1c may be normal in puberty
More likely to regress due to changes in insulin resistance of puberty
Value of screening is unclear
Overt diabetes remains rare (< 0.4% in high-risk kids)
Value of identifying prediabetes in kids is unclear – all obese kids deserve intervention
A1c an imperfect, but efficient, approach to evaluation of high-risk kids
A1c > 6% has increased risk for progression
Other abnormalities associated with obesity are more common than pre-diabetes and there is evidence base for treatment
Hypertension, dyslipidemia, hepatic steatosis, sleep disturbance, mood disorder, disturbed eating etc
Deanna
16 year old Latina female diagnosed with type 2 diabetes 3 years ago by primary doctor
Started on metformin 2000 mg/d, but reports that she took this for only a few months
One month ago, she was admitted to hospital following a suicide attempt Noted to have a glucose of 550 ng/dL (30.5 mmol/L) and
glucosuria, with small ketones, normal pH, and normal electrolytes
HbA1c 12.5%
Started on basal insulin and discharged
5/16/2018
13
Of the following, which is the most important next test to order?
A. Fasting lipid panel
B. Liver enzymes
C. Pancreatic autoantibodies
D. Self-monitored glucose for one week
E. Stimulated C-peptide
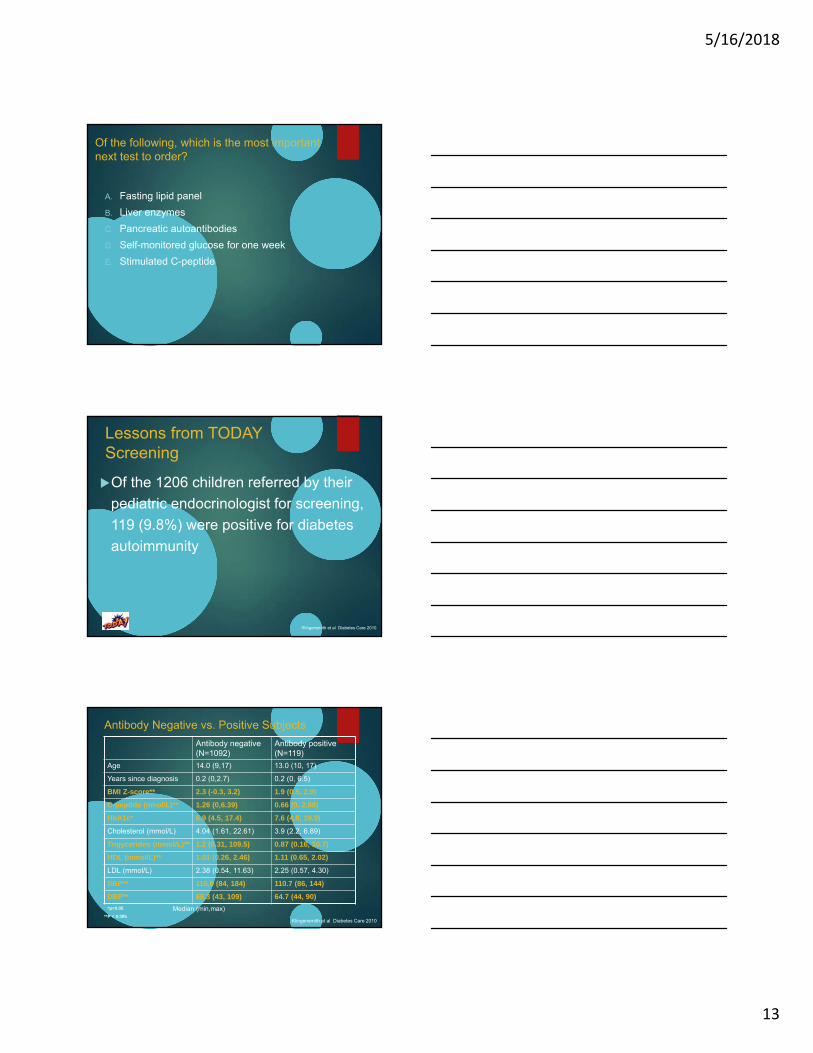
Lessons from TODAY Screening
Of the 1206 children referred by their
pediatric endocrinologist for screening,
119 (9.8%) were positive for diabetes
autoimmunity
Klingensmith et al Diabetes Care 2010
Antibody Negative vs. Positive Subjects
Antibody negative(N=1092)
Antibody positive(N=119)
Age 14.0 (9,17) 13.0 (10, 17)
Years since diagnosis 0.2 (0,2.7) 0.2 (0, 6.5)
BMI Z-score** 2.3 (-0.3, 3.2) 1.9 (0.5, 2.9)
C-peptide (nmol/L)** 1.26 (0,6.39) 0.66 (0, 2.88)
HbA1c* 6.9 (4.5, 17.4) 7.6 (4.8, 19.9)
Cholesterol (mmol/L) 4.04 (1.61, 22.61) 3.9 (2.2, 6.89)
Trigycerides (mmol/L)** 1.2 (0.31, 109.5) 0.87 (0.16, 10.7)
HDL (mmol/L)** 1.01 (0.26, 2.46) 1.11 (0.65, 2.02)
LDL (mmol/L) 2.38 (0.54, 11.63) 2.25 (0.57, 4.30)
SBP** 115.0 (84, 184) 110.7 (86, 144)
DBP** 68.3 (43, 109) 64.7 (44, 90)
*p<0.05
**P < 0.005
Median (min,max)
Klingensmith et al Diabetes Care 2010
5/16/2018
14
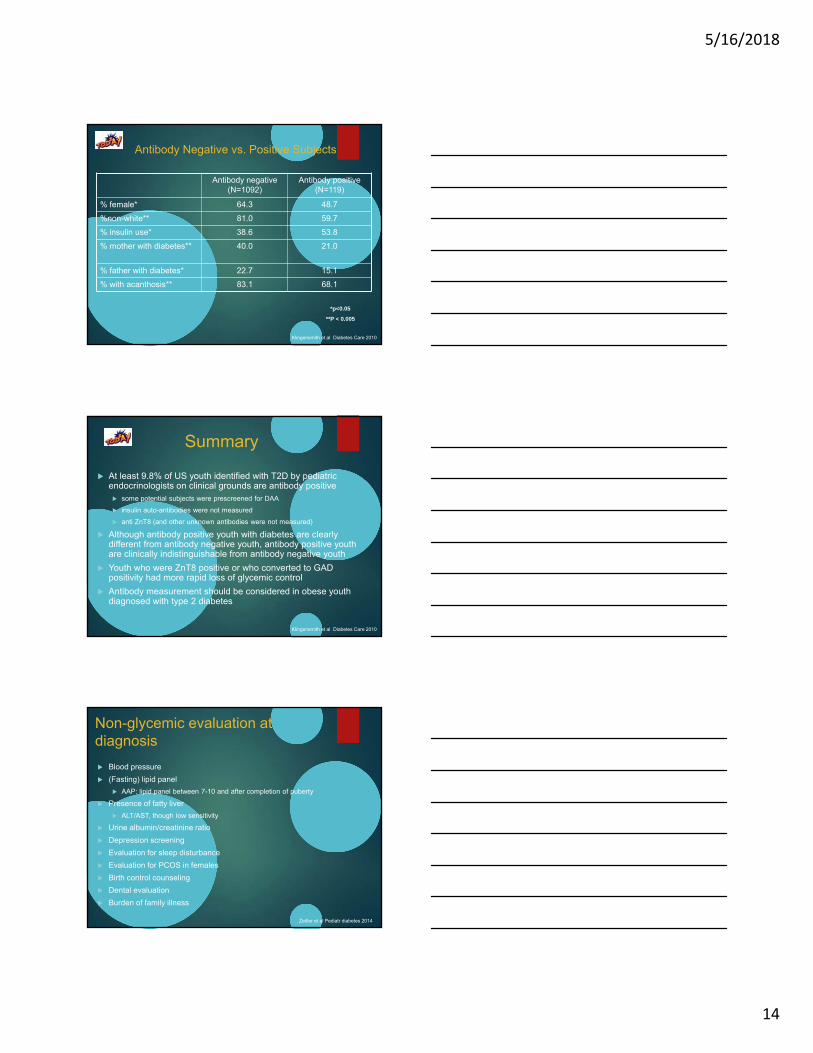
Antibody Negative vs. Positive Subjects
Antibody negative(N=1092)
Antibody positive(N=119)
% female* 64.3 48.7
%non-white** 81.0 59.7
% insulin use* 38.6 53.8
% mother with diabetes** 40.0 21.0
% father with diabetes* 22.7 15.1
% with acanthosis** 83.1 68.1
*p<0.05
**P < 0.005
Klingensmith et al Diabetes Care 2010
Summary
At least 9.8% of US youth identified with T2D by pediatric endocrinologists on clinical grounds are antibody positive some potential subjects were prescreened for DAA
insulin auto-antibodies were not measured
anti ZnT8 (and other unknown antibodies were not measured)
Although antibody positive youth with diabetes are clearly different from antibody negative youth, antibody positive youth are clinically indistinguishable from antibody negative youth
Youth who were ZnT8 positive or who converted to GAD positivity had more rapid loss of glycemic control
Antibody measurement should be considered in obese youth diagnosed with type 2 diabetes
Klingensmith et al Diabetes Care 2010
Non-glycemic evaluation at diagnosis
Blood pressure
(Fasting) lipid panel
AAP: lipid panel between 7-10 and after completion of puberty
Presence of fatty liver
ALT/AST, though low sensitivity
Urine albumin/creatinine ratio
Depression screening
Evaluation for sleep disturbance
Evaluation for PCOS in females
Birth control counseling
Dental evaluation
Burden of family illness
Zeitler et al Pediatr diabetes 2014
5/16/2018
15
Ongoing screening
HbA1c every 3-4 months
BP – every visit
Lipid panel: annual
Foot exam/MNSI/monofilament testing – annual
Eye exam – annual/every 2 years
Dental cleaning and exam – every 6 months
Sleep apnea screen every visit
? Vitamin D
Depression screen: every visit
Zeitler et al Pediatr diabetes 2014
Katz et al Diabetes Care. 2016
Depression in youth-onset type 2
Depression is common in US youth with type 2 diabetes, though not at higher rates than obese youth without diabetes
A greater percentage of participants with low adherence had clinically significant depressive symptoms at baseline (18% vs. 12%)
The odds of medication nonadherence increased significantly from those reporting ≥ 1 major life stressor (OR 1.58) to those reporting ≥ 4 major life stressors (OR 2.70)
Significant odds of elevated depressive symptoms and impaired QoL were also found with increased reporting of major stressors
Larkin et al Diabetes Manag (Lond). 2015
Depression and quality of life
At baseline, 22.2% of participants demonstrated impaired HRQOL
Depressive symptoms distinguished those with impaired HRQOL and were significantly related to later impaired HRQOL
Other comorbidities did not have a significant impact on HRQOL
Physical Health Psychological Health
5/16/2018
16
Arturo
15 yo Latino male with fasting glucose of 289 mg/dL (16 mmol/L) at yearly exam
BMI 32 Kg/M2, BP 120/65, Tanner 5.
Antibodies (GAD, IA2, ZnT8, mIAA) negative
Of the following, what hemoglobin A1c would you use to decide to start insulin:
A. I would always start insulin
B. 6.5%
C. 7.5%
D. 8.5%
E. 10%
A1c < 8.5%* A1c > 8.5%No Acidosis with or without ketosis
Acidosisand/or DKA
and/or HHNK
•metformin PO bid•Titrate up to 2000 mg per day as tolerated
•basal insulin: start at 0.5 U/kg/day and escalate every 2-3 days based on meter glucose•metformin
•titrate up to 2000 mg per day as tolerated
•Manage DKA or HHNK•IV insulin until acidosis resolves, then subcutaneous
Pancreatic autoantibodies
Continue metforminwean insulin
A1C goals not met
Initiate or continue add-on insulin therapy - basal insulin to max 1.5 unit/kg/day
Continue or initiate MDI insulin therapy
positivenegative
A1C Goals Not Met
New Onset Diabetes in Overweight Youth
Consider other drug therapy
5/16/2018
17
Arturo
15 yo Latino male with fasting glucose of 289 mg/dL (16 mmol/L) at yearly exam
BMI 32 Kg/M2, BP 120/65, Tanner 5.
HbA1c 8.7%
You start him on metformin and titrate to 2000 mg a day
He returns in 3 months
HbA1c is 7.0%
He and his mom report good adherence to metformin
Of the following, the BEST next step in management is:
A. Make no changes - patient is at target
B. Start basal insulin
C. Start GLP-1 agonist
D. Start sulfonylurea
E. Start thiazolidinedione
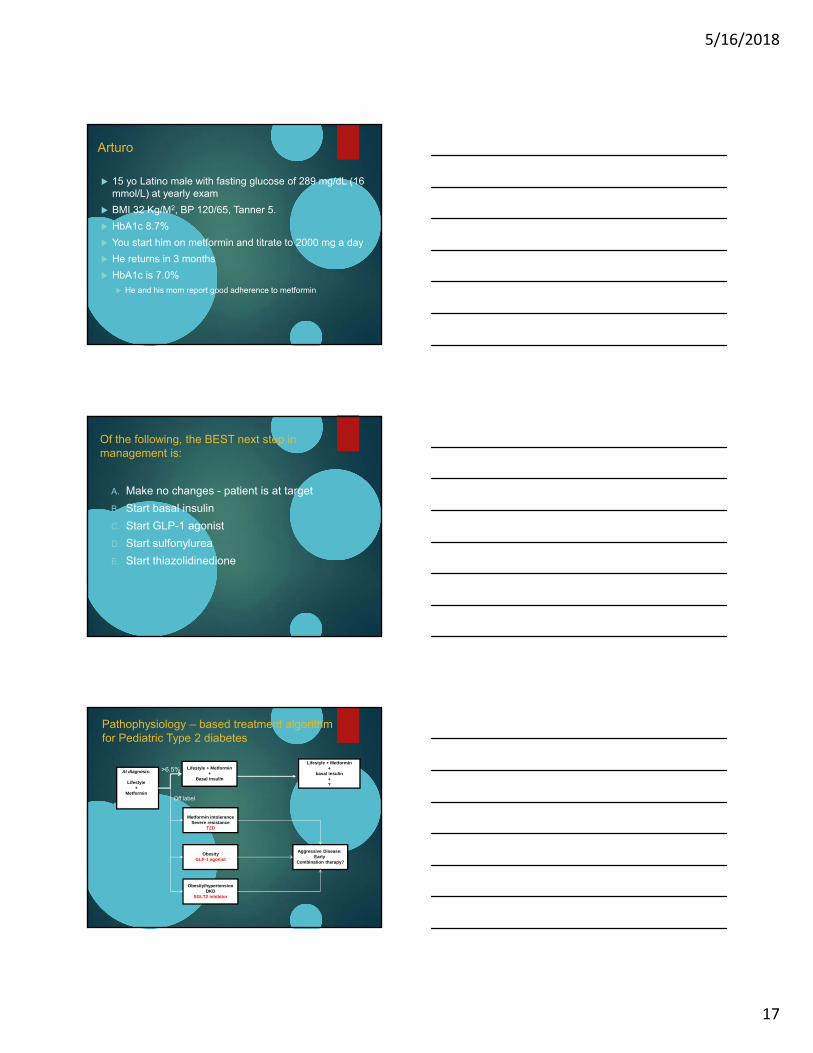
At diagnosis:
Lifestyle+
Metformin
Lifestyle + Metformin+
Basal insulin
Lifestyle + Metformin+
basal insulin+?
>6.5%
Pathophysiology – based treatment algorithm for Pediatric Type 2 diabetes
Metformin intoleranceSevere resistance
TZD
ObesityGLP-1 agonist
Off label
Obesity/hypertensionDKD
SGLT2 inhibitor
Aggressive Disease: Early
Combination therapy?
5/16/2018
18
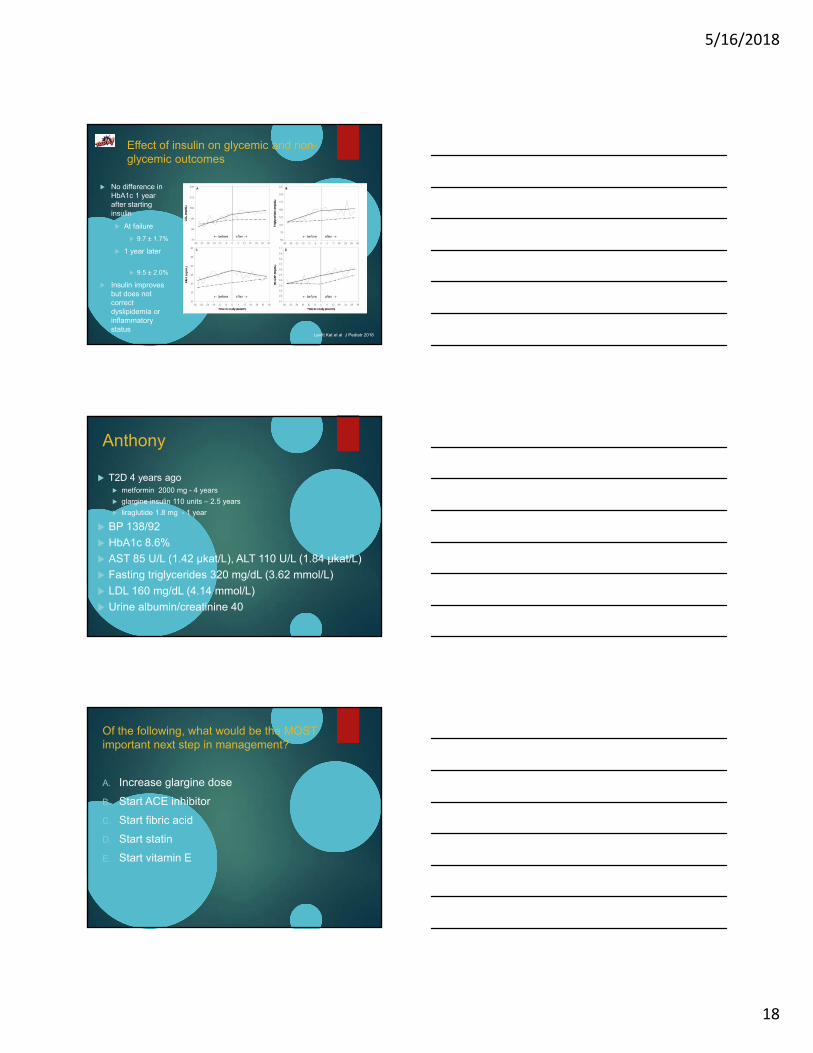
Effect of insulin on glycemic and non-glycemic outcomes
No difference in HbA1c 1 year after starting insulin
At failure
9.7 ± 1.7%
1 year later
9.5 ± 2.0%
Insulin improves but does not correct dyslipidemia or inflammatory status
Levitt Kat et al J Pediatr 2018
Anthony
T2D 4 years ago metformin 2000 mg - 4 years
glargine insulin 110 units – 2.5 years
liraglutide 1.8 mg - 1 year
BP 138/92
HbA1c 8.6%
AST 85 U/L (1.42 µkat/L), ALT 110 U/L (1.84 µkat/L)
Fasting triglycerides 320 mg/dL (3.62 mmol/L)
LDL 160 mg/dL (4.14 mmol/L)
Urine albumin/creatinine 40
Of the following, what would be the MOST important next step in management?
A. Increase glargine dose
B. Start ACE inhibitor
C. Start fibric acid
D. Start statin
E. Start vitamin E
5/16/2018
19
Hypertension
TODAY Diabetes Care 2013
Dyslipidemia
0
2
4
6
8
10
12
14
Base Month 12
Month 24
Month 26
PERC
ENT
LDL> 130
Metformin Met + Rosi Met + L
0
5
10
15
20
25
30
35
Base Month 12 Month 24 Month 36
PERC
ENT
Triglyceride > 150
Metformin Met + Rosi Met + L
TODAY Diabetes Care 2013
ISPAD Lipid Management
LDL Goal: < 130 mg/dL (3.4 mmol/L)
• LDL > goal – diet therapy (7% sat fat, < 200 mg chol)
• LDL > goal after 6 months of TLC
Start statin
Titrate until LDL < 100 mg/dL (2.6 mmol/L)
TG Goal: < 150 mg/dl (1.7 mmol/L) fasting
• TG > 600 mg/dL (6.7 mmol/L)
Start fibrate – to avoid postprandial > 1000 mg/dl
Zeitler et al Pediatr diabetes 2014
5/16/2018
20
Microalbuminuria
TODAY Diabetes Care 2013
Maahs, Diabetes technology and therapeutics 2012
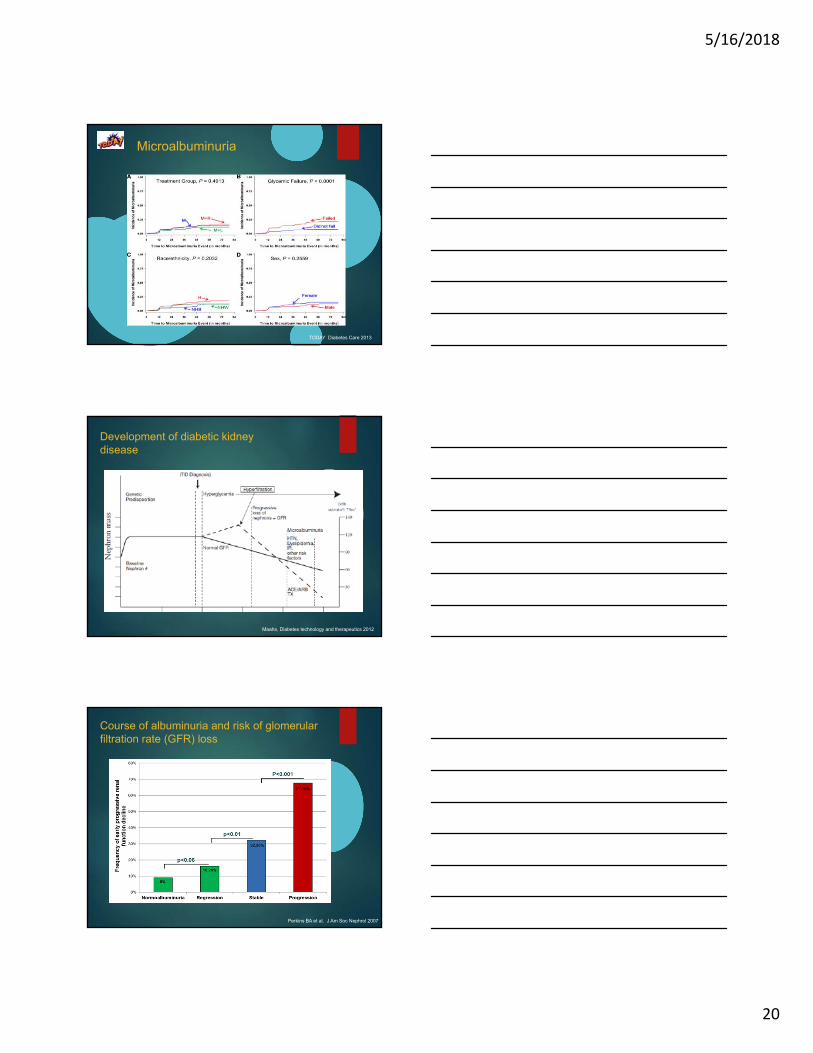
Development of diabetic kidney disease
Course of albuminuria and risk of glomerular filtration rate (GFR) loss
Perkins BA et al. J Am Soc Nephrol 2007
5/16/2018
21
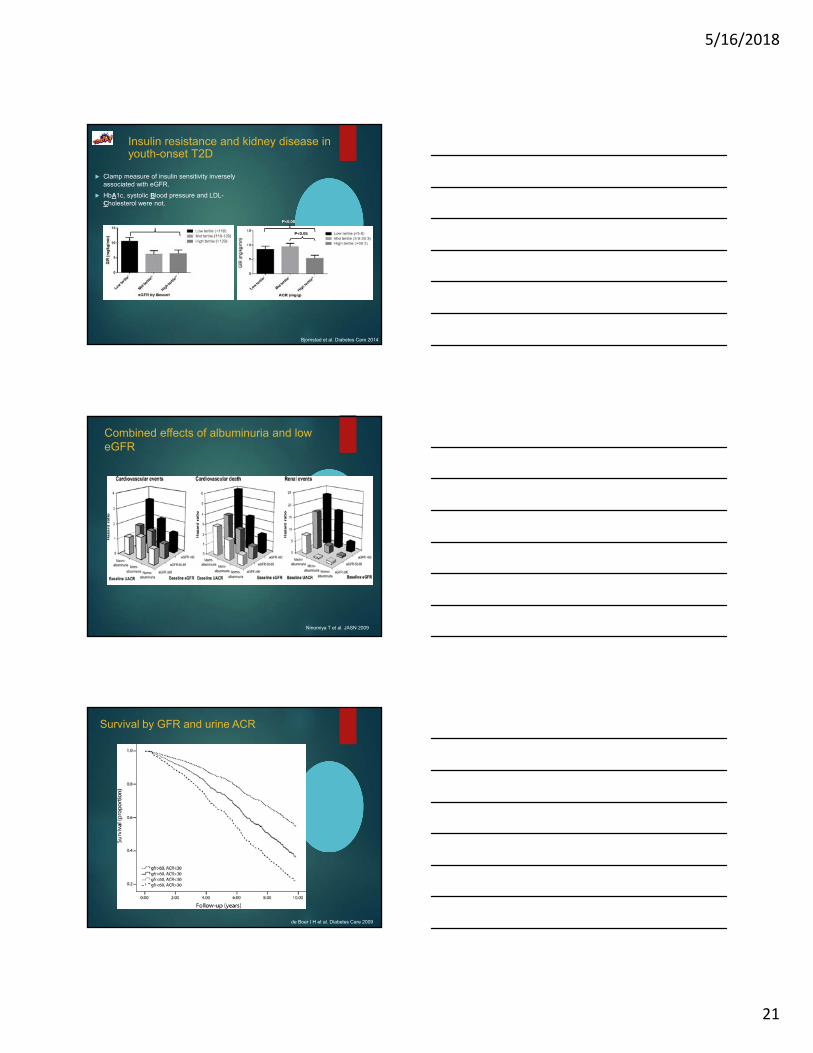
Insulin resistance and kidney disease in youth-onset T2D
Clamp measure of insulin sensitivity inversely associated with eGFR.
HbA1c, systolic Blood pressure and LDL-Cholesterol were not.
P<0.05
P<0.05P<0.05
Bjornstad et al. Diabetes Care 2014
Combined effects of albuminuria and low eGFR
Ninomiya T et al. JASN 2009
Survival by GFR and urine ACR
de Boer I H et al. Diabetes Care 2009
5/16/2018
22
ISPAD: Hypertension and kidney
Blood pressure: Goal < 95%ile for age, sex, and height• if > 95%ile - lifestyle modification
• BP > 95%ile after 6 months
• Start ACE or ARB
• Titrate until BP < 90th %ile
Albumin excretion: goal albumin/creatinine ratio < 30Abnormal: repeat first morning sample; 2 of 3 abnormal is diagnostic
Start ACE - titrate until albumin/creatinine ratio normal
This does not agree with ADA guidelines for adults
ADA
ACR 30-300 – start ACE/ARB if BP elevated
ACR > 300 – start ACE/ARB
Zeitler et al Pediatr diabetes 2014
Retinopathy
Diabetic Retinopathy
HbA1c (%) tertile
N N % OR (95%CL)
4.30-5.92 172 8 4.7
5.93-7.80 173 20 11.6 2.5 (1.1-5.9)
7.81-13.50 172 43 25.0 6.3 (2.8-14.0)
TODAY Diabetes Care 2013
Beyond glycemic control
Morbidity and mortality in adults with type 2 diabetes is predominately related to cardiovascular disease
Hypertension, microalbuminuria, and dyslipidemia are common in youth with T2D at the time of diagnosis
The prevalence of all of these increases over time
In TODAY, glycemic treatment was insufficient to prevent increased prevalence/risk
These results underscore the worrisome prognosis for complications and comorbidities in youth with type 2 diabetes
Kids are going to live a long time with both poor β-cell function and rising comorbidities
More attention is needed to evidence-based approaches to aggressive treatment of comorbidities needed to lower CVD risk in youth with T2D
5/16/2018
23
Thank you for your attention