pearson science stage 5 skills and assessment
TRANSCRIPT
PEARSON
SCIENCESKILLS AND ASSESSMENT
STA
GE
STAGE 5NSW
Sample
page
s

ii Pearson Science Stage 5 | Skills and Assessment ISBN 978 1 4886 2615 9
Working scientifically toolkit 1
Earth and space
The universe
WORKSHEET 1 Features of the universe 86
WORKSHEET 2 Our changing view of the universe 87
WORKSHEET 3 Gravitational attraction 89
WORKSHEET 4 Using evidence to shape the universe 91
PRACTICAL ACTIVITY 1 The distance to the Moon 93
INQUIRY ACTIVITY 1 Redshift and the big bang 95
Plate tectonics
WORKSHEET 1 Structure of Earth 98
WORKSHEET 2 Tsunamis, tectonics and technology 100
WORKSHEET 3 Earthquakes and tectonic plates 102
WORKSHEET 4 Volcanic activity 105
INQUIRY ACTIVITY 1 Modelling mantle movements 108
INQUIRY ACTIVITY 2 Detecting and measuring plate movement 110
Global systems
WORKSHEET 1 Carbon footprints 113
WORKSHEET 2 Renewable power 115
WORKSHEET 3 Measuring climate change 116
PRACTICAL ACTIVITY 1 Water’s role in climate 118
PRACTICAL ACTIVITY 2 Exploring microclimates 121
INQUIRY ACTIVITY 1 Global warming and CO2: Is there a link? 125
DEPTH STUDY Components of the universe 128
Living world
Systems in multicellular organisms
WORKSHEET 1 Treating disease 132
WORKSHEET 2 Healthy eating 134
WORKSHEET 3 Keeping cool 136
WORKSHEET 4 Paying for science 138
PRACTICAL ACTIVITY 1 Plant movement 140
INQUIRY ACTIVITY 1 Model arm 143
Physical world
Motion
WORKSHEET 1 Travelling around NSW 24
WORKSHEET 2 Acceleration, velocity and force 26
WORKSHEET 3 Newton’s three laws 28
PRACTICAL ACTIVITY 1 Exploring velocity: Crash test 30
PRACTICAL ACTIVITY 2 Newton’s first law 33
INQUIRY ACTIVITY 1 Acceleration and speed in a car 36
Energy
WORKSHEET 1 Energy transfers to home and at home 38
WORKSHEET 2 Mission to Mars 39
WORKSHEET 3 Transferring potential to kinetic energy 41
WORKSHEET 4 Choosing a new kettle 43
PRACTICAL ACTIVITY 1 Conservation of energy 45
INQUIRY ACTIVITY 1 The future of nanotechnology 50
Waves
WORKSHEET 1 Wave motion 52
WORKSHEET 2 Acoustic design 53
WORKSHEET 3 Making music 55
PRACTICAL ACTIVITY 1 Mapping the ocean floor 57
PRACTICAL ACTIVITY 2 Investigating solar energy: Black coffee 60
INQUIRY ACTIVITY 1 Echoes 64
Electricity
WORKSHEET 1 Current, voltage and resistance 66
WORKSHEET 2 Applications of circuits 68
WORKSHEET 3 Electricity generation 70
PRACTICAL ACTIVITY 1 Measuring the voltage of elements in series 72
PRACTICAL ACTIVITY 2 Voltage–current characteristics of a resistor 75
INQUIRY ACTIVITY 1 Electric cars 78
DEPTH STUDY The energy efficiency of light bulbs 80
Contents
Sample
page
s

iii ISBN 978 1 4886 2615 9 Pearson Science Stage 5 | Skills and Assessment
DNA and genetics
WORKSHEET 1 Watson and Crick model 145
WORKSHEET 2 Inheritance 147
WORKSHEET 3 Creating clones 149
PRACTICAL ACTIVITY 1 Incomplete dominance in pea plants 151
INQUIRY ACTIVITY 1 Pedigree model 154
INQUIRY ACTIVITY 2 Modelling biotechnology 156
Natural selection and evolution
WORKSHEET 1 Australia’s megafauna 158
WORKSHEET 2 Fossil records 160
WORKSHEET 3 Evolution of primates 163
WORKSHEET 4 Natural selection and malaria 165
INQUIRY ACTIVITY 1 Evolutionary biologist for a day 167
INQUIRY ACTIVITY 2 Bird beaks 169
Ecosystems
WORKSHEET 1 The flow of energy in an ecosystem 171
WORKSHEET 2 The cost of conservation 173
WORKSHEET 3 After disturbance 175
PRACTICAL ACTIVITY 1 Detergents in waterways 177
PRACTICAL ACTIVITY 2 Species richness and abundance 180
INQUIRY ACTIVITY 1 Food-chain model 183
DEPTH STUDY Solving problems with science and technology 185
Chemical world
Atomic theory
WORKSHEET 1 Mass spectrometry 190
WORKSHEET 2 Introducing quarks 191
WORKSHEET 3 Electron energy levels 193
PRACTICAL ACTIVITY 1 Historical development of atomic theory 194
INQUIRY ACTIVITY 1 Metastable atoms 196
INQUIRY ACTIVITY 2 Uses for nuclear energy 199
Atomic structure and the periodic table
WORKSHEET 1 Trends in the periodic table 201
WORKSHEET 2 Predicting the properties of elements 203
WORKSHEET 3 Modelling the structure of the atom 205
PRACTICAL ACTIVITY 1 Metals 207
INQUIRY ACTIVITY 1 Testing materials 210
INQUIRY ACTIVITY 2 Organising the elements 213
Chemical reactions
WORKSHEET 1 Acid rain 215
WORKSHEET 2 Reactivity of metals 217
WORKSHEET 3 Chemistry in your cells 219
PRACTICAL ACTIVITY 1 Conservation of matter 221
PRACTICAL ACTIVITY 2 Evidence of a chemical reaction 223
INQUIRY ACTIVITY 1 Conserving mass in chemical reactions 225
Energy transfer
WORKSHEET 1 Instant cold packs 227
WORKSHEET 2 Rates of reaction 229
WORKSHEET 3 Aluminium and air 232
PRACTICAL ACTIVITY 1 Exothermic or endothermic? 234
PRACTICAL ACTIVITY 2 Energy content of various foods 236
INQUIRY ACTIVITY 1 Steel wool in copper sulfate solution 238
Applications of chemistry
WORKSHEET 1 Plastic bags from milk 240
WORKSHEET 2 Cola myths 241
WORKSHEET 3 The hemp industry 244
PRACTICAL ACTIVITY 1 Fruit batteries 246
INQUIRY ACTIVITY 1 Lab-grown food 249
INQUIRY ACTIVITY 2 Advances in science 251
DEPTH STUDY Investigating tooth decay 253
Sample
page
s
iv Pearson Science Stage 5 | Skills and Assessment ISBN 978 1 4886 2615 9
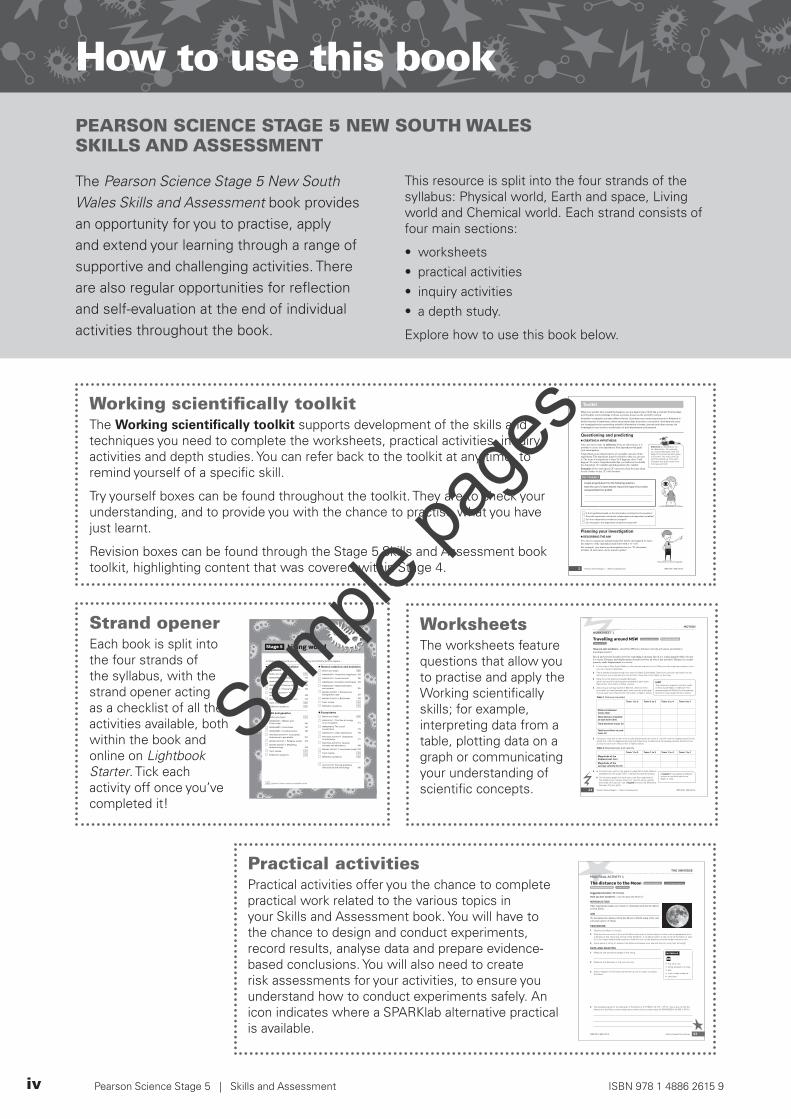
How to use this bookPEARSON SCIENCE STAGE 5 NEW SOUTH WALES SKILLS AND ASSESSMENT
The Pearson Science Stage 5 New South Wales Skills and Assessment book provides an opportunity for you to practise, apply and extend your learning through a range of supportive and challenging activities. There are also regular opportunities for reflection and self-evaluation at the end of individual activities throughout the book.
This resource is split into the four strands of the syllabus: Physical world, Earth and space, Living world and Chemical world. Each strand consists of four main sections:
• worksheets• practical activities• inquiry activities• a depth study.
Explore how to use this book below.
Working scientifically toolkit The Working scientifically toolkit supports development of the skills and techniques you need to complete the worksheets, practical activities, inquiry activities and depth studies. You can refer back to the toolkit at any time, to remind yourself of a specific skill.
Try yourself boxes can be found throughout the toolkit. They are to check your understanding, and to provide you with the chance to practise what you have just learnt.
Revision boxes can be found through the Stage 5 Skills and Assessment book toolkit, highlighting content that was covered within Stage 4.
Strand openerEach book is split into the four strands of the syllabus, with the strand opener acting as a checklist of all the activities available, both within the book and online on Lightbook Starter. Tick each activity off once you’ve completed it!
WorksheetsThe worksheets feature questions that allow you to practise and apply the Working scientifically skills; for example, interpreting data from a table, plotting data on a graph or communicating your understanding of scientific concepts.
Practical activitiesPractical activities offer you the chance to complete practical work related to the various topics in your Skills and Assessment book. You will have to the chance to design and conduct experiments, record results, analyse data and prepare evidence-based conclusions. You will also need to create risk assessments for your activities, to ensure you understand how to conduct experiments safely. An icon indicates where a SPARKlab alternative practical is available.
Pearson Science Stage 5 | Skills and Assessment ISBN 978 1 4886 2615 92
When you wonder why something happens, you are beginning to think like a scientist. Turning ideas and thoughts into knowledge involves a process known as the scientific method.
Scientific investigation can take different forms. Scientists may conduct experiments or fieldwork in which they test a hypothesis, collect and analyse data, and reach a conclusion. Scientists also carry out investigations by researching scientific information in books, journals and other sources. An investigation may involve a combination of both experiments and research.
Questioning and predicting■■ CREATING A HYPOTHESIS
Once you have made an inference from an observation, it is possible to create your hypothesis. Your hypothesis will guide your investigation.
A hypothesis is an educated guess at a possible outcome of the experiment. The hypothesis must be worded so that you can test it. The form of a hypothesis is often ‘If X happens, then Y will happen’. To create a hypothesis like this, you will need to identify the dependent (Y ) variable and independent (X ) variable.
Example: If the wind speed (X ) increases, then the time taken for the clothes to dry (Y ) will decrease.
TRY YOURSELF
Create a hypothesis from the following question.
Does the use of a foam helmet reduce the impact force when someone falls from a bike?
Is the hypothesis based on the information contained in the question?
Does the hypothesis include the independent and dependent variables?
Can the independent variable be changed?
Can changes in the dependent variable be measured?
Planning your investigation■■ DESCRIBING THE AIM
The aim is a statement summarising what will be investigated. It states the purpose of the experiment and starts with a ‘to’ verb.
For example, your aim in an investigation may be: ‘To determine whether oil and water can be mixed together’.
The problem to be investigated...
Toolkit
Inference: an explanation for an observation. For example, you notice that grass near the edge of the road remains green in summer. You may come up with the inference ‘The road insulates the grass roots from the heat and cold’.
Careful observation is essential
M01A_PS5_SAB_1E_26159_FINAL.indd 2 9/10/19 12:02 PM
ISBN: 978 1 4886 2615 9 Physical world: Cells 131
Stage 5 Living world
In Stage 5 Living world, you will use Working scientifically skills to explore …
■■ Systems in multicellular organisms Before you begin LBS
WORKSHEET 1 Treating disease 132
WORKSHEET 2 Healthy eating 134
WORKSHEET 3 Keeping cool 136
WORKSHEET 4 Paying for science 138
PRACTICAL ACTIVITY 1 Plant movement 140
INQUIRY ACTIVITY 1 Model arm 143
Topic review LBS
Reflection questions LBS
■■ DNA and genetics Before you begin LBS
WORKSHEET 1 Watson and Crick model 145
WORKSHEET 2 Inheritance 147
WORKSHEET 3 Creating clones 149
PRACTICAL ACTIVITY 1 Incomplete dominance in pea plants 151
INQUIRY ACTIVITY 1 Pedigree model 154
INQUIRY ACTIVITY 2 Modelling biotechnology 156
Topic review LBS
Reflection questions LBS
■■ Natural selection and evolution Before you begin LBS
WORKSHEET 1 Australia’s megafauna 158
WORKSHEET 2 Fossil records 160
WORKSHEET 3 Evolution of primates 163
WORKSHEET 4 Natural selection and malaria 165
INQUIRY ACTIVITY 1 Evolutionary biologist for a day 167
INQUIRY ACTIVITY 2 Bird beaks 169
Topic review LBS
Reflection questions LBS
■■ Ecosystems Before you begin LBS
WORKSHEET 1 The flow of energy in an ecosystem 171
WORKSHEET 2 The cost of conservation 173
WORKSHEET 3 After disturbance 175
PRACTICAL ACTIVITY 1 Detergents in waterways 177
PRACTICAL ACTIVITY 2 Species richness and abundance 180
INQUIRY ACTIVITY 1 Food-chain model 183
Topic review LBS
Reflection questions LBS
LBS Lightbook Starter questions available online
DEPTH STUDY Solving problems with science and technology 185
M03_PS5_SAB_1E_26159_FINAL.indd 131 9/10/19 12:01 PM
Pearson Science Stage 5 | Skills and Assessment ISBN 978 1 4886 2615 924
WORKSHEET 1
Travelling around NSW Planning Investigations Processing & Analysing Communicating
Have you ever wondered … about the difference between velocity and speed, and distance and displacement?
Speed and velocity describe how fast something is moving. Speed is a scalar quantity while velocity is a vector. Distance and displacement describe how far an object has travelled. Distance is a scalar quantity while displacement is a vector.
1 Find a map of New South Wales on the internet and print it out. Make sure the map has a scale on it so you can measure distances.
2 Plan a holiday journey through four towns in New South Wales. Start from one town and return to the same town; you could use your home town. Draw the route clearly on the map.
3 Determine the distance travelled between each town and the total distance travelled at each town. Record this information in Table 1 below.
4 Assuming an average speed of 80 km/h, determine the time taken to travel between each town and the total travel time at each town. Record this information in Table 1 below.
Table 1 Distance travelled
Town 1 to 2 Town 2 to 3 Town 3 to 4 Town 4 to 1
Distance between towns (km)
Total distance travelled at each town (km)
Time between towns (h)
Total travel time at each town (h)
5 Using your map and a ruler work out the displacement at towns 2, 3 and 4, and the displacement for the whole trip. Use the displacement and total travel time to determine the average velocity (km/h) for the journey to each town. Record this in Table 2 below.
Table 2 Displacement and velocity
Town 1 to 2 Town 1 to 3 Town 1 to 4 Town 1 to 1
Magnitude of the displacement (km)
Magnitude of the average velocity (km/h)
6 a For each town, plot on the graph on page 25 the total distance travelled from the origin (Town 1) versus the total time taken.
b On the same graph, for each town, plot the magnitude of the displacement versus total time. Use the same vertical axis scale as in part (a). Use a legend to show the difference between the two plots.
HINTThe maximum speed on country roads in New South Wales is 100 km/h. The average speed of 80 km/h for this exercise factors in lower speed limits in towns.
MOTION
A legend or key explains different colours or symbols used on a graph or map.
M01_PS5_SAB_1E_26159_FINAL.indd 24 9/10/19 12:04 PM
ISBN 978 1 4886 2615 9 Earth and space: The universe 93
PRACTICAL ACTIVITY 1
The distance to the Moon Planning Investigations Conducting Investigations Processing & Analysing Data Problem Solving
Suggested duration: 30 minutes
Have you ever wondered … how far away the Moon is?
INTRODUCTION This experiment makes use of ratio to determine how far the Moon is from Earth.
AIM To determine the distance from the Moon to Earth using a five cent coin and a piece of string.
PROCEDURE
1 Observe the Moon in the sky.
2 Hold the five cent coin in front of the Moon and move it further away or closer until its appearance from a distance is the same size as that of the full Moon. It could be held so it sits on top of the Moon or next to it. You might need another person to hold the coin, as the distance could be longer than your arm.
3 Use a piece of string to measure the distance between your eye and the coin, and mark its length.
DATA AND ANALYSIS
1 Measure and record the length of the string.
2 Measure the diameter of the five cent coin.
3 Draw a diagram of the experimental set-up (not to scale), including the Moon.
4 The accepted value for the diameter of the Moon is 3 474 000 m (3.474 × 10⁶ m). Use a ratio to find the distance to the Moon, and compare your answer to the correct value of 384 400 000 m (3.844 × 10⁸ m).
MATERIALS
• five cent coin• string (at least 2 m long)• pen• ruler or tape measure• calculator
THE UNIVERSE
M02_PS5_SAB_1E_26159_FINAL.indd 93 9/10/19 11:53 AM
Sample
page
s
v ISBN 978 1 4886 2615 9 Pearson Science Stage 5 | Skills and Assessment | How to use this book
LIGHTBOOK STARTERLightbookStarter
LS LS
LightbookStarter
LS LS
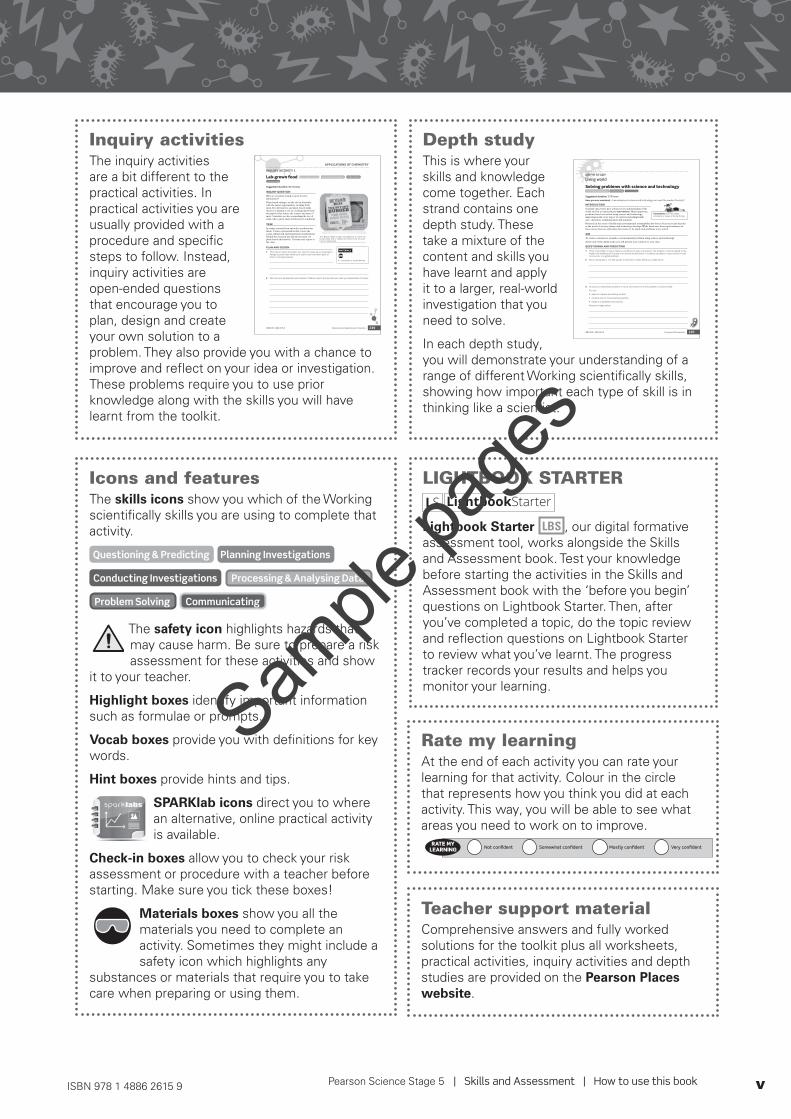
Lightbook Starter LBS , our digital formative assessment tool, works alongside the Skills and Assessment book. Test your knowledge before starting the activities in the Skills and Assessment book with the ‘before you begin’ questions on Lightbook Starter. Then, after you’ve completed a topic, do the topic review and reflection questions on Lightbook Starter to review what you’ve learnt. The progress tracker records your results and helps you monitor your learning.
Teacher support materialComprehensive answers and fully worked solutions for the toolkit plus all worksheets, practical activities, inquiry activities and depth studies are provided on the Pearson Places website.
Inquiry activitiesThe inquiry activities are a bit different to the practical activities. In practical activities you are usually provided with a procedure and specific steps to follow. Instead, inquiry activities are open-ended questions that encourage you to plan, design and create your own solution to a problem. They also provide you with a chance to improve and reflect on your idea or investigation. These problems require you to use prior knowledge along with the skills you will have learnt from the toolkit.
Depth studyThis is where your skills and knowledge come together. Each strand contains one depth study. These take a mixture of the content and skills you have learnt and apply it to a larger, real-world investigation that you need to solve.
In each depth study, you will demonstrate your understanding of a range of different Working scientifically skills, showing how important each type of skill is in thinking like a scientist.
Rate my learning At the end of each activity you can rate your learning for that activity. Colour in the circle that represents how you think you did at each activity. This way, you will be able to see what areas you need to work on to improve.
Icons and featuresThe skills icons show you which of the Working scientifically skills you are using to complete that activity.
Questioning & Predicting Planning Investigations Conducting Investigations Processing & Analysing Data Problem Solving Communicating
The safety icon highlights hazards that may cause harm. Be sure to prepare a risk assessment for these activities and show
it to your teacher.
Highlight boxes identify important information such as formulae or prompts.
Vocab boxes provide you with definitions for key words.
Hint boxes provide hints and tips.
SPARKlab icons direct you to where an alternative, online practical activity is available.
Check-in boxes allow you to check your risk assessment or procedure with a teacher before starting. Make sure you tick these boxes!
Materials boxes show you all the materials you need to complete an activity. Sometimes they might include a safety icon which highlights any
substances or materials that require you to take care when preparing or using them.
249ISBN 978 1 4886 2615 9 Chemical world: Applications of chemistry
INQUIRY ACTIVITY 1
Lab-grown food Questioning & Predicting Processing & Analysing Data Problem Solving Communicating
Suggested duration: 45 minutes
INQUIRY QUESTION Why are scientists trying to grow food in laboratories?
Plant-based eating is on the rise in Australia, with the major supermarkets stocking both meat-free alternatives and plant-based milks. Science is playing a role in creating plant-based alternatives that mimic the texture and taste of meat. Scientists are also researching the use of stem cells to grow meat in laboratory conditions.
TASK In teams, research how meat-free products are made. Create a presentation that covers the social, ethical and environmental considerations behind the research into lab-grown meat (or plant-based alternatives). Present your report to the class.
PLAN AND DESIGN
1 Think about what information you need to create your presentation. Assign yourself roles within your teams and note down each of them in the space below.
2 Plan how you will approach your research. Make a note of the structure you want your presentation to follow.
APPLICATIONS OF CHEMISTRY
MATERIALS
• computer or smart device
The ‘Beyond Meat’ burger uses beetroot to colour the burger patty, and to create juice that mimics the juice from a meat burger.
M04_PS5_SAB_1E_26159_FINAL.indd 249 9/10/19 11:47 AM
185
DEPTH STUDY
Living world
Solving problems with science and technology Processing & Analysing Data Problem Solving Communicating
Suggested duration: 3.75 hours
Have you ever wondered … how advances in science and technology can meet the needs of society?
INTRODUCTION Scientific discoveries have advanced our understanding of the world and led to extraordinary innovations. Many important problems have been solved using science and technology, improving nearly every aspect of our lives including health care, education, communication and transport.
Research in the areas of health and environmental sustainability has been a focus in recent decades as the needs of society change and technology develops. While there have been rapid advances in these areas, there are still many discoveries to be made and problems to be solved.
AIM To create a solution to a health or environmental problem using science and technology.
At the end of the depth study, you will present your solution to your class.
QUESTIONING AND PREDICTING
1 Think of a problem or issue that you would like to learn more about. The problem must be related to the health and wellbeing of humans or an environmental issue. It could be a problem in your school or local community, or a global problem.
2 Work individually or in small groups to brainstorm ideas. Write your ideas below.
3 Once you’ve identified a problem or issue, think about how this problem could be solved.
You can:
• adapt or improve an existing solution
• combine two or more existing solutions
• create a completely new solution.
Write your ideas below.
Innovations are new ideas, products or ways of doing things.
ISBN 978 1 4886 2615 9 Living world: Ecosystems
M03_PS5_SAB_1E_26159_FINAL.indd 185 9/10/19 12:01 PM
ISBN 978 1 4886 2614 2 Physical world: Non-contact forces 43
3 A dog has a mass of 30 kg on the Earth. The dog is launched on a space mission to the Moon. What is the mass of the dog on the Moon? How has the weight of the dog changed?
4 Describe how magnets make your life easier by using an everyday object as an example.
5 A student was investigating the conditions needed to make a spark when rubbing wool and glass together. Write a suggested procedure they could use, and highlight what condition they were testing.
6 A student has a cylindrical object with unknown properties. They wish to determine if it has an electric charge or if it is magnetic without touching it with anything. Describe how this could be done.
TAKE THIS FURTHER7 In Marvel Comics there is a supervillain, Magneto, who has the ability to manipulate metals. Write down
your predictions for how he is able to achieve this, and then conduct research to support or disprove your hypothesis. Discuss with your group how you think that this could be achieved in real life.
Worksheet 2
RATE MY LEARNING Not confident Mostly confident Very confidentSomewhat confident
M01_PS4_SAB_1E_26142_2PP.indd 43 09/07/19 11:00 AM
Sample
page
s
ISBN 978 1 4886 2615 9 Physical world: Motion 23
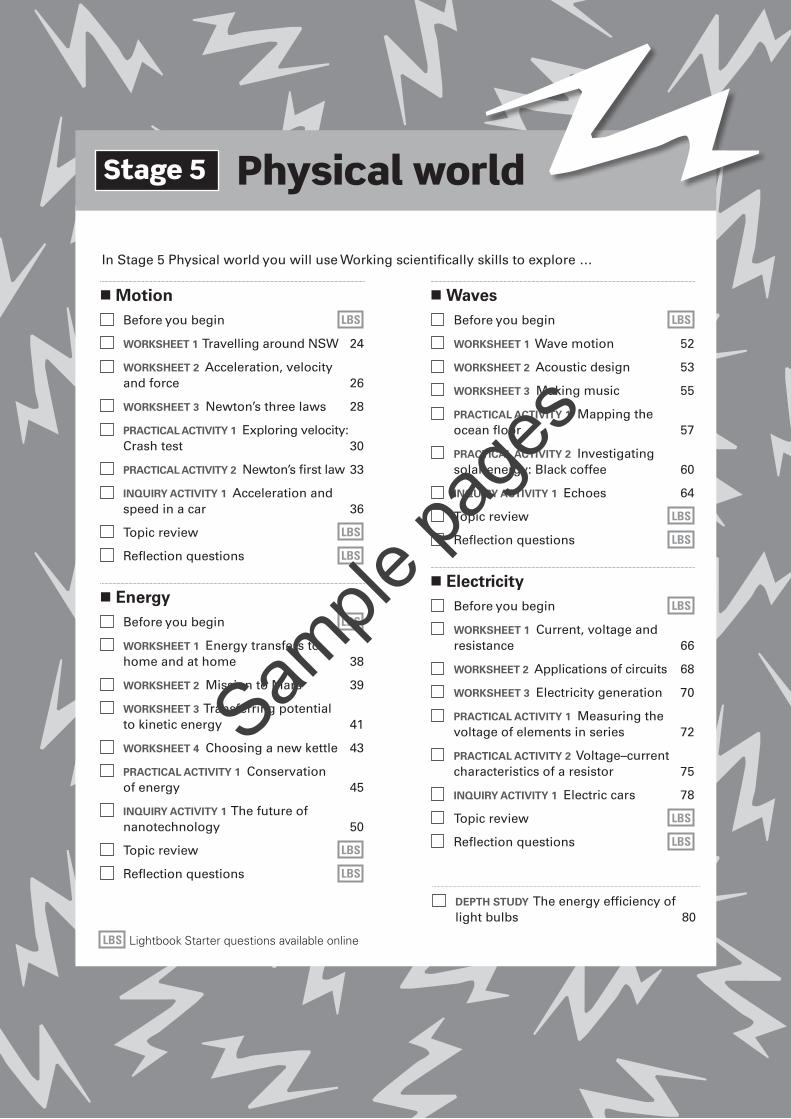
In Stage 5 Physical world you will use Working scientifically skills to explore …
Physical worldStage 5
■■ Motion Before you begin LBS
WORKSHEET 1 Travelling around NSW 24
WORKSHEET 2 Acceleration, velocity and force 26
WORKSHEET 3 Newton’s three laws 28
PRACTICAL ACTIVITY 1 Exploring velocity: Crash test 30
PRACTICAL ACTIVITY 2 Newton’s first law 33
INQUIRY ACTIVITY 1 Acceleration and speed in a car 36
Topic review LBS
Reflection questions LBS
■■ Energy Before you begin LBS
WORKSHEET 1 Energy transfers to home and at home 38
WORKSHEET 2 Mission to Mars 39
WORKSHEET 3 Transferring potential to kinetic energy 41
WORKSHEET 4 Choosing a new kettle 43
PRACTICAL ACTIVITY 1 Conservation of energy 45
INQUIRY ACTIVITY 1 The future of nanotechnology 50
Topic review LBS
Reflection questions LBS
■■ Waves Before you begin LBS
WORKSHEET 1 Wave motion 52
WORKSHEET 2 Acoustic design 53
WORKSHEET 3 Making music 55
PRACTICAL ACTIVITY 1 Mapping the ocean floor 57
PRACTICAL ACTIVITY 2 Investigating solar energy: Black coffee 60
INQUIRY ACTIVITY 1 Echoes 64
Topic review LBS
Reflection questions LBS
■■ Electricity Before you begin LBS
WORKSHEET 1 Current, voltage and resistance 66
WORKSHEET 2 Applications of circuits 68
WORKSHEET 3 Electricity generation 70
PRACTICAL ACTIVITY 1 Measuring the voltage of elements in series 72
PRACTICAL ACTIVITY 2 Voltage–current characteristics of a resistor 75
INQUIRY ACTIVITY 1 Electric cars 78
Topic review LBS
Reflection questions LBS
LBS Lightbook Starter questions available online
DEPTH STUDY The energy efficiency of light bulbs 80
Sample
page
s

Pearson Science Stage 5 | Skills and Assessment ISBN 978 1 4886 2615 924
WORKSHEET 1
Travelling around NSW Planning Investigations Processing & Analysing Communicating
Have you ever wondered … about the difference between velocity and speed, and distance and displacement?
Speed and velocity describe how fast something is moving. Speed is a scalar quantity while velocity is a vector. Distance and displacement describe how far an object has travelled. Distance is a scalar quantity while displacement is a vector.
1 Find a map of New South Wales on the internet and print it out. Make sure the map has a scale on it so you can measure distances.
2 Plan a holiday journey through four towns in New South Wales. Start from one town and return to the same town; you could use your home town. Draw the route clearly on the map.
3 Determine the distance travelled between each town and the total distance travelled at each town. Record this information in Table 1 below.
4 Assuming an average speed of 80 km/h, determine the time taken to travel between each town and the total travel time at each town. Record this information in Table 1 below.
Table 1 Distance travelled
Town 1 to 2 Town 2 to 3 Town 3 to 4 Town 4 to 1
Distance between towns (km)
Total distance travelled at each town (km)
Time between towns (h)
Total travel time at each town (h)
5 Using your map and a ruler work out the displacement at towns 2, 3 and 4, and the displacement for the whole trip. Use the displacement and total travel time to determine the average velocity (km/h) for the journey to each town. Record this in Table 2 below.
Table 2 Displacement and velocity
Town 1 to 2 Town 1 to 3 Town 1 to 4 Town 1 to 1
Magnitude of the displacement (km)
Magnitude of the average velocity (km/h)
6 a For each town, plot on the graph on page 25 the total distance travelled from the origin (Town 1) versus the total time taken.
b On the same graph, for each town, plot the magnitude of the displacement versus total time. Use the same vertical axis scale as in part (a). Use a legend to show the difference between the two plots.
HINTThe maximum speed on country roads in New South Wales is 100 km/h. The average speed of 80 km/h for this exercise factors in lower speed limits in towns.
MOTION
A legend or key explains different colours or symbols used on a graph or map.
Sample
page
s

ISBN 978 1 4886 2615 9 Physical world: Motion 25
7 Plot the magnitude of the average velocity versus time on a second graph, below. Use the same time scale as the first graph so you can compare the two graphs.
TAKE THIS FURTHERLook at the distance from your house to your school. Calculate the total travel time, magnitude of the displacement, and magnitude of the average velocity. In your calculations, use an average speed of 60 km/h.
Worksheet 1
RATE MY LEARNING Not confident Mostly confident Very confidentSomewhat confident
Sample
page
s
Pearson Science Stage 5 | Skills and Assessment ISBN 978 1 4886 2615 926
WORKSHEET 2
Acceleration, velocity and force Questioning & Predicting Planning Investigations Processing & Analysing Data
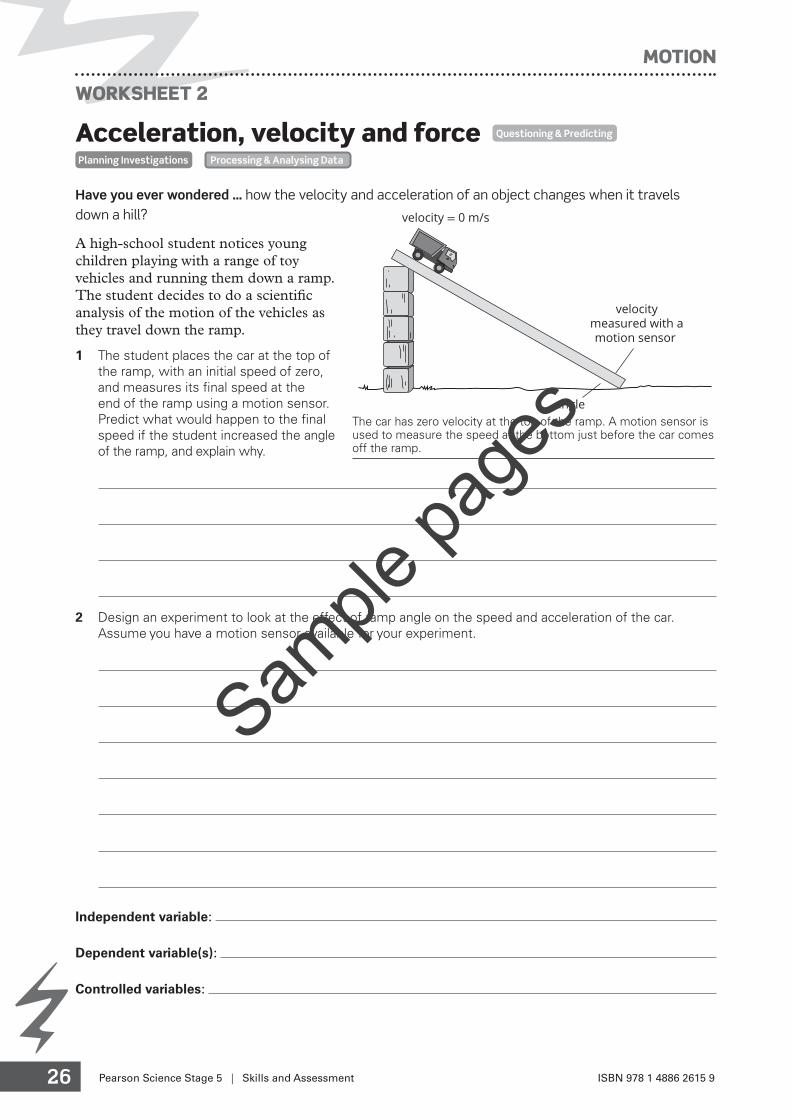
Have you ever wondered … how the velocity and acceleration of an object changes when it travels down a hill?
A high-school student notices young children playing with a range of toy vehicles and running them down a ramp. The student decides to do a scientific analysis of the motion of the vehicles as they travel down the ramp.
1 The student places the car at the top of the ramp, with an initial speed of zero, and measures its final speed at the end of the ramp using a motion sensor. Predict what would happen to the final speed if the student increased the angle of the ramp, and explain why.
2 Design an experiment to look at the effect of ramp angle on the speed and acceleration of the car. Assume you have a motion sensor available for your experiment.
Independent variable:
Dependent variable(s):
Controlled variables:
velocity = 0 m/s
velocitymeasured with amotion sensor
angleThe car has zero velocity at the top of the ramp. A motion sensor is used to measure the speed at the bottom just before the car comes off the ramp.
MOTION
Sample
page
s

ISBN 978 1 4886 2615 9 Physical world: Motion 27
3 Draw a suitable table with headings for your experiment. Assume you can take measurements for two different angles.
4 a Describe the data analysis you would have to do.
b State what force causes the vehicle to accelerate down the ramp.
5 a The student collects the following data and scribbles it down in their book without putting it directly into a table. Place the data in your table and calculate the acceleration at the two angles.
Angle 30°, initial velocity = 0 m/s Angle 55°, initial velocity = 0 m/s
Measurement 1: Final velocity = 2.64 m/s time taken = 0.58 s
Measurement 1: Final velocity = 3.46 m/s time taken = 0.44 s
Measurement 2: Final velocity = 2.68 m/s time taken = 0.61 s
Measurement 2: Final velocity = 3.58 m/s time taken = 0.47 s
Measurement 3: Final velocity = 2.62 m/s time taken = 0.62 s
Measurement 3: Final velocity = 3.52 m/s time taken = 0.46 s
b Discuss whether the trend of the data matches your prediction.
c Describe what the student needs to do to improve the experiment.
TAKE THIS FURTHERWould the initial velocity change if the truck was at the bottom of the ramp about to be pushed up the ramp?
Worksheet 2
RATE MY LEARNING Not confident Mostly confident Very confidentSomewhat confident
Sample
page
s

Pearson Science Stage 5 | Skills and Assessment ISBN 978 1 4886 2615 928
WORKSHEET 3
Newton’s three laws Processing & Analysing Data
Have you ever wondered … how forces affect motion?
1 A bike pump works in the following way. When the handle is pulled up, air is drawn into the main cylinder. Pushing down on the handle compresses the air in the main cylinder and forces it into the bike tyre.
Use a bike pump and consider the forces acting on the handle as you push down.
a Using a black pen or pencil, draw and label all of the forces acting on the pump handle in the figure to the right.
b In a different colour, draw the reaction force of the pump handle acting on the hand. Which of Newton’s laws is relevant here?
2 a Arrange to travel as a passenger in a car and place a light box, with low friction, on your legs. You should sit with your thighs horizontal. Place the box on the middle of your thighs and observe what happens in the following situations. Draw on each diagram the net force acting for each situation and explain what is happening.
Car accelerates Car travels at constant speed Car slows down or decelerates
Observation: Observation: Observation:
Explanation: Explanation: Explanation:
b State which of Newton’s laws is relevant here.
MOTION
Sample
page
s

ISBN 978 1 4886 2615 9 Physical world: Motion 29
3 A person is pushing a shopping trolley filled with shopping. The following graph shows how the acceleration of the trolley varies with the force used to push it.
0 0.1 0.2 0.3 0.4 0.5 0.6 0.70
5
10
15
20
25
35
30
40
Acceleration (m/s2)
Force versus acceleration
Forc
e (N
)
a State which of Newton’s laws is relevant here.
b Use the graph to determine the force required to accelerate the trolley at 0.45 m/s2. Draw lines on the graph to show your working.
c From this information determine the total mass of the trolley and the shopping.
d Check your value for the mass using another point on the graph.
e On the same axes, draw the expected shape of the graph if the total mass were doubled.
TAKE THIS FURTHERIn the Marvel comics there is a supervillain, Juggernaut, who is physically unstoppable once he is in motion. Using your knowledge of Newton’s laws, discuss with your classmates why this is or isn’t possible.
Worksheet 3
RATE MY LEARNING Not confident Mostly confident Very confidentSomewhat confident
Sample
page
s

Pearson Science Stage 5 | Skills and Assessment ISBN 978 1 4886 2615 930
PRACTICAL ACTIVITY 1
Exploring velocity: Crash test Questioning & Predicting Conducting Investigations Processing & Analysing Data
Suggested duration: 50 minutes
Have you ever wondered … why an object keeps moving after a collision?
INTRODUCTIONNewton’s first law of motion states that an object in motion will continue that motion with constant speed in a straight line unless a force acts on it. This resistance to a change in motion is referred to as inertia. A person riding in a car is traveling at the same rate as the car. If the car suddenly stops due to an outside force acting on it, such as from a tree, the person would continue moving forward due to their inertia, until a force is applied to him or her. Inertia is why someone who is not wearing a seatbelt could get ejected from the car, since there is no force acting to prevent their forward motion.
AIM To investigate the relationship between velocity and the distance an object is thrown after a collision.
HYPOTHESIS
1 Write a prediction of how velocity will affect the distance a bean bag is thrown after a collision.
2 Based on your prediction, write a hypothesis for this investigation.
MOTION
MATERIALS
• data-collection system• motion sensor• dynamics track• dynamics cart or toy car• marble• small bean bag• tape• metre ruler
Sample
page
s

ISBN 978 1 4886 2615 9 Physical world: Motion 31
PROCEDURE
1 Set up the motion track on the floor, ensuring there is enough clear area for the bean bag to be thrown from the cart without hitting anything.
2 Incline the motion track using books or the adjustable feet at one end of the track.
3 Using the metre ruler, determine the height of the track at the raised end. Record this as the height 1 measurement in Table 1 in the Data and analysis section.
4 Place a textbook at the lower end of the motion track so the cart will collide with its bound side.
5 Attach the motion sensor to the track, making sure the gold disk is perpendicular to the track.
6 Place the bean bag at the front of the cart, sitting as if it were driving.
7 Mark the spot where the cart will hit the book with a small strip of tape on the floor.
8 Start a new experiment on the data-collection system.
9 Connect the motion sensor to the data-collection system. Create a graph with velocity on the y-axis and time on the x-axis.
10 Hold the cart in position at the top of the track, begin data recording and release the cart. When the cart stops moving, stop data recording.
11 Measure the distance from the collision spot (marked with tape) to the middle of the bean bag, to the nearest 0.1 cm. Record this distance in Table 1 in the Data and analysis section.
12 From your velocity graph, determine the maximum velocity of the cart. Record this in Table 2.
13 Repeat this test for a total of three trials for this height of the track. Record all results in Table 1.
14 After completing three trials for the first height of the motion track, change the height of the track. Measure the new height of the track at the inclined end. Carry out three collisions for this height of the track. Record all results (distance travelled and maximum velocity) in Table 1.
15 After completing three trials for height 2 of the motion track, change the height of the track. Measure the new height of the track at the inclined end. Carry out three collisions for this height of the track. Record all results (distance travelled and maximum velocity) in Table 1.
DATA AND ANALYSIS
Table 1 Collected data
Height 1: cm Height 2: cm Height 3: cm
Distance bean bag travelled (cm)
Distance bean bag travelled (cm)
Distance bean bag travelled (cm)
Trial 1
Trial 2
Trial 3
Maximum velocity of cart (m/s)
Maximum velocity of cart (m/s)
Maximum velocity of cart (m/s)
Trial 1
Trial 2
Trial 3
Practical activity 1
HINTBe careful converting between centimetres and metres when calculating the velocity.
Sample
page
s

Pearson Science Stage 5 | Skills and Assessment ISBN 978 1 4886 2615 932
1 Average your results for each trial. Record the results of these calculations in Table 2 below.
Table 2 Average distance and velocity
Average maximum velocity for all trials (m/s)
Average maximum distance for all trials (cm)
Height 1
Height 2
Height 3
2 On the graph below, plot the average distance against the average maximum velocity.
CONCLUSION
3 Look over your experimental results in Table 1. Do your results agree with your hypothesis? Why or why not? Explain your thinking.
4 What property of matter causes the bean bag to carry on travelling for a distance after the cart has stopped?
HINTBe careful to label units correctly on your graph axes. Height and distance have been measured in cm, but the velocity from the motion sensor will be given in m/s.
Practical activity 1
RATE MY LEARNING Not confident Mostly confident Very confidentSomewhat confident
Sample
page
s

ISBN 978 1 4886 2615 9 Physical world: Motion 33
PRACTICAL ACTIVITY 2
Newton’s first law Questioning & Predicting Conducting Investigations Processing & Analysing Data
Suggested duration: 50 minutes
Have you ever wondered … how force affects an object’s motion?
INTRODUCTION In physics, a force is a push or a pull on an object. Discuss with your lab group some examples of forces you commonly encounter and write them in the space below.
Isaac Newton is known for his work on forces; in fact, the SI unit of force is called the newton (N). Newton derived three laws of motion that describe the effects of forces acting on objects. Newton’s first law of motion states that an object at rest stays at rest, or that an object in motion stays in motion, unless an external force is exerted upon that object. Newton’s first law is commonly called the law of inertia.
AIM To investigate how applied forces change an object’s motion.
Inertia means resistance to change. The amount of inertia an object has depends on its mass.
MOTION
Sample
page
s
Pearson Science Stage 5 | Skills and Assessment ISBN 978 1 4886 2615 934
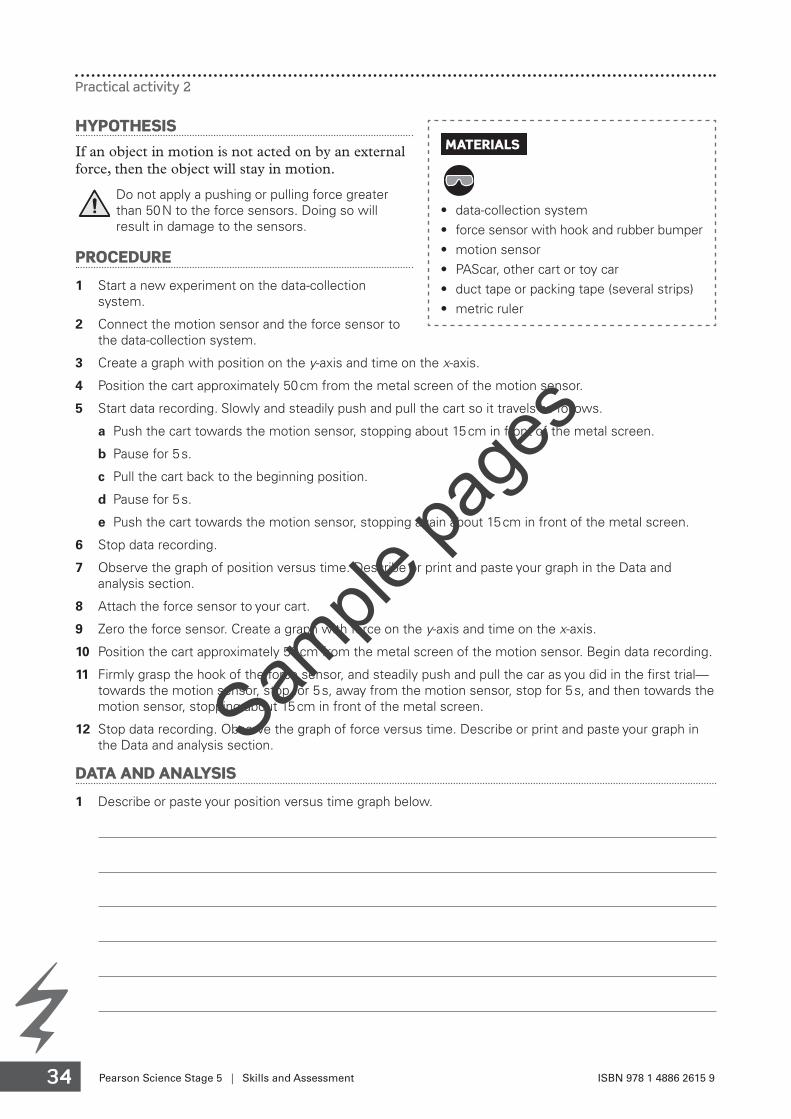
HYPOTHESIS If an object in motion is not acted on by an external force, then the object will stay in motion.
Do not apply a pushing or pulling force greater than 50 N to the force sensors. Doing so will result in damage to the sensors.
PROCEDURE
1 Start a new experiment on the data-collection system.
2 Connect the motion sensor and the force sensor to the data-collection system.
3 Create a graph with position on the y-axis and time on the x-axis.
4 Position the cart approximately 50 cm from the metal screen of the motion sensor.
5 Start data recording. Slowly and steadily push and pull the cart so it travels as follows.
a Push the cart towards the motion sensor, stopping about 15 cm in front of the metal screen.
b Pause for 5 s.
c Pull the cart back to the beginning position.
d Pause for 5 s.
e Push the cart towards the motion sensor, stopping again about 15 cm in front of the metal screen.
6 Stop data recording.
7 Observe the graph of position versus time. Describe or print and paste your graph in the Data and analysis section.
8 Attach the force sensor to your cart.
9 Zero the force sensor. Create a graph with force on the y-axis and time on the x-axis.
10 Position the cart approximately 50 cm from the metal screen of the motion sensor. Begin data recording.
11 Firmly grasp the hook of the force sensor, and steadily push and pull the car as you did in the first trial—towards the motion sensor, stop for 5 s, away from the motion sensor, stop for 5 s, and then towards the motion sensor, stopping about 15 cm in front of the metal screen.
12 Stop data recording. Observe the graph of force versus time. Describe or print and paste your graph in the Data and analysis section.
DATA AND ANALYSIS
1 Describe or paste your position versus time graph below.
Practical activity 2
MATERIALS
• data-collection system • force sensor with hook and rubber bumper • motion sensor• PAScar, other cart or toy car• duct tape or packing tape (several strips)• metric ruler
Sample
page
s
ISBN 978 1 4886 2615 9 Physical world: Motion 35
2 Describe or paste your force versus time graph below.
CONCLUSION
3 Newton’s first law can be stated as: ‘Every object that is standing still stays standing still, and every object that is moving keeps on moving, unless some outside force acts upon that object’. Suppose Newton was referring to the cart you just used in this investigation. What outside forces acted on the cart?
4 What evidence do you see in your graphs of position and force versus time that supports Newton’s idea?
Practical activity 2
RATE MY LEARNING Not confident Mostly confident Very confidentSomewhat confident
Sample
page
s

Pearson Science Stage 5 | Skills and Assessment ISBN 978 1 4886 2615 936
INQUIRY ACTIVITY 1
Acceleration and speed in a car Planning Investigations Conducting Investigations Processing & Analysing Data Problem Solving Communicating
Suggested duration: 120 minutes
INQUIRY QUESTION How does a car’s acceleration vary during a journey?
TASK In this inquiry you are going to take a simple journey in a car. You will need a friend or parent to drive you while you take your observations. Using the in-built accelerometer in your phone or any Apple or Android device, you can measure the acceleration as function of time. Your task is to compare the acceleration you record using your device with the acceleration determined from your observations of the changes in speed of the car over time taken from the car's speedometer. This inquiry activity should be written up as a full laboratory report using a logbook.
PLAN AND DESIGN
MOTION
MATERIALS
• a vehicle• device containing an accelerometer such
as a smartphone or tablet, with SPARKvue 4.0 software (or similar software) installed
• second device to measure time intervals (i.e. the stopwatch on a phone)
Ensure you use a reliable and safe driver and that your seatbelt is on. Use quiet streets with no pedestrians, or a big car park after closing time. Have a third person watch the streets to look out for traffic and pedestrians.
1 Plan the route you are going to take and where you are going to accelerate, travel at a constant speed and decelerate.
2 Determine a plan for taking the following measurements.
a Measure the acceleration as a function of time using a phone or tablet.
b Measure the speed from the car’s speedometer as a function of time.
Note: it is important to be able to match the times for the two measurements.
3 In your logbook, write up your procedure and draw up a suitable table for recording your results. Keep in mind that you will need to produce the following graphs in your analysis of your results:
• speed versus time
• calculated acceleration (found from measuring the speed) versus time
• measured acceleration versus time.
Have you checked your procedure with your teacher?
HINTRemember, acceleration is equal to the change in speed over time.
Sample
page
s

ISBN 978 1 4886 2615 9 Physical world: Motion 37
CREATE
4 Conduct your experiment.
IMPROVE
5 Discuss any issues you faced when designing and carrying out your experiment.
6 How could the experiment be improved?
REFLECT
7 Compare the acceleration calculated from the speed versus time data and the acceleration directly measured from your device. How well did they agree?
8 Compare the shape of the velocity versus time graph with that of the acceleration versus time graph. Did your car accelerate at a constant rate or did it change? How did this affect your measurements?
Inquiry activity 1
RATE MY LEARNING Not confident Mostly confident Very confidentSomewhat confident
Sample
page
s