peak effect in superconductors - experimental aspects
DESCRIPTION
Peak effect in Superconductors - Experimental aspects. G. Ravikumar Technical Physics & Prototype Engineering Division, Bhabha Atomic Research Centre, Mumbai. H c2. 0 2.01 × 10 -7 G. cm 2 B = n 0 a 0 ( 0 /B) 1/2 H c1 100 Oe. Abrikosov Vortex solid. H c1. - PowerPoint PPT PresentationTRANSCRIPT

Peak effect in Superconductors - Experimental aspects
G. Ravikumar
Technical Physics & Prototype Engineering Division,
Bhabha Atomic Research Centre, Mumbai
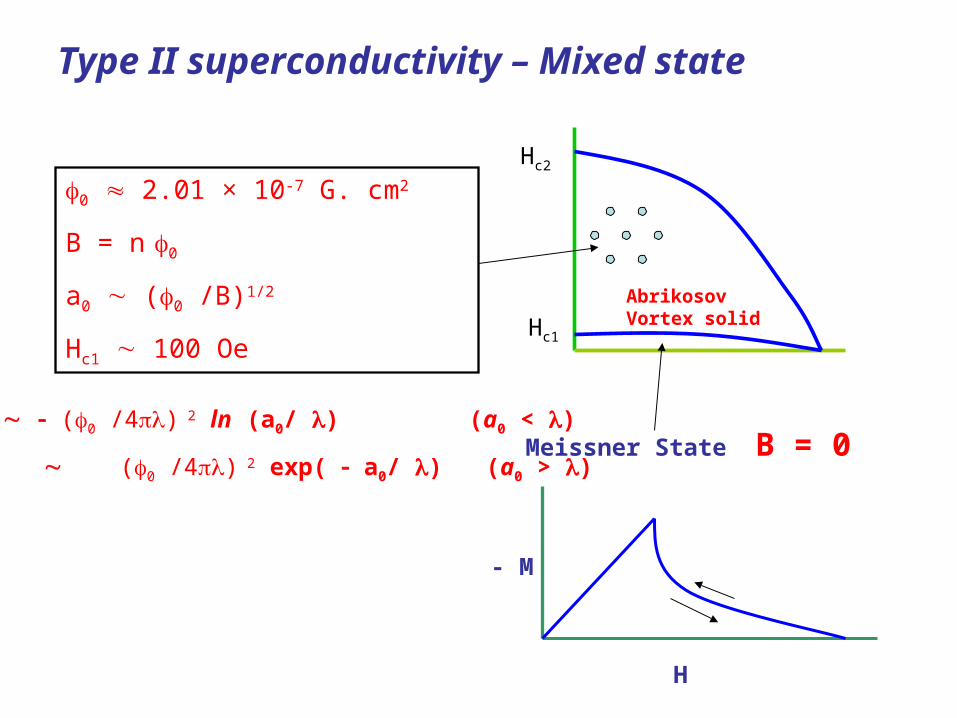
Type II superconductivity – Mixed state
AbrikosovVortex solid
Hc2
0 2.01 × 10⁻⁷ G. cm2
B = n 0
a0 (0 /B)1/2
Hc1 100 OeHc1
Meissner State B = 0Uel (0 /4) 2 ln (a0/ ) (a0 < )
(0 /4) 2 exp( a0/ ) (a0 > )
- M
H

• Lorentz Force
F = J × B
• Causes vortex motion
Electric field
E = v X B
Can not carry any bulk current
Current transport through Abrikosov Vortex lattice

Ic
V
I
Vortex pinning by lattice defects and impurities
Upin = 0Hc23
V = 0 below I = Ic (critical current)
Ic
H / T
Usually Ic is a monotonically decreasing function of H / T
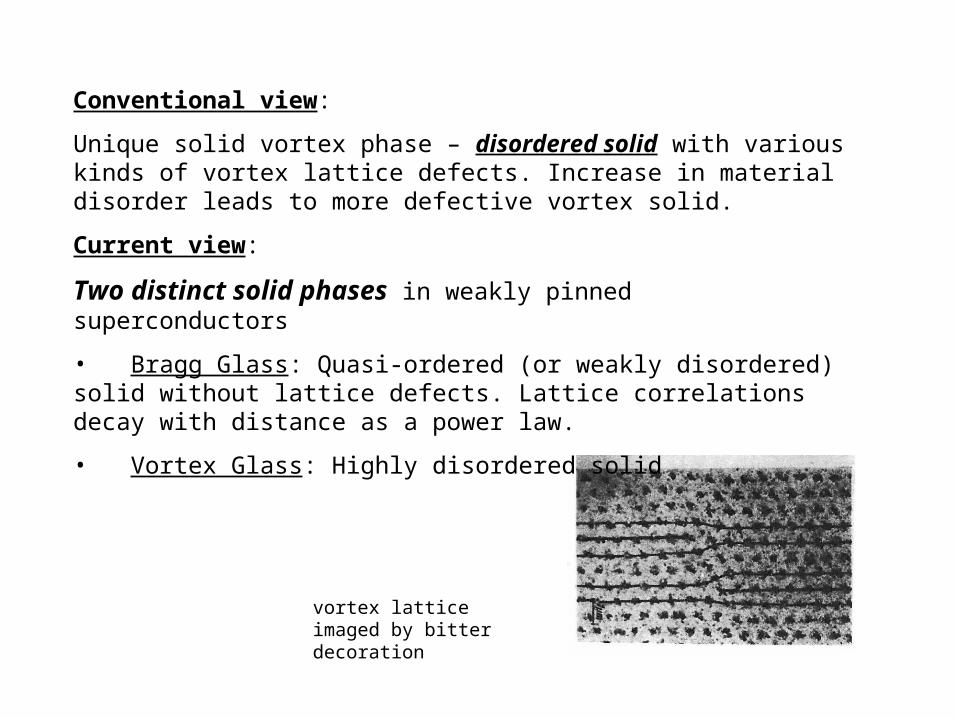
vortex lattice imaged by bitter decoration
Conventional view:
Unique solid vortex phase – disordered solid with various kinds of vortex lattice defects. Increase in material disorder leads to more defective vortex solid.
Current view:
Two distinct solid phases in weakly pinned superconductors
• Bragg Glass: Quasi-ordered (or weakly disordered) solid without lattice defects. Lattice correlations decay with distance as a power law.
• Vortex Glass: Highly disordered solid
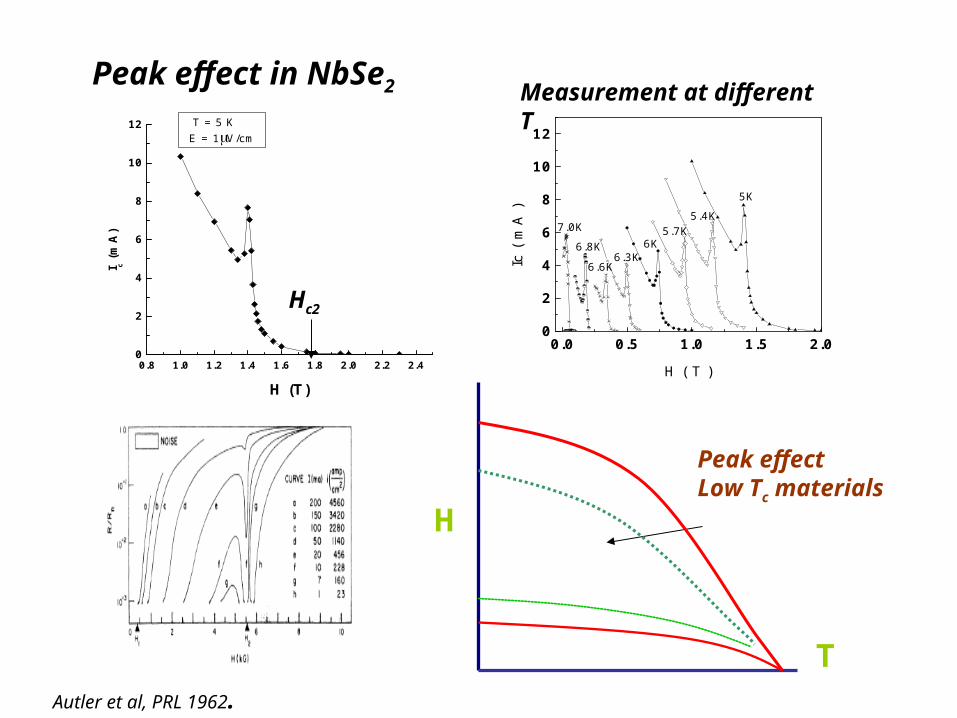
Peak effect in NbSe2
Hc2
Measurement at different T
Autler et al, PRL 1962.
0.8 1.0 1.2 1.4 1.6 1.8 2.0 2.2 2.40
2
4
6
8
10
12I c
(mA
)
H (T)
T = 5 KE = 1V/cm
0.0 0.5 1.0 1.5 2.00
2
4
6
8
10
12
7.0K
6.8K
6.6K6.3K
6K5.7K
5.4K
5K
Ic (
mA
)
H ( T )
H
T
Peak effect Low Tc materials
0.8 1.0 1.2 1.4 1.6 1.8 2.0 2.2 2.40
2
4
6
8
10
12
I c (m
A)
H (T)
T = 5 KE = 1V/cm
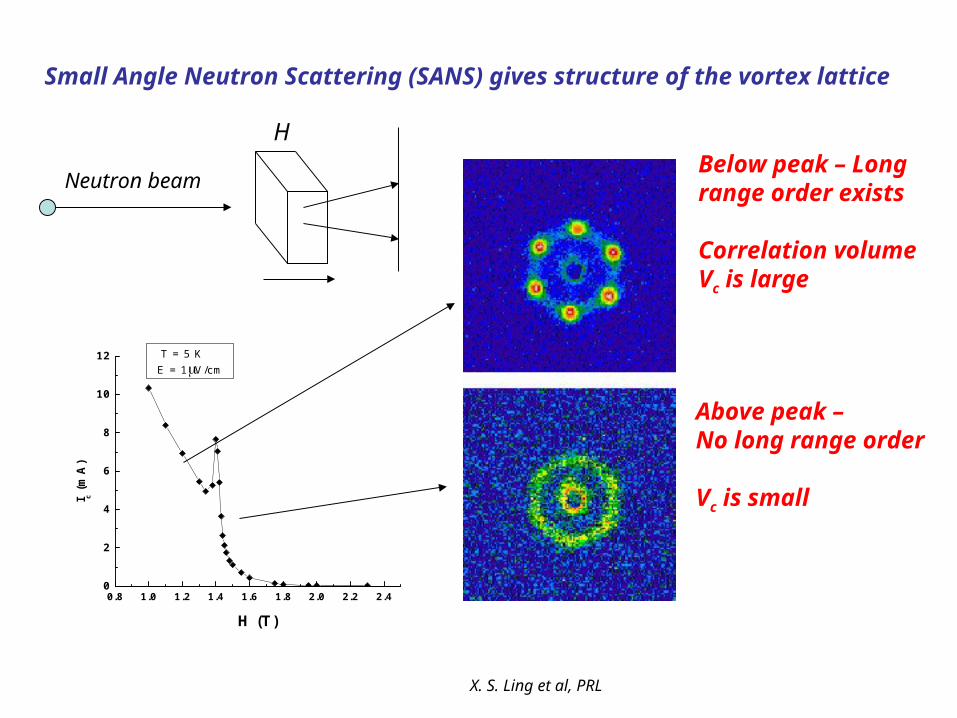
Neutron beam
H
X. S. Ling et al, PRL
Small Angle Neutron Scattering (SANS) gives structure of the vortex lattice
Below peak – Long range order exists
Correlation volumeVc is large
Above peak – No long range order
Vc is small

Peak effect is seen only for weak pinning
• In V3Si defects introduced by fast neutron irradiation.
• At low dose pinning weak – peak is sharp
• Peak broadens with increasing dose (increase in pinning)
• For strong pinning Jc – H is monotonic
Küpfer et al

Jc from Magnetization hysteresis measurements – Critical State Model
• Resistivity = 0 For J < Jc,
0 For J
> Jc
• Persistent currents of density Jc induced in response to field variation
• Direction of currents depends on the direction of field scan
• M (H) = – 0JcR
• M (H) = 0JcR
• Jc(H) = { M (H) – M (H) } / 2 0R
M + Jc R
HH
M - Jc R

Peak effect in magnetization measurements
peak
onset
Critical current vs Field/Temp
Hc2
Jc
H
M
H
Jc(H) ~ M (H)/0R
M
1400 1600 1800 2000 2200 2400 2600
-0.0020
-0.0015
-0.0010
-0.0005
0.0000
0.0005
0.0010
m (
emu)
H (Oe)
NbSe2T = 6.8K
Hc2
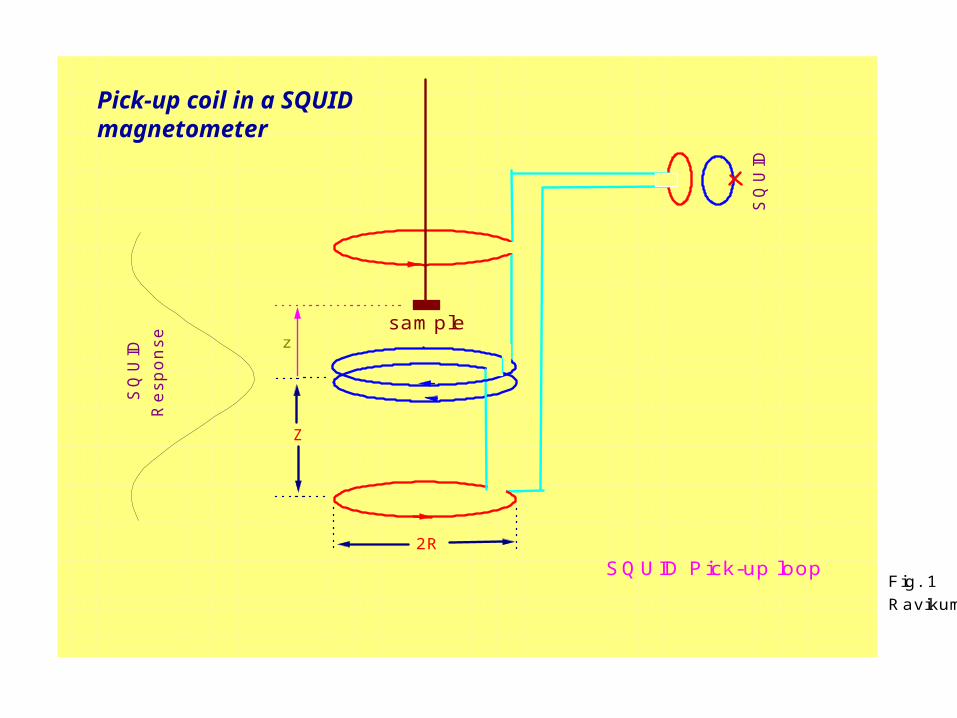
z
SQUID Pick-up loopFig. 1Ravikumar et al
S
QU
IDR
esp
onse
Z
2R
sample
SQ
UID
Pick-up coil in a SQUID magnetometer

Peak effect in LaSrCaCuO (Tc 38 K)
– Peak is broad – Anisotropic
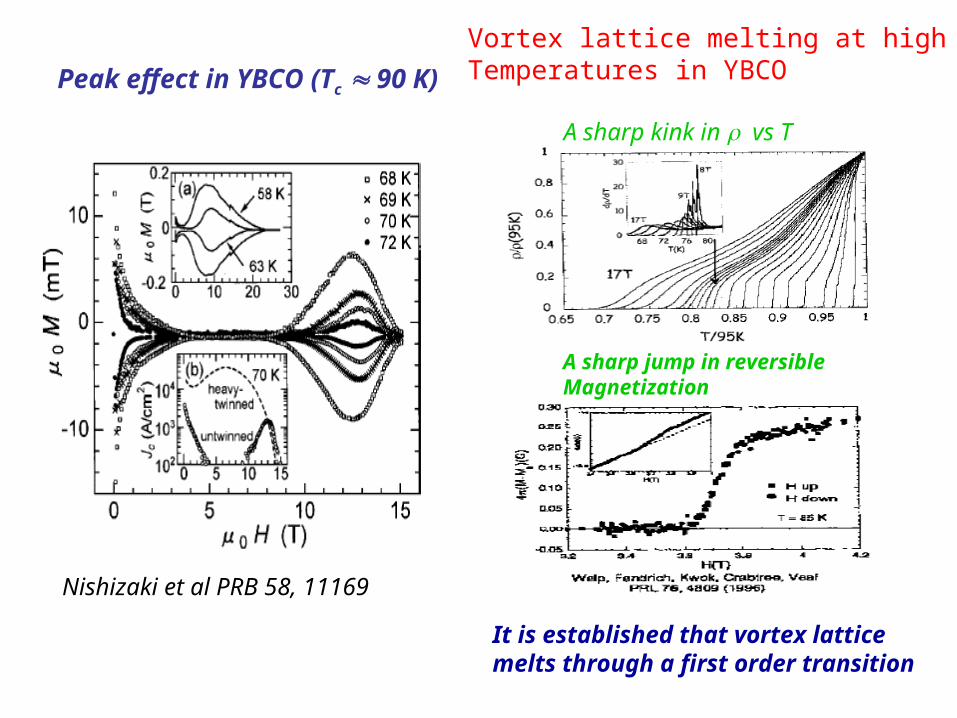
Peak effect in YBCO (Tc 90 K)
Nishizaki et al PRB 58, 11169
Vortex lattice melting at high Temperatures in YBCO
A sharp kink in vs T
A sharp jump in reversible Magnetization
It is established that vortex lattice melts through a first order transition

Phase diagram in YBCO (Tc 90 K)
kT is important in the peak effect regime in addition to Uel and Upin
kTUpin
Uel
Bragg Glass
Bragg Glass – Vortex LiquidTransition is aFirst order transition
Onset
peak
Plastically deformed vortex lattice
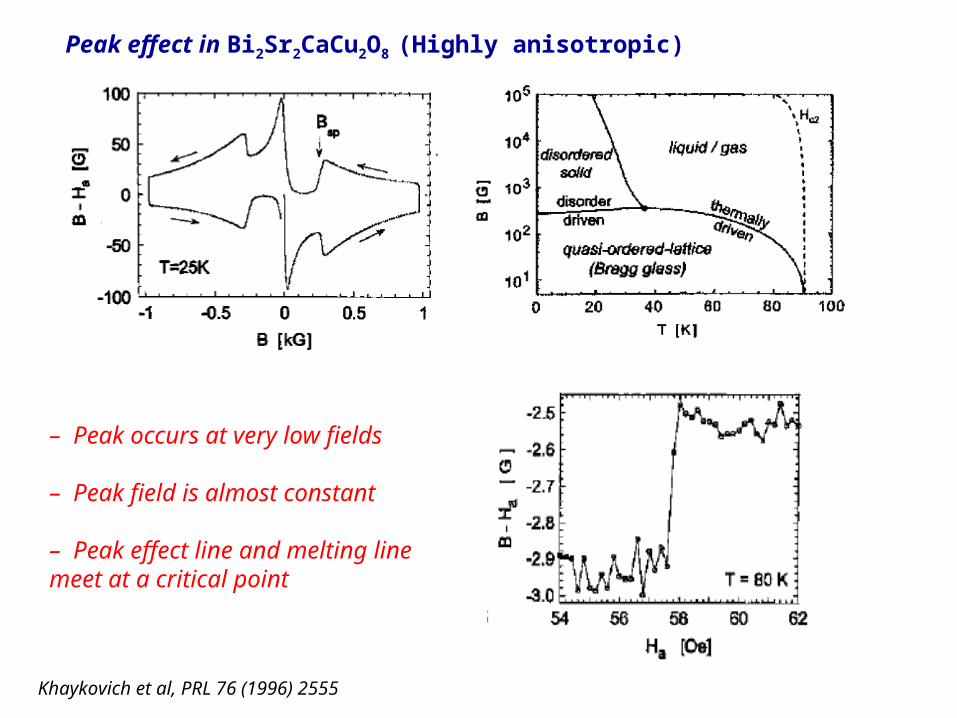
Peak effect in Bi2Sr2CaCu2O8 (Highly anisotropic)
Melting
– Peak occurs at very low fields
– Peak field is almost constant
– Peak effect line and melting line meet at a critical point
Khaykovich et al, PRL 76 (1996) 2555

• Over-doped : Weakest pinning
• Optimally doped : Strongest pinning
Surprisingly Melting line follows the peak effect line

Not the Final Summary
H
T
Peak effect inLow Tc
0.8 1.0 1.2 1.4 1.6 1.8 2.0 2.2 2.40
2
4
6
8
10
12
I c (m
A)
H (T)
T = 5 KE = 1V/cm
Sharp & Just below Hc2
BSCCO YBCO
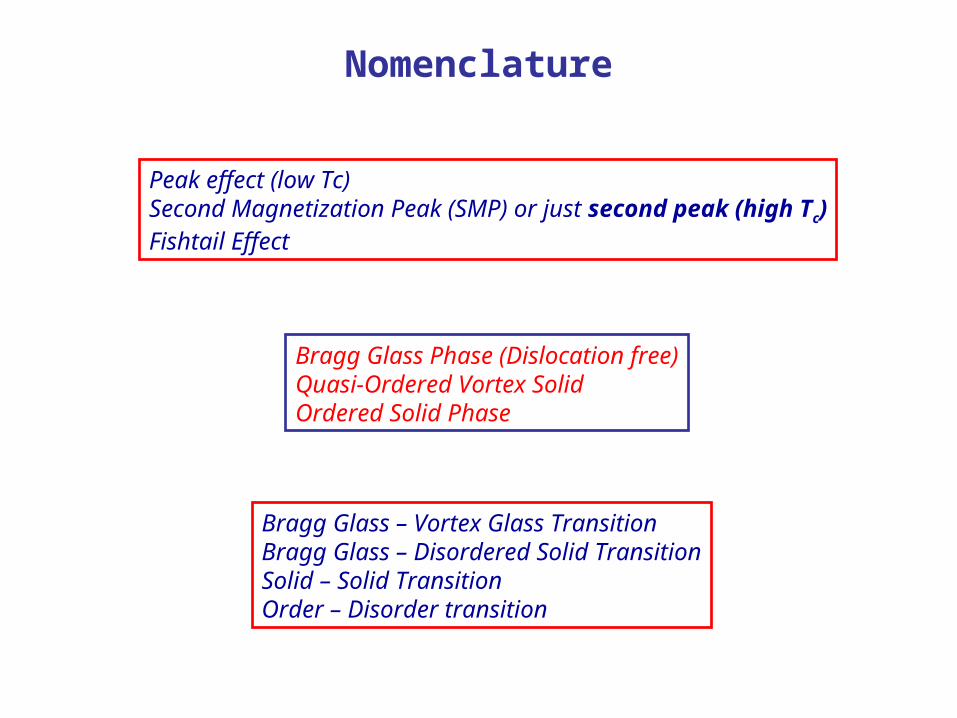
Nomenclature
Peak effect (low Tc)Second Magnetization Peak (SMP) or just second peak (high Tc)Fishtail Effect
Bragg Glass Phase (Dislocation free)Quasi-Ordered Vortex SolidOrdered Solid Phase
Bragg Glass – Vortex Glass TransitionBragg Glass – Disordered Solid TransitionSolid – Solid TransitionOrder – Disorder transition

History dependence in the peak region
Jc depends on how a particular point (H,T) in the phase diagram is approached
ZFC
FC
Hp
Henderson et al PRL (1996)
NbSe2
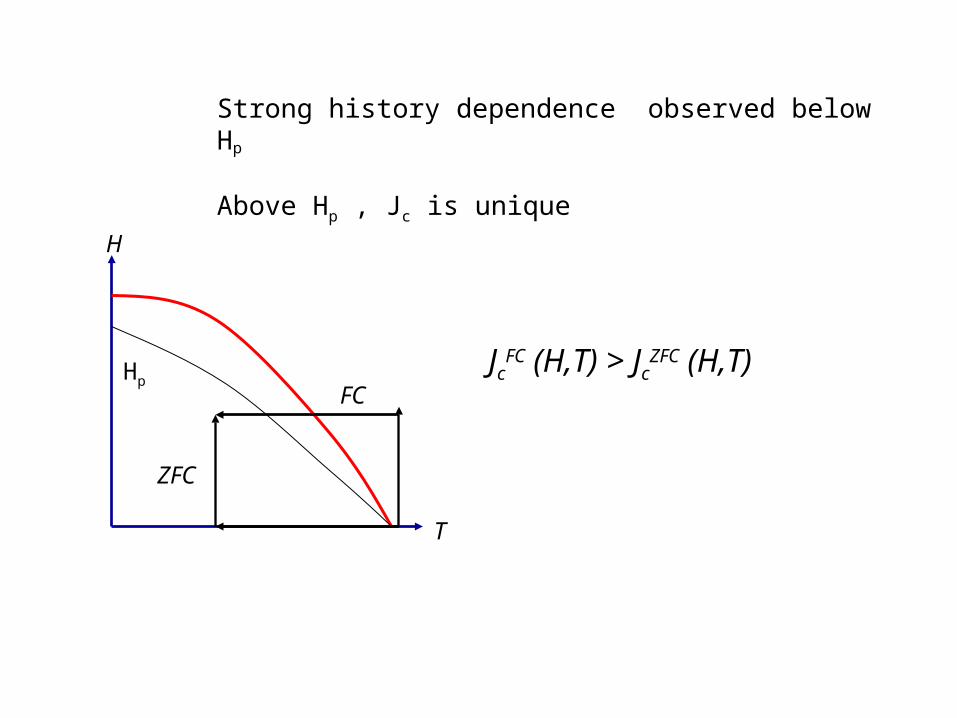
Strong history dependence observed below Hp
Above Hp , Jc is unique
T
H
FC
ZFC
HpJc
FC (H,T) > JcZFC (H,T)
0.4 0.6 0.8 1.0 1.2 1.4
-0.4
-0.2
0.0
0.2
0.4
0.6
Ravikumar et al - fig.2a
Hpl
-
M calculated with 5mmX4mmX0.5mm
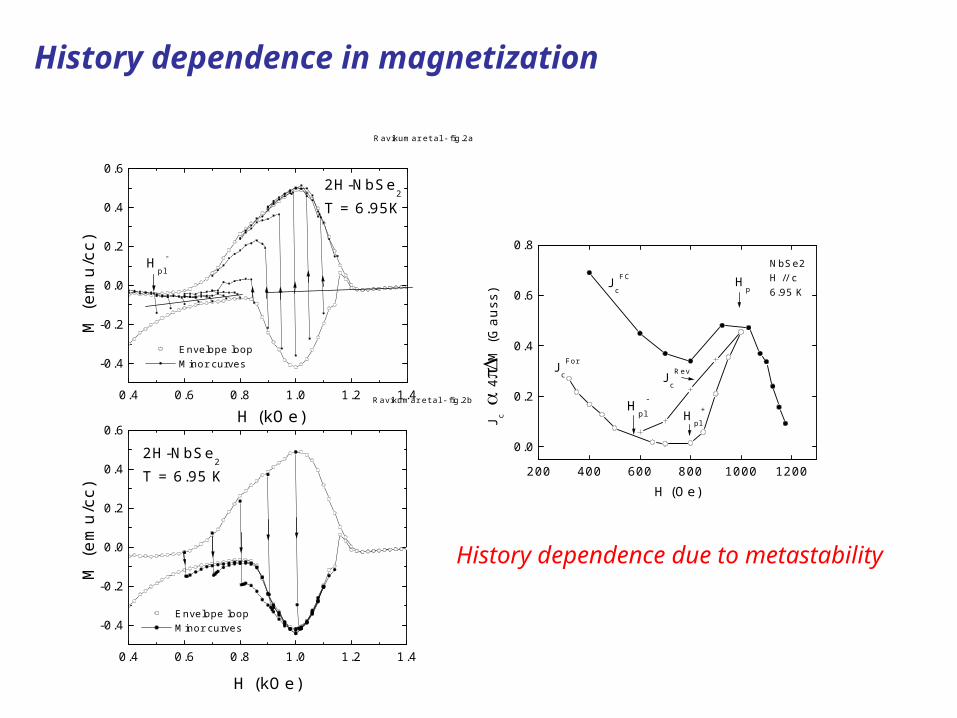
2H-NbSe2
T = 6.95K
Envelope loop Minor curves
M (
emu/
cc)
H (kOe)
0.4 0.6 0.8 1.0 1.2 1.4
-0.4
-0.2
0.0
0.2
0.4
0.6
Ravikumar et al - fig.2b
2H-NbSe2
T = 6.95 K
Envelope loop Minor curves
M (
emu/
cc)
H (kOe)
200 400 600 800 1000 1200
0.0
0.2
0.4
0.6
0.8NbSe2H // c6.95 K
Jc
RevJc
For
Jc
FC Hp
Hpl
+Hpl
-
FC-REV Reverse Forward
J c
4
M (
Gau
ss)
H (Oe)
History dependence in magnetization
History dependence due to metastability
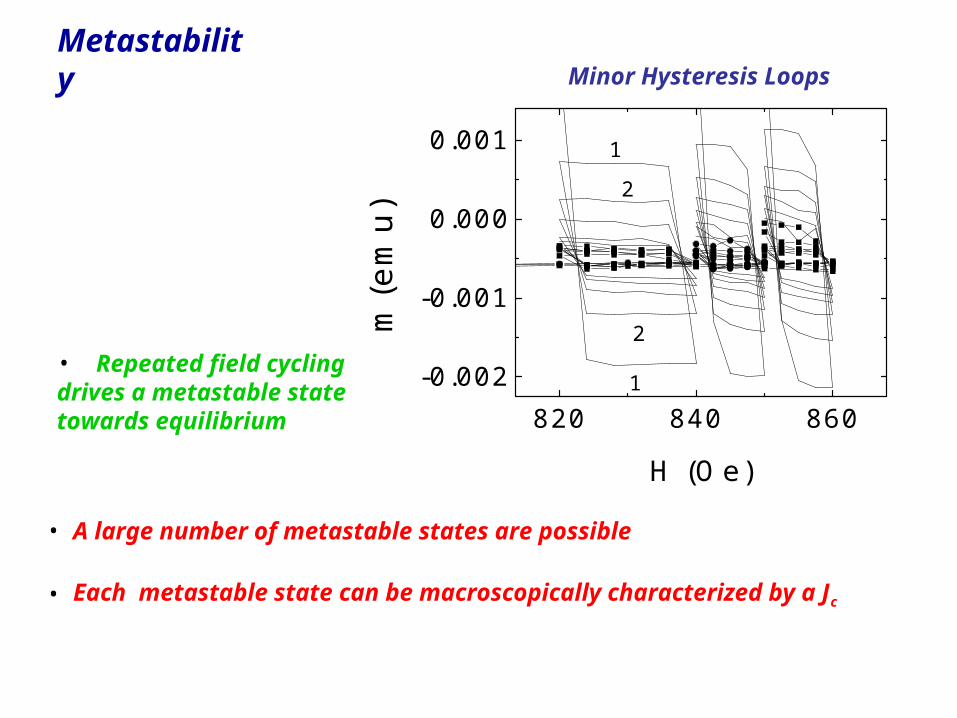
Metastability
820 840 860-0.002
-0.001
0.000
0.001
2
1
2
1
C G K O S W
m(e
mu)
H (Oe)
• Repeated field cycling drives a metastable state towards equilibrium
Minor Hysteresis Loops
• A large number of metastable states are possible
• Each metastable state can be macroscopically characterized by a Jc

1000 1020
-0.002
0.000
0.002
0.004
1030 1040 1050
JAG07A
C C G K O S W
m (
em
u)
H(Oe)
H > HpH < H
p
JA
G07B
(N-O
)JA
G07B
(J-K
)
C K O
H(Oe)
Just below Just above
No Metastability
No History effect
( ii )( i )
fig.1 - Ravikumar et al
dc
b
Jc = J
c
st
Jc
B
a
C (Jc < J
c
st)
A (Jc > J
c
st)
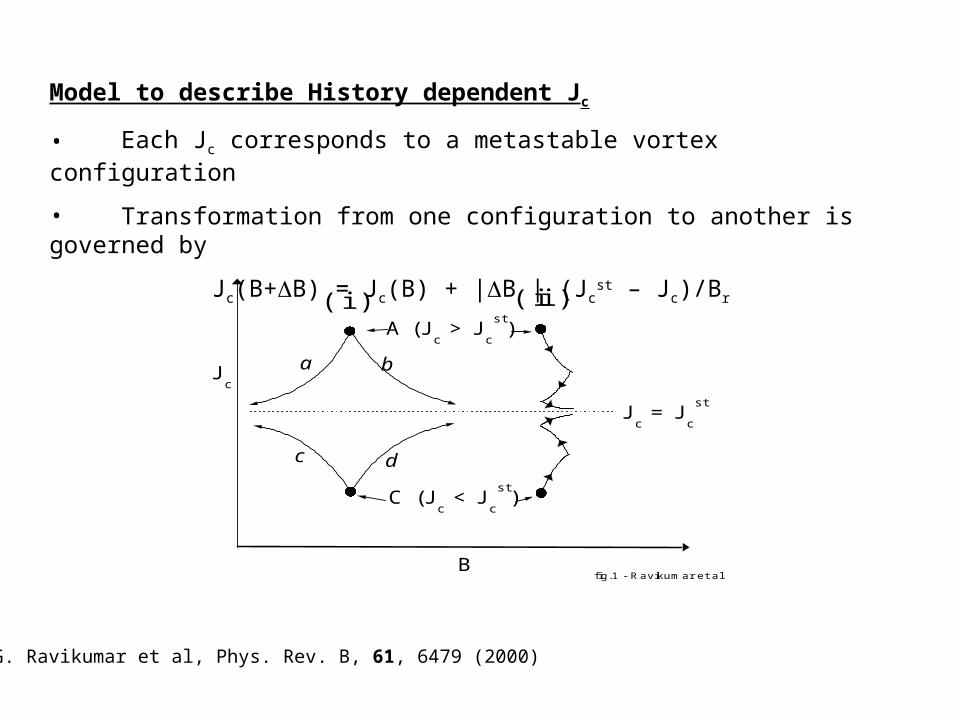
Model to describe History dependent Jc
• Each Jc corresponds to a metastable vortex configuration
• Transformation from one configuration to another is governed by
Jc(B+B) = Jc(B) + |B | (Jcst – Jc)/Br
G. Ravikumar et al, Phys. Rev. B, 61, 6479 (2000)
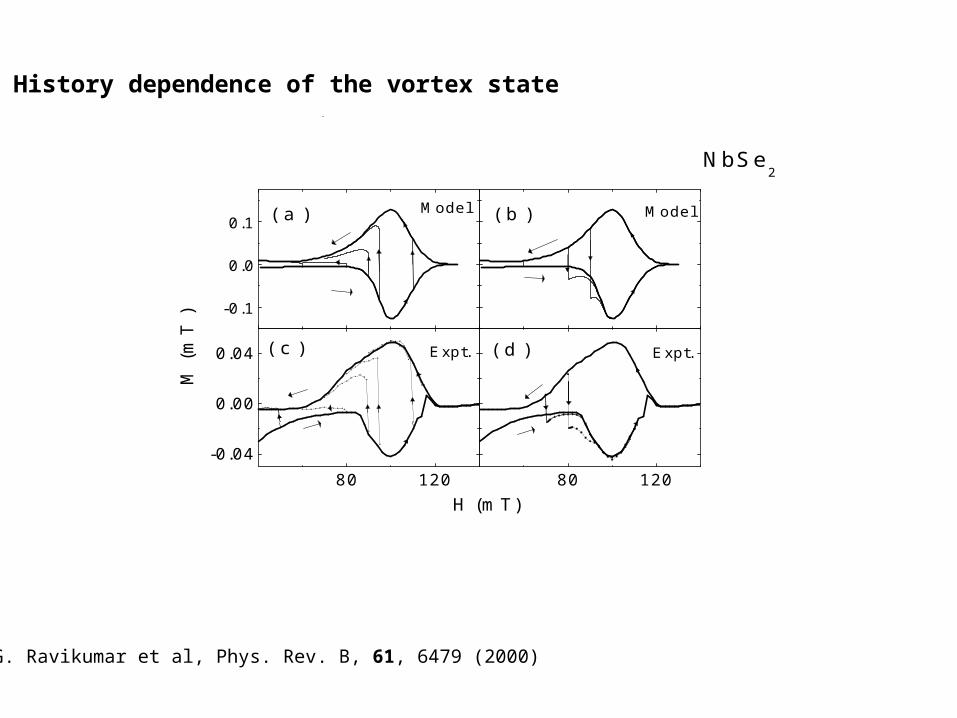
80 12080 120-0.04
0.00
0.04
-0.1
0.0
0.1
Expt.( d )
Expt.
H (mT)
( c )
NbSe2
Model( b )
Model( a )M
(m
T )
G. Ravikumar et al, Phys. Rev. B, 61, 6479 (2000)
History dependence of the vortex state

80 120
-0.04
0.00
0.04
40 80 120
-0.1
0.0
0.1
6.95KH//c
Expt.(b)
MFC
(H)
NbSe2
MFC
(H)
(a) Model
M (m
T )
H (mT)
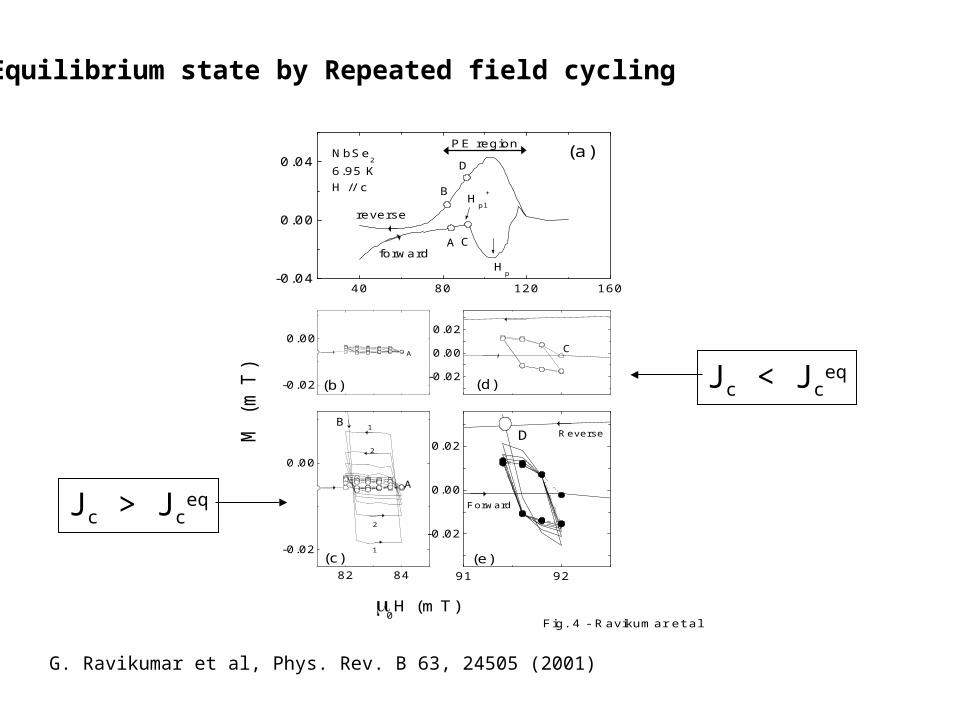
91 92
-0.02
0.00
0.02
82 84
-0.02
0.00
40 80 120 160-0.04
0.00
0.04
-0.02
0.00
-0.02
0.00
0.02
(e)
D
(d)
Forward
Reverse
0H (mT)
(c)
B
A
Fig. 4 - Ravikumar et al
(b)
2
1
2
1
PE region
reverse
forwardH
p
Hpl
+
D
CA
B
(a)NbSe2
6.95 KH // c
M (
mT
)
A
C
G. Ravikumar et al, Phys. Rev. B 63, 24505 (2001)
Equilibrium state by Repeated field cycling
Jc < Jceq
Jc > Jceq
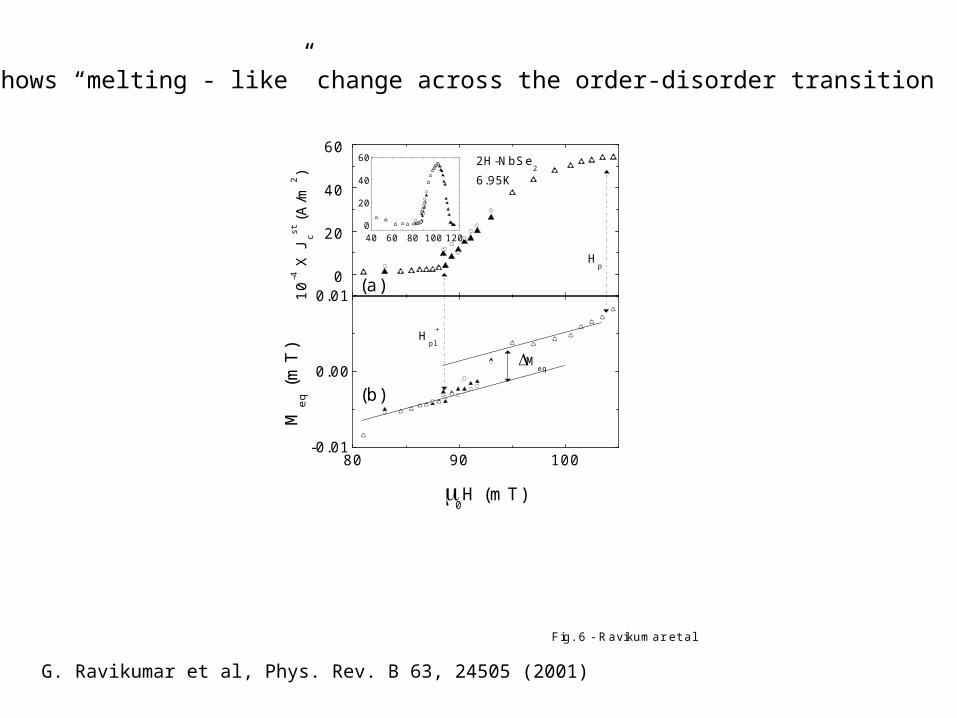
0
20
40
60
80 90 100-0.01
0.00
0.01
40 60 80 100 1200
20
40
60
Hp
2H-NbSe2
6.95K
(a)10-4 X
Jcst
(A
/m2 )
Hpl
+
Meq
(b)
Fig. 6 - Ravikumar et al
Meq
(m
T)
0H (mT)
G. Ravikumar et al, Phys. Rev. B 63, 24505 (2001)
Meq shows “melting - like” change across the order-disorder transition

Avraham et al Nature 411 (2001) 451
Equilibration by transverse AC magnetic field
H
Hac
Peak effect – First order transition
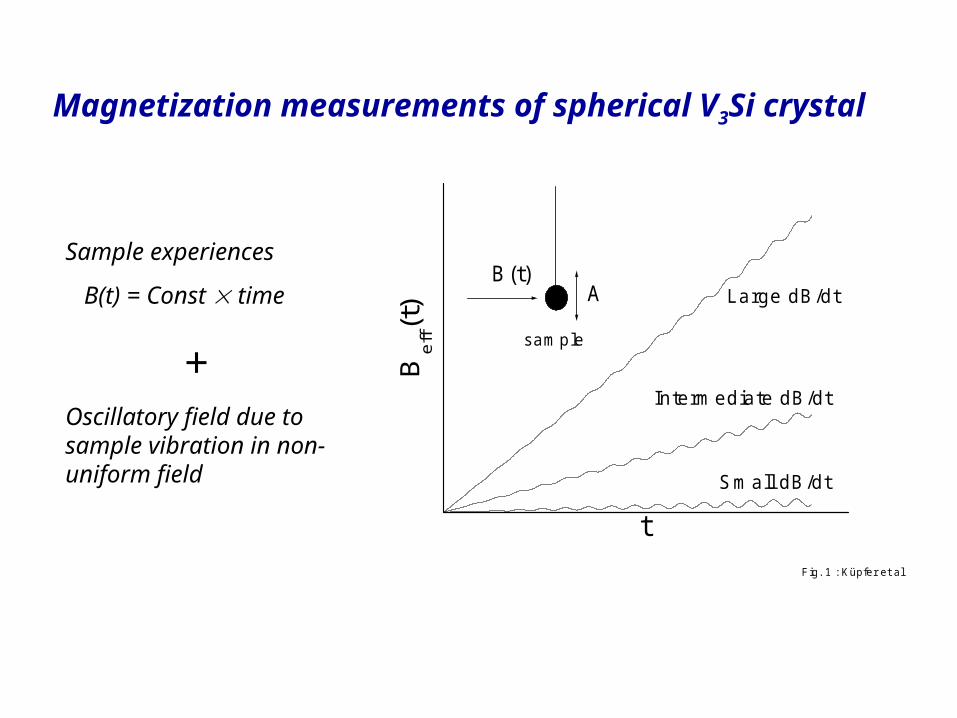
Fig. 1 : Küpfer et al
A
sample
B(t)
Intermediate dB/dt
Small dB/dt
Large dB/dt
Bef
f(t)
t
Magnetization measurements of spherical V3Si crystal
Sample experiences
B(t) = Const time
+Oscillatory field due to sample vibration in non-uniform field
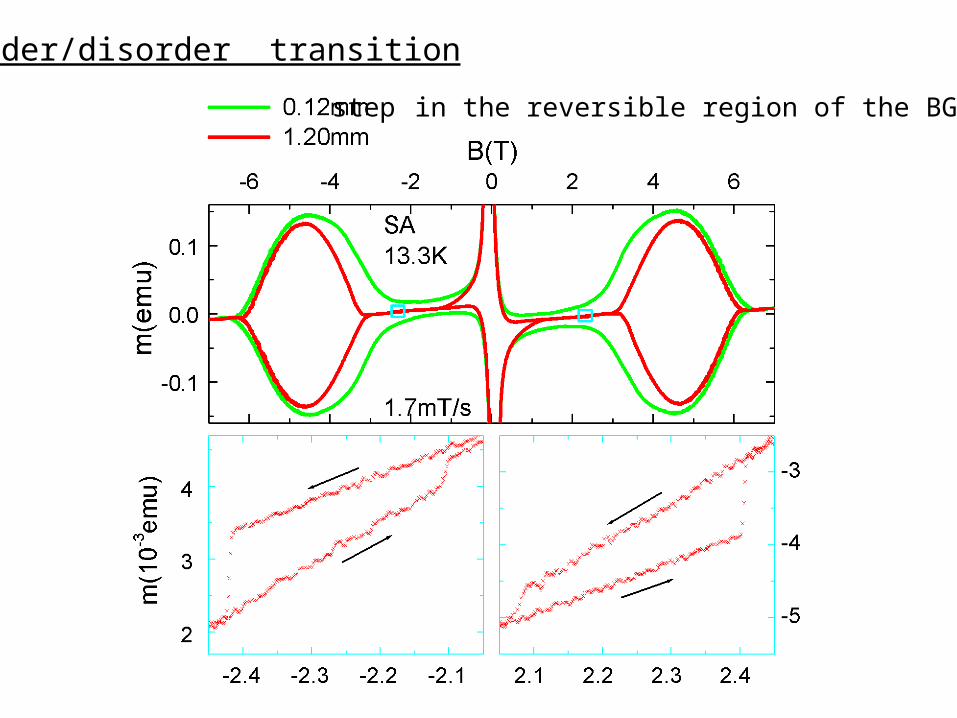
Order/disorder transition
step in the reversible region of the BG

Summary
• History dependence and metastability near order-disorder transition.
• “Repeated field cycling” to access the equilibrium state
• Order-disorder transition is a first order transition.


• History dependence Near Peak effect
• Many metastable states
(multiple Jc’s)
• Disorder and low kT - difficult to access equilibrium state 0 2 4 6 8 10 12
-0.04
-0.02
0.00
0.02
0.04
m (
emu)
H (T)
Meq(H) = [ M (H) + M(H) ]/2
Assuming Jc (microscopic vortex state) is same in the increasing and decreasing field branches
V3Si / 9.5 K

