peak demand charges and electric transit buses · 2020-01-07 · calstart fresno rural envision...
TRANSCRIPT

Peak Demand Charges and Electric Transit Buses
Working with Your Utility Company to Provide an Electric Solution for your Bus Fleet
APTA Sustainability and Multimodal Planning Workshop
Fred Silver VP CALSTART
August 8, 2017

Agenda
• Growth of BEB Market and Power Consumption
• Peak Demand charges Publications and Dome scenarios
• Mitigation Strategies and Micro grids
• Fleet and Utility Activities- California example

Growth of ZEB Deployments- From 1-5 to 10 -20 to 50 BEBs
• More than Sixty Fleets demonstrating or deploying ZEBS– With cumulative orders of 800
there are more than 200 Battery electric buses deployed
• Individual fleet sizes of some properties approaching 20- 30 BEB’s with some properties committing to fleet size of more than 100 by 2018/19

Peak loads for Various Electric Vehicle Fleets (without mitigating grid impacts)
Assumptions: the Chevy Volt charging rate is 3.3 kW, the medium-duty E-Truck charging rate is 15 kW and the E-Bus charging rate is 60 kW.

Interesting Factoid (or Projections)
• US Transit Bus Electrification Potential at * 71,136 Transit Vehicles (2015) and 93 Average Miles Per Day / 201 KWh– 14.3 Giga Watt Hours Per Day– 5,208 Giga Watt Hours Per Year
• More power than a major City i.e. Los Angeles
• Other Examples– Birmingham Alabama- 56 Buses-11 Mega Watts Hours per
day– Santa Cruz Metro California-100 Buses -22 Mega Watt hours
per day– Honolulu Hawaii, 542 Buses-109 Megawatts per day – New York MTA- 5,852 Buses-1.174 Giga Watt Hours per day
*According to Black and Veatch

Understanding How Peak Demand Charges Effect the Business Case
• Reviewed 26 major electric utilities in Arizona, California, Colorado, Florida, Georgia, Illinois, New York, Oregon, Texas & Washington – 21 out of the 26 electric utilities reviewed levy
demand charges
• Demand charges vary widely from $0.00/kW to $23.65/kW
• Time-Of-Use (TOU) rates, demand charges can go up to $59.24/kW
• Highest demand charges are California and New York
• Lowest demand charges are Oregon and Washington

Two Parts of Your Utility BillEnergy and Demand
PG&E Presentation on Demand Charges

Impact of Demand Charge With Identical Energy Usage

Fuel Cost Comparison Moderate Demand Charge $10/kW
• Electric Buses can have an advantage with no or moderate demand charges
• One can optimize the demand charge cost by using 8 buses on one on route charger or using overnight charging

Fuel Cost Comparison High Demand Charge $20/kW
• Electric Buses may have a dis-advantage with high demand charges
• While one can optimize the demand charge cost by using 8 buses on one on route charger- there is a need to mitigate these energy costs

Opportunities to Mitigate Energy Costs
• First and most important-talk to your Utility Account Rep.
• Smart Charging
• Micro-grid
– Energy Storage
– Solar
– APU

Smart Charging
• Understand your overall building load and time of day rate structures-Talk with your Utility Account Manager
• Shed Load and manage the overall charging level– In lieu of Charging all of 20 BEBs overnight at 50 kW
rate for 4 Hours causing 1,000 kW demand• Charge at 30 kW for 6 hours at 600kW demand or • Optimize the charging power demand based on when the
buses are needed for service how much energy the buses needs and the time available to charge the bus– Off Board Charger Companies may offer these back office
controls

Smart Charging
• Load Shifting to avoid Time of Use (TOU) prices-energy is more expensive when the electric demand on the grid is higher charging off peak.
– Consider depot charging initiation after 11 PM
– Consider load shedding during mid day peak with on route charging
Illustration of SCE Summer Time-Of-Use pricing

Micro-grid• Definition: a small network of electricity users with a local
source of supply that is usually attached to a centralized national grid but is able to function independently
Solar PV Array
Bus Charger Interface
Bus Charger Equipment
Energy Management System
Energy Storage
Grid
Micro-Turbineor Fuel Cell APU

The Value of Energy Storage• Energy storage systems
using batteries, ultra-capacitors, or flywheels can act as a buffer between the grid and charger to smooth out peak loads
• The ABB TOSA bus charging system in Switzerland uses ultra-capacitors to decrease the demand on the gridfrom 400 kW to 40 kW while maintaining the benefits of on-route fast
Grid to Charger Charger to Bus
Maximum charging power
40kW 400kW
Charging duration 2.5 Minutes 15 Seconds
Energy transferred 1.7kWh 1.7kWh

The Value of Solar Systems
• 43 States have adopted net metering
• Net metering is a billing mechanism that credits solar energy system owners for the electricity they add to the grid
• A bi-directional meter measure energy use and energy produced
• Solar will reduce the Part A energy cost of your utility bill
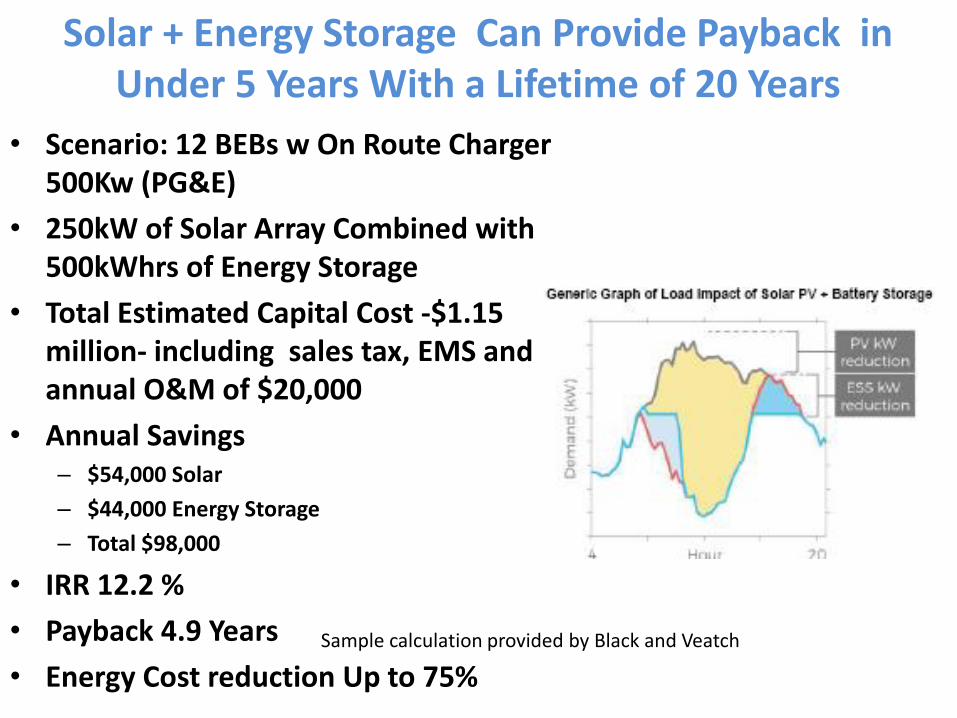
Solar + Energy Storage Can Provide Payback in Under 5 Years With a Lifetime of 20 Years
• Scenario: 12 BEBs w On Route Charger 500Kw (PG&E)
• 250kW of Solar Array Combined with 500kWhrs of Energy Storage
• Total Estimated Capital Cost -$1.15 million- including sales tax, EMS and annual O&M of $20,000
• Annual Savings– $54,000 Solar
– $44,000 Energy Storage
– Total $98,000
• IRR 12.2 %
• Payback 4.9 Years
• Energy Cost reduction Up to 75%Sample calculation provided by Black and Veatch

Example of Transit Projects
• Advanced Transit Bus VGI Project at Santa Clara Valley Transit (VTA) in California-Funded by the CEC/FTA
• Leveraging VTA’s plans to purchase up to 35 all-electric buses towards electrification of its near 500-bus fleet– Includes Vehicle to Grid and
Vehicle to Building functions
– CALSTART Selected to develop Best Practices
– Targeting a reduction of $220K per year in demand charges

CALSTART Fresno Rural Envision Solar Midday Bus Charger
• Fresno Rural Trans and CALSTART deploying 2 BEBs on express routes between Fresno and Clovis
• Envision Solar Umbrella provides an integrated, and stand alone – Tracking solar array
– Energy storage system
– Charger
• Due to the demanding range requirements, the buses will be charged in Fresno – Mid-day avoiding extending the range and avoiding peak time premium costs

CALSTART and FCRTA Supporting EV Car Charging in 13 Rural Cities

CALSTART Commercial Electric Vehicle Working Group Enabled Cal. Utilities to Make Case to CPUC for New BEB
Beneficial Rate Cases
Key Topics1
• Infrastructure: Public investment in power supply and EVSE
• Rates: Demand charges and energy prices
• Innovative Approaches: Storage, DG, DR, and control strategies
CALSTART now forming Electric Fleet Alliance to represent stakeholders at CPUC hearings
Objectives» Understand MHDV electrification costs, impacts, and barriers
» Identify win-win paths for fleets, tech providers, and utilities
Members

Summary
• BEB Fleet Sizes Growing Demanding Megawatts and trending towards Gigawatts
• BEB Fleets need to implement strategies to save energy costs such as– Controlled charging
– Energy Storage
– Solar Systems
• Work and find way to work closely with your Electric Utilities