pxs preliminary final report to asx june 2009 ltd abn 75 082 811 630 asx preliminary final report...
TRANSCRIPT
1
Pharmaxis Ltd ABN 75 082 811 630 ASX Preliminary final report – 30 June 2009 Lodged with the ASX under Listing Rule 4.3A This report is to be read in conjunction with the Statutory Annual Report dated 12th August 2008 and any public announcements made by during the reporting period in accordance with the continuous disclosure requirements of the Corporations Act 2001. Contents Results for announcement to the market (Appendix 4E item 2) 2 Other Appendix 4E information (Appendix 4E item 9) 2 Commentary on results for the period (Appendix 4E item 14) 3 Status of audit (Appendix 4E items 15 to 17) 7 Financial report (Appendix 4E items 3 to 8, 10 to 12) Attachment 1

2
Pharmaxis Ltd ABN 75 082 811 630 Reporting period: Year ended 30th June 2009 (Previous corresponding period: Year ended 30th June 2008) Results for announcement to the market A$’000 Revenue from ordinary activities Down 32% to 6,465
Profit / (Loss) from ordinary activities after tax Up 72% to (35,171) Net profit / (loss) for the year attributable to members Up 72% to (35,171)
Dividends It is not proposed to pay a dividend Other Appendix 4E information
30 June 2009 30 June 2008 Net tangible assets per ordinary share $ 0.63 $ 0.61

3
Commentary on results for the period (Appendix 4E item 14) Overview
Bronchitol We are developing Bronchitol for the management of chronic obstructive lung diseases including cystic fibrosis, bronchiectasis and other acute and chronic pulmonary conditions. Bronchitol is a proprietary formulation of mannitol administered as a dry powder in a hand-held inhaler. It is designed to hydrate the lungs, restore normal lung clearance mechanisms, and help patients clear mucus more effectively. Major milestones achieved during the year include:
• We reported positive top line results of our first Phase III clinical trial of Bronchitol in CF. The trial which involved 325 patients with CF and was conducted across 40 sites in Europe and Australia. Based on this trial we expect to file a marketing application in Europe in the second half of 2009.
• We reported successful clinical data from our Phase II dosing trial in patients with cystic fibrosis.
• We commenced dosing our second Phase III clinical trial in patients with CF. The trial is being conducted across 65 sites in the U.S., Canada, Argentina, France, Germany, Belgium and the Netherlands. This trial is required in order for us to submit a marketing application in the U.S.
• We reported positive long-term safety data from our first Phase III clinical trial of Bronchitol in people living with bronchiectasis.
• We filed a marketing application with the Australian regulatory agency for Bronchitol for bronchiectasis.
Aridol Aridol is our first product. It is a simple-to-use airways inflammation test administered as a dry powder in a hand-held inhaler. Doctors can use the results of this test to identify airway hyper-responsiveness – a hallmark of asthma. Major milestones achieved during the year include:
• We filed a new drug application with the U.S. FDA in March 2009. • We received marketing approval in Switzerland, Malaysia and Singapore.
Other milestones
• Construction was completed on our new 7,000 square metre manufacturing and research facility at Frenchs Forest, NSW, Australia and we took possession in May 2009. Installation, commissioning and validation of our expanded manufacturing capacity commenced during the year and is scheduled to be complete in the first half of 2010.
• The preclinical studies with PXS25 were completed and it was shown to have an appropriate safety window to allow administration to human volunteers.
• Dr Howard Fox joined our senior executive team. • U.S. life science investment manager Mr. Richard van den Broek joined our
Board of Directors.

4
• We completed a share placement and share purchase plan in which we issued 23.1 million shares and raised A$51.2 million net of issue expenses.
Results of Operations
Sales and Gross Profit. Sales were A$0.6 million in 2009 compared to A$0.5 million in 2008 and relate to sales of our first product, Aridol. Aridol has been approved and launched in Australia, various European countries and Korea. In addition we sell Aridol to pharmaceutical companies for use in clinical trials. Sales by region are made up as follows:
Year ended 30 June
2009 2008
In thousands A$ A$ Australia 232 216 Europe 267 137 Korea 32 - Clinical trials 64 174 595 527
Gross profit was approximately 74 percent and 75 percent of sales in 2009 and 2008 respectively. Other revenue – interest. Interest and other income decreased from A$7.4 million in 2008 to A$5.3 million in 2009. The decrease in interest income is attributable to both the lower level of funds invested during 2009 and lower prevailing interest rates. We started 2009 with cash and bank accepted commercial bills of $111.8 million to which was added approximately $51.2 million in the second half of June 2009. By contrast we started 2008 with $76 million of cash and bank accepted commercial bills to which was added approximately $60 million in October and November 2007 from a share placement on the ASX and a share purchase plan. Average interest rates on bank accepted commercial bills during 2009 were significantly less than during 2008. Other income. The main component of other income in 2009 is amounts paid to us under a contract with pharmaceutical companies for services performed by our sales representatives promoting products of the pharmaceutical companies to respiratory specialists. In 2009 we also received an Export Market Development Grant from the Australian government of A$0.15 million. In 2008 the main component of other income was grant revenue, including A$1.3 million claimed under an Australian Government Pharmaceuticals Partnerships Program grant (“P3 Grant”) awarded to us in June 2004, and an Australian Export Market Development Grant of A$0.08 million. Our claims under the P3 Grant were calculated at 30% of the increase of eligible R&D expenditure over a base amount (derived from average prior year expenditures). The P3 Grant concluded at 30 June 2008 and no further amounts are claimable.

5
Research and Development Expenses. Research and development expenses were $29.3 million in 2009 compared to $20.0 million in 2008.
1. Our drug discovery group, now based in our new facility at Frenchs Forest accounted for approximately 7 percent of our total research and development expenditure in the current year and decreased by approximately 10 percent or A$0.2 million compared to 2008. This group is focused on respiratory and immune disorders drug discovery. The decreased level of expenditure reflects reduced contract research required during the year.
2. Our preclinical development group accounted for approximately 6 percent of our total research and development expenditure in the current year and increased by approximately 175 percent or A$1.1 million compared to 2008. The increased level of expenditure relates to toxicology studies in PXS4159 and PXS25 and additional efficacy data in PXS25.
3. Our clinical group accounted for approximately 64 percent of our total research
and development expenditure in 2009 and increased by approximately 70 percent or A$7.7 million compared to 2008. The clinical group designs and monitors the clinical trials run by us. The majority of the expenditures of this group are directed at hospitals and other services related to the conduct and analysis of clinical trials. This significant increase in expenditure reflects the number and size of clinical trials in the active dosing stage during 2009, including two Phase III clinical trial in CF.
4. Our TGA registered manufacturing facility at Frenchs Forest is predominantly
focused on producing material for clinical trials, producing and analyzing material in support of regulatory filings and developing enhanced manufacturing products and processes. Manufacturing expenses for the current year have therefore mainly been classified as a research and development expenditure. Costs associated with the Aridol product sold are classified as cost of sales. Manufacturing accounted for approximately 21 percent of our total research and development expenditure in 2009 and increased by approximately 4 percent or A$0.2 million compared to 2008.
Commercial expenses. Commercial expenses were A$6.2 million in 2009 compared to A$4.6 in 2008. During 2009 we incurred expenditure in preparation for the commercial launch of Bronchitol for CF in Europe and the U.S. and in preparation for the commercial launch of Aridol in the U.S.. In 2009 we increased our sales representatives in the UK as Aridol was launched. This expenditure was in part offset by other income received from other pharmaceutical companies. The costs of our U.S. operations established part way through 2008 were incurred for the whole of 2009. General and Administrative Expenses. General and administrative expenses were A$5.8 million in 2009 and A$5.2 million in 2008, an increase of 13 percent. In 2009 administration

6
expenses include costs associated with expanding internationally, costs related to our larger facility at Frenchs Forest, costs to support our expanded clinical program, and impairment of trade receivables and other assets.
Finance Costs. Finance costs represent the ongoing finance charge associated with the capitalized finance lease of our new facility at Frenchs Forest. These costs commenced in May 2009. Income Tax Expense. Income tax expense was A$0.05 million in 2009 and A$0.03 million in 2008. The expense relates to income generated by our UK and US subsidiaries which are currently reimbursed for their expenditures on a cost plus basis upon which tax is payable.
Loss. Our loss increased from A$20.4 million in 2008 to A$35.2 million in 2009 due to the significant increase in operating expenses discussed, together with a decrease in interest income.
Basic and diluted net loss per share. Basic and diluted net loss per share increased from A$0.108 in 2008 to A$0.180 in 2009 predominantly because of the increase in research and development expenses in 2009, but also partially offset by the share placement and share purchase plan in June 2009 in which we issued 23.1 million shares.

7
Status of audit (Appendix 4E items 15 to 17) This preliminary final report is based on accounts which have been audited. The audit report, which was unqualified, will be made available when the Company lodges its Statutory Annual Report.

Attachment 1Pharmaxis Ltd
Annual financial report - 30 June 2009
Contents
This financial report covers both Pharmaxis Ltd as an individual entity and the consolidated entity consisting of Pharmaxis Ltd and its subsidiaries. The financial report is presented in the Australian currency.
Pharmaxis Ltd is a company limited by shares, incorporated and domiciled in Australia. Its registered office and principal place of business is:
Pharmaxis Ltd 20 Rodborough Road Frenchs Forest, NSW Australia 2086.
A description of the nature of the consolidated entity's operations and its principal activities is included in the review of operations and activities in the directors’ report which is not part of this financial report.
The financial report was authorised for issue by the directors on 13th August 2009. The company has the power to amend and reissue the financial report.
Through the use of the internet, we have ensured that our corporate reporting is timely, complete, and available globally at minimum cost to the company. Press releases, financial reports and other information are available at our website: www.pharmaxis.com.au.
1
Page
Financial report
Income statements 2
Balance sheets 3
Statements of changes in equity 4
Cash flow statements 5
Notes to the financial statements 6

2
Pharmaxis Ltd Income statements For the year ended 30 June 2009
Consolidated Parent entity
2009 2008 2007 2009 2008
Notes $'000 $'000 $'000 $'000 $'000
Revenue from continuing operations
Revenue from sale of goods 2 595 527 205 563 531 Cost of sales (153) (129) (49) (153) (130)
Gross profit 442 398 156 410 401 Other revenue 2 5,347 7,402 5,278 5,345 7,398 Other income 3 523 1,576 2,152 320 1,576 Other expenses from ordinary
activities 4
Research & development expenses (29,308) (19,996) (23,840) (29,406) (20,056) Commercial expenses (6,202) (4,557) (3,240) (5,985) (4,644) Administration expenses (5,800) (5,231) (4,666) (5,791) (5,231) Finance expenses (122) - - (122) -
Loss before income tax (35,120) (20,408) (24,160) (35,229) (20,556) Income tax expense 5 (51) (32) (19) - -
Loss for the year (35,171) (20,440) (24,179) (35,229) (20,556)
Earnings per share: Cents Cents Cents Cents Cents Basic earnings / (loss) per share 31 (18.0) (10.8) (13.6) (18.0) (10.9) Diluted earnings / (loss) per share 31 (18.0) (10.8) (13.6) (18.0) (10.9)
The above income statements should be read in conjunction with the accompanying notes.

Pharmaxis Ltd Balance sheets As at 30 June 2009
3
Consolidated Parent entity
2009 2008 2009 2008
Notes $'000 $'000 $'000 $'000
ASSETS Current assets
Cash and cash equivalents 6 124,993 111,842 124,797 111,650
Trade and other receivables 7 1,219 6,651 1,113 6,617 Inventories 8 254 96 247 94
Total current assets 126,466 118,589 126,157 118,361
Non-current assets Receivables 9 3,392 1,526 3,384 1,521 Other financial assets 10 248 39 248 39 Property, plant and equipment 11 32,698 3,668 32,625 3,611 Intangible assets 12 1,193 1,227 1,193 1,227
Total non-current assets 37,531 6,460 37,450 6,398
Total assets 163,997 125,049 163,607 124,759
LIABILITIES Current liabilities Trade and other payables 13 8,587 5,709 8,547 5,656 Borrowings 14 316 - 316 - Other liabilities 15 239 - 239 - Current tax liabilities 55 31 - -
Total current liabilities 9,197 5,740 9,102 5,656
Non-current liabilities Borrowings 16 13,559 - 13,559 - Other liabilities 17 3,307 - 3,307 - Provisions 18 243 188 243 188
Total non-current liabilities 17,109 188 17,109 188
Total liabilities 26,306 5,928 26,211 5,844
Net assets 137,691 119,121 137,396 118,915
EQUITY Contributed equity 19 245,958 194,680 245,958 194,680 Reserves 20(a) 9,902 7,439 9,875 7,443 Accumulated losses 20(b) (118,169) (82,998) (118,437) (83,208)
Total equity 137,691 119,121 137,396 118,915
The above balance sheets should be read in conjunction with the accompanying notes.

Pharmaxis Ltd Statements of changes in equity For the year ended 30 June 2009
4
Consolidated Parent entity
2009 2008 2007 2009 2008
Notes $'000 $'000 $'000 $'000 $'000
Total equity at the beginning of the financial year 119,121 76,559 98,888 118,915 76,465
Exchange differences on translation of foreign operations 20(a) 31 (4) (1) - -
Net income recognised directly in equity 31 (4) (1) - - Loss for the year (35,171) (20,440) (24,179) (35,229) (20,556)
Total recognised income and expense for the year (35,140) (20,444) (24,180) (35,229) (20,556)
Contributions of equity, net of transaction costs 19(a) 51,278 59,572 363
51,278 59,572
Employee share options 20(a) 2,432 3,434 1,488 2,432 3,434
Total equity at the end of the financial year
137,691 119,121 76,559 137,396 118,915
The above statements of changes in equity should be read in conjunction with the accompanying notes.

Pharmaxis Ltd Cash flow statements For the year ended 30 June 2009
5
Consolidated Parent entity
2009 2008 2007 2009 2008
Notes $'000 $'000 $'000 $'000 $'000
Cash flows from operating activities
Receipts from customers (inclusive of goods and services tax) 963 601 191 790 617
Payments to suppliers and employees (inclusive of goods and services tax) (36,747) (28,299) (28,458) (36,587) (28,511)
(35,784) (27,698) (28,267) (35,797) (27,894) Lease incentive receipt 3,578 - - 3,578 - Grant receipts from government 443 1,542 2,292 443 1,542 Interest received 5,321 7,348 5,278 5,319 7,344 Income tax paid (27) (42) - - -
Net cash outflow from operating activities 29 (26,469) (18,850) (20,697) (26,457) (19,008)
Cash flows from investing activities Payments for property, plant and equipment (12,516) (1,012) (1,182) (12,485) (962) Instalment payments to acquire plant and
equipment (362) (2,396) - (362) (2,396) Release/(payment) of security deposits to
acquire plant and equipment 1,498 (1,498) - 1,498 (1,498) Proceeds from disposal of plant and
equipment 7 1 52 7 1 Payments for intangible assets (169) (154) (192) (169) (154)
Net cash outflow from investing activities (11,542) (5,059) (1,322) (11,511) (5,009)
Cash flows from financing activities Net proceeds from issues of shares 51,278 59,572 363 51,278 59,572 Finance lease payments (163) - - (163) -
Net cash inflow from financing activities 51,115 59,572 363 51,115 59,572
Net increase / (decrease) in cash and cash equivalents 13,104 35,663 (21,656) 13,147 35,555
Cash and cash equivalents at the beginning of the financial year 111,842 76,182 97,840 111,650 76,095
Effects of exchange rate changes on cash and cash equivalents
47 (3) (2) - -
Cash and cash equivalents at the end of the financial year
6 124,993 111,842 76,182 124,797 111,650
Non-cash investing and financing activities 30
The above cash flow statements should be read in conjunction with the accompanying notes.

Pharmaxis Ltd Notes to the financial statements 30 June 2009
6
Contents of the notes to the financial statements
Page 1. Summary of significant accounting policies ................................................................................................................................ 7 2. Revenue ................................................................................................................................................................................... 14 3. Other income ............................................................................................................................................................................ 14 4. Expenses.................................................................................................................................................................................. 14 5. Income tax expense ................................................................................................................................................................. 15 6. Current assets – Cash and cash equivalents ........................................................................................................................... 15 7. Current assets – Trade and other receivables.......................................................................................................................... 16 8. Current assets – Inventories ..................................................................................................................................................... 17 9. Non-current assets – Receivables ............................................................................................................................................ 17 10. Non-current assets – Other financial assets ............................................................................................................................ 17 11. Non-current assets – Property, plant and equipment .............................................................................................................. 18 12. Non-current assets – Intangible assets ................................................................................................................................... 19 13. Current liabilities – Trade and other payables ......................................................................................................................... 19 14. Current liabilities – Borrowings ................................................................................................................................................ 20 15. Current liabilities – Other liabilities .......................................................................................................................................... 20 16. Non-current liabilities – Borrowings ......................................................................................................................................... 20 17. Non-current liabilities – Other liabilities ................................................................................................................................... 20 18. Non-current liabilities – Provisions .......................................................................................................................................... 20 19. Contributed equity .................................................................................................................................................................... 21 20. Reserves and accumulated losses .......................................................................................................................................... 22 21. Key management personnel disclosures ................................................................................................................................. 23 22. Remuneration of auditors ........................................................................................................................................................ 25 23. Contingent liabilities ................................................................................................................................................................ 26 24. Commitments .......................................................................................................................................................................... 27 25. Related party transactions ....................................................................................................................................................... 28 26. Subsidiaries ............................................................................................................................................................................. 29 27. Events occurring after the balance sheet date ........................................................................................................................ 29 28. Financial reporting by segments .............................................................................................................................................. 29 29. Reconciliation of loss after income tax to net cash outflows from operating activities ............................................................. 30 30. Non-cash investing and financing activities ............................................................................................................................. 30 31. Earnings per share .................................................................................................................................................................. 31 32. Financial risk management...................................................................................................................................................... 31 33. Share-based payments ........................................................................................................................................................... 35

Pharmaxis Ltd Notes to the financial statements 30 June 2009 (continued)
7
1. Summary of significant accounting policies
The principal accounting policies adopted in the preparation of the financial report are set out below. These policies have been consistently applied to all the years presented, unless otherwise stated. The financial report includes separate financial statements for Pharmaxis Ltd as an individual entity and the consolidated entity consisting of Pharmaxis Ltd and its subsidiaries.
(a) Basis of preparation
This general purpose financial report has been prepared in accordance with Australian Accounting Standards, other authoritative pronouncements of the Australian Accounting Standards Board, Urgent Issues Group Interpretations and the Corporations Act 2001.
Compliance with IFRSs The financial report of Pharmaxis Ltd also complies with International Financial Reporting Standards (IFRS) as issued by the International Accounting Standards Board (IASB).
Historical cost convention These financial statements have been prepared under the historical cost convention.
Critical accounting estimates The preparation of financial statements requires the use of certain critical accounting estimates. It also requires management to exercise its judgement in the process of applying the Group’s accounting policies. Management believe that any estimation uncertainty would not have a significant risk of causing a material adjustment to the carrying values of assets and liabilities and no judgements were made that could have significant effects on the amounts recognised in the financial report.
Comparatives When classification of items in the financial report is amended, comparative amounts have been reclassified to enhance comparability.
(b) Principles of consolidation
The consolidated financial statements incorporate the assets and liabilities of all subsidiaries of Pharmaxis Ltd (''company'' or ''parent entity'') as at 30 June 2009 and the results of all subsidiaries for the year then ended. Pharmaxis Ltd and its subsidiaries together are referred to in this financial report as the Group or the consolidated entity.
Subsidiaries are all those entities over which the Group has the power to govern the financial and operating policies, generally accompanying a shareholding of more than one-half of the voting rights. The existence and effect of potential voting rights that are currently exercisable or convertible are considered when assessing whether the Group controls another entity.
Subsidiaries are fully consolidated from the date on which control is transferred to the Group. They are de-consolidated from the date that control ceases.
Intercompany transactions, balances and unrealised gains on transactions between Group companies are eliminated. Unrealised losses are also eliminated unless the transaction provides evidence of the impairment of the asset transferred. Accounting policies of subsidiaries have been changed where necessary to ensure consistency with the policies adopted by the Group.
Investments in subsidiaries are accounted for at cost in the individual financial statements of Pharmaxis Ltd.
(c) Segment reporting
A business segment is a group of assets and operations engaged in providing products or services that are subject to risks and returns that are different to those of other business segments. A geographical segment is engaged in providing products or services within a particular economic environment and is subject to risks and returns that are different from those of segments operating in other economic environments.
(d) Foreign currency translation
(i) Functional and presentation currency
Items included in the financial statements of each of the Group’s entities are measured using the currency of the primary economic environment in which the entity operates (‘the functional currency’). The consolidated financial statements are presented in Australian dollars, which is Pharmaxis Ltd’s functional and presentation currency.

Pharmaxis Ltd Notes to the financial statements 30 June 2009 (continued)
8
1. Summary of significant accounting policies (continued)
(ii) Transactions and balances
Foreign currency transactions are translated into the functional currency using the exchange rates prevailing at the dates of the transactions. Foreign exchange gains and losses resulting from the settlement of such transactions and from the translation at year-end exchange rates of monetary assets and liabilities denominated in foreign currencies are recognised in the income statement, except when deferred in equity as qualifying cash flow hedges and qualifying net investment hedges.
(iii) Group companies
The results and financial position of all the Group entities that have a functional currency different from the presentation currency are translated into the presentation currency as follows:
assets and liabilities for each balance sheet presented are translated at the closing rate at the date of that balance sheet;
income and expenses for each income statement are translated at average exchange rates (unless this is not a reasonable approximation of the cumulative effect of the rates prevailing on the transaction dates, in which case income and expenses are translated at the dates of the transactions); and
all resulting exchange differences are recognised as a separate component of equity.
On consolidation, exchange differences arising from the translation of any net investment in foreign entities, and of borrowings and other financial instruments designated as hedges of such investments, are taken to shareholders’ equity. When a foreign operation is sold or any borrowings forming part of the net investment are repaid, a proportionate share of such exchange differences are recognised in the income statement, as part of the gain or loss on sale where applicable.
(e) Revenue recognition
Revenue is measured at the fair value of the consideration received or receivable. Amounts disclosed as revenue are net of returns and trade allowances. Revenue is recognised for the major business activities as follows:
(i) Sale of goods
Sales revenue is measured at the fair value of the consideration received or receivable. Revenue from the sale of goods is recorded when goods have been dispatched and risk and rewards passed to the customer.
(ii) Service income
Service income relates to revenue received from other pharmaceutical companies for use of the Groups sales force to promote their products. Service income is recognised in the period the service is performed.
(iii) Interest income
Interest income is recognised on a time proportion basis using the effective interest method, see note 1(j).
(f) Government grants
Grants from the government are recognised at their fair value where there is a reasonable assurance that the grant will be received and the company will comply with all attached conditions. When the company receives income in advance of incurring the relevant expenditure, it is treated as deferred income as the company recognises the income only when the relevant expenditure has been incurred.
Government grants relating to costs are deferred and recognised in the income statement over the period necessary to match them with the costs that they are intended to compensate.
Government grants relating to the purchase of plant and equipment are included in non-current liabilities as deferred income and are credited to the income statement on a straight-line basis over the expected lives of the related assets.
(g) Income tax
The income tax expense or revenue for the period is the tax payable on the current period’s taxable income based on the applicable income tax rate for each jurisdiction adjusted by changes in deferred tax assets and liabilities attributable to temporary differences and unused tax losses.

Pharmaxis Ltd Notes to the financial statements 30 June 2009 (continued)
9
1. Summary of significant accounting policies (continued)
Deferred income tax is provided in full, using the liability method, on temporary differences arising between the tax bases of assets and liabilities and their carrying amounts in the consolidated financial statements. However, deferred income tax is not accounted for if it arises from initial recognition of an asset or liability in a transaction other than a business combination that at the time of the transaction affects neither accounting nor taxable profit or loss. Deferred income tax is determined using tax rates (and laws) that have been enacted or substantially enacted by the reporting date and are expected to apply when the related deferred income tax asset is realised or the deferred income tax liability is settled.
Deferred tax assets are recognised for deductible temporary differences and unused tax losses only if it is probable that future taxable amounts will be available to utilise those temporary differences and losses.
Deferred tax liabilities and assets are not recognised for temporary differences between the carrying amount and tax bases of investments in controlled entities where the parent entity is able to control the timing of the reversal of the temporary differences and it is probable that the differences will not reverse in the foreseeable future.
Deferred tax assets and liabilities are offset when there is a legally enforceable right to offset current tax assets and liabilities and when the deferred tax balances relate to the same taxation authority. Current tax assets and tax liabilities are offset where the entity has a legally enforceable right to offset and intends either to settle on a net basis, or to realise the asset and settle the liability simultaneously.
Current and deferred tax balances attributable to amounts recognised directly in equity are also recognised directly in equity.
(h) Leases
Leases of property where the Group, as lessee, has substantially all the risks and rewards of ownership are classified as finance leases (note 24). Finance leases are capitalised at the lease’s inception at the fair value of the leased property or, if lower, the present value of the minimum lease payments. The corresponding rental obligations, net of finance charges, are included in other short-term and long-term payables. Each lease payment is allocated between the principal repayment and the finance cost. The finance cost is charged to the income statement over the lease period so as to produce a constant periodic rate of interest on the remaining balance of the liability for each period. The property acquired under the finance lease is depreciated over the asset's useful life or over the shorter of the asset’s useful life and the lease term if there is no reasonable certainty that the Group will obtain ownership at the end of the lease term. Any lease incentive received is recognised in the income statement on a straight-line basis over the lease term.
Leases or plant and equipment in which a significant portion of the risks and rewards of ownership are not transferred to the Group as lessee are classified as operating leases (note 24). Payments made under operating leases (net of any incentives received from the lessor) are charged to the income statement on a straight-line basis over the period of the lease.
Lease income from operating leases where the Group is a lessor is recognised in income on a straight-line basis over the lease term.
(i) Impairment of assets
Intangible assets that have an indefinite useful life are not subject to amortisation and are tested annually for impairment or more frequently if events or changes in circumstances indicate that they might be impaired. Other assets are reviewed for impairment whenever events or changes in circumstances indicate that the carrying amount may not be recoverable. An impairment loss is recognised for the amount by which the asset’s carrying amount exceeds its recoverable amount. The recoverable amount is the higher of an asset’s fair value less costs to sell and value in use. For the purposes of assessing impairment, assets are grouped at the lowest levels for which there are separately identifiable cash inflows which are largely independent of the cash inflows from other assets or groups of assets (cash-generating units). Non-financial assets other than goodwill that suffered an impairment are reviewed for possible reversal of the impairment at each reporting date.
(j) Cash and cash equivalents
For purposes of the statement of cash flows, cash includes cash on hand, deposits at call and bank accepted commercial bills, which are subject to an insignificant risk of changes in value.
Bank accepted commercial bills are short-term deposits held with banks with maturities of three months or less, which are acquired at a discount to their face value. The bills are carried at cost plus a portion of the discount recognised as income on an effective yield basis. The discount brought to account each period is accounted for as interest received.

Pharmaxis Ltd Notes to the financial statements 30 June 2009 (continued)
10
1. Summary of significant accounting policies (continued)
(k) Trade receivables
Trade receivables are recognised initially at fair value and subsequently measured at amortised cost using the effective interest method, less provision for impairment. Trade receivables are due for settlement between 30 – 60 days from date of invoice.
Collectibility of trade receivables is reviewed on an ongoing basis. Debts which are known to be uncollectible are written off by reducing the carrying amount directly. An allowance account (provision for impairment of trade receivables) is used when there is objective evidence that the Group will not be able to collect all amounts due according to the original terms of the receivables. Significant financial difficulties of the debtor, probability that the debtor will enter bankruptcy or financial reorganisation, and default or delinquency in payments (more than 30 days overdue) are considered indicators that the trade receivable is impaired. The amount of the impairment allowance is the difference between the asset’s carrying amount and the present value of estimated future cash flows, discounted at the original effective interest rate. Cash flows relating to short-term receivables are not discounted if the effect of discounting is immaterial.
The amount of the impairment loss is recognised in the income statement within administration expenses. When a trade receivable for which an impairment allowance had been recognised becomes uncollectible in a subsequent period, it is written off against the allowance account. Subsequent recoveries of amounts previously written off are credited against administration expenses in the income statement.
(l) Inventories
Raw materials, work in progress and finished goods are stated at the lower of cost and net realisable value. Cost comprises direct materials, direct labour and an appropriate proportion of variable and fixed overhead expenditure, the latter being allocated on the basis of normal operating capacity. Costs are assigned to individual items of inventory on the basis of weighted average costs. Costs of purchased inventory are determined after deducting rebates and discounts. Net realisable value is the estimated selling price in the ordinary course of business less the estimated costs of completion and the estimated costs necessary to make the sale.
(m) Property, plant and equipment
Property, plant and equipment is stated at historical cost less depreciation. Historical cost includes expenditure that is directly attributable to the acquisition of the items.
Subsequent costs are included in the asset’s carrying amount or recognised as a separate asset, as appropriate, only when it is probable that future economic benefits associated with the item will flow to the Group and the cost of the item can be measured reliably. All other repairs and maintenance are charged to the income statement during the financial period in which they are incurred.
Depreciation on other assets is calculated using the straight-line method to allocate their cost, net of their residual values, over their estimated useful lives, as follows:
Plant and equipment 5 – 15 years Computer equipment 4 years Leased building and improvements 15 years
The assets’ residual values and useful lives are reviewed, and adjusted if appropriate, at each balance sheet date.
An asset’s carrying amount is written down immediately to its recoverable amount if the asset’s carrying amount is greater than its estimated recoverable amount (note 1(i)).
Gains and losses on disposals are determined by comparing proceeds with carrying amount. These are included in the income statement.
(n) Intangible assets
(i) Patents
Patents have a finite useful life and are carried at cost less accumulated amortisation and impairment losses. Amortisation is calculated using the straight-line method to allocate the cost of the patents over their estimated useful lives, which vary from 12 to 20 years.
(ii) Trademarks
Trademarks have a finite useful life and are carried at cost less accumulated amortisation and impairment losses. Amortisation is calculated using the straight-line method to allocate the cost of the trademarks over their estimated useful lives, which are assessed as 20 years.

Pharmaxis Ltd Notes to the financial statements 30 June 2009 (continued)
11
1. Summary of significant accounting policies (continued)
(iii) Research and development
Research expenditure is recognised as an expense as incurred. Costs incurred on development projects (relating to the design and testing of new or improved products) are recognised as intangible assets when it is probable that the project will be a success considering its commercial and technical feasibility and its costs can be measured reliably. Other development expenditures that do not meet these criteria are recognised as an expense as incurred.
(iv) Software
Software licenses are carried at cost less accumulated amortisation and impairment losses. Amortisation is calculated using the straight-line method to allocate the cost of the software over their estimated useful lives, which vary from 3 to 5 years.
(o) Trade and other payables
These amounts represent liabilities for goods and services provided to the Group prior to the end of financial year which are unpaid. The amounts are unsecured and are usually paid within 30 days of recognition and receipt of a valid invoice.
(p) Employee benefits
(i) Wages and salaries and annual leave
Liabilities for wages and salaries, including non-monetary benefits and annual leave expected to be settled within 12 months of the reporting date are recognised in other payables in respect of employees' services up to the reporting date and are measured at the amounts expected to be paid when the liabilities are settled.
(ii) Long service leave
The liability for long service leave is recognised as a provision for employee benefits and measured as the present value of expected future payments to be made in respect of services provided by employees up to the reporting date. Consideration is given to expected future wage and salary levels, experience of employee departures and periods of service. Expected future payments are discounted using market yields at the reporting date on national government bonds with terms to maturity and currency that match, as closely as possible, the estimated future cash outflows.
(iii) Retirement benefit obligations
Contributions to defined contribution funds are recognised as an expense as they become payable.
(iv) Share-based payments
Share-based compensation benefits are provided to employees via the Pharmaxis Employee Option Plan. Information relating to these schemes is set out in note 33. The fair value of options granted under the option plan is recognised as an employee benefit expense with a corresponding increase in equity. The fair value is measured at grant date and recognised over the period during which the employees become unconditionally entitled to the options.
The fair value at grant date is determined using a Black-Scholes option pricing model that takes into account the exercise price, the term of the option, the share price at grant date and expected price volatility of the underling share, the expected dividend yield and the risk-free interest rate for the term of the option.
The fair value of the options granted excludes the impact of any non-market vesting conditions (for example, performance targets). Non-market vesting conditions are included in assumptions about the number of options that are expected to become exercisable. At each balance sheet date, the Company revises its estimate of the number of options that are expected to become exercisable. The employee benefit expense recognised each period takes into account the most recent estimate.
(v) Bonus plans
The Group recognises a liability and an expense for bonuses where contractually obliged or where there is a past practice that has created a constructive obligation.

Pharmaxis Ltd Notes to the financial statements 30 June 2009 (continued)
12
1. Summary of significant accounting policies (continued)
(vi) Termination benefits
Termination benefits are payable when employment is terminated before the normal retirement date, or when an employee accepts voluntary redundancy in exchange for these benefits. The Group recognises termination benefits when it is demonstrably committed to either terminating the employment of current employees according to a detailed formal plan without possibility of withdrawal or providing termination benefits as a result of an offer made to encourage voluntary redundancy. Benefits falling due more than 12 months after balance sheet date are discounted to present value.
(q) Other liabilities
Other liabilities comprises a deferred lease incentive which relates to a cash incentive received pursuant to the ‘Put and Call Option to Lease’ agreement. The deferred incentive is amortised to the income statement over the lease term of 15 years.
(r) Contributed equity
Ordinary shares are classified as equity.
Incremental costs directly attributable to the issue of new shares or options (net of recognised tax benefits) are shown in equity as a deduction from the proceeds. Incremental costs directly attributable to the issue of new shares or options for the acquisition of a business are not included in the cost of the acquisition as part of the purchase consideration.
(s) Earnings per share
(i) Basic earnings per share
Basic earnings per share is calculated by dividing net result after income tax attributable to equity holders of the company, excluding any costs of servicing equity other than ordinary shares, by the weighted average number of ordinary shares outstanding during the financial year.
(ii) Diluted earnings per share
Diluted earnings per share adjusts the figures used in the determination of basic earnings per share to take into account the after income tax effect of interest and other financing costs associated with dilutive potential ordinary shares and the weighted average number of shares assumed to have been issued for no consideration in relation to dilutive potential ordinary shares. At present, the potential ordinary shares are anti-dilutive, and have therefore not been included in the dilutive earnings per share calculations.
(t) Goods and Services Tax (GST)
Revenues, expenses and assets are recognised net of the amount of associated GST, unless the GST incurred is not recoverable from the taxation authority. In this case it is recognised as part of the cost of acquisition of the asset or as part of the expense.
Receivables and payables are stated inclusive of the amount of GST receivable or payable. The net amount of GST recoverable from, or payable to, the taxation authority is included with other receivables or payables in the balance sheet.
Cash flows are presented on a gross basis. The GST components of cash flows arising from investing or financing activities which are recoverable from, or payable to the taxation authority, are presented as operating cash flow.
(u) Rounding of amounts
The Company is of a kind referred to in Class order 98/0100, issued by the Australian Securities and Investments Commission, relating to the ''rounding off'' of amounts in the financial report. Amounts in the financial report have been rounded off in accordance with that Class Order to the nearest thousand dollars, or in certain cases, the nearest dollar.
(v) New accounting standards and interpretations
Certain new accounting standards and interpretations have been published that are not mandatory for the year ended 30 June 2009 reporting period. The Group’s and the parent entity’s assessment of the impact of these new standards and interpretations is set out below.

Pharmaxis Ltd Notes to the financial statements 30 June 2009 (continued)
13
1. Summary of significant accounting policies (continued)
(i) AASB 8 Operating Segments and AASB 2007-3 Amendments to Australian Accounting Standards arising from AASB 8 (effective from 1 January 2009)
AASB 8 may result in a significant change in the approach to segment reporting, as it requires adoption of a 'management approach' to reporting on financial performance. The information being reported will be based on what the key decision makers use internally for evaluating segment performance and deciding how to allocate resources to operating segments. The Group will adopt AASB 8 from 1 July 2009. The segments will be reported in a manner that is consistent with the internal reporting provided to the chief operating decision-maker, however at present it is unlikely that the other segments will meet the reportable thresholds.
(ii) Revised AASB 101 Presentation of Financial Statements and AASB 2007-8 Amendments to Australian Accounting Standards arising from AASB 101 (effective from 1 January 2009)
The September 2007 revised AASB 101 requires the presentation of a statement of comprehensive income and makes changes to the statement of changes in equity, but will not affect any of the amounts recognised in the financial statements. If an entity has made a prior period adjustment or has reclassified items in the financial statements, it will need to disclose a third balance sheet (statement of financial position), this one being as at the beginning of the comparative period. The Group will apply the revised standard from 1 July 2009.
(iii) AASB 2008-1 Amendments to Australian Accounting Standard – Share-based Payments: Vesting Conditions and Cancellations (effective from 1 January 2009)
AASB 2008-1 clarifies that vesting conditions are service conditions and performance conditions only and that other features of a share-based payment are not vesting conditions. It also specifies that all cancellations, whether by the entity or by other parties, should receive the same accounting treatment. The Group will apply the revised standard from 1 July 2009, but it is not expected to affect the accounting for the Group's share-based payments.
(iv) AASB 2009-4 Amendments to Australian Accounting Standards arising from the Annual Improvements Project (effective for annual periods beginning on or after 1 July 2009)
The AASB has made amendments to AASB 2 Share-based payment, AASB 138 Intangible Assets and AASB Interpretations 9 Reassessment of Embedded Derivatives and 16 Hedges of a Net Investment in a Foreign Operation as a result to the IASB's annual improvements project. The Group will apply the amendments from 1 July 2009. The Group does not expect that any adjustments will be necessary as a result of applying the revised rules.
(v) AASB 2009-5 Further Amendments to Australian Accounting Standards arising from the Annual Improvements Project
(effective for annual periods beginning on or after 1 January 2010)
In May 2009, the AASB issued a number of improvements to existing Australian Accounting Standards. The Group will apply the revised standards from 1 July 2010. The Group does not expect that any adjustments will be necessary as the result of applying the revised rules.
(vi) Group Cash-settled Share-based Payment Transactions - Amendments to IFRS 2 (effective for annual periods commencing
on or after 1 January 2010)
The amendments made by the IASB to IFRS 2 confirm that an entity receiving goods or services in a group share-based payment arrangement must recognise an expense for those goods or services regardless of which entity in the group settles the transaction or whether the transaction is settled in shares or cash. They also clarify how the group share-based payment arrangement should be measured, that is, whether it is measured as an equity- or a cash-settled transaction. The AASB is expected to make equivalent amendments to AASB 2 shortly. The Group will apply these amendments retrospectively for the financial reporting period commencing on1 July 2009. However, as the amendments only affect the accounting in the individual entities there will be no impact on the financial statements of the Group.
(vii) Revised AASB 123 Borrowing Costs and AASB 2007-6 Amendments to Australian Accounting Standards arising from AASB 123 (effective from 1 January 2009)
The revised AASB 123 has removed the option to expense all borrowing costs and - when adopted - will require the capitalisation of all borrowing costs directly attributable to the acquisition, construction or production of a qualifying asset. There will be no impact on the financial report of the Group, as the Group already capitalises borrowing costs relating to qualifying assets.

Pharmaxis Ltd Notes to the financial statements 30 June 2009 (continued)
14
2. Revenue Consolidated Parent entity
2009 2008 2007 2009 2008
$'000 $'000 $'000 $'000 $'000 Sales revenue Sale of goods 595 527 205 563 531
Other revenue Interest 5,347 7,402 5,278 5,345 7,398
3. Other income Consolidated Parent entity
2009 2008 2007 2009 2008
$'000 $'000 $'000 $'000 $'000 Government grants 93 1,358 2,152 93 1,358 Service income 430 218 - 227 218 523 1,576 2,152 320 1,576
Service income comprised revenue received from other pharmaceutical companies for use of the Groups sales force to promote their products.
4. Expenses
Consolidated Parent entity
2009 2008 2007 2009 2008
Loss before income tax includes the following specific expenses:
$'000 $'000 $'000 $'000 $'000
Depreciation (note 11) Plant and equipment 566 610 631 564 608 Computer equipment 196 149 109 175 141 Leased building and improvements 300 99 51 300 99 Total depreciation 1,062 858 791 1,039 848 Amortisation (note 12) Patents 96 95 92 96 95 Trademarks 5 3 3 5 3 Software 102 68 53 102 68 Total amortisation 203 166 148 203 166 Impairment losses – financial assets Trade receivables 150 - - 150 - Other financial assets 39 - - 39 - Net loss on disposal of plant and equipment - 6 24 - 6 Rental expense relating to operating leases 774 638 459 619 537 Net foreign exchange losses 12 96 47 12 98 Employee benefits expense Defined contribution superannuation 761 594 454 662 534 Other employee benefits expenses 14,272 12,592 9,007 11,560 11,304

Pharmaxis Ltd Notes to the financial statements 30 June 2009 (continued)
15
5. Income tax expense Consolidated Parent entity
2009 2008 2007 2009 2008
(a) Numerical reconciliation of income tax expense to prima facie tax payable
$'000 $'000 $'000 $'000 $'000
Loss before income tax expense (35,120) (20,408) (24,160) (35,229) (20,556)
Tax at the Australian tax rate 30% (2008:30%) (10,536) (6,122) (7,248) (10,569) (6,167) Tax effect of amounts which are not deductible
(taxable) in calculating taxable income: Share-based payments 730 1,030 446 730 1,030 Government research tax incentives (2,331) (988) (1,900) (2,331) (988) Sundry items 8 6 8 8 6
(12,129) (6,074) (8,694) (12,162) (6,119)
Over/(under) provision in prior years 563 18 (251) 533 18
Difference in overseas tax rates (12) (15) (9) - -
Total (11,578) (6,071) (8,954) (11,629) (6,101)
Deferred tax benefits not recognised 11,629 6,103 8,973 11,629 6,101
Income tax expense 51 32 19 - -
This represents current income tax expense.
(b) Deferred tax balances Deferred tax asset comprises temporary
differences attributable to the following:
Interest and Grant receivables (56) (363) (231) (56) (363)
Lease balances 26 - - 26 -
Deferred lease incentive 1,064 - - 1,064 -
Employee benefits 323 303 156 283 260
Share capital raising costs 1,625 1,580 1,637 1,625 1,580
Other 101 17 2 101 17 3,083 1,537 1,564 3,043 1,494
Deferred tax assets attributable to temporary differences which are not recognised (3,083) (1,537) (1,564) (3,043) (1,494)
- - - - -
(c) Tax losses
Unused tax losses for which no deferred tax asset has been recognised 139,200 102,290 79,219 139,200 102,290
Potential tax benefit @ 30% 41,760 30,687 23,766 41,760 30,687
All unused tax losses were incurred by the parent entity.
6. Current assets – Cash and cash equivalents
Consolidated Parent entity
2009 2008 2009 2008
$'000 $'000 $'000 $'000
Cash at bank and in hand 627 569 431 377 Deposits at call 9,773 1,533 9,773 1,533 Bank accepted commercial bills 114,593 109,740 114,593 109,740
124,993 111,842 124,797 111,650

Pharmaxis Ltd Notes to the financial statements 30 June 2009 (continued)
16
6. Current assets – Cash and cash equivalents (continued)
Interest rate risk exposure
The Group’s and the parent entity’s exposure to interest rate risk is discussed in note 32. The maximum exposure to credit risk at the reporting date is the carrying amount of each class of cash and cash equivalents above.
7. Current assets – Trade and other receivables
Consolidated Parent entity
2009 2008 2009 2008
$'000 $'000 $'000 $'000
Trade receivables 408 222 295 210 Provision for impairment of receivables (note (b)) (150) - (150) - 258 222 145 210 Government research grants receivable - 350 - 350 Prepayments (note (c)) 519 4,241 519 4,241 Other receivables (note (d)) 52 1,598 52 1,598 Tax related receivables 390 240 397 218
1,219 6,651 1,113 6,617
(a) Past due but not impaired
As of 30 June 2009, trade receivables of $60,366 (2008: $144,244) were past due but not impaired. These relate to a number of independent customers for whom there is no recent history of default. The aging analysis of these trade receivables is as follows:
Consolidated Parent entity
2009 2008 2009 2008
$'000 $'000 $'000 $'000
Up to 1 month 54 24 53 24 1 to 2 months 3 97 - 97 Over 2 months 3 23 1 22
60 144 54 143
The other classes within trade and other receivables do not contain impaired assets and are not past due. Based on the credit history of these other classes, it is expected that these amounts will be received when due. The group does not hold any collateral in relation to these receivables.
(b) Impaired trade receivables
As of 30 June 2009, trade receivables of $149,645 (2008: $Nil) over 6 months were impaired. These relate to one distributor which is having difficulty repaying due to limited financial resources given current economic conditions.
(c) Prepayments
Prepayments primarily relate to advance payments for items of plant and equipment.
(d) Other receivables
Other receivables primarily represent cash held at bank to cover bank guarantee facilities related to short term operating leases. The balance at 30 June 2008 represented cash held at bank to cover a letter of credit facility for the acquisition of plant and equipment.

Pharmaxis Ltd Notes to the financial statements 30 June 2009 (continued)
17
7. Current assets – Trade and other receivables (continued)
(e) Foreign exchange and interest rate risk
Information about the Group’s and the parent entity’s exposure to foreign currency risk and interest rate risk in relation to trade and other receivables is provided in note 32.
(f) Fair value and credit risk
Due to the short-term nature of these receivables, their carrying amount is assumed to approximate their fair value. The maximum exposure to credit risk at the reporting date is the carrying amount of each class of receivables mentioned above. Refer to note 32 for more information on the risk management policy of the Group and the credit quality of the entity’s trade receivables.
8. Current assets – Inventories
Consolidated Parent entity
2009 2008 2009 2008
$'000 $'000 $'000 $'000
Raw materials - at cost 122 48 122 48 Work-in-progress - at cost 70 10 70 10 Finished goods - at cost 62 38 55 36
254 96 247 94
9. Non-current assets – Receivables
Consolidated Parent entity
2009 2008 2009 2008
$'000 $'000 $'000 $'000
Other receivables (note (a)) 3,307 1,377 3,302 1,372
Prepayments 85 149 82 149
3,392 1,526 3,384 1,521
(a) Other receivables
Other receivables primarily represents cash held at bank to cover bank guarantee facilities related to finance and operating lease commitments, corporate credit card and local payment clearing house facilities.
(b) Fair value
The carrying amount of the non-current receivables approximates their fair value.
(c) Risk exposure
Information about the Group’s and the parent entity’s exposure to credit risk, foreign exchange and interest rate risk is provided in note 32.
10. Non-current assets – Other financial assets
Consolidated Parent entity
2009 2008 2009 2008 $'000 $'000 $'000 $'000
Shares in subsidiaries (note 26) - - - - Other 248 39 248 39
248 39 248 39
The cost of shares held in subsidiaries is $13 which has been rounded to $Nil for the purposes of disclosure.

Pharmaxis Ltd Notes to the financial statements 30 June 2009 (continued)
18
11. Non-current assets – Property, plant and equipment
Consolidated
Plant and equipment
Computer equipment
Leased building and
improvements
Total
At 1 July 2007 $'000 $'000 $'000 $'000
Cost 5,223 614 354 6,191 Accumulated depreciation and impairment (2,271) (213) (186) (2,670)
Net book amount 2,952 401 168 3,521
Year ended 30 June 2008 Opening net book amount 2,952 401 168 3,521 Additions 172 170 670 1,012 Disposals - (7) - (7) Depreciation charge (610) (149) (99) (858)
Closing net book amount 2,514 415 739 3,668
At 30 June 2008 Cost 5,395 768 1,024 7,187 Accumulated depreciation and impairment (2,881) (353) (285) (3,519)
Net book amount 2,514 415 739 3,668
Year ended 30 June 2009 Opening net book amount 2,514 415 739 3,668 Exchange differences - 8 - 8 Additions 7,903 317 21,871 30,091 Disposals (6) (1) - (7) Depreciation charge (566) (196) (300) (1,062)
Closing net book amount 9,845 543 22,310 32,698
At 30 June 2009 Cost 13,276 1,089 22,895 37,260 Accumulated depreciation and impairment (3,431) (546) (585) (4,562)
Net book amount 9,845 543 22,310 32,698
(a) Assets in the course of construction
The carrying amount of the assets disclosed above include the following expenditure recognised in relation to property, plant and equipment which is in the course of construction:
Consolidated Parent entity
2009 2008 2009 2008
$'000 $'000 $'000 $'000
Leased building and improvements - 632 - 632 Plant and equipment 6,599 - 6,599 - 6,599 632 6,599 632
(b) Leased assets
Leased building and improvements includes the following amounts where the Group is a lessee under a finance lease:
Cost 13,916 - 13,916 - Accumulated amortisation (126) - (126) - Net book amount 13,790 - 13,790 -

Pharmaxis Ltd Notes to the financial statements 30 June 2009 (continued)
19
12. Non-current assets – Intangible assets
Consolidated and parent entity Patents Trademarks Software Total
$'000 $'000 $'000 $'000
At 1 July 2007 Cost 1,608 65 296 1,969 Accumulated amortisation and impairment (668) (3) (59) (730)
Net book amount 940 62 237 1,239
Year ended 30 June 2008 Opening net book amount 940 62 237 1,239 Additions 16 35 103 154 Amortisation charge (95) (3) (68) (166)
Closing net book amount 861 94 272 1,227
At 30 June 2008 Cost 1,624 100 399 2,123 Accumulated amortisation and impairment (763) (6) (127) (896)
Net book amount 861 94 272 1,227
Year ended 30 June 2009
Opening net book amount 861 94 272 1,227
Additions 43 13 113 169
Amortisation charge (96) (5) (102) (203)
Closing net book amount 808 102 283 1,193
At 30 June 2009
Cost 1,667 113 512 2,292
Accumulated amortisation and impairment (859) (11) (229) (1,099)
Net book amount 808 102 283 1,193
13. Current liabilities – Trade and other payables Consolidated Parent entity
2009 2008 2009 2008
$'000 $'000 $'000 $'000
Trade payables 1,582 516 1,522 488 Other payables (note (a)) 7,005 5,193 6,418 4,918 Trade payables to subsidiaries - - 607 250
8,587 5,709 8,547 5,656
(a) Other payables
Other payables include accruals for annual leave. The entire obligation is presented as current, since the Group does not have an unconditional right to defer settlement.
(b) Risk exposure
Information about the Group’s and the parent entity’s exposure to foreign exchange risk is provided in note 32.

Pharmaxis Ltd Notes to the financial statements 30 June 2009 (continued)
20
14. Current liabilities – Borrowings
Consolidated Parent entity
2009 2008 2009 2008
$'000 $'000 $'000 $'000
Secured
Lease liabilities (note 24) 316 - 316 -
(a) Security and fair value disclosures
Information about the security relating to each of the secured liabilities and the fair value of each of the borrowings is provided in note 16.
(b) Risk exposure
Information about the Group’s and the parent entity’s exposure to risks arising from current and non-current borrowings is provided in note 32.
15. Current liabilities – Other liabilities
Consolidated Parent entity
2009 2008 2009 2008
$'000 $'000 $'000 $'000
Deferred lease incentive 239 - 239 -
Information about the deferred lease incentive is provided in note 17.
16. Non-current liabilities – Borrowings
Consolidated Parent entity
2009 2008 2009 2008
$'000 $'000 $'000 $'000
Secured
Lease liabilities (note 24) 13,559 - 13,559 -
Secured liabilities and assets pledged as security
Lease liabilities are effectively secured, as the rights to the leased assets recognised in the financial statements revert to the lessor in the event of default.
17. Non-current liabilities – Other liabilities
Consolidated Parent entity
2009 2008 2009 2008
$'000 $'000 $'000 $'000
Deferred lease incentive 3,307 - 3,307 -
The deferred lease incentive relates to a cash incentive received pursuant to the ’Put and Call Option to Lease’ agreement. The deferred incentive is amortised over the 15 year lease term on a straight-line basis.
18. Non-current liabilities – Provisions
Consolidated Parent entity
2009 2008 2009 2008
$'000 $'000 $'000 $'000
Employee benefits - long service leave 243 188 243 188

Pharmaxis Ltd Notes to the financial statements 30 June 2009 (continued)
21
19. Contributed equity Consolidated and
Parent entity Consolidated and
Parent entity
2009 2008 2009 2008
Notes Shares Shares $'000 $'000 (a) Share capital
Ordinary shares (b),(c) Fully paid 217,659,109 194,514,762 245,958 194,680
Movements in ordinary share capital:
Date Details Number of shares
Issue price $'000
1 July 2007 Opening balance 177,949,217 135,108 19 July 2007 Exercise of employee options 72,000 $ 0.3125 22 19 July 2007 Exercise of employee options 5,000 $ 1.7900 9 19 July 2007 Exercise of employee options 2,500 $ 1.9170 5 28 September
2007 Exercise of employee options 3,750 $ 1.7900 7 16 October 2007 Share Placement 12,820,513 $ 3.9000 50,000 1 November 2007 Exercise of employee options 10,000 $ 2.1940 22 1 November 2007 Exercise of employee options 2,500 $ 1.9170 5 9 November 2007 Exercise of employee options 400,000 $ 0.3125 125 9 November 2007 Exercise of employee options 160,000 $ 0.3125 50 16 November 2007 Share Purchase Plan 2,999,074 $ 3.9000 11,695 20 November 2007 Exercise of employee options 1,876 $ 1.7900 3 20 November 2007 Exercise of employee options 875 $ 1.9170 2 20 November 2007 Exercise of employee options 2,250 $ 2.0340 4 20 December 2007 Exercise of employee options 10,000 $ 1.7900 18 20 December 2007 Exercise of employee options 48,957 $ 1.9170 94 8 February 2008 Exercise of employee options 15,000 $ 1.1470 17 8 February 2008 Exercise of employee options 3,750 $ 1.7900 7 8 February 2008 Exercise of employee options 1,250 $ 1.9170 2 29 February 2008 Exercise of employee options 1,250 $ 1.8918 2 4 March 2008 Exercise of employee options 5,000 $ 0.8340 4 Less: Transaction costs on share issues (2,521)
1 July 2008 Opening balance 194,514,762 194,680 7 August 2008 Exercise of employee options 22,500 $ 0.5080 11 4 June 2009 Share Placement (initial settlement) 500,000 $ 2.3500 1,175 10 June 2009 Exercise of employee options 50,000 $ 2.1940 109 10 June 2009 Exercise of employee options 2,500 $ 1.9170 5 11 June 2009 Share Placement (main settlement) 19,500,000 $ 2.3500 45,825 30 June 2009 Share Purchase Plan 3,069,347 $ 2.3500 7,213 Less: Transaction costs on share issues (3,060)
217,659,109 245,958

Pharmaxis Ltd Notes to the financial statements 30 June 2009 (continued)
22
19. Contributed equity (continued)
(b) Ordinary shares
Ordinary shares entitle the holder to participate in dividends and the proceeds on winding up of the company in proportion to the number of and amounts paid on the shares held.
On a show of hands every holder of ordinary shares present at a meeting in person or by proxy, is entitled to one vote, and upon a poll each share is entitled to one vote.
(c) Options
Information relating to the Pharmaxis Employee Option Plan, including details of options issued, exercised and lapsed during the financial year and options outstanding at the end of the financial year, is set out in note 33.
(d) Capital risk management
The Group's and the parent entity's objectives when managing capital are to safeguard their ability to continue as a going concern and to maintain an optimal capital structure to reduce the cost of capital.
The Group predominately uses equity to finance its projects. In order to maintain or adjust the capital structure, the Group may issue new shares.
20. Reserves and accumulated losses
Consolidated Parent entity 2009 2008 2009 2008
(a) Reserves $'000 $'000 $'000 $'000
Share-based payments reserve 9,875 7,443 9,875 7,443 Foreign currency translation reserve 27 (4) - -
9,902 7,439 9,875 7,443
Share-based payments reserve Balance 1 July 7,443 4,009 7,443 4,009 Option expense 2,432 3,434 2,432 3,434
Balance 30 June 9,875 7,443 9,875 7,443
Foreign currency translation reserve
Balance 1 July (4) - - - Currency translation differences arising during
the year 31 (4) - -
Balance 30 June 27 (4) - -
(b) Accumulated losses
Movements in accumulated losses were as follows: Consolidated Parent entity 2009 2008 2009 2008 $'000 $'000 $'000 $'000
Balance 1 July (82,998) (62,558) (83,208) (62,652) Net loss for the year (35,171) (20,440) (35,229) (20,556)
Balance 30 June (118,169) (82,998) (118,437) (83,208)

Pharmaxis Ltd Notes to the financial statements 30 June 2009 (continued)
23
20. Reserves and accumulated losses (continued)
(c) Nature and purpose of reserves
(i) Share-based payments reserve The share-based payments reserve is used to recognise the fair value of options granted.
(ii) Foreign currency translation reserve Exchange differences arising on translation of the foreign controlled entities are taken to the foreign currency
translation reserve, as described in note 1(d).
21. Key management personnel disclosures
(a) Key management personnel compensation
Consolidated Parent entity 2009 2008 2009 2008 $ $ $ $ Short-term employee benefits 2,445,024 2,235,880 2,445,024 2,235,880 Post-employment benefits 165,958 156,613 165,958 156,613 Long-term benefits 1,881 70,445 1,881 70,445 Share-based payments 1,651,472 1,997,655 1,651,472 1,997,655
4,264,335 4,460,593 4,264,335 4,460,593
Detailed remuneration disclosures are provided in the remuneration report under section 1.5.
(b) Equity instrument disclosures relating to key management personnel
(i) Options provided as remuneration and shares issued on exercise of such options Details of options provided as remuneration and shares issued on the exercise of such options, together with
terms and conditions of the options, can be found in the remuneration report section of the Directors’ Report.
(ii) Option holdings The number of options over ordinary shares in the company held during the financial year by each director of
Pharmaxis Ltd and other key management personnel of the Group, including their personally related parties, are set out below.
2009
Name
Balance at the start of the
year
Granted during the
year as compensation
Exercised during the
year
Other changes
during the year
Balance at the end of the year
Vested and exercisable at the end of the
year Directors of Pharmaxis Ltd DM Hanley 1,120,000 - - - 1,120,000 1,120,000 AD Robertson 2,680,000 200,000 - - 2,880,000 2,542,500 MJ McComas 240,000 - - - 240,000 240,000 PC Farrell 220,000 - - - 220,000 170,000 J Villiger 200,000 - - - 200,000 150,000 W Delaat - 200,000 - - 200,000 50,000 R. van den Broek - - - - - -

Pharmaxis Ltd Notes to the financial statements 30 June 2009 (continued)
24
21. Key management personnel disclosures (continued)
Other key management personnel of the Group
2009 Name
Balance at the start of the
year
Granted during the
year as compensation
(1)
Exercised during the
year
Other changes
during the year
Balance at the end of the year
Vested and exercisable at the end of the
year
B Charlton 910,000 300,000 - - 1,210,000 796,250 JF Crapper 810,000 300,000 - - 1,110,000 697,500 HG Fox - 400,000 - - 400,000 - IA McDonald 570,000 300,000 - - 870,000 457,500 DM McGarvey 1,410,000 300,000 - - 1,710,000 1,297,500 GJ Phillips 955,000 300,000 - - 1,255,000 842,500
(1) Options granted during the year covers two grant issues. The first issue in August 2008 for the financial year ended 30 June 2009 and the second issue in June 2009 for the year ended 30 June 2010.
2008 Name
Balance at the start of the
year
Granted during the
year as compensation
Exercised during the
year
Other changes
during the year
Balance at the end of the year
Vested and exercisable at the end of the
year Directors of Pharmaxis Ltd DM Hanley 1,120,000 - - - 1,120,000 1,110,000 AD Robertson 2,380,000 300,000 - - 2,680,000 2,342,500 CPH Kiefel 68,957 - (58,957) (10,000) - - MJ McComas 240,000 - - - 240,000 235,000 PC Farrell 220,000 - - - 220,000 120,000 J Villiger - 200,000 - - 200,000 100,000 Other key management personnel of the Group B Charlton 1,060,000 250,000 (400,000) - 910,000 643,750 JF Crapper 560,000 250,000 - - 810,000 547,500 IA McDonald 320,000 250,000 - - 570,000 290,000 DM McGarvey 1,160,000 250,000 - - 1,410,000 1,147,500 GJ Phillips 705,000 250,000 - - 955,000 691,250
(iii) Share holdings The numbers of shares in the company held during the financial year by each director of Pharmaxis Ltd and other
key management personnel of the Group, including their close family members, are set out below. (Close members of the family of an individual are those family members who may be expected to influence, or be influenced by, that individual in their dealings with the entity).
2009
Name
Balance at the start of the year
Received during the
year on the exercise of
options
Other changes
during the year
Balance at the end of the
year
Directors of Pharmaxis Ltd Ordinary shares DM Hanley 789,787 - 8,508 798,295 AD Robertson 100,000 - - 100,000 MJ McComas 139,999 - - 139,999 P Farrell 101,645 - - 101,645 J Villiger - - - - W. Delaat - - 25,000 25,000 R. van den Broek (1) - - 45,000 45,000
Pharmaxis Ltd Notes to the financial statements 30 June 2009 (continued)
25
21. Key management personnel disclosures (continued)
Other key management personnel of the Group 2009
Name
Balance at the start of the year
Received during the
year on the exercise of
options
Other changes
during the year
Balance at the end of the
year
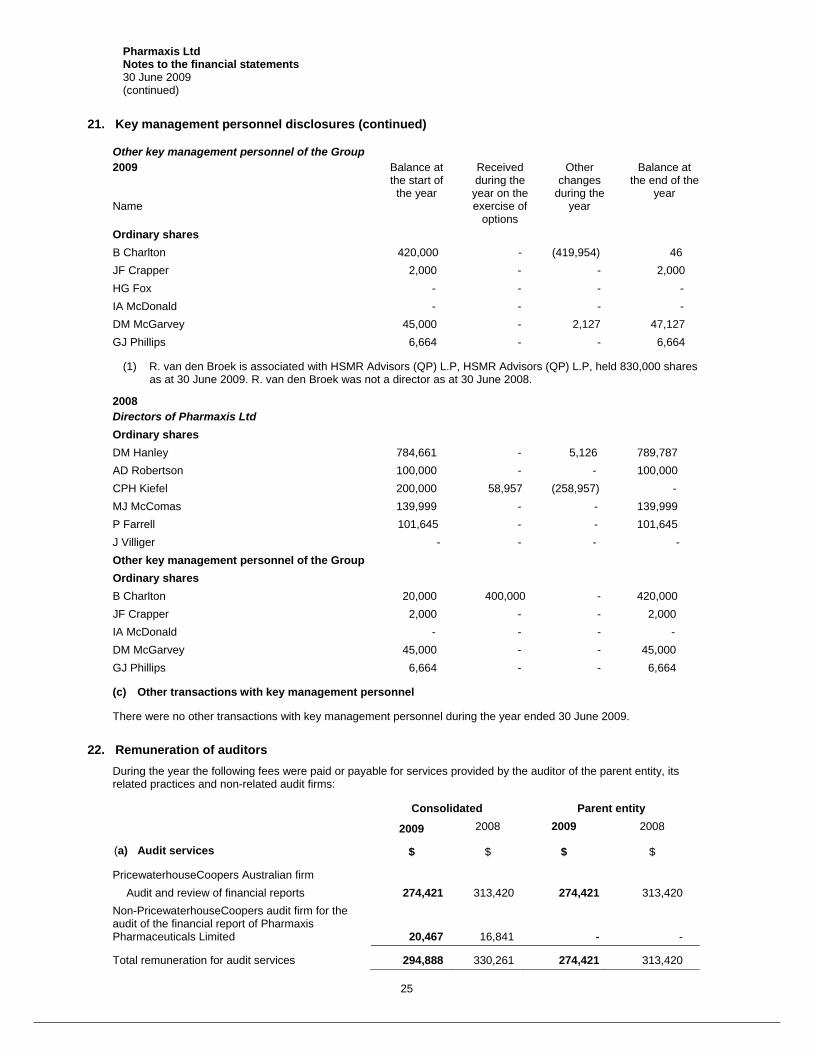
Ordinary shares B Charlton 420,000 - (419,954) 46 JF Crapper 2,000 - - 2,000 HG Fox - - - - IA McDonald - - - - DM McGarvey 45,000 - 2,127 47,127 GJ Phillips 6,664 - - 6,664
(1) R. van den Broek is associated with HSMR Advisors (QP) L.P, HSMR Advisors (QP) L.P, held 830,000 shares as at 30 June 2009. R. van den Broek was not a director as at 30 June 2008.
2008 Directors of Pharmaxis Ltd Ordinary shares DM Hanley 784,661 - 5,126 789,787 AD Robertson 100,000 - - 100,000 CPH Kiefel 200,000 58,957 (258,957) - MJ McComas 139,999 - - 139,999 P Farrell 101,645 - - 101,645 J Villiger - - - - Other key management personnel of the Group Ordinary shares B Charlton 20,000 400,000 - 420,000 JF Crapper 2,000 - - 2,000 IA McDonald - - - - DM McGarvey 45,000 - - 45,000 GJ Phillips 6,664 - - 6,664
(c) Other transactions with key management personnel
There were no other transactions with key management personnel during the year ended 30 June 2009.
22. Remuneration of auditors During the year the following fees were paid or payable for services provided by the auditor of the parent entity, its
related practices and non-related audit firms:
Consolidated Parent entity
2009 2008 2009 2008
(a) Audit services $ $ $ $
PricewaterhouseCoopers Australian firm Audit and review of financial reports 274,421 313,420 274,421 313,420 Non-PricewaterhouseCoopers audit firm for the
audit of the financial report of Pharmaxis Pharmaceuticals Limited 20,467 16,841 - -
Total remuneration for audit services 294,888 330,261 274,421 313,420

Pharmaxis Ltd Notes to the financial statements 30 June 2009 (continued)
26
22. Remuneration of auditors (continued)
Consolidated Parent entity
2009 2008 2009 2008
$ $ $ $
(b) Other services
PricewaterhouseCoopers Australian firm Review of government research grant claims - 5,800 - 5,800 IT Infrastructure review - 15,372 - 15,372
- 21,172 - 21,172
PricewaterhouseCoopers China firm Accounting review services 23,304 - 23,304 -
Total remuneration for other services 23,304 21,172 23,304 21,172
(c) Tax services
PricewaterhouseCoopers Australian firm International tax consulting and tax advice 8,700 11,780 8,700 11,780 Tax compliance services 12,900 12,000 12,900 12,000
21,600 23,780 21,600 23,780
PricewaterhouseCoopers China firm Tax compliance services 13,580 - 13,580 -
Total remuneration for tax services 35,180 23,780 35,180 23,780
23. Contingent liabilities
The parent entity and Group had contingent liabilities at 30 June 2009 in respect of:
Government grants The company has received three separate Australian Government research grants under the R&D START Program,
all three of which have been completed. The Government may require the company to repay all or some of the amount of a particular grant together with interest in either of the following circumstances:
a) the company fails to use its best endeavours to commercialise the relevant grant project within a reasonable time of completion of the project; or
b) upon termination of a grant due to breach of agreement or insolvency. The company continues the development and commercialisation of all three projects funded by the START Program.
The total amount received under the START Program at 30 June 2009 was $4,707,817 (2008: $4,707,817).
The company completed the Australian Government’s Pharmaceuticals Partnerships Program (“P3”) at 30 June 2008 and received cash proceeds of $297,871 (2008: $1,320,584) as the final payment during the financial year. The Government may require the company to repay all or some of the amount of the grant together with interest in any of the following circumstances:
a) the Government determines that expenditure claimed on research projects do not meet the P3 guidelines; or
b) upon termination of the grant due to breach of agreement, change in control of the company or insolvency.

Pharmaxis Ltd Notes to the financial statements 30 June 2009 (continued)
27
23. Contingent liabilities (continued)
Guarantees
The company’s bankers have issued bank guarantees of $2,891,097 in relation to rental bond deposits for which no provision has been made in the accounts. The rental bond deposits cover the leased building which has been accounted for as a finance lease and other leased premises accounted for as operating leases. These bank guarantees are secured by security deposits held at the bank.
The company’s bankers have provided a corporate credit card facility which is secured by a deposit held at the bank totalling $72,141.
The company’s bankers have issued a bank guarantee of GBP70,000 in relation to corporate credit card facilities provided by an overseas affiliate of the banker to Pharmaxis Pharmaceuticals Limited. This bank guarantee is secured by a deposit held at the bank.
The company’s bankers have issued a bank guarantee of USD100,000 in relation to corporate credit card and local payment clearing house facilities provided by an overseas affiliate of the banker to Pharmaxis, Inc. This bank guarantee is secured by a deposit held at the bank.
24. Commitments
(a) Capital Commitments
Capital expenditure contracted for at the reporting date but not recognised as liabilities is as follows:
Consolidated Parent entity
2009 2008 2009 2008
$'000 $'000 $'000 $'000
Building Fit-out Payable: Within one year 135 7,188 135 7,188 Plant and equipment Payable: Within one year 1,357 2,126 1,357 2,126
(b) Lease Commitments
(i) Non-cancellable operating leases
The Group leases various offices and items of plant and equipment under non-cancellable operating leases expiring within one to fifteen years. The leases have varying terms, escalation clauses and renewal rights. On renewal, the terms of the leases are renegotiated.
Consolidated Parent entity
2009 2008 2009 2008
$'000 $'000 $'000 $'000
Commitments for minimum lease payments in relation to non-cancellable operating leases are payable as follows:
Within one year 868 464 838 444
Later than one year but not later than five years 2,338 728 2,338 728 Later than 5 years 5,089 - 5,089 -
8,295 1,192 8,265 1,172

Pharmaxis Ltd Notes to the financial statements 30 June 2009 (continued)
28
24. Commitments (continued)
(ii) Finance leases
The company has entered into an agreement concerning the lease of a custom designed manufacturing, warehousing, research and office facility of approximately 7,200 square metres, constructed to our specifications. The lease has a term of 15 years, with two options to renew of a further five years each and the option to break the lease at ten years but with financial penalties attached. The initial minimum annual rental under the agreement for the finance lease component is $1.2 million. The operating lease component (disclosed in note 24 (b) (i)) is $0.4 million. Both components increase each year for the term of the agreement by 3.25%.
Consolidated Parent entity
2009 2008 2009 2008
$'000 $'000 $'000 $'000
Commitments in relation to finance leases are payable as follows:
Within one year 1,198 - 1,198 - Later than one year but not later than five years 5,193 - 5,193 - Later than five years 15,984 - 15,984 -
Minimum lease payments 22,375 - 22,375 -
Future finance charges (8,500) - (8,500) -
Total lease liabilities 13,875 - 13,875 -
Representing lease liabilities:
Current (note 14) 316 - 316 -
Non-current (note 16) 13,559 - 13,559 -
13,875 - 13,875 -
(iii) Other commitments The company has in place a number of contracts with consultants and contract research organisations in relation to
its research and development activities. The terms of these contracts are for relatively short periods of time and allow for the contracts to be terminated with relatively short notice periods. The actual committed expenditure arising under these contracts is therefore not material.
25. Related party transactions
(a) Parent entities
The parent entity within the Group is Pharmaxis Ltd (incorporated in Australia).
(b) Subsidiaries
Interests in subsidiaries are set out in note 26.
(c) Key management personnel
Disclosures relating to key management personnel are set out in note 21.

Pharmaxis Ltd Notes to the financial statements 30 June 2009 (continued)
29
25. Related party transactions (continued)
(d) Transactions with related parties
The following transactions occurred with related parties:
Consolidated Parent entity
2009 2008 2009 2008
$ $ $ $
Marketing, clinical, regulatory and administration services expenditure paid to subsidiaries - -
4,961,884 2,592,796
(e) Outstanding balances arising from transactions
The following balances are outstanding at the reporting date in relation to transactions with related parties:
Consolidated Parent entity
2009 2008 2009 2008
$ $ $ $
Current payables
Subsidiaries - - 607,108 250,006
(f) Terms and conditions
All transactions were made on normal commercial terms and conditions and at market rates pursuant to a Contract for Services. Under the contract the parent entity is required to pay for services within 30 days of receipt, with interest penalty clauses applying after 90 days.
Outstanding balances are unsecured and are repayable in cash.
26. Subsidiaries The consolidated financial statements incorporate the assets, liabilities and results of the following subsidiaries in
accordance with the accounting policy described in note 1(b):
Name of entity Country of
incorporationClass of shares
Equity holding 2009 2008
% %
Pharmaxis Pharmaceuticals Limited United Kingdom Ordinary 100 100 Pharmaxis, Inc. United States Ordinary 100 100
27. Events occurring after the balance sheet date No matter or circumstance has arisen since 30 June 2009 that has significantly affected, or may significantly affect:
(a) the company’s operations in future financial years, or (b) the results of those operations in future financial years, or (c) the company’s state of affairs in future financial years.
28. Financial reporting by segments
The company operates predominantly in one industry. The principal activities of the company are the research, development and commercialisation of pharmaceutical products.
The company operates in a number of geographical areas. The operations in overseas jurisdictions are in the early days of establishment and currently do not have a material impact on the overall group operations.

Pharmaxis Ltd Notes to the financial statements 30 June 2009 (continued)
30
29. Reconciliation of loss after income tax to net cash outflows from operating activities
Consolidated Parent entity
2009 2008 2007 2009 2008
$'000 $'000 $'000 $'000 $'000
Loss for the year (35,171) (20,440) (24,179) (35,229) (20,556) Depreciation of property, plant &
equipment 1,062 858 791 1,039 848 Amortisation of intangibles 203 166 148 203 166 Amortisation of lease incentive (32) - - (32) - Impairment losses – financial assets Trade receivables 150 - - 150 - Other financial assets 39 - - 39 - Finance charges 122 - - 122 - Non-cash employee benefits expense -
share-based payments 2,432 3,434 1,488 2,432
3,434 Net loss on disposal of non-current
assets - 6 24 - 6 Change in operating assets and liabilities (Increase) in trade receivables (186) (188) (27) (85) (176) (Increase) / decrease in inventories (158) (17) 21 (153) (15) (Increase) / decrease in other operating
assets (178) (2,508) 327 (204) (2,493) Increase / (decrease) in trade payables 1,066 (2,138) 1,841 1,034 (2,137) Increase / (decrease) in other operating
liabilities 4,127 1,904 (1,183) 4,172
1,842 Increase in other provisions 55 73 52 55 73
Net cash outflow from operating activities (26,469) (18,850) (20,697) (26,457) (19,008)
30. Non-cash investing and financing activities
Consolidated Parent entity
2009 2008 2007 2009 2008
$'000 $'000 $'000 $'000 $'000
Acquisition of leased building and improvements by means of finance leases 13,916 - - 13,916 -

Pharmaxis Ltd Notes to the financial statements 30 June 2009 (continued)
31
31. Earnings per share Consolidated
2009 2008
Cents Cents
(a) Basic earnings per share
Loss attributable to the ordinary equity holders of the company (18.0) (10.8)
(b) Diluted earnings per share
Loss attributable to the ordinary equity holders of the company (18.0) (10.8)
(c) Weighted average number of shares used as the denominator
Weighted average number of ordinary shares used as the denominator in calculating basic and diluted earnings / (loss) per share 195,588,481 189,335,187
(d) Information concerning the classification of option securities
Options granted to employees under the Pharmaxis Ltd Employee Option Plan are considered to be potential ordinary shares and have been included in the determination of diluted earnings per share to the extent to which they are dilutive. The options have not been included in the determination of basic earnings per share. Given the entity is currently loss making, the potential ordinary shares are anti-dilutive and have therefore not been included in the diluted earnings per share calculation. Details relating to the options are set out in note 33.
32. Financial risk management
The Group’s activities expose it to a variety of financial risks: market risk (including currency risk and interest rate risk), credit risk and liquidity risk. The Group’s overall risk management program focuses on the unpredictability of financial markets and seeks to minimise potential adverse effects on the financial performance of the Group.
The Group uses different methods to measure different types of risks to which it is exposed. These methods include sensitivity analysis in the case of interest rate, foreign exchange and other price risks and aging analysis for credit risk.
Risk management is carried out by the Chief Financial Officer under policies approved by the Board of Directors. The Board provides written principles of overall risk management, as well as policies covering specific areas, such as foreign exchange risk, interest rate risk, credit risk and investment of excess liquidity.
The Group and the parent entity hold the following financial instruments:
Consolidated Parent entity
2009 2008 2009 2008
$'000 $'000 $'000 $'000
Financial assets Cash and cash equivalents 124,993 111,842 124,797 111,650 Trade and other receivables 1,219 6,651 1,113 6,617 Receivables 3,392 1,526 3,384 1,521 Other financial assets 248 39 248 39 129,852 120,058 129,542 119,827 Financial liabilities Trade and other payables 8,587 5,709 8,547 5,656 Borrowings 13,875 - 13,875 - Other liabilities 3,546 - 3,546 - 26,008 5,709 25,968 5,656

Pharmaxis Ltd Notes to the financial statements 30 June 2009 (continued)
32
32. Financial risk management (continued)
(a) Market risk
(i) Foreign exchange risk
The Group and the parent entity operate internationally but are only exposed to minimal foreign exchange risk arising from various currency exposures.
Foreign exchange risk arises from future commercial transactions and recognised assets and liabilities denominated in a currency that is not the entity’s functional currency. The risk is measured using sensitivity analysis and cash flow forecasting.
The Group’s exposure to foreign currency risk at the reporting date was as follows:
30 June 2009 30 June 2008
USD GBP EUR USD GBP EUR
$'000 $'000 $'000 $'000 $'000 $'000
Cash and cash equivalents 3 6 20 9 9 83 Trade receivables - - 198 - - 103 Prepayments - - 362 - - 1,498 Other receivables 127 149 - 104 83 1,498 Trade payables 700 159 75 98 30 25 Other payables 530 925 649 288 736 1,591
The carrying amounts of the parent entity’s financial assets and liabilities are denominated in Australian dollars except as set out below:
30 June 2009 30 June 2008
USD GBP EUR USD GBP EUR
$'000 $'000 $'000 $'000 $'000 $'000
Cash and cash equivalents 3 6 20 9 9 83 Trade receivables - - 198 - - 103 Prepayments - - 362 - - 1,498 Other receivables 127 149 - 104 83 1,498 Trade payables 700 159 75 98 30 25 Other payables 530 925 649 288 736 1,591 Trade payables to subsidiaries 486 121 - 10 240 -
Group sensitivity
Based on the financial instruments held at 30 June 2009, had the Australian dollar weakened/strengthened by 10% against the GBP with all other variables held constant, the Group’s and parent entity post-tax loss for the year would have been $103,000 higher/$84,000 lower (2008 EUR: $142,000 higher/$157,000 lower), mainly as a result of foreign exchange gains/losses on translation of GBP (2008: EUR) denominated financial assets/liabilities as detailed in the above table. Profit/Loss is more sensitive to movements in the Australian dollar/GBP exchange rates in 2009 than 2008 because of the increased amount of other liabilities in GBP. The Group’s and parent entity exposure to other foreign exchange movements is not material.
(ii) Cash flow and fair value interest rate risk
The Group’s main interest exposure arises from bank accepted commercial bills held.
As at the reporting date, the Group had the following cash profile:

Pharmaxis Ltd Notes to the financial statements 30 June 2009 (continued)
33
32. Financial risk management (continued) 30 June 2009 30 June 2008
Weighted average interest
rate %
Balance $’000
Weighted average interest
rate %
Balance $’000
Cash and cash equivalents 2.47% 10,400 6.0% 2,102 Bank accepted commercial bills 3.18% 114,593 7.7% 109,740 Other receivables 2.97% 3,359 5.3% 2,921
Group sensitivity
The Group’s and parent entity’s main interest rate risk arises from cash and cash equivalents. At 30 June 2009, if interest rates had changed by +/- 80 basis points from the year-end rates with all other variables held constant, post-tax loss for the year would have been $1,026,819 lower/higher (2008 – change of 80 bps: $918,060 lower/higher), mainly as a result of higher/lower interest income from cash and cash equivalents.
(b) Credit risk
Credit risk is managed on a group basis. Credit risk arises from cash and cash equivalents and deposits with banks and financial institutions, as well as credit exposures to customers, including outstanding receivables and committed transactions. For banks and financial institutions, only independent rated parties with a minimum shortterm money market rating of ‘A1+’ and a long term credit rating of ‘AA’ are accepted. Credit risk on bank accepted bills is further managed by spreading these bills across four major Australian banks.
Customer credit risk is managed by the establishment of credit limits. The compliance with credit limits by customers is regularly monitored by management, as is the ageing analysis of receivable balances.
The maximum exposure to credit risk at the reporting date is the carrying amount of the financial assets as summarised in note 7 and note 9.
The credit quality of financial assets that are neither past due nor impaired can be assessed by reference to external credit ratings:
Consolidated Parent entity
2009 2008 2009 2008
$'000 $'000 $'000 $'000
Cash and cash equivalents A1+ 124,993 111,842 124,797 111,650 Other receivables AA+ - 290 - 290 AA 3,324 2,623 3,324 2,623 Not rated 35 8 30 3 3,359 2,921 3,354 2,916
Other receivables primarily represent bank guarantee facilities related to operating leases, corporate credit card and local payment clearing house facilities. Other receivables at 30 June 2008 also included cash held at bank to cover a letter of credit facility for the acquisition of plant and equipment.
(c) Liquidity risk
Prudent liquidity risk management implies maintaining sufficient cash and cash equivalents. The Group manages liquidity risk by continuously monitoring forecast and actual cash flows and matching the maturity profiles of financial assets and liabilities. Surplus funds are generally only invested in instruments that are tradeable in highly liquid markets with short term maturity profiles.

Pharmaxis Ltd Notes to the financial statements 30 June 2009 (continued)
34
32. Financial risk management (continued)
Maturities of financial liabilities
The tables below analyse the Group’s financial liabilities, into relevant maturity groupings based on the remaining period at the reporting date to the contractual maturity date. The amounts disclosed in the table are the contractual undiscounted cash flows.
Group - at 30 June 2009 Less than 1 year
Between 1 and 2 years
Between 2 and 5 years
Over 5 years
Total contractual cash flows
Carrying Amount (assets)/ liabilities
$'000 $'000 $'000 $'000 $'000 $'000
Non-interest bearing 8,826 239 716 2,352 12,133 12,133 Fixed rate 310 371 1,533 11,661 13,875 13,875
Total non-derivatives 9,136 610 2,249 14,013 26,008 26,008
Group - at 30 June 2008
Non-interest bearing 5,709 - - - 5,709 5,709 Fixed rate - - - - - -
Total non-derivatives 5,709 - - - 5,709 5,709
Parent entity - at 30 June 2009
Non-interest bearing 8,786 239 716 2,352 12,093 12,093 Fixed rate 310 371 1,533 11,661 13,875 13,875
Total non-derivatives 9,096 610 2,249 14,013 25,968 25,968
Parent entity - at 30 June 2008
Non-interest bearing 5,656 - - - 5,656 5,656 Fixed rate - - - - - -
Total non-derivatives 5,656 - - - 5 ,656 5,656
(d) Fair value estimation
The fair value of financial assets and liabilities must be estimated for recognition and measurement or for disclosure purposes.
The carrying value less impairment provision of trade receivables and payables are assumed to approximate their fair values due to their short-term nature. The carrying value of financial liabilities for disclosure purposes is estimated by discounting future contractual cash flows at the current market interest rate that is available to the Group for similar financial instruments.

Pharmaxis Ltd Notes to the financial statements 30 June 2009 (continued)
35
33. Share-based payments
(a) Employee Option Plan
The Pharmaxis Employee Option Plan (“EOP”) was approved by shareholders in 1999 and amended by shareholders in June 2003. The maximum number of options available to be issued under the EOP is 15% of total issued shares including the EOP. All employees and directors are eligible to participate in the EOP, but do so at the invitation of the Board. The terms of option issues are determined by the Board. Options are generally granted for no consideration and vest equally over a four year period. Once vested, the options remain exercisable for up to 10 years from the grant date or termination of employment (whichever is earlier). For options granted after 1 January 2003 the annual vesting is subject to approval by the Remuneration and Nomination Committee of the Board. The Committee gives its approval for vesting based on the achievement of individual employee’s personal annual objectives.
Options granted under the EOP carry no dividend or voting rights. When exercisable, each option is convertible into one ordinary share.
The exercise price is set by the Board. Before the company listed on the Australian Stock Exchange in November 2003, the Board set the exercise price based on its assessment of the market value of the underlying shares at the time of grant. From listing until 31 August 2006 the exercise price was set as the average closing price of Pharmaxis Ltd shares on the Australian Securities Exchange on the 5 business days prior to the grant of the options. From 1 September 2006 the exercise price is set as the average of the volume weighted average price of Pharmaxis Ltd shares on the Australian Securities Exchange on the 5 business days prior to the grant of options.
Set out below are details of options exercised during the year and number of shares issued to employees on the exercise of options.
Year ended 2009
Year ended 2008
Exercise date Fair value of shares at issue
date
Number
Exercise date Fair value of shares at issue
date
Number
7 August 2008 $ 1.80 22,500 19 July 2007 $ 3.55 72,000 10 June 2009 $ 2.50 50,000 19 July 2007 $ 3.55 5,000 10 June 2009 $ 2.50 2,500 19 July 2007 $ 3.55 2,500 28 September 2007 $ 4.05 3,750 1 November 2007 $ 4.44 10,000 1 November 2007 $ 4.44 2,500 9 November 2007 $ 4.39 400,000 9 November 2007 $ 4.39 160,000 20 November 2007 $ 4.28 1,876 20 November 2007 $ 4.28 875 20 November 2007 $ 4.28 2,250 20 December 2007 $ 4.12 10,000 20 December 2007 $ 4.12 48,957
8 February 2008 $ 3.20 15,000 8 February 2008 $ 3.20 3,750 8 February 2008 $ 3.20 1,250 29 February 2008 $ 2.60 1,250 4 March 2008 $ 2.47 5,000 75,000
745,958
The fair value of shares issued on the exercise of options is the closing price at which the company’s shares were traded on the Australian Securities Exchange on the day of the exercise of the options.
There were 10,186,188 vested options at 30 June 2009 (8,413,250 at 30 June 2008). There are no options under escrow (Nil at 30 June 2008). Set out below are summaries of options granted under the plan:

Pharmaxis Ltd Notes to the financial statements 30 June 2009 (continued)
36
33. Share-based payments (continued)
Grant Date Expiry date Exercise price
Balance at start of the
year
Granted during the
year
Exercised during
the year
Forfeited during the
year
Balance at end of the
year
Vested at end of the
year
Consolidated and parent entity - 2009 Number Number Number Number Number Number
1 Dec 1999 30 Nov 2009 $0.1250 1,120,000 - - - 1,120,000 1,120,000 1 Sept 2001 30 August 2011 $0.3125 640,000 - - - 640,000 640,000 2 Dec 2001 30 Nov 2011 $0.1250 100,000 - - - 100,000 100,000 12 May 2003 30 June 2012 $0.3125 2,490,000 - - - 2,490,000 2,490,000 12 May 2003 30 Nov 2012 $0.3125 480,000 - - - 480,000 480,000 12 May 2003 30 April 2013 $0.3125 16,000 - - - 16,000 16,000 1 July 2003 30 June 2013 $0.3125 360,000 - - - 360,000 360,000 4 July 2003 3 July 2013 $0.3125 200,000 - - - 200,000 200,000 9 Dec 2003 30 Nov 2013 $0.3760 500,000 - - - 500,000 500,000 25 April 2004 24 April 2014 $0.5080 22,500 - 22,500 - - - 4 June 2004 3 June 2014 $0.4260 15,000 - - - 15,000 15,000 2 Feb 2005 1 Feb 2015 $0.8340 235,000 - - - 235,000 235,000 12 May 2005 11 May 2015 $1.1470 290,000 - - - 290,000 290,000 5 Aug 2005 4 August 2015 $1.7900 755,000 - - 7,500 747,500 747,500 17 Oct 2005 16 Oct 2015 $2.7720 70,000 - - 17,500 52,500 52,500 13 Feb 2006 12 Feb 2016 $2.1940 245,000 - 50,000 100,000 95,000 58,750 1 June 2006 31 May 2016 $2.0340 87,500 - - - 87,500 65,625
15 Aug 2006 14 Aug 2016 $1.9170 604,250 - 2,500 14,500 587,250 439,813 26 Oct 2006 14 Aug 2016 $1.9170 230,000 - - - 230,000 192,500 20 Sept 2006 19 Sept 2016 $1.8918 42,500 - - - 42,500 31,875 26 Oct 2006 15 Mar 2016 $2.0680 200,000 - - - 200,000 150,000 14 Dec 2006 13 Dec 2016 $3.0710 45,000 - - - 45,000 33,750
18 Jun 2007 17 Jun 2017 $3.3155 192,500 - - 35,000 157,500 78,750 10 Aug 2007 9 Aug 2017 $3.3890 1,617,000 - - 60,750 1,556,250 778,125 5 Nov 2007 9 Aug 2017 $3.3890 150,000 - - - 150,000 75,000 5 Nov 2007 14 Nov 2016 $3.2258 200,000 - - - 200,000 150,000 6 Nov 2007 5 Nov 2017 $4.2900 517,000 - - 10,000 507,000 366,000 14 Dec 2007 13 Dec 2017 $4.1373 4,000 - - 2,000 2,000 1,000 8 Feb 2008 7 Feb 2018 $3.2666 18,500 - - - 18,500 4,625 11 Apr 2008 10 Apr 2018 $2.1135 16,000 - - 2,000 14,000 3,500 23 June 2008 22 June 2018 $1.5990 73,500 - - 12,500 61,000 15,250 23 Oct 2008 22 June 2018 $1.5990 - 200,000 - - 200,000 50,000 12 Aug 2008 11 Aug 2018 $1.8170 - 1,479,500 - 104,500 1,375,000 343,750 23 Oct 2008 11 Aug 2018 $1.8170 - 200,000 - - 200,000 50,000 23 Oct 2008 22 Oct 2018 $1.6060 - 162,500 - 5,000 157,500 39,375 11 Dec 2008 10 Dec 2018 $1.1607 - 50,000 - - 50,000 12,500 5 Feb 2009 4 Feb 2019 $1.3380 - 276,000 - - 276,000 - 23 Apr 2009 22 Apr 2019 $1.9574 - 7,500 - - 7,500 - 23 Jun 2009 22 Jun 2019 $2.5498 - 1,609,500 - - 1,609,500 -
Total 11,536,250 3,985,000 75,000 371,250 15,075,000 10,186,188 Weighted average exercise price $ 1.422 $ 2.052 $ 1.679 $ 2.436 $ 1.562 $ 1.153

Pharmaxis Ltd Notes to the financial statements 30 June 2009 (continued)
37
33. Share-based payments (continued)
Grant Date Expiry date Exercise price
Balance at start of the
year
Granted during the
year
Exercised during
the year
Forfeited during the
year
Balance at end of the
year
Vested at end of the
year
Consolidated and parent entity - 2008 Number Number Number Number Number Number
1 Dec 1999 30 Nov 2009 $0.1250 1,120,000 - - - 1,120,000 1,120,000
1 Sept 2001 30 August 2011 $0.3125 640,000 - - - 640,000 640,000
2 Dec 2001 30 Nov 2011 $0.1250 100,000 - - - 100,000 100,000
12 May 2003 30 June 2012 $0.3125 3,122,000 - 632,000 - 2,490,000 2,490,000
12 May 2003 30 Nov 2012 $0.3125 480,000 - - - 480,000 480,000
12 May 2003 30 April 2013 $0.3125 16,000 - - - 16,000 16,000
1 July 2003 30 June 2013 $0.3125 360,000 - - - 360,000 360,000
4 July 2003 3 July 2013 $0.3125 200,000 - - - 200,000 200,000
9 Dec 2003 30 Nov 2013 $0.3760 500,000 - - - 500,000 500,000
25 April 2004 24 April 2014 $0.5080 22,500 - - - 22,500 22,500
4 June 2004 3 June 2014 $0.4260 15,000 - - - 15,000 15,000
2 Feb 2005 1 Feb 2015 $0.8340 240,000 - 5,000 - 235,000 190,000
12 May 2005 11 May 2015 $1.1470 320,000 - 15,000 15,000 290,000 230,000
5 Aug 2005 4 August 2015 $1.7900 800,000 - 24,376 20,624 755,000 566,250
17 Oct 2005 16 Oct 2015 $2.7720 70,000 - - - 70,000 52,500
13 Feb 2006 12 Feb 2016 $2.1940 270,000 - 10,000 15,000 245,000 122,500
1 June 2006 31 May 2016 $2.0340 96,500 - 2,250 6,750 87,500 43,750
15 Aug 2006 14 Aug 2016 $1.9170 627,250 - 7,125 15,875 604,250 302,125
26 Oct 2006 14 Aug 2016 $1.9170 278,957 - 48,957 - 230,000 155,000
20 Sept 2006 19 Sept 2016 $1.8918 47,500 - 1,250 3,750 42,500 21,250
26 Oct 2006 15 Mar 2016 $2.0680 200,000 - - - 200,000 100,000
14 Dec 2006 13 Dec 2016 $3.0710 72,500 - - 27,500 45,000 22,500
18 Jun 2007 17 Jun 2017 $3.3155 237,500 - - 45,000 192,500 48,125
10 Aug 2007 9 Aug 2017 $3.3890 - 1,736,000 - 119,000 1,617,000 404,250
5 Nov 2007 9 Aug 2017 $3.3890 - 150,000 - - 150,000 37,500
5 Nov 2007 14 Nov 2016 $3.2258 - 200,000 - - 200,000 100,000
6 Nov 2007 5 Nov 2017 $4.2900 - 527,000 - 10,000 517,000 73,000
14 Dec 2007 13 Dec 2017 $4.1373 - 6,000 - 2,000 4,000 1,000
8 Feb 2008 7 Feb 2018 $3.2666 - 18,500 - - 18,500 -
11 Apr 2008 10 Apr 2018 $2.1135 - 16,000 - - 16,000 -
23 June 2008 22 June 2018 $1.5990 - 73,500 - - 73,500 -
Total 9,835,707 2,727,000 745,958 280,499 11,536,250 8,413,250 Weighted average exercise price $ 0.823 $ 3.496 $ 0.535 $ 2.946 $ 1.422 $ 0.843
There were 371,250 options forfeited during 2009 (280,499 options during 2008).
The weighted average remaining contractual life of share options outstanding at the end of the period was 6.06 years (2008 – 5.92 years).

Pharmaxis Ltd Notes to the financial statements 30 June 2009 (continued)
38
33. Share-based payments (continued)
Fair value of options granted
The assessed fair value at grant date of options granted during the year ended 30 June 2009 is detailed in the table below. The fair value at grant date is determined using a Black-Scholes option pricing model that takes into account the exercise price, the term of the option, the weighted average share price at grant date and expected price volatility of the underlying share and the risk free interest rate for the term of the option.
The model inputs for options granted during the year ended 30 June 2009 are as follows:
Grant date No. of options granted
Exercise Price
Share Price Time to expiration
(days)
Volatility (%)
Annual interest rate (%)
Option value
Consolidated and parent entity - 2009
23 Oct 2008 200,000 $1.5990 $1.58 2,190 50.00 4.69 $0.8537 12 Aug 2008 1,479,500 $1.8170 $1.93 2,190 50.00 5.78 $1.0064 23 Oct 2008 200,000 $1.8170 $1.58 2,190 50.00 4.69 $0.9701 23 Oct 2008 162,500 $1.6060 $1.58 2,190 50.00 4.69 $0.8574 11 Dec 2008 50,000 $1.1607 $1.05 2,190 50.00 3.75 $0.6056 5 Feb 2009 276,000 $1.3380 $1.13 2,190 50.00 3.60 $0.6949 23 Apr 2009 7,500 $1.9574 $2.14 2,190 50.00 4.05 $1.0250 23 Jun 2009 1,609,500 $2.5498 $2.33 2,190 50.00 5.33 $1.3873 3,985,000
Consolidated and parent entity – 2008
10 Aug 2007 1,736,000 $3.3890 $3.3890 2,190 40.81 6.14 $1.6678 5 Nov 2007 150,000 $3.3890 $3.3890 2,190 40.81 6.14 $1.6932 5 Nov 2007 200,000 $3.2258 $3.2258 2,190 40.81 6.14 $1.6117 6 Nov 2007 527,000 $4.2900 $4.2900 2,190 40.81 6.55 $2.1434 14 Dec 2007 6,000 $4.1373 $4.1373 2,190 40.81 6.55 $2.0671 8 Feb 2008 18,500 $3.2666 $3.2666 2,190 40.81 6.38 $1.6404 11 Apr 2008 16,000 $2.1135 $2.1135 2,190 40.81 6.15 $1.0523 23 June 2008 73,500 $1.5990 $1.5990 2,190 50.00 6.70 $0.9045 2,727,000
The options are issued for no consideration.
The expected price volatility is based on the historic volatility (based on the remaining life of the options), adjusted for any expected changes to future volatility due to publicly available information.
(b) Expenses arising from share-based payment transactions
Total expenses arising from share-based payment transactions recognised during the period as part of employee benefit expense were as follows:
Consolidated Parent entity
2009 2008 2009 2008
$'000 $'000 $'000 $'000
Options issued under employee option plan 2,432 3,434 2,432 3,434