organizational structure and fund performance: …russelljame.com/org_structure_3_2010.pdfthe...
TRANSCRIPT

1
Organizational Structure and Fund Performance:
Pension Funds vs. Mutual Funds*
Russell Jame†
March 2010
Abstract This paper examines whether the additional layer of delegation found in the pension fund industry generates agency costs that impair pension fund performance. Corporate treasurers, who have an incentive to reduce their own job risk, tend to hire pension fund managers with low tracking error. This may result in pension fund managers underweighting profitable investment opportunities in stocks outside of their benchmark. Consistent with this hypothesis, I find that pension funds tilt their trading towards S&P 500 stocks, both in absolute terms and relative to mutual funds. Moreover, I show that the trades made by pension funds in non-S&P 500 stocks significantly outperform their trades in S&P 500 stocks. After controlling for risk and transaction costs, I estimate that that the tracking error constraint imposed on pension funds weakens the performance of their trades by roughly 30 basis points per year.
* I would like to thank Jeff Busse, Tarun Chordia, Clifton Green, Byoung Hwang, Narasimhan Jegadeesh, Joshua
Pollet, Raghu Rao, Jay Shanken, Johan Sulaeman, Qing Tong, Jonathan Weaver, and seminar participants at Emory
University, Drexel University, University of New South Wales, University of Illinois Chicago, and the 2009 Financial
Management Association Doctoral Student Consortium for very helpful comments. † Goizueta School of Business, Department of Finance, Emory University, email: [email protected]

2
1. Introduction
Defined benefit pension funds currently manage over $6 trillion dollars in total assets,
roughly 50% of which is invested in equities (Pensions & Investments (2008)). The majority of
these equities are managed by active fund managers who attempt to generate higher returns
through superior stock selection. The investment decisions of these fund managers have
profound implications for pension plan sponsors (i.e. the corporation), beneficiaries (i.e. the
employee), and shareholders. Poor stock selection results in increased pension deficits (or
reduced surpluses). These deficits often leave corporations with diminished profits, weaker credit
ratings, higher borrowing costs, and reduced capital expenditures (Rauh, (2006)). Pension
deficits can also harm current employees through lower wages and benefits, as well as increased
job cuts. Thus a better understanding of the determinants of the investment decisions and
performance of pension fund managers is critically important.
In this paper, I examine whether organizational structure is a factor that affects pension
fund performance. The organizational structure of the pension fund industry is distinct from the
mutual fund industry. In the mutual fund industry, retail investors directly allocate their own
personal wealth to the mutual fund of their choice. In the pension fund industry, the employees
of a corporation typically delegate investment choices to a corporate treasurer who then selects a
pension fund. This additional layer of delegation offers several benefits. Pooling the assets of
many small investors allows treasurers greater negotiating power and monitoring capacity (Bauer
and Frehen, (2009)). In addition, Del Guercio and Tkac (2002) provide evidence that corporate
treasurers are more financially sophisticated than the average retail investor. Their greater
financial sophistication may allow them to better identify skilled fund managers.

3
However, delegation may also result in agency costs. Rational investors’ desire high risk
adjusted returns, but treasurers may have a different objective. For example, Lakonishok,
Shleifer, and Vishny (1992) argue that since the treasurer must answer to senior management in
the event of poor fund performance, treasurers will allocate funds to managers who are likely to
reduce their own job risk. Consistent with this hypothesis, Del Guercio and Tkac (2002) find that
flow in the pension fund industry is strongly related to characteristics that can be justified ex-
post to superiors such as low tracking error, the recommendations of external consultants, and
personality attributes such as credibility and reputation. Del Guercio and Tkac (2002) find the
negative relationship between tracking error and flow is most pronounced for pension funds with
strong performance, suggesting that funds are punished for deviating from a benchmark even if it
results in outperformance. In contrast, Del Guercio and Tkac (2002) find that flow in the mutual
fund industry is unrelated to tracking error and is more strongly related to prior performance.1
The purpose of this paper is to empirically examine whether this additional layer of
delegation found in the pension fund industry generates agency costs that impair pension fund
performance. Specifically, I investigate whether the treasurer’s emphasis on tracking error
weakens pension fund performance by discouraging pension funds from deviating from their
given benchmark. There are good theoretical reasons to expect this to be the case. Since fund
manager compensation is typically tied to the size of the fund, rational fund managers will
choose investment strategies that maximize the expected net asset value of the fund. Given this
objective, pension fund managers have a natural incentive to perform well; both because high
returns mechanically increase the size of the fund, and because net flows into the fund are
positively related to prior performance. However, the findings of Del Guercio and Tkac (2002)
1 Several other papers document a strong relationship between mutual fund flow and prior performance. See, for
example, Patel, Zeckhauser, and Hendricks (1991), Ippolito (1992), or Sirri and Tufano (1998).

4
also indicate that net flows into the fund are negatively related to tracking error. In fact, for
pension funds managers outperforming the S&P 500, a 1% reduction in tracking error augments
net flows by roughly the same magnitude as a 1% increase in Jensen’s alpha.2 Thus, when
making an investment decision, pension funds must weigh the benefits of higher expected returns
with the costs of greater expected tracking error. My hypothesis predicts that, in certain cases,
the costs of greater expected tracking error will exceed the benefit of higher expected returns,
resulting in pension funds underweighting profitable investment opportunities.
This hypothesis yields several testable implications. First, pension funds will engage in
less active management than mutual funds. Second, pension funds will tilt their trading towards
stocks in their given benchmark, both in absolute terms and relative to mutual funds who are less
constrained by tracking error. Pension fund’s aversion to stocks outside of their benchmark will
be particularly strong amongst the most volatile stocks. Pension funds will also be less
aggressive in trading on short-term momentum, since this investment strategy generates
significant deviations from benchmark weights. Most importantly, if pension fund managers
have some stock selection skill, than these constraints likely impair pension fund performance.3
For example, tracking error constraints may result in pension funds underweighting (relative to
mutual funds) profitable investment opportunities in stocks outside of their benchmark. This
suggests that the trades of pension funds will underperform the trades of mutual funds.
Using a proprietary dataset containing roughly 7 million executed trades by pension
funds and 11 million executed trades by mutual funds; I find support for all the above
2 Specifically, a 1% reduction in tracking leads to a $790.52 increase in net flows, while a 1% increase in Jensen’s
alpha results in a $781.37 increase. 3 Tracking error constraints likely impair risk adjusted performance even if fund managers have no skill. Roll (1992)
proves that optimal tracking error volatility portfolios (i.e. portfolios that maximize expected returns for given level
of tracking error volatility) will not be mean variance efficient unless the benchmark is also mean variance efficient.
5
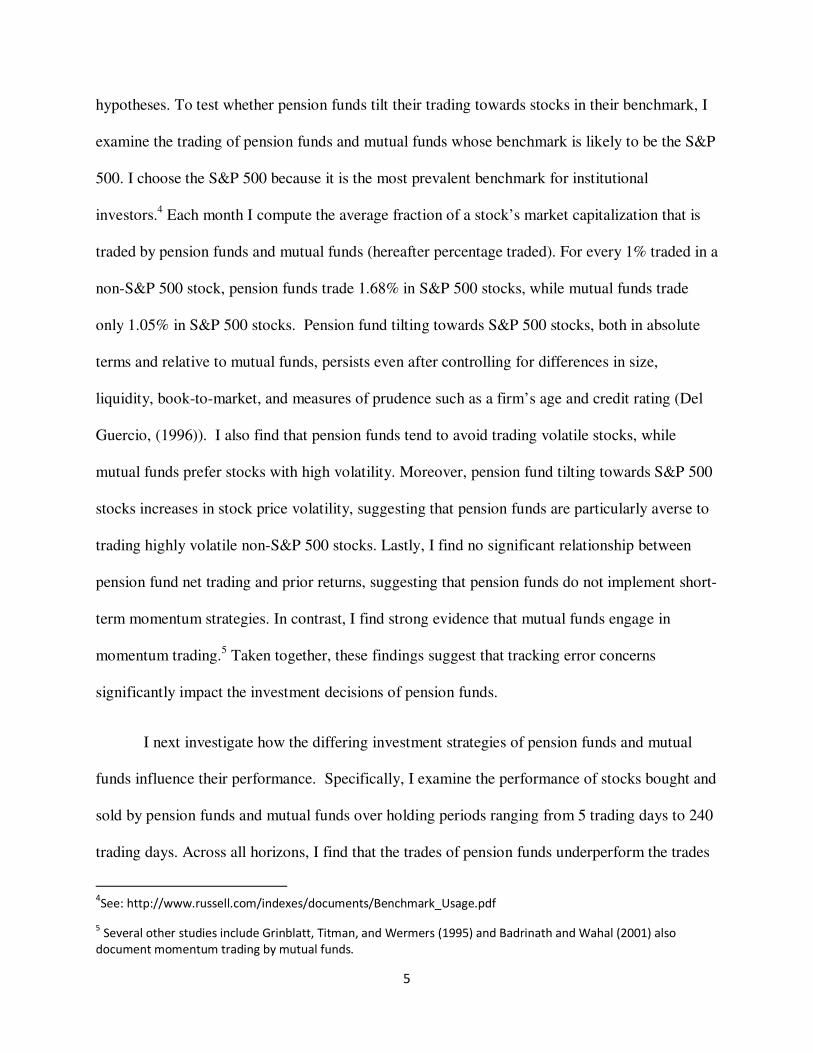
hypotheses. To test whether pension funds tilt their trading towards stocks in their benchmark, I
examine the trading of pension funds and mutual funds whose benchmark is likely to be the S&P
500. I choose the S&P 500 because it is the most prevalent benchmark for institutional
investors.4 Each month I compute the average fraction of a stock’s market capitalization that is
traded by pension funds and mutual funds (hereafter percentage traded). For every 1% traded in a
non-S&P 500 stock, pension funds trade 1.68% in S&P 500 stocks, while mutual funds trade
only 1.05% in S&P 500 stocks. Pension fund tilting towards S&P 500 stocks, both in absolute
terms and relative to mutual funds, persists even after controlling for differences in size,
liquidity, book-to-market, and measures of prudence such as a firm’s age and credit rating (Del
Guercio, (1996)). I also find that pension funds tend to avoid trading volatile stocks, while
mutual funds prefer stocks with high volatility. Moreover, pension fund tilting towards S&P 500
stocks increases in stock price volatility, suggesting that pension funds are particularly averse to
trading highly volatile non-S&P 500 stocks. Lastly, I find no significant relationship between
pension fund net trading and prior returns, suggesting that pension funds do not implement short-
term momentum strategies. In contrast, I find strong evidence that mutual funds engage in
momentum trading.5 Taken together, these findings suggest that tracking error concerns
significantly impact the investment decisions of pension funds.
I next investigate how the differing investment strategies of pension funds and mutual
funds influence their performance. Specifically, I examine the performance of stocks bought and
sold by pension funds and mutual funds over holding periods ranging from 5 trading days to 240
trading days. Across all horizons, I find that the trades of pension funds underperform the trades
4See: http://www.russell.com/indexes/documents/Benchmark_Usage.pdf
5 Several other studies include Grinblatt, Titman, and Wermers (1995) and Badrinath and Wahal (2001) also
document momentum trading by mutual funds.
6
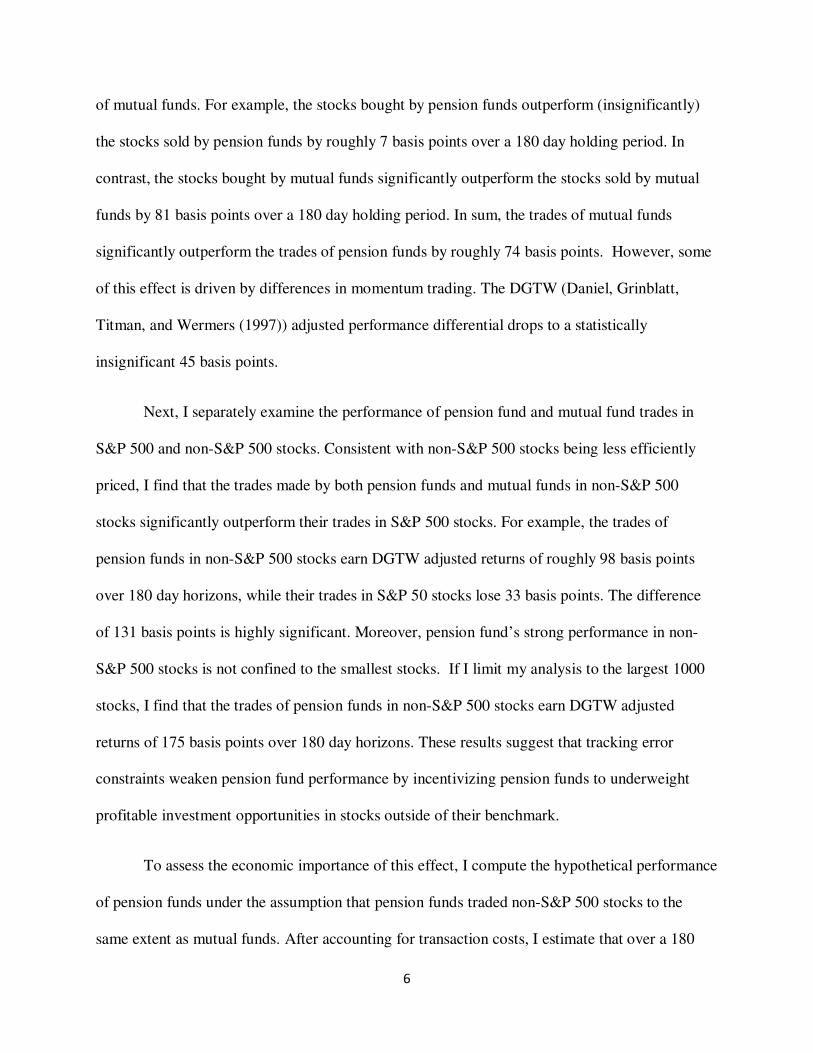
of mutual funds. For example, the stocks bought by pension funds outperform (insignificantly)
the stocks sold by pension funds by roughly 7 basis points over a 180 day holding period. In
contrast, the stocks bought by mutual funds significantly outperform the stocks sold by mutual
funds by 81 basis points over a 180 day holding period. In sum, the trades of mutual funds
significantly outperform the trades of pension funds by roughly 74 basis points. However, some
of this effect is driven by differences in momentum trading. The DGTW (Daniel, Grinblatt,
Titman, and Wermers (1997)) adjusted performance differential drops to a statistically
insignificant 45 basis points.
Next, I separately examine the performance of pension fund and mutual fund trades in
S&P 500 and non-S&P 500 stocks. Consistent with non-S&P 500 stocks being less efficiently
priced, I find that the trades made by both pension funds and mutual funds in non-S&P 500
stocks significantly outperform their trades in S&P 500 stocks. For example, the trades of
pension funds in non-S&P 500 stocks earn DGTW adjusted returns of roughly 98 basis points
over 180 day horizons, while their trades in S&P 50 stocks lose 33 basis points. The difference
of 131 basis points is highly significant. Moreover, pension fund’s strong performance in non-
S&P 500 stocks is not confined to the smallest stocks. If I limit my analysis to the largest 1000
stocks, I find that the trades of pension funds in non-S&P 500 stocks earn DGTW adjusted
returns of 175 basis points over 180 day horizons. These results suggest that tracking error
constraints weaken pension fund performance by incentivizing pension funds to underweight
profitable investment opportunities in stocks outside of their benchmark.
To assess the economic importance of this effect, I compute the hypothetical performance
of pension funds under the assumption that pension funds traded non-S&P 500 stocks to the
same extent as mutual funds. After accounting for transaction costs, I estimate that over a 180

7
day investment horizon, the hypothetical performance of the trades made by pension funds
would earn a DGTW adjusted return of 22 basis points, a statistically significant 27 basis points
increase over their realized performance. Moreover, the standard error of the hypothetical
portfolio would increase by only 4 basis points. Similarly, if mutual funds traded non-S&P 500
stocks to the same extent as pension funds, the performance of their trades would deteriorate by
roughly 20 basis points.
The remainder of this paper is organized as follow. Section 2 discusses related literature.
Section 3 describes the data and presents descriptive statistics. Section 4 investigates the
investment decisions of pension funds and mutual funds. Section 5 examines the performance of
pension funds and mutual funds. Section 6 concludes.
2. Related Literature
This paper contributes to the growing literature linking fund manager trading to their
implicit incentives to increase assets under management. For example, prior research has found
that the performance-flow relationship in the mutual fund industry is convex; investors reward
winners much more strongly than they punish losers (see Ippolitio (1992) or Sirri and Tufano
(1998)). Several papers have documented that mutual fund managers adapt their investment
decisions in order to benefit from this convex performance-flow relationship. For example,
Chevalier and Ellison (1997) find that mutual funds managers respond to their incentive to
increase variance. Similarly, Carhart, Kaniel, Musto, and Reed (2002) find evidence that
managers with the best performance inflate quarter-end portfolio prices with last minute
purchases of stocks already held to improve their year-end ranking. This paper extends this

8
literature by focusing on the potentially adverse incentives that follow from the performance
flow relationship in the pension fund industry.
This paper also contributes to the debate over organizational structure and fund
performance. Bauer and Frehen (2008), estimate that pension funds outperform mutual funds,
after expenses, by roughly 200 basis points per year. They argue that pension funds have greater
negotiating power and monitoring capacity which limits their exposure to hidden agency costs.
However, Lakonishok, Shleifer, and Vishny (1992) analyze the returns of 769 pension plans over
the period of 1983-1989 and find that these funds underperform the S&P 500 by roughly 260
basis points per year before fees and expenses. Lakonishok et al. (1992) note that the pension
fund underperformance of 260 basis points is larger than the gross underperformance
documented in the mutual fund literature and “cautiously conclude” that mutual funds have
outperformed pension funds. They conjecture that the extra layer of agency costs in the pension
fund industry may be driving pension fund under performance. However, performance
differences can be driven by a variety of factors unrelated to organizational structure, such as
fund manager skill. By documenting that tracking error constraints lead to pension funds
underweighting profitable investment opportunities, I provide more direct evidence that
organizational structure influences fund performance.
3. Data and Descriptive Statistics
3.1 Data
I obtain stock returns, share prices, dividend payments, number of shares outstanding,
and turnover from CRSP. I obtain book value of equity, S&P credit ratings, and S&P 500
membership data from Compustat. I obtain data on institutional trading from Abel Noser Corp.

9
Abel Noser is a consulting firm that helps institutional investors track and evaluate their
transaction costs.6 The data cover equity transactions by a large sample of institutional investors
from January 1, 1999 to December 31, 2005. Private discussions with Abel Noser indicate that
the database does not suffer from survivorship bias. Due to privacy concerns, the data does not
include the actual names of the clients or fund specific information such as total net assets value,
fund holdings, fund age, expense ratio, etc. However there is an institution type variable that
allows me to distinguish between money managers (e.g. Vanguard or Fidelity) and pension plan
sponsors (e.g. CALPERS or United Airlines). Moreover, the data contain a client identifier that
is unique to each fund family/plan sponsor and a manager code that corresponds to the different
portfolio managers within the fund. Each executed trade also includes the date of execution, the
stock traded, the number of shares trades, the execution price, and whether the execution was a
buy or a sell.
An additional source for institutional trading is the Thomson (CDA/Spectrum S34) data.
The data include the quarterly holdings of all fund families with greater than $100 million in
equities. Portfolio holdings data begin in the first quarter of 1980 and end in the fourth quarter of
2007. Thus, relative to Abel Noser, the Thomson data include more fund families, span a longer
horizon, and allow me to analyze the performance of fund holdings. However, the Thomson data
have several limitations. First, pension fund data are only available at the fund family level. The
quarterly holdings of a fund family (e.g. Calpers) represent a combination of the quarterly
holdings of several fund managers with different benchmarks (e.g. The Calpers Large Cap Blend
Fund, The Calpers Small Cap Value Fund, etc.). As a result, I cannot use Thomson data to
6 Abel Noser data is similar to Plexus data, a competing transaction cost consulting firm. Plexus data has been used
in several academic studies such as Keim and Madhavan (1995, 1996, and 1997). Studies that have analyzed Abel
Noser data include Chemmanur,He, and Hu (2009) and Puckett and Yan (2008).

10
examine whether fund managers tilt their trading toward stocks in their benchmark. In addition,
trading can only be inferred from changes in quarterly holding. This is problematic for at least
two reasons. First, changes in quarterly holdings do not reflect intra-quarter roundtrip trades (i.e.
the purchase and sale of the same stock within the same quarter). Second, quarterly holdings data
are not able to accurately identify the exact timing and execution price of a given trade. Given
these limitations, most of my analysis relies on the Abel Noser data. However, when appropriate,
I will also provide results using the Thomson data.
3.2 Expenses
Neither Abel Noser nor Thomson provides data on expense ratios. In contrast to mutual
funds, pension funds do not have one expense ratio; instead expenses are determined through
negotiations between the plan sponsor and the fund family, and depend heavily on the size of the
mandate. As a result, analysis of pension fund performance is typically reported gross of
expenses (e.g., Lakonishok, Shleifer, and Vishny (1992) and Busse, Goyal, and Wahil (2009)).
Following this literature, I will compare the gross performance of pension funds and mutual
funds. In doing so, a critical assumption is that the investment strategies chosen by pension funds
generate similar expenses as the investment strategies chosen by mutual funds.
This assumption may seem unreasonable, particularly in light of previous studies that
find pension funds tend to charge lower expenses than mutual funds. For example, French (2008)
reports that the total expenses of pension funds in 2005 was roughly 30 basis points, while the
total expenses of mutual funds was roughly 100 basis points.7 However, this comparison is
misleading because pension funds and mutual funds provide different services to their clients.
7 French (2008) defines total expenses as the expense ratio plus an annualized load, which measures the weighted
average load paid by investors in mutual funds.

11
Both pension funds and mutual funds provide portfolio management services such as research
and security selection. However, mutual funds are also responsible for business and
administrative expenses such as the preparation and filing of tax reports, the preparation of
prospectuses and shareholder reports, a call center, and a staff to support such operations.
Although pension fund beneficiaries also receive these services, they are typically provided
internally by the pension plan’s board of trustees, offices, and staff; not by the external money
managers.
It is more appropriate to compare the expenses of pension funds to mutual fund
subadvisors. Like external managers for pension plans, mutual fund subadvisors provide research
and security selection, but are typically not responsible for other administrative expenses. The
Investment Company Institute reports that the average expenses charged by pension funds was
28 basis points while the average expenses charged by subadvisors was 31 basis points.8 This
finding suggests that the cost of research and security selection is comparable for both pension
funds and mutual funds.
3.3. Identifying the Benchmark
This study examines actively managed funds whose benchmark is likely to be the S&P
500. I focus on the S&P 500 because it is the dominant benchmark amongst institutional
investors. For example, in 2002 (the midpoint of my sample), 1009 institutional investors with
over $1.7 trillion in total assets reported the S&P 500 as their benchmark. The next most
common benchmark was the Russell 2000 with 289 institutional investors and $198 billion in
total assets.9 I take the following steps to remove funds that are unlikely to be actively managed
8 See: http://www.ici.org/pdf/fm-v12n5.pdf
9 See: http://www.russell.com/indexes/documents/Benchmark_Usage.pdf
12
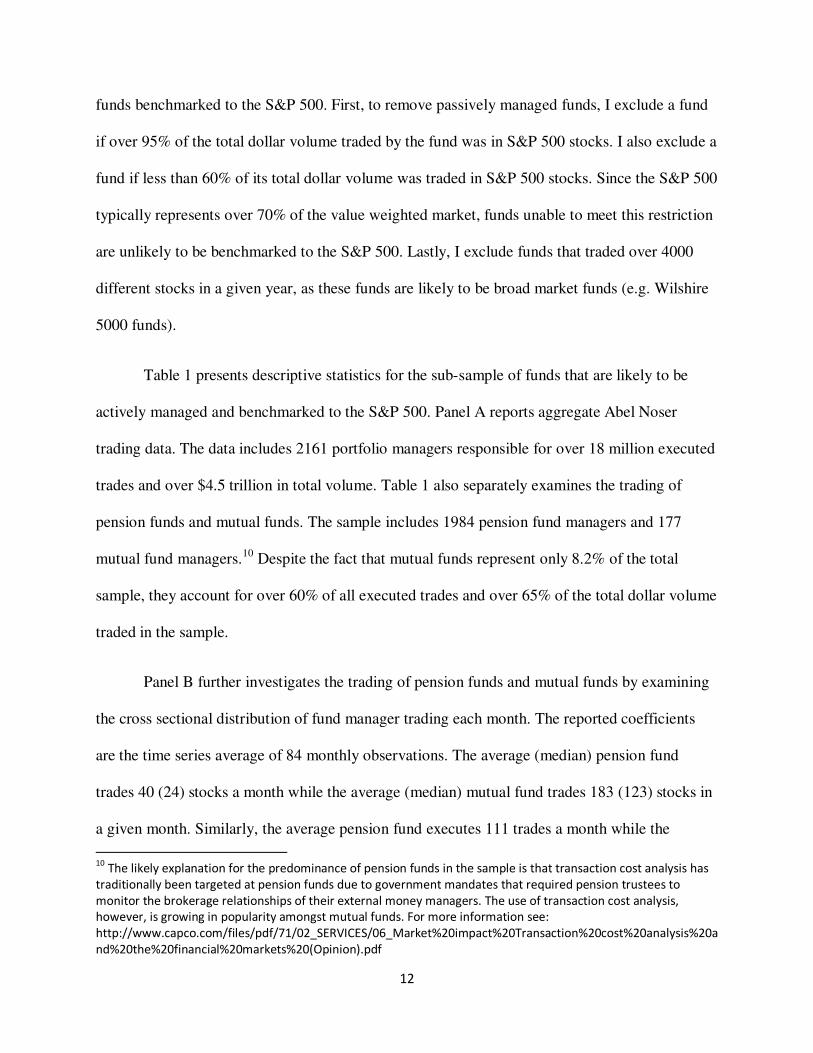
funds benchmarked to the S&P 500. First, to remove passively managed funds, I exclude a fund
if over 95% of the total dollar volume traded by the fund was in S&P 500 stocks. I also exclude a
fund if less than 60% of its total dollar volume was traded in S&P 500 stocks. Since the S&P 500
typically represents over 70% of the value weighted market, funds unable to meet this restriction
are unlikely to be benchmarked to the S&P 500. Lastly, I exclude funds that traded over 4000
different stocks in a given year, as these funds are likely to be broad market funds (e.g. Wilshire
5000 funds).
Table 1 presents descriptive statistics for the sub-sample of funds that are likely to be
actively managed and benchmarked to the S&P 500. Panel A reports aggregate Abel Noser
trading data. The data includes 2161 portfolio managers responsible for over 18 million executed
trades and over $4.5 trillion in total volume. Table 1 also separately examines the trading of
pension funds and mutual funds. The sample includes 1984 pension fund managers and 177
mutual fund managers.10 Despite the fact that mutual funds represent only 8.2% of the total
sample, they account for over 60% of all executed trades and over 65% of the total dollar volume
traded in the sample.
Panel B further investigates the trading of pension funds and mutual funds by examining
the cross sectional distribution of fund manager trading each month. The reported coefficients
are the time series average of 84 monthly observations. The average (median) pension fund
trades 40 (24) stocks a month while the average (median) mutual fund trades 183 (123) stocks in
a given month. Similarly, the average pension fund executes 111 trades a month while the
10
The likely explanation for the predominance of pension funds in the sample is that transaction cost analysis has
traditionally been targeted at pension funds due to government mandates that required pension trustees to
monitor the brokerage relationships of their external money managers. The use of transaction cost analysis,
however, is growing in popularity amongst mutual funds. For more information see:
http://www.capco.com/files/pdf/71/02_SERVICES/06_Market%20impact%20Transaction%20cost%20analysis%20a
nd%20the%20financial%20markets%20(Opinion).pdf

13
average mutual fund executes over 4,000 trades a month. Comparing the ratio of executed trades
to stocks traded suggests that mutual funds break up their orders into smaller trades much more
frequently than do pension funds. Nevertheless, mutual funds still tend to execute larger trades
than do pension funds ($445,000 vs. $330,000). The average mutual fund trades over $1 billion
in a given month while the average pension fund trades $22 million.
Much of mutual fund trading seems to be driven by their very short holding periods.
Monthly round trip trades (i.e. the purchase and sale or the sale and repurchase of the same stock
in the same month) are a sizable fraction of all mutual fund trading. Roughly 25% (20%) of all
trades made by the average (median) mutual fund are monthly round-trip trades. In contrast,
roughly 4.0% (0%) of all trades made by the average (median) pension fund are monthly round
trip trades. Some of this difference may be driven by liquidity motivated trading due to fund
inflows and outflows. However, fund managers typically hold some of their assets in cash, so
flow shocks that reverse themselves over short horizons (e.g. within the month) are unlikely to
lead to significant trading. Thus differences in the monthly round trip trading of mutual funds
and pension funds are not likely to be driven entirely by differences in liquidity based trading.
One explanation for this difference is that mutual funds, who are less constrained by tracking
error, are more aggressive in searching for transient mispricing. They actively trade on this
mispricing and quickly reverse their position once the stock price has reverted back to its
fundamental value. Consistent with this interpretation, I find that the intra-monthly roundtrip
trades of mutual funds do earn significant abnormal returns.11
11
Puckett and Yan (2009), who analyze the same dataset, also find that the intra-quarter roundtrip trades of
mutual funds are highly profitable.
14
4. The Investment Decisions of Pension Funds and Mutual Funds
4.1 Measuring Active Management
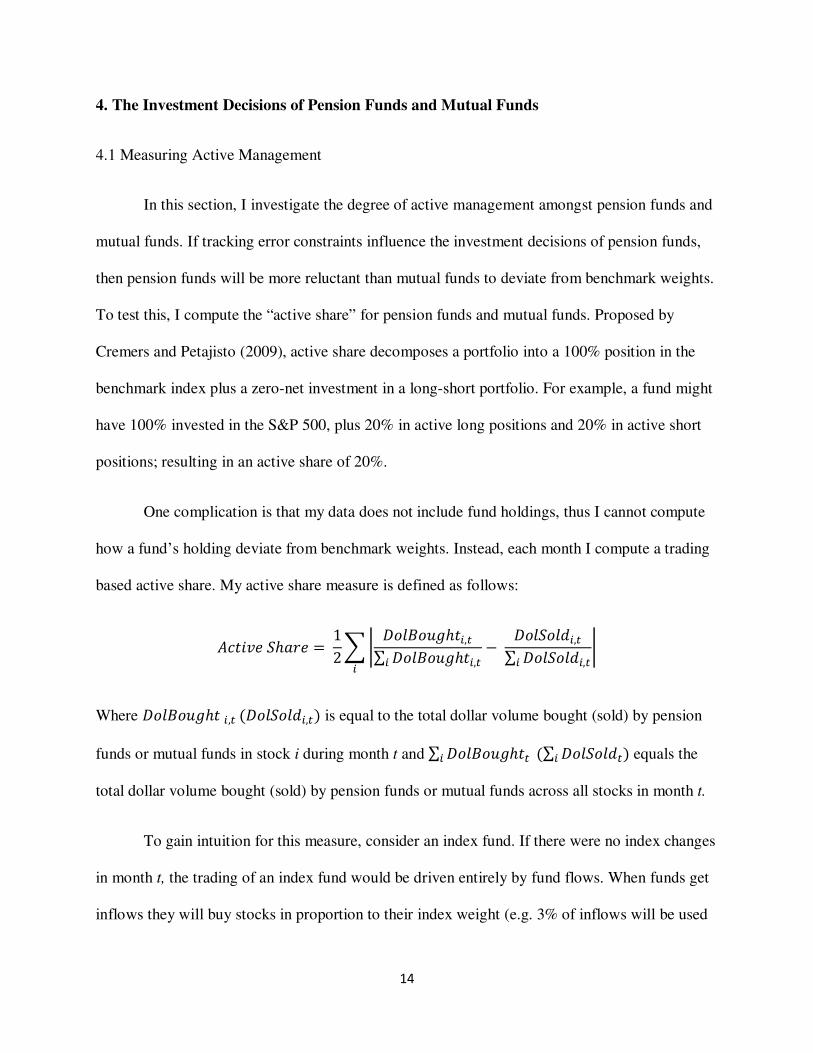
In this section, I investigate the degree of active management amongst pension funds and
mutual funds. If tracking error constraints influence the investment decisions of pension funds,
then pension funds will be more reluctant than mutual funds to deviate from benchmark weights.
To test this, I compute the “active share” for pension funds and mutual funds. Proposed by
Cremers and Petajisto (2009), active share decomposes a portfolio into a 100% position in the
benchmark index plus a zero-net investment in a long-short portfolio. For example, a fund might
have 100% invested in the S&P 500, plus 20% in active long positions and 20% in active short
positions; resulting in an active share of 20%.
One complication is that my data does not include fund holdings, thus I cannot compute
how a fund’s holding deviate from benchmark weights. Instead, each month I compute a trading
based active share. My active share measure is defined as follows:
������ �ℎ�� = 12 � � �������ℎ��,�∑ �������ℎ��,�� − ��������,�∑ ��������,�� �
�
Where �������ℎ� �,� (��������,�) is equal to the total dollar volume bought (sold) by pension
funds or mutual funds in stock i during month t and ∑ �������ℎ��� (∑ ��������� ) equals the
total dollar volume bought (sold) by pension funds or mutual funds across all stocks in month t.
To gain intuition for this measure, consider an index fund. If there were no index changes
in month t, the trading of an index fund would be driven entirely by fund flows. When funds get
inflows they will buy stocks in proportion to their index weight (e.g. 3% of inflows will be used

15
to buy Microsoft) and when funds get outflows they will sell stocks in proportion to their index
weight (e.g. 3% of redemptions will be covered by selling Microsoft). Thus the active share for
this index fund would be zero. However, amongst actively managed funds, funds will buy and
sell stocks in different proportions. For example, Microsoft may account for 4% of pension funds
total buys and only 2% of pension funds total sells, resulting in an active long position of 2% in
Microsoft. To measure the active management of pension funds and mutual funds over the
course of one month, I simply take the sum of the absolute value of all positions. I divide by two
to ensure that the active share does not exceed 100% (i.e. I do not count the long and the short
side of the positions separately). Thus, active share measures the percentage of fund trading in a
given month that generates active long-short positions.
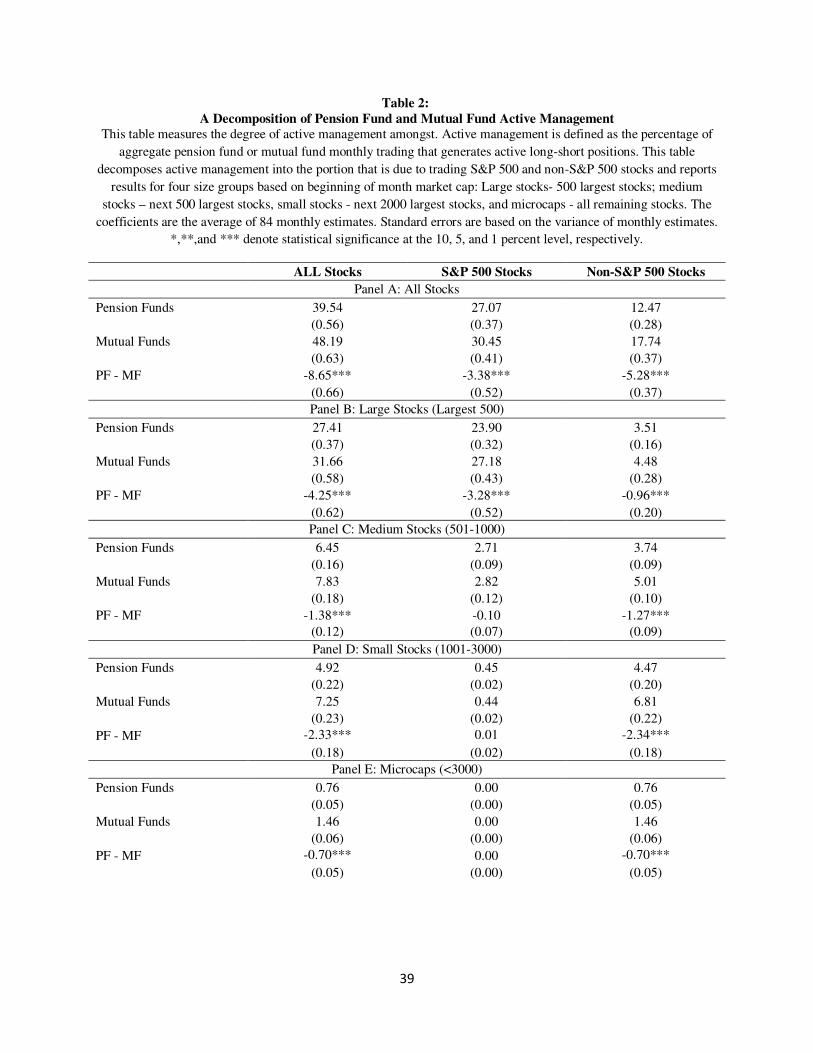
Table 2 reports the time series mean and standard deviation of the monthly estimates of
active share based on the aggregate trading of pension funds and mutual funds. To account for
serial correlation, I calculate the standard deviation of the mean using the Newey West
correction with 12 lags. Panel A reports the results for the full sample of stocks. The average
active share amongst pension fund managers is 39.54%, while mutual funds managers have an
active share of 48.19%. The difference of 8.65% is highly significant and suggests that mutual
funds are more actively managed than pension funds. I also decompose the total active share into
the active share due to trading S&P 500 and non-S&P 500 stocks. Mutual funds engage in
significantly greater active management in both S&P 500 and non-S&P 500 stocks, although this
effect is significantly greater in non-S&P 500 stocks.
One concern is that differences in mutual funds’ active management amongst non-S&P
500 stocks is concentrated in very small stocks, perhaps because fiduciary responsibilities
prohibit pension funds from trading smaller non-S&P 500 stocks (Del Guercio, (1996)). To

16
address this concern, each month, I sort stocks into 4 groups based on the market capitalization at
the beginning of the month. The first group (large stocks) consists of the 500 largest stocks; the
second group (medium stocks) includes the next 500 largest stocks, the third group (small
stocks) contains the next 2000 largest stocks, and the last group (microcaps) includes all
remaining stocks (roughly 3500 stocks). Panels B through E reveal that mutual funds engage in
significantly more active management amongst non-S&P 500 stocks across all four size groups.
4.2 Pension Fund and Mutual Fund Trading and Firm Characteristics
In this section, I use a regression approach to examine differences in the characteristics of
the stocks traded by pension funds and mutual funds. The regressions use 3 dependent variables:
� _"#$"�,� = � _�%$_&%$�,�'�(���)�,� � � _�%$_&%$�,��
* ∗ 10-.
' _"#$"�,� = ' _�%$_&%$�,�'�(���)�,� � ' _�%$_&%$�,��
* ∗ 10-.
�# �,� = � _"#$"�,� − ' _"#$"�,�
In words, /0_123_4235,6789:;�<8=5,6 is the percentage of a stock’s market capitalization traded (percent
traded) by pension funds in a given month. Since the percent traded by pension funds in any
given stock is highly correlated with the total trading activity of pension funds, I scale percent
traded by the total dollar volume traded by pension funds in that given month. Multiplying by 10
billion is an arbitrary scaling factor that makes the coefficients and standard errors more
readable. Thus, � _"#$"�,� captures the percentage of a stock’s market capitalization that would

17
be traded by pension funds in a given month, if they traded $10 billion dollars in that month.
' _"#$"�,� is defined analogously.
I examine the extent to which pension fund and mutual fund tilting is related to several
firm level characteristics. The variable of primary interest is SP, a dummy variable which equals
one if the stock is a member of the S&P 500 index. Other variables include: VOL – total
volatility measured as the standard deviation of monthly gross returns over the previous two
years. MARKETCAP – market capitalization calculated as share price at the beginning of the
month times total shares outstanding. BM – book to market ratio defined as book value for the
fiscal year end before the most recent June 30 (taken from Compustat) divided by market
capitalization on December 31st during that fiscal year. TURN – the average monthly turnover
over the prior three months. PRC – defined as the share price at the beginning of the month. Age
– firm age calculated as the number of month since first returns appear in CRSP. CR – a
numerical proxy for a firm’s credit rating, where a higher numerical score corresponds to a better
credit rating. Each improvement in a credit score corresponds to a 1 point improvement, with
scores ranging from 0 (not ranked) to 22 (AAA).12 D/P – dividend yield calculated as the sum of
all dividends over the prior scaled by the average stock price over the prior year. DIV – a dummy
variable which equals one if the stock pays a dividend. I use natural logs for all of the above
variables except for SP, CR, and DIV. I limit my analysis to largest 1000 firms in a given month.
I exclude smaller stocks because they represent less than 20% of total trading but would account
12
NR signifies not ranked because of insufficient data. Thus NR is not intended to indicate a stock’s quality.
However, my use of credit scores is motivated by the findings of Del Guercio (1996) that banks and other
institutions with fiduciary responsibilities tend to prefer stocks with high rating and avoid stocks that are unrated.

18
for over 85% of total observations; and would thus have an undue influence on regression
estimates.13
Table 3 reports the regression coefficient and standard errors from monthly Fama
Macbeth (1973) regressions. The standard errors are adjusted for serial correlation by using
Newey West standard errors with 12 lags.14 The results from the univariate regression (columns
1, 4, and 7) indicate that pension funds exhibit a strong preference for S&P 500 stocks while
mutual funds have no significant preference for S&P 500 stocks. The coefficients suggest that
for every $10 billion dollars traded, pension funds trade 6.88% of the average non-S&P 500
stock and 11.45% of the average S&P 500 stock. In contrast, mutual funds trade 9.80% of the
average non-S&P 500 stock and 10.31% of the average S&P 500 stock. In other words, for every
1% traded in non-S&P 500 stocks, pension funds trade 1.68% in S&P 500 stocks, compared with
only 1.05% for mutual funds.
These results are consistent with pension funds responding to their incentive to reduce
tracking error by tilting their trading towards stocks in their benchmark. However, there are other
plausible interpretations. Perhaps pension funds avoid trading non-S&P 500 stocks because these
stocks tend to be more illiquid, and thus more costly to trade. Alternatively, differences in
fiduciary responsibilities may explain pension fund’s stronger preference for S&P 500 stocks.
Moreover, if pension fund tilting towards S&P 500 stocks is motivated, at least in part, by
tracking error concerns, then pension funds should be particularly reluctant to trade volatile non-
S&P 500 stocks.
13
Including all stocks significantly strengthens the central conclusion, that pension funds tilt their trading towards
S&P 500 stocks to a greater extent than mutual funds. 14
In unreported results, I’ve repeated the analysis using a panel regression with month dummy variables and
standard errors clustered by firm. Results are very similar.
19
To explore these questions, I run the following Fama Macbeth regression:
"����,� = >. + >-���,� + >@&%$�,� + >A'�BCD"E���,� + >F�'�,� + >G"HBI�,� +>J�BE�,� + >K�LD�,� + >MEB�,� + >N�/��,� + >-.�#&�,� + P�,�
where “"����,� = is either � _"#$"Q,R, ' _"#$"Q,R, or �# _"#$"Q,R. The results of this regression
are presented in columns 2,5, and 8. Columns 3,6, and 9 augment this reaction by including an
interaction term between SP and VOL.
Several interesting findings emerge. First, pension funds do have a preference for
liquidity (as measured by turnover); however even after controlling for liquidity pension funds
still exhibit a strong preference for S&P 500 stocks. Moreover mutual funds appear to have a
similar preference for liquidity, thus controlling for liquidity has no significant effect on pension
funds preference towards S&P 500 stocks relative to mutual funds. Second, both pension funds
and mutual funds tend to tilt their trading away from large stocks. After controlling for mutual
funds tendency to tilt their trading towards relatively smaller stocks, mutual funds do prefer S&P
500 stocks. However, pension funds still tilt their trading towards S&P 500 stocks to a
significantly greater extent than mutual funds.
There is some evidence that differences in fiduciary responsibilities contribute to
differences in the trading behavior of pension funds and mutual funds. Relative to mutual funds,
pension funds show a strong preference for dividend paying stocks. However, both pension
funds and mutual funds exhibit a similar aversion to stocks with high dividend yields. This result
suggests that pension funds preference for dividend paying stocks is not driven by tax differences
or risk preferences, but instead because non-dividend paying stocks are more likely to be viewed
20
as imprudent investments.15 However, pension funds do not exhibit a strong preference for older
stocks or stocks with higher credit rating, two other measures that often proxy for prudence (Del
Guercio, (1996)). Moreover, pension funds preference for S&P 500 stocks persists even after
controlling for these measures of prudence.
Pension funds and mutual funds also have very different attitudes towards stock price
volatility. Pension funds tend to tilt their trading away from volatile stocks while mutual funds
have a strong preference for volatility. Since volatility stocks are often viewed as imprudent,
pension fund’s relative aversion to stock price volatility may also be driven by their greater
fiduciary responsibilities. Alternatively, mutual fund’s preference for volatility may stem from
the performance-flow relationship in the mutual fund industry. Since investors tend to rewards
big winners but fail to punish big losers, mutual funds have a natural incentive to take on
volatility (Chevalier and Ellison, (1997)). In contrast, because the performance-flow relationship
in the pension fund industry is essentially linear and because pension funds managers are
punished for tracking error volatility, pension funds have an incentive to avoid volatile stocks
(Del Guercio and Tkac (2004)). The results from columns 3,6, and 9 indicate that pension funds
tilting towards S&P 500 stocks, both in absolute terms and relative to mutual funds, is positively
related to a firm’s volatility. In other words, pension funds are particularly averse to trading
highly volatile non-S&P 500 stocks. Taken together, the findings of Table 3 suggest that tracking
error constraints lead to pension funds underweighting their trading in non-S&P 500 stocks.
4.3 Momentum Trading
15
The Second Restatement of Trusts by the American Law Institute (1959) specifically cites dividend paying stocks
as an example of a prudent investment.

21
Tracking error constraints may also hinder pension fund’s ability to exploit the well
known momentum effect (Jegadeesh and Titman, (1993)). Since overweighting recent winners
and underweighting recent losers can result in significant deviations from benchmark weights,
pension funds likely underweight momentum strategies relative to mutual funds. To examine
momentum trading by pension funds and mutual funds, each day I compute the value weighted
(by total dollar volume traded) gross return of all stocks bought and sold by pension funds and
mutual funds over the prior 60, 120, and 240 trading days.
Table 4 reports the time-series average across all days. Standard errors are computed
using the Newey-West correction with 60 lags. The prior returns of the stocks bought by pension
funds are not significantly different from the prior returns on the stocks sold by pension funds.
This suggests that the investment decisions of pension funds are unrelated to prior performance.
This is in sharp contrast to mutual funds who engage in significant momentum trading. For
example, the stocks bought by mutual funds have outperformed the stocks sold by mutual funds
by roughly 300 basis points over the prior 60 trading days. Moreover, the net trades of mutual
funds (i.e. buys – sells) have earned significantly greater returns than the net trades of pension
funds over the prior 60 and 120 trading days. This finding is consistent with the idea that
tracking constraints result in pension funds underweighting profitable momentum strategies
relative to mutual funds.
5. The Performance of Pension Funds and Mutual Funds
The results of the previous section suggests that the negative relationship between
tracking error and fund flows in the pension fund industry does impact the investment decisions
of pension funds managers. Specifically, relative to mutual funds, pension funds engage in less
22
active management, tilt their trading towards stocks in their benchmark, and are less aggressive
in trading on short term momentum. In this section, I examine whether these differences in
investment decisions lead to differences in performance
5.1 Total Performance
To assess pension fund and mutual fund performance, each day I compute the value
weighted (by total dollar volume traded) return of all stocks bought and sold by pension funds
and mutual funds over the subsequent 5, 20, 60, 120, 180, and 240 trading days. The returns are
computed using the actual execution price but do not include trading commissions. I eliminate all
trades where the execution price reported by Abel Noser is outside of the daily high and low
price reported by CRSP.16
Panel A of Table 5 reports the time series average of the daily estimates of gross returns
(i.e. non-risk adjusted returns). I use Newey-West standard errors in computing the t-statistics
due to the serial correlation induced by overlapping periods.17 The performance of pension fund
trades (i.e. buys – sells) is insignificantly different from zero across all holding periods. In
contrast, the stocks bought by mutual funds significantly outperform the stocks sold by mutual
funds for all horizons except for the 240 day holding period. Mutual fund’s performance over
short horizons is particularly strong. For example, the stocks bought by mutual funds outperform
the stocks sold by mutual funds by 55 basis points over holding periods of 20 trading days. The
standard error of this portfolio is only 13 basis points indicating that mutual fund performance is
16
The execution price reported by Abel Noser lies within the CRSP daily high and low price for roughly 99.9% of all
trades. I’ve repeated the analysis including these .1% of trades under the assumption that the execution price was
equal to the CRSP closing price, results are virtually identical. 17
The number of lags used to compute the standard errors is equal to: max (60, 1 + holding period). I limit the
number of lags to 60 trading days, because the returns on pension fund and mutual fund portfolios are serially
uncorrelated for periods of greater than 60 trading days.
23
greater than 4 standard errors away from zero. This estimate is not only statistically significant,
but also economically important; this outperformance translates into an annualized
outperformance of nearly 7%.
I next investigate whether pension fund underperformance is driven by differences in the
characteristics of stocks traded by pension funds and mutual funds. For example, mutual funds
may earn higher returns than pension funds simply because the engage in momentum trading to a
significantly greater extent than pension fund. To examine this issue, I repeat the analysis above
using DGTW adjusted returns (Daniel, Grinblatt, Titman, and Wermers (1997). DGTW
benchmark portfolios are constructed by first sorting all stocks into quintiles based on market
capitalization. Then within each size quintile, stocks are sorted into quintiles based on book-to-
market ratio, resulting in 25 different portfolios. Within each portfolio, stocks are once again
sorted into quintiles based on prior 12 month returns, resulting in 125 portfolios. Benchmark
portfolio returns are then computed as the value-weighted holding period buy and hold return for
each of these 125 portfolios.18 The benchmark for each stock is the portfolio to which it belongs.
The DGTW adjusted return for each stock is the difference between the stock return and the
benchmark portfolio return over a particular holding period.
Panel B of Table 5 reports the DGTW adjusted performance of pension funds and mutual
funds. The DGTW adjusted performance of pension funds is similar to their gross performance.
Pension fund performance is very close to zero, ranging from -8 basis points (240 days) to 4
basis points (20 days). In contrast, the DGTW adjusted performance of mutual funds is always
lower than their gross performance. For example, over a 20 day holding period, mutual fund
18
For more details on the DGTW benchmark construction procedure see DGTW (1997) or Wermers (2004) The
DGTW benchmarks are available via http://www.smith.umd.edu/faculty/rwermers/ftpsite/Dgtw/coverpage.htm

24
performance falls from 55 basis points to 38 basis points. Over 180 day horizons, mutual funds
performance declines from 81 basis points to 40 basis points.
To get a better sense for what accounts for the sizable difference between mutual funds’
gross and DGTW adjusted performance, I compute one factor, three factor, and four factor
alphas for the 20 day buy-sell portfolios of mutual funds and pension funds.19 Specifically, I run
a time series regression where the dependent variable is the 20 day return on the portfolio of the
stocks bought by pension funds (or mutual funds) less the return on the portfolio of stocks sold
by pension funds (or mutual funds). The one factor model uses the market factor (MKT-RF) as
the only independent variable, the three factor model includes the Fama and French (1993)
factors (MKT-RF, SMB, and HML), and the four factor model adds momentum (MKT-RF,
SMB, HML, UMD).
The one factor, three factor, and four factor alphas for the 20 day buy-sell mutual fund
portfolios are 55, 51, and 43 basis points, all of which are statistically significant. Mutual funds
do load positively on SMB and UMD, indicating that mutual funds are net buyers of small stocks
and momentum stocks. The results suggest that the difference between mutual funds gross and
DGTW adjusted returns can be attributed in part to their tendency to be net buyers of small
stocks, but is primarily driven by their aggressive momentum trading. The one factor, three
factor, and four factor alphas for the pension fund portfolios are 1, 3, and 2 basis points
respectively; none of which are statistically significant. Pension funds do have a significant
negative loading on HML, but do not load significantly on UMD. Thus, pension funds’ failure to
implement momentum strategies contributes to their weaker gross performance relative to
mutual funds.
19
Factor loadings are similar for other holding periods.

25
Even after controlling for differences in characteristics, there is still some evidence that
mutual funds outperform pension funds. Over holding periods of less than 20 days, mutual funds
significantly outperform pension funds. Indeed, the trades of mutual funds outperform the trades
of pension funds by more than 28 basis points over 5 day holding period, which is nearly 7
standard errors away from zero. To get a better sense for mutual funds short-term
outperformance, I examine the performance of pension fund and mutual fund trades from
execution price to close of trading (hereafter 1 day return). I find that the 1 day return of the
stocks traded by pension funds earn 3 basis points while the 1 day return of stocks traded by
mutual funds earn an impressive 20 basis points. These results suggest that difference in brokers
and execution quality also contribute to mutual fund outperformance. However, even after
controlling for differences in execution costs, mutual funds still exhibit short-term
outperformance. If pension funds and mutual funds simply bought all stocks at the end of day
closing price, mutual funds would still outperform pension funds by a statistically significant 9
basis points over the subsequent 5 trading days. Moreover, although mutual fund
outperformance is no longer statistically significant over longer horizons, outperformance of
more than 45 basis points over a 180 day holding period is not an economically trivial difference.
5.2 Performance in S&P and Non-S&P 500 Stocks
I next investigate the performance of pension funds and mutual funds in S&P 500 and
non-S&P 500 stocks. Since non-S&P 500 stocks tend to be smaller stocks with less analyst
coverage, it seems plausible that these stocks are less efficiently priced, and thus offer profitable
investment opportunities to sophisticated investors such as pension funds and mutual funds.
Moreover, if pension fund performance is significantly higher amongst non-S&P 500 stocks,

26
then pension fund’s tendency to underweight their trading in non-S&P 500 stocks is a factor that
contributes to pension funds’ underperformance relative to mutual funds.
Table 6 reports the net performance (i.e. buys – sells) of pension funds and mutual funds
for the subset of non-S&P 500 and S&P 500 stocks for holding periods ranging from 5 to 240
trading days. Panel A reports the gross returns. The main finding is that over longer holding
periods both pension funds and mutual funds have some skill in trading non-S&P 500 stocks. For
example, over a 180 day holding period, the non-S&P 500 stocks bought by pension funds
outperform the non-S&P 500 stocks sold by pension funds by over 130 basis points. Similarly,
the non-S&P 500 stocks bought by mutual funds outperform the non-S&P 500 stocks sold by
mutual funds by over 245 basis points. In sharp contrast, neither pension funds nor mutual funds
exhibit any skill in trading S&P 500 stocks. Moreover, both pension fund and mutual fund’s
performance in non-S&P 500 stocks is significantly greater than their performance in S&P 500
stocks.
Panel B of Table 6 repeats the analysis using DGTW adjusted returns. Over 180 day
holding periods, pension fund and mutual fund performance fall slightly to 98 and 200 basis
points, respectively. However, both estimates remain statistically and economically significant.
In addition, pension fund and mutual fund performance in non-S&P 500 stocks remains
significantly greater than their performance in S&P 500 stocks. The results suggest that non-
S&P 500 stocks represent profitable investment opportunities for sophisticated investors. Thus,
tracking error constraints that result in pension funds tilting their trading towards S&P 500 stocks
have an adverse effect on pension fund performance.

27
One concern, however, is that the majority of pension fund and mutual fund
outperformance in non-S&P 500 stocks occurs in very small and illiquid stocks. If so, it may be
erroneous to conclude that pension funds could improve performance by taking larger positions,
since there may be significant market impact associated with trading these very small stocks. To
address this concern, Panel C of Table 6 reports the DGTW adjusted performance amongst the
subset of the largest 1000 stocks; thus this analysis excludes small stocks and microcap stocks.
The results indicate that pension fund and mutual fund outperformance is actually stronger
amongst the larger non-S&P 500 stocks. Over 180 day holding periods, pension fund and
mutual fund performance increases to 175 and 271 basis points, respectively. Both estimates are
greater than 2.5 standard errors away from zero.
5.3 Performance in Non-S&P 500 and S&P 500 stocks by Firm Characteristics
I next examine whether pension fund and mutual fund outperformance in non-S&P 500
stocks is related to other firm characteristics. Each month, I rank the largest 1000 firms (i.e. I
continue to exclude small and microcap stocks) on the following firm characteristics (as
previously defined in section 4.2): market cap, book-to-market, turnover, volatility, and age. I
split stocks based on the median breakpoint. For example, the 500 stocks with the highest book
to market are classified as value and the 500 stocks with the smallest book to market are
classified as growth. Amongst each group (e.g. value and growth) stocks are further subdivided
by S&P 500 membership.
Table 7 reports the DGTW adjusted performance results for holding periods of 240
trading days for all firm characteristics. Across all firm characteristics, the trades of pension
funds and mutual funds in non-S&P 500 stocks earn positive returns; although some estimates

28
are not statistically significant. The strong performance of pension funds and mutual funds in
non-S&P 500 stocks is concentrated in larger non-S&P 500 stocks. Pension fund and mutual
fund outperformance in non-S&P 500 stocks is also statistically significant in growth stocks,
high and low turnover stocks, volatile and non-volatile stocks, and younger stocks. The finding
that pension fund strong performance in non-S&P 500 stocks is concentrated in larger stocks and
is present in the most liquid stocks (as measured by turnover) suggests that pension funds could
likely improve total performance if they took larger total positions in their non-S&P 500 trades.
5.4 Implied Performances
Just how much do pension funds lose by tilting their trading towards S&P 500 stocks? To
answer this question, I compute the hypothetical performance of pension funds under the
assumption that they traded non-S&P 500 stocks to the same extent as mutual funds. Thus the
stocks traded and turnover remain identical for both pension funds and mutual funds, but the
dollar volume traded in each stock is multiplied by a scaling factor. The scaling factor is
determined from the coefficients of the following Fama MacBeth regression: "����,� = >. + >-���,� . As in Table 3, the regression is estimated for the subset of the largest 1000 stocks. I
focus on the largest 1000 stocks because increasing the dollar volume traded in very small stocks
is unlikely to be a feasible trading strategy given the significant price impact incurred when
trading small stocks. The results of the panel regression indicate that for every 1% traded in non-
S&P 500 stocks, pension funds (mutual funds) trade 1.68% (1.05%) in S&P 500 stocks. In other
words, if pension funds and mutual funds had to allocate their trading to an S&P 500 and non-
S&P 500 stock with equal market caps, pension funds would trade roughly 62.87% (1.68/2.68) in
the S&P 500 stock while mutual funds would trade roughly 51.21% (1.05/2.05) in the S&P 500
stock. Thus, I scale PF dollar volume in S&P 500 stocks by 0.82 (51.21/62.87). Similarly, I scale

29
PF dollar volume in large (i.e. stocks amongst the largest 1000) non-S&P 500 stocks by 1.31
((100-51.21)/(100-62.87)). The dollar volume traded for small stocks remains unchanged. I also
estimate how much mutual fund performance would deteriorate if they traded S&P 500 stocks to
the same extent as pension funds. Using analogous reasoning, I scale MF dollar volume in S&P
500 (non-S&P 500) stocks by 1.22 (0.77).
Trading larger amounts in non-S&P 500 may result in additional price impact. Following
Wermers (2000), I estimate execution costs using the Keim and Madhavan (1997) model.
Specifically, my equation for estimating the total cost of executing a purchase of stock i, as a
percentage of the total value of the trade, is
E�T = 1.098 + 0.336��Y8Z[8\ + 0.092"�]�^�� − 0.084$��(`�)�) + 13.807(1 ��b ).
��Y8Z[8\ is a dummy variable that equals one if the stock is traded on the Nasdaq and zero
otherwise. "�]�^�� is the total dollar volume of the trade scaled by the market capitalization of
stock i.$��(`�)�) is the natural log of the market capitalization of the stock (expressed in $
thousands), and �� is the stock price at the time of the trade. Similarly, my equation for
estimating the total cost of executing a sale of stock i, as a percentage of the total value of the
trade, is
E�c = 0.979 + 0.058��Y8Z[8\ + 0.214"�]�^�� − 0.059$��(`�)�) + 6.537(1 ��b ).
I then compute the hypothetical execution cost of buys as:
De_�����T = �����fg;h ∗ 1 + Di_E�]�jk=l�m;��<8h1 + Di_E�]�f<�n8h

30
�����fg;his the original execution price reported by Abel Noser, Di_E�]�jk=l�m;��<8h is the
computed execution using the hypothetical dollar volume of the trade, and Di_E�]�f<�n8h is the
computed execution cost using the actual dollar volume of the trade. Similarly, I compute the
hypothetical execution costs of sells as
De_�����c = �����fg;h ∗ 1 − Di_E�]�jk=l�m;��<8h1 − Di_E�]�f<�n8h
Table 8 reports the DGTW adjusted hypothetical returns of pension funds and mutual
funds.20 For reference, the actual returns (from Table 5) are also presented. If pension funds
traded S&P 500 stocks to the same extent as mutual funds, the trades of pension funds would
earn 22 basis points over a 180 day holding period. This is a statistically significant 27 basis
point increase over their actual performance of -5 basis points. Not surprisingly, by loading more
heavily on non-S&P 500 stocks, the standard error of the hypothetical portfolio does increase,
but the magnitude of this increase is a relatively small 5 basis points. Similarly, if mutual funds
traded S&P 500 stocks to the same degree as pension funds, the performance of mutual funds’
trades would decline to roughly 20 basis points over a 180 day holding period. This represents a
statistically significant 20 basis point reduction in performance. Moreover, the standard error of
the portfolio would decline by only 7 basis points. These findings indicate that pension fund
tilting towards S&P 500 stocks results in a significant reduction in the performance of their
trades.
5.5. Thomson Data
20
Using gross returns yields similar results.

31
In this section, I examine pension fund and mutual performance using quarterly holdings
data provided by Thomson. The Thomson data include all fund families with greater than $100m
in equity holdings and spans 28 years, from 1980 to 2007. Most importantly, the Thomson data
allow me to compare the performance of the both the trades and the holdings of pension funds
and mutual funds.
5.5.1 Thomson Trading Results
I first compare the performance of pension fund and mutual fund trades. I infer trading by
computing changes in quarterly holdings. Each quarter, I compute the value weighted (by total
dollar volume trade) return of all stocks bought and sold by pension funds and mutual funds. I
label the formation period (i.e. the period in which the trade occurred) as “Qtr 0”. I compute
returns over the prior one and two quarters as well as the subsequent one and two quarters. For
example, suppose during quarter 1 of 1980 (Q1 1980), pension funds bought 200 shares of IBM
and sold 100 shares of Microsoft. “Qtr 0” would be the return of IBM in Q1 1980 less the return
of Microsoft in Q1 1980. “Qtr 1” would be the return of IBM in Q2 1980 less the return of
Microsoft in Q2 1980, and “Qtr 2” would be the return of IBM from the beginning of Q2 1980 to
end of Q3 1980 less the return of Microsoft from the beginning of Q2 1980 to end of Q3 1980.
Panel A of Table 9 reports the gross returns of the net trading (i.e. buys – sells) of
pension funds and mutual funds across the different holding periods. The Qtr -1 result indicates
that pension funds do not engage in significant momentum trading. In contrast, the stocks bought
by mutual funds outperformed the stocks sold by mutual funds by over 300 basis points over the
prior quarter. These findings are consistent with the Abel Noser momentum trading results (see
Table 4). The Qtr -2 results suggest that pension funds do tend to be momentum traders over the

32
prior two quarters; however, mutual funds are still significantly greater momentum traders than
pension funds.
The Qtr 0 results reveal an astounding difference between the trading of pension funds
and mutual funds. During the formation period, the stocks bought by pension funds earn
essentially the same return as the stocks sold by pension funds, while the stocks bought by
mutual funds outperform the stocks sold by mutual funds by over 770 basis points. Interpreting
this difference requires some speculation. If mutual fund trading occurred at the very end of the
quarter, this would suggest that mutual funds are significant short-term momentum traders. On
the other hand, if mutual funds trading occurred at the very beginning of the quarter, this would
suggest that the stocks traded by mutual funds earn significantly positive returns over short
horizons. Both of these results are consistent with the Abel Noser findings, and both likely
contribute to the extreme differences in the Qtr 0 result.21
The stocks bought by pension funds do not significantly outperform the stocks sold by
pension funds over the subsequent one or two quarters. However, the stocks bought by mutual
funds outperform the stocks sold by mutual funds by about 92 basis points over the subsequent
quarter and by 181 basis points over the subsequent two quarters. Moreover, the trades of mutual
funds outperform the trades of pension funds by roughly 152 basis points over the subsequent
two quarters. Panel B of Table 9 indicates that some of mutual fund outperformance is due to
simply following momentum strategies. Over the subsequent two quarters the DGTW adjusted
performance of mutual fund trades drop to 103 basis points and their outperformance over
pension funds drops to a statistically insignificant 115 basis points. The performance results
using the Thomson trading data are highly consistent with the Abel Noser findings (see Table 5).
21
Price pressure may also contribute to the significant formation period returns.

33
The results provide confirmatory evidence that the trades of pension funds underperform the
trades of mutual funds and that pension funds’ reluctance to implement profitable momentum
strategies contributes to their underperformance.
5.5.2 Thomson Holding Results
While the above results indicate that the trades of pension funds significantly
underperform the trades of mutual funds, it is not obvious how big of an impact trading
differences have on the performance of total holdings. To assess the performance of pension
fund and mutual fund holdings, I compute four measures of fund performance. The first is the
total net asset weighted gross performance of pension fund and mutual fund holdings. I also
compute three factor alphas, four factor alphas, and DGTW adjusted returns.
Panel A of Table 10 reports the performance of holdings under the assumption that all
trades were made at the very end of the quarter, while Panel B of Table 10 reports the
performance of holdings under the assumption that all trades were made at the very beginning of
the quarter. If you assume mutual fund trading occurs entirely at the end of the quarter (Panel A),
then the holdings of mutual funds exhibit only modest outperformance. The three factor alpha for
mutual funds is about 18 basis points per quarter and mutual funds outperform pension funds by
a statistically insignificant 12 basis points per quarter. Moreover, after controlling for momentum
mutual funds exhibit no outperformance, both in absolute terms and relative to pension funds. On
the other hand, if mutual fund trading occurs entirely at the beginning of the quarter (Panel B),
then mutual funds exhibit substantial outperformance. Mutual funds earn a three factor alpha of
roughly 82 basis points per quarter. Controlling for momentum reduces mutual fund abnormal
returns to between 32 and 53 basis points per quarter, both of which remain economically and

34
statistically significant. Moreover, mutual funds outperform pension funds by about 75 basis
points per quarter before controlling for momentum and by roughly 24 to 54 basis points after
controlling for momentum.
Given that mutual funds tend to trade on short-term momentum, the assumption that
mutual funds trade at the beginning of the quarter almost certainly overstates mutual fund
performance. However, given the short-term performance results of mutual fund documented
using the Abel Noser data, the assumption that mutual funds trade at the end of quarter almost
certainly understates mutual fund performance. As a compromise, in unreported results, I also
compute pension fund and mutual fund performance assuming that all trades were bought at the
midpoint of the quarter. Under this assumption, I find that mutual funds outperform pension
funds by roughly 40 basis points per quarter before controlling for momentum, and by about 13
to 25 basis points per quarter after controlling for momentum. All estimates are statistically
significant and suggest that differences in the performance of trades do meaningfully impact the
performance of total holdings.
6. Conclusion
In this paper, I argue that the treasurer’s emphasis on tracking error distorts the
investment decisions of pension funds and impairs pension fund performance. Consistent with
this position, I find that relative to mutual funds, pension funds are less actively managed, tilt
their trading towards stocks in their benchmark, and are less aggressive in implementing
momentum strategies. Further, I show that the trades of pension funds significantly underperform
the trades of mutual funds. Much of pension fund’s relative underperformance can be explained
by pension funds reluctance to implement momentum strategies and by their underweighting of

35
profitable investment opportunities in non-S&P 500 stocks, despite a demonstrated ability to
generate abnormal returns in these stocks. These results provide evidence that the additional
layer of delegation found in the pension fund industry likely generates significant agency costs,
and suggests that the current organizational structure of the pension fund industry may be
suboptimal.

36
References:
Badrinath, S., and S. Wahal, 2002, “Momentum Trading by Institutions,” Journal of Finance 57, 2449-2478.
Bauer, R., and R. Frehen, 2008, “The Performance of US Pension Funds,” working paper,
Maastricht University. Busse, J, A. Goyal, and S. Wahil, 2009, “Performance Persistence in Institutional Investment
Management” Journal of Finance, forthcoming. Carhart, M., 1997, “On Persistence in Mutual Fund Performance”, Journal of Finance 52, 57-82. Carhart, M., R. Kaniel, D. Musto and A. Reed, 2002, “Leaning for the Tape: Evidence of
Gaming Behavior in Equity Mutual Funds”, Journal of Finance 57, 661-693. Chemmanur, T., S. He, and G. Hu, 2009, “The Role of Institutional Investors in Seasoned Equity
Offerings” Journal of Financial Economics, forthcoming.
Chevalier, J. and G. Ellison, 1997, “Risk taking by mutual funds as a response to incentives,” Journal of Political Economy 105, 1167-1200.
Cremers, M. and A. Petajisto, 2009, “How Active Is Your Fund Manager? A New Measure That
Predicts Performance,” Review of Financial Studies, forthcoming. Daniel, K., M. Grinblatt, S. Titman, and R. Wermers, 1997, “Measuring Mutual Fund
Performance with Characteristic-Based Benchmarks,” Journal of Finance 52, 1035-1058. Del Guercio, D., 1996, “The Distorting Effect of the Prudent-Man Laws on Institutional Equity
Investment,” Journal of Financial Economics 40, 31-62. Del Guercio, D. and P.A. Tkac, 2002, “The Determinants of Flow of Funds of Managed
Portfolios: Mutual Funds versus Pension Funds,” Journal of Financial and Quantitative
Analysis 37(4), 523-57. Fama, E. and K. French, 1993, “Common Risk Factors in the Returns on Stocks and Bonds”,
Journal of Financial Economics 33, 3-56. Fama, E., and J. Macbeth, 1973, “Risk, Return, and Equilibrium: Empirical Tests,” Journal of
Political Economy 81, 607-636.
French, K. 2008, “The Cost of Active Investing,” Journal of Finance 63, 1537-1574. Grinblatt, M., S. Titman, and R. Wermers, 1995, “Momentum Investment Strategies, Portfolio
Performance, and Herding: A Study of Mutual Fund Behavior,” American Economic Review 85, 1088-1105.
37
Ippolito, R. A., 1989, “Efficiency With Costly Information: A Study of Mutual Fund
Performance, 1965-1984,” Quarterly Journal of Economics 104, 1-24.
Jegadeesh, N and S. Titman, 1993, “Returns to Buying Winners and Selling Losers: Implications for Stock Market Efficiency,” Journal of Finance 48, 65-91.
Keim, D., and A. Madhavan, 1995, “Anatomy of the trading process: Empirical evidence on the behavior of institutional traders,” Journal of Financial Economics 37, 371-398.
Keim, D., and A. Madhavan, 1996, “The upstairs market for large-block transactions: Analysis
and measurement of price effects,” Review of Financial Studies 9, 1-36. Keim, D., and A. Madhavan, 1997, “Transaction costs and investment style: An inter exchange
analysis of institutional equity trades,” Journal of Financial Economics 46, 265-292.
Lakonishok, J., A. Shleifer, and R. Vishny, 1992, “The structure and performance of the money management industry,” Brookings Papers: Microeconomics 1992, 339-391.
Newey, W., and K. West, 1987, “A simple positive definite heteroskedasticity and
autocorrelation consistent covariance matrix,” Econometrica 55, 703-708. Patel, J., R. Zeckhauser, and D. Hendricks, 1991, “The rationality struggle: Illustrations from
financial markets,” American Economic Review 81, 232–236. Puckett, A., and X. Yan., 2009, “The Interim Trading Skill of Institutional Investors,” working
paper, The University of Missouri.
Rauh, J., 2006, “Investments and Finance Constraints: Evidence from the Funding of Corporate Pension Plans,” Journal of Finance 61, 33-71.
Roll, R., 1992, “A Mean/Variance Analysis of Tracking Error,” Journal of Portfolio
Management 8, no. 4 (Summer): 13-22. Sirri, E. R., and P. Tufano, 1998, “Costly Search and Mutual Fund Flows,” Review of Financial
Studies 53, 1589-1622.
Wermers, R., 2000, Mutual Fund Performance: An Empirical Decomposition into Stock-Picking Talent, Style, Transaction Costs, and Expenses, Journal of Finance 55, 1655-1703.

38
Table 1
Descriptive Statistics for Aggregate Institutional Trading This table presents descriptive statistics for Abel Noser institutional trading data. The sample includes all the
institutional clients of Abel Noser Corp. who are likely to be actively managed funds benchmarked to the S&P 500. Panel A reports aggregated sums across all institutions (or all pension funds/mutual funds) over the sample period of January 1, 1999 to December 31, 2005. Panel B reports the cross sectional distribution of fund manager trading. For
each month, the distribution for each variable is computed for mutual funds and pension funds. The coefficients reported are the time series average based on 84 monthly observations.
Panel A: Aggregate Trading
All Funds
Pension Funds
% of Sample
Mutual Funds
% of Sample
Total Number of Managers 2161 1984 91.8% 177 8.2%
Total Executed Trades 18.07 6.98 38.6% 11.09 61.4%
Total Dollar Volume Traded ($trillions) 4.56 1.55 34.0% 3.01 66.0%
Dollar Volume of Buys ($trillions) 2.27 0.76 33.5% 1.51 66.5%
Dollar Volume of Sells ($trillions) 2.29 0.79 34.5% 1.5 65.5%
Total Shares Volume Traded (billions) 139.5 44.74 32.1% 94.76 67.9%
Share Volume of Buys (billions) 68.78 21.78 31.7% 47 68.3%
Share Volume of Sells (billions) 70.73 22.96 32.5% 47.77 67.5%
Panel B: Cross Sectional Distribution of Monthly Trading
Mean Median Std. Dev 95th 5th
PF No. of Trades Executed 111 53 290 358 4
MF No. of Trades Executed 4058 967 8083 22074 44
PF No. of Stocks Trades 40 24 60 128 3
MF No. of Stocks Traded 183 123 170 522 14
PF Ave $ Vol Per Trade (thousands) 337 148 611 1276 19
MF Ave $ Vol Per Trade (thousands) 445 254 600 1370 29
PF Total $ Volume (millions) 22 8 54 87 1
MF Total $ Volume (million) 1314 224 2864 7257 7
PF Pct Monthly Roundtrip Trades 3.86% 0.02% 8.78% 17.76% 0.00%
MF Pct Monthly Roundtrip Trades 24.94% 20.10% 21.71% 66.15% 0.51%
39
Table 2: A Decomposition of Pension Fund and Mutual Fund Active Management
This table measures the degree of active management amongst. Active management is defined as the percentage of
aggregate pension fund or mutual fund monthly trading that generates active long-short positions. This table
decomposes active management into the portion that is due to trading S&P 500 and non-S&P 500 stocks and reports
results for four size groups based on beginning of month market cap: Large stocks- 500 largest stocks; medium
stocks – next 500 largest stocks, small stocks - next 2000 largest stocks, and microcaps - all remaining stocks. The
coefficients are the average of 84 monthly estimates. Standard errors are based on the variance of monthly estimates.
*,**,and *** denote statistical significance at the 10, 5, and 1 percent level, respectively.
ALL Stocks S&P 500 Stocks Non-S&P 500 Stocks
Panel A: All Stocks
Pension Funds 39.54 27.07 12.47
(0.56) (0.37) (0.28)
Mutual Funds 48.19 30.45 17.74
(0.63) (0.41) (0.37)
PF - MF -8.65*** -3.38*** -5.28***
(0.66) (0.52) (0.37)
Panel B: Large Stocks (Largest 500)
Pension Funds 27.41 23.90 3.51
(0.37) (0.32) (0.16)
Mutual Funds 31.66 27.18 4.48
(0.58) (0.43) (0.28)
PF - MF -4.25*** -3.28*** -0.96***
(0.62) (0.52) (0.20)
Panel C: Medium Stocks (501-1000)
Pension Funds 6.45 2.71 3.74
(0.16) (0.09) (0.09)
Mutual Funds 7.83 2.82 5.01
(0.18) (0.12) (0.10)
PF - MF -1.38*** -0.10 -1.27***
(0.12) (0.07) (0.09)
Panel D: Small Stocks (1001-3000)
Pension Funds 4.92 0.45 4.47
(0.22) (0.02) (0.20)
Mutual Funds 7.25 0.44 6.81
(0.23) (0.02) (0.22)
PF - MF -2.33*** 0.01 -2.34***
(0.18) (0.02) (0.18)
Panel E: Microcaps (<3000)
Pension Funds 0.76 0.00 0.76
(0.05) (0.00) (0.05)
Mutual Funds 1.46 0.00 1.46
(0.06) (0.00) (0.06)
PF - MF -0.70*** 0.00 -0.70***
(0.05) (0.00) (0.05)

40
Table 3
The Determinants of Pension Fund and Mutual Fund Trading This table presents the results of panel regressions over the sample period of January 1999 to December 2005. The dependent variable is either PF TILT, MF
TILT, or DIF. PF TILT measures the extent to which pension funds tilt their total trading (i.e. buys + sells) towards a given stock in a given month. MF TILT is defined analogously and DIF = PF TILT – MF TILT. The independent variables are: SP – a dummy variable which equals one if the stock is a member of the
S&P 500. VOL – the standard deviation of monthly gross returns over the previous two years. MARKETCAP – beginning of month share price times total shares outstanding. BM – book value of equity divided by market value of equity. PRC –share price at the beginning of the month. TURN – the average monthly
turnover over the prior three months. Age – the number of month since first returns appear in CRSP. CR – a numerical version of a firm’s credit rating with scores ranging from 0 (not ranked) to 22 (AAA). D/P - dividend yield calculated as the sum of all dividends over the prior scaled by the average stock price over the prior year. DIV – a dummy variable which equals one if the stock pays a dividend. I use natural logs for all variables except for SP and CR. The regression
coefficient and standard errors are derived from monthly Fama Macbeth (1973) regressions. The standard errors (in parentheses) are adjusted for serial correlation by using Newey West standard errors with 12 lags. *,**,and *** denote statistical significant at the 10, 5, and 1 percent level, respectively.
PF TILT MF TILT DIF
1 2 3
4 5 6
7 8 9 INT
6.88*** 11.86*** 8.20***
9.80*** 14.17*** 24.16***
-2.92*** 12.31*** -15.96***
(0.39) (2.19) (2.47)
(0.34) (2.18) (2.25)
(0.21) (1.95) (2.10)
SP
4.66*** 4.66*** 12.17***
0.51 1.25*** 1.56*
4.16*** 3.41*** 10.60***
(0.35) (0.21) (1.44)
(0.47) (0.20) (0.82)
(0.51) (0.25) (1.21)
VOL
-1.03 -1.52**
1.34*** 1.33***
-2.36*** -2.85***
(0.65) (0.72)
(0.27) (0.28)
(0.70) (0.63)
SP*VOL
1.75***
0.10
1.66***
(0.35)
(0.63)
(0.28)
SIZE
-0.39*** -0.33***
-0.52*** -0.52***
0.13 0.19*
(0.09) (0.10)
(0.14) (0.14)
(0.11) (0.11)
TURN
3.56*** 3.58***
3.81*** 3.81***
-0.25 -0.23
(0.52) (0.52)
(0.26) (0.26)
(0.39) (0.39)
BM
1.03*** 0.98***
-0.76*** -0.75***
1.79*** 1.74***
(0.21) (0.21)
(0.08) (0.08)
(0.22) (0.22)
PRC
0.16 0.25
0.62*** 0.63***
-0.46** -0.38*
(0.18) (0.16)
(0.09) (0.09)
(0.22) (0.21)
AGE
-0.55* -0.52*
-0.41*** -0.41***
-0.14 -0.11
(0.29) (0.27)
(0.08) (0.08)
(0.28) (0.56)
CR
0.00 0.02
0.00 0.00
0.00 0.02
(0.01) (0.01)
(0.01) (0.01)
(0.01) (0.01)
D/P
-13.77*** -13.67***
-13.43*** -13.27***
-0.34 -0.39
(2.03) (2.03)
(2.84) (2.84)
(2.88) (2.83)
DIV
0.70* 0.71*
-2.00*** -2.00***
2.70*** 2.71***
(0.43) (0.44)
(0.24) (0.24)
(0.54) (0.54)
R2
4.08% 11.65% 12.03%
0.37% 22.71% 22.80%
2.52% 9.87% 10.13%

41
Table 4 Momentum Trading by Pension Funds and Mutual Funds
This table presents the prior performance of the stocks bought and sold by pension funds and mutual funds over the sample period of January 1, 1999 to December31, 2005. For each trade, I calculate the gross return over the prior 60, 120, or 240 trading days. Each day, I separately compute the value weighted (by
dollar traded) average return for pension fund buys and sells and mutual fund buys and sells. Finally, I take the difference between buys and sells and the difference between pension funds and mutual funds across all measures. This table reports the time series average across the 1760 trading days in the sample. All returns are
in basis points. Standard errors, in parentheses, are computed using the Newey-West correction. *,**,and *** denote statistical significance at the 10, 5, and 1 percent level, respectively.
Pension Funds Mutual Funds PF-MF
Holding Period
Buys Sells Buys-Sells
Buys Sells Buys-Sells
Buys Sells Buys-Sells
-60 352.5*** 375.45*** -22.95 680.12*** 383.45** 296.67*** -327.62*** -7.99 -319.62***
(133.20) (133.96) (22.18) (202.70) (168.90) (71.48) (97.57) (53.02) (78.96)
-120 847.85*** 860.54*** -12.69 1441.44*** 1092.75*** 348.69*** -593.59*** -232.21** -361.38***
(232.39) (231.31) (29.81) (392.67) (321.77) (126.83) (194.68) (113.08) (127.64)
-240 2154.37*** 2056.64*** 97.74 3307.87*** 2921.33*** 386.53* -1153.49*** -864.49*** -288.80
(448.69) (441.98) (116.33) (760.73) (639.21) (214.97) (353.91) (270.23) (208.00)

42
Table 5
The Performance of the Stocks Traded by Pension Funds and Mutual Funds This table summarizes the performance of the stocks bought and sold by pension funds and mutual funds over the sample period of January, 1, 1999 to December
31, 2005. For each trade, I calculate the gross return from the execution price until 5, 20, 60, 120, 180, or 240 trading days have passed. Each day, I separately compute the value weighted (by dollars traded) average return for pension fund buys and sells and mutual fund buys and sells. Finally, I take the difference
between buys and sells and the difference between pension fund and mutual funds across all measures. This table reports the time series average across the 1760 trading days in the sample. Panel A reports the gross returns and Panel B reports the DGTW adjusted returns. All returns are in basis points. Standard errors, in
parentheses, are computed using the Newey-West correction. *,**,and *** denote statistical significant at the 10, 5, and 1 percent level, respectively
Panel A: Gross Returns
Pension Funds Mutual Funds PF – MF
Holding Period Buys Sells Buys - Sells
Buys Sells Buys - Sells
Buys Sells Buys - Sells
5 18.47 15.56 2.90
44.34** 5.95 38.40***
-25.88*** 9.62** -35.49***
(12.87) (12.60) (2.87)
(14.90) (14.76) (4.56)
(5.06) (4.53) (5.08)
20 54.84 52.59 2.25
88.21* 33.04 55.17***
-33.36* 19.55 -52.92***
(44.71) (42.71) (7.28)
(52.64) (50.42) (13.09)
(18.49) (15.58) (13.65)
60 132.47 130.99 1.48
167.05 113.98 53.07**
-34.58 17.01 -51.59**
(119.07) (117.69) (12.80)
(149.87) (142.86) (25.85)
(49.82) (42.54) (23.80)
120 233.41 233.58 -0.18
268.00 194.15 73.85**
-34.59 39.43 -74.02**
(191.48) (186.19) (22.64)
(240.49) (232.96) (36.53)
(75.03) (73.52) (31.74)
180 337.59 330.22 7.37
381.70 300.24 81.46*
-44.10 29.99 -74.09*
(250.88) (241.09) (24.20)
(315.91) (309.06) (44.68)
(103.06) (103.47) (43.02)
240 467.93 476.01 -8.08
511.98 453.56 58.42
-44.06 22.45 -66.51
(307.56) (291.57) (31.06)
(387.75) (375.53) (67.22)
(125.24) (126.62) (63.03)

43
Panel B: DGTW Adjusted Returns
Pension Funds Mutual Funds PF – MF
Holding Period Buys Sells Buys - Sells Buys Sells Buys - Sells Buys Sells Buys - Sells
5 8.32*** 4.77* 3.54
29.40*** -2.26 31.67***
-21.08*** 7.03** -28.12***
(2.74) (1.72) (2.45)
(3.94) (3.81) (3.52)
(3.51) (3.05) (4.11)
20 13.23** 9.60 3.63
38.83*** 0.96 37.87***
-25.60** 8.64 -34.24***
(6.43) (6.47) (5.53)
(10.61) (8.86) (8.92)
(11.12) (9.28) (3.52)
60 14.99 12.89 2.10
33.98 9.39 24.59
-18.99 3.50 -22.49
(13.57) (16.40) (9.75)
(25.90) (21.62) (16.79)
(24.90) (20.62) (15.42)
120 11.42 18.18 -6.76
26.28 -0.66 26.94
-14.86 18.84 -33.69
(21.86) (26.30) (14.13)
(44.52) (38.07) (23.66)
(38.57) (36.29) (23.12)
180 86.86 91.97 -5.11
105.47 65.11 40.36
-18.60 26.86 -45.46
(118.37) (110.64) (18.61)
(161.47) (157.78) (28.14)
(67.44) (71.09) (30.40)
240 15.39 23.67 -8.28
27.05 -12.95 40.00
-11.67 36.62 -48.29
(34.10) (31.62) (22.50)
(73.84) (60.35) (32.04)
(63.00) (61.57) (33.38)

44
Table 6
The Performance of Pension Funds and Mutual Funds in S&P 500 and Non-S&P 500 Stocks This table reports the net performance (i.e buys- sells) of pension funds and mutual funds in Non-S&P 500 stocks (NSP) and S&P 500 stocks (SP). For each
trade, , I calculate the gross return from the execution price until 5, 20, 60, 120, 180, or 240 trading days have passed. Each day, from January 1, 1999 to December 31, 2005, I separately compute the value weighted (by dollars traded) average return for pension fund buys and sells and mutual fund buys and sells amongst the subset of NSP and SP stocks. I then compute the net returns as the returns on stocks bought less the returns on the stocks sold. Finally, I take the difference between NSP and SP performance and the difference between pension fund and mutual funds across all measures. This table reports the time series average across the 1760 trading days in the sample. Panel A reports the gross returns, Panel B reports the DGTW adjusted returns, and Panel C reports DGTW adjusted returns for the subset of the largest 1000 stocks. All returns are in basis points. Standard errors, in parentheses, are computed using the Newey-West
correction. *,**,and *** denote statistical significant at the 10, 5, and 1 percent level, respectively
Panel A: Gross Returns
Pension Funds Mutual Funds PF – MF
Holding Period NSP SP NSP - SP NSP SP NSP - SP NSP SP NSP - SP
5 -1.97 4.69 -6.67
51.97*** 30.69*** 21.28***
-53.95*** -26.00*** -27.94***
(5.09) (3.13) (5.84)
(6.22) (4.58) (6.44)
(7.21) (5.48) (8.32)
20 16.89 -1.96 18.85
68.48*** 45.99 22.49
-51.59*** -47.95*** -3.64
(14.99) (7.35) (16.16)
(17.23) (10.84) (15.78)
(17.47) (13.61) (0.18)
60 24.80 -6.38 31.19
84.77* 33.08** 51.69
-59.96 -39.46** -20.50
(38.60) (13.97) (44.55)
(49.08) (16.46) (52.14)
(37.01) (19.73) (42.82)
120 35.18 -12.50 47.68
153.58* 35.88 117.60
-118.30* -48.38 -69.92
(51.78) (20.81) (54.52)
(90.87) (25.43) (93.36)
(71.27) (30.93) (83.17)
180 131.69* -28.54 160.23**
246.60** -6.43 253.03***
-114.91 -22.11 -92.79
(69.28) (23.35) (75.82)
(100.58) (43.86) (115.88)
(85.43) (42.38) (95.96)
240 115.84* -44.62 160.46**
283.01** -51.52 334.52**
-167.17 6.90 -174.06
(70.16) (30.26) (76.84)
(144.04) (68.92) (164.82)
(117.47) (65.21) (133.68)

45
Panel B: DGTW Adjusted Returns
Pension Funds Mutual Funds PF – MF
Holding Period NSP SP NSP - SP NSP SP NSP - SP NSP SP NSP - SP
5 -3.63 5.65** -9.28*
47.47*** 23.92*** 23.58***
-51.10*** -18.27*** -32.83***
(4.70) (2.67) (5.26)
(5.78) (3.59) (6.06)
(6.92) (4.44) (7.73)
20 9.74 2.15 7.59
60.94*** 27.40*** 33.54**
-51.21*** -25.25** -25.96
(13.21) (5.73) (13.99)
(15.19) (8.15) (14.86)
(16.97) (10.08) (18.60)
60 11.26 -0.05 11.31
68.19* 8.24 59.95
-56.94* -8.29 -48.64
(30.48) (11.61) (34.40)
(36.12) (17.63) (42.78)
(34.00) (19.20) (43.52)
120 12.69 -13.47 26.17
104.77** -2.45 107.21
-92.07 -11.02 -81.05
(34.28) (17.54) (40.85)
(61.71) (24.91) (71.01)
(59.50) (27.87) (73.22)
180 97.58* -33.28 130.86**
200.33*** -36.69 237.02**
-102.75 3.40 -106.16
(54.05) (21.25) (60.88)
(71.74) (34.34) (91.52)
(1.43) (32.91) (84.74)
240 114.95** -39.19 154.13***
198.38** -26.72 225.10*
-83.44 -12.47 -70.97
(51.82) (25.94) (58.26)
(99.48) (31.22) (115.33)
(92.85) (32.99) (107.08)
Panel C: DGTW Adjusted Returns (Largest 1000 Stocks)
Pension Funds Mutual Funds PF – MF
Holding Period NSP SP NSP - SP NSP SP NSP - SP NSP SP NSP - SP
5 5.59 6.27** -0.67
47.07*** 23.44*** 23.63***
-41.47*** -17.17*** -24.30***
(5.80) (2.68) (6.17)
(6.99) (3.59) (7.21)
(8.48) (4.45) (9.05)
20 30.66* 3.10 27.57*
62.18*** 27.42*** 34.76**
-31.53 -24.32** -7.21
(1.93) (5.73) (15.90)
(16.39) (3.36) (16.66)
(19.47) (10.01) (21.28)
60 58.80* 0.53 58.27
94.35** 9.05 85.29*
-35.55 -8.52 -27.02
(35.34) (11.46) (38.36)
(43.51) (17.40) (47.95)
(39.04) (19.24) (45.71)
120 66.49 -12.44 78.93*
156.79** -0.92 157.71*
-90.29 -11.52 -78.78
(40.92) (17.28) (47.94)
(75.78) (24.73) (82.75)
(67.13) (27.96) (78.91)
180 174.99*** -32.94 207.93***
270.75*** -33.91 304.66**
-95.76 0.96 -96.72
(65.01) (20.99) (71.03)
(87.48) (34.84) (106.05)
(81.64) (33.45) (93.91)
240 215.69*** -39.45 255.14***
261.93** -22.35 284.28**
-46.24 -17.10 29.14
(63.66) (25.81) (69.98)
(108.68) (31.88) (124.20)
(96.15) (33.44) (111.50)
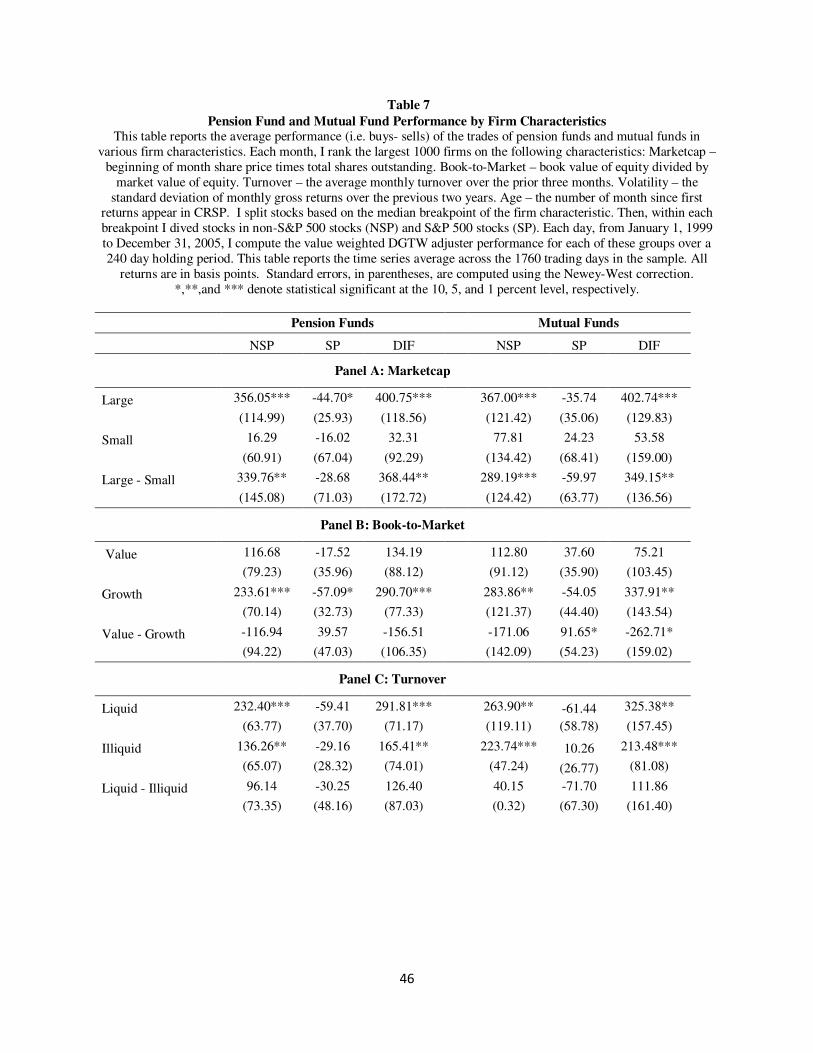
46
Table 7
Pension Fund and Mutual Fund Performance by Firm Characteristics This table reports the average performance (i.e. buys- sells) of the trades of pension funds and mutual funds in
various firm characteristics. Each month, I rank the largest 1000 firms on the following characteristics: Marketcap – beginning of month share price times total shares outstanding. Book-to-Market – book value of equity divided by
market value of equity. Turnover – the average monthly turnover over the prior three months. Volatility – the standard deviation of monthly gross returns over the previous two years. Age – the number of month since first
returns appear in CRSP. I split stocks based on the median breakpoint of the firm characteristic. Then, within each breakpoint I dived stocks in non-S&P 500 stocks (NSP) and S&P 500 stocks (SP). Each day, from January 1, 1999 to December 31, 2005, I compute the value weighted DGTW adjuster performance for each of these groups over a 240 day holding period. This table reports the time series average across the 1760 trading days in the sample. All
returns are in basis points. Standard errors, in parentheses, are computed using the Newey-West correction. *,**,and *** denote statistical significant at the 10, 5, and 1 percent level, respectively.
Pension Funds Mutual Funds
NSP SP DIF
NSP SP DIF
Panel A: Marketcap
Large 356.05*** -44.70* 400.75***
367.00*** -35.74 402.74***
(114.99) (25.93) (118.56)
(121.42) (35.06) (129.83)
Small 16.29 -16.02 32.31
77.81 24.23 53.58
(60.91) (67.04) (92.29)
(134.42) (68.41) (159.00)
Large - Small 339.76** -28.68 368.44**
289.19*** -59.97 349.15**
(145.08) (71.03) (172.72)
(124.42) (63.77) (136.56)
Panel B: Book-to-Market
Value 116.68 -17.52 134.19
112.80 37.60 75.21
(79.23) (35.96) (88.12)
(91.12) (35.90) (103.45)
Growth 233.61*** -57.09* 290.70***
283.86** -54.05 337.91**
(70.14) (32.73) (77.33)
(121.37) (44.40) (143.54)
Value - Growth -116.94 39.57 -156.51
-171.06 91.65* -262.71*
(94.22) (47.03) (106.35)
(142.09) (54.23) (159.02)
Panel C: Turnover
Liquid 232.40*** -59.41 291.81***
263.90** -61.44 325.38**
(63.77) (37.70) (71.17)
(119.11) (58.78) (157.45)
Illiquid 136.26** -29.16 165.41**
223.74*** 10.26 213.48***
(65.07) (28.32) (74.01)
(47.24) (26.77) (81.08)
Liquid - Illiquid 96.14 -30.25 126.40
40.15 -71.70 111.86
(73.35) (48.16) (87.03)
(0.32) (67.30) (161.40)
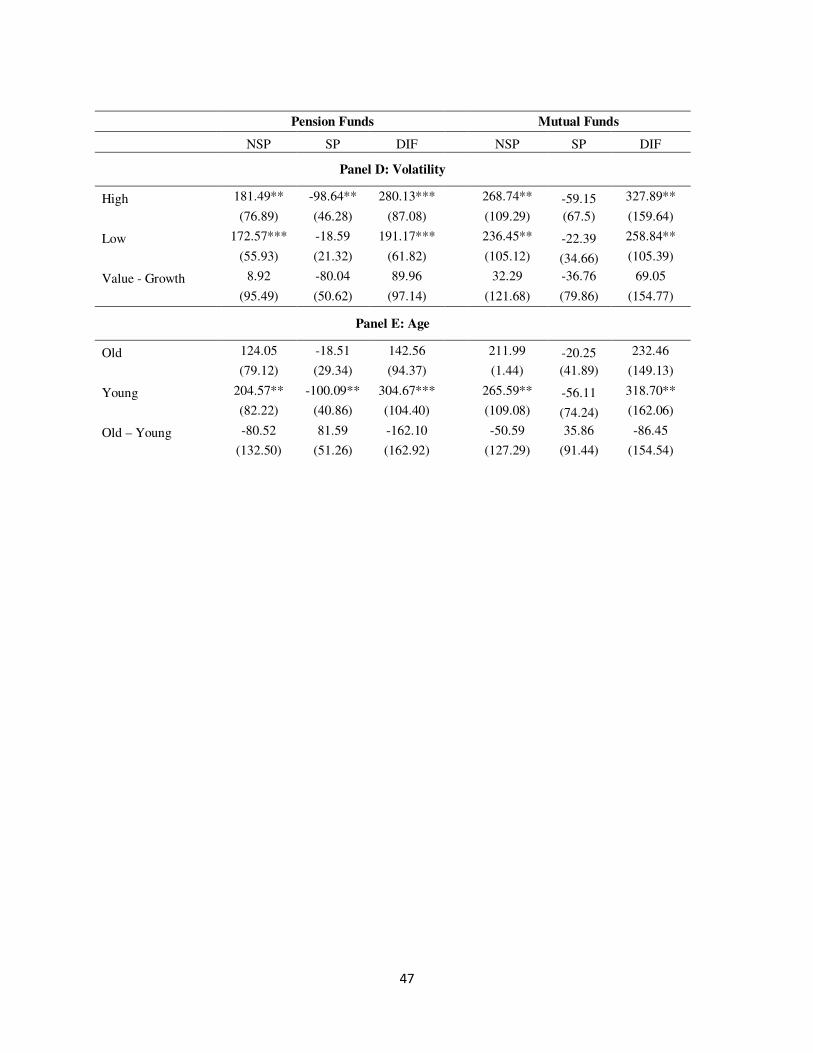
47
Pension Funds Mutual Funds
NSP SP DIF
NSP SP DIF
Panel D: Volatility
High 181.49** -98.64** 280.13***
268.74** -59.15 327.89**
(76.89) (46.28) (87.08)
(109.29) (67.5) (159.64)
Low 172.57*** -18.59 191.17***
236.45** -22.39 258.84**
(55.93) (21.32) (61.82)
(105.12) (34.66) (105.39)
Value - Growth 8.92 -80.04 89.96
32.29 -36.76 69.05
(95.49) (50.62) (97.14)
(121.68) (79.86) (154.77)
Panel E: Age
Old 124.05 -18.51 142.56
211.99 -20.25 232.46
(79.12) (29.34) (94.37)
(1.44) (41.89) (149.13)
Young 204.57** -100.09** 304.67***
265.59** -56.11 318.70**
(82.22) (40.86) (104.40)
(109.08) (74.24) (162.06)
Old – Young -80.52 81.59 -162.10
-50.59 35.86 -86.45
(132.50) (51.26) (162.92)
(127.29) (91.44) (154.54)

48
Table 8
The DGTW Implied Performance of Pension Funds and Mutual Funds This table estimates the hypothetical, or implied, DGTW adjusted net performance (i.e. buys – sells) of pension funds trades under the assumption that pension funds traded S&P 500 stocks to the same extent as mutual funds. The table also estimates the implied performance of mutual fund trades under the assumption
that they traded S&P 500 stocks to the same extent as pension funds. I obtain hypothetical returns by scaling the dollar volume of all trades in S&P 500 and non-S&P 500 stocks by the appropriate factor. I account for differences in transaction costs by applying the execution cost regression of Keim and Madhavan (1997).
For each hypothetical trade, I calculate the return from the execution price until 5, 20, 60, 120, 180, or 240 trading days have passed. Each day, I separately compute the value weighted (by dollars traded) average DGTW adjusted return for pension fund buys and sells and mutual fund buys and sells. Net performance is the difference between buys – sells. This table reports the time series average of net performance across the 1760 trading days in the sample. For reference, the
actual returns (from table 5) are also reported. All returns are in basis points. Standard errors, in parentheses, are computed using the Newey-West correction. *,**,and *** denote statistical significant at the 10, 5, and 1 percent level, respectively
Pension Funds Mutual Funds PF – MF
Holding Period Implied Actual Implied - Actual Implied Actual Implied - Actual Implied Actual Implied – Actual
5 1.27 3.54 -2.27***
28.30*** 31.67*** -3.37***
-27.03*** -28.13*** 1.10
(2.56) (2.45) (0.70)
(3.43) (3.52) (0.67)
(4.01) (4.11) (1.36)
20 4.34 3.63 0.71
33.22*** 37.87*** -4.65***
-28.87*** -34.23*** 5.36***
(6.25) (5.53) (1.79)
(8.38) (8.92) (1.70)
(8.91) (8.99) (1.70)
60 5.65 2.10 3.55
16.21 24.59 -8.38
-10.56* -22.49 11.93
(11.48) (9.75) (4.13)
(14.78) (16.79) (5.41)
(15.87) (15.42) (11.47)
120 -0.95 -6.76 5.81
12.63 26.94 -14.31
-13.58 -33.70 20.12
(14.84) (14.13) (5.16)
(20.63) (23.66) (8.04)
(21.16) (23.12) (15.01)
180 22.30 -5.11 27.41***
20.37 40.36 -19.99**
1.93 -45.57 47.40**
(23.17) (18.61) (7.71)
(21.22) (28.14) (9.68)
(34.77) (30.40) (22.10)
240 14.89 -8.28 23.17***
12.64 40.00 -27.36**
2.25 -48.28 50.33**
(24.61) (22.50) (7.73)
(26.73) (32.04) (12.31)
(31.41) (33.38) (24.08)

49
Table 9
The Performance of the Stocks Traded by Pension Funds and Mutual Funds: Thomsons Data This table reports the performance of pension fund and mutual fund trades using the Thomson (CDA/Spectrum) database. Each quarter, from the first quarter of 1980 to the fourth quarter of 2007, I compute the total net asset weighted performance of the net trades (i.e. buys- sells) of pension funds and mutual funds. Buys and sells are
inferred from changes in quarterly holdings. The period in which the trade occurred is labeled “Qtr 0”. I report the average (across all quarters) portfolio return during event quarters -2, -1, 0, 1, and 2. Qtr 1(Qtr 2) is the return of the stocks bought less the return on the stocks sold over the subsequent 1 (2) quarters. Panel A reports the gross returns,
Panel B reports the DGTW adjusted returns. All returns are in basis points. Standard errors, in parentheses, are computed using the Newey West correction. *, **, and *** denote statistical significance at the 10, 5, and 1% level,
respectively.
Panel A: Gross Returns
Qtr -2 Qtr -1 Qtr 0 Qtr 1 Qtr 2
Pension Funds 286.90*** 64.79 2.76 3.42 29.48
(102.83) (79.99) (46.00) (48.86) (73.70)
Mutual Funds 547.15*** 337.35*** 770.52*** 91.68* 181.11***
(97.88) (62.94) (65.91) (48.25) (67.83)
PF - MF -260.25*** -272.56*** -767.76*** -88.26 -151.63*
(88.82) (64.43) (65.85) (63.50) (90.80)
Panel B: DGTW Adjusted Returns
Qtr -2 Qtr -1 Qtr 0 Qtr 1 Qtr 2
Pension Funds 303.60*** 14.34 20.85 -21.16 -12.56
(91.72) (62.34) (52.15) (55.68) (89.71)
Mutual Funds 557.83*** 314.14*** 703.00*** 77.07* 103.00*
(86.36) (52.80) (67.02) (41.44) (58.52)
PF - MF -254.23** -299.80*** -682.15*** -98.23 -115.56
(104.62) (70.38) (75.56) (66.82) (97.93)
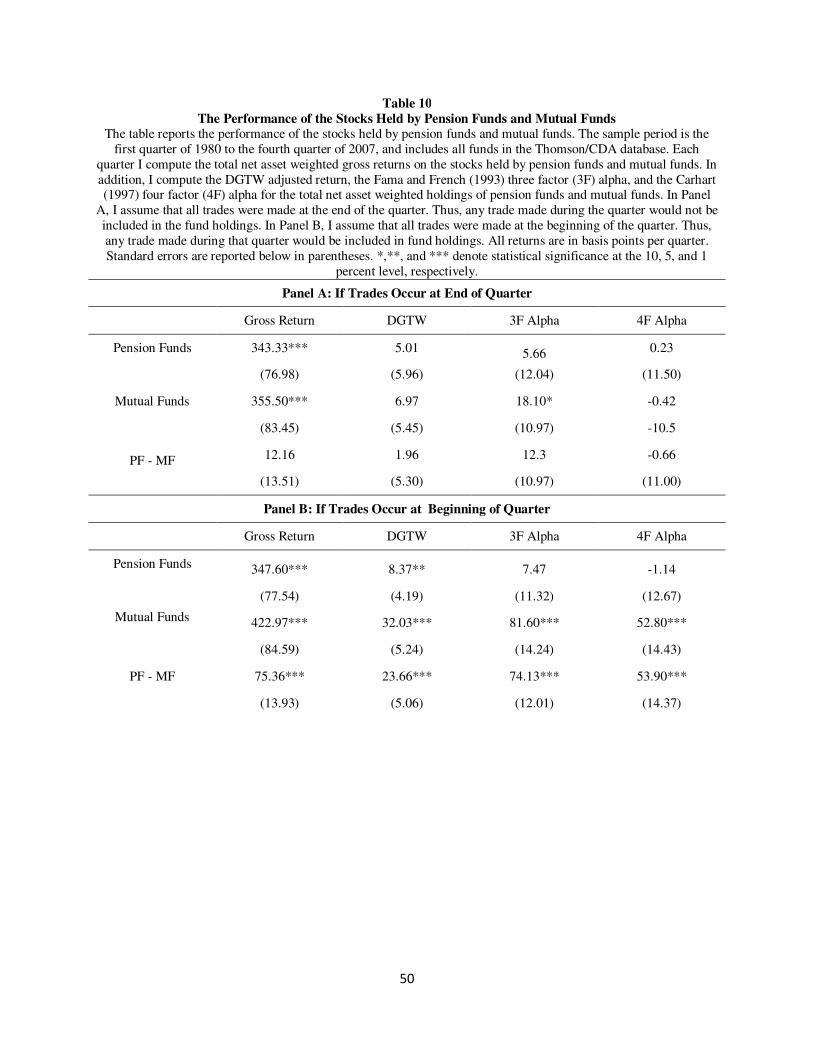
50
Table 10
The Performance of the Stocks Held by Pension Funds and Mutual Funds The table reports the performance of the stocks held by pension funds and mutual funds. The sample period is the
first quarter of 1980 to the fourth quarter of 2007, and includes all funds in the Thomson/CDA database. Each quarter I compute the total net asset weighted gross returns on the stocks held by pension funds and mutual funds. In addition, I compute the DGTW adjusted return, the Fama and French (1993) three factor (3F) alpha, and the Carhart (1997) four factor (4F) alpha for the total net asset weighted holdings of pension funds and mutual funds. In Panel
A, I assume that all trades were made at the end of the quarter. Thus, any trade made during the quarter would not be included in the fund holdings. In Panel B, I assume that all trades were made at the beginning of the quarter. Thus, any trade made during that quarter would be included in fund holdings. All returns are in basis points per quarter. Standard errors are reported below in parentheses. *,**, and *** denote statistical significance at the 10, 5, and 1
percent level, respectively.
Panel A: If Trades Occur at End of Quarter
Gross Return DGTW 3F Alpha 4F Alpha
Pension Funds 343.33*** 5.01 5.66 0.23
(76.98) (5.96) (12.04) (11.50)
Mutual Funds 355.50*** 6.97 18.10* -0.42
(83.45) (5.45) (10.97) -10.5
PF - MF 12.16 1.96 12.3 -0.66
(13.51) (5.30) (10.97) (11.00)
Panel B: If Trades Occur at Beginning of Quarter
Gross Return DGTW 3F Alpha 4F Alpha
Pension Funds 347.60*** 8.37** 7.47 -1.14
(77.54) (4.19) (11.32) (12.67)
Mutual Funds 422.97*** 32.03*** 81.60*** 52.80***
(84.59) (5.24) (14.24) (14.43)
PF - MF 75.36*** 23.66*** 74.13*** 53.90***
(13.93) (5.06) (12.01) (14.37)