mid-year population estimates - statistics south...
TRANSCRIPT

Statistical release P0302
Mid-year population estimates
2013
Embargoed until:14 May 2013
10:30 Enquiries: Forthcoming issue: Expected release date
User Information Services Mid-year population estimates, 2014 July 2014 Tel: (012) 310 8600/4892/8390

Statistics South Africa P0302
Mid-year population estimates, 2013
1
Contents Summary ....................................................................................................................................................................... 2 1. Introduction ......................................................................................................................................................... 4 2. Demographic and other assumptions ................................................................................................................. 4 3. National population estimates ............................................................................................................................ 6 4. Provincial population estimates .......................................................................................................................... 9 4.1 Demographic assumptions ................................................................................................................................. 9 4.2 Provincial distributions ...................................................................................................................................... 11 4.3 Migration patterns ............................................................................................................................................. 11 4.4 Provincial estimates by age and sex ................................................................................................................ 11 References .................................................................................................................................................................. 15
Tables Table 1: Mid-year population estimates for South Africa by population group and sex, 2013 ..................................... 3 Table 2: Mid-year population estimates by province, 2013 .......................................................................................... 3 Table 3: HIV prevalence estimates and the number of people living with HIV, 2002–2013......................................... 4 Table 4: International migration assumptions for the period 1985–2015 ................................................................... 5 Table 5: Assumptions about fertility and mortality levels, 2002–2013 .......................................................................... 5 Table 6: Mid-year estimates by population group and sex, 2013 ................................................................................. 6 Table 7: Estimated annual population growth rates, 2002–2013 ................................................................................. 6 Table 8: Births and deaths for the period 2002–2013 .................................................................................................. 7 Table 9: Mid-year population estimates by population group, age and sex, 2013 ....................................................... 8 Table 10: Percentage distribution of the projected provincial share of the total population, 2002–2013 ................... 11 Table 11: Estimated provincial migration streams, 2001–2006 .................................................................................. 12 Table 12: Estimated provincial migration streams, 2006–2011 .................................................................................. 12 Table 13: Provincial population estimates by age and sex, 2013 .............................................................................. 13
Figures
Figure 1: Provincial average total fertility rates for the periods 2001–2006, 2006–2011 and 2011–2016 ................... 9 Figure 2: Provincial average life expectancy at birth, 2001–2006, 2006–2011 and 2011–2016 (males) .................. 10 Figure 3: Provincial average life expectancy at birth, 2001–2006, 2006-2011 and 2011–2016 (females) ................ 10
Statistics South Africa P0302
Mid-year population estimates, 2013
2
Summary • This release uses the cohort-component methodology to estimate the 2013 mid-year population of South
Africa.
• The estimates cover all the residents of South Africa at the 2013 mid-year, and are based on the latest available information. Estimates may change as new data become available.
• For 2013, Statistics South Africa (Stats SA) estimates the mid-year population as 52,98 million.
• Approximately fifty-one per cent (approximately 27,16 million) of the population is female.
• Gauteng comprises the largest share of the South African population. Approximately 12,7 million people
(24,0%) live in this province. KwaZulu-Natal is the province with the second largest population, with 10,5 million people (19,7%) living in this province. With a population of approximately 1,16 million people (2,2%), Northern Cape remains the province with the smallest share of the South African population.
• About 29,2% of the population is aged younger than 15 years and approximately 7,8% (4,15 million) is 60
years or older. Of those younger than 15 years, approximately 22% (3,42 million) live in KwaZulu-Natal and 19,5% (3,01 million) live in Gauteng.
• Migration is an important demographic process in shaping the age structure and distribution of the
provincial population. For the period 2006–2011 it is estimated that approximately 264 449 people will migrate from the Eastern Cape; Limpopo is estimated to experience a net out-migration of nearly 227 919 people. During the same period, Gauteng and Western Cape are estimated to experience a net inflow of migrants of approximately 1 046 641 and 307 411 respectively.
• Life expectancy at birth for 2013 is estimated at 57,7 years for males and 61,4 years for females.
• The infant mortality rate for 2013 is estimated at 41,7 per 1 000 live births.
• The estimated overall HIV prevalence rate is approximately 10%. The total number of people living with
HIV is estimated at approximately 5,26 million in 2013. For adults aged 15–49 years, an estimated 15,9% of the population is HIV positive.

Statistics South Africa P0302
Mid-year population estimates, 2013
3
Table 1: Mid-year population estimates for South Africa by population group and sex, 2013
Population group
Male Female Total
Number % of male population Number
% of female population Number
% of total population
African 20 607 800 79,8 21 676 300 79,8 42 284 100 79,8
Coloured 2 306 800 8,9 2 459 400 9,1 4 766 200 9,0
Indian/Asian 669 200 2,6 660 100 2,4 1 329 300 2,5
White 2 239 500 8,7 2 362 900 8,7 4 602 400 8,7
Total 25 823 300 100,0 27 158 700 100,0 52 982 000 100,0
Table 2: Mid-year population estimates by province, 2013
Population estimate % of total population
Eastern Cape 6 620 100 12,5
Free State 2 753 200 5,2
Gauteng 12 728 400 24,0
KwaZulu-Natal 10 456 900 19,7
Limpopo 5 518 000 10,4
Mpumalanga 4 128 000 7,8
Northern Cape 1 162 900 2,2
North West 3 597 600 6,8
Western Cape 6 016 900 11,4
Total 52 982 000 100,0
PJ Lehohla Statistician-General

Statistics South Africa P0302
Mid-year population estimates, 2013
4
1. Introduction Statistics South Africa (Stats SA) subscribes to the specifications of the Special Data Dissemination
Standards (SDDS) of the International Monetary Fund (IMF) and publishes the mid-year population estimates for the country annually. This release uses the latest available software from UNAIDS. The HIV epidemic curves were derived using the Estimation and Projection Package which now has been incorporated into SPECTRUM (Version 4.57). Stats SA used JMP script language (JSL) developed by the SAS institute Inc. to do estimates lower than country level.
2. Demographic and other assumptions Our knowledge of the HIV epidemic in South Africa is based primarily on the prevalence data collected
annually from pregnant women attending public antenatal clinics (ANC) since 1990. However antenatal surveillance data produce biased prevalence estimates for the general population because only a select group of people (i.e. pregnant women attending public health services) are included in the sample. To correct this bias we adjusted the ANC prevalence estimates by adjusting for relative attendance rates at antenatal clinics and for the difference in prevalence between pregnant women and the general adult population. For a detailed description of the adjustment see, www.statssa.gov.za.
Median time from HIV infection to death This release assumed the median time from HIV infection to death in line with the UNAIDS Reference
Group recommendation of 10,5 years for men and 11,5 years for women.
Ratio of new infections
Adult HIV incidence is disaggregated into female and male incidence by specifying the ratio of new female infections to new male infections. This report assumes a ratio of female to male prevalence for those aged 15–49 of 1,5 by 2013.
HIV prevalence
Table 3 shows the prevalence estimates and the total number of people living with HIV from 2002 to 2013. The total number of persons living with HIV in South Africa increased from an estimated 4 million in 2002 to 5,26 million by 2013. For 2013 an estimated 10% of the total population is HIV positive. Shisana, et al. (2009) estimated the HIV prevalence for 2008 at 10,9%. Approximately seventeen percent of South African women in their reproductive ages are HIV positive.
Table 3: HIV prevalence estimates and the number of people living with HIV, 2002–2013
Year Prevalence Incidence
Adult 15-49 HIV
population (millions) Women 15-49 Adult 15-49 Youth 15-24 Total
population
2002 15,9 15,1 13,6 8,7 1,26 4,00
2003 16,0 15,1 12,8 8,9 1,25 4,10
2004 16,1 15,1 12,0 8,9 1,28 4,18
2005 16,2 15,1 11,4 9,0 1,32 4,25
2006 16,4 15,2 10,9 9,1 1,29 4,34
2007 16,5 15,3 10,5 9,2 1,21 4,46
2008 16,7 15,4 10,1 9,3 1,12 4,59
2009 16,9 15,5 9,7 9,5 1,03 4,74
2010 17,1 15,6 9,3 9,6 0,98 4,88
2011 17,2 15,7 9,0 9,8 0,95 5,01
2012 17,3 15,8 8,7 9,9 0,87 5,13
2013 17,4 15,9 8,5 10,0 0,85 5,26

Statistics South Africa P0302
Mid-year population estimates, 2013
5
International migration
The following numbers of migrants were assumed in this projection (see Table 4). Table 4: International migration assumptions for the period 1985–2015
Period African Asian White 1985–2000 1 505 600 14 500 (304 100)*
2001–2005 864 000 23 300 (133 800)
2006-2010 974 000 34 700 (112 000)
2011-2015 998 000 40 900 (95 200) * Numbers in brackets indicate an outflow of people
Expectation of life at birth and total fertility
This report makes assumptions about life expectancy at birth by sex and uses a model life table of age-specific mortality rates. Stats SA used the UN East Asia model life tables. Table 5 shows the life expectancies used to generate survival ratios from the UN East Asia model life tables. It also shows the estimates of the fertility assumptions and the infant mortality rates associated with the given mortality pattern. Life expectancy at birth had declined between 2002 and 2005 but has since increased partly due to the roll-out of antiretrovirals. For 2013 life expectancy at birth is estimated at 57,7 years for males and 61,4 years for females. This increase in life expectancy at birth is expected to continue.
Infant mortality has declined from an estimated 63,5 live births per 1 000 in 2002 to 41,7 per 1 000 live
births in 2013. Fertility has declined from an average of 2,71 children per woman in 2002 to 2,34 children in 2013.
Table 5: Assumptions about fertility and mortality levels, 2002–2013
Year Crude birth rate
Total fertility
rate (TFR)
Life expectancy at birth Infant mortality rate (IMR)
Under 5 mortality
Crude death rate
Rate of natural
increase (%)
Male Female Total
2002 24,5 2,71 50,0 55,2 52,7 63,5 92,9 13,9 1,05
2003 24,2 2,68 49,5 54,4 52,1 62,6 91,9 14,6 0,96
2004 23,6 2,61 49,3 53,9 51,7 60,1 89,3 15,0 0,86
2005 23,1 2,56 49,4 53,6 51,6 58,0 85,4 15,2 0,79
2006 22,8 2,53 50,2 54,6 52,5 55,6 80,9 14,6 0,82
2007 22,6 2,53 51,7 56,1 54,0 53,6 76,7 13,5 0,91
2008 22,5 2,52 53,3 57,6 55,5 50,8 72,3 12,6 0,99
2009 22,3 2,51 54,6 58,8 56,8 49,1 68,5 11,8 1,05
2010 22,2 2,50 55,5 59,5 57,6 47,1 65,2 11,5 1,07
2011 21,6 2,44 56,1 60,0 58,1 45,1 62,1 11,3 1,03
2012 21,0 2,39 56,8 60,5 58,7 43,5 59,5 11,0 1,00
2013 20,5 2,34 57,7 61,4 59,6 41,7 56,6 10,6 0,99
Statistics South Africa P0302
Mid-year population estimates, 2013
6
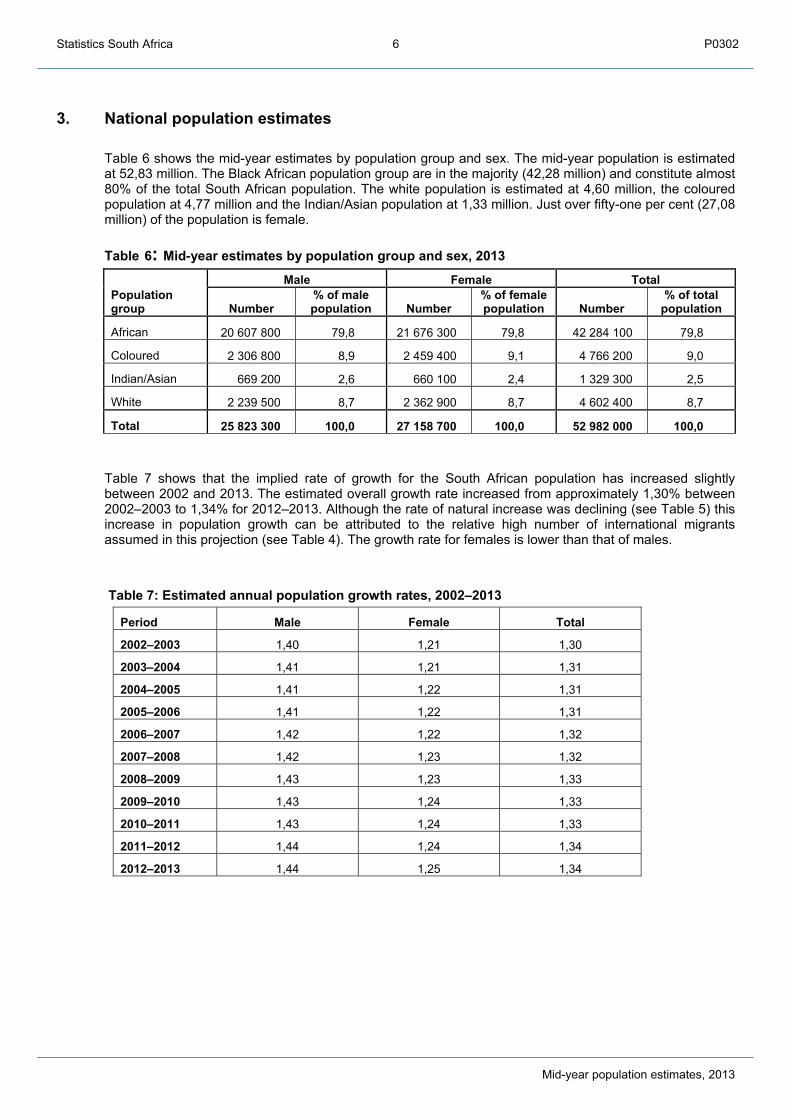
3. National population estimates Table 6 shows the mid-year estimates by population group and sex. The mid-year population is estimated
at 52,83 million. The Black African population group are in the majority (42,28 million) and constitute almost 80% of the total South African population. The white population is estimated at 4,60 million, the coloured population at 4,77 million and the Indian/Asian population at 1,33 million. Just over fifty-one per cent (27,08 million) of the population is female.
Table 6: Mid-year estimates by population group and sex, 2013
Population group
Male Female Total
Number % of male population Number
% of female population Number
% of total population
African 20 607 800 79,8 21 676 300 79,8 42 284 100 79,8
Coloured 2 306 800 8,9 2 459 400 9,1 4 766 200 9,0
Indian/Asian 669 200 2,6 660 100 2,4 1 329 300 2,5
White 2 239 500 8,7 2 362 900 8,7 4 602 400 8,7
Total 25 823 300 100,0 27 158 700 100,0 52 982 000 100,0 Table 7 shows that the implied rate of growth for the South African population has increased slightly
between 2002 and 2013. The estimated overall growth rate increased from approximately 1,30% between 2002–2003 to 1,34% for 2012–2013. Although the rate of natural increase was declining (see Table 5) this increase in population growth can be attributed to the relative high number of international migrants assumed in this projection (see Table 4). The growth rate for females is lower than that of males.
Table 7: Estimated annual population growth rates, 2002–2013
Period Male Female Total
2002–2003 1,40 1,21 1,30
2003–2004 1,41 1,21 1,31
2004–2005 1,41 1,22 1,31
2005–2006 1,41 1,22 1,31
2006–2007 1,42 1,22 1,32
2007–2008 1,42 1,23 1,32
2008–2009 1,43 1,23 1,33
2009–2010 1,43 1,24 1,33
2010–2011 1,43 1,24 1,33
2011–2012 1,44 1,24 1,34
2012–2013 1,44 1,25 1,34
Statistics South Africa P0302
Mid-year population estimates, 2013
7
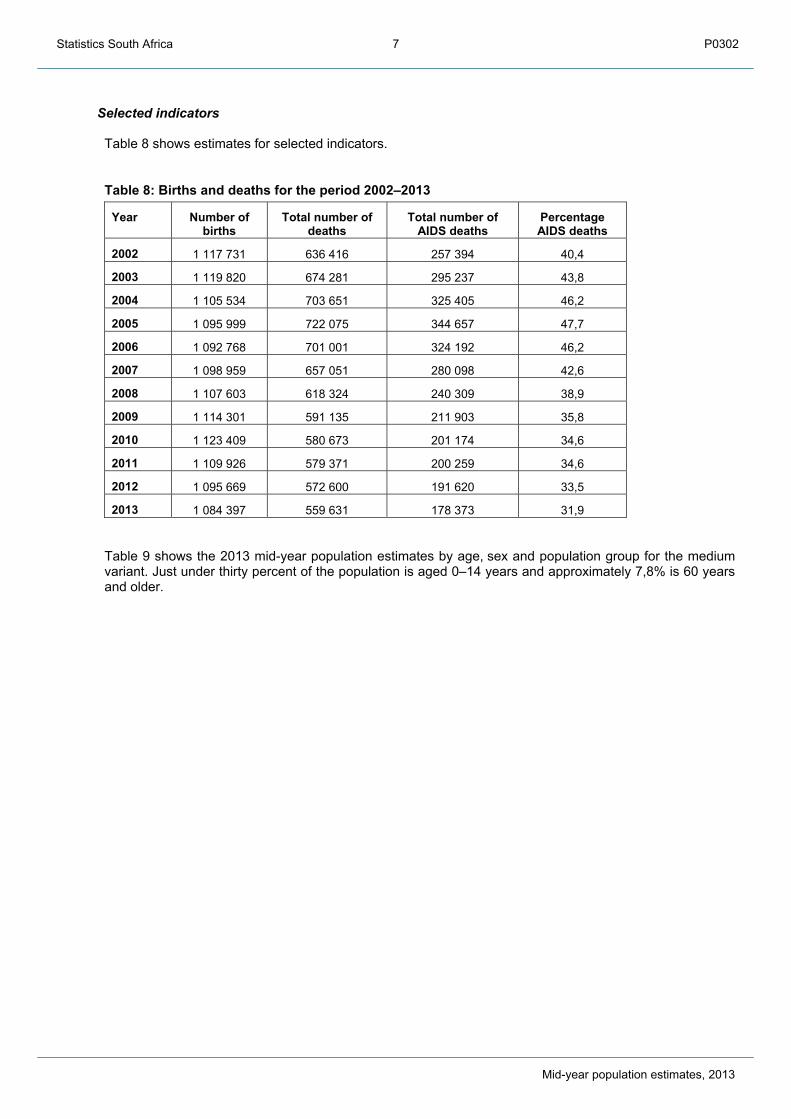
Selected indicators Table 8 shows estimates for selected indicators.
Table 8: Births and deaths for the period 2002–2013
Year Number of births
Total number of deaths
Total number of AIDS deaths
Percentage AIDS deaths
2002 1 117 731 636 416 257 394 40,4
2003 1 119 820 674 281 295 237 43,8
2004 1 105 534 703 651 325 405 46,2
2005 1 095 999 722 075 344 657 47,7
2006 1 092 768 701 001 324 192 46,2
2007 1 098 959 657 051 280 098 42,6
2008 1 107 603 618 324 240 309 38,9
2009 1 114 301 591 135 211 903 35,8
2010 1 123 409 580 673 201 174 34,6
2011 1 109 926 579 371 200 259 34,6
2012 1 095 669 572 600 191 620 33,5
2013 1 084 397 559 631 178 373 31,9 Table 9 shows the 2013 mid-year population estimates by age, sex and population group for the medium
variant. Just under thirty percent of the population is aged 0–14 years and approximately 7,8% is 60 years and older.

Sta
tistic
s S
outh
Afri
ca
P03
02
Mid
-yea
r pop
ulat
ion
estim
ates
, 201
3
8
Tabl
e 9:
Mid
-yea
r pop
ulat
ion
estim
ates
by
popu
latio
n gr
oup,
age
and
sex
, 201
3
Age
Afr
ican
C
olou
red
Indi
an/A
sian
W
hite
So
uth
Afric
a
Mal
e Fe
mal
e To
tal
Mal
e Fe
mal
e To
tal
Mal
e Fe
mal
e To
tal
Mal
e Fe
mal
e To
tal
Mal
e Fe
mal
e To
tal
0–4
2 27
0 43
5 2
237
183
4 50
7 61
8 21
1 38
0 20
8 51
9 41
9 89
9 50
746
49
486
10
0 23
2 13
4 76
2 13
0 00
1 26
4 76
3 2
667
323
2 62
5 18
9 5
292
512
5–9
2 15
4 09
4 2
141
569
4 29
5 66
3 21
6 83
8 21
4 60
7 43
1 44
5 47
568
46
708
94
276
13
7 37
0 13
2 48
1 26
9 85
1 2
555
869
2 53
5 36
5 5
091
234
10–1
4 2
120
919
2 12
2 71
5 4
243
633
224
923
222
916
447
839
46 7
80
46 2
40
93 0
21
145
839
140
664
286
502
2 53
8 46
1 2
532
534
5 07
0 99
6
15–1
9 2
151
533
2 15
1 44
4 4
302
977
225
808
223
831
449
639
51 6
46
51 2
99
102
946
159
250
153
985
313
235
2 58
8 23
7 2
580
560
5 16
8 79
7
20–2
4 2
114
083
2 07
6 46
7 4
190
550
210
390
209
350
419
741
55 6
90
54 2
31
109
921
159
492
154
828
314
320
2 53
9 65
5 2
494
877
5 03
4 53
2
25–2
9 2
010
446
1 96
5 35
6 3
975
801
187
014
190
812
377
826
61 5
66
56 5
59
118
125
147
915
145
994
293
909
2 40
6 94
0 2
358
721
4 76
5 66
1
30–3
4 1
841
283
1 78
3 50
5 3
624
787
179
408
190
479
369
887
64 2
73
56 9
10
121
184
140
909
142
766
283
675
2 22
5 87
3 2
173
660
4 39
9 53
3
35–3
9 1
576
773
1 55
8 08
4 3
134
857
182
951
198
314
381
265
58 8
64
52 3
70
111
234
141
395
144
541
285
936
1 95
9 98
3 1
953
309
3 91
3 29
2
40–4
4 1
218
401
1 33
6 15
6 2
554
557
167
949
186
635
354
584
51 3
84
47 2
26
98 6
11
157
049
159
342
316
390
1 59
4 78
3 1
729
359
3 32
4 14
2
45–4
9 87
0 06
6 1
004
682
1 87
4 74
8 13
9 56
8 15
8 08
4 29
7 65
2 45
106
43
623
88
728
17
5 52
1 17
5 87
2 35
1 39
3 1
230
261
1 38
2 26
1 2
612
522
50–5
4 73
6 69
5 89
3 37
0 1
630
065
118
083
135
796
253
879
38 6
38
39 2
91
77 9
29
172
244
175
849
348
094
1 06
5 66
0 1
244
307
2 30
9 96
7
55–5
9 56
5 42
6 69
1 98
9 1
257
416
89 1
47
106
626
195
773
32 3
37
34 7
22
67 0
59
162
200
169
446
331
645
849
110
1 00
2 78
3 1
851
893
60–6
4 39
4 96
8 51
6 42
9 91
1 39
7 61
636
79
811
14
1 44
8 25
780
29
839
55
619
14
5 22
9 15
5 79
8 30
1 02
6 62
7 61
3 78
1 87
7 1
409
490
65–6
9 25
9 22
1 49
5 50
9 75
4 73
0 41
520
53
853
95
373
17
687
20
955
38
643
10
5 48
1 13
5 07
6 24
0 55
7 42
3 90
9 70
5 39
2 1
129
301
70–7
4 16
6 07
6 34
6 39
8 51
2 47
3 25
901
36
875
62
775
11
140
14
472
25
613
75
128
10
2 27
0 17
7 39
8 27
8 24
4 50
0 01
4 77
8 25
9
75–7
9 97
918
21
3 77
2 31
1 69
0 15
150
25
279
40
429
6
232
9 25
4 15
486
45
140
70
017
11
5 15
7 16
4 44
0 31
8 32
3 48
2 76
2
80+
59 4
56
141
714
201
169
9 10
6 17
612
26
718
3
811
6 86
5 10
676
34
535
74
000
10
8 53
4 10
6 90
8 24
0 19
1 34
7 09
8
Tota
l 20
607
792
21
676
341
42
284
132
2
306
772
2 45
9 40
0 4
766
172
669
250
660
051
1 32
9 30
2 2
239
457
2 36
2 92
9 4
602
386
25 8
23 2
70
27 1
58 7
21
52 9
81 9
91

Statistics South Africa P0302
Mid-year population estimates, 2013
9
4. Provincial population estimates When provincial population estimates are desired and the appropriate data are available a multi-regional
approach should be considered as this is the only way to guarantee that the total migration flows between regions will sum to zero (United Nations, 1992). The methods developed for this purpose by Willekens and Rogers (1978) have not been widely used in developing countries, partly due to the lack of adequate migration data and the difficulty of applying these methods.
Multi-regional methods require the estimation of separate age-specific migration rates between every
region of the country and every other region and such detailed data are rarely available. Although it is possible to estimate some of the missing data (see Willekens et al., 1979) the task of preparing data can become overwhelming if there are many regions. If there are only a few streams however the multi-regional method is the best method to use. In South Africa 2448 (9x8x17x2) migration streams are derived if the multi-regional model is applied in calculating migration streams by age group (17 in total) and sex for each of the nine provinces.
The cohort-component approach suggested by the United Nations (United Nations, 1992) was used to
undertake the provincial projections for this report. The programming was done through JMP script language (JSL). JMP was developed by the SAS Institute Inc. JMP is not a part of the SAS System though portions of JMP were adapted from routines in the SAS System particularly for linear algebra and probability calculations. Version 10.01 was used to develop the projection for the 2013 provincial mid-year estimates and used the matrix algebra approach. A detailed description of the methodology that Stats SA used for the provincial projections is available at: www.statssa.gov.za
4.1 Demographic assumptions Figure 1 shows the provincial fertility estimates for the periods 2001–2006, 2006–2011 and 2011–2016.
For all the provinces it was assumed that the total fertility rates will decline.
Figure 1: Provincial average total fertility rates for the periods 2001–2006, 2006–2011 and 2011–2016
Figures 2 and 3 show the average provincial life expectancies at birth for males and females for the periods
2001–2006, 2006–2011 and 2011–2016. The assumptions for this projection were that Western Cape has the highest life expectancy at birth for both males and females; while the Free State has the lowest life expectancy at birth.

Statistics South Africa P0302
Mid-year population estimates, 2013
10
Figure 2: Provincial average life expectancy at birth, 2001–2006, 2006–2011 and 2011–2016 (males)
Figure 3: Provincial average life expectancy at birth, 2001–2006, 2006-2011 and 2011–2016 (females)

Statistics South Africa P0302
Mid-year population estimates, 2013
11
4.2 Provincial distributions Table 10 shows the estimated percentage of the total population residing in each of the provinces from
2002 to 2013. The provincial estimates show that Gauteng has the largest share of the population followed by KwaZulu-Natal and Eastern Cape. Approximately 11% of South Africa’s population lives in Western Cape. Northern Cape has the smallest population. Free State has the second smallest share of the South African population, constituting just over 5% of the population.
Table 10: Percentage distribution of the projected provincial share of the total population, 2002–2013
2002 2003 2004 2005 2006 2007 2008 2009 2010 2011 2012 2013
Eastern Cape 13,7 13,6 13,5 13,4 13,3 13,1 13,0 12,9 12,8 12,7 12,6 12,5
Free State 5,9 5,9 5,8 5,7 5,7 5,6 5,5 5,5 5,4 5,3 5,3 5,2
Gauteng 21,9 22,1 22,3 22,5 22,7 22,9 23,1 23,3 23,5 23,7 23,8 24,0
KwaZulu-Natal 20,4 20,3 20,2 20,2 20,1 20,1 20,0 20,0 19,9 19,8 19,8 19,7
Limpopo 10,6 10,6 10,6 10,5 10,5 10,5 10,5 10,5 10,5 10,4 10,4 10,4
Mpumalanga 7,8 7,8 7,8 7,8 7,8 7,8 7,8 7,8 7,8 7,8 7,8 7,8
Northern Cape 2,3 2,3 2,3 2,3 2,3 2,3 2,2 2,2 2,2 2,2 2,2 2,2
North West 6,8 6,8 6,8 6,8 6,8 6,8 6,8 6,8 6,8 6,8 6,8 6,8
Western Cape 10,6 10,7 10,7 10,8 10,9 11,0 11,0 11,1 11,2 11,2 11,3 11,4
Total 100,0 100,0 100,0 100,0 100,0 100,0 100,0 100,0 100,0 100,0 100,0 100,0
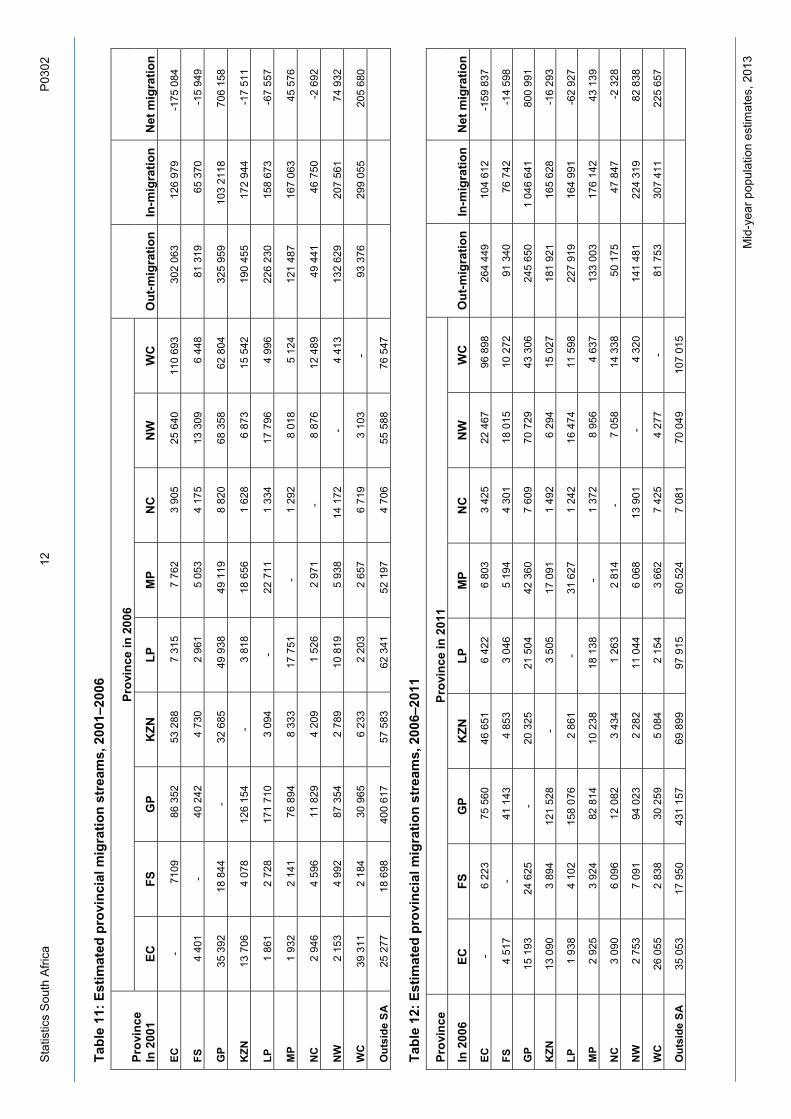
4.3 Migration patterns From Censuses 2001 and 2011 as well as the Community Survey that Stats SA undertook in 2007, it was
possible to determine out-migration rates for each province. Applying these rates to the age-structures of the province, it was possible to establish migration streams between the provinces. The result of these analyses is shown in Tables 11 and 12 below. Although the assumptions still imply that Gauteng and Western are the only provinces that receive the highest number of migrants, Mpumalanga and North West provinces also received positive net migration. The Eastern Cape, Free State and Limpopo experienced the largest outflow.
4.4 Provincial estimates by age and sex Table 13 shows the detailed provincial population estimates by age and sex. Where necessary the totals
by age were reconciled with the national totals for males and females separately. It was indicated earlier, about 29,17% of the population is younger than 15 years and approximately 7,8%
(4,15 million) is 60 years or older. Of those younger than 15 years approximately 22% (3,42 million) live in KwaZulu-Natal and 19,48% (3,01 million) live in Gauteng. The province with the smallest population namely Northern Cape has thirty percent of its population aged younger than 15 years.
Sta
tistic
s S
outh
Afri
ca
P03
02
Mid
-yea
r pop
ulat
ion
estim
ates
, 201
3
12
Tabl
e 11
: Est
imat
ed p
rovi
ncia
l mig
ratio
n st
ream
s, 2
001–
2006
Prov
ince
In
200
1
Prov
ince
in 2
006
Out
-mig
ratio
n In
-mig
ratio
n N
et m
igra
tion
EC
FS
GP
KZN
LP
M
P N
C
NW
W
C
EC
- 71
09
86 3
52
53 2
88
7 31
5 7
762
3 90
5 25
640
11
0 69
3 30
2 06
3 12
6 97
9 -1
75 0
84
FS
4 40
1 -
40 2
42
4 73
0 2
961
5 05
3 4
175
13 3
09
6 44
8 81
319
65
370
-1
5 94
9
GP
35 3
92
18 8
44
- 32
685
49
938
49
119
8
820
68 3
58
62 8
04
325
959
103
2118
70
6 15
8
KZN
13
706
4
078
126
154
- 3
818
18 6
56
1 62
8 6
873
15 5
42
190
455
172
944
-17
511
LP
1 86
1 2
728
171
710
3 09
4 -
22 7
11
1 33
4 17
796
4
996
226
230
158
673
-67
557
MP
1 93
2 2
141
76 8
94
8 33
3 17
751
-
1 29
2 8
018
5 12
4 12
1 48
7 16
7 06
3 45
576
NC
2
946
4 59
6 11
829
4
209
1 52
6 2
971
- 8
876
12 4
89
49 4
41
46 7
50
-2 6
92
NW
2
153
4 99
2 87
354
2
789
10 8
19
5 93
8 14
172
-
4 41
3 13
2 62
9 20
7 56
1 74
932
WC
39
311
2
184
30 9
65
6 23
3 2
203
2 65
7 6
719
3 10
3 -
93 3
76
299
055
205
680
Out
side
SA
25
277
18
698
40
0 61
7 57
583
62
341
52
197
4
706
55 5
88
76 5
47
Tabl
e 12
: Est
imat
ed p
rovi
ncia
l mig
ratio
n st
ream
s, 2
006–
2011
Prov
ince
Pr
ovin
ce in
201
1
Out
-mig
ratio
n In
-mig
ratio
n N
et m
igra
tion
In 2
006
EC
FS
GP
KZN
LP
M
P N
C
NW
W
C
EC
- 6
223
75 5
60
46 6
51
6 42
2 6
803
3 42
5 22
467
96
898
26
4 44
9 10
4 61
2 -1
59 8
37
FS
4 51
7 -
41 1
43
4 85
3 3
046
5 19
4 4
301
18 0
15
10 2
72
91 3
40
76 7
42
-14
598
GP
15 1
93
24 6
25
- 20
325
21
504
42
360
7
609
70 7
29
43 3
06
245
650
1 04
6 64
1 80
0 99
1
KZN
13
090
3
894
121
528
- 3
505
17 0
91
1 49
2 6
294
15 0
27
181
921
165
628
-16
293
LP
1 93
8 4
102
158
076
2 86
1 -
31 6
27
1 24
2 16
474
11
598
22
7 91
9 16
4 99
1 -6
2 92
7
MP
2 92
5 3
924
82 8
14
10 2
38
18 1
38
- 1
372
8 95
6 4
637
133
003
176
142
43 1
39
NC
3
090
6 09
6 12
082
3
434
1 26
3 2
814
- 7
058
14 3
38
50 1
75
47 8
47
-2 3
28
NW
2
753
7 09
1 94
023
2
282
11 0
44
6 06
8 13
901
-
4 32
0 14
1 48
1 22
4 31
9 82
838
WC
26
055
2
838
30 2
59
5 08
4 2
154
3 66
2 7
425
4 27
7 -
81 7
53
307
411
225
657
Out
side
SA
35
053
17
950
43
1 15
7 69
899
97
915
60
524
7
081
70 0
49
107
015

Sta
tistic
s S
outh
Afri
ca
P03
02
Mid
-yea
r pop
ulat
ion
estim
ates
, 201
3
13
Tabl
e 13
: Pro
vinc
ial p
opul
atio
n es
timat
es b
y ag
e an
d se
x, 2
013
A
ge
East
ern
Cap
e Fr
ee S
tate
G
aute
ng
Kw
aZul
u-N
atal
Li
mpo
po
Mal
e Fe
mal
e To
tal
Mal
e Fe
mal
e To
tal
Mal
e Fe
mal
e To
tal
Mal
e Fe
mal
e To
tal
Mal
e Fe
mal
e To
tal
0–4
376
854
369
019
745
873
124
728
123
296
248
025
517
229
508
108
1 02
5 33
6 59
0 57
4 58
1 33
9 1
171
913
319
891
315
893
635
784
5–9
366
118
367
252
733
370
121
130
122
352
243
482
501
437
487
409
988
846
570
951
568
091
1 13
9 04
2 28
3 51
6 28
4 27
8 56
7 79
4
10–1
4 35
0 14
5 34
4 30
6 69
4 45
1 13
5 33
2 13
4 85
5 27
0 18
7 49
5 06
2 50
1 82
5 99
6 88
7 55
4 66
3 55
3 74
5 1
108
408
291
928
291
670
583
597
15–1
9 36
5 48
0 35
9 03
2 72
4 51
2 14
1 29
7 13
9 66
1 28
0 95
8 50
7 18
4 51
3 73
3 1
020
917
553
191
557
259
1 11
0 45
0 31
4 60
2 31
4 01
9 62
8 62
2
20–2
4 34
0 58
5 34
4 13
4 68
4 72
0 13
4 48
6 13
2 51
7 26
7 00
2 57
0 21
7 54
2 93
3 1
113
150
509
769
515
598
1 02
5 36
7 28
9 92
1 29
5 22
9 58
5 15
0
25–2
9 28
6 85
6 29
8 41
0 58
5 26
6 12
6 57
3 12
4 24
3 25
0 81
5 60
5 20
1 56
4 89
2 1
170
093
455
794
470
134
925
927
253
646
262
168
515
813
30–3
4 23
3 63
6 24
2 21
2 47
5 84
7 11
4 68
4 11
3 39
4 22
8 07
8 63
2 11
7 57
8 93
4 1
211
051
398
357
415
720
814
077
212
109
225
079
437
188
35–3
9 17
6 50
0 19
4 04
8 37
0 54
8 97
016
10
0 75
0 19
7 76
5 63
8 98
7 56
9 39
7 1
208
384
327
825
354
372
682
197
155
621
186
052
341
673
40–4
4 13
5 23
2 17
4 98
6 31
0 21
8 80
553
91
338
17
1 89
1 53
8 99
7 50
0 88
4 1
039
881
247
297
303
807
551
104
112
739
155
001
267
740
45–4
9 10
7 50
5 15
1 62
8 25
9 13
3 65
089
74
485
13
9 57
4 40
0 65
6 38
0 12
8 78
0 78
5 18
6 41
0 24
7 97
0 43
4 38
0 85
162
12
4 40
4 20
9 56
7
50–5
4 99
954
15
1 86
9 25
1 82
3 57
531
66
642
12
4 17
3 33
7 40
9 33
2 80
0 67
0 21
0 16
4 59
1 22
8 58
7 39
3 17
8 72
335
11
1 22
3 18
3 55
7
55–5
9 85
658
12
9 47
9 21
5 13
7 47
359
55
632
10
2 99
1 25
9 90
5 26
1 84
7 52
1 75
2 13
5 06
8 18
3 31
7 31
8 38
4 59
536
91
893
15
1 42
9
60–6
4 65
713
10
1 41
5 16
7 12
7 35
203
44
623
79
825
18
3 55
5 19
3 53
8 37
7 09
3 10
7 34
6 15
1 78
0 25
9 12
6 46
732
74
813
12
1 54
5
65–6
9 46
739
94
565
14
1 30
3 23
678
40
210
63
888
11
8 55
4 16
7 06
7 28
5 62
0 74
336
14
0 85
3 21
5 18
9 32
286
66
452
98
738
70–7
4 37
105
80
270
11
7 37
5 15
274
27
626
42
900
70
334
10
5 16
5 17
5 49
9 48
286
98
684
14
6 97
0 22
729
51
379
74
107
75–7
9 26
974
60
096
87
070
8
604
17 3
03
25 9
07
35 3
41
53 1
39
88 4
79
29 7
24
64 0
13
93 7
36
15 9
70
41 9
62
57 9
32
80+
17 1
63
39 2
02
56 3
65
4 28
9 11
390
15
680
19
867
34
587
54
455
20
100
47
359
67
459
14
850
42
881
57
731
Tota
l 3
118
215
3 50
1 92
2 6
620
137
1 33
2 82
6 1
420
316
2 75
3 14
2 6
432
053
6 29
6 38
5 12
728
438
4
974
281
5 48
2 62
7 10
456
907
2
583
572
2 93
4 39
5 5
517
968

Sta
tistic
s S
outh
Afri
ca
P03
02
Mid
-yea
r pop
ulat
ion
estim
ates
, 201
3
14
Tabl
e 13
: Pro
vinc
ial m
id-y
ear p
opul
atio
n es
timat
es b
y ag
e an
d se
x, 2
013
(con
clud
ed)
Age
Mpu
mal
anga
N
orth
ern
Cap
e N
orth
Wes
t W
este
rn C
ape
All
prov
ince
s
Mal
e Fe
mal
e To
tal
Mal
e Fe
mal
e To
tal
Mal
e Fe
mal
e To
tal
Mal
e Fe
mal
e To
tal
Mal
e Fe
mal
e To
tal
0–4
223
591
220
991
444
582
58 7
01
57 8
60
116
561
187
419
184
922
372
341
268
336
263
761
532
097
2 66
7 32
3 2
625
189
5 29
2 51
2
5–9
209
749
207
372
417
121
55 8
88
56 4
78
112
366
179
448
179
178
358
626
267
632
262
956
530
587
2 55
5 86
9 2
535
365
5 09
1 23
4
10–1
4 21
8 26
7 21
8 17
2 43
6 43
9 58
998
58
097
11
7 09
4 17
2 94
4 17
1 99
0 34
4 93
4 26
1 12
4 25
7 87
5 51
8 99
8 2
538
461
2 53
2 53
4 5
070
996
15–1
9 22
0 50
4 21
9 71
9 44
0 22
3 58
186
56
036
11
4 22
2 17
1 56
4 16
6 73
5 33
8 29
9 25
6 22
9 25
4 36
7 51
0 59
5 2
588
237
2 58
0 56
0 5
168
797
20–2
4 21
0 10
6 20
2 05
4 41
2 16
1 53
368
50
788
10
4 15
6 17
2 92
8 16
0 76
6 33
3 69
4 25
8 27
5 25
0 85
7 50
9 13
3 2
539
655
2 49
4 87
7 5
034
532
25–2
9 19
8 38
1 18
6 17
4 38
4 55
6 50
879
47
215
98
094
16
9 17
8 15
0 54
9 31
9 72
7 26
0 43
4 25
4 93
6 51
5 36
9 2
406
940
2 35
8 72
1 4
765
661
30–3
4 17
3 42
5 16
4 94
4 33
8 36
9 46
741
42
982
89
722
15
8 60
2 13
6 41
1 29
5 01
4 25
6 20
3 25
3 98
4 51
0 18
7 2
225
873
2 17
3 66
0 4
399
533
35–3
9 13
9 92
1 14
4 33
9 28
4 26
1 40
463
38
792
79
255
13
7 63
8 12
2 69
5 26
0 33
3 24
6 01
2 24
2 86
4 48
8 87
6 1
959
983
1 95
3 30
9 3
913
292
40–4
4 10
8 54
0 12
6 21
7 23
4 75
6 35
109
36
610
71
718
11
5 23
4 10
9 13
9 22
4 37
3 22
1 08
2 23
1 37
8 45
2 46
0 1
594
783
1 72
9 35
9 3
324
142
45–4
9 84
187
99
091
18
3 27
8 28
268
30
197
58
466
95
347
86
583
18
1 93
1 17
7 63
5 18
7 77
4 36
5 41
0 1
230
261
1 38
2 26
1 2
612
522
50–5
4 71
959
83
108
15
5 06
7 25
143
27
493
52
636
87
072
77
088
16
4 15
9 14
9 66
6 16
5 49
8 31
5 16
4 1
065
660
1 24
4 30
7 2
309
967
55–5
9 57
723
65
765
12
3 48
8 21
226
23
485
44
711
67
153
62
450
12
9 60
3 11
5 48
3 12
8 91
6 24
4 39
9 84
9 11
0 1
002
783
1 85
1 89
3
60–6
4 42
200
50
604
92
804
15
931
18
809
34
740
45
396
47
366
92
761
85
539
98
930
18
4 46
8 62
7 61
3 78
1 87
7 1
409
490
65–6
9 27
178
43
124
70
302
11
066
17
858
28
924
30
851
45
168
76
019
59
221
90
096
14
9 31
7 42
3 90
9 70
5 39
2 1
129
301
70–7
4 17
657
31
605
49
262
7
452
12 6
83
20 1
35
20 2
40
33 1
00
53 3
39
39 1
68
59 5
04
98 6
72
278
244
500
014
778
259
75–7
9 10
414
22
117
32
531
4
227
7 32
7 11
554
10
402
19
033
29
435
22
783
33
333
56
116
16
4 44
0 31
8 32
3 48
2 76
2
80+
9 08
3 19
689
28
772
2
516
6 04
3 8
559
6 24
7 16
755
23
001
12
793
22
284
35
077
10
6 90
8 24
0 19
1 34
7 09
8
Tota
l 2
022
885
2 10
5 08
5 4
127
970
574
162
588
752
1 16
2 91
4 1
827
662
1 76
9 92
8 3
597
589
2 95
7 61
4 3
059
312
6 01
6 92
6 25
823
270
27
158
721
52
981
991

Statistics South Africa P0302
Mid-year population estimates, 2013
15
References Shisana, O. et al. 2009. South African National HIV Prevalence, Incidence, Behaviour and Communication Survey 2008: A Turning Tide among Teenagers? HSRC Press, Cape Town. Stover, J. & Kirmeyer, S. March 2009. Demproj Version 4. A computer program for making population projections (The Spectrum system of policy models). UNAIDS. 2013. Spectrum Version 4.57. United Nations, Geneva, Switzerland. United Nations. 1992. Preparing Migration Data for Subnational Population Projections. Department of International and Economic and Social Affairs. United Nations, New York. USAID Health Policy Initiative. March 2009. AIM: A Computer Program for Making HIV/AIDS Projections and Examining the Demographic and Social Impacts of AIDS. Willekens, F. & Rogers, A. 1978. Spatial Population Analysis: Methods and Computer Programs. International Institute for Applied System Analysis. Research Report RR 78-18. Laxenberg, Austria. Willekens, F., Por, A. & Raquillet, R. 1978. Entropy multiproportional and quadratic techniques for inferring detailed migration patterns from aggregate data. International Institute for Applied System Analysis. Working Paper WP-79-88. Laxenberg, Austria.

Statistics South Africa P0302
Mid-year population estimates, 2013
16
General information Stats SA publishes approximately 300 different statistical releases each year. It is not economically viable to produce them in more than one of South Africa's eleven official languages. Since the releases are used extensively, not only locally but also by international economic and social-scientific communities, Stats SA releases are published in English only. Stats SA has copyright on this publication. Users may apply the information as they wish, provided that they acknowledge Stats SA as the source of the basic data wherever they process, apply, utilise, publish or distribute the data; and also that they specify that the relevant application and analysis (where applicable) result from their own processing of the data. Advance release calendar An advance release calendar is disseminated on www.statssa.gov.za Stats SA products A complete set of Stats SA publications is available at the Stats SA Library and the following libraries: National Library of South Africa, Pretoria Division National Library of South Africa, Cape Town Division Natal Society Library, Pietermaritzburg Library of Parliament, Cape Town Bloemfontein Public Library Johannesburg Public Library Eastern Cape Library Services, King William’s Town Central Regional Library, Polokwane Central Reference Library, Nelspruit Central Reference Collection, Kimberley Central Reference Library, Mmabatho Stats SA also provides a subscription service. Electronic services A large range of data are available via on-line services and CD. For more details about our electronic data services, contact (012) 310 8600/8390/8351/4892/8496/8095. Forthcoming issue Issue Expected release date Mid-year population estimate
N/A
July 2014
You can visit us on the internet at: www.statssa.gov.za Enquiries Telephone number: (012) 310 8600/8390/8351/4892/8496/8095 (user information services) (012) 310 8922/2152 (technical enquiries) (012) 310 8161 (orders) (012) 310 8490 (library) Fax number: (086) 670 9723 (technical enquiries) Email address: [email protected] (technical) [email protected] (technical) [email protected] (user information services) [email protected] (orders) Postal address: Private Bag X44, Pretoria, 0001
Produced by Stats SA