institute of food and resource …orgprints.org/13198/1/13198.pdfinstitute of food and resource...
TRANSCRIPT

INSTITUTE OF FOOD AND RESOURCE ECONOMICS THE ROYAL VETERINARY AND AGRICULTURAL UNIVERSITY
Rolighedsvej 25 Phone 35 28 22 80/Fax 35 28 68 02 1958 Frederiksberg C (Copenhagen) Email adu[a]kvl.dk Denmark
CASE STUDY: GREEN ROADS TO GROWTH
Support to organic farming and bio-energy as rural development drivers
Jens Abildtrup
Alex Dubgaard
Kristoffer S. Andersen Paper prepared for the meeting: Green Roads to Growth, 1-2 March 2006. Hosted by the Danish Environmental Assessment Institute, Copenhagen

1
SUMMARY
The aim of the meeting “Green Roads to Growth” is to provide input to policy makers on policies that could meet the goals of the Lisbon Agenda in the way of stimulating economic growth, employment and the environment at the same time – also known as a win-win-win strategy. This paper presents analyses of the potentials of organic farming and bio-energy to promote win-win-win strategies in the sense of the Lisbon Agenda. The growth and employment aspects are seen in relation to rural development in particular.
Organic farming
Based on literature studies it has been investigated if there are systematic differences between the remuneration of factors of production in organic and conventional farming. It is the conclusion that there is no systematic tendency for organic practices to yield either higher or lower economic returns than conventional practices. Analyses of farm account statistics indicate that the relative Net-Factor Income of organic farms, compared to conventional farms, depends on the year, country, and enterprise – rather than the practise as such. In other words, there is no clear empirical evidence that conversion to organic farming has the potential of satisfying the first “w” in the Lisbon Strategy, i.e. stimulating economic growth in terms of increasing rural income.
The second “w” concerns employment. Organic arable farms and mixed farms generally have somewhat higher inputs of labour per ha, while organic dairy farms use the same amount of labour or less than comparable conventional farms. On organic horticulture farms labour requirements are much higher. However, a relatively small share of the farmed area is needed to grow the horticultural products demanded. Off-farm employment would tend to decrease as a result of conversion of agriculture to organic practices. Hence, there is no clear-cut tendency for employment to either increase or decrease as a result of conversion.
The third “w” is about environmental improvements. Organic farming differs from conventional agriculture with respect to the provision of public as well as private goods. The public goods are (reduced) environmental externalities and the private goods (perceived) differences in taste and health attributes of the produced commodities. Generally, the provision of private goods can be left to market forces. Externalities, on the other hand, must be dealt with through some form of public intervention.
The absence of chemical pesticides in organic farming represents an environmental advantage in terms of ground water protection and enhancement of wildlife. Nitrate leaching is lower per ha on organic farms, but similar or slightly higher per unit of production. N2O and methane emissions exhibit the same pattern. Energy use is found to be lower in organic farming systems, but the difference is small when measured as energy use per unit of output. It is the overall conclusion that there are environmental benefits associated with a conversion of conventional agriculture to organic practices, primarily due to the absence of pesticides. However, the survey indicates that these benefits could be provided at lower social costs through other agri-environmental measures.
The conclusion drawn from these findings has two components: 1) there is a need to internalise the externalities from agricultural production (especially from fertilizer and pesticide usage) through environmental taxes or similar measures; 2) provided externalities are internalised to all producers

2
the extent of conversion to organic farming should be determined by consumers’ demand/willingness to pay for organically produced food. In addition to securing the internalization of external costs the Government has an important institutional role as a guarantee of the authenticity of products marketed as organically produced.
Bio-energy When certain conditions are met bioenergy production has the potential of generating economic activities and employment in rural areas alongside with provision of environmental benefits in terms of CO2 reductions. To constitute a win-win-win strategy in the sense of the Lisbon Agenda it is essential that energy crops are grown on land which would otherwise be idle. If energy crops crowd out traditional crops it is unlikely that this will have positive net effects on employment. Therefore, win-win-win opportunities in relation to energy crops will have to be found in areas with an “abundance” of abandoned agricultural land – and unemployed labour, i.e. typically in less favoured areas. Rising oil prices have created considerable optimism regarding the commercial opportunities for bioenergy production, in particular ethanol and biodiesel. A considerable number of studies have investigated the energy efficiency and economic viability of these alternatives. Unfortunately, the results do not provide a unique answer to these questions. However, it seems reasonable to conclude that the production of bio-energy on agricultural land is not generally a commercially competitive land use. Inclusion of external costs and benefits improves the competitiveness of bio-energy from a societal perspective. Still, the competitiveness of bio-energy is sensitive to the value of the avoided green house gas emissions.
When biomass is converted to liquid biofuel the oil price plays a crucial role for the competitiveness of the bioenergy alternative. Another factor crating uncertainty about the long run viability of biofuel are crop prices and land rent. If biofuel becomes a commercially competitive alternative to conventional crop production at the global level an equilibrium will have to be found between land based energy production and food production. This will inevitably lead to higher crop/grain prices and higher land rents, which in turn will reduce the competitiveness of energy crops everything else equal. Trade regimes have a significant influence on price formation. Biofuels – especially ethanol – can be produced a much lower cost in Brazil than in the EU. At present trade barriers protect EU producers from global competition in biofuels. Accordingly, trade liberalization could drastically change the economic prospects for biofuel production in the EU. Generally speaking conversion of biomass into liquid biofuels is an expensive way of reducing CO2 emissions – at least when relatively expensive raw materials such as starch and vegetable oil are used as feedstock. A potentially viable alternative is lingo-cellulose in low value biomass like straw and waste wood. The processing cost component may be significantly reduced in the (near) future due to expected technological breakthroughs in terms of the so called second generation biofuels.
The overall policy recommendation is to implement an adequate price structure for all types of energy. This implies that the externalities from fossil fuel combustion – primarily CO2 emissions –should be taxed at a level compatible with the long run marginal costs of realizing the specified reduction commitments in the EU/Member States. When fuel is taxed for fiscal purposes biofuels should be exempted from the CO2 tax element. The right price structure will create adequate incentives for innovators and producers to develop and implement new technologies. However,

3
there are still a number of unanswered questions regarding the economy wide and global interactions between bioenergy production and other economic and social factors. There is a need for thorough investigations of the interrelationships between the economic factors mentioned above. Such analyses should be based on an analytical framework in the form of computable general equilibrium models.

4
0. Introduction The objective of this study is to analyse the potentials of Green Roads to Growth policies, enhancing organic farming and bio-energy production. The focus will be on incentives to convert agricultural production from conventional to organic practices and incentives to increase the production of energy crops and biogas. For these two policy areas the study will assess the impact of support measures on economic growth, employment and the environment. The approach will primarily be a meta-analysis based on the literature in these fields and the results of data analyses already published. A special feature of the study is the spatial-economic perspective. Organic farming and bio-energy production are closely tied to agricultural land, implying that policies promoting these activities can also be regarded as rural development measures. Rural development policy Rural development policies focus on a wide range of measures aiming at enhancing economic growth, avoiding depopulation of rural areas, and increasing the supply of rural amenities1. In Europe, the EU plays a key role in the definition of rural development policies. The Agenda 2000 reforms of the Common Agricultural Policy introduce the concept of rural development policy as the second pillar of the CAP. The new rural policy is mainly implemented through The Rural Development Regulation (1257/1999). It lists a number of rural development measures which can be implemented by the Member States and which will be co-financed by the EU. The regulation also prescribes that Member States must prepare rural development programmes at the national or regional level. As already mentioned, support to organic farming and bio-energy production has obvious rural development perspectives. In most EU-countries, subsidy schemes for organic farming are integrated in the rural development programmes (European Commission, 2005), and production of bio-energy can be seen as an option for economic diversification in rural areas (Sims, 2004). Objectives of the study It is the hypothesis that support to organic farming and bio-energy has the potential of simultaneously enhancing economic growth, employment and environmental qualities. To what extend these assumptions hold is an empirical question. The present survey of bio-energy policies will focus on the production of energy crops. Concerning organic farming, the focus will be on the conversion of agricultural production from conventional to organic practices. The impacts of relevant support schemes will be investigated with the aim to:
1. Identify win-win-win policies in terms of
2. The impact on regional economic growth, rural employment and the environment Approach 1 In Denmark rural areas are statistically defined as the parts of the country that are not urban, where urban is defined as communities of 200 persons and more. Rural areas are also defined as rural municipalities, i.e. municipalities in which the biggest town has less than 3,000 inhabitants.

5
The primary focus of the study will be on policies implemented in Denmark, however, results of similar policies in other (EU) countries will also be addressed. The analysis will be based on a review of existing studies reported in the literature. In addition, the study will draw on the comprehensive accountancy data base for agriculture, available at the Food and Resource Economics Institute. There are only a few published studies on the impact of organic faming on income and employment. This is one of the reasons why this paper, to some extent, is based on an analysis of primary data from The Danish Farm Account Statistics. Outline In the second chapter, organic farming is analysed, and the third chapter addresses bio-energy. The chapter on organic farming first introduces organic farming and discusses the analytical framework from a theoretical perspective. Then, analyses of the impact of organic farming on income, employment and environment, reported in the literature, are reviewed, and an empirical analysis of Danish data on organic farms is performed. The third chapter first discusses biomass production in relation to agriculture and rural development. Next, the analyses of farm production of biomass for energy, reported in the literature, are reviewed. Each of the two chapters concludes with a summary of the main findings.

6
1. ORGANIC FARMING What is understood by organic farming has changed over time, and in the early 1980s the definitions of organic farming varied between countries (Wynen 1998). However, in the beginning of the 1990s, the organic production was defined by the European Community and standards for organic production were set. Organic farming can be considered as a particular agricultural production system in which synthetic fertilizers and pesticides are not used. Organic farming can also be considered as an alternative paradigm for production of food which seeks to integrate humane, environmentally, and economically sustainable agricultural production systems (Dabbert et al. 2004). In this paper organic farming refers to the production systems which comply with national definitions and regulations of organic agriculture in Europe. In the year 2002 certified and policy-supported organic production accounted for four per cent (over 5 million ha) of the total agricultural land in Europe (Häring et al. 2004). As the recorded area of organic farming was only 100,000 ha in 1985 this represents a remarkable increase in area. The countries with the highest relative organic area were in 2001; Austria, Switzerland Sweden, Finland, and Denmark. In Denmark the growth in the organically farmed area seems to have stopped, and Jacobsen et al. (2005) expect a decrease in the organic farmed area. The conversion to organic farming has been driven by a combination of high market prices on products and generous subsidies. By 1996, all member states, with the exception of Luxenbourg, had introduced policies to support organic farming within the agri-environmental programmes co-financed by the EU (Lampkin et al. 1999). In 1997 the support for conversion to and continuation of organic production amounted to nearly 260 million ECU. In the year 2001, a total of 275 million € was spent on organic farming within the agri-environmental measures of the Council regulations (EC) 2078/92 and 1257/99 covering more than 18,000 holdings, farming nearly 3 million hectares (Häring et al. 2004). The subsidies for organic farming vary between countries, e.g. France and Great Britain only support in the conversion period, whereas other countries have continued supporting organic production (Offerman and Nieberg 2002).
1.2. The analytical framework Arguments often brought forward in favour of organic farming are its contribution to conversion of farm incomes and increase in labour employed in agriculture (Häring et al. 2004). Organic products receive higher prices, and the organic production methods influence the labour intensity, e.g. mechanical or manual weeding and a higher share of labour-intensive crops, such as vegetables, may imply a higher labour input, compared to conventional faming. However, the impact of organic farming on income and employment is ambiguous because the production is normally lower per hectare at organic farms than at conventional farms due to extensification of the production, e.g. the livestock density is often lower at organic farms (Häring et al. 2003).

7
Since agricultural land is an essential input factor in the production of (organic) crops, and the supply elasticity for agricultural land is close to zero, any given use of agricultural land is competing with other uses for a share of the fixed total area. Thus, to increase value added and employment in land-based production as a whole, we must look for alternatives which “yield” more value added and employment per hectare than the displaced activities. Comparing the performance of organic and conventional farms with respect to value added and employment, it is required that the organic farms are compared to conventional farms which look like the organic farms if they have not been converted (Nieberg and Offermann 2003). The main approach used in the literature is to compare organic farms with a selection of comparable conventional farms. These farms should have a similar production potential, i.e. a similar endowment with production factors as the analysed organic farms. Only “non-system determined” variables, e.g. location factors such as region, soil texture, topography, climate and market distance, can be used for this matching. Other variables like farm size, farm type, and crop rotation may possibly be affected by the choice of production. However, these variables are also often chosen as variables for selecting comparable farms (e.g. Dubgaard 1990, Dubgaard 1994, Offermann and Nieberg 2000). Differences in crop rotation between organic and conventional farms illustrate the problem. For example, the share of land for production of vegetables is often higher on organic farms compared to conventional farms (see e.g. Dubgaard 1994) and the income and labour use per hectare is higher for vegetables. Therefore, differences in income and labour use between the organic and the conventional farms may be a result of the differences in the crop mix. Ideally, an assessment of the impact on income and employment of subsidizing organic farming should be performed in a general equilibrium framework where the feedbacks on relative prices and the interactions with the conventional sector are included. For example, an increased production of organic products may have a negative effect on the prices of organic products and a positive effect on prices of conventional products. Furthermore, changes in the organically farmed area may also influence upstream as well as downstream activities generated by the agricultural production. The present analysis is primarily based on studies applying a partial approach, i.e. without including feedback mechanisms, because only a few studies are based on a general equilibrium approach. The analysis also includes an analysis of primary and recent data, based on the Danish farm account statistics. When evaluating organic farming as instrument for rural development, organic farming should be compared with the best available alternative options (Dabbert 2003). It may not be the case that the present policy and production system represent the best alternatives. For example, taxes on pesticides may be a less costly instrument to increase the supply of environmental benefits, e.g. biodiversity, compared to subsidizing organic farming. However, in this study organic farming is compared with corresponding conventional production systems. This implies that we are not analysing whether organic agriculture is the best use of production factors in general but only compared to similar conventional systems.

8
1.2. Literature review
The literature review is divided into two parts. The first part reviews studies that are based on a partial approach. The second section reviews three studies of organic agriculture in Denmark applying a general equilibrium model.
1.2.1. Partial analyses Income Offermann and Nieburg (2000) compare the income from organic farming with the income from conventional farming based on an empirical study of farm account statistics in a number of European countries in the 1990s. They also analyse the underlying factors determining the relative income, i.e. relative yields and prices of the organic products and the cost structure on organic farms. They find that prices of organic products are higher and yields are lover. The average price premium for organic products varies between products and marketing channels. They find that the relative farm gate price premium for organic products in different European countries varies between a few per cent to 200 hundred per cent, lowest for milk and higher for crops. In their empirical study they also find that the relative difference between organic and conventional yields depends on the intensity of the production systems compared, the farm types, and the crop types considered. Furthermore, natural conditions, e.g. soil types and climate, have also an impact on the relative yield. The performance in livestock production is less influenced by the choice of farming system when measured per livestock unit, since the main difference between the two production systems is that the livestock density is lover on organic farms compared to conventional farms. In the empirical analysis they find that fixed costs per hectare are generally higher on organic farms relative to comparable conventional farms, whereas the variable costs are lower on organic farms. The cost structure is different due to restricted use of external inputs, e.g. fertilizers, pesticides, and concentrates which reduce costs, whereas the cost of buying organic seeds and feedstuffs may increase the costs per hectare or per output unit. Often labour input is high at organic farms, as analysed in the next section, due to the substitution of labour input and pesticides in weed control, and more on-farm processing and marketing at organic farms. They also find that the total costs per ha at organic farms relative to comparable conventional farms vary between European countries and between crop and dairy farms. Offermann and Nieburg (op. cit.) analyse the income from organic farms in eight European countries. Income is measured as the relative profit of organic farms compared with profit on conventional farms. They define profit as family farm income, i.e. the sum of market revenues from sales of agricultural products, subsidies, other farm income (rents, contract work for others, etc.), net value of change in stock, and the value of farmhouse consumption minus variable costs, overheads, wages, salaries paid to seasonal and non-family workers, interest paid on borrowed

9
capital, and rent paid. In their study they find that organic farms in Europe on average achieve similar levels of income as comparable conventional farms. However, variance within the samples is high. Arable farms have, in general, achieved above average incomes over the years investigated. Organic dairy farms generally have a higher return to family labour but a lower return per ha agricultural land than comparable conventional farms. The family farm income is, however, not an appropriate measure for comparing the income between conventional and organic farms. First, it does not include the income generated for the paid labour and secondly, the profit includes subsidies which do not represent a production value but an income transfer.2 Offerman and Nieburg (op. cit.) find that about 20 % of the profit at organic farms is generated by subsidy payments to organic farming. The results of an analysis of 36 Danish organic farms in 1998 (Dubgaard et al. 1990 and Dubgaard 1994) indicate that factors of production received about the same remuneration in conventional and organic agriculture – after a conversion period of some length. The remuneration of labour was somewhat better in the organic sample than in a group of comparable conventional farms. Labour remuneration was measured per hour and was calculated as total returns to labour divided by the recorded labour input. The return to labour was calculated as the residual of total net factor income after remuneration of capital. Conventional farms were found to have a higher return to capital than organic farms given the imputed value of the farm-family labour. This analysis is based on rather few farms and from an early stage in the development of organic farming in Denmark. Therefore, conclusions can not be drawn about future organic performance based this analysis. In section 2.3 more recent (1999-2004) farm accounts from organic and conventional farms are analysed and compared, based on the Danish farm account database (Institute of Food and Resource Economics, FOI, 2005). Employment Generally, it is expected that organic farms are more labour intensive due to more labour-intensive production activities, e.g. mechanical weed control in arable production, higher shares of more labour-incentive crops, more marketing activities and on-farm processing activities, and increased information requirements (Schulze Pals 1994 quoted from Offermann and Nieberg 2000). Häring et al. (2003) also find that there are more non-agricultural commercial activities on organic farms than on conventional farms, e.g. tourism. However, lower yields and stocking rates, i.e. less livestock units per hectare agricultural land may imply a lower labour intensity than at conventional farming. Since organic farming is a relatively new production system we may expect organic farming to have a higher potential for technical processes. It is only in recent years that the allocation of resources for research and development in organic farming systems has increased. Therefore, it should be possible to reduce the labour input relatively more in organic systems than in conventional systems. Offermann and Nieberg (2000) find empirical evidence of the decreasing difference in the labour input between organic and conventional farms. Based on a case studies in nine European countries Offermann and Nieberg (op. cit.) conclude that the labour use per ha Utilisable Agricultural Area on average is 10 %-20 % higher on organic farms relative to comparable conventional farms. However, for some countries, labour requirements are 2 Alternatively subsidies to organic farming can be seen as remuneration for the provision of public goods in terms of less pollution.

10
lower on organic farms than on comparable conventional farms (see Table 1). The results are based on data from various years in the different countries. Table 1. Annual Work Unit per ha Utilisable Agricultural Land on organic farms as a percentage of comparable conventional farms in different countries (Offermann and Nieberg 2000). Austria Switzer-
land Germany Denmark Finland France Luxembourg Italy The
Nederlands Years 1993 1993-96 1993-97 1996/97 1995 1997 1997 1992-
95 1995
% 91 110-132 102-118 105 89 (125)1 (125)1 60-90 (214)2
197
1 Expert estimate 2 Single study (Cerasola and Marino 1995), year of data unknown. The results are dependent on the farm type. Organic arable farms or mixed farms generally have higher inputs of labour per ha while organic dairy farms use the same amount of labour or less than comparable conventional farms. On horticulture farms, labour requirements are much higher than on conventional farms. In their study they also found that organic farm types are, in general, more labour intensive than average conventional farms, i.e. the relative labour input on conventional farms, which are comparable to organic farms, is 10 -20 % higher than the average labour input on conventional farms. Based on 1.3 % of the agricultural land converted to organic farming in 1996 Europe, Offermann and Nieberg (op. cit.) estimate, that 18.000 more people were employed in agriculture than there would have been in a situation without organic farming. This corresponds to 0.3 % of the total agricultural labour force. They note that it is not possible to extrapolate from these results to estimate the labour use in a situation with a higher share of organic farming. Since to some extent the increased labour demand is due to on-farm processing and marketing activities, it is unlikely that labour intensity will be unchanged by increased conversion to organic farming. In some areas there will be no demand for regional products and the benefit of on-farm processing, and marketing may also decrease when more farms in a region follow this trend. On-farm processing and marketing may also reduce employment in agro-industrial processing and marketing enterprises. Furthermore, organic farming will also result in less employment in the industries supplying pesticides and fertilizers. However, for the rural communities it may be an advantage that labour use is moved to the farms from industries, which are typically located in urban areas.
1.2.2. General equilibrium analysis Frandsen and Jacobsen (1999) and Jacobsen (2001, 2003) analyse the Danish organic farming sector applying the Danish Research Institute of Food Economics’ Agricultural Applied General Equilibrium model (AAGE). The advantage of using the AAGE approach is that this modelling framework covers the interdependencies between the individual industries, interaction between industries and consumers, and between domestic and foreign agents. The model thus covers the

11
whole Danish economy, and is characterised by the requirement that there should be equilibrium in all markets. The model therefore calculates long-run results of a given policy scenario (Jacobsen 2003). Another advantage of the model is that it includes the upstream and downstream impacts of organic farming. Applying the AAGE model, Frandsen and Jacobsen (1999) show that the cost to society of a complete transformation of Danish agriculture into organic production would be around 2-3 % of real GDP, whereas the costs of a complete or partial ban on pesticides would amount to 0.82 % and 0.35 % of real GDP, respectively. Jacobsen (2003) analyses five scenarios for the development of organic farming in Denmark. Besides a baseline, which includes ongoing policy development and known shocks to the economy, four alternative scenarios are analysed. One alternative scenario assumes that domestic and foreign consumers change their preferences in favour of organic products (preference scenario). Two scenarios introduce subsidies to agricultural land in the organic sector to induce a conversion of land into organic production in order to achieve a positive environmental effect. The first subsidy scenario is designed to achieve the same level of land converted to organic production as in the preference scenario, and the second subsidy scenario is designed to obtain the same environmental effects as in the preference scenario. The environmental impacts are measured as the level of input of environmentally harmful inputs (fertilizers and pesticides). The fourth alternative scenario introduces a tax on fertilizer and pesticide use to achieve the same effect on the use of environmentally harmful input as in the preference scenario. The analysis shows that the relative organic area and production volume increase in the preference scenario (8.7 % and 10.7 %, respectively). In the subsidy scenarios, the cost of land (net-costs after area-based subsidy) decreases for organic farmers, implying substitution of land for other inputs. This corresponds to an extensification of the production, i.e. the area with organic farming is equal to or higher than in the preference scenario, but the increase in organic production is much smaller. In the fertilizer and pesticide tax scenarios, the increase in organic farming is less than in the preference scenario. This is because the environmental effects are primarily achieved by substitution on conventional farms - rather than conversion of land into organic farming. A larger share of organic land use is required in the subsidy scenario compared to the preference scenario to achieve the same level of environmental benefits as in the preference scenario. This is due to substitution of land by fertilizers and pesticides at conventional farms because the land prices increase for conventional farms when organic land use is subsidized. In the preference scenario, where organic land use is not subsidized, the production intensity is higher on organic farms and the demand for land is less. In the preference scenario, the employment in conventional farming decreases by 3,211 full time workers, while employment in the organic sector increases by 3,100 full time workers, i.e. a net decrease of 111. In the subsidy scenarios the net decrease is 600 full time workers. The tax scenario has a small positive effect on employment, due to substitution of fertilizers and pesticides by labour. The negative effect on employment in the subsidy scenario is mainly explained by the transfer of land from conventional production to organic production, but since demand for organic products does not follow the inflow of land, this results in an extensification effect in organic production. In the fertilizer and pesticide tax scenario, the production is lower but the taxed inputs are to some degree substituted by other inputs, especially labour in conventional farming.

12
The preference scenario and the subsidy scenarios also have a negative impact on the employment in the processing sector. In the preference scenario the employment increases with 819 full time workers in the organic processing industry but decreases with 1281 in the conventional sector. In the subsidy scenarios total employment in the processing sectors decrease with 469 and 679 full time workers. A comparison of changes in GNP between the subsidy and the tax scenarios shows that the GNP decreases most in the subsidy scenario. Achieving the same reduction in nitrogen and pesticide use by using subsidies is more than seven times as expensive than the use of fertilizer and pesticide taxes. It is important to note that the above analysis was conducted at the national level. The environmental effects (the reduction in pesticide and fertilizer inputs) are positive in all scenarios but total production also decreases – and, consequently, agricultural exports decrease. This may imply intensification of agricultural production in other countries and negative environmental effects. In DØRS (2004) three scenarios for protection of groundwater and biodiversity by regulating Danish agricultural production are analysed. In the first scenario, pesticides are taxed higher than today; in the second scenario pesticide use is banned in buffer zones around fields and drillings for drinking water, and in the third scenario, conversion to organic farming is increased by increasing the subsidy to organic farming. The scenarios are designed to incur the same costs by the three different policy interventions. The objective is then to identify the policy which yields the highest level of environmental benefit. The scenarios are modelled in an integrated model framework involving two economic models, the general equilibrium model, AAGE, and ESMARALDA3 which is an agricultural sector model, and ALMaSS4 which is a landscape model for simulation of fauna in the landscape. In the present study, ALMASS was used to model the population of skylarks, which was used as indicator of biodiversity. The results indicate that establishment of buffer zones have the most positive effect on biodiversity. Organic farming also has a positive effect, but less than buffer zones. Increased pesticide taxes had a small negative effect on biodiversity. One of the reasons for this negative effect is changes in the land use which is less favourable for skylarks, the biodiversity indicator species. In all three scenarios, the risk of contamination of groundwater with pesticides was reduced. The lowest risk reduction was in the organic scenario. It is concluded that increased conversion to organic production is not a cost-effective instrument for improving biodiversity and protection of groundwater.
1.2.3. Environment Stolze et al. (2000) assess the impact of environmental and resource use of organic farming relative to conventional farming systems. The assessment is based on a literature review and a survey of specialists in eighteen European countries using a structured questionnaire. It is concluded that 3 ESMERALDA (Econometric Sector Model for Evaluating Ressource Application and Land use in Danish Agriculture). See Jensen (1996) and Jensen et al. (2001) for documentation. 4 ALMaSS (Animal, Landscape and Man Simulation System). See also Topping et al. (2003).

13
organic farming clearly performs better than conventional farming with respect to floral and faunal diversity, and due to the ban of synthetic pesticides and N-fertilizers, organic farming systems provide potentials that result in positive effects on wildlife conservation and landscape. Due to mostly higher contents of organic matter and higher biological activity in organically farmed soils than in conventionally managed soils, organic farms tend to conserve soil fertility and system stability better than conventional farming systems. However, the results are highly site-specific. The above survey showed that nitrate leaching is lower per ha on organic farms but similar or slightly higher per unit of production compared to conventional farms. The ban of synthetic pesticides in organic farming implies that there is no risk of contaminating the ground and surface water with pesticides. On a hectare scale they find that nitrate leaching is lower per ha on organic farms but similar or slightly higher per unit of production compared to conventional farms. For N2O and methane the limited amount of available data indicates that emissions from organic farming systems are lowest compared to conventional systems based on a hectare scale but higher on a per-unit output scale. Energy use in organic farming systems is found to be lower than in conventional systems. Similar results are found in Jørgensen and Dalgaard (2004) where it is concluded that the energy use per unit of organic output of meat and milk is lower than for conventional products, but the difference is small. The same holds for crop production but the energy use per unit of outputs depends on the crop type and the production practice. Stolze et al. (2000) find new clear differences between organic and conventional farming with respect to animal health and welfare. Finally, based on the reviewed studies they cannot make clear-cut conclusions about the quality of organic food in general. However, it can be assumed that the risk of contaminating food with pesticides and nitrate is lower for organically produced food. Wrang et al. (2004) review the differences between organic and conventional production with focus on Danish agriculture and the five specific areas: economy, environment, health, animal welfare and taste. They find that organic farming has positive effects on biodiversity, soil quality, water environment, and genetic variation. However, organic farming also has negative effects on the environment, including harmful effects of mechanical weeding and increased area requirements for the production of the same amount of food. The empirical evidences of the effect of organic farming on health are not clear, but theoretical considerations indicate that organic food could be healthier. In the case of animal welfare it is not documented that there are general differences in level of animal health or mortality between organic and conventional production systems. However, primarily organic farming satisfies consumers’ considerations about animals being well-treated and that production methods follow ethical practices.

14
Based on studies of the sensory properties of organic products it is not possible to conclude that organic products have significantly different sensory characteristics compared to conventional produced food. Finally, it is concluded that there is a cost-difference between organic and conventional production of 430 million DKK. The additional costs are due to the fact that organic agriculture experiences lower yields and higher production costs. Furthermore, there may be additional costs associated with the processing and distribution of organic products. Valuation of the environmental benefits is not attempted because there are different environmental effects, many of which are difficult to value.
1.2. Danish case study Since no recent studies on the relative performance of organic farms are reported in the literature, an analysis of the generation of income and labour use in organic farming is carried out based on the Danish account statistic for agriculture (FOI 2005). The objective of the analysis is to empirically estimate the income generation and labour input by organic farming compared to conventional farming systems. Income is measured as net factor income per hectare, and labour input as hours per hectare. Labour input includes both unpaid family labour and paid labour.
1.3.1. Data The empirical analysis is based on the Danish database of farm accounts. This data is collected and analysed by The Institute of Food and Resource Economics. The Danish data input to the European Farm Accountancy Data Network (FADN) is based on the same data. The database includes a representative sample, including around 1,900 farm accounts (Pedersen (2005). The full population of farms included 49,000 farms in 1999 which decreased to 39.000 farms in 2004. The reduction in the number of farms is a consequence of the development in farm structure, i.e. increasing farm sizes. The farms are in the statistic defined as holdings, i.e. a farm may include more farm estates owned by the same farmer. The minimum size of the farms included in the population and the sample are farms of 10 hectares. However, if a farm with less than 10 ha has an aggregate Standard Gross Margin which exceeds 8 European Size Unit, i.e. a standard gross margin of 71.496 DKK, the farm is included in the population.
1.3.2. Method The analysis is performed for dairy cow farms and arable farms separately. The main reason for this distinction is that there are significant differences in the geographical location and size of these two groups of organic farms. The number of organic dairy cow farms is high in the southern and western part of Jutland, whereas the organic arable farms are more evenly distributed throughout the country (Jacobsen et al. 2005). One determinant of the geographical distribution of dairy cow farms may be the differences in soil quality. With regard to sandy soils, dairy cow farms have a comparative advantage to other farm types. Furthermore, Offermann and Nieburg (2000) suggest that organic farms are expected to be found on poor soils where costs of extensification are lower than on fertile soils. However, whether

15
this holds generally is not empirically documented. Anyway, the highest concentration of organic dairy cow farms is found in the western and southern part of Jutland where sandy soils are dominating. Organic dairy cow farms are in average larger than other organic farms, e.g. in 2003 dairy farms constitute 26 % of the number of organic farms but they cultivated 46 % of the organic area. The share of part time farmers, with annual working hours less than 1.665 standard working hours, are higher among arable organic farms than organic arable farmers. For example, in 2003 no dairy cows were found on farms managed by part time farmers even though these cultivate 28 % of the organically farmed area (Jacobsen et al. 2005). Ignoring these systematic differences in the production structure between organic and conventional farms in the analysis may lead to biased conclusions. Since most of the organic farms are either located on relatively poor soils in Jutland or are small-sized and owned by part time farmers, a comparison between an average organic farm and the national average of conventional farms may disfavour organic farm with respect to income. Since it will be a comparison of income between organic farms primarily located on poor soils with conventional farms primarily located on more fertile soils. Furthermore, the comparison may be biased by a higher number of part time farmers among the organic arable farmers. It is important to emphasise that the results of the present analysis only apply to the production structure of organic farming which is observed today. It is not possible to extrapolate the result to a situation with a more widespread adaptation to organic farming. With a larger share of organically cultivated land, the organic production structure may change, i.e. we may see more organic production on more fertile soils and more full time farmers will become arable farmers. Furthermore, the distribution between milk, pork, crop and vegetable production may change too. In the empirical analysis we have used two approaches to estimate the contribution of organic farming to rural income and employment. Firstly, we have compared organic dairy farms and arable farms with conventional farms with a similar production structure. Secondly, we have statistically estimated a model describing income from organic and conventional farming as a function of some underlying structural variables, like farm size, livestock, and soil types. In the comparison of the organic diary farms with conventional dairy farms, the group of comparable conventional farms is based on the group of farms selected in Sotelo (2005). The conventional farms are randomly selected from the sample of farm account statistic and given the restrictions that the sample of conventional farms should correspond to the organic sample with respect to the age of the farmer and the size and composition of the production. These variables are selected because based on experience these variables have an impact on the economic results Sotelo (op. cit.). For example, the conventional farmers are generally older than the organic farmers and the labour productivity is higher for young farmers. The production structure of the sample of organic dairy and arable farms is shown in Tables 2 and 3, respectively. The tables also include the production structure of the conventional farms selected for comparison with the organic farms. For most production structure indicators, the organic and conventional groups are rather similar. However, the area of the organic farms is around 10 % larger for the dairy cow farms (Table 2).

16
Table 2. Farm and production structure on organic farms and group of comparable conventional farms.
Table 3. Farm and production structure on organic arable farms and group of comparable conventional farms.
The Net-Factor Income is defined as the total revenue from agricultural production, excluding subsidies, and minus costs, except taxes, labour costs, and capital costs. Employment is measured as working hours, including working hours of the farmer, the farmer’s family, and paid labour. In the comparison of arable farms the same approach has been followed as in the comparison of the dairy farms. In the selection of conventional arable farms for comparison, relatively more small farms have been selected to match the generally smaller organic arable farms. The statistical analysis is based on a linear model of the form:
Units 1999 2000 2001 2002 2003 2004Sample size Farms Conventional 162 126 225 205 253 244 Farms Organic 81 122 150 138 134 115
ha Conventional 81 85 82 88 94 95Agricultural area ha Organic 98 109 104 106 112 112
Conventional 80 88 82 86 94 95Dairy cows Organic 80 88 83 87 94 91years Conventional 43 43 43 46 45 44Farmer's age years Organic 43 43 44 45 45 44
Conventional 3010 3264 3184 3191 3080 3032Labour, Farmer and family hours Organic 2887 2940 3024 2989 2927 2882
hours Conventional 1223 1152 1043 1076 1302 1200Labour, Paid hours Organic 1475 1504 1333 1354 1541 1458hours Conventional 4233 4416 4227 4267 4382 4231Labour, Total hours Organic 4362 4445 4356 4343 4468 4340
Units 1999 2000 2001 2002 2003 2004Sample size Conventional 84 90 143 149 225 200 Organic 57 61 88 113 126 139
ha Conventional 30 27 33 36 37 41Agricultural area ha Organic 39,0 31,8 38,4 39,6 43,2 44,3
Live. Conventional 6 12 11 8 7 4Livestock units Organic 6 6 7 7 5 6 years Conventional 46 46,3 47 48 47 48Farmer's age years Organic 45 46 47,0 47,0 46,9 48,0
hours Conventional 1094 1050 1174 1035 1032 1012Labour, Farmer and family hours Organic 1483 1065 1154 1102 1006 997
hours Conventional 511 356 243 175 215 206Labour, Paid hours Organic 1000 553 349 224 1312 1334 hours Conventional 1605 1406 1417 1210 1247 1218Labour, Total hours Organic 2483 1618 1503 1326 1312 1334

17
ddistributey identicallt independen and normal assumed is which error tems theis
structure, production farm ngrepresenti st variableindependen of vector a is andestimated, be toparameters of vectorsare ,
4}2000,..200 {1999,k and
organic}, nal,{conventioi farms, .,...,1,
kij
kij
kiki
kijkijkikikij
X
NjXY
ε
βα
εβα
=
==++=
Two models are estimated for both the arable and the dairy farms. One model is estimated with Net-Factor Income as dependent variable, Yij, and one with labour input measured in hours as dependent variables are estimated. The definition of arable and dairy farms is based on the definition in Jacobsen et al. (2004), where the farm types are defined based on the crop rotation. Dairy (cattle) farms are defined as farms where more than 16 % of the agricultural area is used for roughage production. Arable farms are defined as the farms which are not dairy farms, however, excluding farms with high shares of horticultural crops. In the model for Net-Factor Income, dummy variables are included to account for annual variation in prices and yields, e.g. due to variation in climate. In the model for labour input a time trend is included. Variables describing the production structure in the model represent conditions that cannot easily be changed in the short-run, e.g. the number of hectare, soil type, land used for horticultural crops and permanent grass, and the livestock size. Horticultural crops and permanent grass are the only crops explicitly included in the model, because other crops may change from year to year due to changes in relative prices. The production of horticultural crops typically implies a higher share of fixed costs, e.g. specific machinery and know-how, whereas permanent grass is normally located on less fertile soils that are not suitable for rotational crops. Quadratic terms for area and livestock units to account for decreasing marginal productivity of area and livestock are included.
1.3.3. Results
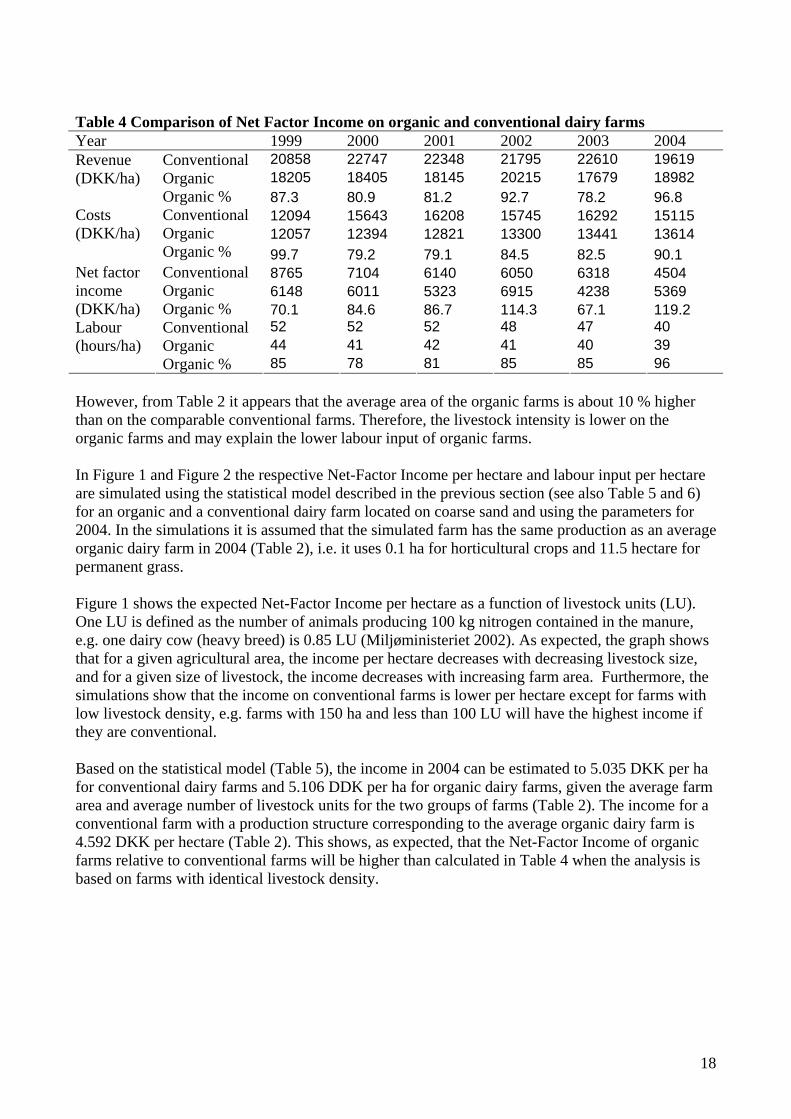
1.3.3.1. Dairy farms Table 4 shows the Net-Factor Income for organic farms and a group of comparable conventional dairy farms for the period 1999-2006 based on data from FOI (2005). The selection of the comparable conventional dairy farms is based on the criteria described in the previous section. The revenue from organic dairy farming is around 19,000 DKK per ha which is less than for the comparable conventional farms (81-97 %). However, there are rather high variations over the years. The costs per hectare are also lower at organic farms compared to the comparable conventional farms (79-100 %). This implies that it is not possible to conclude whether the Net-Factor Income is higher or lower per hectare for organic dairy farms. In 2002 and 2004 the factor income was higher on organic farms than on the comparable conventional dairy farms, whereas the factor income was significantly lower in the other years analysed. The labour use on the organic dairy farms is estimated to 39-44 working hours per hectare on organic farms. This is 1-11 hours lower than on the comparable conventional farms, i.e. the labour input on organic farms is about 78-96 % of the labour input of comparable conventional farms.
18
Table 4 Comparison of Net Factor Income on organic and conventional dairy farms Year 1999 2000 2001 2002 2003 2004
Conventional 20858 22747 22348 21795 22610 19619 Organic 18205 18405 18145 20215 17679 18982
Revenue (DKK/ha)
Organic % 87.3 80.9 81.2 92.7 78.2 96.8 Conventional 12094 15643 16208 15745 16292 15115 Organic 12057 12394 12821 13300 13441 13614
Costs (DKK/ha)
Organic % 99.7 79.2 79.1 84.5 82.5 90.1 Conventional 8765 7104 6140 6050 6318 4504 Organic 6148 6011 5323 6915 4238 5369
Net factor income (DKK/ha) Organic % 70.1 84.6 86.7 114.3 67.1 119.2
Conventional 52 52 52 48 47 40 Organic 44 41 42 41 40 39
Labour (hours/ha)
Organic % 85 78 81 85 85 96 However, from Table 2 it appears that the average area of the organic farms is about 10 % higher than on the comparable conventional farms. Therefore, the livestock intensity is lower on the organic farms and may explain the lower labour input of organic farms. In Figure 1 and Figure 2 the respective Net-Factor Income per hectare and labour input per hectare are simulated using the statistical model described in the previous section (see also Table 5 and 6) for an organic and a conventional dairy farm located on coarse sand and using the parameters for 2004. In the simulations it is assumed that the simulated farm has the same production as an average organic dairy farm in 2004 (Table 2), i.e. it uses 0.1 ha for horticultural crops and 11.5 hectare for permanent grass. Figure 1 shows the expected Net-Factor Income per hectare as a function of livestock units (LU). One LU is defined as the number of animals producing 100 kg nitrogen contained in the manure, e.g. one dairy cow (heavy breed) is 0.85 LU (Miljøministeriet 2002). As expected, the graph shows that for a given agricultural area, the income per hectare decreases with decreasing livestock size, and for a given size of livestock, the income decreases with increasing farm area. Furthermore, the simulations show that the income on conventional farms is lower per hectare except for farms with low livestock density, e.g. farms with 150 ha and less than 100 LU will have the highest income if they are conventional. Based on the statistical model (Table 5), the income in 2004 can be estimated to 5.035 DKK per ha for conventional dairy farms and 5.106 DDK per ha for organic dairy farms, given the average farm area and average number of livestock units for the two groups of farms (Table 2). The income for a conventional farm with a production structure corresponding to the average organic dairy farm is 4.592 DKK per hectare (Table 2). This shows, as expected, that the Net-Factor Income of organic farms relative to conventional farms will be higher than calculated in Table 4 when the analysis is based on farms with identical livestock density.

19
Table 5. Model parameters for Net-Factor Income at dairy farms 2004 located on coarse sand Variable Parameter value
Conventional farm t value1)
Parameter value Organic farm
t value1)
Intercept -191458 -8.02** -191458 -8.02** Year, (2004=1) 2) 0 0 Organic farm (conventional farm= 1) 12110 0,59 - Permanent grass (ha) -4628 -17** -4628 -17** Horticulture crops (ha) 16220 4.78** 16220 4.78** Area 2004 (hectare coarse sand) 1853 6.10** 1441 5.10** Livestock units (LU) 4041 21.5** 4668 12.1**
(Livestock units)2 (LU2) -2.36 -18.9** -1.07 -0.91 1) ** Significant at the 1 % level. 2) The dummy variable for the year was normalised on the year 2004, i.e. the effect of the year is measured as differences between 2004 and the other years in the sample.
1000
3362
5724
8086
10448
70 90 110 130 150 170 190Livestock (LU)
Net
Fac
tor I
ncom
e (D
KK
/hec
tare
)
Conv 112 haOrgan. 112 haConv 75 haOrgan. 75 haConv 150 haOrgan. 150 ha
Figure 1. Simulated Net Factor Income per hectare as a function of the numbers of livestock units (LU) for conventional (Conv) and organic (Organ) dairy farms with 75, 112, and 150 ha. See text for further explanation. Source: FOI (2005) and own calculations. In Table 6, the estimated parameters of the statistical model of labour input on dairy farms are reported. Again, the parameters are shown for a farm located on coarse sand. In this model the parameters are independent of the year. Changes in labour input over the years are modelled with a time trend. According to the estimated model, the labour input of an average farm decreased by 73 hours per year. Labour input to the farm by contracting is not included in the analysis, but it is assumed that organic and conventional farms use contracting to the same extent. This assumption seems reasonable, since the costs of contracting are at the same level for both farms types (FOI 2005).

20
Using the estimated statistical model (Table 6), we can show that the labour input on organic dairy farms relative to conventional farms in Table 4 is lower than when the organic farms have the same livestock density as the group of comparable conventional farms. In Figure 2 the labour input is modelled as a function of farm area for given size of the livestock. The figure shows that the labour input is decreasing with the increasing areas and decreasing livestock size. The figure also shows that the labour input on organic and conventional farms is at the same level for given area and livestock sizes. On farms with high livestock density, the labour input per ha seems to be higher on organic farms compared to conventional farms. Table 6. Model parameters for labour input on dairy farms 2004 located on coarse sand. Variable Parameter value
Conventional farm t value1)
Parameter value Organic farm
t value1)
Intercept 146915 8.40** 146915 8.40** Year -73.3 -8.39** -73.3 -8.39** Organic farm (conventional farm= 1) 276 2.63** - Permanent grass (ha) -9.4 -10.5** -9.4 -10.5** Horticulture crops (ha) 247 22.8** 247 22.8** Area 2004 (ha coarse sand) 18.2 20.6** 16.1 10.5** (Area 2004)2 (ha2 coarse sand) -0.0113 -4.94** -0.0079 4.67** Livestock units 2004 (LU) 11.7 21.8** 16.9 8.8**
(Livestock units)2 (LU2) -0.0031 -7.22** -0.0187 -3.99 Livestock density (LU/ha) 363 10.8** 456 4.54 1) ** Significant at the 1 % level.
20
30
40
50
60
70
80
90
50 70 90 110 130 150 170Farm area (hectare)
Labo
ur in
put (
hour
s/he
ctar
e)
Conv 143 LUOrgan. 143 LUConv 100 LUOrgan. 100 LUConv 180 LUOrgan. 180 LU
Figure 2. Simulated labour input per hectare as a function of the size of farm area (ha) for conventional (Conv) and organic (Organ) dairy farms with 100, 143, and 180 ha. See text for further explanation. Source: FOI (2005) and own calculations.

21
1.3.3.2. Arable farms In Table 7 the Net-Factor Income and labour input per ha on organic and conventional arable farms are compared for the years 199-2004. The revenue per ha is lower on the organic farms except for 1999. However, the costs are also lower on the organic farms. The Net-Factor Income is highly variably over the years. In 1999 and 2002, the Net-Factor Income is highest on organic farms, whereas conventional farms have the highest income in the other years analysed. There is no clear conclusion in the case of labour input. In 1999 and 2004 the labour input per ha is highest on organic farms. One explanation for the blurred conclusion might be the small size of the farms considered. Most farms are owned by part time farmers who may manage the farms according to various objectives where profit maximization may play a minor role. These results were confirmed by estimating the statistical model based on the arable farms. It was not possible to estimate a reasonable model for the organic farms, e.g. the estimated parameters were inconsistent with the theory. Therefore, the results of the statistical analysis are not presented. We can, therefore, not draw definite conclusions from the analysis of the arable farms. Table 7 Comparison of Net Factor Income and labour input on organic and conventional arable farms Year 1999 2000 2001 2002 2003 2004
Conventional 11883 14097 11679 8073 9353 8418 Organic 13282 10204 7828 7437 7333 6630
Revenue (DKK/ha)
Organic % 112 72 67 92 78 79 Conventional 9797 11262 9949 8679 8534 8054 Organic 10159 9258 7372 7672 6910 7120
Costs (DKK/ha)
Organic % 104 82 74 88 81 88 Conventional 2087 2835 1730 -606 819 364 Organic 3123 947 456 -235 424 -490
Net factor income (DKK/ha) Organic % 150 33 26 39 52 -134
Conventional 54 53 43 34 34 30 Organic 64 51 39 33 30 30
Labour (hours/ha)
Organic % 119 97 92 98 90 101
1.3.4. Discussion The above analysis of farm account statistics is partial, i.e. it does not take into account the interactions between the farming organic sector, the conventional farming and other sectors in the economy as was the case in section 2.2.2 (general equilibrium analysis). For example, the production structure at the conventional farms may have been different without an organic farming sector. This implies that the results of the above empirical analysis can only be used as indications of the consequences of future policy changes. Especially, it gives an indication of the contribution of organic farming to the rural economy given the present farm structure. During the period of analysis there has been an over-supply of organically produced milk. Therefore, it must be expected that the milk price will decrease in the future if there are no other changes in the markets, e.g. changes in the consumer preferences for organic milk. The expected decrease in the price premium of organic milk implies that the Net-factor Income per ha is also expected to decrease for organic dairy farms.

22
Comparing the organic dairy farms with conventional dairy farms showed that the labour input per ha was lowest on organic farms. Also, the milk production per hectare is lower on organic dairy farms. If we assume that the milk quota is binding for the amount of milk produced, then increased organic production will reduce the conventional production with an equal amount. By this conversion more land is occupied by roughage for producing the same amount of milk. Therefore, organically produced milk will imply less production of cash crops. The net effect on employment of an increase in the production of organic milk will therefore be differences in the labour input per kg milk between organic and conventional dairy farms, and the effect of substituting cash crops with organic roughage production. In 2004 the labour use per 1000 kg milk was 0.75 hours higher on organic farms compared to conventional farms, and the organic dairy farm used 0.03 ha more land for producing 1000 kg milk (Table 8). An average farm with plant production uses 21.7 hours per ha. This implies that the total employment effect of converting the production of 1.000 kg of conventionally produced milk into organic production is 0,75 hour - 21.7 hours * 0.03=0.1 hours (1.8 % higher than in the conventional production). The analysis shows that conversion from conventional to organic milk production does not have a dramatic impact on labour use even when the lower milk yield per cow is taken into account. Table 8. Impact on employment of converting 1000 kg of conventionally produced milk to organically produced milk. Organic dairy farm Conventional dairy farm difference Plant production Area Ha 112 105 146,5 Cows 91 91 Milk per cow 1000 kg/cow 7.390 8.244 Labour farm Hour 4,340 4,279 3182
Labour/milk Hour/1000
kg 6.45 5.70 0.75 area/milk Ha/1000 kg 0.17 0.14 0.03 Labour/area Hours /ha 38.8 40.7 21.7 Source: FOI (2005a, 2005b)
1.2. Conclusion concerning organic farming
• There is no clear empirical evidence that organic farming is increasing rural income. In the partial analyses above the farming system with the highest Net-Factor Income per hectare depends on the year, country, and farm type considered.
• Analyses of labour input based on Danish and European farm account statistics do not provide clear-cut conclusions regarding the impact of organic farming on employment in rural areas. Analyses applying a general equilibrium model indicate that employment in agriculture and in the processing industry in Denmark will decrease as a result of conversion to organic farming.
• Organic farming has environmental benefits but these benefits could be provided at lower social cost than.
• Consequently, conversion to organic farming should be market driven – provided external costs are internalized to all producers. Government policies should focus on ensuring consumer confidence in eco-labelling and information initiatives.

23
2. BIOENERGY Bioenergy is defined as renewable energy produced form biomass. The biomass may be used for solid combustion or processed into liquid or gaseous biomass fuel. The present analysis will focus on biomass from agriculture, i.e. traditional crops, crop residues, energy-dedicated crops and animal waste. In the following we will present an overview of recent analyses investigating the environmental and economic aspect of the different types of bioenergy including the prospects for advances in processing technologies. During the last few years increasing oil prices have triggered considerable interest in bio-based transportation fuels, primarily ethanol and different types of biodiesel. We will start with an outline of the role of biofuels energy supply in the EU and the USA.
2.1 Overview of the role of biofuels
Share of biomass and biofuels in total energy consumption
EU The EU currently meets 4 per cent of its energy needs from biomass (EU-COM, 2005a). About 97 per cent of the energy came from wood (directly from forests or from wood industry residues); organic wastes, agricultural and food processing residues; and manure. Only 3 per cent of the bioenergy supply was from energy crops (op. cit.). The market share of biofuels in the EU25 area was 0.8 per cent in 2004 – an increase from 0.2 per cent in 2000. Automotive biofuel in the EU is primarily in the form of biodiesel. About 90 per cent of biofuel consumption is covered by domestic raw materials, 10 per cent by imports (op. cit.).
EU-25 Gross energy consumption in 2002 (Source: EU-COM, 2005b).
About 1.8 million hectares were used in the production of feedstock for biofuels in 2005. This equals 1.9 per cent of EU25’s total arable area of 97 million hectares (EU-COM, 2005a). It is an EU target that 5.75 per cent of total transport fuel consumption should be derived from biofuels by 2010 – and fully met by feedstock from home grown crops (EU-Directive, 2003). The European

24
Environment Agency estimates that 4 to 13 per cent of the agricultural area in EU25 will be required to meet this goal (depending on the choice of crops and technological developments).
USA According to US-EIA (2006b) biomass5 accounted for close to 3 per cent of total U.S. energy consumption in 2004. Of this 70% came from wood, black liquor, and other wood waste; 20 per cent from municipal solid waste, landfill gas, sludge waste, tires, agricultural by-products, and other biomass; while the last 10 per cent mainly comes from ethanol blended into motor gasoline. Even though relatively small, biofuels consumption has grown rapidly in recent years. From 1994 to 2004 the share of biofuels increased from 0.6 percent to 1.2 per cent of the transportation fuels market in the U.S. (Manella, 2006). Production of biofuels has increased by 150 per cent in the same period. The primary feedstock in the production of biofuel (ethanol) is corn.
Role of Renewable Energy in the U.S., 2004 (Source: US-EIA, 2005)
Trends in biofuel consumption As noted above there has been a marked increase in the production of bio-based automotive fuels, i.e. ethanol and biodiesel products. Bioethanol is the world’s main biofuel. In 2004 world production of bioethanol for fuel use was around 30 billion litres. This represents around 2 per cent of global petrol use. Production is set to increase by around 11 per cent in 2005 (EU-COM, 2006). As can be seen from the figure below Brazil and North America (US and Canada) are the world’s leading producers of ethanol in the world. Brazilian production has not increased significantly since the mid-1980s. In contrast, ethanol production in the US and Canada has seen a sharp increase during the last few years – to reach a level close to Brazil’s in 2003. 5 Biomass includes: black liquor, wood/wood waste solids, municipal solid waste, landfill gas, agriculture by-products/crops, sludge waste, tires, alcohol fuels and other biomass solids, liquids and gases.

25
Source: US-IEA (2004) With production of close to 0.5 million tonnes the European Union is estimated to have produced 10 per cent of the world’s bioethanol in 2004. More than 1 million tonnes are expected by the end of 2005 and capacity is likely to treble by the end of 2007 (EU-COM, 2006a). As can be seen in the figure below biodiesel was produced almost solely in the EU until recently. The amount of biodiesel produced is still small compared to the world’s bioethanol production. However, in 2004 the EU’s production of biodiesel increased by more than 25 per cent to 1.9 million tonnes. For mid-2006 an increase in total EU25 biodiesel production capacity to 3.8 – 4.1 million tonnes is expected (op. cit.).

26
Source: US-IEA (2004) Break even prices (oil) for commercially competitive biofuels Ethanol production in Brazil (based primarily on sugar cane) is economically viable without government support at oil prices above $35 per barrel (Ugarte, 2005). With the currently available technologies EU-produced bioethanol becomes competitive at oil prices of around €90 per barrel, corresponding to US$108, whereas EU-produced biodiesel breaks even at oil prices around €60 per barrel, corresponding to US$72 (EU-COM, 2006a). Thus, Brazilian ethanol production is considerably more competitive than EU production of ethanol and biodiesel alike. In other words, trade barriers are required to secure the domestic competitiveness of the EU production of biofuels.
Marginal abatement cost (carbon price) for major types of bioenergy Most available studies indicate that the abatement costs of EU-produced biofuels are quite high relative to the current “carbon price”. The marginal abatement cost (carbon price) in the EU emissions trading scheme is about €20 per tonne of CO2 avoided, while new biofuel technologies (second generation biofuels) are expected to have marginal abatement costs of between €40 and €100 per tonne of CO2 avoided (EU-COM, 2006b). This means that EU-produced biofuels are not currently the most cost-effective way to reduce greenhouse gas emissions. Estimates of carbon prices in Fulton et al. (2004) show a similar picture, as can be seen in the figure below. Ethanol from grain is clearly the most expensive carbon reduction alternative. Biodiesel from rapeseed is estimated to yield CO2 reductions at about half the cost of ethanol, but still at a price far in excess of the €20 per tonne of CO2 avoided emissions trading scheme.

27
Source: Fulton et al. (2004). From here we will proceed with some more detailed literature surveys focussing to a greater extent on income generation and employment associated with biomass and bioenergy production.
2.2. Analytical framework
The impact on income, employment, and the environment of growing energy crops should be compared with the impacts of the activities that energy crops displace. In several studies it is assumed that the alternative to growing energy crops is fallow land. Under the CAP, farmers have been allowed to grow non-food crops on set-aside areas. Set-aside was required to obtain hectare payment and is required to obtain the single payment after the 2003 reform of the CAP. Given the CAP it is relevant to compare energy crops with fallow land.
The net carbon emission level depends on the way the biomass is produced. Emissions of SO2 from bio-energy are low because of the inherently low sulphur content of biomass. If energy crops substitute fallow land, growing energy crops could have a negative environmental impact, e.g. increased nitrogen leaching and reduced biodiversity. If energy crops replace food crops, it is more complex to evaluate the environmental consequences. Often the production of energy crops implies less use of fertilizers and pesticides than for food crop, but, on the other hand, replacing food crops will only intensify the production of food crops in other places, resulting in negative environmental consequences.

28
Sim (2004) and Domac et al (2005) propose that renewable energy systems are more labour intensive than fossil fuel systems, and to operate bio-energy plants and provide the fuel, employment opportunities are often created particularly in rural areas.
Bioenergy project employment differs from wind, hydro, and solar projects where the work activities mainly consist manufacturing of capital goods, installation, and maintenance. Producing the biomass fuel supply and delivering it to the conversion plant is an essential additional activity component of bio-energy. Therefore, the investment-related jobs tend to be of a smaller proportion relative to the on-going operation and maintenance jobs, when compared to other renewables.
Ideally, the effect of growing energy crops should be evaluated in a general equilibrium framework where the impacts of growing energy crops on other economic sectors are modelled explicitly and where the impacts on income, employment, and the environment is assessed specifically for the rural areas. Furthermore, the welfare economic costs for society of energy crop should be estimated and compared to the costs of policies which have comparable impacts on rural areas.
No studies found in the literature apply such a framework. However, Schneider and McCarl (2003) analyse the impacts of energy crops using a general equilibrium model but without estimating the employment and rural income effect explicitly. In this study, the shadow value of reducing CO2 emissions by growing crop is derived and can be compared to alternative measures. If the shadow value of reducing CO2 by alternative measures is lower than growing energy crops the higher shadow value by energy crops represent a cost. This cost should be compared to the side effects, e.g. environmental or employment impacts, of alternative measures.
2.3 Literature reviews
A comprehensive study of the welfare consequences of growing energy crops is found in Schneider and McCarl (2003). They explore the economic potential of biofuels in a greenhouse gas mitigation market, i.e. the production and use of the energy crops switchgrass, hybrid poplar, and willow in the US. The analysis is performed applying the U.S. Agricultural Sector Model and potential emission mitigation strategies, or markets are simulated via hypothetical carbon prices. Biofuels are not considered independently but rather in comparison with a total suite of agricultural mitigation options, e.g. tillage alteration, tree planting, fertilization alteration, livestock dietary alteration, and manure management.
Their results indicate that there is no role for biofuels below carbon reduction prices of $40 per tonne of carbon equivalent. Whether biofuels are a relevant mitigation strategy depends on the marginal costs of reducing emissions in other sectors than agriculture. There is no agreement to what this level is, and it is depending on the existence of international markets for emission trading. In Denmark, the prices of CO2 quotas (allowances within the European Union Emission Trading Scheme) have mostly been traded to prices between 150-180 DKK per tonne CO2 ($23-27 per tonne CO2, given the exchange rate: 6.59 DKK/$)6. This implies that at a marginal value of emission of around $25 per tonne CO2 biofuel is not a cost-effective alternative. However, emission reductions via reduced soil tillage and afforestation are more cost efficient than biofuels. 6 Quota prices is from www.dong.dk/portal/page?_pageid=74,38337&_dad=portal&_schema=PORTAL Exchange rates from www.nationalbanken.dk/DNDK/statistik.nsf/side/FT_Valutakurser!OpenDocument

29
The model computes welfare effects on producers, consumers, and foreign trading partners in the agricultural sector context. As mitigation incentives increase, total welfare decreases monotonically. This decrease can be identified as dead weight loss and provides a measure of the minimum benefits the society must gain from reduced levels of green house gas emissions plus any co-benefits attained through cleaner water or reduced erosion to meet the Kaldor-Hicks potential compensation test. In addition, the transaction costs of policy implementation would need to be considered. They find that higher operational costs to farmers are more than offset by higher revenues due to increased prices (prices inclusive CO2 reduction subsidies). Therefore, farmers achieve a higher level of welfare by increasing the demand for green house gas emission reductions through the subsidizing of the CO2 reduction. This indicates that a market for CO2 will increase rural income.
Therefore, introducing a market for the reduction of green house gases will increase farmers’ income, i.e. the income of rural population. However, the study also shows that the benefit of reducing emissions should be rather high before bio-energy crops will be a competitive mitigation strategy.
The agricultural sector’s green house gas emission mitigation measures also have impacts on the emission of other pollutants. The impact of mitigation measures on nitrogen and phosphorous pollution and erosion have been simulated and indicate that the cheapest mitigation measures, i.e. reduced soil tillage, reduces the negative impact of agriculture on the environment, whereas a higher level of mitigation which involves growing energy crops does not further reduce the negative impacts. This is because growing energy crops increases the competition for agricultural land. As a result the intensity of agricultural production increases.
The study does not consider that bio-energy may also yield other ancillary benefits in terms of air quality - due to reduced coal burning. Inclusion of these benefits would have increased the competitiveness of energy crops.
Steininger and Voraberger (2003) analyse the medium term biomass energy potentials in Austria, applying a general equilibrium model for the Austrian economy. The model does not assume full employment, i.e. the labour market does not clear. This allows the model to estimate employment effects of policy changes. They evaluate the macro-economic effects of economic incentives for increased use of 12 biomass products in different heating and power-generation systems and for biofuels.
In a scenario with a CO2 tax, the results indicate which biomass technologies become competitive at which CO2 tax levels. The technologies that are competitive at a tax level of 15 € per tonne CO2 are wood chips, bark, biogas, and recycled7 edible oil methyl ester. In the tax scenario, the employment increases by 3100 persons but the GDP decreases slightly. A tax of 15 € per tonne CO2 is, however, relative low compared to current emission reduction costs. Therefore, other biomass technologies may be competitive with higher taxes.
In a scenario where taxes and subsidies are combined, the positive employment effect increases without further loss of GDP. The reduction in CO2 emissions increases from around 5,000 to more than 10,000 million tonne by combining the tax with a subsidy corresponding to one third of the tax revenue. In this scenario the increase in biomass use is almost 70.000 million PJ. 7 Biofuels from vegetable oils after initial cooking use.

30
However, this study does not estimate the impact on the rural economy, i.e. the agricultural sector of adopting biomass energy technologies. Faaij et al. (1998) analyse the externalities of biomass-based electricity production compared with power generation from coal in a Dutch context. The effects on economic activity and employment are investigated using input-output multipliers. Compared to the analysis above, feedbacks, i.e. changes in relative prices, of using biomass based electricity production, is not included in the model. Therefore, the analysis only applies to marginal changes in energy production.
Valuations of damage from emissions to air are based on generic data from other studies. The external costs of nitrate leaching and the use of agrochemicals are estimated.
The impact of bio-energy production is compared with fallow land. Short rotation coppice willow is selected as the energy crop.
They conclude from the analysis that the average private costs for biomass and coal-based power generation are projected to be 68 and 38 mECU per kWh, respectively, in the year 2005. If the external costs and benefits are included the cost range for bio-electricity amounts to 53-70 mECU per kWh and 45-72 mECU per kWh for coal. The external costs includes impact on GDP, employment benefits, emissions damage for SO2, NO2, dust, CO, and CO2, potential damage from agrochemical use and nitrogen leaching.
However, the external costs are not estimated using standard appraisal methods. For example, the impacts on GDP and employment of the two alternatives are included in the assessment of the external costs. Increased employment is included as an external benefit and is measured as saved unemployment payments8. If only external environmental costs are included the range of costs of bio-electricity amounts to 71-77 mECU per kWh and 40-64 mECU per kWh for coal (see Table 9). In the case of coal the CO2 damage is estimated as being in the range 0.4 – 21 mECU per kWh (based on CO2 damage cost of 1- 25 ECU per tonne CO2), i.e. the value of reducing the CO2 emissions is important for the results. However, even with a value of 25 ECU per tonne CO2 emission reduction it is still cheaper to use coal as energy source.
Table 9. External costs of energy production used in Faaij et al. (1998) External cost factor Biomass Coal mECU/kWh mECU/kWh SO2, NO2, dust, CO emissions 2.3 - 6.4 1.7 – 4.8 CO2 emissions 0.0 – 0.6 0.4 - 21 Potential damage from agrochemical use 0.8 n.a. Potential damage from nitrogen leaching 0.8 n.a. Total external environmental effects 3.9 - 8.6 2.1 – 25.8 Private costs of energy production 68 38 Total costs of energy production 71.9 – 76.6 40.1 – 63.8
They find that employment is significantly higher in bio-energy systems compared to coal systems, i.e. 0.44-0.53 man year per GWh for biomass and 0.17-0.20 man year per GWh. The authors 8 In social project appraisals unemployment payments represent transfer payments which are normally not included in the assessment of the social value of a project or policy.
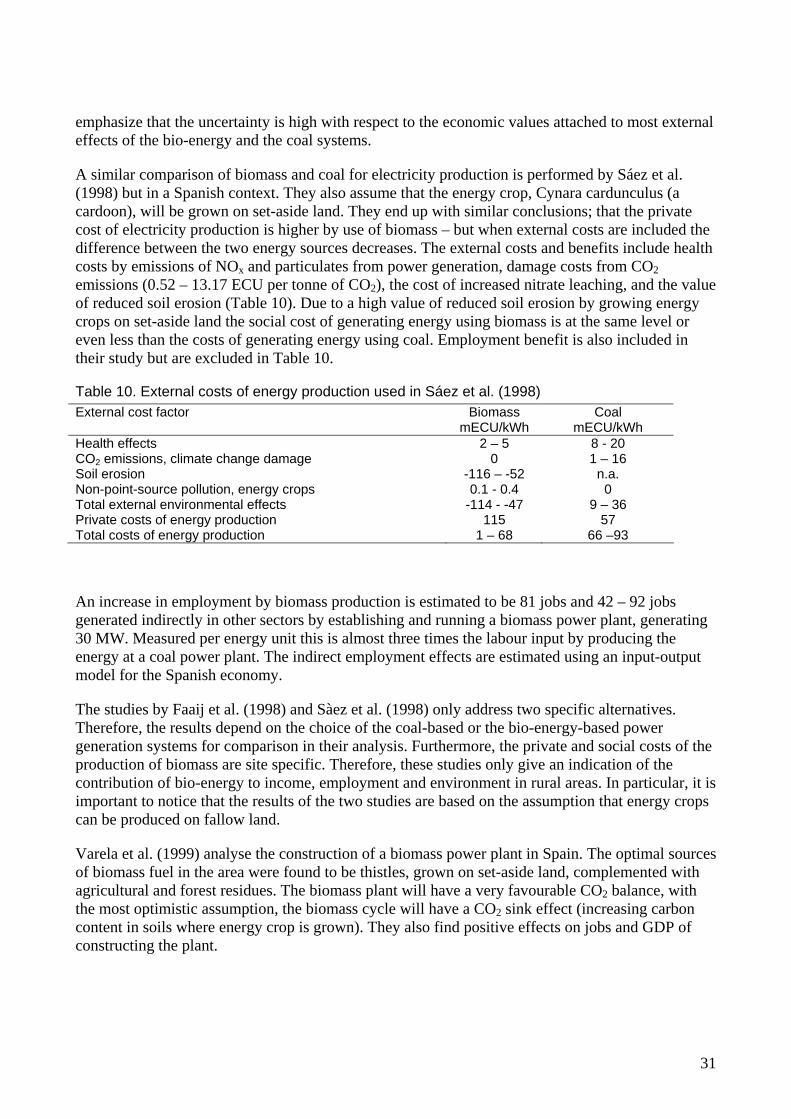
31
emphasize that the uncertainty is high with respect to the economic values attached to most external effects of the bio-energy and the coal systems.
A similar comparison of biomass and coal for electricity production is performed by Sáez et al. (1998) but in a Spanish context. They also assume that the energy crop, Cynara cardunculus (a cardoon), will be grown on set-aside land. They end up with similar conclusions; that the private cost of electricity production is higher by use of biomass – but when external costs are included the difference between the two energy sources decreases. The external costs and benefits include health costs by emissions of NOx and particulates from power generation, damage costs from CO2 emissions (0.52 – 13.17 ECU per tonne of CO2), the cost of increased nitrate leaching, and the value of reduced soil erosion (Table 10). Due to a high value of reduced soil erosion by growing energy crops on set-aside land the social cost of generating energy using biomass is at the same level or even less than the costs of generating energy using coal. Employment benefit is also included in their study but are excluded in Table 10.
Table 10. External costs of energy production used in Sáez et al. (1998) External cost factor Biomass Coal mECU/kWh mECU/kWh Health effects 2 – 5 8 - 20 CO2 emissions, climate change damage 0 1 – 16 Soil erosion -116 – -52 n.a. Non-point-source pollution, energy crops 0.1 - 0.4 0 Total external environmental effects -114 - -47 9 – 36 Private costs of energy production 115 57 Total costs of energy production 1 – 68 66 –93
An increase in employment by biomass production is estimated to be 81 jobs and 42 – 92 jobs generated indirectly in other sectors by establishing and running a biomass power plant, generating 30 MW. Measured per energy unit this is almost three times the labour input by producing the energy at a coal power plant. The indirect employment effects are estimated using an input-output model for the Spanish economy.
The studies by Faaij et al. (1998) and Sàez et al. (1998) only address two specific alternatives. Therefore, the results depend on the choice of the coal-based or the bio-energy-based power generation systems for comparison in their analysis. Furthermore, the private and social costs of the production of biomass are site specific. Therefore, these studies only give an indication of the contribution of bio-energy to income, employment and environment in rural areas. In particular, it is important to notice that the results of the two studies are based on the assumption that energy crops can be produced on fallow land.
Varela et al. (1999) analyse the construction of a biomass power plant in Spain. The optimal sources of biomass fuel in the area were found to be thistles, grown on set-aside land, complemented with agricultural and forest residues. The biomass plant will have a very favourable CO2 balance, with the most optimistic assumption, the biomass cycle will have a CO2 sink effect (increasing carbon content in soils where energy crop is grown). They also find positive effects on jobs and GDP of constructing the plant.

32
In Gylling et al. (2001) the private costs of producing energy crops have been estimated in a Danish context. They find that the production costs are higher than the paying capacity for energy crops of bio-energy power generating plants, even though alternative use of the land used for energy crops has not been considered. However, in this study there has been no attempt to estimate the external costs and benefit of growing energy crops and substituting fossils fuels with bio-energy.
In Gylling (2001) the negative impacts on the aquatic environment of growing energy crops in Denmark is assessed to be lower than for traditional agricultural crops. Therefore, it is suggested that energy crops are suitable for environmentally sensitive areas. Gylling (2001) estimates that the production costs for willow coppice delivered at the power plant during the harvest season is between 30-33 DKK per GJ (clay soil) and 36-39 DKK per GJ (sandy soil), while big baled energy grain (all year delivery) has a cost between 38-39 DKK/GJ (clay soil) and 43-45 DKK per GJ (sandy soil). The cost of straw is about 28 DKK per GJ. In the same study the paying capacity of a medium size bio fuelled power plant producing heat and power is estimated to be around 20-24 DKK per GJ for energy crops, given an electricity price of 0.30-0.35 DKK per kWh and a heat price of 45-48 DKK per GJ. Co-firing with coal will increase the ability to pay to 30-34 DKK per GJ. The price which power plants can obtain selling bio-energy-based electricity is higher than the cost of producing electricity from the cheapest fossil-based alternative energy source. This is due to policy regulation of the energy markets, where a certain share of electricity should be based on “green energy” sources, and the consumers can be charged a higher price for this share. The study does estimate the cost of reducing CO2 emission by substituting fossil fuels with biomass. Corresponding to the results above Olesen et al. (2001) find that energy crops, i.e. elephant grass grown at sandy soils, may be competitive to traditional agricultural crops, if the price of biomass is 30 DKK per GJ. Given this price of biomass elephant grass on sandy soils there will be negative costs of reducing CO2 emissions by substituting fossil energy sources with biomass. However, according to Gylling (2001) the price of 30 DKK per GJ used in Olesen et al. (2001) seems higher than the costs of alternative fossil energy sources.
Søbygaard (2002) evaluates the Danish energy policy in the 1990’s, including the support of biomass use in power generation. The analysis includes tax deadweight losses. It is concluded that use of straw at power plants have been a rather expensive measure compared to the environmental benefit achieved. The shadow value of reducing CO2 emission is estimated to be 566 DKK per tonne CO2 (76 € per tonne CO2). The shadow value represents here the minimum value of the CO2 emission reduction which ensures a social net benefit from use of biomass in energy production.
2.2. Conclusions
Production of bio-energy on agricultural land is not in general a commercially competitive land use. However, bio-energy reduces the externalities from the use of fossil fuels. Inclusion of external costs and benefits improves the competitiveness of bio-energy from a societal perspective. Still, the competitiveness of bio-energy is sensitive to the value of the avoided green house gas emissions. When biomass is converted to biofuel the oil price plays a crucial role for the competitiveness of the bioenergy alternative. Generally speaking biofuel is an expensive way of reducing CO2 emissions – at least in the EU.

33
If energy crop production competes with traditional crops there is no evidence that energy crops generate a higher level of employment. In General energy crops require less labour per hectare than traditional crops, but downstream activities in terms of transportation and handling of the biomass at power plants may be greater than for most traditional crops. However, if the alternative to growing energy crops is fallow land then there will be positive employment impacts of bio-energy production and use. The employment effects will depend on the region, i.e. the “abundance” of abandoned agricultural land suitable for energy production.
The production of crops for power generation has a positive effect on the environment in terms of reduced green house gas emissions. However, depending on the crop and farming practices biomass production may increase nutrient and pesticide pollution from agriculture through intensified land use.
The important aspect is to implement an adequate price structure with pricing of externalities as the central feature. Thus, CO2 emissions from the use of fossil energy should be taxed at a level compatible with the long run marginal costs of realizing the specified reduction commitments in the EU/Member States. Where fuels are taxed for fiscal purposes biofuels should be exempted from the CO2 tax element outlined above. Subsidizing/tax exempting bioenergy by more than can be justified in terms of environmental benefits will result in a welfare loss to society.
Whether production of energy crops will be socially competitive depends on the development of fossil energy prices, the shadow value of reducing CO2 emissions, and future processing costs. The processing cost component may be significantly reduced in the (near) future due to expected technological breakthroughs in terms of the so called second generation biofuels. The right price structure will create adequate incentives for innovations and producers to develop and implement new technologies.

34
References Cerasola, M., Marino, D. 1995. Analisi strutturale dell’agricoltura biologica in Sicilia. In Chironi, G. (Ed.), Filiere atte allo sviluppo di aree collinari e montane: il caso dell’agricoltura biologica. Palermo: Univeristà degli Studi di Palermo. Coelho, S.T and Goldemberg, J. (2004) Alternative Fuels, Encyclopedia of Energy, Vol. 1, pp 67–80. Dabbert, S. 2003. Organic agriculture and sustainability: environmental aspects. In: OECD (Eds.). Organic Agriculture: Sustainability, Markets and Policies. OECD, Paris: 51-64. Dabbert, S., Häring, A. M., Zanoli, R. (2004): Organic farming. Policies and prospects. Zed Books, London. Domac, J. Richards, K., Risovic, S. 2005. Socio-economic drivers in implementing bioenergy projects. Biomass and Bioenergy 25: 97-106. Dubgaard, A. 1990. Økonomien i økologisk jordbrug – en regnskabsundersøgelse. Statens Jordbrugsøkonomiske Institut. Rapport nr. 54. Dubgaard, A. 1994. Economics of organic farming in Denmark. In: Lampkin, N. H., Padel, S. (Eds.). The Economics of Organic Farming. An International Perspective. CAB International: 119-129. DØRS 2004. Dansk Økonomi Efterår 2004. Diskussionsoplæg. Kapitel III. Vand og Natur. Det Økonomiske Råds Sekretariat. København. EU-COM (2005a): Biomass action plan, Communication from the Commission, COM(2005) 628 final, Commission of the European Communities, Brussels, 7.12.2005, SEC(2005) 1573. EU-COM (2005b): Biomass action plan. Impact Assessment, COM(2005) 628 final}, Commission Staff Working Document, Annex to the Communication from the Commission, Commission of the European Communities, Brussels, 7.12.2005, SEC(2005) 1573. EU-COM (2006a): An EU Strategy for Biofuels. COM(2006) 34 final, Communication from the Commission. Commission of the European Communities, Brussels. SEC(2006) aaaa. EU-COM (2006b): An EU Strategy for Biofuels. Impact Assessment; Communication from The Commission, Brussels, 2006. SEC(2006)142 EU-Directive (2003): Directive 2003/30/Ec of the European Parliament and of the Council of 8 May 2003 on the promotion of the use of biofuels or other renewable fuels for transport. http://europa.eu.int/comm/energy/res/legislation/doc/biofuels/en_final.pdf Faaij, A., Meuleman, B. Turkenburg, W. van Wijk, A., Bauen, A. Rosillo-Calle, F., Hall. D. 1998. Externalities of biomass based electricity production compared with power generation from coal in the Netherlands. Biomass and Bioenergy 14(2): 125-147.

35
Fulton, L., Howes, T. and Hardy, J.(2004): Biofuels for Transport, An International Perspective. Development. International Energy Agency, Paris, April 2004. http://www.iea.org/textbase/nppdf/free/2004/biofuels2004.pdf Gylling, M. 2001. Energiafgrødeprogrammet. Hovedrapport. Statens Jordbrugs- og Fiskeriøkonomiske Institut, Rapport nr. 131, 78 pp. Gylling, M., Abildtrup, J., Nielsen, K. V. 2001. Langsigtede biomasseressourcer til energiformål. Statens Jordbrugs- og Fiskeriøkonomiske Institut, Rapport nr. 125, 67 pp. FOI 2005. Regnskabsstatistik for økologisk jordbrug 2004 [Account Statistics for Organic Farming 2004]. Serie G, nr. 9. Institute of Food and Resource Economics. København Frandsen, S. E., Jacobsen, L. B. 1999. Analyser af de samfundsøkonomiske konsekvenser af en omlægning af dansk landbrug til økologisk produktion. Statens Jordbrugs- og Fiskeriøkonomisk Institut. Working Paper no. 5/1999. Gallagher, P. W., Dikeman, M., Fritz, J., Wailes, E., Gauthier, W., Shapouri, H. 2003. Supply and Social Cost Estimates for Biomass from Crop Residues in the United States. Environmental and Resource Economics 24: 335-358 Häring, A. M., Bichler, B., Dabbert, S. 2003. Der Einfluss ökologischer Produktionsverfahren auf die Betriebsstruktur: Eine deskriptive Analyse basierend auf der EU Agrarstrukturerhebung 2000. The impact of organic production methods on farm structure in the EU: A descriptive analysis base don farm survey data for 2000. Paper presented at the 13. Jahrestagnung Österreichische Gesellschaft für Agrarökonomie “Europäische Integration – Chancen und Risiken für den ländlichen Raum”, September, 18-20. 2003 Ljubjlana/Domzale, Slovenia. Häring A. M., Dabbert, S., Aurbacher, J., Bichler, B., Eichert, B., Gambelli, D., Lampkin, N., Offermann, F., Olmos, S., Tuson, J., Zanoli, R. 2004. Organic farming and measures of European agricultural policy. Organic Farming in Europe: Economics and Policy. Volume 11. Stuttgart-Hohenheim: University of Hohenheim. IPCC 2001. Climate change 2001, Mitigation. Third Assessment Report of Working Group III of the IPCC. Cambridge University Press. Cambridge. Jacobsen, B.H., J. Abildtrup, M. Andersen, T. Christensen, B. Hasler, Z.B. Hussain, H. Huusom, J.D. Jensen, J.S. Schou og J.E. Ørum. 2004. Omkostninger ved reduktion af landbrugets næringsstoftab til vandmiljøet - Forarbejde til Vandmiljøplan III. Rapport nr. 167 fra Institute of Food and Resource Economics, København 2004. Jacobsen, B. H., Madsen, N., Ørum, J. E. 2005. Organic farming at the farm level – scenarios for the future development. Institute of Food and Resource Economics, Den Kgl. Veterinær- og Landbohøjskole. Report no. 178. Jacobsen, L. B. 2001. Potentialet for økologisk jordbrug: Sektor og samfundsøkonomiske beregninger. Statens Jordbrugs- og Fiskeriøkonomiske Institut rapport nr. 121

36
Jacobsen, L. B. 2002. Økologi i dansk økonomi. Konstruktion af en økologispecifik input-output tabel. Institute of Food and Resource Economics, Working paper nr. 2002/16. Jacobsen, L. B. 2003. Do support payments for organic farming achieve environmental goals efficiently? In: OECD (Eds.). Organic Agriculture: Sustainability, Markets and Policies. OECD, Paris: 345-364. Econometric Sector Model for Evaluating Ressource Application and Land use in Danish Agriculture (ESMERALDA). Statens Jordbrugs- og Fiskeriøkonomiske Institut, Report no. 90, København. Jensen, J. D., Andersen, M., Kristensen, K. 2001. A Regional Econometric Sector Model. A documentation of the regionalized ESMERALDA model. Statens Jordbrugs- og Fiskeriøkonomiske Institut, Report no. 129, København Jørgensen, U., Dalgaard, T. (Eds.) 2004. Energi i økologisk jordbrug. Reduktion af fossilt energiforbrug og produktion af vedvarende energi. FØJO-rapport nr. 19/2004. Lampkin, N. Foster, C., Padel, S., Midmore, P. 1999. The Policy and Regulatory Environment for Organic Farming in Europe. Organic Farming in Europe: Economics and Policy Volume 1. Stuttgart-Hohenheim: University of Hohenheim. Manella, M. (2006): Ethanol and Biodiesel Fuels in the U.S., National Biomass Initiative, U.S. Department of Energy, Feature Article, January 2006. http://www.bioproducts-bioenergy.gov/news/DisplayRecentArticle.asp?idarticle=227 Miljøministeriet 2002. Bekendtgørelse om erhvervsmæssigt dyrehold, husdyrgødning, ensilage m.v. Bekendtgørelse nr. 604 af 15/7 2002. Nieberg, H., Offermann, F., 2003. The profitability of organic farming in Europe. In: OECD (Eds.). Organic Agriculture: Sustainability, Markets and Policies. OECD, Paris: 141-151. Offermann, F., Nieberg, H. (2000): Economic Performance of Organic Farms in Europe. In: Organic Farming in Europe: Economics and Policy. Volume 5. Stuttgart-Hohenheim: University of Hohenheim. Offermann, F., Nieberg, H. 2002. Does organic farming have a future in Eruope? Eurochoice 1 (2): 12-17. Olesen, J. E., Andersen, J. M., Jacobsen, B. H., Hvelplund, T., Jørgensen, U., Schou, J., S., Graversen, J., Dalgaard, D., Fenhann, J. V. 2001. Kvantificering aft re tiltag til reduktion af landbrugets emission af drivhusgasser. DJF-rapport. Markbrug Nr. 48. Danmarks JordbrugsForskning, Foulum. Pain, K. L., Peterson, T. L., Undersander, D. J. Rineer, K. C., Bartelt, G. A., Temple, S. A., Sample, D. W., Klemme, R. M. 1996. Some Ecological and Socio-economic Considerations for Biomass Energy crop Production. Biomass and Bioenergy 10(4): 231-242.

37
Pedersen, H. B. 2005. Landbrugsregnskabsstatistik 2004 – udvælgelse, beregninger og definitioner. Statistisk Afdeling, Institute of Food and Resource Economics (www.foi.dk). Sáez, R. M., Linares, P., Leal, J. 1998. Assessment of the Externalities of Biomass Energy, and a Comparision of its full costs with coal. Biomass and Bioenergy 14 : 469-478. Schneider, U. W., McCarl, B. A. 2003. Economic Potential of Biomass Based Fuels for Greenhouse Gas Emission Mitigation. Environmental and Resource Economics 25: 291-312 Schulze Pals, L. 1994. Ökonomische Analyse der Umstellung auf ökologischen Landbau. Münster: Landwirtschaftsverlag GmbH. Schriftenreihe des BMELF, Reihe A, Angewandte Wissenshaft, Heft 436. Sim, R. E. H. 2004: The triple bottom line benefits of bioenergy for the community. In: OECD (Ed.): Biomass and Agriculture: Sustainability, Markets and Policies. Organisation for Economic Co-operation and Development, Paris, pp 91-103. Sotelo, A. S. 2005. Materialeudvælgelse, beregninger og definitioner 2004 for økologisk regnskabsstatistik. Institute of Food and Resource Economics (www.foi.dk). Steininger, K. W., Voraberger, H. 2003. Exploiting the Medium Term Biomass Energy Potentials in Austria. Environmental and Resource Economics 24: 259-377. Stolze, M., Piorr, A., Häring, A., Dabbert, S. 2000. The Environmental Impacts of Organic Farming on Europe. Organic Farming in Europe: Economics and Policy. Volume 6. Stuttgart-Hohenheim: University of Hohenheim. Søbygaard, J. K. Cost benefit analyser af energipolitik samt energi- og transportafgifter. Det Økonomiske Råds Sekretariat. Arbejdspapir 2002:4. København. Topping, C. J., Hansen, T. S., Jensen, T. S., Jepsen, J. U., Nikolajsen, F., Odderskær, P. 2003. ALMaSS, an Agent-based Model for Animals in Temperate European Landscapes. Ecological Modelling, 167: 65-82. Ugarte, D. L. T. (2005): The contribution of Bioenergy to a New Energy Paradigm. EuroChoices: agri-food and rural resource issues, Vol. 4, Nr. 3, 2005. US-EIA(2004): Biofuels for Transport – An international Perspective. (U.S. Government Energy Information Administration) http://www.iea.org/textbase/nppdf/free/2004/biofuels2004.pdf US-EIA (2005): Renewable Energy Trends 2004. (U.S. Government Energy Information Administration). http://www.eia.doe.gov/cneaf/solar.renewables/page/trends/trends.pdf US-IEA (2006b): Monthly Energy Review, February 2006. (U.S. Government Energy Information Administration).

38
http://www.eia.doe.gov/emeu/mer/pdf/mer.pdf Varela, M. Lechón, Y., Sáez, R. 1999. Environmental and socioeconomic aspects in the strategic analysis of a biomass power plant integration. Biomass and Bioenergy 17: 405-413. Venendaal, R., Jørgensen, U., Foster, C. A. 1997. European Energy Crops: A Synthesis. Biomass and Bioenergy 13 (3): 147-185. Wrang, K., Hansen, A. S., Egense, A. 2004. Økologi og Økonomi. Fordele og omkostninger ved økologisk fødevareproduktion. Rapport fra Institut for Miljøvurdering. Wynen, E. 1998. Organic Agriculture in Denmark – Economic Impacts of a Widespread Adoption of Organic Management. Rapport nr. 99. Statens Jordbrugs- og Fiskeriøkonomiske Institut.