g20 subsidies to oil, gas and coal production: canada ... institute ... potential production...
TRANSCRIPT
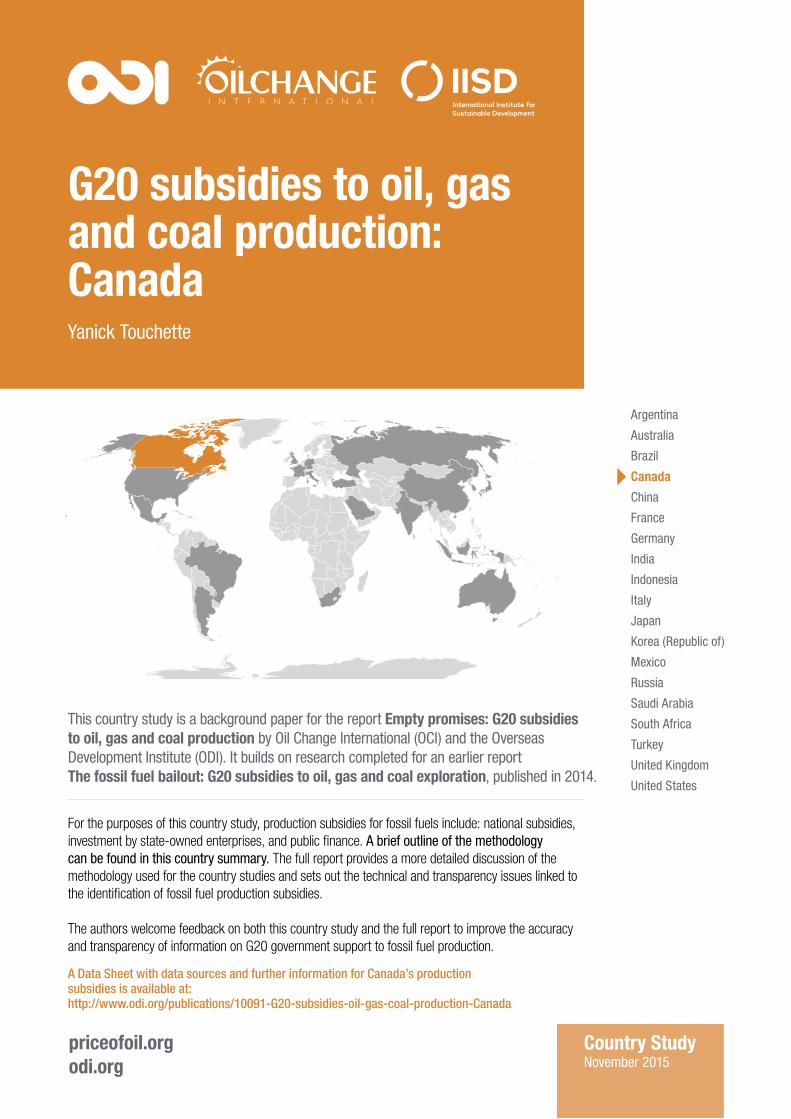
For the purposes of this country study, production subsidies for fossil fuels include: national subsidies, investment by state-owned enterprises, and public finance. A brief outline of the methodology can be found in this country summary. The full report provides a more detailed discussion of the methodology used for the country studies and sets out the technical and transparency issues linked to the identification of fossil fuel production subsidies.
The authors welcome feedback on both this country study and the full report to improve the accuracy and transparency of information on G20 government support to fossil fuel production.
This country study is a background paper for the report Empty promises: G20 subsidies to oil, gas and coal production by Oil Change International (OCI) and the Overseas Development Institute (ODI). It builds on research completed for an earlier report The fossil fuel bailout: G20 subsidies to oil, gas and coal exploration, published in 2014.
G20 subsidies to oil, gas and coal production: CanadaYanick Touchette
priceofoil.orgodi.org
Country StudyNovember 2015
Argentina
Australia
Brazil
Canada
China
France
Germany
India
Indonesia
Italy
Japan
Korea (Republic of)
Mexico
Russia
Saudi Arabia
South Africa
Turkey
United Kingdom
United States
A Data Sheet with data sources and further information for Canada’s production subsidies is available at:http://www.odi.org/publications/10091-G20-subsidies-oil-gas-coal-production-Canada

BackgroundThe picture of fossil fuel production in Canada changed considerably during 2014 and 2015. New projects to extract tar sands, which in 2013 accounted for 56% of Canada’s oil production (CAPP, 2015), were either shelved or postponed in the cases of 19 distinct projects (OCI, 2015). Two of these projects alone – Shell’s Pierre River project and PetroChina’s Dover project, both located north of Fort McMurray, Alberta – have a combined potential production capacity of 450,000 barrels of oil per day (bpd). A third project, the Joslyn project by Total and Suncor, represents an additional 157,000 bpd of production. Applications for the Joslyn project, alongside applications for Pierre River, were both withdrawn in recent months.
Natural gas production expanded between 2013 and 2014 by just under 5%, and looked set to benefit from additional tax breaks as of 19 February 2015, mainly targeting production in British Columbia (CRA, 2015). However, by late December 2014, two provincial governments – New Brunswick and Québec – had announced their intentions to put a hold on hydraulic fracturing (fracking) in their jurisdictions. New Brunswick followed through with a five-conditions moratorium on fracking in 2015, whereas the latter had yet to implement any such policies as the fracking debate ensues in the province.
Although Canada is one of the rare G20 countries to have openly referred in the past years to its G20 commitments to implement fossil fuel subsidy phase-out, it introduced new subsidy schemes in 2015 alongside the phase-out of other measures that will no longer incur costs on the Canadian government’s tax revenues after 2014. One such new measure, the Accelerated Capital Cost Allowance (ACCA) for liquefied natural gas (LNG) projects, increases the amount of expenses that can be deducted by more than thrice what they were before, from 8% to 30% (CRA, 2015). The revenue impact for this new measure is estimated at $38 million1 (CAD 45 million) over a five-year period (2015 to 2020) (Government of Canada, 2015).
National subsidies
Tax expenditureAll tax expenditures can occur at both the federal and provincial levels of administration in Canada, with a wide array of national subsidies that total a minimum of $2.5 billion annually when the two are combined. At the
federal level, this amounts to a minimum of $1.6 billion, mainly through tax expenditures (Table 1). Most of the measures identified benefit oil and natural production upstream, providing tax breaks to exploration activities, field development and extraction. Because estimates for some subsidies are not available, the actual value of national subsidies is likely to be higher (Commissioner of the Environment and Sustainable Development, 2012).
A November 2010 flagship study by the Global Subsidies Initiative provides detailed information on upstream subsidies in Canada’s largest oil-producing provinces and at the federal level (Sawyer and Stiebert, 2010). Natural Resources Canada also provides technical information on Mining-Specific Tax Provisions (NRCAN, 2015), although lack of transparency means that information on the annual magnitude of these resources is not readily available.2
Canadian producers have access to four tax measures from which they can deduct expenses (KPMG, 2015). Through the Canadian Development Expenses (CDE), estimated at $785 million for oil and $196 million for natural gas in 2013, producers can claim up to 30% of their expenses for drilling, converting, and completing an oil field, or sinking a mine shaft, in tax deductions on a declining-balance basis. These expenses can be accumulated in a cumulative CDE pool over the years and be claimed later during the project’s lifetime (NRCAN, 2015). Since 2011, the Canadian government has made changes to the Canadian Exploration Expenses (CEE; see below) that affect CDE. Between 2011 and 2015, expenses incurred for tar sands pre-production purposes are gradually being transitioned from CEE to CDE tax breaks (see NRCAN, 2014 for transition schedule).
Through the CEE, estimated at $127 million for oil and $32 million for natural gas in 2013, oil and gas companies can deduct 100% of their exploration expenses, including the costs of geological surveys and exploratory drilling, whether or not these efforts lead to significant discoveries and resource development (Sawyer and Stiebert, 2010; NRCAN, 2015). Until the end of 2012, pre-production expenses for tar sands commercial-scale mining were also fully deductible under CEE. After 2015, these expenses will be considered as CDE. Schedules to phase out pre-production expenses for other mine development as CEE and bring these expenses under CDE tax breaks were also implemented through the Canadian government’s Budget 2013. Full phase-out will be in effect as of 2018. If exploration expenditures are not deducted in the year they were made, they can be carried forward indefinitely to
1 Based on IRS 2014 exchange rate: www.irs.gov/Individuals/International-Taxpayers/Yearly-Average-Currency-Exchange-Rates
2 Although this approach has been dismissed as inappropriate in the past, mainly because it can potentially neglect interaction with other fiscal incentives (McKenzie and Mintz, 2011), we still consider it legitimate because the estimate that it fetches is based on Statistics Canada’s (2015, see Table 7.2) figure for Natural Resource Expenses that were exempt of income taxes for the years of interest, multiplied by the corresponding federal corporate income tax rate of 15%. As noted, these four tax measures are available to oil and gas producers and Finance Canada still does not record the actual uptake by companies. The total amount included in this study assumes a 100% tax measure uptake.
2 G20 subsidies to oil, gas and coal production

be deducted in later years (NRCAN, 2015). As of March 2015, producers who incur expenses to conduct mandated environmental studies and community consultations before they can get authorisation to proceed with exploration projects are now able to fully deduct these costs as well.
An additional tax break, the Canadian oil and gas property expense (COGPE), allows companies to take a 10% deduction for the costs of acquiring oil and gas wells and rights. The COGPE is estimated to amount to $28 million and $7 million annually for oil and gas respectively. This subsidy applies to the upstream oil and gas industry more broadly, including exploration alongside other extraction and production activities (NRCAN, 2015). The introduction of the COGPE in the 2011 budget eliminated a tar sands preference by reclassifying as COGPE the costs of acquiring tar sands property and leases, previously eligible for the 30% Canadian development expense deduction, saving up to $69 million each year by 2015/16 (OECD, 2012).
For fossil fuel companies that operate abroad, the foreign resource expense (FRE) and foreign exploration and development expense (FEDE) allow Canadian companies to deduct 30% of exploration expenses incurred overseas (NRCAN, 2015). Lack of data means that it was not possible to estimate the exact value of FRE and FEDE for 2013 and 2014. However, the combination of these four distinct measures (CDE, CEE, COGPE and FRE/FEDE) is estimated to amount to $1.1 billion each year (Statistics Canada, 2015; Sawyer and Stiebert, 2010).
The duty exemption for imports of mobile offshore drilling units is designed to further reduce exploration costs for oil and gas companies. This tax break, which was renewed for five years in 2009 and became permanent in the 2014 budget, aims to promote oil and gas exploration in the offshore Atlantic and Arctic specifically (Government of Canada, 2014). These regions are among the world’s worst in terms of the financial and environmental risks of oil and gas production (Rouse et al., 2014).
For certain companies, such as junior exploration companies that do not yet turn a significant profit, these tax deductions have limited benefit because of their lack of taxable revenue. The flow-through share deduction valued at $119 million annually (OECD, 2015), allows these companies (mostly limited partnerships) to pass exploration expenses on to their investors, who can deduct them from their personal income taxes (Hasselback, 2013). This subsidy encourages additional investment in exploration companies to take advantage of the tax deductions (Commissioner of the Environment and Sustainable Development, 2012). The profits of exploration-limited partnerships are taxed as capital gains, at only half the rate of the regular income tax, encouraging still further investment (Sprott Asset Management, 2014).
The earned depletion allowance was implemented specifically to promote resource exploration and development (OECD, 2012). The subsidy was phased out in 1990, but companies could still continue to claim eligible expenses from before that year (NRCAN, 2015). This provision allowed companies to deduct one third of certain expenses from their tax base; prior to its phase-out, the typical deduction totalled up to 25% of a company’s total resource profits. The residual claims for earned depletion allowance now appear to have been phased out completely, with no tax expenditures reported by the Canadian government in the past five years (Department of Finance Canada, 2014).
Alongside the COGPE, an additional measure passed in 2007 aimed to ‘align the tax treatment’ of tar sands with the conventional oil and gas sector by eliminating tar sands-specific breaks (Government of Canada, 2012b). The 2007 Canadian budget implemented a schedule to phase out accelerated depreciation for tar sands projects, i.e. the accelerated capital cost allowance (ACCA), which previously cost the federal government $276 million each year by allowing companies to deduct 100% of asset costs (Commissioner of the Environment and Sustainable Development, 2012). Assets for tar sands projects acquired on 1 January 2015 onwards are no longer eligible for an ACCA, the subsidy being reduced to make tar sands projects subject to the regular 25% depreciation rate available to oil, gas and mining assets (Commissioner of the Environment and Sustainable Development, 2012; NRCAN, 2015). Nonetheless, an ACCA has been introduced in Canada’s 2015 budget to specifically benefit LNG projects (benefiting plants in British Columbia), adding 22% to the usual 8% rate for natural gas liquefaction equipment (CRA, 2015). The new measure was advocated for by the Canadian Association of Petroleum Producers (CAPP) in a brief submitted to the Canadian government in August 2014 (CAPP, 2014). The new rate applies to capital assets acquired after 19 February 2015. Current provisions include an end-date by the end of 2024.
In 2012, the Canadian government scheduled a phase-out for the Atlantic Investment Tax Credit (AITC), which amounted to approximately $72 million in foregone revenues from the oil and gas sector in 2014 (Department of Finance Canada, 2014; Sawyer and Stiebert, 2010).3 A tax credit rate of 5% will continue to apply to assets acquired through 2015, and companies will still be able to benefit from the deduction for past expenses until 2017 (NRCAN, 2015).
At the provincial level, tax breaks amount to a minimum of $979 million annually, mostly delivered for oil and natural gas exploration activities as relief on royalties by the provinces of Alberta and British Columbia. In Alberta, the province allows for several relief programmes on royalties
Canada 3
3 Finance Canada provides data on the cost of AITC. Although these are not disaggregated between sectors benefiting from the measure – such as agriculture and logging – it is estimated that half of the tax breaks were allocated to the oil and gas sector under AITC (Sawyer and Stiebert, 2010).

for oil and gas projects, ranging from oil recovery to low productivity and reactivated wells (OECD, 2012). These amount to an average of $604 million each year. In British Columbia, the Deep Royalty Program, estimated at $249 million annually, provides relief on royalties to producers whose horizontal wells are shallower than 1,900 metres and vertical wells with depths greater than 2,500 metres. For the latter, royalty credits can amount to as much as $2 million (Government of British Columbia, 2015).4
Direct spendingThe government of Canada provides few budgetary transfers to producers of oil, gas and coal. Between 2011 and 2014, it provided Saskatchewan’s electricity provider, SaskPower, with $226 million in grants for the refurbishment, retrofitting and development of carbon capture and storage (CCS) infrastructure at the Boundary Dam coal power plant (SaskPower, 2011-2014). The federal government also partially funded Saskatchewan’s Petroleum Technology Research Centre (PTRC) through Natural Resources Canada (NRCAN). Collectively, NRCAN, the Government of Saskatchewan, the University of Regina, and the Saskatchewan Research Council provided the PTRC with $18 million in R&D funding for CCS projects and enhanced oil recovery research (OECD, 2015; PTRC, 2015).5 The Canadian government will also invest a total of $156 million in two projects in Alberta (see below) over their implementation phase, although data pertaining to the specific fiscal year during which this funding has been or will be allocated did not appear to be available at the time of publishing this report (NRCAN, 2013).
At the provincial level, Saskatchewan shares participation in the PTRC with the federal government (see above), and its public utility for electricity generation also invested significantly in the CCS Boundary Dam project (see below). Another Canadian province, Alberta, through its Ministry of Energy, has spent an annual average of $103 million on two CCS projects as well (Energy Alberta, 2014a), one of which is conducted by the Canadian divisions of Shell, Chevron, and Marathon Oil Sands (NRCAN, 2015b). Finally, British Columbia has also invested approximately $19 million each year through its transportation investment plan to facilitate oil and gas extraction (OECD, 2012).
State-owned enterprise investmentThe Canadian federal government does not own any oil, gas or coal companies, or electricity companies. In Canada, electricity generation is managed at the provincial, and at times, municipal levels. Although accounting for the investment by sub-national state-owned enterprises (SOEs)
is not within the remit of this report, among the provincial utilities, SaskPower funded the refurbishment, retrofit and development of CCS infrastructures at its Boundary Dam coal power plant installations between 2011 and 2014 with financial grants from the Canadian government (see above). In 2013 alone, SaskPower spent $475 million on the Boundary Dam project, which amounted to 39% of the utility’s entire capital expenditures for that year. Total costs incurred by SaskPower for the Boundary Dam Integrated CCS Demonstration project amounted to $1.2 billion over four years, of which two thirds were dedicated to the CCS installations (SaskPower, 2014; Saskatchewan Community Wind, 2015).6 SaskPower also invested in the Shand Carbon Capture Test Facility, for which data was not readily available.
Public financeCanada’s main public finance institution is Export Development Canada (EDC), which, despite what the name might suggest, provides public finance domestically, as well as internationally (Table 2).
EDC’s reporting of its transactions is not precise: information on the volume of each transaction is provided as a range (for example, $50–100 million; $250–500 million). To overcome this data limitation, wherever EDC’s reporting was the only source of information for a transaction benefiting fossil fuel production, the lowest end of the range was used in our analysis. This means that the estimates in this analysis could represent as little as half the true amount of Canadian public finance for fossil fuel production. Due to the lack of precision in EDC reporting, it was also not possible to clearly disaggregate finance into different fossil fuels (oil, natural gas and coal) and into upstream and downstream activities. However, given the recipients of most of EDC’s public finance for fossil fuel production, all appear to involve oil and gas production.
With these caveats in mind, the analysis found that EDC provided an average of $2.5 billion per year to fossil fuel production. The largest transaction was between $435 million and $870 million, to India’s Reliance Industries Ltd. A number of EDC’s larger transactions were with oil and gas producers and pipeline companies in the US and Canada, including TransCanada, Enbridge, Encana, Devon Energy, ConocoPhillips and Phillips 66, and Chevron.
InternationalCanada also owns shares in multilateral development banks (MDBs). Through these banks, Canada was responsible for an average of $176 million per year in finance for fossil fuel production in 2013 and 2014.
4 Based on 2014 exchange rate.
5 This figure could be not fully disaggregated due to lack of data.
6 With federal spending included, the Boundary Dam Integrated CCS Demonstration project benefited from $1.4 billion in public funds.
4 G20 subsidies to oil, gas and coal production

Private companiesPrivate upstream oil and gas companies
Regardless of a mix of sharply declining prices for oil during the second half of 2014 and high production costs for tar sands, overall, the top 10 oil and gas producers in Canada posted higher profits in 2014 than they did in 2013, rising from $5.8 billion to $7.8 billion. However, Exxon Mobil and ConocoPhillips, two major multinational oil corporations, posted losses for a second year, at $3 billion and $2.2 billion respectively. Oil and
gas output, based on million barrels of oil equivalent (boe), was fairly stable at 1.2 billion and 1.3 billion for 2013 and 2014 respectively. The 10 biggest producers in the country thus shared more than half of the 2.4 billion boe produced.
Exploration expenditures in Canada reached a peak of $11.1 billion in 2014, with Shell again leading the way at $851 million, or 8% of total spending (Rystad, 2015). It was followed by Encana and Husky Energy, which spent $471 million and $389 million on exploration respectively in 2014 (Rystad, 2015).
Canada 5
Table 1: Canada’s national subsidies to fossil fuel production, 2013–2014 ($ million except where stated otherwise)
Subsidy Subsidy type Targeted energy source
Stage 2013 estimate
2014 estimate
Estimated annual average amount*
Canadian Development Expense Tax deductions for development expense, including accelerated depreciation
Oil and gas Field development 981 N/A 981**
Alberta Crown Royalty Reductions (Alberta)
Relief on royalties and production taxes on field output
Oil and gas Extraction from a field
631 578 604
Deep Drilling Credit (British Columbia)
Relief on royalties and production taxes on field output
Gas Extraction from a field
260 238 249
Canadian Exploration Expense Tax deductions for exploration expense, including accelerated depreciation
Oil and gas Gaining access, exploration and appraisal of a field
159 N/A 159
Atlantic Investment Tax Credit Tax deductions for development expense, including accelerated depreciation; tax deductions, including accelerated depreciation, for earned depletion allowances, for operation of mature and non-conventional fields and purchase of certain field operation equipment
Oil and gas Gaining access, exploration and appraisal of a field; field development; extraction from a field
200 72 136
Other national subsidies (see Data Sheets)
609
Totals
Total national subsidies ($ m) 2,738
Total national subsidies (CAD m) 2,923
Sources and additional data are available in the Data Sheets that accompany each Country Study.
Notes: *When initial values were available in Canadian dollars, they were converted to US dollar values using IRS corresponding yearly average
currency exchange rates. Note that the Canadian dollar lost value against the US dollar between 2013 and 2014, which sometimes results in
showing a ‘decrease’ in subsidies from one year to the next (see, for instance, Heartlands Oil and Gas Road Rehabilitation). For IRS chart, see:
(www.irs.gov/Individuals/International-Taxpayers/Yearly-Average-Currency-Exchange-Rates).**When data is yet to be made available for 2014,
the two-year average is based on 2013 data only

Tar sands companies again led the way in production expansion in the country, with CNRL and Suncor Energy at the top of the largest oil and gas producers list in Canada in 2014. Other independent companies that specialise largely or entirely in tar sands – Husky Energy, Cenovus Energy and Encana – were also among the country’s top 10 producers.
By the end of 2014, two Canadian provinces, New Brunswick and Quebec, had declared their intentions of implementing a moratorium on shale gas extraction. Between 69 trillion and 300 trillion cubic feet are believed to be spread among the Utica, Elgin, Frederick Brook and Horton Bluff formations, three of which are present in New Brunswick and Quebec. British Columbia could have as much as 2,900 trillion cubic feet (Parliament of Canada, 2014). In 2015, the Canadian government introduced a new ACCA for LNG that will mostly benefit producers from British Columbia, after CAPP advocated for it in front of the country’s House of Commons Standing Committee on Finance. This allowed for the entire 30% declining depreciation rate that was suggested (CAPP, 2014).
Private midstream/downstream oil and gas companies There are a total of 15 refineries currently in service in Canada owned by 9 companies, for a total refining capacity of 1.87 million bpd (Canadian Fuels Association, 2015). Three of these companies are also among the top 10 oil and gas upstream producers in the country (Husky Energy, Shell, and Suncor). Furthermore, there are currently five pipeline projects pending in the country, all of which
would transport tar sands from Alberta and Saskatchewan to both the East and West Coasts of Canada, and to the South to the Gulf of Mexico (Sears, 2015). Combined, these five projects would increase transport capacity by 3.4 million bpd.
Private coal companiesAccording to the Coal Association of Canada, the country has 24 permitted coal mines, of which 19 are operational (Coal Association of Canada, 2015). Most of Canada’s coal resources are found in similar regions to tar sands and shale gas deposits in Alberta, British Columbia and Saskatchewan.
Teck Resources, Canada’s largest diversified mining company, is the country’s largest coal producer and owned six Canadian coal mines in 2014 – five in British Columbia and one in Alberta, down from nine the previous year (Teck Resources, 2015). Westmoreland Coal continued to make new acquisitions in Canada in 2014, forming the Prairie Mines & Royalty ULC subsidiary (five mines in Alberta and Saskatchewan). The company also acquired Coal Valley Resources Inc. as part of its purchase of Sherritt International in 2014 (Westmoreland Coal Company, 2015).
Another company, Walter Energy, owns coal mines in British Columbia. Although it planned to add three mines to its previously existing three in 2013, the company suspended its operations at the Birmingham mine in 2014 due to plummeting coal prices (Globe and Mail, 2014). It currently operates three mines. Declining prices also delayed Coalspur’s Vista mine project, which received
6 G20 subsidies to oil, gas and coal production
Table 2: Canada’s public finance for fossil fuels production, 2013–2014 ($ million except where stated otherwise)
Institution name Coal mining Coal-fired power Upstream oil and gas
Oil and gas pipelines, power
plants and refineries
Total fossil fuel finance 2013 &
2014
Annual avg. fossil fuel
finance
Domestic
Export Development Canada - - 807 87 894 447
Subtotal domestic - - 807 87 894 447
International
Export Development Canada - - 2,502 1,674 4,176 2,088
Multilateral development banks - 61 78 212 351 176
Subtotal international - 61 2,580 1,886 4,527 2,264
Totals
Total public finance ($ m) 2,711
Total public finance (CAD m) 2,894
Sources and additional data are available in the Data Sheets that accompany each Country Study.

approval in 2014 but was put on hold late that year (Hinton Parklander, 2015). Also in 2014, the province of Ontario completed its process of phasing out coal as a share of its energy mix, which accounted for a quarter of all generation sources as early as 2007 (Harris et al., 2015).
Private electricity companies (fossil fuel-based)In Canada, electricity generation is managed at the provincial, and at times, municipal levels. Most Canadian provinces own Crown Corporations, or SOEs, and generate most of their own electricity. However, in
provinces such as Alberta and Nova Scotia most of the generation available is owned by private entities, whose capacity is mainly derived from fossil fuels. For the latter, electricity is produced by Nova Scotia Power Inc. (NPSI), since the privatisation of NSP Corporation in 1992. NPSI generates 78% of its electricity from non-renewable sources (Emera Inc., 2015). Electricity generation in Alberta is also owned privately, and supplied by numerous utilities; 90% of generation capacity in the province is generated by coal (55%) and natural gas (35%) (Energy Alberta, 2014b).
Canada 7
Table 3: Top private upstream oil and gas producers in Canada, 2013–2014
Company Headquarter country
Oil production (million barrels in country)
Gas production (billion cubic metres
in country)
Sum of operating expenditure & capital expenditure, including exploration
expenditure ($ million)
Profitability (from country operations, as measured by
free cash flow) ($ million)
2013 2014 2013 2014 2013 2014 2013 2014
Canadian Natural Resources (CNRL)
Canada 176 183 12 16 9,965 11,164 2,597 2,263
Suncor Energy Canada 166 175 0 0 10,630 10,606 2,026 2,496
Husky Energy Canada 88 105 5 5 4,086 4,750 1,263 1,557
Shell Netherlands 70 75 8 9 6,166 6,402 827 860
ConocoPhillips United States 65 66 9 9 5,629 5,880 -1,085 -1,042
ExxonMobil United States 87 98 1 2 8,987 9,038 -3,030 -2,195
Cenovus Energy Canada 75 78 5 5 5,143 4,824 -301 314
Encana Canada 6 9 10 12 1,932 2,113 -324 107
Penn West Exploration
Canada 33 31 2 2 1,425 1,281 946 953
Apache United States 11 9 6 6 981 1,126 323 148
Source: Rystad Energy, 2015.
Table 4: Top private midstream/downstream oil and gas producers in Canada, 2013–2014
Company/ies Refinery Locations Capacity (million barrels)
Imperial Oil Limited Strathcona Refinery, Edmonton, Alberta; Nanticoke Refinery, Jarvis, Ontario; Sarnia Refinery, Sarnia, ON 420
Suncor Energy Products Partnership
Edmonton Refinery, Edmonton, Alberta; Petro-Canada Lubricants Centre, Mississauga, Ontario; Montreal Refinery, Montreal, Québec
381
Irving Oil Limited Saint John, New Brunswick 320
Valero Lévis, Québec 265
Shell Canada Products Scotford Refinery, Fort Saskatchewan, Alberta; Sarnia Manufacturing Centre, Corunna, Ontario 175
Source: Canadian Fuels Association, 2015.

8 G20 subsidies to oil, gas and coal production
Methodology (for detailed methodology see Chapter 3 of main report)
This report compiles publicly available information on G20 subsidies to oil, gas and coal production across G20 countries in 2013 and 2014. It provides a baseline to track progress on the phase-out of such subsidies as part of a wider global energy transition. It uses the following terms and their definitions.
Production subsidiesGovernment support for fossil fuel production. For the purpose of this country study, production subsidies include national subsidies, investment by state-owned enterprises (SOEs) (domestic and international) and public finance (domestic and international) specifically for fossil fuel production.
Fossil fuel productionProduction in the oil, gas and coal sectors. This includes access, exploration and appraisal, development, extraction, preparation, transport, plant construction and operation, distribution and decommissioning. Although subsidies for the consumption of fossil fuels can support their production, this report excludes such subsidies as well as subsidies for the consumption of fossil fuel-based electricity.
National subsidiesDirect spending, tax and duty exemptions and other mechanisms (such as forms of capacity markets) provided by national and sub-national governments to support fossil fuel production. Normally, the value assigned for a national subsidy is the number provided by the government’s own sources, by the OECD, or by an independent research institution.
State-owned enterprise (SOE) investmentA SOE is a legal entity created by a government to undertake commercial activities on its behalf. SOEs can be wholly or partially owned by governments.
It is difficult to identify the specific component of SOE investment that constitutes a subsidy, given the limited publicly available information on government transfers to SOEs (and vice-versa), and on the distribution of investment within their vertically integrated structures. Therefore, this report provides data on total investment by SOEs in fossil fuel production (where this information is available from the company), which are presented separately from national subsidies.
For the purpose of this report, 100% of the support provided to fossil fuel production through domestic and international investment by an SOE is considered when a government holds >50% of the shares.
Public finance Public finance includes the provision of grants, equity, loans, guarantees and insurance by majority government-owned financial institutions for domestic and international fossil fuel production. Public finance is provided through institutions such as national and multilateral development banks, export credit agencies and domestic banks that are majority state-owned.
The transparency of investment data for public finance institutions varies. Assessing the portion of total financing that constitutes a subsidy requires detailed information on the financing terms, the portion of finance that is based directly on public resources (rather than raised on capital markets) or that depends on the institutions’ government-linked credit rating. Few of the institutions assessed allow public access to this information. Therefore, we report the total value of public finance from majority government-owned financial institutions for fossil fuel production separately from ‘national subsidy’ estimates.
For the purpose of this report, 100% of the support provided to fossil fuel production through domestic and international financing is considered when a government holds >50% of the shares in the bank or financial institution.
Canada 9
ReferencesBast, E., Makhijani, S., Pickard, S. and Whitley, S. (2014)
‘The Fossil Fuel Bailout: G20 Subsidies for Oil, Gas, and Coal Exploration’. London: Overseas Development Institute (www.odi.org/publications/8678-fossil-fuel-bailout-g20-subsidies-oil-gas-coal-exploration)
Canada Revenue Agency (CRA) (2015) What’s new for corporations. (www.cra-arc.gc.ca/tx/bsnss/tpcs/crprtns/whtsnw-eng.html#rts)
Canadian Association of Petroleum Producers (CAPP) (2015) Statistical Handbook for Canada’s Upstream Petroleum Industry. (http://www.capp.ca/publications-and-statistics/publications/258990)
CAPP (2014) 2015 Budget Submission to the House of Commons Standing Committee on Finance. (www.capp.ca/~/media/capp/customer-portal/documents/250242.pdf)
Canadian Fuels Association (2015) The Fuels Industry – Fuel Production: Refining Sites and Capacity. (http://canadianfuels.ca/en/refining-sites-and-capacity)
Coal Association of Canada (2015). Mine Map. (www.careersincoal.ca/mine-map/)
Commissioner of the Environment and Sustainable Development (2012) Report of the Commissioner of the Environment and Sustainable Development. Ottawa: Office of the Auditor General of Canada.
Department of Finance Canada (2014) Tax Expenditures and Evaluations 2014. (www.fin.gc.ca/taxexp-depfisc/2014/taxexp1401-eng.asp#toc2)
Emera Inc. (2015) Annual Report 2014. Halifax: Emera Inc. (http://www.snl.com/Cache/1001197233?Y=&O=PDF&D=&fid=10011 97233&T=&iid=4072693)
Energy Alberta (2014a) Annual Report 2013-2014. Calgary: Energy Alberta (http://www.energy.alberta.ca/Org/Publications/AR2014.pdf)
Energy Alberta (2014b) Electricity Statistics – Electricity Supply: Alberta’s Electricity Generation – 2014. Calgary: Energy Alberta (http://www.energy.alberta.ca/electricity/682.asp)
Globe and Mail (2014) ‘Price slump hits B.C. coal miners’. Globe and Mail, 15 April. (www.theglobeandmail.com/report-on-business/industry-news/energy-and-resources/walter-energy-suspends-bc-coal-operations-on-slumping-prices/article18004649/)
Government of British Columbia (2015) Deep Royalty Program. (www.empr.gov.bc.ca/OG/OILANDGAS/ROYALTIES/DEEPROYALTYPROGRAM/Pages/default.aspx)
Government of Canada (2015) Budget 2015. (www.budget.gc.ca/2015/docs/plan/budget2015-eng.pdf)
Government of Canada (2014) ‘Annex 2 - Tax Measures: Supplementary Information’ in Budget 2014. Ottawa:
Government of Canada. (www.budget.gc.ca/2014/ docs/plan/anx2-1-eng.html)
Government of Canada (2012a) Phasing Out the Atlantic Investment Tax Credit – Oil & Gas Mining. (Accessed online on 14 September 2015 at http://actionplan.gc.ca/en/initiative/phasing-out-atlantic-investment-tax-credit-oil-gas)
Government of Canada (2012b) ‘Annex 4: Tax Measures: Supplementary Information, Notices of Ways and Means Motions and Draft Amendments to Various GST/HST Regulations’ in Budget 2012. Ottawa: Government of Canada. (www.budget.gc.ca/2012/ plan/anx4-eng.html#BITM3)
Harris, M., Beck, M. and Gerasimchuk, I. (2015) The End of Coal: Ontario’s coal phase-out. (https://www.iisd.org/sites/default/files/publications/end-of-coal-ontario-coal-phase-out.pdf)
Hasselback, D. (2013) ‘Flow-through shares: Canada’s quirky tax innovation’. Financial Post, 7 March. (http://business.financialpost.com/2013/03/07/ flow-through-shares-canadas-quirky-tax-innovation/)
Hinton Parklander (2015). Coalspur changes Vista plans. 23 January 2015. (www.hintonparklander.com/2015/01/23/coalspur-changes-vista-plans-2)
KPMG (2015). A Guide to Oil and Gas Taxation in Canada. (www.kpmg.com/Ca/en/IssuesAndInsights/ArticlesPublications/Documents/A-Guide-to-Oil-and-Gas-Taxation-in-Canada-web.pdf)
McKenzie, K.J. and Mintz, J.M. (2011) The Tricky Art of Measuring Fossil Fuel Subsidies: A Critique of Existing Studies. (www.policyschool.ucalgary.ca/?q=content/myths-and-facts-fossil-fuel-subsidies-critique-existing-studies-0)
Natural Resources Canada (NRCAN) (2015) ‘Mining-Specific Tax Provisions’. Ottawa: Government of Canada. (https://www.nrcan.gc.ca/mining-materials/taxation/mining-taxation-regime/8892#lnk5)
NRCAN (2013) Large Scale CCS Demonstration Projects. (http://www.nrcan.gc.ca/energy/funding/current-funding-programs/4951)
Oil Change International (OCI) (2015) On the Edge: 1.6 Million Barrels per Day of Proposed Tar Sands Oil on Life Support. (http://priceofoil.org/content/uploads/2015/05/OCI-Briefing-OnTheEdge_FINAL+.pdf)
Organisation for Economic Co-operation and Development (OECD) (2012) Inventory of Estimated Budgetary Support and Tax Expenditures for Fossil Fuels 2013. Paris: Organisation for Economic Co-operation and Development.
OECD (2015) OECD analysis of budgetary support and tax expenditures: Canada. Paris: Organisation for Economic Co-operation and Development.

Parliament of Canada (2014) Shale Gas in Canada: Resource Potential, Current Production and Economic Implications. (www.parl.gc.ca/Content/LOP/ResearchPublications/2014-08-e.htm#app)
Petroleum Technology Research Centre (PTRC) (2015) Projects. (http://ptrc.ca/projects)
Rouse, L., Galkina, A., Levine, M., Stockman, L., Kronick, C., with Norlen, D. and Marriott, J. (2014) Frozen Future: Shell’s ongoing gamble in the US Arctic. London: Greenpeace. (http://priceofoil.org/content/ uploads/2014/02/Frozen-Future.pdf)
Rystad Energy (2015) ‘Rystad Energy UCube Upstream Database’. Oslo: Rystad Energy (www.rystadenergy.com/ Databases/UCube)
Saskatchewan Community Wind (2015) Analysis of the Cash and Carbon Flows of Boundary Dam Coal-Fired Power Station. Saskatoon: Saskatchewan Community Wind (http://static1.squarespace.com/static/5394a3cbe4b032d797fe179c/t/5514190ce4b0b71a5147a8a3/1427380492322/150326-BoundaryCCS-ExecSummary.pdf)
SaskPower (2015) 2014 Annual Report: Investing in our Power Future. (www.saskpower.com/wp-content/uploads/2014-SaskPower-Annual-Report.pdf)
SaskPower (2014) 2013 Annual Report: It takes Power to Grow. (www.saskpower.com/wp-content/uploads/2013_saskpower_annual_report.pdf)
SaskPower (2013) 2012 Annual Report: One company. One focus. (www.saskpower.com/wp-content/uploads/2012_saskpower_annual_report.pdf)
SaskPower (2012). 2011 Annual Report: Energizing growth. (http://www.saskpower.com/wp-content/uploads/2011_skpower_annual_report.pdf)
Sawyer, D. and Stiebert, S. (2010) Fossil-fuels – At What Cost? Government support for upstream oil activities in three Canadian provinces: Alberta, Saskatchewan, and Newfoundland and Labrador. Geneva: Global Subsidies Initiative.
Sears, Allison (2015) Need and resistance: a review of the status of major Canadian pipeline projects in 2014. (http://www.canadianenergylaw.com/2015/01/articles/pipelines-and-storage/need-and-resistance-a-review-of-the-status-of-major-canadian-pipeline-projects-in-2014/)
Sprott Asset Management (2014) ‘Sprott Flow-Through Limited Partnerships’. Toronto: Sprott Asset Management. (www.sprott.com/products/ sprott-flow-through-limited-partnerships/)
Statistics Canada (2015) Financial and Taxation Statistics for Enterprises 2013. (www.statcan.gc.ca/pub/61-219-x/61-219-x2013000-eng.htm)
Teck Resources (2015) Our Steelmaking Coal Business.(www.teck.com/Generic.aspx?PAGE =Teck+Site%2f Diversified +Mining+Pages%2fCoal&portalName=tc)
Westmoreland Coal Company (2015) Mining Operations. (http://westmoreland.com/about-us/mining-operations/).
ODI is the UK’s leading independent think tank on international development and humanitarian issues. Oil Change International is a research, communications, and advocacy organization focused on exposing the true costs of fossil fuels and facilitating the coming transition towards clean energy. IISD’s mission is to promote human development and environmental sustainability through innovative research, communication and partnerships.
Overseas Development Institute 203 Blackfriars Road London SE1 8NJTel +44 (0)20 7922 0300 Fax +44 (0)20 7922 [email protected]
Oil Change International714 G Street SE Suite 202 Washington, DC 20003 USATel: +1 202 518 9029Fax: +1 202 330 [email protected]
Readers are encouraged to reproduce material for their own publications, as long as they are not being sold commercially. As copyright holders, ODI, OCI and IISD request due acknowledgement and a copy of the publication. For online use, we ask readers to link to the original resource on the ODI website. The views presented in this paper are those of the author(s) and do not necessarily represent the views of ODI, OCI or IISD. © Overseas Development Institute, Oil Change International and International Institute for Sustainable Development 2015. This work is licensed under a Creative Commons Attribution-NonCommercial Licence (CC BY-NC 4.0).
International Institute for Sustainable Development111 Lombard Avenue, Suite 325Winnipeg, Manitoba, Canada R3B 0T4Tel: +1 (204) 958-7700Fax: +1 (204) [email protected]
10 G20 subsidies to oil, gas and coal production