(f’,,,) ridge hollow clay tile walls - digital library/67531/metadc623853/m2/1/high...as part of...
TRANSCRIPT
Y-I 2
COMPRESSIVE STRENGTH OF MASONRY (f’,,,)
HOLLOW CLAY TILE WALLS FOR THE OAK RIDGE Y-12 PLANT
April17, 1995
Prepared for the Center for Natural Phenomena Engineering
Oak Ridge Y-12 Plant Oak Ridge, TN 37831-8169
managed by Lockheed Martin Energy Systems, Inc.
for the U. S. Department of Energy
under contract DE-AC05-840R2 1400
0 ISCLAIME R
This report was prepared as an account of work sponsored by an agency of the United States Government. Neither the United States Government nor any agency thereof, nor any of their employees, makes any warranty, express or implied, or assumes any legal liability or responsibility for the accuracy, completeness, or use- fulness of any information, apparatus, product, or process disclosed, or represents that i t s use would not infringe privately owned rights. Reference herein t o any specific commercial product, process, or service by trade name, trademark, manu- facturer, or otherwise, does not necessarily constitute or imply i ts endorsement, recommendation, or favoring by the United States Government or any agency thereof. The views and opinions of authors expressed herein do not necessarily state or reflect those of the United States Government or any agency thereof.
Portions of this dormmmf m y be iDegible in electronic image products. fmapcr are! produced from the best avaiIable original dOl.nment

YEN-5346
COMPRESSIVE STRENGTH OF MASONRY (f',,,)
HOLLOW CLAY TILE WALLS FOR THE OAK RIDGE Y-12 PLANT
April17, 1995
Prepared by Kenneth E. Fricke
and Roger D. Flanagan
Lockheed Martin Energy Systems, Inc. Oak Ridge, Tennessee
Prepared for the Center for Natural Phenomena Engineering
Oak Ridge Y-12 Plant Oak Ridge, TN 37831-8169
managed by Lockheed Martin Energy Systems, Inc.
for the U. S. Department of Energy
under contract DE-AC05-840R21400
CONTENTS
1 .
2 .
COMPRESSIVE STRENGTH OF MASONRY (f,) FOR THE OAK RIDGE Y-12 PLANT HOLLOW CLAY TILE WALLS . . . . . . . . . . . . . . . . . . . . . . . . . . . . . . . . . . . . 1 1.1 SUMMARY OF DATA ............................................. 1 1.2 DISCUSSION OF RESULTS ........................................ 2
REFERENCES ......................................................... 5
TABLES
(f) eff Determination for 8.in . Walls .............................................. 1
( f ) eff Determination for 13.in . Walls .............................................. 2
Recommended ( f ) eK Values for HCT Walls ........................................ 4
i
1. COMPRESSIVE STRENGTH OF MASONRY (f;) FOR THE OAK RIDGE Y-12 PLANT HOLLOW CLAY TILE WALLS
1.1 SUMMARY OF DATA
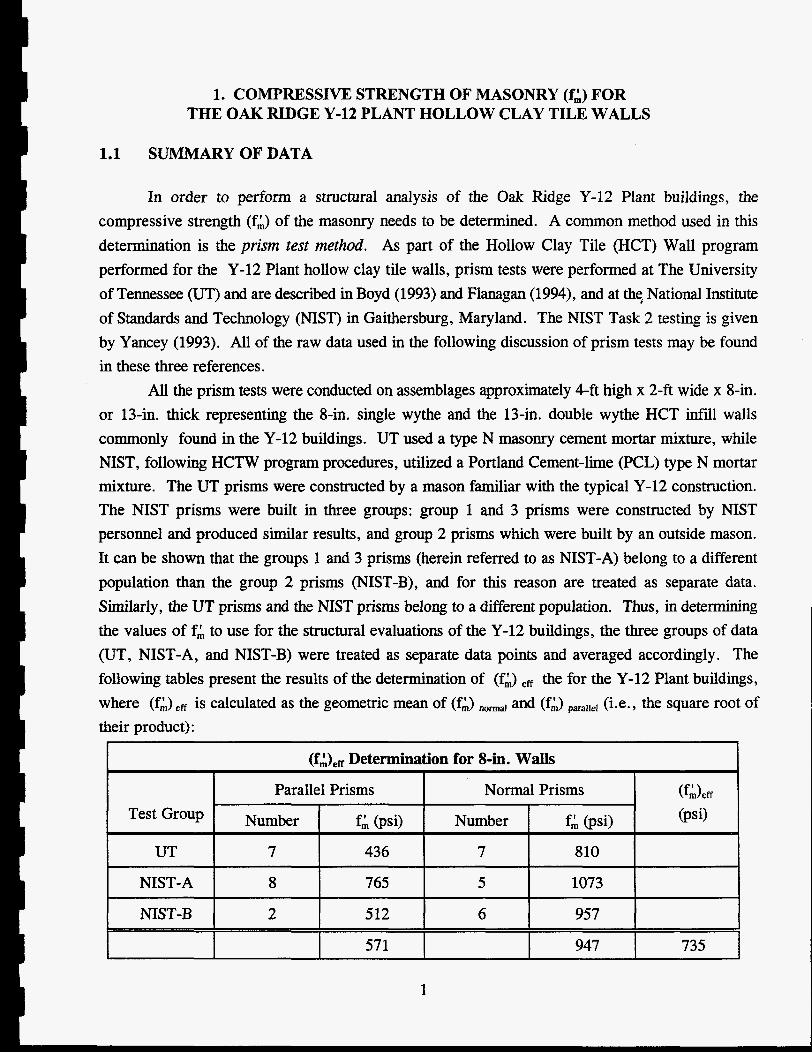
In order to perform a structural analysis of the Oak Ridge Y-12 Plant buildings, the compressive strength ( f2 of the masonry needs to be determined. A common method used in this determination is the prism test method. As part of the Hollow Clay Tile (HCT) Wall program performed for the Y-12 Plant hollow clay tile walls, prism tests were performed at The University of Tennessee (UT) and are described in Boyd (1993) and Flanagan (1994), and at thq National Institute of Standards and Technology (NIST) in Gaithersburg, Maryland. The NIST Task 2 testing is given by Yancey (1993). All of the raw data used in the following discussion of prism tests may be found in these three references.
All the prism tests were conducted on assemblages approximately 4-ft high x 2-ft wide x &in. or 13411. thick representing the 8-in. single wythe and the 13-in. double wythe HCT infill walls commonly found in the Y-12 buildings. UT used a type N masonry cement mortar mixture, while NIST, following HCTW program procedures, utilized a Portland Cement-lime (PCL) type N mortar mixture. The UT prisms were constructed by a mason familiar with the typical Y-12 construction. The NIST prisms were built in three groups: group 1 and 3 prisms were constructed by NIST personnel and produced similar results, and group 2 prisms which were built by an outside mason. It can be shown that the groups 1 and 3 prisms (herein referred to as NIST-A) belong to a different population than the group 2 prisms (NIST-B), and for this reason are treated as separate data. Similarly, the UT prisms and the NIST prisms belong to a different population. Thus, in determining the values off; to use for the structural evaluations of the Y-12 buildings, the three groups of data (UT, NIST-A, and NIST-B) were treated as separate data points and averaged accordingly. The following tables present the results of the determination of (f;) eff the for the Y-12 Plant buildings, where (f;)eff is calculated as the geometric mean of (f;) (Le., the square root of their product):
and (f;)
(f,&.n Determination for 8-in. Walls
Parallel Prisms Normal Prisms ( f2ef f
f; (psi) (Psi) f; (psi) Number Test Group Number
UT 7 436 7 810
NIST-A 8 765 5 1073
NIST-B 2 5 12 6 957 ~~~ ~ ___ ---- ____
571 947 735
1
1.2 DISCUSSION OF RESULTS
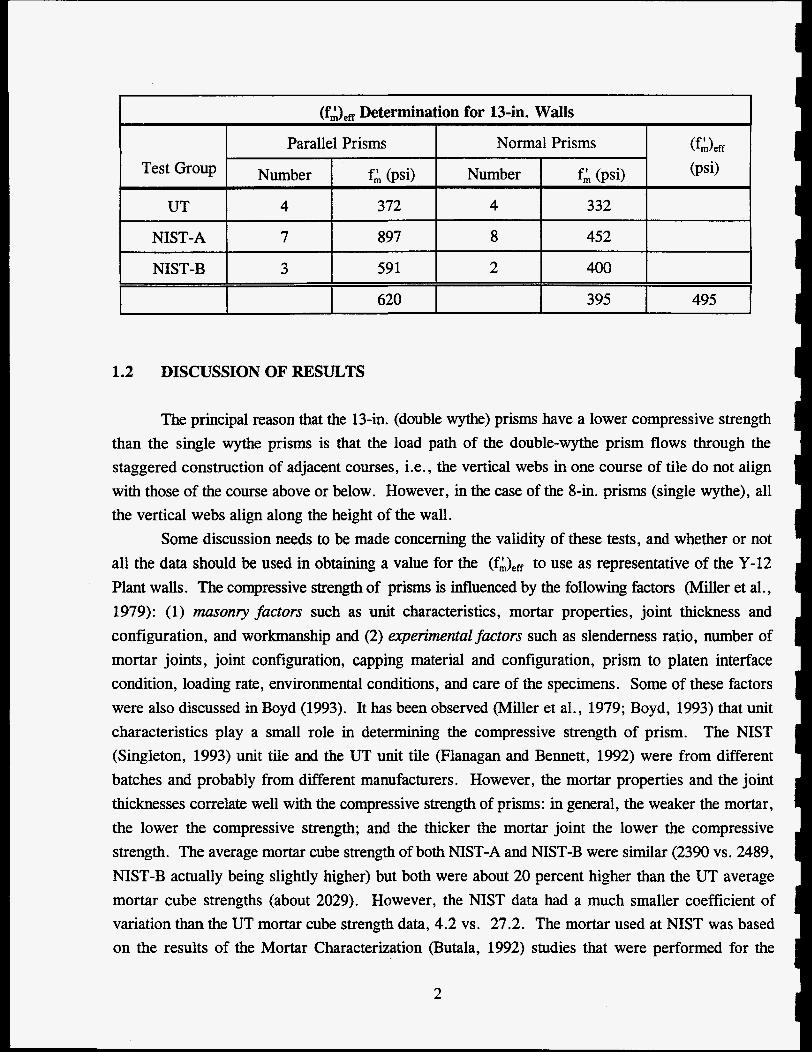
The principal reason that the 13-in. (double wythe) prisms have a lower compressive strength than the single wythe prisms is that the load path of the double-wythe prism flows through the staggered construction of adjacent courses, Le., the vertical webs in one course of tile do not align with those of the course above or below. However, in the case of the 8-in. prisms (single wythe), all the vertical webs align along the height of the wall.
Some discussion needs to be made concerning the validity of these tests, and whether or not all the data should be used in obtaining a value for the (f&fi to use as representative of the Y-12 Plant walls. The compressive strength of prisms is influenced by the following factors (Miller et al., 1979): (1) musonry factors such as unit characteristics, mortar properties, joint thickness and configuration, and workmanship and (2) experimental factors such as slenderness ratio, number of mortar joints, joint configuration, capping material and configuration, prism to platen interface condition, loading rate, environmental conditions, and care of the specimens. Some of these factors were also discussed in Boyd (1993). It has been observed (Miller et al., 1979; Boyd, 1993) that unit characteristics play a small role in determining the compressive strength of prism. The NIST (Singleton, 1993) unit tile and the UT unit tile (Flanagan and Bennett, 1992) were from different batches and probably from different manufacturers. However, the mortar properties and the joint thicknesses correlate well with the compressive strength of prisms: in general, the weaker the mortar, the lower the compressive strength; and the thicker the mortar joint the lower the compressive strength. The average mortar cube strength of both NIST-A and NIST-B were similar (2390 vs. 2489, NIST-B actually being slightly higher) but both were about 20 percent higher than the UT average mortar cube strengths (about 2029). However, the NIST data had a much smaller coefficient of variation than the UT mortar cube strength data, 4.2 vs. 27.2. The mortar used at NIST was based on the results of the Mortar Characterization (Butala, 1992) studies that were performed for the
2
HCTW program, and from which a general, Type N, Portland Cement-lime mortar mix was developed. The NIST-A group adhered tightly to the program approved procedure, whereas the NIST-B mason used less water, producing a stiffer and less workable mix (Yancey, 1993), and observations of the mortar joint revealed more voids and hairline cracks than were noticed in the NET-A prisms. Yancey does state that he feels that the NIST-B workmanship is probably more typical of field construction practices (though he was not specifically familiar with the Y-12 HCT construction). On the other hand, the UT mortar used a mortar cement Type-N mixture, which is probably more typical of recent mortar than 1940's and 1950's mortar. The UT prisms were built by a mason employed for many years at the Y-12 Plant, and who was familiar with the HCTW testing program. The NIST prisms were built to specifications prepared based on a rough average of what existed in the Y-12 Plant walls. However, the mortar bed thicknesses of the UT prisms were thicker than those used in the NIST prisms. A comparison of the data (Boyd, 1993 and Yancey, 1993) supports this statement. The average height of 8-in. UT normal prisms is 48.2-in. as compared to 47.9-in. at NIST. For parallel prisms the numbers are similar, 48.1-in. (UT) vs. 47.4-in. (NIST). Since the tile data shows that the heights and lengths of the UT (Flanagan and Bennett, 1992) and the NIST (Singleton, 1993) tile are similar, each bed joint (of a normal prism) or head joint (of a parallel prism) at UT was thicker than the same joint in a NIST prism by 1/16" to 3/16". The thicker mortar joints, coupled with the much larger variation in the mortar cube strengths and the use of masonry cement instead of the PCL mortar may account for the lower compressive strengths produced by the UT prism tests.
In addition, the capping procedures used at NIST differed significantly from those employed at UT. The test procedure (Fricke and Butala, 1992) required capping to be in accordance with ASTM specifications, including levelness and flatness requirements. We know that the NIST prisms met these requirements, while the capping procedures used at UT did not specifically attempt to meet the exact requirements, though care was used in the UT capping procedures and the principal researchers were well acquainted with the importance of obtaining a good cap. The capping procedure used at UT is described in Boyd on page 38. While the top cap procedure was fairly tedious, if the researchers were not satisfied with the capping results, the cap was removed and the capping step repeated. Flanagan has verbally indicated that no premature failures of the prisms were noted that could be directly related to a cap, Le., the load seemed to be distributed fairly uniformly.
Finally, the (f:) eff factor will be used in a formula to determine the capacity of the element in question. This formula will have the form
where t eff is the effective width of the element, K is a constant to be determined from the infill wall tests, R is a reduction factor (about 3/4) applied directly to the (f:) eff term, and 4 is the capacity reduction factor. These last two are intended to reduce the possibility of overpredicting the member capacity. Considering that the NIST tests were intended to produce a value for f: for the analysis,
Capacity = @{ (f:) eff x R} x (t efJ x K
3
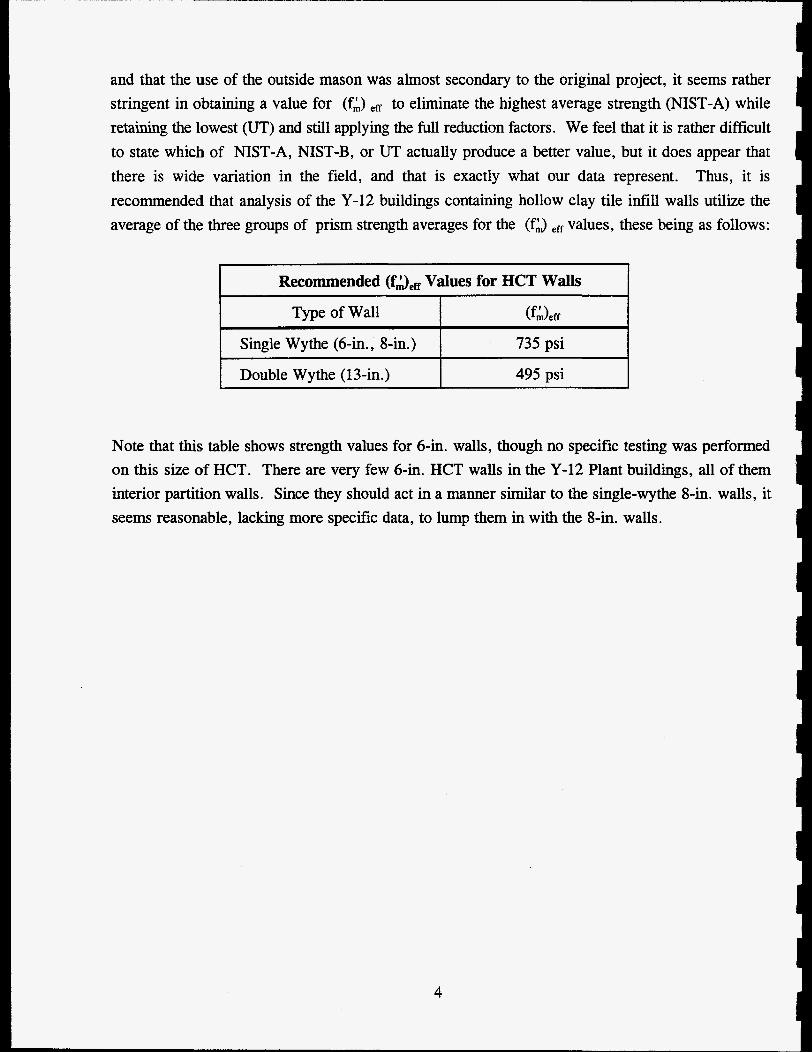
and that the use of the outside mason was almost secondary to the original project, it seems rather stringent in obtaining a value for (fk) eff to eliminate the highest average strength (NIST-A) while retaining the lowest (UT) and still applying the full reduction factors. We feel that it is rather difficult to state which of NIST-A, NIST-B, or UT actually produce a better value, but it does appear that there is wide variation in the field, and that is exactly what our data represent. Thus, it is recommended that analysis of the Y-12 buildings containing hollow clay tile infill walls utilize the average of the three groups of prism strength averages for the (fa eff values, these being as follows:
Type of Wall
I Double Wythe (13411.) I 495 psi I I Note that this table shows strength values for 6-in. walls, though no specific testing was performed on this size of HCT. There are very few 6-in. HCT walls in the Y-12 Plant buildings, all of them interior partition walls. Since they should act in a manner similar to the single-wythe 8-in. walls, it seem reasonable, lacking more specific data, to lump them in with the 8-in. walls.
I
4
2. REFERENCES
Boyd, K. A. 1993. “Compressive Strength and Constitutive Behavior of Clay Tile Prisms ”, Masters Thesis, The University of Tennessee, Knoxville, TN.
Butala, M. B. 1992. Mortar Characterization Study of Unreinforced Hollow Clay Tile Masonry, Y/EN-4675, Martin Marietta Energy Systems, Inc., Oak Ridge Y-12 Plant, Oak Ridge, Tennessee.
Flanagan, R. D. and Bennett, R.D. 1991. Structural Testing of Hollow Clay Tile Units - Volume 1, Y/EN4536/Vl, Martin Marietta Energy Systems, Inc., Oak Ridge Y-12 Plant, Oak Ridge, Tennessee.
Flanagan, R. D. 1994. “Behavior of Structural Clay Tile Infilled Frames”, Doctoral Dissertation, The University of Tennessee, Knoxville, TN.
Fricke, K. E. and Butala, M. B. 1992. Test Procedure for Prism Compression Testing /$or prisms tested outside of MMES] , Y/EN-4595/Rl, Martin Marietta Energy Systems, Inc., Oak Ridge, Y-12 Plant, Oak Ridge, Tennessee.
Miller, D. E., Noland, J. L., and Feng, C. C. 1979. “Factors Influencing the Compressive Strength of Hollow Clay Unit Prism’’ in Proceedings, 5th Internationul Brick Masonry Conference, Washington, D.C.
Singleton Laboratories. 1993. Final Report of the Hollow Clay Tile Test Program: Unit Tile Testing, Volumes 1 and 2.
Yancey, C. W. C. 1993. “Hollow Clay Tile Wall Prism Tests Report for Martin Marietta Energy Systems - Task 2,” National Institute for Standards and Technology, Y/EN-5083, Martin Marietta Energy Systems, Inc., Oak Ridge Y-12 Plant, Oak Ridge, Tennessee.
5
YIEN-5346
INTERNAL DISTRIBUTION
R. D. Flanagan M. S. Guthrie (2) K. E. Shaffer File-KEF-RC Y-12 Central Files-RC (2) CNPE Library (5)
EXTERNAL DISTRIBUTION
A. K. Lee/DOE-OSTI, 9731, MS-8175 (2),
Gilbert Commonwealth, Inc. (2), Oak Ridge, Tennessee