effectiveness of chickpea based ready-to-use … hailu.pdfconference place –addis ababa by:...
TRANSCRIPT

Conference place – Addis Ababa By: Tesfaye Hailu (EPHI)
Effectiveness of Chickpea based Ready-to-use-Supplementary Feeds, Super Cereal, and Super Cereal PLUS for Management of
Moderate Acute Malnutrition (MAM)
A cluster randomize controlled trial involving Ethiopian children aged 6–59 months with MAM

Content
• Introduction
• Method
• Result and Discussion
• Conclusion
• Recommendation
• Acknowledgement

Introduction• Globally MAM affects a total of 11% of children
under the age of 5 years.
• In Ethiopia, overall 12.5% of under-five children arewasted and 9.7% are moderately wasted.
• Moderately wasted children are typically givenfortified corn-soy blended flour (CSB).
• However, CSB has been reported to be nutritionalinappropriate and inadequate in treating of acutemoderate malnutrition in children
Introduction
• In a study conducted in Ethiopia in 2012 byTsinuel, Mekitie, and Fessahaye, a recovery rateof 64.4% was recorded which was below theSPHERE standards of 75% for supplementaryfeeding programmes.
• RUSF on the other hand have been indicated foruse in supplementary feeding programs as atreatment for moderate acute malnutrition, andan alternative to fortified blended flour (CSB).

Objectives
General• To evaluate the effectiveness in terms of nutritional
outcomes and cost of Chickpea Based Ready-to-use-Supplementary Feeds (C-RUSF and CMS-RUSF), andSuper Cereal PLUS(CSB++) as compared to SuperCereal( CSB+) for the Management of MAM inEthiopia

Specific objectives• To determine the recovery rates of children with moderate acute
malnutrition (MAM)
• To determine the rate of weight gain of children with moderate acutemalnutrition ( MAM)
• To determine the time of recovery of children with moderate acutemalnutrition ( MAM)
• To assess programme performance rates for each intervention arm interms of rates of recovery, transfer, default, death and non-responsecomparing them against the SPHERE standards;
• To explore the knowledge, attitude and practices of caregivers for eachof the four products including preparation and sharing;
• Explore the beneficiaries’ and their caregivers’ perceptions of eachcommodity; and
• To determine and compare cost of the products in terms of cost perbeneficiary, product, storage and transport costs; length of treatment andtime required for recovery of children

Methodology• Cluster randomized controlled effectiveness trial• Amhara, Oromia, SNNPR and Tigray using the 4 study
products– High prevalence of MAM compared to other regions;– High number of OTP sites; and– Food insecurity hotspot 2 prioritization.
• From each woreda,– Two health centres were randomly selected based on
Woreda Health Office (WOHO) report on the incidence ofchild malnutrition.• For each of the selected Health Centres, four Health
Posts (clusters) were selected based on the number ofmalnourished children identified in the 3 months priorto the study.

Regions and Respective Zones and Woredas for the Study
Region Zone Selected Woreda Health CentersNumber of Health
Posts (Clusters)
Amhara
North Wollo Ambasel/Tenta Mariye&Fito 8
North Wollo Kutaber Kutaber&Kundi 8
North Wollo Sayint Adjibar&Euwa 8
OromiyaWest Arsi Hitossa Itaya&Welarge 8
West Arsi ZewyDugda Ogalcho&Kiyansho 8
SNNPR
Gedeo Wonago Mekonisa&Hasseharo 8
Gedeo DillaZuriya Tuticha&Uddo 12
Gedeo Kochore Beloya&Chelaliktu 8
Tigray
Southern Ofla Hashengie&Fala 8
Southern Endamohonie Meswaeti&Neksegie 8
Southern EmbaAlaje Bora &Silawa/Adishu 12
Total 4 11 22 96

Methodology
• Enrolment of the study participants was based on:
– Mid Upper Arm Circumference (MUAC) ofbetween greater than or equal to 11 cm and lessthan 12.5cm with no bilateral oedema;
• Therefore the primary indicator used foradmission and discharge was MUAC 11-12.5cm.

MethodologyInclusion• All children aged 6 to 59 months of age identified as moderately
malnourished based on MUAC screening measurement of (> 11 - <12) and/or WHZ of <-2 and > -3 without bipedal pitting oedema.
Exclusion• Children identified as severely malnourished based on MUAC
screening <11cm and/or bilateral oedema;• Children with any illness or clinical condition that would have
prevented them from safely ingesting the study food. Children weretherefore assessed upon enrolment for any complicated clinicalcondition such as oedema, malaria, ARI, vomiting, diarrhoea(defined as 3 or more watery stools in 24hours), and lack ofappetite that would require medical attention;
• Chronic debilitating illness including congenital or acquiredmalformations;
• Children in Outpatient Therapeutic Programme; and• Children already enrolled and participating in the TSF programme.

Sample Size
• Formula of calculating sample size was:
• n = [(Zα + Zβ)2 × {(p1 (1-p1) + (p2 (1-p2)}]/(p1 - p2)2
Where:
• n = sample size required in each group;
• p1 = proportion of subject recovered by SC/oil = 0.644;
• p2 = proportion of subject cured by RUSF = 0.724;
• p1-p2 = clinically significant difference = 0.08;
• Zα: Level of significance, for 5% which is 1.64; and
• Zβ: Power, for 80% which is 0.84
• 2,425 children aged 6 to 59months (606/ product)

Methodology
Overall Region Woreda Kebele
(Clusters)
Sample size for
children
2,425 606 152 25
Study sites 4 12 96

Formula and Nutritive Value for the Chickpea Based RUSF
Supplementary Feed Chickpea Chickpea + maize + soy
Proportion of Ingredients (%) per 100gms
Chickpeas 32.8 31.3
Maize - 16.1
Soy Flour - 8
Soy oil 9 16.9
Palmolein oil 19 7.8
Dry Skim Milk 20 7.9
Sugar 15 9.9
Premix 1.75 1.75
Nutritional Vale
Energy (Kcal) 521 507
Protein (g) 15 13.7
Fat (g) 32.3 31.3
Iron (g) 13.6 14.3
Vitamin A 2,061.2 2060.5
Cost per Metric Tonne
Cost per Metric Tonne (USD) 2,317.3 1,617.3

Composition of Super Cereal and Super
Cereal PLUS
IngredientsValues (%)
Super Cereal PLUS Super Cereal
Corn 58.24 78.24
Soybean (de-hulled) 20 20
Soybean oil 3 -
Dry Skimmed Milk 8 -
Sugar 9 -
Vitamin/mineral mix 0.2 0.2
Ca (H2PO4)2. Water 0.8 0.8
Potassium Chloride 0.76 0.76

Nutritional Composition of Super Cereal
and Super Cereal PLUS
ParameterValues
Super Cereal PLUS Super Cereal
Protein (%) MinVegetable source 13.5 14Animal source 2.5 -
Fat (%) Min 9 6Fibre (%) Max 2.9 5Moisture (%) Max 7 10Aflatoxin MAX 5ppb 20ppdBostwick mm/30 sec(450C)
100mm (50g/250g water) 90Kcal/100ml
porridge
55mm (40g/250g water) 60Kcal/100ml
porridge
Approximate cost perMetric Ton
$1,280 $1,657 (Including oil)

Amount of food required per study subject per product
Treatment
food
Amount per
Day
Amount per
week
Amount for 12
weeks per child
Total for 12 weeks for
the entire study
CMS-RUSF1 sachet
(100gms)
7 sachets
(100gms)
84 sachets
(100gms)
74,592 sachets
(100gms)
C-RUSF1 sachet
(100gms)
7 sachets
(100gms)
84 sachets
(100gms)
74,592 sachets
(100gms)
Super CerealSC (200gms)
and Oil (33mls)
SC (1.4kgs) and
Oil (231mls)
SC (18kgs) and
Oil (19.4lts)
14,919kgs
(1.5tonnes)SC
17.227lts Oil
Super Cereal-
PLUS200gms 1.5kgs 16.8kgs
15,984kgs (1.6tonnes)

Methodology
• All the required information from the individual child was recordedon the Individual questionnaire and subsequently TSF IndividualCard
• The variables assessed included: – Age: – Sex: – Weight:– Height/Length:– Mid-Upper Arm Circumference (MUAC): – Bilateral oedema:– Vaccination in children 6-59months– Child already enrolled in selective feeding programme– Vitamin A supplementation in last 6months– Morbidity in last 2weeks

Methodology
• MAM received the routine medications as perthe national protocol
– Anthelminthic (Albendazole/Mebendazole,
– Vitamin A and
– Routine immunization
• Dietary treatment, nutrition counseling,follow-up (weekly visit) and exit

Methodology
• Data Collection Methods– MUAC Screening Tool
– Referral slips
– Individual questionnaire
– TSF Individual treatment card
– TSF Ration card
– TSF Register
– Home visit tool
– Site Tally Sheet
– Monthly region reporting form
• Qualitative Data collection – FGD

Study Team size
National Regional Woreda Kebele
Study number 4 12 96
Study team
Principal
Investigator
1 - - -
Coordinator(s) - 10 - -
Supervisor(s) - - 12 -
Enumerators - - - 96
Statisticians 2
Total 3 10 12 96

Methodology
• Training and Pre-testing
• Consent
• Ethical Clearance - Scientific and Ethical Review Office (SERO) of EPHI

Result and Discussion
Variable Recovery rate by product type
SC+ SC Formula-1 Formula-2Recovery rate by sex
Male 42.9 37.2 31.1 34.3
Female 41.3 32.7 33.9 33.0
Recovery rate by age 6 - 11 Months 52.5 36.4 37.7 28.7
12 - 23 Months 40.2 36.9 34.3 32.6
24 - 35 Months 36.4% 33.3% 28.7% 32.6%
36 - 59 Months 41.2% 27.8% 28.1% 22.7%
Total 42.0% 34.7% 32.6% 33.5%
Table 1: distribution of recovered children by sex and age

Result and Discussion
Variable Type of products
SC+ SC Formula
1
Formula
2
Mean time of
recovery in week
7.87 8.02 7.76 7.65
95% CI Lower
bound
7.48 7.59 7.38 7.21
Upper
bound
8.25 8.45 8.15 7.69
Table 2: Mean time of recovery by product

Result and Discussion
Follow
up
Weeks
Product Type
SC+ SC Formula-1 Formula-2
N
Mean Wt.
gain/kg N
Mean Wt.
gain/kg N
Mean Wt.
gain/kg N
Mean Wt.
gain/kg
Week1 589 .20 554 .14 517 .14 552 .16
Week2 590 .32 542 .25 510 .24 536 .26
Week3 591 .40 543 .31 505 .33 534 .36
Week4 590 .51 540 .37 491 .42 524 .43
Week5 602 .56 528 .43 480 .49 508 .50
Week6 584 .63 540 .51 470 .56 512 .57
Week7 574 .68 523 .57 459 .64 486 .64
Week8 567 .75 510 .61 458 .68 464 .69
Week9 563 .79 492 .65 436 .75 472 .75
Week10 542 .85 479 .72 431 .80 457 .80
Week11 533 .88 485 .79 425 .84 434 .85
Week12 517 .95 485 .87 419 .89 434 .89
Table 3. Average change of anthropometric measurements (weight, height and MUAC) by products
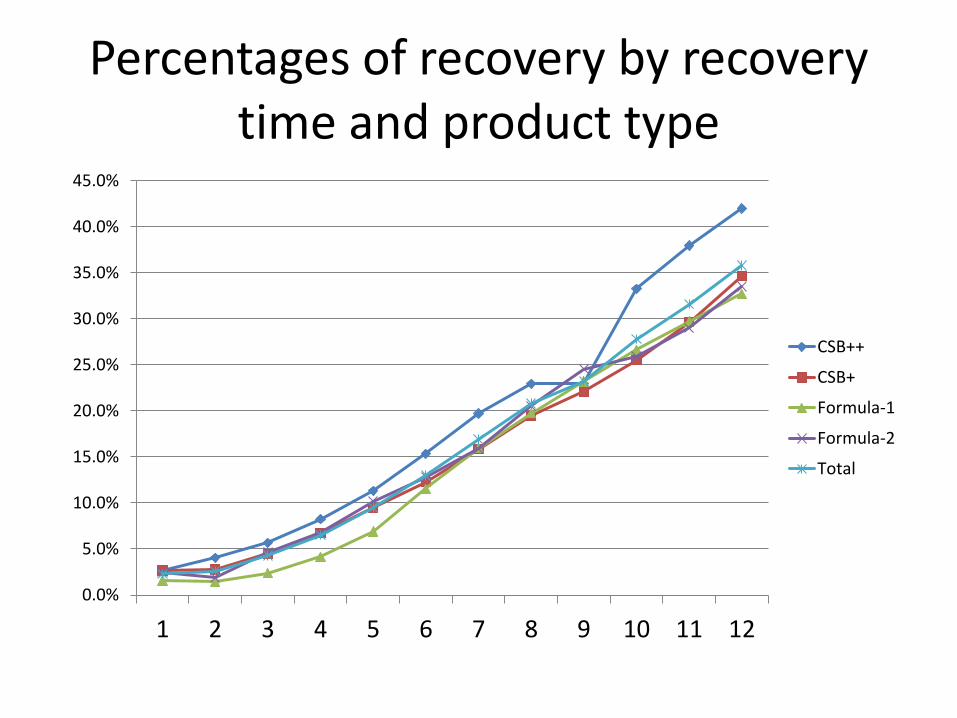
Percentages of recovery by recovery time and product type
0.0%
5.0%
10.0%
15.0%
20.0%
25.0%
30.0%
35.0%
40.0%
45.0%
1 2 3 4 5 6 7 8 9 10 11 12
CSB++
CSB+
Formula-1
Formula-2
Total

Outcomes % (95% CI) Product Type Total
SC+ SC Formula-1 Formula-2
Recovery N 618 580 554 579 2331
Percent (%) 42.1 34.7 32.7 33.5 35.9
95% CI [38.2,46.0] [30.9, 38.6] [28.9, 36.7] [29.8, 37.5] [33.9, 37.8]
Developme
nt of SAM
N 609 571 551 576 2307
Percent (%) 9.5 6.0 6.0 9.4 7.8
95% CI [7.4, 12.1] [4.3, 8.2] [4.3, 8.3] [7.2, 12.0] [6.7, 8.9]
Non-
Recovery
N 618 580 554 579 2331
Percent (%) 57.9 65.3 67.3 66.5 64.1
95% CI [54.0, 61.8] [61.4, 69.1] [63.3, 71.1] [62.5, 70.2] [62.2, 66.1]
Death N 2344 2344 2344 2344 2344
Percent (%) 0.0 0.0 0.0 0.0 0.0
Default N 621 582 557 584 2344
Percent (%) 1.3 1.7 4.7 4.5 3.0
95% CI [0.7, 2.6] [0.9, 3.2] [3.2, 6.8] [3.0, 6.5] [2.4, 3.8]
Program performance indicator by product type

33%
13%26%
28%
household Foodsecured
household Mild foodinsecure
householdModerately foodinsecure
household Severelyfood insecure
Household food security Status N=2010

Estimated cost per each arm
List of products Cohort
Product cost
of recovery
per child
Cost
Product 1 (SC+) 606 16.23 9835.09Product 2 (SC and
Oil) 606 10.50 6365.16Product 3
(Formula-1) 606 15.77 9559.36Product 4
(Formula-2) 606 12.22 7405.39

Limitation
• Withdrawal of Somali region due to unable to find enough eligible MAM children
• One of the inclusion criteria to select woreda was no TSF program currently exists in the area. The study woreda don’t have a system of implementing TSF program and behavioral change communication is require longer time than what was given during the study period (3 months).
• The study was done during the huger season. Hence, this condition increases the probability of sharing and not providing additional food for the study subjects.

Conclusion • The mean MUAC of the children ranges from 11.6-11.7 cm with an average
of 11.6 cm. The average weight of the children is 7.9 kg
• There is no significant difference between the mean weight, MUAC of thechildren across the products (P > 0.05).
• Statistically significant recovery rate (42%) observed in Super-cereal plus(SC+) than the other three products; SC, formula 1 and formula 2.
• There is no statistically significant difference on mean weight changeamong the products.
• The more vulnerable age group for moderately acute malnutrition is thehighest probability to react for treatment timely.
• Following the recommended ICER procedure for cost effectiveness, SC andSC+ were strongly dominated and eliminated along the step-wise costeffectiveness ratio calculation. Finally, the ICER for Formula 2 was very lowas compared to formula 1.

Recommendation
• The study revealed that, SC+ has statisticallysignificant higher rate of recovery comparedwith SC, formula 1 and 2. However, there is nosignificant difference among SC, formula 1 and2 in terms of recovery rate.
• Further study among the three products (SC, formula 1 and 2) under control setup like animal trial is recommended.

Acknowledgement
• WFP
• EPHI staff
• Study participants
• Data collectors and supervisors

Thank you