2017 participation report - home - physical activity...
TRANSCRIPT
2018 PARTICIPATION REPORT
The Physical Activity Council’s annual study tracking
sports, fitness, and recreation participation in the US
TABLE OF CONTENTS
20
18
Ph
ysic
al
Acti
vit
y C
ou
ncil
Pa
rti
cip
ati
on
Re
po
rt
Your guide through the 2018 Participation Report
Methodology 3
Physical Activity Council (PAC) 4
Overview 5
Overall Participation Rate in the US 6-9
Activity Level Trends 6
2011 – 2016 Participation Trends 7
Participation by Generation 8-9
Overall Inactivity Levels in the US 10-12
2011 – 2016 Inactivity Trends 10
Inactivity by Age 11
Inactivity by Income 12
Aspirational Participants and PE Participation 13-15
Non-Participation Interest 13-14
The PE Pathway 15
Appendix 1: Sports Categorized 16
Appendix 2: Activity Levels 172
METHODOLOGY
20
18
Ph
ysic
al
Acti
vit
y C
ou
ncil
Pa
rti
cip
ati
on
Re
po
rt
3
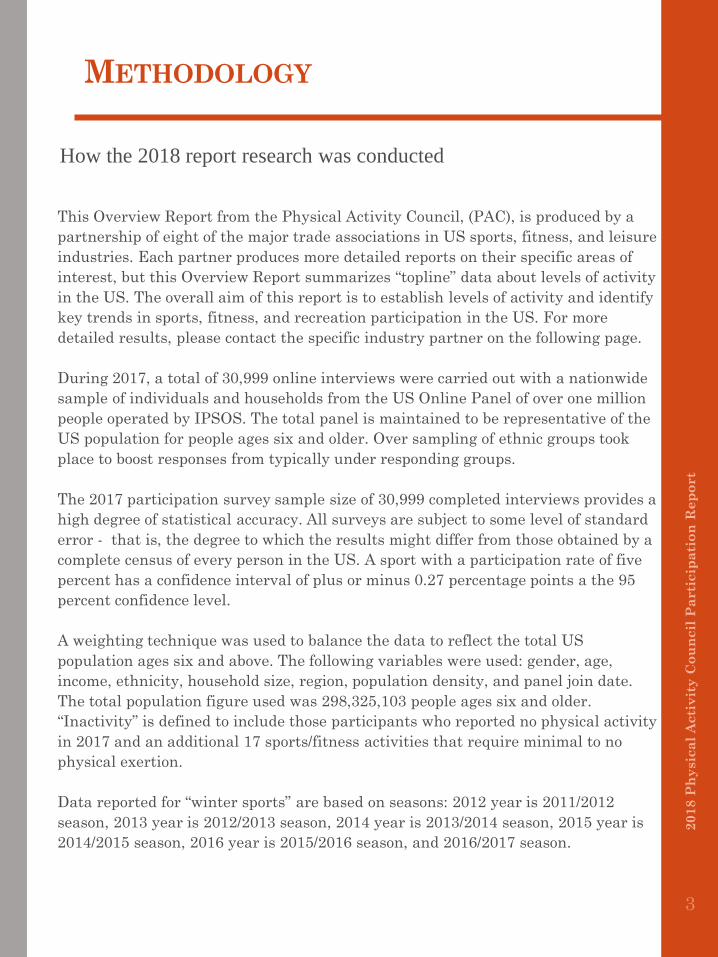
This Overview Report from the Physical Activity Council, (PAC), is produced by a
partnership of eight of the major trade associations in US sports, fitness, and leisure
industries. Each partner produces more detailed reports on their specific areas of
interest, but this Overview Report summarizes “topline” data about levels of activity
in the US. The overall aim of this report is to establish levels of activity and identify
key trends in sports, fitness, and recreation participation in the US. For more
detailed results, please contact the specific industry partner on the following page.
During 2017, a total of 30,999 online interviews were carried out with a nationwide
sample of individuals and households from the US Online Panel of over one million
people operated by IPSOS. The total panel is maintained to be representative of the
US population for people ages six and older. Over sampling of ethnic groups took
place to boost responses from typically under responding groups.
The 2017 participation survey sample size of 30,999 completed interviews provides a
high degree of statistical accuracy. All surveys are subject to some level of standard
error - that is, the degree to which the results might differ from those obtained by a
complete census of every person in the US. A sport with a participation rate of five
percent has a confidence interval of plus or minus 0.27 percentage points a the 95
percent confidence level.
A weighting technique was used to balance the data to reflect the total US
population ages six and above. The following variables were used: gender, age,
income, ethnicity, household size, region, population density, and panel join date.
The total population figure used was 298,325,103 people ages six and older.
“Inactivity” is defined to include those participants who reported no physical activity
in 2017 and an additional 17 sports/fitness activities that require minimal to no
physical exertion.
Data reported for “winter sports” are based on seasons: 2012 year is 2011/2012
season, 2013 year is 2012/2013 season, 2014 year is 2013/2014 season, 2015 year is
2014/2015 season, 2016 year is 2015/2016 season, and 2016/2017 season.
How the 2018 report research was conducted

PHYSICAL ACTIVITY COUNCIL (PAC)
20
18
Ph
ysic
al
Acti
vit
y C
ou
ncil
Pa
rti
cip
ati
on
Re
po
rt
4
More about the PAC and further research
Each year, the Physical Activity Council (PAC) conducts the largest single-source
research study of sports, recreation and leisure activity participation in the nation. The
PAC is made up of eight of the leading sports and manufacturer associations that are
dedicated to growing participation in their respective sports and activities.
These leading trade and industry organizations are dedicated to providing the most
comprehensive, accurate, and actionable database of sports participation data. The
respondents come from a panel of over one million Americans and are managed by
IPSOS. The study looks at 123 different sports and activities in a variety of sub
categories including, but not limited to: team and individual sports, outdoor sports and
activities like camping, hunting, and fishing; fitness and exercise, action sports, golf,
tennis, and much more.
The data, dating back as far as 2007, is representative of the US population ages six and
older. Universally accepted research practices are used to ensure data is obtained from
traditionally under responding segments of the population. Please contact any of the
individual members of the PAC or Sports Marketing Surveys to learn more about the
study and other available data.
If you have specific questions regarding the methodology, please contact Sports
Marketing Surveys USA at [email protected] or (561) 427-0647.
The Physical Activity Council is made up of the following industry leading organizations:
➢ CLUB/INSTITUTIONAL FITNESS: International Health, Racquet, and Sportsclub
Association (IHRSA) www.ihrsa.org P: (617) 951-0055
➢ GOLF: National Golf Foundation (NGF) www.ngf.org P: (561) 744-6006
➢ OUTDOOR ACTIVITIES/SPORTS: Outdoor Foundation (OF)
www.outdoorfoundation.org P: (202) 271-3252
➢ SNOW SPORTS: Snowsports Industries of America (SIA) www.snowsports.org P:
(435) 657-5140
➢ TEAM SPORTS/INDIVIDUAL SPORTS/GENERAL FITNESS/WATER SPORTS: Sports &
Fitness Industry Association (SFIA) www.sfia.org P: (301) 495-6321
➢ FOOTBALL: USA Football www.usafootball.com P: (317) 489-4417
➢ TENNIS: Tennis Industry Association (TIA) and United States Tennis Association
(USTA) www.tennisindustry.org P: (843) 686-3036

OVERVIEW
20
18
Ph
ysic
al
Acti
vit
y C
ou
ncil
Pa
rti
cip
ati
on
Re
po
rt
5
An overview of the research and insights into the numbers
The Physical Activity Council’s annual study continued to track participation in
118 sports and fitness activities. This report gives a broad overview of the study.
For more details on specific sports, please contact the specific industry partner.
When looking at how activity played out during 2017, it looks very similar to
2016. While 72% of the U.S. population ages six and over were active, the level of
activity continues to trend towards a lesser frequency. Of the 216.0 million
Americans who were active, well over half, 127.5 million, participated at the
maximum three times a week. Around 62 million participated in low calorie
burning activities (see Appendix 2).
The largest focus of activities continues to be toward fitness sports. Winter sports
gained the most of all categories, increasing 2% over the last year.
Although the rate of inactivity has remained flat for the last 5 years, the number
inactive rose due to population increase. 82.4 million people were inactive in
2017, that was 2.0 million more people when compared to 2012. While the Gen Z
generation are moving towards a slightly more active lifestyle, those 65 and over
are less active than they were in 2012.
The interest in activities has started moving toward outdoor recreation. The top
aspirational activity for all age segments was outside, ranging from camping to
biking to birdwatching. While camping appears to be in the top three in most
segments, solo adventures are becoming a lost art and most people who aspired
to camp will do so if they have someone to do it with. People want to experience
the outdoors, fitness classes, teams sports, etc. with a partner.
ACTIVITY LEVEL TRENDS
20
18
Ph
ysic
al
Acti
vit
y C
ou
ncil
Pa
rti
cip
ati
on
Re
po
rt
6
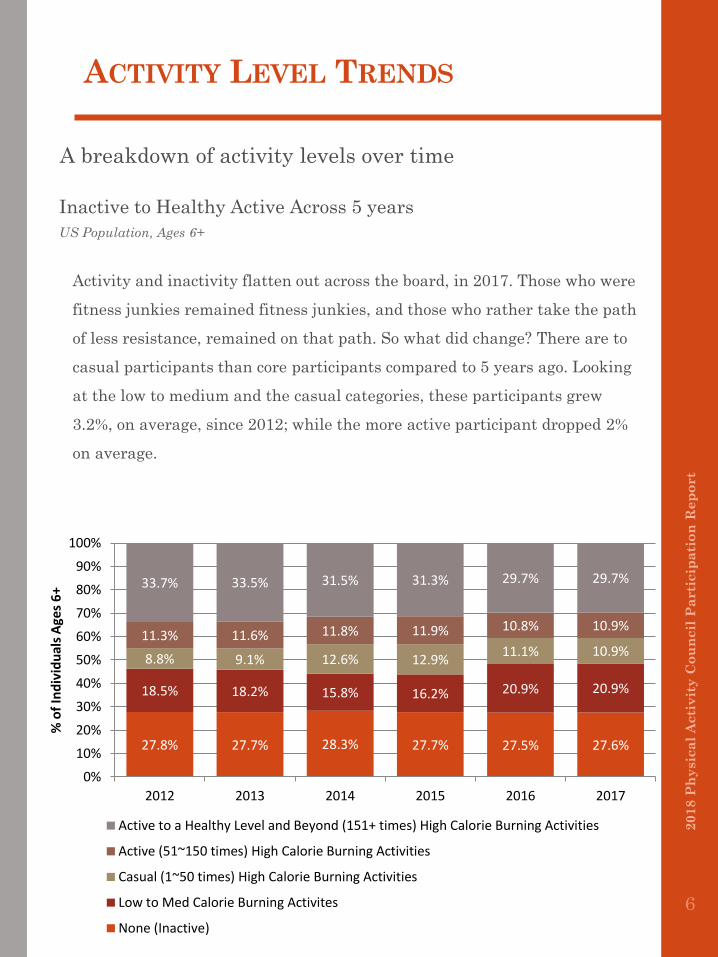
A breakdown of activity levels over time
Inactive to Healthy Active Across 5 years
US Population, Ages 6+
27.8% 27.7% 28.3% 27.7% 27.5% 27.6%
18.5% 18.2% 15.8% 16.2% 20.9% 20.9%
8.8% 9.1% 12.6% 12.9%11.1% 10.9%
11.3% 11.6% 11.8% 11.9% 10.8% 10.9%
33.7% 33.5% 31.5% 31.3% 29.7% 29.7%
0%
10%
20%
30%
40%
50%
60%
70%
80%
90%
100%
2012 2013 2014 2015 2016 2017
% o
f In
div
idu
als
Age
s 6
+
Active to a Healthy Level and Beyond (151+ times) High Calorie Burning Activities
Active (51~150 times) High Calorie Burning Activities
Casual (1~50 times) High Calorie Burning Activities
Low to Med Calorie Burning Activites
None (Inactive)
Activity and inactivity flatten out across the board, in 2017. Those who were
fitness junkies remained fitness junkies, and those who rather take the path
of less resistance, remained on that path. So what did change? There are to
casual participants than core participants compared to 5 years ago. Looking
at the low to medium and the casual categories, these participants grew
3.2%, on average, since 2012; while the more active participant dropped 2%
on average.

2012 - 2017 PARTICIPATION TRENDS
20
18
Ph
ysic
al
Acti
vit
y C
ou
ncil
Pa
rti
cip
ati
on
Re
po
rt
7
A look at physical activity participation by year
Total Participation Rate by Activity Category
US Population, Ages 6+
63.8%
33.7%
49.0%
13.6%
22.9%
13.4%7.7%
0%
10%
20%
30%
40%
50%
60%
70%
FitnessSports
IndividualSports
OutdoorSports
RacquetSports
TeamSports
WaterSports
WinterSports
2012 2013 2014 2015 2016 2017
Fitness sports/activities continues to have the highest participation rates;
having 64% of the US population ages 6 and over engaging in activities like
running/jogging, high intensity/impact training, row machines, and
swimming. Outdoor activities remained second but was flat from 2016; seeing
a increase in day hiking and backpacking, but lost participants in canoeing
and adventure racing.

PARTICIPATION BY GENERATION
20
18
Ph
ysic
al
Acti
vit
y C
ou
ncil
Pa
rti
cip
ati
on
Re
po
rt
8
A look at activity levels by generation
Participation Rates Segmented by Generations
US Population, Ages 6+
Inactive Low/Med
Calorie
Casual & Low/Med
Calorie
Active & High
Calorie
Active to a
Healthy Level
17.6%
17.4%
20.1%18.5%
26.3%
Gen Z (2000+)
24.0%
16.4%
13.0%11.3%
35.4%
Millennials (1980-1999)
28.1%
18.7%9.1%
9.1%
35.0%
Gen X (1965~1979)
33.3%
29.6%
4.3%6.3%
26.5%
Boomers (1945~1964)
65% of
GenZer’s were
at least
casually active
in 2017.
Almost half of
Millennials
participated in
high caloric
activities, while a
quarter remained
sedentary.
While 35% of
both Gen X and
Millennials were
active to a
healthy level,
Gen X was less
active overall.
As the Boomers
continue to age,
their commitment
to an active lifestyle
remains. Part rates
in all categories
remained flat from
2016.
PARTICIPATION BY GENERATION
20
18
Ph
ysic
al
Acti
vit
y C
ou
ncil
Pa
rti
cip
ati
on
Re
po
rt
9
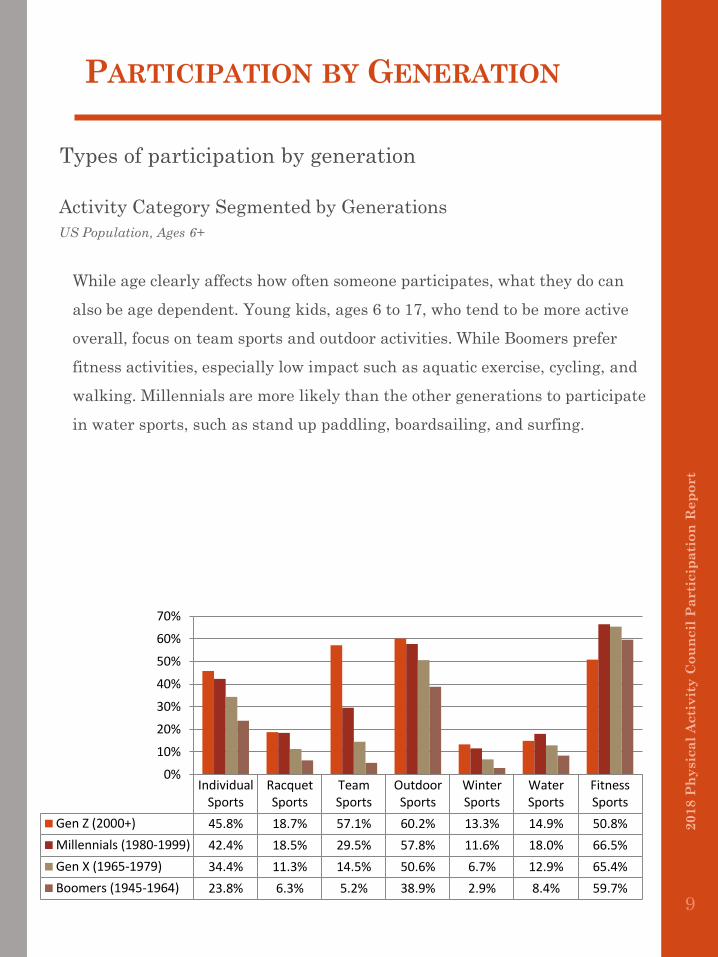
Types of participation by generation
Activity Category Segmented by Generations
US Population, Ages 6+
IndividualSports
RacquetSports
TeamSports
OutdoorSports
WinterSports
WaterSports
FitnessSports
Gen Z (2000+) 45.8% 18.7% 57.1% 60.2% 13.3% 14.9% 50.8%
Millennials (1980-1999) 42.4% 18.5% 29.5% 57.8% 11.6% 18.0% 66.5%
Gen X (1965-1979) 34.4% 11.3% 14.5% 50.6% 6.7% 12.9% 65.4%
Boomers (1945-1964) 23.8% 6.3% 5.2% 38.9% 2.9% 8.4% 59.7%
0%
10%
20%
30%
40%
50%
60%
70%
While age clearly affects how often someone participates, what they do can
also be age dependent. Young kids, ages 6 to 17, who tend to be more active
overall, focus on team sports and outdoor activities. While Boomers prefer
fitness activities, especially low impact such as aquatic exercise, cycling, and
walking. Millennials are more likely than the other generations to participate
in water sports, such as stand up paddling, boardsailing, and surfing.

2012 – 2017 INACTIVITY TRENDS
20
18
Ph
ysic
al
Acti
vit
y C
ou
ncil
Pa
rti
cip
ati
on
Re
po
rt
10
Overall inactivity levels in the US
Inactivity Rates vs. Total Inactives
US Population, Ages 6+
80.4 M 80.2 M 82.7 M 81.6 M 81.4 M 82.4 M
28.0% 27.6% 28.3% 27.7% 27.5% 27.6%
0%
5%
10%
15%
20%
25%
30%
35%
40%
0.0 M
10.0 M
20.0 M
30.0 M
40.0 M
50.0 M
60.0 M
70.0 M
80.0 M
90.0 M
2012 2013 2014 2015 2016 2017
Nu
mb
er o
f in
acti
ves
Inactives (Millions) Inactivity Rate
Over the last few years, inactivity has been a hot topic. Initiatives on moving
from a sedentary lifestyle to one that is active and healthy are in abundance.
While the benefits of an active lifestyle are clear, inactivity has plateaued.
Just over a quarter of the US population ages 6 and over, 82.4 million people,
did not participate in even the lowest caloric burning activity in 2017. This
rate still remains higher than the 10 year average of 27.2%.
2012 – 2017 INACTIVITY BY AGE
20
18
Ph
ysic
al
Acti
vit
y C
ou
ncil
Pa
rti
cip
ati
on
Re
po
rt
11
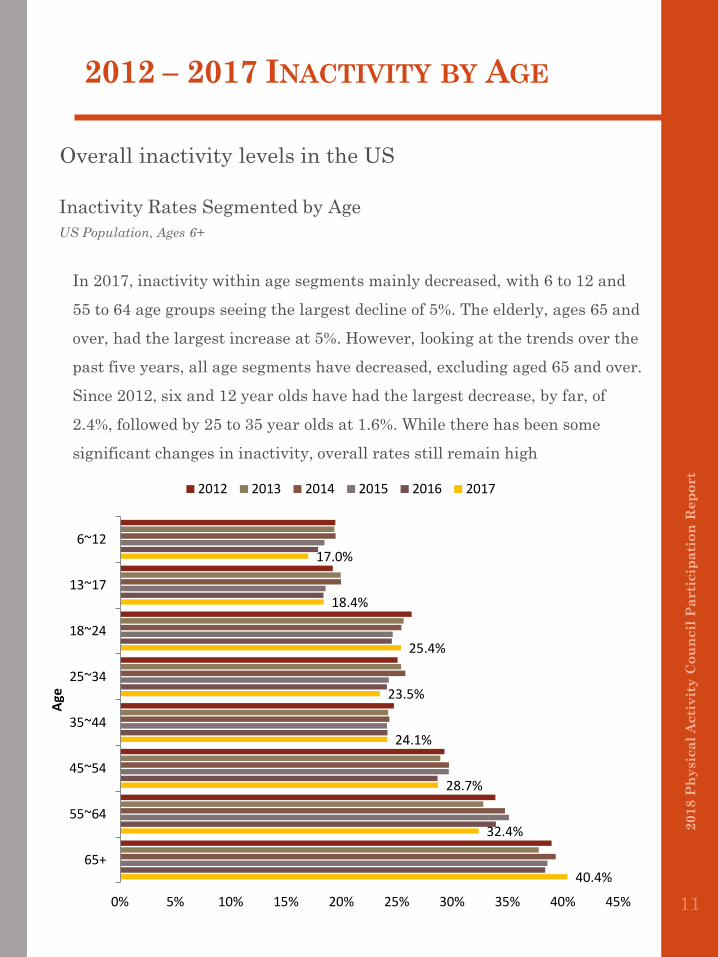
Overall inactivity levels in the US
Inactivity Rates Segmented by Age
US Population, Ages 6+
17.0%
18.4%
25.4%
23.5%
24.1%
28.7%
32.4%
40.4%
0% 5% 10% 15% 20% 25% 30% 35% 40% 45%
6~12
13~17
18~24
25~34
35~44
45~54
55~64
65+
Age
2012 2013 2014 2015 2016 2017
In 2017, inactivity within age segments mainly decreased, with 6 to 12 and
55 to 64 age groups seeing the largest decline of 5%. The elderly, ages 65 and
over, had the largest increase at 5%. However, looking at the trends over the
past five years, all age segments have decreased, excluding aged 65 and over.
Since 2012, six and 12 year olds have had the largest decrease, by far, of
2.4%, followed by 25 to 35 year olds at 1.6%. While there has been some
significant changes in inactivity, overall rates still remain high
2012 – 2017 INACTIVITY BY INCOME
20
18
Ph
ysic
al
Acti
vit
y C
ou
ncil
Pa
rti
cip
ati
on
Re
po
rt
12
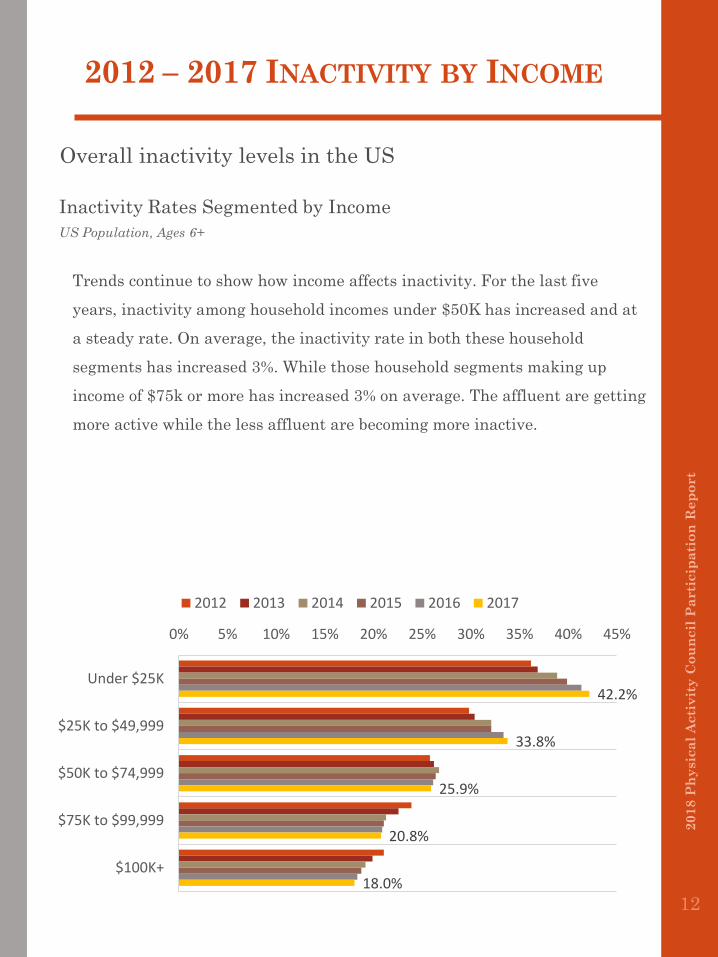
Overall inactivity levels in the US
Inactivity Rates Segmented by Income
US Population, Ages 6+
42.2%
33.8%
25.9%
20.8%
18.0%
0% 5% 10% 15% 20% 25% 30% 35% 40% 45%
Under $25K
$25K to $49,999
$50K to $74,999
$75K to $99,999
$100K+
2012 2013 2014 2015 2016 2017
Trends continue to show how income affects inactivity. For the last five
years, inactivity among household incomes under $50K has increased and at
a steady rate. On average, the inactivity rate in both these household
segments has increased 3%. While those household segments making up
income of $75k or more has increased 3% on average. The affluent are getting
more active while the less affluent are becoming more inactive.
NON-PARTICIPANT INTEREST
20
18
Ph
ysic
al
Acti
vit
y C
ou
ncil
Pa
rti
cip
ati
on
Re
po
rt
13
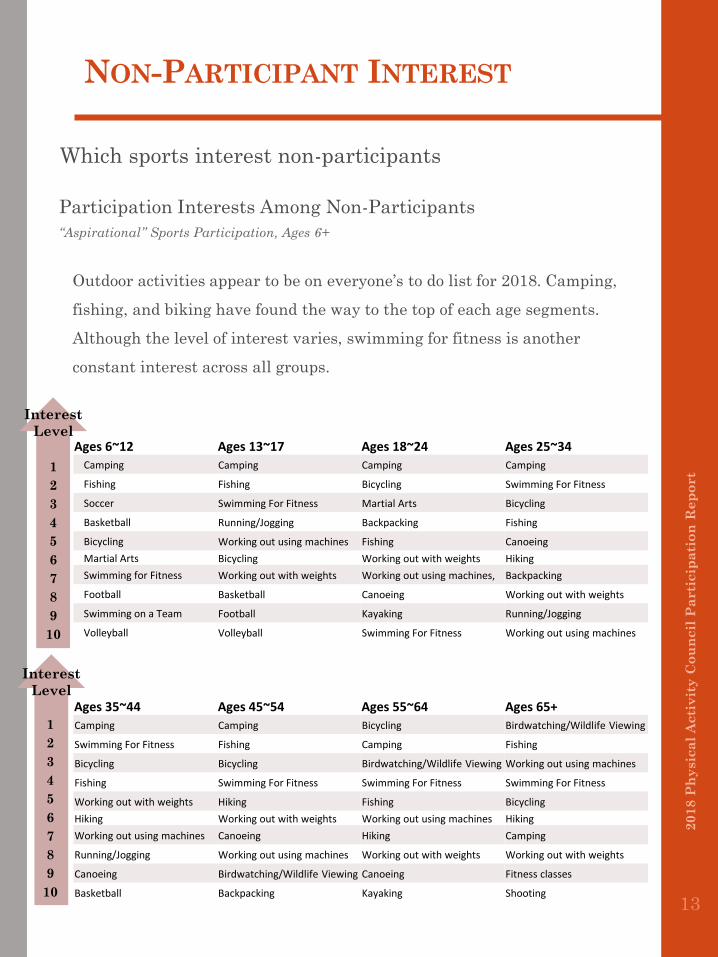
Which sports interest non-participants
Participation Interests Among Non-Participants
“Aspirational” Sports Participation, Ages 6+
Ages 6~12 Ages 13~17 Ages 18~24 Ages 25~34
Camping Camping Camping Camping
Fishing Fishing Bicycling Swimming For Fitness
Soccer Swimming For Fitness Martial Arts Bicycling
Basketball Running/Jogging Backpacking Fishing
Bicycling Working out using machines Fishing Canoeing
Martial Arts Bicycling Working out with weights Hiking
Swimming for Fitness Working out with weights Working out using machines, Backpacking
Football Basketball Canoeing Working out with weights
Swimming on a Team Football Kayaking Running/Jogging
Volleyball Volleyball Swimming For Fitness Working out using machines
Interest
Level
1
2
3
4
5
6
7
8
9
10
Ages 35~44 Ages 45~54 Ages 55~64 Ages 65+
Camping Camping Bicycling Birdwatching/Wildlife Viewing
Swimming For Fitness Fishing Camping Fishing
Bicycling Bicycling Birdwatching/Wildlife Viewing Working out using machines
Fishing Swimming For Fitness Swimming For Fitness Swimming For Fitness
Working out with weights Hiking Fishing Bicycling
Hiking Working out with weights Working out using machines Hiking
Working out using machines Canoeing Hiking Camping
Running/Jogging Working out using machines Working out with weights Working out with weights
Canoeing Birdwatching/Wildlife Viewing Canoeing Fitness classes
Basketball Backpacking Kayaking Shooting
Interest
Level
1
2
3
4
5
6
7
8
9
10
Outdoor activities appear to be on everyone’s to do list for 2018. Camping,
fishing, and biking have found the way to the top of each age segments.
Although the level of interest varies, swimming for fitness is another
constant interest across all groups.

NON-PARTICIPANT INTEREST
20
18
Ph
ysic
al
Acti
vit
y C
ou
ncil
Pa
rti
cip
ati
on
Re
po
rt
14
What would help get non-participants involved
Ways To Get a Non-Participant Involved
“Aspirational” Sports Participation, Ages 6+
43.0%
31.7%
24.9%
19.1%
18.5%
18.1%
16.6%
15.0%
12.5%
12.1%
9.6%
6.9%
15.9%
0% 5% 10% 15% 20% 25% 30% 35% 40% 45% 50%
Having someone to take part with
Having a friend take me along
Being in better health
Fewer family commitments
More vacation time
Fewer work commitments
Having an introductory lesson/outing
Having a friend instruct me
New equipment
Availability of better multi-use trails/sidewalks
Tax break on equipment, fees, & instructions
Employer sponsored activity
Something else
2015 2016 2017
While people are aspiring to be active, getting them there always seems to be
the problem. As seen over the years, people start participating in different
activities if they had a friend or family member to do it with. Health issues
and time commitments are classic excuses. Who wouldn’t do more if they had
an extra week of vacation? However, years has shown us that first time
participation really depends on who you are doing it with more than if you
have the time.

THE PE PATHWAY
20
18
Ph
ysic
al
Acti
vit
y C
ou
ncil
Pa
rti
cip
ati
on
Re
po
rt
15
How adults who had PE engage in physical activity
The Effect of PE on Physical Activities During Adult Years
US Participants, Ages 18+ asked about PE during school years
37.7%
62.3%
24.1%22.1%
77.9%
37.6%
0%
10%
20%
30%
40%
50%
60%
70%
80%
90%
Inactive Active Active to a healthy leveland beyond
No PE at School PE at School (all ages)
Since PE is a predictor of activity in adulthood and lower income households
depend on PE as their source of fitness, how is it that PE continues to
disappear in the schools? Of those adults who had PE in school (between the
ages of 6 to 17), almost 80% are active and 38% are active to a healthy level.

APPENDIX 1
20
18
Ph
ysic
al
Acti
vit
y C
ou
ncil
Pa
rti
cip
ati
on
Re
po
rt
16
List of Sports/Activities in Grouped Categories
FITNESS ACTIVITIES: High Impact/Intensity Training, Dance, Step and Other Choreographed
Exercise to Music, Cardio Kickboxing, Elliptical Motion Trainer/Cross-Training, Row
Machine, Stationary Cycling (Group, Recumbent, Upright), Stair-Climbing Machine,
Treadmill, Aquatic Exercise, Boot-Camp Style Training, Bodyweight Exercise & Bodyweight
Accessory-Assisted Training, Cross-Training Style Workouts, Barre, Pilates Training,
Stretching, Tai Chi, Yoga, Free Weights (Barbells, Dumbbells, Hand Weights), Kettlebells,
Weight/Resistance Machines, Running/Jogging, Swimming for Fitness, and Walking for
Fitness.
INDIVIDUAL SPORTS: Triathlon (Traditional/Road, Non-Traditional/Off-Road), Adventure
Racing, Golf, Boxing (Fitness, Competition), Martial Arts, MMA (Fitness, Competition),
Other Combat Training, Bowling, Ice Skating, Roller Skating (2x2 Wheels, In-Line),
Skateboarding, Archery, Shooting (Sports Clays, Trap/Skeet), Target Shooting (Rifle,
Handgun), and Trail Running.
OUTDOOR SPORTS: Adventure Racing, Backpacking Overnight (more than a ¼ mile from
home/vehicle), Bicycling (Road/Paved Surface, Mountain/Non-Paved Surface, BMX),
Birdwatching (excursion more than ¼ mile from home/vehicle), Boardsailing/Windsurfing,
Camping (within ¼ mile from home/vehicle), Camping (RV), Canoeing, Climbing
(Sport/Boulder, Indoor, Traditional/Ice/Mountaineering), Fishing (Fly, Saltwater,
Freshwater/Other), Hiking (Day), Hunting (Rifle, Shotgun, Handgun, Bow), Kayaking
(White Water, Sea/Touring, Recreational), Rafting, Running/Jogging, Sailing, Scuba Diving,
Skateboarding, Skiing (Cross-Country, Alpine/Downhill, Freestyle), Snorkeling,
Snowboarding, Snowshoeing, Stand-Up Paddling, Surfing, Telemark (Downhill), Trail
Running, Triathlon (Traditional/Road, Non-Traditional/Off-Road),Wakeboarding, and
Wildlife Viewing (excursion more than ¼ mile from home/vehicle).
RACQUET SPORTS: Badminton, Cardio Tennis, Pickleball, Racquetball, Squash, Tennis, and
Table Tennis.
TEAM SPORTS: Ultimate Frisbee, Gymnastics, Baseball, Basketball, Cheerleading, Ice
Hockey, Field Hockey, Football (Flag, Tackle, Touch), Lacrosse, Paintball, Rugby, Soccer
(Indoor, Outdoor), Softball (Fast-Pitch, Slow-Pitch), Track and Field, Volleyball (Court,
Grass, Sand/Beach), Wrestling, Roller Hockey, and Swimming on a Team.
WATER SPORTS: Boardsailing/Windsurfing, Canoeing, Kayaking (White Water, Sea/Touring,
Recreational), Jet Skiing, Rafting, Sailing, Scuba Diving, Snorkeling, Stand-Up Paddling,
Surfing, Wakeboarding, and Water Skiing.
WINTER SPORTS: Skiing (Cross-Country, Alpine/Downhill, Freeski/Freestyle),
Sledding/Saucer Riding/Snow Tubing, Snowboarding, Snowshoeing, Telemark (Downhill).

APPENDIX 2
20
18
Ph
ysic
al
Acti
vit
y C
ou
ncil
Pa
rti
cip
ati
on
Re
po
rt
17
List of Sports/Activities in Activity Levels
INACTIVE: Archery, Birdwatching (excursion more than ¼ mile from home/vehicle),
Camping (within ¼ mile from home/vehicle), Camping (RV), Fishing (Fly, Saltwater,
Freshwater/Other), Hunting (Rifle, Shotgun, Handgun, Bow), Shooting (Sports Clays,
Trap/Skeet), Target Shooting (Rifle, Handgun), and Wildlife Viewing (excursion more
than ¼ mile from home/vehicle).
LOW CALORIE BURNING ACTIVITIES: Stretching, Walking for Fitness,
Sledding/Saucer Riding/Snow Tubing, Snowmobiling, Bowling, Table Tennis,
Boardsailing/Windsurfing, Jet Skiing, and Sailing.
MEDIUM CALORIE BURNING ACTIVITIES: Barre, Tai Chi, Yoga, Free Weights
(Barbells, Dumbbells) Kettlebells, Weight/Resistance Machines, Golf, Baseball,
Cheerleading, Football (Flag), Gymnastics, Paintball, Softball (Fast-Pitch, Slow-Pitch),
Ultimate Frisbee, Volleyball (Court, Grass, Sand/Beach), Skiing (Alpine/Downhill,
Freeski/Freestyle), Snowboarding, Telemark (Downhill), Ice Skating, Roller Skating (2x2
Wheels, In-line), Skateboarding, Kayaking (White Water, Sea/Touring, Recreational),
Rafting, Scuba Diving, Snorkeling, Surfing, Wakeboarding, Water Skiing, Backpacking
(more than a ¼ mile from a vehicle/home), and Hiking (Day).
HIGH CALORIE BURNING ACTIVITIES: High Impact/Intensity and Training, Dance,
Step, and Other Choreographed Exercise to Music, Cardio Kickboxing, Stationary
Cycling (Group, Recumbent, Upright), Elliptical Motion Training/Cross-Training, Rowing
Machine, Treadmill, Aquatic Exercise, Boot Camp Style Training, Bodyweight exercise
and Bodyweight Accessory-Assisted Training, Cross-Training Style Workouts, Pilates
Training, Adventure Racing, Bicycling (BMX, Mountain/Non-Paved Surface, Road/Paved
Surface), Running/Jogging, Swimming for Fitness, Triathlon (Traditional/Road, Non-
Traditional/Off-Road), Basketball, Field Hockey, Football (Tackle, Touch), Ice Hockey,
Lacrosse, Rugby, Soccer (Indoor, Outdoor), Swimming on a Team, Track and Field,
Cardio Tennis, Pickleball, Racquetball, Squash, Tennis, Skiing (Cross-Country),
Snowshoeing, Boxing (Fitness, Competition), Marital Arts, MMA (Fitness, Competition),
Wrestling, Other Combat Training, Roller Hockey, Stand-Up Paddling, Climbing
(Sport/Boulder, Indoor, Traditional/Ice/Mountaineering), and Trail Running)

20
18
Ph
ysic
al
Acti
vit
y C
ou
ncil
Pa
rti
cip
ati
on
Re
po
rt
18
Disclaimer
While proper due care and diligence has been taken in the preparation of this
document, the Physical Activity Council cannot guarantee the accuracy of the
information and does not accept any liability for any loss or damage caused as a
result of using information or recommendations contained within this document.
© 2018 Physical Activity Council
No part of the report may be reproduced or transmitted in any form or by any
means, including photocopying, without the written permission of the Physical
Activity Council, any application for which should be addressed to the Physical
Activity Council. Written permission must also be obtained before any part of the
report is stored in a retrieval system of any nature. Contact Sports Marketing
Surveys USA at (561) 427-0647 or [email protected].
20
18
Ph
ysic
al
Acti
vit
y C
ou
ncil
Pa
rti
cip
ati
on
Re
po
rt
19
The 2018 Overview Report is
brought to you by: