pdf tracking form - cms
TRANSCRIPT

PDF TRACKING FORM Tracking Job Number
Document Title
Author
Document Description:
210 Printed: 6/4/2002
Evaluation of Medicare’s Competitive Bidding Demonstration for Durable Medical Eauiument, Prosthetics, Orthotics, and Supplies: First Annual Renort to Congress
Anonvmous Document Date 29-Nov-00
Report to Congress, first annual
Project Specifics
SR Number
Project Number
Project Title
98-239
500-95-0061/03
Evaluation of Competitive Bidding Demonstration for DME and POS
Awardee University of Wisconsin - MadisoniResearch Triangle Institute/Northwestern Univ.
Project Officer
Principle Investigator
Funding Level
Start Date
End Date
Project Description:
Meadow, Ann
Karen, Sarita
23 15249
9/30/1998
511512003
HCFA has mounted a demonstration to test the feasibility and effectiveness of establishing Medicare fees for durable medical equipment (DME) and prosthetics, prosthetic devices, orthotics and supplies (POS) through a competitive bidding process. The fund
Finished (Sub):
version I 0
First Annual Report to Congress: Evaluation of Medicare’s Competitive Bidding Demonstration
For Durable Medical Equipment, Prosthetics, Orthotics, and Supplies
November 30,200O
U.S. Department of Health and Human Services Health Care Financing Administration
Baltimore, Maryland

Purpose
Section 1847 of the Social Security Act, as added by Section 43 19 of Public Law 105-33. the Balanced Budget Act of 1997 (BBA 1997). directs the Secretary of Health and Human Services to report annually on the impact of competitive bidding projects authorized in the BBA. Specifically, Section 1847(c)( 1) directs the Secretary to “evaluate the impact of the demonstration projects on Medicare program payments access. diversity of product selection, and quality.” The Secretary is to report annually and no later than 6 months after the demonstrations terminate on December 3 1, 2002. In accordance with the requirements, the Secretary is hereby submitting the First Annual Report.
Background
Section 1847 of the Social Security Act authorized the Secretary to conduct Demonstration Projects for Competitive Acquisition of Items and Services. In these prqiects. Medicare Part B items and services (other than physician services) can be furnished under competitively awarded contracts. The competitions are conducted in competitive acquisition areas, defined under the act as a Metropolitan Statistical Area (MSA) or a smaller area within an MSA.
In the first site of the demonstration, the Health Care Financing Administration (HCFA) selected five categories of durable medical equipment, prosthetics. orthotics and supplies (DMEPOS) for competitive bidding in Polk County, Florida. (A second site, San Antonio. Texas, was selected in Spring 2000.) The categories were oxygen supplies and equipment (required by statute), hospital beds and accessories, enteral nutrition, urological supplies, and surgical dressings. Bids for a total of 172 individual product and services codes were submitted in March 1999. A total of 16 winning suppliers began providing demonstration products and services in Polk County on October 1, 1999. A new fee schedule for Polk County replaced the statewide Medicare DMEPOS fee schedule.
HCFA contracted with the University of Wisconsin-Madison in 1998 to conduct the evaluation. The evaluation team consists of the University, the Research Triangle Institute. and Northwestern University. For the First Annual Report. the evaluation activities have included a beneficiary survey; live site visits by the team to Polk County. Florida. and to the Medicare carrier managing the project in 1999 and 2000; focus groups in Polk County with suppliers and members of other affected groups: analysis of suppliers’ bids and comparison of fee schedules; and review of operational and documentary materials such as ombudsman records and the demonstration Request for Bid Proposals (RFP) from suppliers.
Results of the Evaluation to Date
This evaluation focuses on five major areas of impact:

1. Medicare expenditures: 2. beneficiary access; 3. quality and product selection; 4. market competitiveness; and 5. administrative feasibility of the reimbursement system.
The remainder of this report summarizes the key evaluation findings in each impact area. based primarily on the first 9 months of demonstration operations. In general. we find that the demonstration is proceeding smoothly and without serious adverse impacts in any of the evaluation areas. Estimates suggest significant savings from competitive bidding. A detailed contractor report on these findings, including an executive summary, is attached as an appendix.
Medicare expenditures
The Medicare fees that resulted from the bidding competition suggest substantial savings are likely from competitive bidding for the products and services involved in Polk County. Our current estimates suggest savings of about 17 percent annually.
For each demonstration product or service, the prices bid by winning suppliers were used to determine the competitively bid fee schedule price. The resulting Medicare fees under the competitively bid fee schedule in Polk County are lower than the fees in the Year 2000 Medicare fee schedule for I5 of 15 oxygen items, 28 of 3 1 hospital beds and accessories items, 22 of 24 enteral nutrition items, and 37 of 40 urological items. In the surgical dressings category, the fees in the competitively bid fee schedule are lower than the fees in the Medicare fee schedule for 6 of 62 items. This means that, for at least 90 percent of the items in four of the product categories, the demonstration produced lower fees than the existing Medicare fee schedule.
In the surgical dressings category. fees were lower for 10 percent of the items, and higher for the remaining 90 percent. It is likely that the fees for surgical dressings would have been lower for more than 6 of the 62 items under an improvement in the technical procedure for summarizing each bidder’s prices into a single bid for comparison purposes. This change has been implemented in HCFA’s second demonstration site, San Antonio. Texas. and will be used in any additional future demonstration sites.
The 15 oxygen fees under the competitively bid fee schedule represent a discount of 6 to 33 percent from the Medicare fee schedule, with 12 of 15 categories exhibiting a discount of at least 10 percent. The discount takes into account percentage fee reductions under the demonstration and are therefore in addition to the BBA-mandated fee schedule reductions.
Our total projected savings estimate for both Medicare and Polk County beneficiaries is nearly $1.3 million annually, 17 percent less than payments that would have been incurred under the Year 2000 Medicare fee schedule. Medicare program outlays account
2
for about $1 million of this amount, while reductions in beneficiary copayments account for about $250,000. (There are about 92,000 beneficiaries residing in the county. but most do not use DMEPOS.)
By product category. our savings estimate for Medicare and Polk County beneficiaries is 16 percent for oxygen supplies. 29 percent for hospital beds and accessories, 16 percent for enteral nutrition. and 18 percent for urological supplies. We estimate that annual expenditures by Medicare and Polk County beneficiaries for surgical dressings will increase 10 percent.
The actual amountof savings that will result from competitive bidding depends upon the volume of services in Polk County. Another factor determining actual savings is the impact of demonstration transition policies allowing payments under the Medicare fee schedule for capped-rental or purchase agreements until the agreements run out. The above estimates are based on volume data for 1998, the most recent data available at the time the bidding occurred, and they do not take transition policies into account. However, we do not expect the final savings estimates to differ markedly from our current ones.
Access to DMEPOS goods and services
The demonstration has had no adverse effects on beneficiary access that we could determine from our evaluation activities thus far. Monitoring conducted by HCFA’s ombudsman. as well as by the evaluation team during site visits, turned up only a few specific complaints about impediments to access. These arose during the transition to demonstration operations beginning in October 1999. Incidents known to occur were either addressed by the Ombudsman or were resolved in the course of the consumer’s selecting a supplier more to his or her liking. Thus it appears that normal market processes were at work in which a few suppliers received feedback from the Ombudsman. referral agents, and beneficiaries that should produce improved performance.
The encouraging access situation appears to be attributable to several factors in the design and outcome of the bidding demonstration. First, the demonstration design provided for multiple winners in each product category. The multiple winners are expected to compete for market share. and in so doing have a strong incentive to provide services in a manner that promotes timely and appropriate access to DMEPOS goods and services. In Polk County, there are 13 winning suppliers for oxygen. 10 for hospital beds and accessories. 7 for enteral nutrition. 5 for urological supplies. and 4 for surgical dressings. (These counts sum to more than 16 because certain suppliers won in more than one product category.)
Second, winner selection procedures explicitly considered bidders’ capacity and service capabilities. Suppliers’ ability to deliver quickly, respond to after-hours emergencies, and follow natural disaster procedures were assessed. In addition, 12 of the 16 winning firms agreed to provide service to every area of the county.

Third. transition policies were designed specifically to avoid access dislocations. These policies include the capped-rental provisions noted above, and the provision permitting nondemonstration oxygen suppliers to continue serving their existing patients under the competitively bid fee schedule. All nondemonstration oxygen suppliers agreed to continue serving their oxygen patients under the provision: their decision eliminated the need for patients to establish a relationship with a new oxygen supplier.
More conclusive data on access will be available in the Second Annual Report to Congress. That report will contain the results of pre- and post-implementation surveys of beneficiaries in Polk County and a comparison county. The analysis will assess any changes in the generally high levels of access and supplier performance that existed before the demonstration. Data collected among suppliers will provide additional resources for the evaluation of access. Further. the evaluation team will continue qualitative data collection on access impacts.
Quality andproduct selection
With the possible exception of urological supplies, there have been no systematic reports of a reduction in the quality and selection of goods and services provided to beneficiaries under the demonstration. After the start of the demonstration. a number of referral agents reported that the new supplier they initially selected did not please them, but that they subsequently found a different demonstration supplier to be satisfactory. It appears that these instances were transitory. In a focus group 6 months after the demonstration prices took effect, referral agents reported that overall quality was not lowrer under the demonstration.
Evidence concerning possible problems with urological supplies is both anecdotal and inferential, warranting continued close monitoring of this product category. Anecdotally, a nondemonstration supplier reported that several urological patients sought supplies from the firm after being dissatisfied with a demonstration supplier. A home health agency reported quality problems with catheters provided by a demonstration supplier. Complaints to the Ombudsman indicated deficiencies in the quality and quantity of urological supplies from one winning supplier. In November 2000, the firm agreed in writing to correct the deficiencies.
We infer that there is a potential for quality and product selection problems because of indications that the competitively bid fees frequently do not cover the acquisition costs of the urological items. The extent of this disparity varies with the supplier. A disparity gives suppliers an incentive to substitute lower-priced products (which may or may not be of inferior quality), when they are in a position to do so. In practice, however. suppliers are often unable to choose urological products for beneficiaries. This is due to beneficiary preferences and experiences with products, and due to the requirement that suppliers provide the brand prescribed by the physician, if a brand is named in the prescription. Such constraints on suppliers are consistent with reports from referral
4
agents that they have not observed suppliers systematically changing their offerings of urological products.
In summary. available data from site visits and from discussions with all five urological suppliers lead us to conclude that the quality and selection of urological items probably have not deteriorated. although quality and selection may be under pressure from the low prices determined through the bidding competition. The situation continues to be monitored by the demonstration Ombudsman. Higher prices for urological supplies may result from the second round of competitive bidding in Polk County, which is scheduled take place in 2001. Higher prices would alleviate potential pressures on the quality of urological supplies.
There is no evidence at this time suggesting a reduction in the quality- of the other product categories. The diversity of surgical dressings may have improved under the demonstration. One winning supplier, new to Polk County. uses wound care supplies and techniques that were not generally offered previously in the area. and the presence of this firm may have resulted in a wider selection of wound care supplies. Additionally. the multiple-winner design appears to be promoting competition among suppliers over quality.
As with our analysis of access impacts, a fuller understanding of the quality situation awaits further evaluation results. More complete data on quality and product diversity will be available after we conduct the second round of the beneficiary survey. Results will be reported in next year’s Report to Congress.
Market competitiveness
Competitive bidding in Polk County resulted in 16 winning firms out of 30 that submitted bids. More than 40 firms had non-minimal business volume in the five product categories before the demonstration began. Nevertheless, the evaluation suggests that the DMEPOS market in Polk County remains reasonably competitive. Both small and large firms bid successfully. The local industry does not evidence serious financial difficulties as a result of the demonstration. Three firms filed for bankruptcy (two demonstration suppliers and one nondemonstration supplier), but the tilings are unrelated to the demonstration, and the firms continue to provide DMEPOS in Polk County. After the demonstration began, a large, national oxygen firm that did not win a bid acquired two smaller demonstration suppliers. These transactions may suggest that the financial health of the purchased firms did not interfere with their attractiveness as acquisitions.
The experience with the demonstration so far has revealed several market competition issues that can complicate Medicare competitive bidding projects. although they do not pose serious problems for the viability of the bidding initiatives. One issue concerns mergers and acquisitions. The acquisitions by the large oxygen firm caused dissatisfaction among demonstration suppliers, even though HCFA’s policy allowing purchases that transfer demonstration status to the acquiring firm was known in advance. The policy is intended to preserve access to DMEPOS goods and supplies and to avoid

undue restraints on routine industry mergers and acquisitions. The acquisitions in Polk raise the question whether the ground rules may actually promote mergers by large firms that choose not to bid or lose the bidding, despite indications that the transactions of the large oxygen company may have been part of its ongoing business development program. Another question is what effect, if any, the transferability of demonstration status may have on bidding behavior and price reductions achieved during the bidding phase of the project. Further experience with Medicare competitive bidding demonstrations may inform future policy in this area.
A second issue concerns competitive behaviors among both nondemonstration and demonstration suppliers after the bidding phase. The experience in Polk County revealed behavior by a nondemonstration supplier that was intended to maintain its revenues for non-demonstration product categories but that raised questions of fair play. Specifically. this supplier took referrals from local agents. provided the nondemonstration products in the order. and then referred the remaining business to a specific demonstration supplier. Many of the winning suppliers resented this practice, which was subsequently addressed by HCFA through efforts to educate referring agents to make direct referrals. Another practice was a demonstration supplier’s use of a subcontract with a nondemonstration supplier to provide demonstration services. Again, winning suppliers questioned the propriety of this practice, and HCFA subsequently modified its original policy in this area. limiting subcontracting to five percent of the demonstration supplier’s claims.
It is worth noting that both of these activities took place relatively early in the project, when changes in revenues often fell far below suppliers’ initial expectations, in part due to the transition policies intended to protect beneficiary access to services. The unexpectedly low volumes may have heightened suppliers’ sensitivity to their competitors’ behaviors. We expect that volumes for demonstration suppliers will eventually increase, which may in turn affect perceptions of the significance of certain activities. At the very least, based on this experience, future participants will better comprehend the revenue changes likely in the early part of the contract period. They should also benefit from a deeper understanding of each other’s competitive response and of HCFA’s policies regulating it.
To draw further conclusions about the impact of the demonstration on market competitiveness, activities later in the evaluation will focus on financial and market share data, and on the results of the second round of bidding in 2001. These studies will be reported in future annual Reports to Congress.
Adminisfrafive feasibility of the reimbursement system
The evaluation of administrative feasibility addresses the ease of implementing the process of competitive bidding and of administering the post-bidding phases, including the transition to approved suppliers, new reimbursement procedures, and site monitoring.
Information from suppliers concerning the bidding phase indicates that suppliers generally felt sufficiently informed about the nature of the project, bidding procedures,
6

and demonstration requirements. Based on the evaluation team’s discussions with other stakeholders, most informants believed that public information and notification activities among beneficiaries, referral agents, and others were effective. Bidding suppliers reported few problems in preparing their bids. Since the commencement of the demonstration. no problems have been encountered in supplier claims processing.
The task of selecting the winning bids was assigned to a panel of reimbursement and DMEPOS experts under the direction of Palmetto Government Benefits Administrators (PGBA), the carrier managing the demonstration. In addition to pricing, the panel considered the volume capacity of the bidders; customer service and satisfaction information; the bidder’s ability to meet other quality standards; business ethics; data collection and retention; and financial stability. Panel members used a scoring system to assess the bids. The bidder selection process also involved an on-site assessment to confirm that competitively selected bidders met specified quality and service requirements. HCFA reviewed the panel’s recommendations and requested several additions to the list of winners to ensure sufficient capacity in the demonstration area. The new firms had to remedy quality deficiencies as a condition for being selected. The ground rules also allow-ed for reconsideration of the selection decisions at the request of suppliers.
The bid evaluation process proved to be excessively time-consuming during the first round of bidding. To streamline the process in the future, HCFA and PGBA are considering refinements to the evaluation process. For example. pane1 members can be aided in their evaluation by a structured review form, and detailed quality-related subfactors can be assigned point values to expand the scoring system.
For monitoring the demonstration in the post-bidding phase, HCFA appointed an ombudsman. The ombudsman has played a pivotal role in the smooth functioning of the Polk County demonstration. Site visit interviews by the evaluation team indicate that the ombudsman has strong support among both beneficiaries and suppliers. The ombudsman responds to complaints and inquiries on a “hotline.” and conducts education and outreach. She monitors suppliers through both complaints and routine inspections. In general, the ombudsman serves as HCFA’s and PGBA’s “eyes and ears” in Polk County, and has also facilitated HCFA’s communications with stakeholders.
Summary
The competitive bidding authority under the BBA is scheduled to end in approximately 2 years. Our evaluation activities during the first year of the demonstration give us reason to be optimistic about its eventual success. The competitively bid fee schedule is significantly more favorable to Medicare than the existing Medicare fee schedule. No major access, quality, or product selection issues have surfaced so far. Medicare’s payment procedures under the new system are functioning well. Suppliers appear to have adjusted satisfactorily to the new arrangements and the changed competitive environment.

This evaluation study will continue through the duration of the demonstration. The largely qualitative evidence gathered thus far will be supplemented by quantitative evidence from surveys and other data resources such as Medicare claims. After all the data are in, we will be fully prepared to make a final evaluation of the experiment.

First Annual Report to Congress: Evaluation of Medicare’s Competitive Bidding Demonstration
For Durable Medical Equipment, Prosthetics, Orthotics, and Supplies
Tommy G. Thompson Secretary of Health and Human Services
2001

September 2009 (Revised January 2901)
Evaluation of Medicare’s Competitive Bidding
Demonstration for DMEPOS
First-Year Annual Evaluation Report HCFA Contract No. 590-95-905l/T.O. #3
Prepared for
Ann Meadow, Sc.0. Health Care Financing Administration
Office of Strategic Planning Mail Stop C3-19-26
7500 Security Boulevard Baltimore, MD 21244-1850
Prepared by
University of Wisconsin-Madison Center for Health Systems Research and Analysis
610 Walnut Street Madison. WI 53705
Research Triangle Institute Center for Economics Research
3040 Cornwallis Road Research Triangle Park, NC 27709
Northwestern University Institute for Health Services Research and Policy Studies
629 Noyes Street Evanston. IL 60208
RTI Project Number 7346-002-008

First Annual Report to Congress: Evaluation of Medicare’s Competitive Bidding Demonstration
For Durable Medical Equipment, Prosthetics, Orthotics, and Supplies
Tommy G. Thompson Secretary of Health and Human Services
2001

RTI Project Number 7346-002-008
Evaluation of Medicare’s Competitive Bidding Demonstration for DMEPOS
First-Year Annual Evaluation Report HCFA Contract No. 500-950061/T.O. #3
September 2000 (Revised November 2000)
Prepared for
Ann Meadow, ScD. Health Care Financing Administration
Office of Strategic Planning, Mail Stop C3-19-26 7500 Security Boulevard
Baltimore. MD 21244-1850
Prepared by
Sara Karon, Ph.D. Kay Jewell, M.D.
University of Wisconsin-Madison Center for Health Systems Research and Analysis
610 Walnut Street Madison, WI 53705
Thomas Hoerger, Ph.D., Project Director Kristine Broglio
Shulamit Bernard, Ph.D. Claire Gibbons, M.P.H.
Research Triangle Institute Center for Economics Research
3040 Cornwallis Road Research Triangle Park, NC 27709
Richard Lindrooth, Ph.D. Teresa Waters, Ph.D.
Northwestern University Institute for Health Services Research and Policy Studies
629 Noyes Street Evanston, IL 60208

CONTENTS
Section
Executive Summary
1 Background and Methods
1 .I
1.2
1.3
1 .4
Purpose
Demonstration Overview l-2
History of the Demonstration l-4
1.3.1 Planning Stages l-4
1.3.2 Site Announcement l-5
1.3.3 Request for Bids 1-5
1.3.4 Lawsuit 1-5
1.3.5 Bidding Conference and Bidding l-6
1.3.6 Selection of Winners l-6
1.3.7 Future Events l-7
Evaluation Methods and Data ‘l-8
1.4.1 Medicare Expenditures I-9
1.4.2 Beneficiary Access ‘l-10
1.4.3 Quality and Product Selection l-1 2
1.4.4 Competitiveness of the Market l-14
1.4.5 Reimbursement System l-16
1.4.6 Data Collection Methods l-1 9
1.4.7 Baseline Beneficiary Surveys I-19
1.4.8 Qualitative Studies l-19
2 Medicare Expenditures
2.1 Expenditures
2.2 Prices .._ ..,
2.3 Estimated Annual Savings to Medicare and Beneficiaries
2.4 Weighting issues
111
m
ES-l
l-l
l-l
2-l
2-l
2-2
2-l 6
2-18

2.5 Utilization 2-l 9
2.6 Summary and Next Steps 2-l 9
3 Beneficiary Access 3-l
3.1 Baseline Beneficiary Survey Results 32
3.2 Design Features to Promote and Maintain Benefrcrary Access 3-3
3.3 Results of the Bidding: Service Areas 3-3
3.4 Site Visit Results J-4
3.5 Summary and Next Steps 3-6
3 Quality and Product Selection 4-l
4.1 Baseline Beneficiary Surveys 4-2
4.2 Desrgn Features to Promote and Maintain Quality 4-5
4.3 Site Visit Results 4-5
4.4 Urological Supplies.. 4-6
4.5 Product Selection 4-8
4.6 Multiple Winners 4-9
4.7 Summary and Next Steps 4-l 0
5 Competitiveness of the Market 5-l
5.1 Number and Size of Suppliers Before Demonstratron 5-2
5.2 Number of Bidders 5-4
5.3 Bidding Strategies 5-5
5.4 Winners ._............................................. 5-7
5.5 Changes Since the Demonstration 5-7
5.6 Site Visit Results 5-9
5.7 Summary and Next Steps 5-l 5
iv

6 Reimbursement System ........................ .............. 6-l
6.1 Publicity, Solicitation, and Education ........ .............. 6-l
6.2 Management of the Bidding Process ................... .... 6-3
6.3 Selection of Winners ...................................... 6-5
6.4 Administration and Monitoring .........................
6.4.1 Processing System Changes ......................
6.4.2 Use of an On-Site Ombudsman ...................
6.4.3 Site Monitoring ...............................
6.4.4 The Relationship Between the Demonstration Contractor andHCFA ..................................
6-7 6-7
6-7 6-8
6-9
6.5 Discussion 6-l 1
7 Summary and Conclusions ...................... ................ 7-l
Glossary ................................................... ..C- 1
References ................................................... R-l
Appendix A-Weighting Issues A-l
Appendix B-Medicare Beneficiary Satisfaction with Durable Medical
Equipment Suppliers B-1
LIST OF FIGURES
Number
2-l Demonstration Price Changes for Oxygen Supplies 2-2 Demonstration Price Changes for Hospital Beds and Accessories
2-3 Demonstration Price Changes for Enteral Nutrition 2-4 Demonstration Price Changes for Urological Supplies 2-5 Demonstration Price Changes for Surgical Dressings
4-l
6-l
Beneficiary Satisfaction Ratings
Monthlv Number of Calls to the Ombudsman
2-l 3
2-13 2-14 2-l 5 2-l 6
4-3
6-9

LIST OF TABLES
Number
l-1
l-2 l-3 l-4 l-5
l-6 I-7
Demonstration Timeline: Polk County, Florida Site Demonstration Suppliers by Product Category
Evaluation Approach: Medicare Expenditures Evaluation Approach: Beneficiary Access Evaluation Approach: Quality and Product Selection Evaluation Approach: Competitiveness of the Market
Evaluation Approach: Reimbursement System
u
1-3 1-7
1-l 1
l-13 l-15 117
1-l 8
2-l
2-2 2-3
2-4 2-5 2-6
2-7
Difference in Composite Prices Based on Florida Fee Schedule ..............
Oxygen ........................ Hospital Beds and Accessories .......
Demonstration Prices and the
......... ....... Enteral Nutrition ................................... Urological Supplies ................................
Surgical Dressings .................................
Estimated Annual Allowed Charges, Based on 1998 Volumes
2-2 2-4
2-5 2-7 2-a
2-l 0 2-l 7
3-l Beneficiary Ratings of Access Variables, Polk and Brevard Counties 3-2
4-l Beneficiary Ratings of Supplier Quality, Polk and Brevard Counties 4-4
5-l Number and Size of Suppliers in Polk County in 1997 5-2a Number of Suppliers that Bid
5-2b Number of Bids by Product Category
5-3 Number of Bidders, Winners, and Composite Bids by Product Category 5-4 Bidding Strategy by Product Category
5-5 Bidding Strategy of Winners by Product Category
5-3 5-4 5-4 5-5 5-6 5-a
vii
EXECUTIVE SUMMARY
ES.1 Background and Methods
ES. 1.1 Background and Purpose
The Balanced Budget Act of 1997 (BBA 97) (U.S. Congress, 19971 authorizes the Secretary
of the Department of Health and Human Services to implement up to five demonstration projects
of competitive bidding for Medicare Part H items and services, except physrcian services. On the
basis of this authority, the Health Care Financing Admrnistration (HCFA) planned and
implemented the DMEPOS Competitive Bidding Demonstration to test the use of competitrve
bidding to set prices for durable medical equipment (DME) and prosthetics, orthotics, and
supplies (POS). Bidding in the first demonstration site, Polk County, Florida, was conducted in
early 1999, and the resulting prices took effect on October 1, 1999.
BBA 97 also requires that the demonstrations be evaluated for their impact on Medicare
program payments, access, diversity of product selection, and qualitv. The purpose of this report
is to describe the results to date of the evaluation of the DMEPOS Competitive Bidding
Demonstration. We evaluate the impact of the demonstration on
l Medicare expenditures,
l beneficiary access to care,
l quality of care (including diversity of product selection),
l competitiveness of the market, and
l the reimbursement system.
This report focuses on the evaluation of the first demonstration site, Polk County, Florida.
We emphasize that the demonstration in Polk County will continue until September 30, 2002,
and our evaluation will continue throughout this period. This evaluation report covers the period
leading up to the demonstration and the first 9 of the 36 months that the demonstration prices will
be in effect, Although we have learned a number of lessons from the evaluation so far, we
caution that it is premature to make final conclusions about the long-term impact of the
demonstration on many of the evaluation issues.
ES-l

ES. 1.2 Demonstration Overview
The Polk County DMEPOS Competitive Bidding Demonstration is scheduled to last for 3
years. It will have two rounds of bidding. The first round resulted in a fee schedule that will be
in effect for 2 years, and the fee schedule based on the second round of bidding will be in effect
for 1 year. Each of the five product categories included in the demonstration (oxygen supplies
and equipment, hospital beds and accessories, enteral nutrition, urological supplies, and surgical
dressings) is considered a separate competition, so suppliers are required to submit separate bids
for each product category in which they wish to compete.
Demonstration suppliers are selected using a four-stage bid evaluation process. First,
those bidders that meet the demonstration’s eligibility and quality standards are identified.
Second, a composite bid for each bidder is calculated from their bid submissions, and a cutoff
composite price is chosen. Only those bids that are at or below this cutoff will be considered for
further evaluation. In setting the cutoff, the supply capacity and geographic coverage provided by
the bidders are considered. Finally, references from referral agents (hospital discharge planners,
social workers, physician office staff, and home health workers who reier patients to DMEPOS
suppliers) are evaluated and onsite inspections are made to verify that the remaining bidders
meet general and product-specific quality and service requirements.
At the end of the bid evaluation process, multiple demonstration suppliers are selected in
each category. Demonstration suppliers are not guaranteed to receive a set number of Medicare
patients. These provisions of the demonstration are designed to promote competition between
demonstration suppliers for patients. This competition, it is hoped, will encourage suppliers to
maintain quality and service levels during the demonstration.
The new fee schedule is determined from the demonstration suppliers’ bids. The
demonstration suppliers will be reimbursed according to this new fee schedule, minus the 20
percent beneficiary copayment and any applicable deductibles.
Several transition policies cover beneficiary/supplier relationships that existed prior to the
demonstration. Beneficiaries may continue to receive oxygen supplies from their original
supplier, regardless of whether the supplier is a demonstration supplier. However, payments will
be made according to the new demonstration fee schedule. Those beneficiaries that have
preexisting rental agreements for enteral pumps and hospital beds may continue to use their
current supplier, and these suppliers will be paid the preexisting fees for the duration of the rental
period. If beneficiaries use a nondemonstration supplier of urological supplies or surgical
ES-2

dressings in error, then Medicare will cover the first 2 months of claims while the beneficiary
locates a new supplier.
The demonstration includes quality standards for demonstration suppliers, and these
standards exceed current standards. Also, HCFA designated an Ombudsman to receive, record,
and respond to complaints from beneficiaries, physicians, suppliers, and other interested parties.
ES. 1.3 Methods and Data
This evaluation requires extensive descriptive and explanatory analyses to evaluate both
the effectiveness of the implementation process and the impact of the demonstration on
beneficiaries, providers, and the Medicare program. We are addressing the five evaluation areas
using several sources of qualitative and quantitative data. Data sources include site visits and
telephone discussions with key demonstration participants, focus groups, a review of
documentation, surveys of beneficiaries and providers, bid analysis, and claims analysis. For
many analyses, we are using an external comparison group composed of Medicare beneficiaries
from Brevard County, Florida. Brevard County was chosen as the comparison county because it
closely resembles Polk County in several key characteristics.
To date, we have conducted baseline surveys of Medicare beneficiaries in Polk and
Brevard Counties prior to the start of the demonstration; analyzed biddmg results and estimated
potential reductions in Medicare allowed charges; and conducted a series of site visits to Polk
County where we interviewed beneficiaries, DME suppliers, referral agents who refer
beneficiaries to suppliers, and the demonstration Ombudsman. We also conducted a site visit to
Columbia, South Carolina, where we interviewed staff of Palmetto Government Benefits
Administrators (CBA), HCFA’s demonstration contractor. Later in the evaluation, we will conduct
follow-up surveys of beneficiaries and a survey of suppliers, analyze utilization claims and
expenditures data, and make additional site visits to Polk County.
ES.2 Medicare Expenditures
Medicare allowed charges equal the product of price times the volume of utilization,
summed across procedures. By comparing the demonstration prices to the Florida fee schedule
that would have been in effect in the absence of the demonstration, we can calculate the
demonstration’s impact on prices. We do not yet have sufficient claims data to estimate the
demonstration’s impact on utilization. However, if we assume that utilization remains constant,
we can estimate annual allowed charges. The key findings in this section are as follows:
l Demonstration prices are lower than the existing Florida fee schedule for most items in
every product category except surgical dressings. Demonstration prices are lower for
ES-3
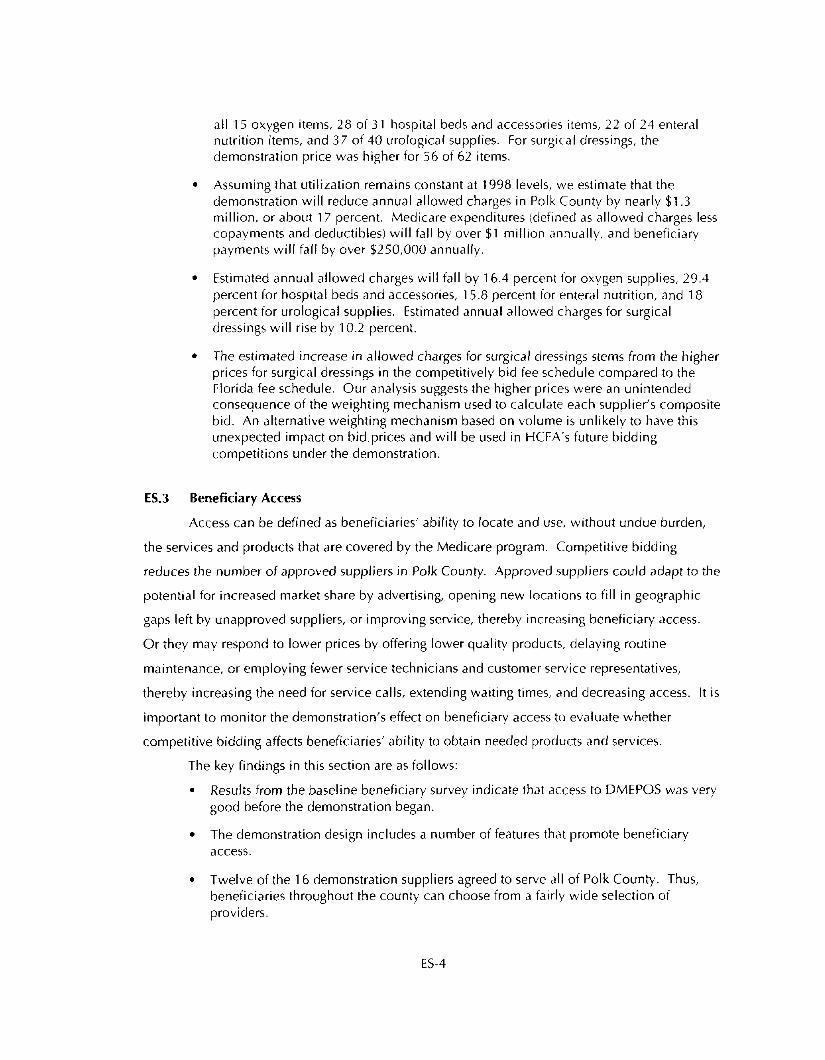
all 15 oxygen items, 28 of 3 1 hospital beds and accessones items, 22 of 24 enteral nutrition items, and 37 of 40 urological supplies. For surgical dressings, the demonstration price was higher for 56 of 62 items.
l Assuming that utilization remains constant at 1998 levels, we estimate that the
demonstration will reduce annual allowed charges in Polk County by nearly $1.3 million, or about 17 percent. Medicare expenditures (defined as allowed charges less copayments and deductibles) will fall by over $1 million annually, and beneficiary
payments will fall by over $250,000 annually.
l Estimated annual allowed charges will fall by 16.4 percent for oxygen supplies, 29.4 percent for hospital beds and accessories, 15.8 percent for enteral nutrition, and 18
percent for urological supplies. Estimated annual allowed charges for surgical dressings will rise by 10.2 percent.
l The estimated increase in allowed charges for surgical dressings stems from the higher
prices for surgical dressings in the competitively bid fee schedule compared to the Florida fee schedule. Our analysis suggests the higher prices were an unintended consequence of the weighting mechanism used to calculate each supplier’s composite bid. An alternative weighting mechamsm based on volume is unlikely to have this unexpected impact on bid prices and will be used in HCFA’s future bidding
competitions under the demonstration.
ES.3 Beneficiary Access
Access can be defined as beneficiaries’ ability to locate and use, without undue burden,
the services and products that are covered by the Medicare program. Competitive bidding
reduces the number of approved suppliers in Polk County. Approved suppliers could adapt to the
potential for increased market share by advertising, opening new locations to fill in geographic
gaps left by unapproved suppliers, or improving service, thereby increasing beneficiary access.
Or they may respond to lower prices by offering lower quality products, delaying routine
maintenance, or employing fewer service technicians and customer service representatives,
thereby increasing the need for service calls, extending waiting times, and decreasing access. It is
important to monitor the demonstration’s effect on beneficiary access to evaluate whether
competitive bidding affects beneficiaries’ ability to obtain needed products and services.
The key findings in this section are as follows:
l Results from the baseline beneficiary survey indicate that access to DMEPOS was very
good before the demonstration began.
l The demonstration design includes a number of features that promote beneficiary access.
l Twelve of the 16 demonstration suppliers agreed to serve all of Polk County. Thus, beneficiaries throughout the county can choose from a fairly wide selection of providers.
ES-4

l During the transition to demonstration prices, there were no substantial barriers to access. This result is related to the transition policies for oxvgen, hospital beds, and
enteral nutrition, as well as nondemonstration suppliers’ willingness to accept demonstration prices and continue serving their patients.
l Through our latest site visits in May 2000, no systematic problems in beneficiary access had materialized.
l It is premature to evaluate the long-term effects of the demonstration on access
ES.4 Quality and Product Selection
I f competitive bidding results in pressure on profit margins, then suppliers may attempt to
restore profits by supplying less expensive and possibly lower quality products and services.
Lower quality may be manifested in a number of ways; for example, by offering lower-quality
products, postponing preventive maintenance, delaying service calls, limiting product selection,
or reducing inventory to the point that time needed to fill orders is increased. Consequently, our
approach has been to evaluate the potential effect of the demonstration on the quality of products
and services by obtaining information directly from Medicare beneficiaries, beneficiary
organizations, referral agents, and suppliers.
The key findings in this section are as follows:
l Results from the baseline beneficiary survey indicate that the quality of services and
equipment that beneficiaries received prior to the demonstration was very good.
l The demonstration design includes a number of features that promote quality
l There have been no systematic reports of substantial changes in the quality of services or equipment provided to beneficiaries under the demonstration. A few referral agents
tried more than one demonstration supplier before finding a supplier they were satisfied wrth, but this appears to have been a transitory problem. If referral agents were not satisfied wrth the initial demonstration supplier, they switched to another demonstration supplier that provided satisfactory service and quality.
l Many of the demonstration suppliers report that they underbid on urological supplies. This resulted in a demonstration reimbursement schedule that sometimes does not
cover the cost of purchasing certain items.
l We have observed no changes in product selection in the oxygen, hospital beds, and
enteral nutrition product categories. Product selection may have improved in the surgical dressings category. The effects of the demonstration on product selection in
the urological supplies category are unclear at this time.
l It is premature to evaluate the long-term effects of the demonstration on quality and product selection.
ES-5

ES.5 Competitiveness of the Market
The process of selecting winners may substantially reduce the number of suppliers that
serve the Polk County market. In order for the second round of biddrng to be successful, there
must be a sufficient number of bidders left in the market to induce comoetitive bids. Suppliers are
also keenly interested in the demonstration’s impact on competition. To evaluate the impact of
the demonstration on the competitiveness of the market, we analyzed the size and number of
supplrers serving Polk County prior to the demonstration, the size and number of bidding
suppliers, bidding strategies, and strategies of winning bidders. We also examined industry
changes such as acquisitions and bankruptcies that have occurred since the demonstration
started. Finally, we interviewed suppliers about their experience with and concerns about the
demonstration to date.
The key findings in this section are as follows:
l A total of 30 suppliers submitted bids in at least one of the product categories. Sixteen suppliers, both large and small firms, were selected as winners. The most common winning strategy was to vary the percentage discount across most procedures in a
product category.
l Few suppliers adopted a bidding strategy that lowered prices for all items by the same percentage, relative to the existing fee schedules. Instead, most bidders cut prices for individual items by varying percentages. Indirectly, this result suggests that relative prices for DMEPOS are not accurately reflected in the existing Florida fee schedule.
l A nondemonstration supplier has acquired two demonstration suppliers. It is unclear whether these acquisitions are directly related to the demonstration. Demonstration
suppliers were concerned about the ability of nondemonstration suppliers to obtain demonstration status through acquisitions.
l The parent companies of one nondemonstration supplier and one demonstration supplier have filed for bankruptcy. Another demonstration supplier has also filed for bankruptcy protection. These events do not appear to be directly related to the
demonstration, and the suppliers continue to supply the demonstration site.
l Increases in volume for demonstration suppliers were less than suppliers expected, partially because expectations may have been too high, and partially because many nondemonstration supphers chose to continue serving existing patients under the demonstration’s transition policies. HCFA should stress in future demonstrations that
volume is not guaranteed and present information on volume effects for demonstration
suppliers based on the Polk County experience.
l Our analysis in the access and quality sections of the evaluation suggests that
demonstration suppliers will still need to compete on the basis of service and quality to attract new patients. Referral agents select suppliers on the basis of these
characteristics. Some referral agents have tried new suppliers as a result of the demonstration; if the initial demonstration supplier did not provide satisfactory service
and quality, the referral agents switched to another demonstration supplier.
ES-6

l Demonstration suppliers were concerned about nondemonstration suppliers serving as brokers by continuing to take referrals from referral agents and then referring the patients to a demonstration supplier of their choosing. This practice, while not in
violation of the demonstration rules, may not be positive for beneficiaries and has been addressed by the Ombudsman.
l Demonstration suppliers were concerned about demonstration suppliers using
nondemonstration suppliers as subcontractors. While subcontracting is permitted under the rules of the demonstration, it does not appear to be a common practice The level of subcontracting has been limited in the next demonstration site.
ES.6 Reimbursement System
In the first year of the evaluation, we have devoted considerable effort to understanding
and documentmg the process of developing the competitive bidding reimbursement system. We
considered such issues as stakeholder education, bid solicitation, evaluation of bids, claims
processing, and supplier monitoring. Detailed documentation of the process will assist HCFA in
replicating the demonstration as well as determining what aspects of the demonstration were most
successful and what improvements might be made.
The key findings in this section are as follows:
l Competitive bidding can be successfully implemented.
l HCFA and its contractor exerted major efforts to educate beneficiaries, suppliers, and referral agents about the demonstration.
l The information included about the demonstration in the Request for Bids (RFB) and Bidders Conference was useful to suppliers.
l The bid evaluation process did not simply focus on price; supplier capacity and quality were carefully considered during this process. The demonstration contractor
has proposed methods for streamlining the bid evaluation process.
l Demonstration claims are being processed smoothly.
l The presence of an on-site Ombudsman has greatly facilitated implementation of the
demonstration.
ES.7 Summary and Conclusions
Based on 9 months of operation, the DMEPOS Competitive Bidding Demonstration shows
promise in meeting its objectives. Competitive bidding has lowered the prices paid by Medicare.
Because we do not yet have data on utilization, we cannot definitively conclude that total
DMEPOS allowed charges (the product of price times utilization) will fall. However, if utilization
remains constant, we estimate that Medicare allowed charges for demonstration products will fall
by nearly $1 .3 million annually, a reduction of 17 percent.
ES-7

The demonstration has also shown that HCFA can design, implement, and operate a
reimbursement system that uses competitive bidding. HCFA was able to notify stakeholders about
the demonstration and provide educational materials to interested parties. HCFA was also able to
solicit and evaluate bids and select demonstration suppliers. The administrative claims system
was modified to incorporate competitive bidding, and demonstration claims are being processed
smoothly. Aided by the presence of an on-site Ombudsman, HCFA appears to be monitoring the
demonstration successfully.
However, important evaluation issues remain unresolved. Because the demonstration is
still relatively new, it is not yet possible to evaluate the full effects of the demonstration on
beneficiary access, quality and product selection, and competitiveness of the market. To date, we
have not observed a systematic impact of the demonstration on beneficiary access or quality and
product selection. It is premature to evaluate whether the demonstration will have negative or
positive impacts on access and quality in the long run. Based on our experience to date, quality
problems are most likely to occur in the urological supplies product category, and we will
monitor that product category carefully. It is also premature to evaluate whether the
demonstration will have long-run impacts on market competitiveness in Polk County. In the short
run, the demonstration attracted numerous bidders, and demonstration suppliers appear to be
competing on the basis of quality and service to attract and maintain patients. However, the
long-run effects on competition will only become apparent after a year or more’s experience with
the demonstration.
Given these unresolved issues, it is premature to declare that competitive bidding is either
an appropriate or an inappropriate reimbursement mechanism for DMEPOS. Our evaluation will
continue throughout the duration of the demonstration in Polk County, and we will collect
extensive information on the demonstration’s impact over time. We will also evaluate the impact
of competitive bidding in San Antonio, Texas, which was recently announced as the second
demonstration site. We will issue the Year 2 Annual Evaluation Report and Report to Congress
1 year from now, and the Final Evaluation Report and Report to Congress after the demonstration
concludes.
ES-8
SECTION 1 BACKGROUND AND METHODS
1.1 Purpose
The Balanced Budget Act of 1997 (BBA 97) (U.S. Congress, 1997) authorizes the Secretary
of the Department of Health and Human Services to implement up to five demonstration projects
of competitive bidding for Medicare Part t? items and services, except physician services. At least
one of these demonstration projects must include oxygen and oxygen services. On the basis of
this authority, the Health Care Financing Administration (HCFA) planned and implemented the
DMEPOS Competitive Bidding Demonstration to test the use of competitive bidding to set prices
for durable medical equipment (DME) and prosthetics, orthotics, and supplres (POS). Bidding in
the first demonstration site, Polk County, Florida, was conducted in early 1999, and the resulting
prices took effect on October 1, 1999.
BBA 97 also requires that the demonstrations be evaluated for their impact on Medicare
program payments, access, diversity of product selection, and quality. The purpose of this report
is to describe the results to date of the evaluation of the DMEPOS Competitive Bidding
Demonstration. We evaluate the impact of the demonstration on
l Medicare expenditures,
l beneficiary access to care,
l quality of care (including diversity of product selectionl,
l competitiveness of the market, and
. the reimbursement system
This report focuses on the evaluation of the first demonstration site, Polk County, Florida.
Three counties in the San Antonio, Texas metropolitan statistical area (MSA) have been selected
for a second site for the DMEPOS Competitive Bidding Demonstration, and the bidding process
has begun; however, it is too early to report evaluation results for the San Antonio demonstration
site. We emphasize that the demonstration in Polk County will continue until September 30,
2002, and our evaluation will continue throughout this period. This evaluation report covers the
period leading up to the demonstration and the first 9 of the 36 months that the demonstration
prices will be in effect. Although we have learned a number of lessons from the evaluation so far,
it is premature to make final conclusions about the long-term impact of the demonstration on
l-1
many of the evaluation issues. We will repeat this caution throughout our report, as we identify
evaluation activities that will continue for the duration of the demonstration.
In the remainder of this section, we provide an overview of the key features of the
demonstration design; provide a brief history of the demonstration to elate; and discuss links
between the major evaluation issues, our evaluation approach, and the methods and data we use
to perform the evaluation. Sections 2 through 6 describe the evaluation results for Medicare
expenditures, access, quality, competitiveness of the market, and the reimbursement system,
respectively. In each of these sections, we present results, identify unresolved issues, and discuss
ongoing evaluation activities. In Section 7, we summarize the key conclusions across evaluation
areas and make policy recommendations on the basis of these conclusions.
1.2 Demonstration Overview
The Polk County DMEPOS Competitive Bidding Demonstration is scheduled to last for 3
years (see Table 1-l ). It will have two rounds of bidding. The first round resulted in a fee
schedule that will be in effect for 2 years, and the seconi round fee schedule based on the
bidding will be in effect for 1 year. Each of the five product categories included in the
demonstration (oxygen supplies and equipment, hospital beds and accessories, enteral nutrition,
urological supplies, and surgical dressings) is considered a separate competition, so suppliers are
required to submit separate bids for each product category in which they wish to compete.
Demonstration suppliers are selected using a four-stage bid evaluation process. First,
those bidders that meet the demonstration’s eligibility and quality standards are identified.
Second, a composite bid for each bidder is calculated from their bid submissions, and a cutoff
composite price is chosen. Only those bids that are at or below this cutoff will be considered for
further evaluation. In setting the cutoff, the supply capacity and geographic coverage provided by
the bidders are considered. Finally, references from referral agents (hospital discharge planners,
social workers, physician office staff, and home health workers who refer patients to DMEPOS
suppliers) are evaluated and on-site inspections are made to verify that the remaining bidders
meet general and product-specific quality and service requirements.
At the end of the bid evaluation process, multiple demonstration suppliers are selected in
each category. Demonstration suppliers are not guaranteed to receive a set number of Medicare
patients. These provisions of the demonstration are designed to promote competition between
demonstration suppliers for patients. This competition, it is hoped, will encourage suppliers to
maintain quality and service levels during the demonstration.
l-2

Table l-1. Demonstration Timeline: Polk County, Florida Site
Demonstration Event Date
WA 97 Passed
Site Announcement
Request for Bids
Bidders Conference
Bid Submission Deadline
Bid Evaluation
Winners Announced
Supplier Directory Distributed
New Prices Take Effect
Second Round oi Bidding
Second Round Prices Take Effect
Demonstration Ends
August S, 1997
May 29, 1998
February 11, 1999
February 23, 1999
March 29, 1999
March 29-July 12, 1999
August 13, 1999
September 73, 1999
October 1, 1999
April 2001
October 1, 2001
Seotember 30. 2002
The new fee schedule is determined from the demonstration suppliers’ bids. The
demonstration suppliers will be reimbursed according to this new fee schedule, minus the 20
percent beneficiary copayment and any applicable deductibles.
Several transition policies cover beneficiary/supplier relationships that existed prior to the
demonstration. Beneficiaries may continue to receive oxygen supplies from their original
supplier, regardless of whether the supplier is a demonstration supplier. However, payments will
be made according to the new demonstration fee schedule. Those beneficiaries that have
preexisting rental agreements for enteral pumps and hospital beds may continue to use their
current supplier, and these suppliers will be paid the preexisting fees for the duration of the rental
period. If beneficiaries use a nondemonstration supplier of urological supplies or surgical
dressings in error, then Medicare will cover the first 2 months of clarms while the beneficiary
locates a new supplier.
Special policies cover reimbursement for demonstration products that are covered by Part
B when Medicare beneficiaries reside in skilled nursing facilities (SNFs). SNFs are allowed to
continue existing relationships with nondemonstration suppliers, but payments are made on the
basis of the demonstration fee schedule. In order to implement these policies, SNFs were asked
to provide information about their DME suppliers.
The demonstration includes quality standards for demonstration suppliers, and these
standards exceed those set under the National Supplier Clearinghouse program.. Also, HCFA
l-3
designated an Ombudsman to receive, record, and respond to complaints from beneficiaries,
physicians, suppliers, and other interested parties. Palmetto Government Benefits Administrators
(Palmetto CBA) is implementing the demonstration under contract and in collaboration with
HCFA.
1.3 History of the Demonstration
1.3.1 Planning Stages
HCFA has long been interested in using competitive bidding to set Medicare fee
schedules. Developmental work on competitive bidding demonstrations for clinical laboratory
services and DME began in the mid-1980s. However, because of a congressional funding
moratorium, the projects were not implemented at that time. HCFA resumed work on the clinical
laboratory and DME competitive bidding demonstrations in 1995.
Interest in competitive bidding has intensified in recent years as continued growth in
Medicare spending has forced HCFA, the President, and Congress to seek additional innovative
means to control program spending. This interest culminated in provisions addressing
competitive bidding in the BBA 97. BBA 97 authorizes the Secretary of Health and Human
Services to conduct up to five demonstration projects of competitive bidding for Part B items and
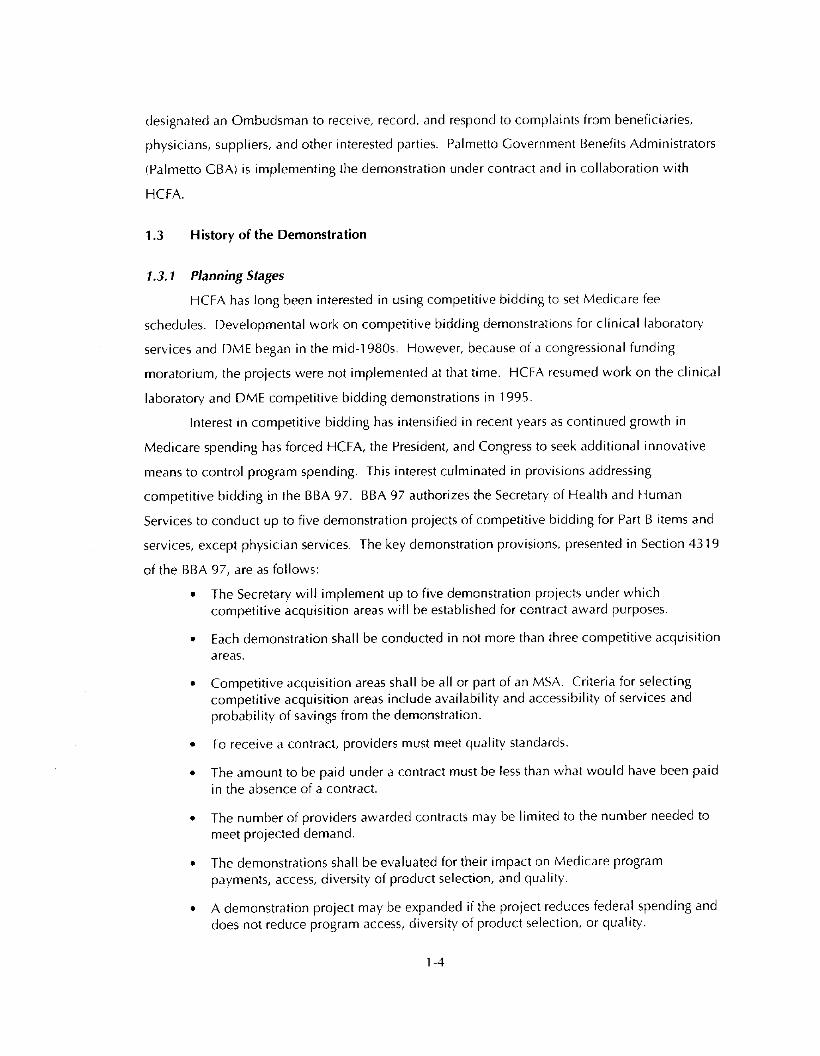
services, except physician services. The key demonstration provisions, presented in Section 4319
of the BBA 97. are as follows:
The Secretary will implement up to five demonstration projects under which competitive acquisition areas will be established for contract award purposes.
Each demonstration shall be conducted in not more than three competitive acquisition
areas.
Competitive acquisition areas shall be all or part of an MSA. Criteria for selecting
competitive acquisition areas include availability and accessibility of services and probability of savings from the demonstration.
To receive a contract, providers must meet quality standards.
The amount to be paid under a contract must be less than what would have been paid in the absence of a contract.
The number of providers awarded contracts may be limited to the number needed to meet projected demand.
The demonstrations shall be evaluated for their impact on Medicare program
payments, access, diversity of product selection, and quality.
A demonstration project may be expanded if the project reduces federal spending and does not reduce program access, diversity of product selection, or quality.
l-4

l The demonstration may include any Part B service except physician services. At least
one demonstration project will include oxygen and oxygen equipment.
l The demonstrations-which will be operated over a 3-year period-must be
completed by December 31, 2002.
7.3.2 Site Announcement
On May 29, 1998, Polk County, Florida-an MSA that includes the cities of Lakeland and
Winter Haven-was announced as the first site for the DMEPOS Competitive Bidding
Demonstration. Polk County was selected because it has a relatively small population but a large
proportion of Medicare beneficiaries, high expenditures for DMEPOS per beneficiary, and a large
number of suppliers servicing the area. In 1997, 4,500 beneficiaries received about $6.6 million
in Medicare reimbursement for the products included in the demonstration. Nationally, Medicare
paid about $3 billion for the items included in the demonstration. The following DMEPOS
product groups were included in the demonstration:
. oxygen supplies and equipment,
l hospital beds and accessories,
. enteral nutrition,
l urological supplies, and
l surgical dressings
7.3.3 Request for Bids
On February 11, 1999, HCFA sent a Request for Bids (RFBI to every supplier that had
submitted claims to Medicare during the previous year for items included in the demonstration
and for beneficiaries residing in the demonstration area. HCFA also published notices of the
demonstration in national trade journals and in Commerce Business Daily, a publication that lists
upcoming government procurements.
7.3.4 Lawsuit
Medi-Health Care Inc., C&C Homecare, and Florida Association of Medical Equipment
Dealers (collectively “FAMED”) filed an injunction against the commissioner of the Social
Security Administration on February 4, 1999. FAMED alleged that, in developing the competitive
demonstration project, HCFA had violated the Federal Advisory Committee Act (FACA), which
ensures public access and participation in advisory committee meetings and makes available to
the public any documentation from the meeting. HCFA had convened a National Technical
l-5
Expert Panel (NTEPI to gather feedback regarding the design of the competitive bidding project
and to enhance communication wrth Interested members of the public. The panel met three
times and was not expected to, and did not, issue a report. FAMED claimed that they were
unable to participate in the NTEP because they did not receive proper notice. Had they been able
to participate, they would have hoped to influence the structure of the demonstration and afford
themselves a better chance to bid successfully. FAMED asked that HCFA be prevented from using
any of the recommendations from the NTEP and that the demonstration project be delayed until
the FACA requirements were met. However, the case was dismissed, and the United States Court
of Appeals, Eleventh Circuit, denied FAMED’s appeal on November 9, 1999 (194 F.3d 12271,
stating that FAMED was only able to allege speculative damages and a tenuous causal connection
of damages to the alleged violations. The lawsuit may have caused uncertainty among suppliers
about whether the demonstration would proceed as scheduled. Ultimately, however, the lawsuit
did not delav the demonstration.
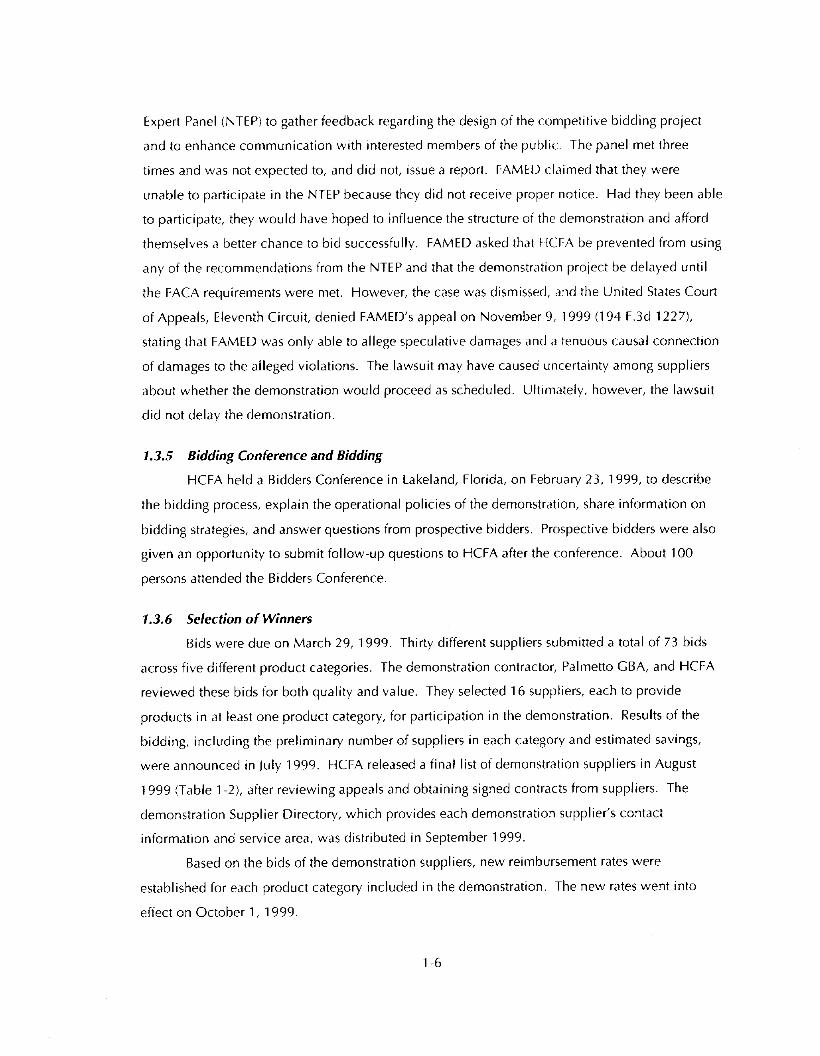
1.3.5 Bidding Conference and Bidding
HCFA held a Bidders Conference in Lakeland, Florida, on February 23, 1999, to describe
the bidding process, explain the operational policies of the demonstration, share information on
bidding strategies, and answer questions from prospective bidders. Prospective bidders were also
given an opportunity to submit follow-up questions to HCFA after the conference. About 100
persons attended the Bidders Conference.
7.3.6 Selection of Winners
Bids were due on March 29, 1999. Thirty different suppliers submitted a total of 73 bids
across five different product categories. The demonstration contractor, Palmetto CBA, and HCFA
reviewed these bids for both quality and value. They selected 16 suppliers, each to provide
products in at least one product category, for participation in the demonstration. Results of the
bidding, including the preliminary number of suppliers in each category and estimated savings,
were announced in July 1999. HCFA released a final list of demonstration suppliers in August
1999 (Table l-2), after reviewing appeals and obtaining signed contracts from suppliers. The
demonstration Supplier Directory, which provides each demonstration supplier’s contact
information and service area, was distributed in September 1999.
Based on the bids of the demonstration suppliers, new reimbursement rates were
established for each product category included in the demonstration. The new rates went into
effect on October 1, 1999.
l-6
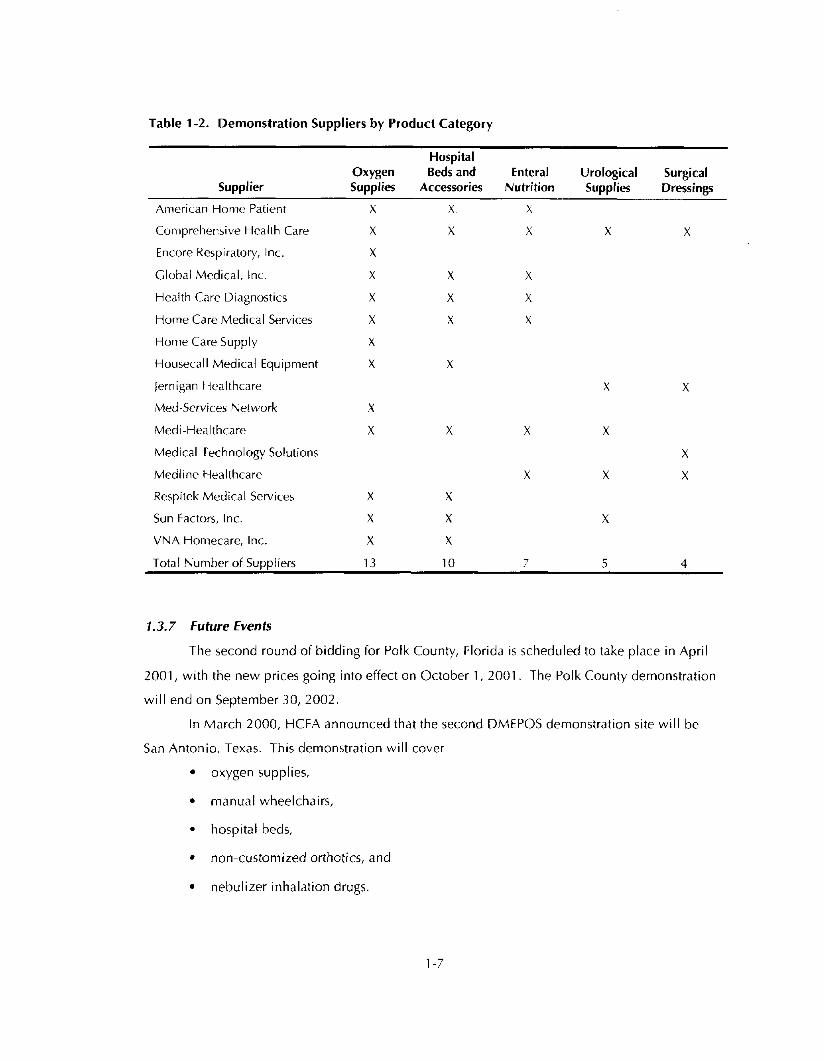
Table l-2. Demonstration Suppliers by Product Category
Supplier Oxygen Supplies
Hospital Beds and
Accessories Enteral Urological Surgical
Nutrition Supplies Dressings
American Home Patient X X X
Comprehensive Health Care X X X X X
Encore Respiratory, Inc. X
Global Medical, Inc. X X X
Health Care Diagnostics X X X
Home Care Medical Services X X X
Home Care Supply X
Housecall Medical Equipment X X
Jernigan Hcalthcare
M&Services Network X
Medi-Healthcare X X
Medical Technology Solutions
Respitek Medical Services
Sun Factors, Inc.
VNA Homecare, Inc.
X X
X X
X X
X
X
X
X
X
X
X
Total Number of Suppliers 13 10 7 5 4
1.3.7 Future Events
The second round of bidding for Polk County, Florida is scheduled to take place in April
2001, with the new prices going into effect on October 1, 2001. The Polk County demonstration
will end on September 30,2002.
In March 2000, HCFA announced that the second DMEPOS demonstration site will be
San Antonio, Texas. This demonstration will cover
. oxygen supplies,
. manual wheelchairs,
l hospital beds,
l non-customized orthotics, and
. nebulizer inhalation drugs.
l-7

According to a HCFA news release, San Antonio was selected for the demonstration “because it
has enough beneficiaries and suppliers to create the potential for significant savings”
(<www.hcfa.gov/ord/dmepr3OO.htm>). San Antonio has approximately 112,000 Medicare
beneficiaries in the three county area included in the demonstration. In 1998, Medicare paid an
average of $287 per area beneficiary for medical equipment and supplies. Between 15 and 48
suppliers provided significant services to Medicare beneficiaries in each of the five product areas
included in the demonstration. Bidding in San Antonio occurred in the spring of 2000, with new
prices scheduled to take effect in February 2001.
1.4 Evaluation Methods and Data
This section describes the methods and data we are using to evaluate the five major
evaluation areas (Medicare expenditures, access, quality, competttiveness of the market, and the
reimbursement system). This evaluation requires extensive descriptive and explanatory analyses
to evaluate both the effectiveness of the implementation process and the impact of the
demonstration on beneficiaries, providers, and the Medicare program. We address the five
evaluation areas using several sources of qualitative and quantitative data. Data sources include
site visits and telephone discussions with key demonstration participants, focus groups, a review
of documentation, surveys of beneficiaries and providers, bid analysis, and claims analysis.
For many analyses, we are using an external comparison group composed of Medicare
beneficiaries from Brevard County, Florida. Brevard County was chosen as the comparison
county because it closely resembles Polk County in several key characteristics:
l location in Florida
l a single-county MSA
. number of Medicare beneficiaries
. number of DME suppliers
. managed care penetration
Our primary focus in the evaluation is on Medicare, Medicare beneficiaries, and Medicare
suppliers. It is possible that the demonstration will affect non-Medicare beneficiaries or payers.
When those effects are clearly evident, we will report them, but such effects will not be a major
focus of our evaluation. Below, we discuss our approach for evaluating the five major evaluation
areas.
l-8

1.4.1 Medicare Expenditures
Our evaluation of Medicare expenditures focuses on price, utilization, and overall
expenditures (the product of price and utilization). The evaluation is addressing the following
primary questions:
l Does competitive bidding reduce the price Medicare pays for DMEPOS?
l Does utilization of DMEPOS rise, fall, or remain the same?
l Do overall Medicare expenditures for DMEPOS fall?
Question 1 is critical to the overall evaluation of the demonstration project because
proponents of competitive bidding expect that competitive bidding will reduce prices relative to
the current Medicare fee schedule. If this expectation is proven incorrect, much of the motivation
for using competitive bidding for DMEPOS will be lost. Conceptuallv, competitive bidding will
have a good chance of reducing Medicare fees if current fees are higher than supplier costs.
In the primary analysis of price, we compare the new price schedule generated by competitive
bidding to the DMEPOS fee schedule that would otherwise hold in Florida. For secondary
analyses, we will also compare the new fee schedule to the prices paid by the Veterans
Administration WA) for demonstration products.
For Question 2, the probable effects of competitive bidding on utilization are less clear,
because utilization is determined by the interplay between the demand for and the supply of
DMEPOS. To the extent that lower Medicare prices reduce beneficiary out-of-pocket costs,
beneficiaries will tend to increase the quantity demanded. Conversely, suppliers tend to reduce
the quantity supplied when prices fall, at least according to standard economic theory. On the
other hand, the theory of supplier-induced demand suggests that suppliers will try to exploit their
informational advantages to induce demand if they suddenly face lower prices. Although many
economists have criticized the theoretical underpinnings of supplier-induced demand, some
economists and many other researchers find this theory intuitively appealing. It is not clear to
what extent, if any, DMEPOS suppliers can induce demand. The demonstration is also designed
to weed out fraudulent suppliers, which could by itself reduce utilization. Of course, all of these
conjectures about utilization could be rendered moot by the nature of DMEPOS: to the extent
that the demand for DMEPOS is driven by medical necessity, rather than price, there may be
relatively little effect on utilization. In the analysis of utilization, we will use Medicare National
Claims History (NCH) data to compare utilization in the Polk County demonstration site to a
comparison group of Medicare patients in Brevard County.
l-9

For Question 3, the overall effect of competitive bidding for DMEPOS on utilization
depends on competitive bidding’s effect on both price and utilization. If price falls and utilization
either falls or remains the same, Medicare expenditures will definitely fall. I f price falls and
utilization rises, the overall effect on expenditures will depend on the relative magnitudes of the
two changes. If the percentage reduction in price is larger than the percentage increase in
utilization, overall expenditures will fall. Proponents of competitive bidding expect that price
reductions will dominate, but this expectation must be tested empirically. Data from the price
and utilization analyses will be combined to evaluate the overall effect of the demonstration on
Medicare expenditures.
Table l-3 summarizes the analyses to be performed. In the table, “pre-intervention” and
“post-intervention” refer to data for the periods before and after the demonstration fee schedule
took effect on October 1, 1999. Results of the analyses will be presented in Annual Evaluation
Keports; the last column of the table indicates the report in which results are expected to be
presented.
1.42 Beneficiary Access
Beneficiary access to and quality of DMEPOS services are interrelated, and both may
change in response to competitive bidding. The impact of competitive bidding on access and
quality is potentially very complex. The purpose of the evaluation is to determine which
outcomes occur and assess their implications for beneficiaries and suppliers.
From a conceptual standpoint, the demonstration’s effects on access and quality are not
clear. The competitive bidding rules have reduced the number of approved suppliers providing
DME to Medicare beneficiaries in Polk County. Further, if demand for services is constant
(because, for example, there is no change in beneficiary health status and DME technology),
competitive bidding will almost certainly reduce the total revenue available to suppliers and shift
the remaining revenue to fewer suppliers. Thus, we would expect some suppliers who do not bid
or whose bids are not accepted to be driven out of the local market. Approved suppliers might
experience increased profits from increased volume and share of total revenue or decreased
profits from smaller profit margins. Approved suppliers could adapt to the potential for increased
market share by advertising, opening new locations to fill in the geographic gaps left by suppliers
who are not approved, and improving service, thereby increasing beneficiary access.
Alternatively, they might retain their initial configuration and marketing behavior and attempt to
restore profit margins by offering lower-quality products, delaying routine maintenance, or
l-1 0

Table I-3. Evaluation Approach: Medicare Expenditures
Issue Method Data Source Pre- Post- Comparison Evaluation
Intervention Intervention Site Reoort”
Price Comparative analysis Bids; old and new fee schedules; VA lees J J 1, 3
Quantity Claims analysis National Claims I listory J J J 2-3
Total exnenditurcs Claims analvsis National Claims I ilstorv J J J 2-1,
d Report 1 : First Annual Evaluation Report. Report 2: Second Annual Evaluation Report. Report 3: Final Evaluation Report

employing fewer mechanics and customer service representatives, thereby increasing the need for
service calls, extending the waiting time for service, and decreasing access and quality. At the
same time, the demonstration also includes measures to maintain access and quality.
The evaluation addresses the following principal access question: Does competitive
bidding reduce the ability of beneficiaries to receive the DMEPOS servtces they need, when they
need them? We are performing several analyses to address this question. First, we have
examined whether the number of DME suppliers decreases in the demonstration site. Second, we
are collecting and analyzing data on perceived access from beneficiaries, suppliers, and referral
agents. Third, as claims data become available, we will examine realized access by testing
whether utilization changes in the demonstration site. Finally, we WIII test whether beneficiary
out-of-pocket expenses are affected by the demonstration. Table l-4 summarizes the analyses to
be performed.
1.4.3 Quabfy and Product Selection
If competitive bidding results in pressure on profit margins (an empirical question to be
determined as part of the evaluation), then suppliers may attempt to restore profits by lowering
quality and therefore their cost of goods and services. Lower quality may be manifested in many
ways: for example, by offering lower-quality products, postponing preventive maintenance,
delaying service calls, or reducing inventory to the point that time needed to fill orders increases,
or even, at the extreme, committing fraud and abuse. On the other hand, demonstration suppliers
will still have to compete among themselves to attract new patients, giving suppliers incentives to
maintain quality and offer a wide product selection. In addition, quality was one of the criteria
used to select demonstration suppliers.
Our analysis of demonstration effects on quality uses both the beneficiary and the supplier
as the unit of analysis. Beneficiary-level and supplier-level analyses wrll be based on both
qualitative and quantitative data.
The evaluation addresses the following principal quality questions:
l Does the demonstration reduce, maintain, or increase the quality of equipment provided to beneficiaries?
l Does the demonstration reduce, maintain, or increase the quality of service provided to beneficiaries?
l Does the demonstration reduce the product selection offered to beneficiaries?
l-12

Table l-4. Evaluation Approach: Beneficiary Access
Issue Method Data Source Pre- Post- Comparison Evaluation
Intervention Intervention site Renort”
Numhcr oi suppliers Claims analysis National Claims I listory J J J 2-3
Heneiicrary perceptions Survey ol users Reneticiarres J J J 1, 2
Ret’erral agent perceptions Focus groups Physicians and relerral agents J 1, ‘2
Supplier perceptions Focus groups Supplrers J 1, 2
Survey Suppliers J J 2
Realrzed access Claims analysis National Claims Iiistory, J J J 2-3
beneirciary surveys
Site visit Ombudsman J l-3
Out-of-pocket expenses Claims analysis National Claims I listory, J J J 2-J
Durable Medical Equipment
1, Regional Carrier w
” Report 1: First Annual Evaluation Report. Report 2: Second Annual Evaluation Report. Report I: Final Evaluatron Report

To answer these questions, we will analyze
l beneficiary assessments of quality,
. supplier assessments of quality,
. referral agent assessments of quality,
l product selection, and
l fraud and abuse data.
These analyses are summarized in Table l-5
1.4.4 Competitiveness of the Market
The process of selecting winners may substantially reduce the number of suppliers that
serve the Polk County market. This has important implications for the health of the DMEPOS
market in Florida. A sufficient number of bidders must be left in the market for both quality and
price competition benefits to be realized in the future. Obviously, reductions in the number of
suppliers also have special relevance to suppliers. Thus, the analysis of industry competitiveness
is an important component of the evaluation of the feasibility of competitive bidding. Our
analysis focuses on the following questions:
l Does competitive bidding significantly reduce the number of suppliers serving the market?
l Are small businesses differentially affected by the demonstration?
l Do winning bidders significantly increase market share?
l Has the demonstration adversely impacted future competition in the market?
To address these issues, we use econometric analysis where appropriate; however, some
questions related to competition can only be addressed in a case-study approach. We are
conducting a comprehensive qualitative and quantitative evaluation using pre- and post-
intervention claims data, data collected from a supplier survey, data collected in focus groups of
referral agents and suppliers conducted during site visits, and discussrons with other payers of
DMEPOS.
These data will allow us to characterize the supplier market in both the pre- and post-
intervention periods and evaluate what changes have occurred in the local market. Specifically,
we will make pre- and post-intervention comparisons of several measures of market competition,
including
l the number of suppliers providing each product category;
. the number of suppliers who are local or from beyond the market;
l-14
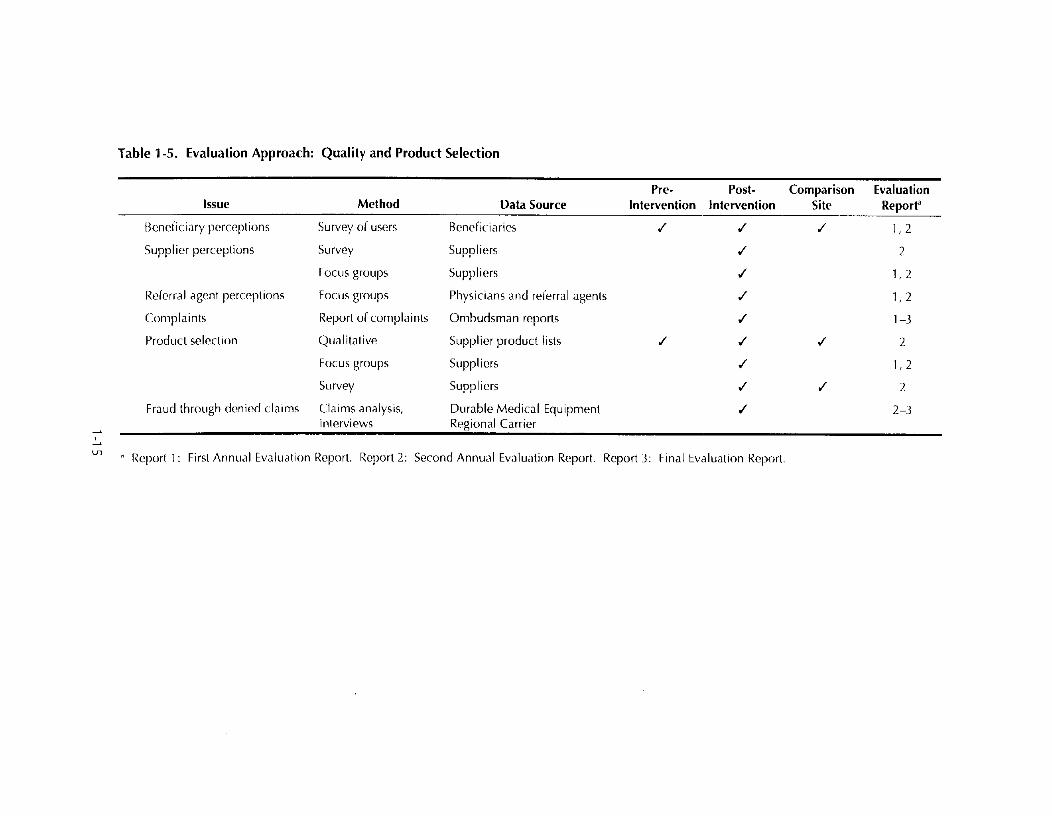
Table 1-5. Evaluation Approach: Quality and Product Selection
ISSUe Method Data Source Pre- Post- Comparison Evaluation
Intervention Intervention Site Report”
Hcnciiciary perceptions Survey of users
Supplier perceptions Survey
Focus groups
Kflrrral agent perceptions Focus groups
Complaints f&port of cornplaInts
Product scI~(.t~on Qualitative
Focus groups
Survey
Fraud through dcanic,d c-laims Claims analysis,
interviews
Beneficiaries
Suppliers
Suppliers
Physicians and referral agents
Ombudsman reports
Supplier product lists
Suppliers
Suppliers
Durable Medical Equipment
Regional Carrier
J J
J
J
J
J
J J
J
J
J
J I, 2
2
1.2
1,2
l-3
J 2
I,2
J 2
2-3
i( Report 1 : First Annual Evaluation Report. Report 2: Second Annual Evaluation Report. Report 3: FInal Evaluation Rrport

. the share of demonstration DMEPOS of the suppliers’ total business;
l the Herfindahl index, a measure of market concentration, for each product category;
and
l relative market shares of small, medium, and large suppliers by product category.
We are also analyzing the reasons behind changes in these variables by evaluating the following
in both the first and second round of bidding:
. entry and exit decisions for the Polk County market;
l bid decisions;
l the effect of winning the contract; and
l financial status by product type and supplier size, origin, and breadth of products.
The key industry competitiveness analyses are summarized in Table l-6
1.4.5 Reimbursement System
Our evaluation of the reimbursement system focuses on the process of the competitive
bidding demonstration itself, rather than on the outcomes (i.e., cost savings, access, and quality)
covered in other task areas. The process of the demonstration is a major focus of the evaluation
because one of the oblectives of the government’s policy is to achieve a fair and administratively
feasible reimbursement system. Information is being solicited from beneficiaries, suppliers,
physicians, referral sources, and government officials to determine whether the demonstration
does, in fact, meet this government objective.
Five areas (or phases) are being covered under the evaluation of the reimbursement
system: publicity and solicitation, management of the bidding process, selection of winners,
administration and monitoring, and public education. Methods used to evaluate the
reimbursement system include site visits, key informant interviews, focus groups, surveys, and
review of documentation. The following general evaluation questions will be addressed:
l What parts of the process worked? What did not work?
l What problems or barriers were encountered during implementation? How were they resolved?
l What were facilitating factors? Why?
l How can the competitive bidding system be improved in subsequent years?
Table 1-7 summarizes the methods and data sources we are using.
l-16

Table 1-6. Evaluation Approach: Competitiveness of the Market
Issue Method Data Source Pre- Post- Comparison Evaluation
Intervention Intervention Site Reoort”
Marltrt concentration I Ieriindahl Index Claims J J J L-3
Number o( bidders per round Bid analysis Bids J 1, 3
Supplier strategies Site visits Suppliers J 1, 3
Supplier pefcrptions Survey, site visits Suppliers J 1, L 3
Cost structure Survey, bid analysis Suppliers, bids J 1, 2, 3
* Rq)ort 1 : First Annual Evaluatwn Report. Report 2: Second Annual Evaluation Report. Report 1: Final Evaluation Report.

Table I-7. Evaluation Approach: Reimbursement System
Pre- Post- Comparison Evaluation Issue Method Data Source intervention intervention Site Report”
KclmlJursement systrm Survey, site visits Supphers J 1, 2
Focus groups Physicians and referral agents J > 1, 2
Site vtslt Durable Medical Equipment Regional J 1
Carrier
Site visit Ombudsman J 1-3
a Report 1: First Annual Evaluation Report. Kept 2: Second Annual Evaluation Rrport. Report %: Final Evaluation Report.

1.4.6 Data Collecfion Mefhods
The major data collection and analysis methods we are usrng in the evaluation are
surveys, qualitative studies, and claims data and statistical analysis. Below, we discuss the major
survey and qualitative data collection activities during the first year of the evaluation. The data
analysis component of this project will involve evaluating National Clarms History (NCH) and
enrollment data; this component will begin 1 year after the demonstration fee schedule goes into
effect.
1.4.7 Baseline Beneficiary Surveys
We fielded two beneficiary surveys: one for oxygen users and another very similar survey
for other medical equipment users (hospital beds, enteral nutrition, urological supplies, and
surgical dressings). Among the demonstration product categories, oxygen accounts for the
majority of beneficiaries and Medicare expenditures. We used the same survey for all other
equipment categories to provide enough observations for statistical analysis. The research
questions that were addressed by the surveys focused on access, quality, and product selection.
The initial beneficiary surveys were conducted from March through June 1999. We mailed
surveys to 2,895 beneficiaries: 1,600 oxygen users and 1,295 medical equipment users. The
overall response rate to the two surveys (excluding ineligible and deceased individuals) was 74
percent. The response rate for the oxygen survey was 82 percent, while the response rate for the
medical equipment survey was 63 percent. The follow-up beneficiary surveys will be fielded
during the fall of 2000, 1 year after the demonstration prices took effect. The data collection plan
for the initial surveys is described in Appendix B; a similar design is being used for the follow-up
surveys.
In addition to the follow-up beneficiary surveys, we will also conduct a survey of DME
suppliers in the fall of 2000. Suppliers in both Polk and Brevard Counties will be surveyed.
1.4.8 Qualitative Studies
The qualitative studies for this project include site visits, focus groups, review of written
materials, and telephone conversations with individuals involved in the demonstration, such as
beneficiaries, physicians, suppliers, the demonstration contractor, and others. The main
objectives of these qualitative studies are to gain an in-depth understanding of the effect the
demonstration is having on beneficiaries, referral agents, and suppliers and to observe and
monitor all aspects of the demonstration in a person-to-person environment.
l-1 9
Prior to the Polk County site visits, we contacted individuals to ask if they would be
willing to participate in an interview. We briefly explained the purpose of the site visit and
described the topics that we would discuss during the interview. We also explained that their
participation was confidential and that we would.not reveal their identity to HCFA or to any other
third party.
We conducted four site visits to Polk County in the first year of the evaluation. The first
site visit took place after bidding had occurred but before winners were announced. During the
first visit, we interviewed both suppliers who bid and suppliers who did not bid, focusing on the
bidding process and reasons for bidding or not bidding. We spoke with seven suppliers and the
Ombudsman during the visit; we interviewed an eighth supplier by telephone shortly thereafter.
The second visit took place 2 months after the demonstration prrces took effect. We
Interviewed beneficiaries and representatives of beneficiary groups, suppliers, referral agents, and
the demonstration Ombudsman. The interviews with beneficiarres and referral agents focused on
transition issues and the initial perceptions of the demonstration. The objective of the supplier
interviews was to describe implementation of the demonstration from the supplier perspective,
identify supplier planning and actions between the time winners were announced and new prices
took effect, and evaluate the early effects of the demonstration on suppliers. We spoke with four
suppliers, 13 referral agents and beneficiary groups, and the Ombudsman during this visit.
During the third site visit, which took place 6 months after the demonstration prices took
effect, we conducted separate focus groups with demonstration suppliers and referral agents. The
supplier focus group discussed implementation issues, product selection, service levels,
beneficiary access, and business activity. The referral agent focus group discussed access and
quality. Seven demonstration suppliers participated in the supplier focus group, and seven
referral agents participated in the referral agent focus group. We also met separately with a
nondemonstration supplier and the Ombudsman during this visit.
The fourth site visit took place 8 months after the demonstration prices took effect. During
this visit, we met with demonstration suppliers in the urological supplies product category to
discuss issues of access, quality, product selection, and pricing. We met with three of the
demonstration urological suppliers and conducted telephone interviews with the remaining two
demonstration suppliers in this product category.
In addition to the four Polk County site visits, we conducted one site visit to Palmetto
CBA, the demonstration contractor, in Columbia, South Carolina. This site visit took place 2
months after the demonstration prices took effect. During the visit, we discussed publicity and
education efforts, bid evaluation, claims processing changes, and other implementation issues. In
l-20

addition to conducting the demonstration, Palmetto CBA is the Durable Medical Equipment
Regional Carrier (DMERC) for Region C, which includes Florida. In this role, Palmetto CBA is
one of the four DMERCs that process Medicare DMEPOS claims.
1-2 1
SECTION 2 MEDICARE EXPENDITURES
2.1 Expenditures
In this section, we estimate the demonstration’s impact on Medicare allowed charges and
expenditures. Medicare allowed charges equal the product of price times the volume of
utilization, summed across procedures. By comparing the demonstration prices to the Florida fee
schedule that would have been in effect in the absence of the demonstration, we can calculate
the demonstration’s impact on prices. We do not yet have sufficient claims data to estimate the
demonstration’s impact on utilization. However, if we assume that utilization remains constant,
we can estimate the effect of the demonstration on annual allowed charges. Estimated allowed
charges can then be divided into Medicare expenditures (80 percent of allowed charges) and
beneficiary copayments (20 percent of allowed charges).
We begin this section by comparing demonstration prices to the prices that would have
been in effect under the Florida fee schedule. Using this comparison, we estimate reductions in
allowed charges for the demonstration, under the assumption that utilization is constant. We then
divide the reduction in allowed charges between reductions in Medicare payments and
reductions in beneficiary copayments.
In interpreting the results of this estimation, several issues arose regarding the weighting
mechanism used in Polk County to calculate composite prices and to set prices for individual
procedures. In Appendix A, we examine these issues in detail and show that an alternative
weighting mechanism based on volume may be desirable. HCFA plans to use the volume
weighting mechanism in the second demonstration site. We conclude this section by discussing
future analyses of utilization and Medicare expenditures.
The key findings in this section are as follows:
l Demonstration prices are lower than the existing Florida fee schedule for most items in every product category except surgical dressings. Demonstration prices are lower for all 15 oxvgen items, 28 of 31 hospital beds and accessories items, 22 of 24 enteral nutrition’items, and 37 of 40 urological supplies. For surgical dressings, the
demonstration price was higher for 56 of 62 items.
l Assuming that utilization remains constant at 1998 levels, we estimate that the
demonstration will reduce annual allowed charges in Polk County by nearly $1.3 million, or about 17 percent. Medicare expenditures (defined as allowed charges less
2-l

copayments and deductibles) will fall by over $1 millton annually, and beneficiary payments will fall bv over $250,000 annually.
l Estimated annual allowed charges will fall by 16.4 percent for oxygen supplies, 29.4 percent for hospital beds and accessories, 15.8 percent for enteral nutrition, and 18 percent for urological supplies. Estimated annual allowed charges for surgical dressings will rise by 10.2 percent.
l The estimated increase in allowed charges for surgical dressings stems from the higher prices for surgical dressings in the competitively bid fee schedule compared to the Florida fee schedule. Our analysis suggests the higher prices were an unintended
consequence of the weighting mechanism used to calculate each supplier’s composite bid. An alternative weighting mechanism based on volume is unlikely to have this
unexpected impact on bid prices, and will be used in HCFA’s future bidding competitions under the demonstration.
2.2 Prices
After winners had been selected, the demonstration fee schedule for individual procedures
was derived based on the cutoff composite bid and winning suppliers’ bids for the procedure, as
follows. First, a supplier ratio was calculated by dividing the cutoff composite bid by the
supplier’s composite bid for each winning supplier. Note that the ratio is greater than or equal to
one because the cutoff composite bid is the highest acceptable bid. Next, an adjusted bid was
calculated by multiplying the supplier’s bid for each product times the supplier ratio. Finally, the
prices for each product were derived by averaging the adjusted bids over all winning suppliers.
On average, the demonstration fee schedule allowances are greater than bid prices because the
supplier ratios exceed one.
Table 2-1 compares the composite price based on the demonstration prices to the
composite price based on the Florida fee schedule that would have been in effect in the absence
Table 2-1. Difference in Composite Prices Based on Demonstration Prices and the Florida Fee
Schedule
Oxygen Supplies
Hospital Beds and
Accessories Enteral Urological
Nutrition Supplies Surgical
Dressings
Composite Prices:
Demonstration Fee Schedule
Florida Fee Schedule
Percentage Reduction: Demonstration Fees vs. Florida Fee Schedule
161.75 90.72 62.59 8.86 13.82
195.99 129.26 86.02 11.07 15.80
17.5% 29.8% 27.2% 20.0% 12.6%
2-2

of the demonstration. The composite price for the demonstration is lower in each product
category. The demonstration composite price is 17.5 percent lower for oxygen supplies, 29.8
percent lower for hospital beds and accessories, 27.2 percent lower for enteral nutrition, 20
percent lower for urological supplies, and 12.6 percent lower for surgical dressings.
Tables 2-2 through 2-6 compare the demonstration fee schedule to the Florida fee
schedule that would have been in effect in the absence of the demonstration. Demonstration fees
are lower than the Florida fee schedule for all 15 oxygen items (Table 2-21. Demonstration prices
are also lower for 28 of 31 hospital beds and accessory items (Table 2-31, 22 of 24 enteral
nutrition items (Table 2-4), and 37 of 40 urological supplies (Table 2-5). For surgical dressings,
the demonstration price was higher than the Florrda fee schedule for 56 of 62 items (Table 2-6).
The percentage change in the demonstration price versus the fee schedule is displayed for
individual procedures in Figures 2-l through 2-5. Procedure codes come from the HCFA
Common Procedure Coding System (HCPCS). Changes in the demonstration price for each
product in the oxygen category are graphed in Figure 2-l. As noted above, the demonstration
prices for all items in the oxygen category are lower than the fee schedule prices. The largest
discounts are for stationary and portable oxygen contents (HCPCS codes E0441 through E0444),
which range from about 17 percent to 33 percent. The discounts on the remaining rental items
varied from 6 percent to about 17 percent.
Changes in the demonstration price for each product in the hospital beds and accessories
category are graphed in Figure 2-2. The demonstration prices are discounted for all items with
the exception of bed cradles for rental or purchase (HCPCS codes E0280NU, E0280RR, and
E0280UE), which rose about 8 to 9 percent. The biggest discounts of 33 percent to 35 percent
were obtained for full length hospital bed side rails (HCPCS codes E03 I ONU, E031 ORR, and
E03 1 OUE). Discounts for other items ranged from about 10 percent to 30 percent.
Changes in the demonstration price for each product in the enteral nutrition category are
graphed in Figure 2-3. The demonstration prices are discounted for all items with the exception
of one type of used IV pole (HCPCS code E0776UEXA), which rose over 75 percent, and category
VI enteral formulae (HCPCS code B4156), which rose less than 10 percent. Discounts of 25
percent to 40 percent were obtained for enteral nutrition fusion pumps with and without alarms
(HCPCS codes B9000NU, BgOOORR, BgOOOUE, B9002NU, B9002RR, and B9002UE), and a rental
rate for an IV pole (E0776RRXA) fell by over 50 percent. Discounts for other items ranged from
about 5 percent to 25 percent.
Changes in the demonstration price for each product in the urological supplies category
are graphed in Figure 2-4. The demonstration prices are discounted for all items with the
2-3

Table 2-2. Oxygen
Code Description
Demonstration Maximum Florida Fee Allowance Schedule
E0424KK
E0431 RR
E0434RR
E0439RR
E0441
E0442
E0443
E0444
El 400RR
El 401 RR
El402RR
El403RR
El 404RR
El405RR
El 406RR
Stationary compressed gaseous oxygen system, rental;
includes contents (per unit), regulator, flowmeter,
humidifier, nebulirer, cannula mask, and tubing; 1 unit =
500 cubic ft.
Portable gaseous oxygen system, rental; includes
regulator, flowmeter. humidifier, cannula or mask, and
tubing
Portable liquid oxygen system, rental; includes portable
container, supply reservoir, humidifier, flowmeter, reiill
adapter, contents gauge, cannula or mask, and tubing
Stationary liquid oxygen system, rental; includes use of
reservoir, contents (per unit), regulator, flowmeter,
humidifier, nebulizer, cannula or mask, and tubing; 1 unit
= lo Ibs.
Oxygen contents, gaseous, per unit tior use with owned
gaseous stationary systems or when both a stationary and
portable gaseous system are owned: 1 unit = 50 cubic ft.1
Oxygen contents, liquid, per unit (for use with owned
liquid stationary systems or when both a stationary and
portable liquid system are owned: 1 unit = 10 Ibs.)
Portable oxygen contents, gaseous, per unit (for use only
with portable gaseous systems when no stationary gas or
liquid system is used; 1 unit = 5 cubic ft.)
Portable oxygen contents, liquid, per unit (for use only
with portable liquid systems when no stationary gas or
liquid system is used; 1 unit = 1 lb.)
Oxygen concentrator, manufacturer specified maximum
flow rate does not exceed 2 liters per minute, at 85
percent or greater concentration
Oxygen concentrator, manufacturer specified maximum
flow rate greater than 2 liters per minute, does not exceed
3 liters per minute, at 85 percent or greater concentration
Oxygen concentrator, manufacturer specified maximum
flow rate greater than 3 liters per minute, does not exceed
4 liters per minute, at 85 percent or greater concentration
Oxygen concentrator, manufacturer specified maximum
flow rate greater than 4 liters per minute, does not exceed
5 liters per minute, at 85 percent or greater concentration
Oxygen concentrator, manufacturer specified maximum
flow rate greater than 5 liters per minute, at 85 percent or
greater concentration
Oxygen and water vapor enriching system with heated
delivery
Oxygen and water vapor enriching system without heated
$181.59
$33.44 $35.97
$33.63 $35.97
S184.01 $213.11
$93.95 $138.53
$98.37 $138.53
$14.05 $18.20
$15.20 $18.20
$175.33 $213.1 1
$175.33 $213.11
$174.30 $213.11
$174.30 $213.11
S176.22 $213.11
$225.40 $245.39
$210.23 $231.93
$213.11
dellvery
2-4

Table 2-3. Hospital Beds and Accessories
Code Description
Demonstration Maximum Florida Fee Allowance Schedule
EO25ORR
E0251 RR
E0255RR
E0256RR
E0260RR
E0261 RR
E0265RR
E0266RR
E0271 NU
E0271 RR
E0271 UE
E0272NU
E0272RR
E0272UE
E0280NU
E0280RR
E0280UE
E0290RR
E0291 RR
Hospital bed, fixed height, with any type side rails, with
mattress
Hospital bed, fixed height, with any type side rails,
without mattress
Hospital bed, variable height (hi-lo), with any type side
rails, with mattress
Hospital bed, variable height (hi-lo), with any type side
rails, without mattress
Hospital bed, semi-electric (head and foot adjustment),
with any type side rails, with mattress
Hospital bed, semi-electric (head and foot adjustment).
with any type side rails, without mattress
Hospital bed, total electric (head, foot and height
adjustment), with any type side rails, with mattress
Hospital bed, total electric (head. foot and height
adjustment), with any type side rails, without mattress
Mattress, innerspring
Mattress, innerspring
Mattress, innerspring
Mattress, foam rubber
Mattress, foam rubber
Mattress, foam rubber
Bed cradle, any type
Bed cradle, any type
Bed cradle, any type
Hospital bed, fixed height, without side rails, with mattress
Hospital bed, fixed height, without side rails, without
mattress
$62.58 $93.25
s53.13 $70.66
$72.01 $107.10
$59.94 $75.24
$95.66 $136.14
$85.07 $111.03
$106.44 $162.06
$97.89 $143.98
$131.80
$13.18
$98.85
$135.66
$13.57
s101.75
$38.16
$3.82
$28.62
$53.85
$45.03
$180.01
$18.70
$140.63
$182.15
918.22
$136.61
$35.29
$3.55
$26.47
$71.29
$51.79
(continued)
2-5

Table 2-3. Hospital Beds and Accessories (continued)
Code Description
Demonstration Maximum Florida Fee Allowance Schedule
E0292RR Hospital bed, variable height (hi-lo), without side rails,
with mattress
E0293 KR Hospital bed, variable height (hi-lo). without side rails,
without mattress
E0294RR Hospital bed, semi-electric (head and foot adjustment),
without side rails, with mattress
E0295RR Hospital bed, semi-electric (head and foot adjustment),
without side rails, without mattress
E0296RR Hospital bed, total electric (head, foot, and height
adjustment) without side rails, with mattress
E0297RR Hospital bed, total electric (head, foot, and height
adjustment), without side rails, without mattress
E0305RR
E031 ONU
E03 1 ORK
E0310UE
E091 ORR
Bed side rails, half length
Bed side rails, full length
Bed side rails, full length
Bed side rails, full length
Trapeze bars, a/k/a patient helper, attached to bed, with
grab bar
E0940RR Trapeze bar, free standing, complete with grab bar $24.17 $29.39
$59.88
S53.18
S83.74
$80.04
$95.04
$87.30
$10.74
5114.08
$11.41
$85.56
515.89
$75.40
$64.20
5105.93
5103.25
$133.13
$114.05
$14.42
$175.41
$18.45
$131.55
419.07
2-6

Table 2-4. Enteral Nutrition
Demonstration Maximum Florida Fee
Code Description Allowance Schedule
64034
n4035
B403b
B4081
B4082
n4083
B4084
n4085
84150
n4i51
R4152
B4153
n4i54
n4i55
B415b
Enteral feeding supply kit; syringe, per day
Enteral feeding supply kit: pump fed, per day
Enteral feeding supply kit; gravity fed, per day
Nasogastric tubing with stylet
Nasogastric tubing without stylet
Stomach tube-levine type
Castrostomyijejunostomy tubing
Castrostomy tube, silicone with sliding ring, each
Enteral formulae: category I: semi-synthetic intact
protein/protein isolates, 100 calories = 1 unit
Enteral formulae: category I: natural intact protein/protein
isolates, 100 calories = 1 unit
Enteral formulae: category II: intact protein/protein isolates
(calorically dense), 100 calories = 1 unit
Enteral formulae; category Ill: hydrolized protein/amino
acids; 100 calories = 1 unit
Enteral formulae: category IV: defined formula for special
metabolic need, 100 calories = 1 unit
Enteral formulae; category V: modular components
(protein, carbohydrates, fat), 100 calories = 1 unit
Enteral formulae; category VI: standardized nutrients, 100
calories = 1 unit
B9000NU Enteral nutrition infusion pump: without alarm
n9000RR Enteral nutrition infusion pump: without alarm
B9000UE Enteral nutrition infusion pump: without alarm
89002NU Enteral nutrition infusion pump: with alarm
n9002RR Enteral nutrition infusion pump; with alarm
69002UE Enteral nutrition infusion pump: with alarm
E077bNUXA IV pole
E077bRRXA IV pole
$4.55
$7.98
S5.45
$15.27
$11.81
51.95
$15.12
$32.64
$0.56
51.26
$0.45
$1.57
$1.05
$0.81
$1.27
$695.62
Sb9.56
$521.72
$793.65
$79.36
5595.24
$70.73
s7.07
$5.60
$10.67
$7.31
519.78
$14.73
$2.25
$16.52
$37.48
SO.61
$1.43
$0.51
$1.74
$1.12
$0.87
$1.24
$1,121.97
$103.10
$841.47
$1,121.97
$108.66
5841.47
$93.30
$23.62
E077bUEXA IV pole $53.05 $29.15
2-7

Table 2-5. Urological Supplies
Code Description
Demonstration Maximum Florida Fee Allowance Schedule
A4310
A4311
A4312
A4313
A4314
A4315
A4316
A4320
A432 1
A4322
A4323
A4326
A4327
A4328
A4338
A4340
A4344
A4346
A4351
A4352
Insertion tray without drainage bag and without catheter
iaccessories only)
Insertion tray without drainage bag with indwelling
catheter, Foley type, two-way latex with coating (teflon.
silicone, silicone elastomer, or hydrophilic, etc.)
Insertion tray without drainage bag with indwelling
catheter, Foley type, two-way, all silicone
Insertion tray without drainage bag with indwelling
catheter, Foley type, three-way, for continuous irrigation
insertion tray with drainage bag with indwelling catheter,
Foley type, two-way latex with coating (teflon, silicone,
silicone elastomer, or hyrophilic, etc.!
Insertion tray with drainage bag with indwelling catheter,
Foley type, two-way, all silicone
Insertion tray with drainage bag with indwelling catheter,
Foley type, three-way, for continuous irrigation
Irrigation tray with bulb or piston syringe, any purpose
Therapeutic agent for urinary catheter irrigation
Irrigation syringe, bulb, or piston, each
Sterile saline irrigation solution, 1000 ml.
Male external catheter specialty type (e.g.. inflatable,
faceplate, etc.) each
Female external urinary collection device: metal cup, each
Female external urinary collection device: pouch, each
indwelling catheter; Foley type; two-way latex with
coating (teflon, silicone, silicone elastomer, or hydrophilic,
etc.), each
indwelling catheter: specialty type tcoude, mushroom,
wing, etc.), each
Indwelling catheter: Foley type; two-way all silicone, each
Indwelling catheter; Foley type, three-way for continuous
irrigation, each
Intermittent urinary catheter: straight tip, each
Intermittent urinary catheter; coude (curved) tip, each
$5.30 $6.26
$9.52 $12.04
$13.71 $17.20
$12.14 $15.02
$17.20 $20.50
$17.62 $21.39
$20.15 523.03
$4.16 $5.08
$5.81 $1.00
$1.97 $2.69
56.05 57.68
58.38 $10.29
$34.91 S40.32
$7.64 $9.40
$8.49 $11.70
$22.78
$12.44
$13.37
$1.41
$4.20
$30.28
$15.28
$18.69
51.73
S5.20
(continued)
2-a

Table 2-5. Urological Supplies (continued)
Code Description
Demonstration Maximum Florida Fee Allowance Schedule
A4353
A4354
A4355
A4356
A4357
A4358
A4359
A5102
Intermittent urinary catheter: with insertion supplies
Insertion tray with drainage bag but without catheter
Irrigation tubing set for continuous bladder irrigation
through a three-way indwelling Foley catheter, each
External urethral clamp or compression device mot to be
used for catheter clamp), each
Bedside drainage bag, day or night, with or without anti-
reflux device, with or wrthout tube, each
Urinary leg bag; vinyl, with or without tube, each
Urinary suspensory without leg bag, each
Bedside drainage bottle with or without tubing, rigid or
expandable, each
A5105
A5112
A5113
A5114
A6265
K0280
Urinary suspensory; with leg bag, with or without tube
Urinary leg bag; latex
K0281
Leg strap: latex, replacement only, per set
Leg strap; foam or fabric, replacement only, per set
Tape, all types, per 18 sq. in.
Extension drainage tubing, any type, any length, with
connector/adaptor; for use with urinary leg bag or
urostomy pouch, each
Lubricant, individual sterile packet, for insertion of urinary
catheter, each
K0407 Urinary catheter anchoring device, adhesive skin
attachment
K0408 Urinary catheter anchoring device, leg strap
K0409 Sterile water irrigation solution, 1,000 ml.
K0410 Male external catheter, with adhesive coating, each
Male external catheter, with adhesive strip, each
$5.23
$7.99
55.75
$35.54
$7.55
$5.02
$19.92
$18.28
$26.07
$26.04
$3.91
$5.98
$0.12
$3.00
so.1 2
$1.86
$4.14
$5.32
$1.79
$1.43
$6.66
$9.56
$7.23
$43.52
$9.25
$6.33
$27.67
$21.53
$33.05
$33.02
$4.48
$7.69
$0.12
$3.04
$0.12
52.10
$4.71
$6.04
$2.07
$1.72 K0411
2-9

Table 2-6. Surgical Dressings
Code Description
Demonstration Maximum Florida Fee Allowance Schedule
A4460
A4462
A6154
A6196
A6197
A6199
A6203
A6204
A6207
A6209
A6210
A6211
A6212
A6213
A6214
A6216
A6219
A6220
Elastic bandage, per roll (e.g.. compression bandage)
Abdominal dressrng holder/binder, each
Wound pouch, each
Alginate dressing, wound cover, pad size 16 sq. in. or less,
each dressing
Alginate dressing, wound cover, pad size more than 16 sq.
in. but less than or equal to 48 sq. in., each dressing
Alginate dressing, wound filler, per 6 inches
Composite dressing, pad size 16 sq. in. or less, with any
size adhesive border, each dressing
Composite dressing, pad size more than 16 sq. in. but less
than or equal to 48 sq. in., with any size adhesive border,
each dressing
Contact layer, more than 16 sq. in. but less than or equal
to 48 sq. in., each dressing
Foam dressing, wound cover, pad size 16 sq. In. or less,
without adhesive border, each dressing
Foam dressing, wound cover, pad size more than 16 sq.
in. but less than or equal to 48 sq. in., without adhesive
border, each dressing
Foam dressing, wound cover, pad size more than 48 sq.
in., without adhesive border, each dressing
Foam dressing, wound cover, pad size 16 sq. in. or less,
with any size adhesive border, each dressing
Foam dressing, wound cover, pad size more than 16 sq.
in. but less than or equal to 48 sq. in., with any size
adhesice border, each dressing
Foam dressing, wound cover, pad size more than 48 sq.
in., with any size adhesive border, each dressing
Gauze, non-impregnated, non-sterile, pad size 16 sq. in.
or less, without adhesive border, each dressing
Gauze, non-impregnated, pad size 16 sq. in. or less, with
any size adhesive border, each dressing
Gauze, non-impregnated, pad size more than 16 sq. in.
but less than or equal to 48 sq. in., with any size adhesive
$1.38
$4.19
$17.31
$7.47
$0.97
53.13
$13.29
57.01
$15.88 $15.68
$6.73 $5.04
$4.21 $3.19
$7.07 $5.94
$8.62 $7.00
$8.03 $7.14
$17.97 $19.00
$25.87 $28.01
S8.96 $9.25
$14.53 59.82
517.65 $9.82
$0.07 $0.05
$1.40 $0.91
$3.12 $2.46
border, each dressing
(continued)
2-10

Table 2-6. Surgical Dressings (continued)
Code Description
Demonstration Maximum Florida Fee Allowance Schedule
A6222
A6223
A6224
A6229
A6234
A6235
A6236
A6237
A6238
A6240
A6241
A6242
A6243
A6244
A6245
Gauze, impregnated, other than water or normal saline,
pad size 16 sq. in. or less, without adhesive border, each
dressing
Gauze, impregnated, other than water or normal saline,
pad size more than 16 sq. in. but less than or equal to 48
sq. in., without adhesive border, each dressing
Gauze, impregnated, other than water or normal saline,
pad size more than 48 sq. in., without adhesive border,
each dressing
Gauze, impregnated, water or normal saline, pad size
more than 16 sq. in. but less than or equal to 48 sq. in.,
without adhesive border, each dressing
Hydrocolloid dressing, wound cover, pad size 16 sq. in. or
less, without adhesive border, each dressing
Hydrocolloid dressing, wound cover, pad size more than
16 sq. in. but less than or equal to 48 sq. in., without
adhesive border, each dressing
Hydrocolloid dressing, wound cover, pad size more than
48 sq. in., without adhesive border, each dressing
Hydrocolloid dressing, wound cover, pad size 16 sq. in. or
less, with any size adhesive border, each dressing
Hydrocolloid dressing, wound cover, pad size more than
16 sq. in. but less than or equal to 48 sq. in., with any size
adhesive dressing, each dressing
Hydrocolloid dressing, wound filler, paste, per fluid ounce
Hydrocolloid dressing, wound filler, dry form, per gram
Hydrogel dressing, wound cover. pad size 16 sq. in. or
less, without adhesive border, each dressing
Hydrogel dressing, wound cover, pad size more than 16
sq. in. but less than or equal to 48 sq. in., without
adhesive border, each dressing
Hydrogel dressing, wound cover, pad size more than 48
sq, in., without adhesive border, each dressing
Hydrogel dressing, wound cover, pad size 16 sq. in. or
less, with any size adhesive border, each dressing
52.88 $2.03
s2.92 $2.30
$4.22 $3.44
$4.30 $3.44
57.84 $6.24
$16.58 $16.05
$29.34 $25.99
$9.41 $7.54
$27.71 $21.74
$12.83
$3.17
S6.06
$11.68
$2.45
$5.79
$11.18 511.75
$28.36 $37.46
$8.46 $6.93
(continued)
2-l 1

Table 2-6. Surgical Dressings (continued)
Code Description
Demonstration Maximum Florida Fee Allowance Schedule
A6246 Hydrogel dressing, wound cover, pad size more than 16
sq. in. but less than or equal to 48 sq. in., with any size
adhesive border, each dressing
A6247
A6248
A6251
Hydrogel dressing, wound cover, pad size more than 48
sq. in., with any size adhesive border, each dressing
Hydrogel dressing, wound filler, gel, per fluid ounce
A6252
A6253
A6254
Specialty absorptive dressing, wound cover, pad size 16
sq. in. or less, without adhesive border, each dressing
Specialty absorptive dressing, wound cover, pad size more
than 16 sq. in. but less than or equal to 48 sq. in., without
adhesive border, each dressing
Specialty absorptive dressing, wound cover, pad size more
than 48 sq. in., without adhesive border, each dressing
Specialty absorptive dressing, wound cover, pad size 16
sq. in. or less, with any size adhesive border, each
dressing
A6255
A6257
A6258
A6259
A6263
A6264
A6265
A6266
Specialty absorptive dressing, wound cover, pad size more
than 16 sq. in. but less than or equal to 48 sq. in., with any
size adhesive border, each dressing
Transparent film, 16 sq. in. or less, each dressing
Transparent film, more than 16 sq. in. but less than or
equal to 48 sq. in., each dressing
Transparent film, more than 48 sq. in., each dressing
Gauze, elastic, non-sterile, all types, per linear yard
Gauze, non-elastic, non-sterile, per linear yard
Tape, all types, per 18 sq. in.
Gauze, impregnated, other than water or normal saline,
any width, per linear yard
A6402 Gauze, non-impregnated, sterile, pad size 16 sq. in. or
less, without adhesive border, each dressing
A6403 Gauze, non-impregnated, sterile, pad size more than 16
sq. in. but less than or equal to 48 sq. in., without
adhesive border, each dressing
A6405 Gauze, elastic, sterile, all types, per linear yard
Gauze, non-elastic, sterile, per linear yard
511.89
$27.38
514.47
$2.35
$3.42
$6.46
$1.90
$3.83
$1.99
55.79
$13.71
$0.38
$0.64
$0.17
$2.26
$0.15
$0.51
$0.51
$0.96
$9.46
$22.68
$15.49
$1.90
$3.10
$6.05
$1.16
$2.89
$1.46
$4.10
$10.43
$0.28
$0.46
$0.12
$1.83
$0.12
$0.41
SO.32
$0.76 A6406
2-12

N 1. w
Percentage Change Percentage Change
E1401RR
E1402RR
E1403RR

90% -
80% -
70%
60%
50%
40%
30%
F 20% m
6 10%.
-40% :
-50%
-60% -
-70%
-80%
HCPCS Code
Figure 2-3. Demonstration Price Changes for Enteral Nutrition
2-l 4

HCPCS Code
Figure 2-4. Demonstration Price Changes for Urological Supplies
exception of two codes that did not change and therapeutic agent for urinary catheter irrigation
(HCPCS code A4321 1, which rose over 450 percent, from $1 .OO to $5.81. The latter code has an
extremely small product weight, indicating it was seldom supplied in the demonstration area.
The biggest discounts of 25 percent to 30 percent were obtained for irrigation syringes, indwelling
two-way latex Foley catheters, indwelling specialty type catheters, indwelling three-way Foley
catheters for continuous irrigation, and urinary suspension without bag (HCPCS codes A4322,
A4338, A4340, A4346, and A4359, respectively). Discounts for most of the other items ranged
from about 10 percent to 20 percent.
Changes in the demonstration price for each product in the surgical dressings category are
graphed in Figure 2-5. In contrast to the other product categories, these demonstration prices are
not discounted for the majority of items. The demonstration price is drscounted up to 20 percent
for foam dressings (HCPCS codes A621 0 through A6212) and three out of six types of hydrogel
dressings (HCPCS codes A6243, A6244, and A6248). Prices for the remaining 56 products
actually increased from about 5 percent to 80 percent. Note that because the weight of the
discounted products was large, the composite bid declined.
2-l 5

100%
90%
80% -
-30% 4
-40% HCPCS Code
Figure 2-5. Demonstration Price Changes for Surgical Dressings
2.3 Estimated Annual Savings to Medicare and Beneficiaries
To estimate savings from the demonstration in each product category, we multiplied the
1998 (the last year for which data are available) volume in Polk County by the demonstration
price for each procedure and then summed across all procedures in the product category. This
produces an estimate of demonstration savings under the assumption that utilization is unaffected
by the demonstration. The assumption of constant utilization mav not hold true in reality because
demonstration changes in price may affect demand for DMEPOS, and demand may change for
reasons unrelated to the demonstration. In addition, the estimate applies the new demonstration
prices to all demonstration procedures. This approach may slightly overstate demonstration
savings because the demonstration transition rules allow suppliers with existing rental agreements
for enteral pumps and hospital beds to continue to receive the preexisting fees for the duration of
the rental period. In future evaluation reports, we will examine whether changes in demand or
2-16

transition policies significantly influence demonstration savings. In the meantime, our estimate
provides a useful measure of the demonstration’s pure price effect.
Estimated annual reductions in allowed charges are shown in Table 2-7. The reductions
in allowed charges are $918,472 for oxygen supplies, $190,229 for hospital beds and accessories,
$167,631 for enteral nutrition, and $16,409 for urological supplies. However, for surgical
dressings, allowed charges are estimated to increase by $14,978. Overall, assuming utilization
remains constant, the demonstration is estimated to reduce annual allowed charges by a total of
$1,277,763, or about 17 percent. The cost of DME supplies is shared by Medicare and the
beneficiary. The beneficiaries’ copayment rate is 20 percent, and the remaining 80 percent of
allowed charges is covered by Medicare. Thus, we estimate that the demonstration will reduce
Medicare payments by $1,022,210, and beneficiary payments by $255,553 annually.
Table 2-7. Estimated Annual Allowed Charges, Based on 1998 Volumesa
Estimated Annual Estimated Annual Allowed Charges Allowed Charges
Under the Under Florida Fee Demonstration Schedule
Estimated Annual Savings Under the
Demonstration Percentage
Savings
Oxygen Supplies $4670,181 $5,588,654 $918,472 16.4%
Hospital Beds and $456,998 $647,228 9190,229 29.4% Accessories
Enteral Nutrition $893,920 $1,061,552 5167.631 15.8%
Urological Supplies $74,600 $91.008 $16,409 18.0%
Surgical Dressings $161,445 $146,467 S(l4,978) -10.2%
Total $6,257,144 $7,534,908 $1,277,763 17.0%
“Assuming volume is the same as 1998 volume
For oxygen supplies, hospital beds and accessories, and urological supplies, the estimated
percentage reductions in allowed charges from the demonstration (see Table 2-7) are nearly the
same as the percentage differences between the composite price basecl on the demonstration
prices and the composite bid based on the Florida fee schedule (see Table 2-l). In contrast, the
estimated reduction in allowed charges for enteral nutrition (15.8 percent in Table 2-7) is smaller
than the 27.2 percent reduction suggested by Table 2-l. And we estimate a 10.2 percent increase
in allowed charges for the demonstration for surgical dressings, even though the composite price
based on demonstration prices is 12.6 percent less than the composite based on the fee schedule.
2-l 7

To understand these differences, we examined the calculation of demonstration prices in
detail. This examination focused on the weights used to determme the composite bid for each
supplier; results are described below.
2.4 Weighting Issues
A key component of the bid evaluation process is the calculation of the composite bid for
each demonstration product category. The composite bid is a way to aggregate a supplier’s bids
for each individual procedure into a single bid for the whole categorv that is comparable across
bidders. A supplier’s composite bid for the product category is calculated by multiplying the
supplier’s bid for each procedure by the procedure’s weight and then summing the weighted bids
across every procedure. Each procedure’s weight represents the share of that procedure relative
to all of the procedures in the category; the weights add to one for each category.
In the Polk County demonstration, the weights for each procedure were set equal to the
procedure’s share of allowed charges relative to the allowed charges for all procedures in the
category in Florida in 1997. For example, if a procedure code represents 80 percent of all
allowed charges for oxygen equipment, that procedure will have a weight equal to 0.80. The
weights were printed in the KFB and incorporated into the bidding software that was available to
all bidders.
Several important issues related to weighting have arisen from our analysis of the bidding
results. Briefly, the key issues are as follows:
l The weighting mechanism, combined with the formula to set prices for individual
procedures, can cause prices to be set too high. This problem occurred for surgical dressings.
. With the current weighting mechanism, it is possible that a supplier offering lower allowed charges to HCFA will have a higher composite bid than a supplier offering higher allowed charges to HCFA.
l The weighting process does not adequately distinguish among HCPCS code modifiers
that are associated with new purchase, used purchase. and rental payments. In the case of enteral nutrition, the use of new purchase prrces in the calculation of the composite bid has a significant impact.
All three of these issues are related to the fact that a weighting mechanism based on
allowed charges puts too much weight on high-priced procedures. Bid prices obviously must
enter the calculation of the composite bid, and, as such, higher bids should lead to a higher
composite bid. However, the problem with the weights based on allowed charges is that the
price effect is essentially squared in the calculation of the composite bid, and squaring a large
price has a disproportionately large impact.
2-18
Weighting issues are discussed in detail in Appendix A. In the appendix, we also discuss
an alternative weighting mechanism based on procedure volume and show why volume
weighting is preferred to the allowed charge weights used in Polk County. HCFA plans to use
volume weighting in the next demonstration site, San Antonio, Texas.
2.5 Utilization
As emphasized earlier, our estimates of savings under the demonstration are based on the
assumption of constant utilization. There are not yet enough claims data to tell whether
utilization has changed under the demonstration. As more data become available, we will
analyze whether utilization changes. It is possible that there will be changes in utilization that
can be attributed to the demonstration, but it is also likely that a portion of changes in utilization
is not attributable to the demonstration. For example, changes in how home health agencies are
reimbursed will affect volume in both Polk County and areas not in the demonstration To
control for these factors, we will perform a pre-post analysis of utilizatron using Brevard County,
Florida as a comparison county. The comparison county allows us to distinguish between
changes due to the demonstration that only affect Polk County and changes due to
contemporaneous trends in the demand or supply of DMEPOS that affect both Polk and Brevard
Counties. This will allow us to identify changes in utilization that are clue to the demonstration.
When the claims data become available, we will analyze both changes in utilization per
user and the aggregate number of claims with an observation defined over a month, quarter, or 6-
month period. We will perform multivariate analyses to identify the effect of the demonstration
on these outcomes.
2.6 Summary and Next Steps
We estimate that competitive bidding will reduce Medicare allowed charges by nearly
$1.3 million annually, or about 17 percent, assuming that utilization remains constant. Allowed
charges will fall substantially in every product category except surgical dressings, where allowed
charges will actually rise. The increase in allowed charges for surgical dressings is an unexpected
result of the weighting mechanism used to construct composite bids in Polk County. This
mechanism, based on allowed charges, produces other unintended results. HCFA will use a more
attractive weighting mechanism based on volume in its next demonstration site.
2-19

We do not yet have sufficient claims data to evaluate whether the demonstration has an
effect on DMEPOS utilization. We will analyze the impact on utilization during the next year of
the evaluation. When that analysis is complete, we will evaluate the combined price and
utilization effects on allowed charges.
2-20
SECTION 3 BENEFICIARY ACCESS
Access in this context can be defined as benefictaries’ ability to locate and use, without
undue burden, the services and products that are covered by the Medicare program. Competitive
bidding reduces the number of approved suppliers in Polk County. Approved suppliers could
adapt to the potential for increased market share by advertising, opening new locations to fill in
geographic gaps left by unapproved suppliers, or improving service, thereby increasing
beneficiary access. Or they may respond to lower prices by offering lower quality products
delaying routine maintenance, or employing fewer service technicians and customer service
representatives, thereby increasing the need for service calls, extending waiting times, and
decreasing access. It is important to monitor the demonstration’s effect on beneficiary access to
evaluate whether competitive bidding affects beneficiaries’ ability to obtain needed products and
services.
In this section, we discuss the findings from the baseline beneficiary survey, which
provides an understanding of access in Polk County before the demonstration began; describe
features of the demonstration design that are intended to maintain and promote beneficiary access
to DMEPOS; discuss the service areas offered by demonstration suppliers in their bids; and
discuss findings related to beneficiary access from four site visits conducted during the first year of
the demonstration. We conclude with a discussion of future steps in the analysis of beneficiary
access to demonstration services. The key findings in this section are as follows:
l Results from the baseline beneficiary survey indicate that access to DMEPOS was very good before the demonstration began.
l The demonstration design includes a number of features that promote beneficiary access.
l Twelve of the 16 demonstration suppliers agreed to serve all of Polk County. Thus, beneficiaries throughout the county can choose from a fatrly wide selection of providers,
l During the transition to demonstration prices, there were no substantial barriers to access. This result is related to the transition policies for oxygen, hospital beds, and enteral nutrition, as well as nondemonstration suppliers’ willingness to accept demonstration prices and continue serving their patients.
3-l
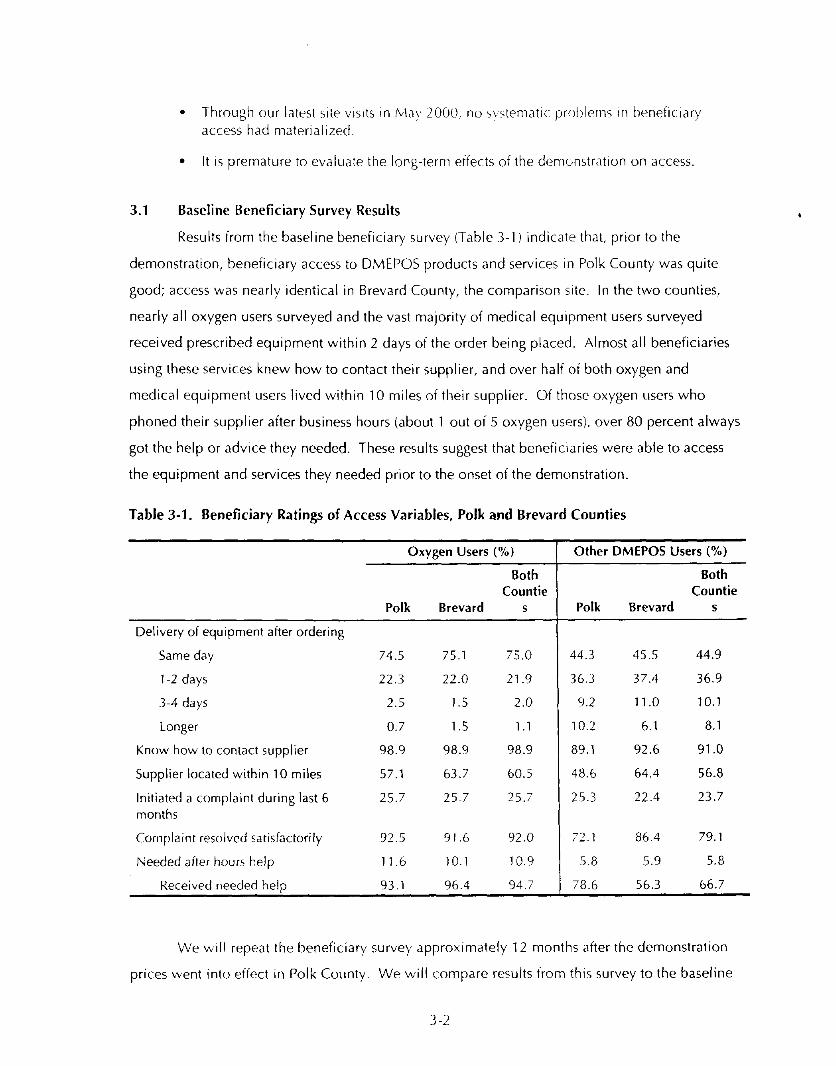
l Through our latest sate VISITS in Ma!, 2000, no svstematrc prot,lems In brnefrcrary
access had materialized.
l It is premature to evaluate the long-term effects of the demonstratron on access.
3.1 Baseline Beneficiary Survey Results
Results from the baseline beneficiary survey (Table 3-l) indicate that, prror to the
demonstration, beneficiary access to DMEPOS products and services 111 Polk County was quite
good; access was nearly identical in Brevard County, the comparison site. In the two counties,
nearly all oxygen users surveyed and the vast majority of medical equipment users surveyed
received prescribed equipment within 2 days of the order being placed. Almost all beneficiaries
using these services knew how to contact their supplier, and over half of both oxygen and
medical equipment users lived within 10 miles of their supplier. Of those oxygen users who
phoned their supplier after business hours (about 1 out of 5 oxygen users), over 80 percent always
got the help or advice they needed. These results suggest that beneficiaries were able to access
the equipment and services they needed prior to the onset of the demonstration.
Table 3-1. Beneficiary Ratings of Access Variables, Polk and Brevard Counties
Delivery of equipment after ordering
Same day
l-2 days
3-4 days
Longer
Know how to contact supplier
Supplier located within 10 miles
Initiated a complaint during last 6
months
Complaint resolved satisfactorily
Needed after hours help
Received needed help
Oxygen Users (%) Other DMEPOS Users (%)
Both Both Countie Countie
Polk Brevard S Polk Brevard S
74.5 75.1 75.0 44.3 45.5 44.9
22.3 22.0 21.9 36.3 37.4 36.9
2.5 1.5 2.0 9.2 11.0 10.1
0.7 1.5 1.1 10.2 6.1 8.1
98.9 98.9 98.9 89.1 92.6 91 .o
57.1 63.7 60.5 48.6 64.4 56.8
25.7 25.7 25.7 25.3 22.4 23.7
92.5 91.6 92.0 72.1 86.4 79.1
11.6 10.1 10.9 5.8 5.9 5.8
93.1 96.4 94.7 78.6 56.3 66.7
We wrll repeat the beneficiary survey approximately 12 months after the demonstration
prices went into effect in Polk County. We will compare results from this survey to the baseline
3-2
results and analyze whether the demonstratton has had a significant effect on access variables.
The survey will agarn collect data from both Polk and Brevard Countrci. allowrng us to distinguish
effects of the demonstration in Polk County irom the effects of factors aiiectrng beneficiaries in
both Polk and Brevard Counties.
3.2 Design Features to Promote and Maintain Beneficiary Access
Medtcare previously allowed beneficiaries to use any DMEPOS supplrer willing to accept
program rules and reimbursements. Under the demonstration, losing bidders and suppliers who
did not bid can no longer provide demonstration products to new Medicare patients; under
demonstration transition policies (see below), they may provide services to existing Medicare
pattents under certain circumstances. With fewer suppliers serving the demonstration area, this
naturally raises the concern that the demonstration will reduce beneficiary access to DMEPOS.
To address this concern, the demonstration design included a number of features intended
to promote and maintain beneficiary access:
l Multiple winners were selected in each product category. The multiple winners still have to compete among themselves to attract business; this competition can enhance access and quality. In Polk County, from four to 13 demonstration suppliers were selected in each product category.
l During the bid evaluation process, supplier capacity was one of the criteria used to select the cutoff composite bid that defined the competitive range for the bidding. The competitive range was set large enough so that the final selection of demonstration suppliers has enough capacity to serve the entire area, even if a few of the suppliers initially in the competitive range were not selected.
l The Bid Evaluation Panel also examined the financial viability of firms in the competitive range to ensure that access problems would not arrse if one or more demonstration suppliers went bankrupt.
l Transition policies allowed nondemonstration oxygen suppliers to continue serving their existing patients throughout the demonstration. Similarly, transition policies allowed nondemonstration suppliers with capped rental agreements for hospital beds or enteral nutrition pumps to continue to supply existing patients.
l Quality and service standards were created that apply to delivery, after-hours emergency service, and natural disaster procedures. These standards are more stringent than the standards to receive a National Suppliers Clearinghouse number, a requirement for Medicare reimbursement for DMEPOS.
3.3 Results of the Bidding: Service Areas
As part of their bids, 12 of the 16 demonstration suppliers agreed to provide service to
every zip code in Polk County. All of the demonstration suppliers who provide surgical dressings
3-3

and urological supplres-the two product categortes wrth the iewest supplIers in total-serve the
entire county, as do none of the 13 oxygen suppliers. The large numher of suppliers supplying
each ZIP code suggests that beneiiciary access remains strong.
3.4 Site Visit Results
Since June 1999, we have conducted four site visits to Polk County, Florida. During these
visits, we interviewed demonstration suppliers, nondemonstration supplrers, home health agency
representatives, hospital discharge planners, beneficiaries, and the Ombudsman.
The transition to demonstration prices in October 1999 passed relatively smoothly. There
were no reports of substantial or widespread barriers to access. This smooth transition seems to
be related to both the existence of the transition policies and the nondemonstration oxygen
suppliers’ willingness to continue serving their patients. The transition policies apply only to
capped-rental equipment, which includes enteral nutrition infusion pumps and hospital beds, and
home oxygen therapy. Preexisting rental or purchase contracts for infusion pumps and hospital
beds are eligible for Medicare reimbursement according to regular fee schedule levels throughout
the demonstration. Beneficiaries beginning the use of these items after the start of the
demonstration are required to obtain the equipment from a demonstration supplier. A beneficiary
who has a preexisting relationship with a nondemonstration oxygen supplier is not required to
switch to a demonstration oxygen supplier, provided the oxygen supplier accepts the
demonstration price schedule.
As it turned out, all nondemonstration suppliers of oxygen equipment in Polk County
opted to continue to serve their patients and accept the demonstration prices. In turn, mojt
oxygen users elected to remain with their original supplier. The willingness of nondemonstration
suppliers to accept the demonstration prices and continue their services was very important to
oxygen users who were concerned about any potential disruption to their services.
The Ombudsman reported only a handful of specific complaints related to the
beneficiaries’ ability to access suppliers or products. A representative of a beneficiary group that
provided a health insurance hotline reported that he received no calls regarding the
demonstration during the first 2 months after the demonstration prices went into effect. This was
in sharp contrast to the representative’s experience when Medicare HMOs withdrew from the
county, and the representative’s office was flooded by calls. The hospital discharge planners also
did not report access-related concerns occurring during the.transition. They even reported that
some demonstration suppliers from the Orlando and Tampa areas opened offices In Polk County
to be more accessible and to reduce response time. Beneficiaries who began using oxygen prior
3-4
to the demonstratton reported no change 111 quality or access during the transItton ithey tended to
remain wtth the supplier they used prior to the demonstratton). Howe\,er, there was a report of a
new oxygen user needing to switch suppliers because of poor servtce and dtfficulty accessing a
portable oxygen tank. Once the beneftciary was made aware that it was possible to change
suppliers, a new supplier was contacted and the beneficiary was pleased with oxygen service and
supplies.
The demonstration enabled some suppliers outside of Polk County to bid and thereby
enter the market. Such is the case with two of the five urological supplters who were not
providing services to Polk County residents prior to the start of the demonstration. However,
contrary to their expectations, they received few referrals in Polk County. There appears to be
some reluctance among both referral agents and beneficiaries about using providers located
outside of the county. This reluctance is not related to concerns about quality but rather issues of
access. Apparently, beneficiaries often want to come to a storefront to obtain their urological
supplies and prefer doing business with a company that has a storefront nearby. One supplier
based outside of Polk County, who was not providing services in Polk County prior to the
demonstration, reported receiving only three new urological patients from Polk County since the
demonstration began. The other supplier new to Polk County reported having 11 new urological
patients.
Although we found no systematic negative effects on access to services resulting from the
demonstration, beneficiaries, nondemonstration suppliers, and referral agents expressed concerns
regarding potential disruptions to demonstration supplies for beneficiaries. For example, one
concern that we heard from referral agents, beneficiaries, and beneficiary group representatives
was that demonstration suppliers located outside of Polk County might not be able to provide
services as quickly as those located within the county. The referral agents stated that some of the
demonstration suppliers who do not deliver quickly enough are located outside of Polk County,
but that being outside of Polk County does not necessarily predict poor service. The oxygen users
and beneficiary group representatives that mentioned this concern did not actually encounter any
problems, but nevertheless, were concerned that the distance could have an effect on access to
service. Two representatives from the benefictary groups mentioned that they were concerned
about access: one was worried about benefrctaries on the edge of the county and the other was
concerned about loss of choice among suppliers. In general, if referral agents encountered any
difficulties with a demonstration supplier, they responded by switching to a different, more
responsive demonstration supplier. Thus, any initial difficulties that may have occurred were not
lingering problems.
3-5

A couple of referral agents expressed concern that since the demonstration began some
suppliers have been less willing to provide equipment for indigent patrents This may be a result
of the need for suppliers to cut costs due to the lower markup under the demonstration prrces, or
the supplier not betng selected as a demonstration supplier. One referral agent had been relying
on a particular supplier to provide products for indigent patients; however, because this supplier
was not chosen to be a demonstration supplier and could no longer accept Medicare patients, the
referral agent no longer felt comfortable asking this supplier to provide free equipment for
indigent patrents. This referral agent has since asked other participating suppliers to provide
services for indigent patients and has, on occasion, been turned down. Referral agents
emphasized that the lack of willingness to assist with indigent patients was not the case for all
suppliers; however, it is a trend that concerns this referral agent.
3.5 Summary and Next Steps
We have found that, overall, beneficiary access to DMEPOS products and services during
the demonstration has been very good. However, these results are preliminary, and it is too early
in the demonstration to definitively state what effect the demonstration will have on beneficiary
access in the long-run. We will monitor the progress of the demonstration and document any
changes that we observe. We will do this by conducting additional site visits, during which we
will interview suppliers, referral agents, beneficiaries, and the Ombudsman. We will also be
conducting a follow-up survey with beneficraries as well as a supplier survey. The follow-up
beneficiary surveys will allow us to compare beneficiary ratings of access and services prior to the
start of the demonstration and after 1 year’s experience with the demonstration.
3-6

SECTION 4 QUALITY AND PRODUCT SELECTION
I f competitive bidding results in pressure on profit margins, then suppliers may attempt to
restore profits by supplying less expensive and possibly lower quality products and services.
Lower quality may be manifested in a number of ways; for example, by offering lower quality
products, postponing preventive maintenance, delaying service calls, limiting product selection,
or reducing inventory to the point that time needed to fill orders is increased. Consequently, our
approach has been to evaluate the effect of the demonstration on the quality of products and
services by obtaining information directly from Medicare beneficiaries, beneficiary organizations,
referral agents, and suppliers.
In this section, we discuss the level of satisfaction with suppliers reported in the baseline
beneficiary survey, describe features of the demonstration design that are intended to maintain
and promote quality, and discuss the findings related to quality from our site visits to Polk County.
We conclude with a summary of results and discussion of future analyses we will conduct to
determine the effect of the demonstration on quality. The key findings in this section are as
follows:
l Kesults from the baseline beneficiary survey indicate that the quality of services and
equipment that beneficiaries received prior to the demonstratron was very good.
l The demonstration design includes a number of features that promote quality
l There have been no systematic reports of substantial changes in the quality of services or equipment provided to beneficiaries under the demonstration. A few referral agents tried more than one demonstration supplier before finding a supplier they were satisfied with, but this appears to have been a transitory problem. If referral agents were not satisfied with the initial demonstration supplier, they switched to another demonstration supplier that provided satisfactory service and quality.
l Many of the demonstration suppliers report that they underbid on urologrcal supplies. This resulted in a demonstration reimbursement schedule that sometimes does not
cover the cost of purchasing certain items.
l We have observed no changes in product selection in the oxygen, hospital beds, and
enteral nutrition product categories. Product selection may have improved in the surgical dressings category. The effects of the demonstration on product selection in the urological supplies category are unclear at this time.
l It is premature to evaluate the long-term effects of the demonstration on quality and product selection.
4-l

4.1 Baseline Beneficiary Surveys
We began the evaluation of the effect of the demonstration on the quality of products and
services by conducting a baseline beneficiary survey of oxygen users and other DME users, both
in Polk County and in the comparison county, Brevard County. We found that, prior to the
demonstration, Medicare beneficiaries rated their satisfaction with their DME suppliers quite
highly. On a scale of 0 to 10, with 0 signifying the worst possible supplier and 10 signifying the
best possible supplier, nearly two-thirds of oxygen users and just under one-half of the other
DMEPOS users gave their supplier a rating of 10 (Figure 4-l). Satisfaction ratings were nearly
identical in the two counties. Combining responses for both counties, 92 percent of oxygen users
and 74 percent of other equipment users gave their suppliers ratings of 8 or higher. Over 90
percent in each group responded that they would recommend their supplier to a friend. Only a
handful of respondents, less than 2 percent, report having switched suppliers because they were
dissatisfied with the service they received.
A number of factors are likely to increase patient satisfaction with their suppliers. These
factors include prompt delivery, effective training in the use of the equipment, frequent supplier
visits to the user’s home, reliable equipment, and prompt response to equipment or service
problems. Table 4-l shows how users ranked suppliers’ performance on these criteria prior to the
demonstration.
As might be expected given the high baseline levels of satisfaction, users ranked their
suppliers highly on most of these factors. As mentioned previously in Section 3, most
beneficiaries received their equipment within 2 days after the equipment was ordered. The
majority of beneficiaries reported that the training they received from the supplier when the
equipment was delivered was very good or excellent. Only a few oxygen users received no
training on how to use their equipment; a greater percentage of other equrpment users did not
receive training, but training is less important in some of these product categories. Beneficiaries
reported that suppliers generally treated them with courtesy and respect, explained things in a
way they could understand, and provided all the information they needed. In addition, the
majority of beneficiaries reported that their equipment was very reliable.
To analyze how these factors affected beneficiary satisfaction prior to the demonstration,
we performed a multivariate regression analysis with the satisfaction rating as the dependent
variable. For oxygen users, we found that beneficiary satisfaction with suppliers was positively
and significantly associated with the quality of training, same-day delivery, and monthly contact
with the supplier. The quality of training and same-day delivery were also significantly and
4-2
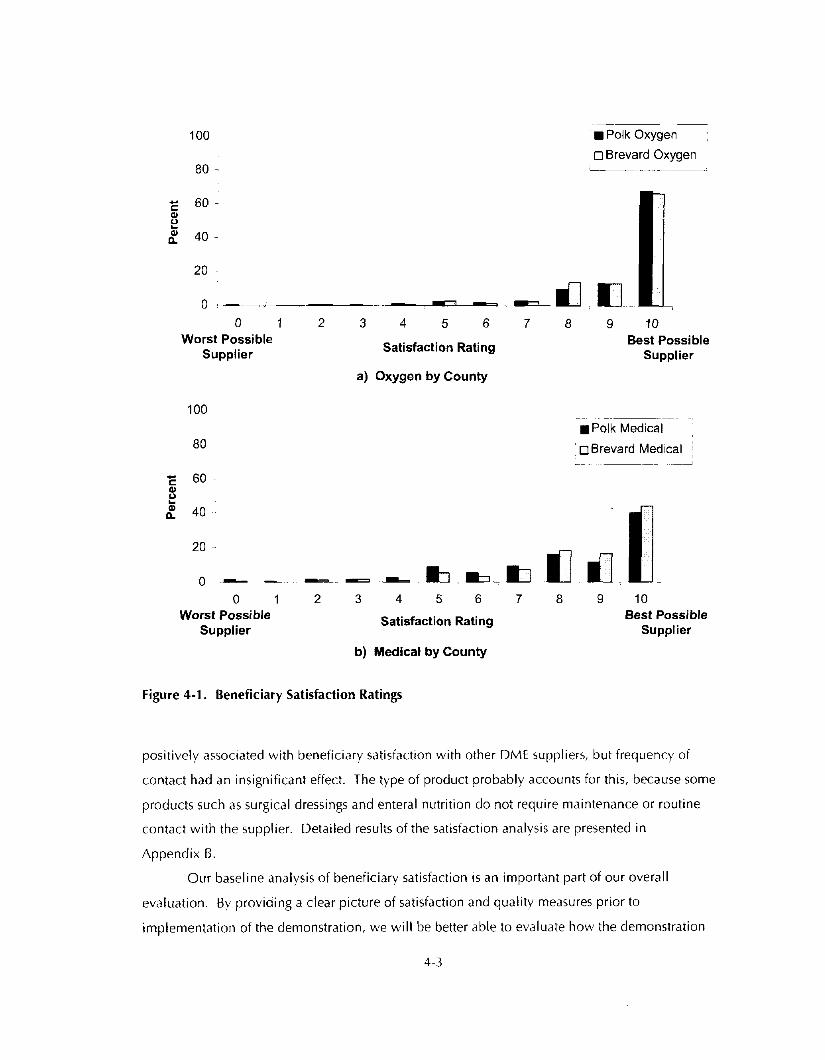
80 -
n Polk Oxygen
q Brevard Oxygen 1
0 +-WV-
0 1 Worst Possible
Supplier
100
80
20 -
0 c-
0 1 Worst Possible
Supplier
2 3 4 5 6 7 8 9 10
Satisfaction Rating Best Possible
Supplier
a) Oxygen by County
n Polk Medical
q Brevard Medical ~
2 3 4 5 6 7 8 9 10
Satisfaction Rating Best Possible Supplier
b) Medical by County
Figure 4-1. Beneficiary Satisfaction Ratings
positively associated with beneficiary satisfaction with other DME suppliers, but frequency of
contact had an insignificant effect. The type of product probably accounts for this, because some
products such as surgical dressings and enteral nutrition do not require maintenance or routine
contact with the supplier. Detailed results of the satisfaction analysis are presented in
Appendix R.
Our baseline analysis of beneficiary satisfaction is an important part of our overall
evaluation. 6y providing a clear picture of satisfaction and quality measures prior to
implementation of the demonstration, we will be better able to evaluate how the demonstration
4-3

Table 4-1. Beneficiary Ratings of Supplier Quality, Polk and Brevard Counties
Oxygen Users (%)” Other DMEPOS Users (%I”
Polk Brevard Both
Counties
Delivery of equipment after
ordering
Same day
l-2 days
3-4 days
Longer
Training
Excellent
Very good
Good
Fair
Poor
None received
Frequency oi home visits
Once a week
Once every 2 weeks
Once a month
Once every 2 months
Once every 3-6 months
Never
Reliability of equipment
Very reliable
Somewhat reliable
Somewhat unreliable
Very unreliable
Equipment replaced because
It was not working right
Initiated a complaint during last 6
months
Complaint resolved
satisfactorily
Needed after hours help
Received needed help
74.5 75.1 75.0 44.3 45.5 44.9
22.3 22.0 21.9 36.3 37.4 36.9
2.5 1.5 2.0 9.2 11.0 10.1
0.7 1.5 1.1 10.2 6.1 8.1
52.1 54.8 53.5 .!6.6 30.6 28.7
30.5 32.0 30.3 23.4 28.9 26.3
12.5 a.5 10.5 13.3 13.3 13.3
2.0 2.7 2.4 5.8 3.3 4.5
0.2 0.2 0.2 1.4 0.3 0.9
2.6 1.8 2.2 29.5 23.6 26.4
3.5 2.9 3.2 6.4 2.4 5.0
6.8 3.5 5.1 1.9 1.4 1.6
44.4 53.1 48.9 3.0 7.6 5.3
la.3 20.0 19.2 0.4 3.1 1.8
18.1 16.7 17.4 7.8 13.3 10.7
a.9 3.8 6.3 80.5 72.2 75.6
93.3
5.8
0.2
0.7
95.4
3.3
0.5
0.7
94.4
4.5
0.4
0.7
73.4
22.1
1.5
3.0
84.0
11.7
0.7
3.7
79.0
16.6
1.0
3.3
21.3 25.4 23.4 15.7 12.1 13.8
25.7 25.7 25.7 25.3 22.4 23.7
92.5 91.6 92.0 72.1 86.4 79.1
11.6 10.1 10.9 5.8 5.9 5.8
93.1 96.4 94.7 78.6 56.3 66.7
d Totals may not sum to 100 percent due to rounding.
Polk Brevard Both
Counties
affects these measures. Because the baseline satisfaction levels are already high, it is almost
statistically impossible for the Competitive Bidding Demonstration to increase satisfaction ratings
Thus, if changes in satisfaction are to be observed, they are likely to be negative. Still, it is
4-4

possible that design features of the demonstration, such as quality evaluation of bidders and
selection of multiple winners, will allow the high baseline levels of satisfaction and quality to be
maintained during the demonstration
We will repeat the beneficiary surveys approximately 1 year after the demonstration prices
went into effect. We will then compare the responses from these surveys to the corresponding
responses from the baseline surveys. Results from this comparison will be included in our Second
Annual Evaluation Report.
4.2 Design Features to Promote and Maintain Quality
To address concerns that competitive bidding could reduce quality, the demonstration
design included a number of features intended to maintain and promote quality:
l Multiple winners were selected in each product category. The multiple winners still
have to compete among themselves to attract business; this competition can enhance quality and service levels. In Polk County, from four to 13 demonstration suppliers
were selected in each product category.
l Quality was one of the key criteria used to select demonstration suppliers during the bid evaluation process. There was an initial evaluation of quality based on information provided in suppliers’ bids. Then, after the competitive range was
established on the basis of bid prices, the quality of suppliers in the competitive range was examined in detail. This examination considered references from patient referral agents and results from on-site visits to suppliers in addition to the information
provided on bid applications.
l Quality and service standards were designed specifically for the demonstration. General standards for all suppliers specified standards for business hours, infection control, loaner equipment during rental repairs, delivery, set-up and pick-up,
education and training for beneficiaries, emergency disaster procedures, complaint processing, and recordkeeping. Additional standards were set for each product
category.
l A demonstration Ombudsman was assigned to work on-site in Polk County to respond
to beneficiary complaints and concerns.
4.3 Site Visit Results
Once the demonstration was implemented, there were few initial reports of substantial
changes in the quality of services or equipment. Two months after demonstration prices went
into effect, the Ombudsman did not receive any complaints from beneficiaries regarding the
quality of the equipment. However, after 2 months, referral agents were not as consistent with
their reports. Some referral agents thought that the highest quality suppliers were included in the
demonstration, while others did not. Not surprisingly, these perceptions were related to whether
the referral agents previously used one of the demonstration suppliers. Referral agents who
4-s

previously used a demonstration supplier tended to believe that the highest quality suppliers were
selected, while referral agents who did not already use one of the demonstration suppliers were
less likely to hold this belief. In the first 2 months after the demonstration began, some referral
agents received complaints from beneficiaries regarding new suppliers, while others did not.
There was a period of adjustment where some referral agents had to work with new suppliers
until they found one(s) with whom they were pleased. One home health agency voiced
complaints about poor quality urological supplies. This home health agency had always provided
patients with urological supplies from its own inventory and was used to dealing with a few, very
reliable manufacturers. They reported catheters that had “disintegrated” and turned patients’
urine blue. However, the issue with urological supplies is complex and is confounded by referral
agents’ frustration regarding the number of items allowable per month by Medicare. Because of
issues unique to this product, we explored issues of price, access, and quality regarding urological
supplies in greater detail (see Section 4.4).
In a focus group 6 months after the demonstration prices took effect, referral agents
reported that, in general, quality had not been reduced as a result of the demonstration. All of
those with whom we spoke were able to locate demonstration suppliers that provided good
quality services and products. These agents reported no problems related to urological supplies.
Suppliers varied in their assessment of the demonstration’s impact on the quality of
products and services. Demonstration suppliers generally believed that quality is good, while
nondemonstration suppliers expressed concerns that lower reimbursement will reduce quality.
However, only one nondemonstration supplier (a urological supplier) was able to provide specific
examples of beneficiaries who had sought this supplier’s services after being dissatisfied with a
demonstration supplier.
4.4 Urological Supplies
During interviews with urological suppliers, it was evident that the reimbursement for
certain HCPCS codes does not adequately cover the cost of some products within that HCPCS
code. One supplier showed us their acquisition cost for selected items and compared these with
the reimbursement level; there was a discrepancy between the reimbursement level and their cost
for a number of urological supplies. However, another supplier reported only a few items with
costs higher than the demonstration reimbursement rate and said that reimbursement rates for
other items were adequate. The number of products with acquisition costs higher than the
demonstration reimbursement rate likely depends on the brands stocked by the supplier. One
4-6

supplier, who is also a manufacturer, did not have any difficulty with the demonstration prices
and reported that their bid prices were actually lower than the demonstration levels,
Examples of the discrepancies between the cost of supplies and the reimbursement rate
show that there is a significant disparity in some cases. The supplier that provided these examples
primarily uses Mentor products. This supplier noted that a certain type of leg bag that some
patients must use costs the supplier approximately $10 per bag, while the reimbursement is only
about $4.80 per bag. Other leg bags are available at this reimbursement level, but they fit the leg
differently and are not the best product for every patient. The supplier gave us other, less
dramatic examples for items with disparities including external catheters, female intermittent
catheters, and tubing for catheters.
It is surprising that demonstration prices are below costs for some products in some
HCPCS codes because the demonstration prices are based on suppliers’ bids. Bidding below cost
would not appear to be a prudent strategy. However, all but one of the urological suppliers stated
that they had bid much too low on some urological supplies. Some of the suppliers bid too low
because they had little or no experience with urological supplies prior to the demonstration and,
as such, had no past experience to inform their bid. They did not realize that the original fee
schedule was not as inflated as it was for other demonstration categories. One of the suppliers
explained the company’s low bid by revealing that the individuals who submitted the bid were
not the same people who deal with patients and so were unfamiliar with the issues of cost of and
preferences for specific urological supplies.
The bidders’ inexperience may have combined with product heterogeneity within some
product codes to produce bids below cost for these codes. There is a wide variety of products
available for some urological codes. Because the reimbursement level applies to a broad
category of products regardless of material used or quality of item, the incentive is for the supplier
to find the least expensive item in the category that would still provide the beneficiary with an
acceptable level of quality. That incentive also existed prior to the demonstration. However,
because urological supplies are very personal items, the patient often has brand and product
preferences. Moreover, even within a single HCPCS code, some products may better match a
patient’s needs than another. The beneficiary can circumvent the supplrer’s incentive to provide
an inexpensive product by asking the physician to prescribe a specific Iproduct. The prescribed
item may be on the high end of cost for the HCPCS code; however, the supplier must provide the
prescribed item regardless of price, while at the same time receiving the approved level of
reimbursement. I f a supplier services patients who use products above and below the price for
the HCPCS, then on average, the supplier should come out even or ahead. However, if the
4-7

supplier has few patients and the majority of these patients have prescriptions for high-end
products, the supplier loses money on that HCPCS code. All urological suppliers reported this
scenario regarding some urological products, While suppliers have not had these difficulties with
all urological product codes, some have had enough difficulty to raise concerns about meeting
their operatmg expenses.
Suppliers added that because they must compete on quality they do not give beneficiaries
substandard products, since in doing so they would lose customers. Suppliers admit to
substituting lower priced products for higher priced products when possible, but claim that they
only substitute products of equal quality. We asked the suppliers what brands they generally
provided, and most of them reported using Mentor, Hollister, Bard, Medline, Kendal, Sherwood,
and Rochester products; these are generally considered to be reputable brands. There is no
evidence of systematically providing the patient with inferior products, and all suppliers
emphasized that if a physician writes a prescription for a particular brand, they would provide the
patient with this product regardless of the cost.
Overall, there does not seem to be a systematic problem regarding quality of urological
products to beneficiaries residing in Polk County. There does, however, seem to be an issue of
price that could lead to quality problems in the long run. The price issue may be resolved in the
next round of bidding as suppliers adjust their bidding strategy based on their experience. We
will continue to monitor the effects of the demonstration on urological supplies by analyzing the
results of the beneficiary and supplier surveys, continuing to talk with urological suppliers and
referral agents, and possibly by using claims data to determine if there is any increase in the
incidence of urinary tract infections since the onset of the demonstration.
4.5 Product Selection
Our evaluation to date has uncovered no change in product selection in the oxygen,
hospital beds, and enteral nutrition product categories. Our findings suggest that product
selection of surgical dressings may have improved since the demonstration began. One surgical
dressings supplier conducted a seminar on surgical dressings in Polk County where, in hrs
opinion, wound care had previously been somewhat dated. During the seminar, this supplier
introduced newer supplies and techniques. This supplier, who had not served Polk County prior
to the demonstration, received a dramatic increase in referrals after conducting the wound care
seminar. Product selection may have increased as a result of this supplier’s participation in the
bidding process.
4-8

At this time, it is unclear how product selection of urological supplies has been affected by
the demonstration. As noted above, some suppliers have substituted lower priced products for
higher priced products, but they claim that they only substitute products of equal quality. Referral
agents on the whole have not observed suppliers systematically substituting products. Since
patients can request a prescription that specifies a particular product that works for them, they are
able to obtain products that meet their individual needs. If the physician specifies a particular
product when writing the prescription, the supplier is obligated to provide that exact product.
The number of patients with a prescription for a particular product vanes by supplier; however, it
is clear that patients who are aware of the products that work best for them are able to obtain
these products. What is not as clear is whether patients who do not have prescriptions that
specify a specific product brand are being given lower cost and/or lower quality products. Many
beneficiaries may not know that they can change products if they do not meet their needs or
request a specific brand by asking their physician to write a prescription for a specific product.
These patients may perceive the demonstration as reducing product selection. However, we do
not yet have data on the extent of this perception.
Given that the impacts of the demonstration may still be unfolding at this relatively early
stage in its history, these results are preliminary. We will address the issue of quality of products
and services throughout our evaluation of the demonstration. We will do this by continuing to
interview referral agents and suppliers. In addition, we will conduct a follow-up survey of
beneficiaries, which will provide information about perceptions of the quality of products and
services from the user’s perspective. A survey of suppliers will also be conducted, which will
contain questions about whether changes were made in the products supplied.
4.6 Multiple Winners
Our findings support the conclusion that selecting multiple winners is having its intended
effect on quality; that is, demonstration suppliers must still compete cn the basis of service and
quality in order to attract and retain patients. Several of the referral agents in our focus group
noted that they had negative experiences with one or more of the demonstration suppliers. The
referral agents explained that if the demonstration supplier made a number of mistakes or was not
as accessible as they would have liked, they switched to a different demonstration supplier to
obtain better service. They continued to refer patients to the company that provided the best
services. This illustrates that suppliers must be responsive to the referral agents and patients or
they will lose their referral sources. By the time of the focus group, all of the participating referral
agents had found a demonstration supplier that they were satisfied with.
4-9

4.7 Summary and Next Steps
Reports of the quality of products and services during the demonstration varied. After 2
months of the demonstration, a few referral agents and beneficiaries noted that the quality of
products and services fell, while most others stated that quality had remained the same. Some
referral agents used new suppliers as a result of the demonstration, and in a few cases they were
not pleased with the first demonstration supplier they called. If that haupened, they switched
suppliers. All of the referral agents who participated in a focus group 6 months after the
demonstration prices took effect had found demonstration suppliers that they were satisfied with.
Overall, there is no evidence of systematic quality problems.
It is too early to tell whether the demonstration will have any long-run effects on quality.
Additional site visits and calls to key individuals and organizations in Polk County will enable us
to continue to monitor reports regarding any detrimental effects of the demonstration on the
quality of products and services before and after the demonstration prices took effect. We will
pay particular attention to urological supplies. As with the evaluation of access to needed
services, the evaluation of quality will continue with an analysis of a follow-up survey of
beneficiaries and another of suppliers, which will enable us to compare ratings of quality during
the demonstration.
4-10

SECTION 5 COMPETITIVENESS OF THE MARKEl
In this section, we discuss the effects of the demonstration on the competitiveness of the
DMEPOS market in Polk County. The process of selecting winners may substantially reduce the
number of suppliers that serve the Polk County market. In order for the second round of bidding
to be successful, there must be a sufficient number of bidders left in the market to induce
competitive bids.
The effects of the demonstration on suppliers are also obviously of interest to suppliers
themselves. DMEPOS suppliers generally opposed competitive bidding prior to the
demonstration project, and a supplier organization filed suit seeking an injunction against the
demonstration. The suit, based on procedural issues, was ultimately dismissed. The impact of the
demonstration on suppliers and its impact on suppliers’ feelings about competitive bidding will
likely shape suppliers’ attitudes for future policy discussions about competitive bidding.
We begin by discussing the number and size of bidders pre- and post-demonstration
implementation, bidding strategies, and the strategies of winning bidders. We then report on
industry changes such as acquisitions and bankruptcy filings that have occurred since the start of
the demonstration project and discuss the results of the site visits that pertain to suppliers’
concerns about industry competitiveness. Finally, we present recommendations to be considered
in the next Competitive Bidding Demonstration and outline future analyses of the competitiveness
of the Polk County DMEPOS market. The key findings in this section are as follows:
l A total of 30 suppliers submitted bids in at least one of the product categories. Sixteen suppliers, both large and small firms, were selected as winners. The most common
winning strategy was to vary the percentage discount across most procedures in a product category.
l Few suppliers adopted a bidding strategy that lowered prices for all items by the same percentage, relative to the existing fee schedules. instead, most bidders cut prices for
individual items by varying percentages. Indirectly, this result suggests that relative prices for DMEPOS are not accurately reflected in the existing Florida fee schedule.
l A nondemonstration supplier has acquired two demonstration suppliers. It is unclear whether these acquisitions are directly related to the demonstration. Demonstration
suppliers were concerned about the ability of nondemonstration suppliers to obtain demonstration status through acquisitions.
l The parent companies of one nondemonstration supplier and one demonstration supplier have filed for bankruptcy. Another demonstration supplier has also filed for
5-l
bankruptcy protection. These events do not appear to be directly related to the demonstration, and the suppliers continue to serve the demonstration site.
l Increases in volume for demonstration suppliers were less than suppliers expected, partially because expectations may have been too high, and partially because many nondemonstration suppliers chose to continue serving existing patients under the demonstration’s transition policies. HCFA should stress in future demonstrations that
volume is not guaranteed and present information on volume effects for demonstration suppliers based on the Polk County experience.
l Our analysis in the access and quality sections of the evaluation suggests that
demonstration suppliers will still need to compete on the basrs of service and quality to attract new patients. Referral agents select suppliers on the basis of these characteristics. Some referral agents have tried new suppliers as a result of the demonstration; if the initial demonstration supplier did not provide satisfactory service
and quality, the referral agents switched to another demonstration supplier.
l Demonstration suppliers were concerned about nondemonstration suppliers serving as brokers by continuing to take referrals from referral agents and then referring the patients to a demonstration supplier of their choosing. This practice, while not in violation of the demonstration rules, may not be positive for beneficiaries and has been addressed by the Ombudsman.
l Demonstration suppliers were concerned about demonstration suppliers using
nondemonstration suppliers as subcontractors. While subcontracting is permitted under the rules of the demonstration, it does not appear to be a common practice.
The level of subcontracting has been limited in the next demonstration site.
5.1 Number and Size of Suppliers Before Demonstration
In 1997, there were a total of 321 DMEPOS suppliers serving Polk County beneficiaries in
at least one of the five demonstration product categories (Table 5-l ). The number of suppliers
serving individual product categories ranged from 61 for enteral nutrition to about 120 for both
hospital beds and oxygen supplies. However, many of the suppliers had a very small presence in
Polk County. More than half of the suppliers had less than $1,000 in allowed charges for Polk
County beneficiaries; some of these were probably out-of-county suppliers providing equipment
and supplies to Polk County beneficiaries traveling outside the county. Only 148 and 42
suppliers had over $1,000 and $10,000, respectively, in total combined allowed charges in Polk
County for the five demonstration product categories. These figures may provide the most
accurate picture of the supplier side of the market at the time the bidding occurred.
5-2

Table 5-l. Number and Size of Suppliers in Polk County in 1997
$lM or $500K $250K to $lOOK to $50K to $lOK to $lK to $0 to Total Allowed Product Category More to $lM $500K $250K $lOOK $50K $lOK UK Suppliers Charges
Oxygen Supplim 2 1 % 5 1 6 62 43 123 $7,615,505
~losptal Hedsand 0 0 0 2 2 10 19 89 122 $587,679 Accessories
Enteral Nutrition 0 0 1 0 7 12 28 13 61 $1,268,458
Urological Supplies 0 0 0 0 0 3 15 52 70 $116,156
Surgical Drcssings 0 0 0 1 0 2 14 49 66 $212,245
Total for all Five 2 1 5 5 10 19 106 173 321 $9,800,043 Calrgories
ul c

5.2 Number of Bidders
A total of 30 suppliers submitted bids in one or more product categories (Table 5.2a).
There were a total of 73 bids across the five product categories (Table 5-2b). Three suppliers bid
on all five product categories, while seven suppliers bid on only one product category; the
remaining 20 suppliers bid on two, three, or four product categories. More suppliers (23) bid on
oxygen than any other product category; surgical dressings and urological supplies received the
fewest bids, receiving eight and nine bids, respectively. Probably not coincidentally, oxygen
accounts for the most allowed charges and surgical dressings and urological supplies account for
the least allowed charges among the five product categories.
that Bid Table 5-2a. Number of Suppliers
Number of Categories
All iivc categories
Number of Firms
3
Percent
1 0%
Four categories
Three categories
Two categories
One category
1 3%
9 30%
10 33%
7 23%
Total 30 100%
Table 5-2b. Number of Bids by Product Category
Category Number of Bids
Oxygen Supplies 23
Hospital Beds and Accessories 19
Enteral Nutrition 14
Urological Supplies 9
Surgical Dressings 8
Tota I 73
Overall, just over half of the bidders in each product category won a contract.
Specifically, 13 of 23 bidders for oxygen supplies, 10 of 19 bidders for hospital beds and
accessories, 7 of 14 bidders for enteral nutrition, 5 of 9 bidders for urological supplies, and 4 of 8
bidders for surgical dressings won a contract (Table 5-3).
5-4

Table 5-3. Number of Bidders, Winners, and Composite Bids by Product Category
Hospital Oxygen Beds and Enteral Urological Surgical Supplies Accessories Nutrition Supplies Dressings
Number oi Bidders 23 19 14 9 a
Number of Winners 13 10 7 5 4
Winners as Percentage of 57% 53% 50% 56% 50% Bidders
Approximate Range of 65-105% 45%100% 60%105% 65%145% 35%105% Composite Bids as a Percentage of the Florida Fee Schedule”
Composite Prices:
Demonstration Fee Schedule 161.75 90.72 62.59 a.86 13.82
Florida Fee Schedule 195.99 129.26 86.02 11.07 15.80
’ Based on RFP product weights.
Suppliers with both large and small market shares in Polk County submitted bids. Of the
42 suppliers with over $10,000 in allowed charges in the county in 1997, 14 submitted bids (by
1999, a few of the top 42 suppliers had merged or gone out of business). The remaining 16
bidders had less than $10,000 in allowed charges in 1997. Suppliers with large and small market
shares that submitted bids were about equally likely to be selected as demonstration suppliers.
Seven of the 14 bidders with over $10,000 in Polk County allowed charges were selected as
demonstration suppliers, while nine of the 16 bidders with less than $10,000 in allowed charges
were selected. Three of the four national DMEPOS companies either did not bid or were not
selected as demonstration suppliers; two of these companies had large Polk County market shares
before the demonstration.
5.3 Bidding Strategies
During site visits, suppliers reported that they determined their bids by examining their
costs of providing services, the prices they had bid on other contracts, and how long their
equipment would be used. They also compared the reimbursement from different payers,
including Medicare, Medicaid, and the VA. Our analysis of individual suppliers’ bids suggests
that bidding strategies varied among suppliers. The strategies can be categorized as follows:
l bid the existing fee schedule for all procedures,
l bid a uniform percentage discount of the fee schedule on all procedures (e.g., bid 20
percent less than the existing fee schedule for all procedures),
5-5

l bid a uniform (usually discountedi percentage of the existrng fee schedule on more than 70 percent of (but not all) procedures, and
. varied the percentage reduction on more than 30 percent of the procedures.
The number of suppliers who used each of these strategies is listed in Table 5-4. One
supplier bid the existing fee schedule for oxygen supplies, hospital beds and accessories, and
enteral nutrition. This supplier also bid the existing fee schedule except for two items in surgical
dressings and one item in urological supplies. Overall, the existing fee schedule was bid by one
other supplier of oxygen supplies and another supplier of hospital beds and accessories. Two
oxygen suppliers and three hospital bed suppliers bid uniform discounts on the existing fee
schedules. Several suppliers bid a uniform reduction on more than 70 percent of the items but
varied bids on some of the remaining 30 percent of the items. However, the most frequently used
strategy was to vary the discount for most procedures. The majority of bidders in each product
category used this strategy.
Table 5-4. Bidding Strategy by Product Category
Hospital Oxygen Beds and Enteral Urological Surgical Supplies Accessories Nutrition Supplies Dressings
Bid fee schedule 2 2 1 0 0
Bid uniform percentage of fee 2 3 0 0 0 schedule on all products
Bid uniform of fee percentage 3 4 3 3 2 schedule on at least 70 percent but not all products
Varied bids on more than 30 16 12 10 6 6 percent of products
Total number of bids 23 19 14 9 8
It is not clear why a few bidders bid the existing fee schedule. It is possible that these
suppliers felt the current fee schedule provides an accurate measure of the underlying costs of
providing the products in each product category. Alternatively, these bidders may have hoped
that only a few competitors would bid, allowing them to gain demonstration status without having
to lower their prices.
Bidding a uniform percentage discount for all procedures is a relatively simple strategy for
bidders to apply. I f the existing fee schedule provides an accurate measure of the relative costs of
each procedure (e.g., if procedure A costs twice as much as procedure U, then the existing fee for
5-6

procedure A is twice the fee for procedure B), bidding a uniform percentage discount is also an
optimal strategy because relative cost differences are already built into the existing fee schedule.
indeed, if the existing fee schedule provides an accurate measure of relative costs, then
competitive bidding could be simplified by requiring bidders to submit a single discount bid or
conversion factor to be applied to the existing fee schedule, rather than submitting individual bids
for each procedure in the product category. The fact that most bidders did not adopt the uniform
percentage discount strategy provides indirect evidence that the current fee schedule does not
accurately reflect the relative costs of procedures.
5.4 Winners
Composite bids for oxygen supplies and enteral nutrition ranged from about 60 to 105
percent of the composite bid based on the 1999 Florida fee schedule (see Table 5-3). Composite
bids for hospital beds and accessories were slightly lower, ranging from approximately 45 percent
to 100 percent of the composite bid based on the Florida fee schedule. The minimum bid for
urological supplies was about 65 percent of the fee schedule composite, and the maximum bid
was about 145 percent of the fee schedule composite. Composite bids for surgical dressings
ranged from about 35 percent to about 105 percent of the fee schedule composite.
The strategies used by winners are displayed in Table 5-5. There were no winners among
the suppliers that bid the existing fee schedule. Only one of the bidders that bid a uniform
discount on the fee schedule was chosen as a winner. Two winners in oxygen supplies and
enteral nutrition varied their bids on up to 30 percent of the products but bid a uniform
percentage discount on other procedures. Three winners in the hospital beds and accessories
category and one winner in the urological supplies category successfullv pursued this mixed
strategy. Most winners varied the discount on more than 30 percent of the procedures. Of
course, regardless of strategy, bidders had to bid sufficiently low to be selected as a winner.
5.5 Changes Since the Demonstration
Several changes have occurred in the competitive environment in Polk County since the
demonstration prices took effect on October 1, 1999. A nondemonstration supplier has acquired
two demonstration suppliers, and one nondemonstration and two demonstration suppliers have
filed for bankruptcy protection. The acquisitions may or may not be related to the demonstration,
while the bankruptcies are unrelated to the demonstration.
Lincare Holdings, Inc., has acquired two demonstration suppliers, Home Care Medical
Services and VNA Homecare. Lincare, one of the nation’s largest providers of oxygen and
5-7

Table 5-5. Bidding Strategy of Winners by Product Category
Hospital Oxygen Beds and Enteral Urological Surgical Supplies Accessories Nutrition Supplies Dressings
Bid fee schedule 0 0 0 0 0
Bid uniform of fee percentage 1 0 0 0 0
schedule on all products
Bid uniform of fee percentage 2 3 2 1 0
schedule on at least 70 percent but not all products
Varied bids on more than 30 10 7 5 4 4 percent of products
Total number of bids 13 10 7 5 4
respiratory therapy to in-home patients, was not initially selected as a demonstration supplier, but
was granted demonstratron status after acquiring Home Care Medical Services. It is not clear
whether Lincare’s acquisitions are directly related to the demonstration protect. Although
acquisition of a demonstration supplier could be attractive to a nondemonstration supplier, the
acquisitions may be part of Lincare’s stated business strategy to acquire market share nationally
through both internal growth and acquisition of local and regional competitors. In 1997, Lincare
acquired 16 local and regional competitors throughout the country and the common stock of 8
others; in 1998, Lincare acquired 12 local and regional competitors and the common stock of 12
others; and in 1999, Lincare acquired 18 local and regional competitors and the common stock of
4 others (Lincare Holdings, Inc., 1999, 2000). Nationally, Lincare has over 225,000 patients, 429
operating centers, and operates in 42 states.
On February 2, 2000, Integrated Health Services and many of its subsidiaries, including
Rotech Medical Corporation, which is a not a demonstration supplier but provides DME services
in Polk County under the name of National Medical Equipment Centers, filed for bankruptcy in
the District Court of Delaware. Integrated Health Services provides home respiratory services,
subacute care, long-term care, and contract rehabilitation service. Inpatient service is the
company’s largest source of revenue, but it also has 750 locations that provide home respiratory
services and DME in 43 states. In its annual report, Integrated Health Services (2000) attributed
its need to file for bankruptcy protection to the BBA 97 change from retrospective reimbursement
rates to a prospective payment system for SNFs. As a result, the per diem rates fell lower than
expected and the demand for therapy services declined. Integrated Health Services has
5-a

experienced net losses since 1997. National Medical Equipment Centers continue to provide
DME services in Polk County.
Sun Healthcare Group, of which SunFactors, a demonstration supplier, is a subsidiary,
announced that it and its U.S. subsidiaries had filed for bankruptcy in October 1999 in the
District Court of Delaware (Sun Healthcare Group, 1999). Sun Healthcare Group operates long-
term, subacute care, and assisted living facilities, provides rehabilitation and respiratory therapy,
pharmaceutical and medical supplies, and ancillary services. Like Integrated Health Services, Sun
Healthcare Group reported that its revenues were adversely affected by the implementation of the
prospective payment system for skilled nursing facilities and a greater than expected decline in
the demand for therapy and pharmaceutical services. SunFactors continues to provide DME
services in Polk County.
Medi-Health Care, a demonstration supplier, filed for bankruptcy protection in March
2000 (The Lakeland Ledger, 20001. The filing appears to be unrelated to the demonstration, and
the supplier continues to provide DME services in Polk County.
5.6 Site Visits Results
We met with suppliers during each of our four site visits to Polk County. The four site
visits centered on, respectively,
l bid decisions and strategies;
. implementation of the demonstration project, from announcement of demonstration suppliers through the first 2 months after the demonstration prices took effect;
l a focus group discussion of the first 6 months after the demonstration prices took effect; and
. urological supplies.
Below, we describe results of the site visits to suppliers that pertain to the competitiveness of the
market, Other findings from the supplier visits are reported in Sections 3, 4, and 6.
During the first site visit, which was conducted after bids had been submitted but before
demonstration suppliers were announced, the suppliers who bid were optimistic and excited
about their business prospects if chosen as demonstration suppliers. Most felt that if they were
chosen as demonstration suppliers, their increased market share would more than offset lower
reimbursement rates. All bidding suppliers were certain that their business would suffer if they
were not selected as a winner. However, most said that they would be able to stay in business if
they did not win because the first round of the demonstration was a relatively short period of
time. (In contrast, when asked why they bid, most of the same suppliers said they would go out
5-9
of business if they did not bid.) Several bidding suppliers planned to expand into other counties if
they were not selected as demonstration suppliers.
Of the suppliers that did not bid, one did not bid because Medicare comprised a small
proportion of their business. They felt that the paperwork was not worth the trouble. Another
supplier said that they did not bid because they felt that competitive brdding was philosophically
wrong and that it would harm their patients. Some suppliers that bid speculated that other
suppliers had passed on bidding because they expected that FAMED’s lawsuit would block
implementation of the demonstration. We were unable to confirm or disprove this speculation.
After being selected as demonstration suppliers, most of the suppliers prepared for a
dramatic increase in volume. Suppliers anticipated cost reductions from manufacturers and
looked to renegotiate contracts with manufacturers based on higher volumes. The manufacturers
were responsive and wanted to get involved in the demonstration. Several suppliers increased
equipment, supplies, and personnel; one supplier designated a driver to serve Polk County
exclusively. Another supplier prepared a series of new operating policres for the demonstration;
some of these policies focused on how to handle transfers of bed and oxygen customers. Most
suppliers also worked to educate referral agents and beneficiaries about the demonstration. Only
one supplier reported doing nothing special to prepare for the demonstration.
All of the suppliers expected their volume to increase once the demonstration began.
Three suppliers prepared for a short-term increase in volume of about LO percent and a long-term
increase in volume of about 40 percent. However, because of the novelty of the demonstration,
suppliers were uncertain about the magnitude of the increase. HCFA may have inadvertently
heightened expectations about volume increases by calling demonstration suppliers just prior to
October 1 to check on supplier preparations for implementation.
Most demonstration suppliers did not notice major changes in volume when the
demonstration rules went into effect on October 1, 1999. Nondemonstration suppliers elected to
continue serving existing patients under the demonstration’s transition policies for oxygen,
hospital beds, and enteral nutrition, reducing the demand for demonstration suppliers. Six
months after the demonstration prices went into effect, three of the seven demonstration suppliers
in our focus group reported significant increases in volume, three suppliers reported no change in
volume, and one supplier had not studied the data on volume increases. One of the suppliers
reporting an increase felt that the volume increases were less than expected, in part because
initial expectations were too high. Some suppliers suggested that HCFA should stress that volume
is not guaranteed in future demonstrations.
5-l 0

During our second and third site visits, several demonstration suppliers expressed strong
concerns about what they viewed as questionable practices by nondemonstration suppliers. The
demonstration suppliers reported the following:
l Nondemonstration suppliers were serving as brokers by continuing to take referrals from referral agents and then referring the patients to a demonstration supplier of their
choosing.
l Demonstration suppliers were using nondemonstration suppliers as subcontractors
l One nondemonstration supplier bought a demonstration supplier and was able to
attain demonstration status.
Most of the demonstration suppliers thought that these practices were unfair and violated the
spirit, if not the rules, of the demonstration. The demonstration suppliers believed that they had
played by the rules of the demonstration, had submitted low bids that saved HCFA money, and
should have been rewarded for their efforts by receiving more business. They viewed the
nondemonstration suppliers’ practices as circumventing the spirit of the demonstration and, in the
process, limiting the ability of demonstration suppliers to obtain new business. Demonstration
suppliers also felt that HCFA had not been responsive to their concerns about these practices and
either had not been clear about or had not aggressively enforced the rules of the demonstration.
For several reasons, the demonstration suppliers’ concerns are worth addressing in detail.
Demonstration suppliers’ opinions are likely to affect the credibility of the demonstration among
other suppliers and influence the industry’s overall acceptance of or opposition to competitive
bidding. Moreover, demonstration suppliers may provide important contributions to the “lessons
learned” from the demonstration. One of the purposes of a demonstration project for a new
reimbursement mechanism is to allow HCFA to learn from its experience and refine the
mechanism based on that experience. Some of the nondemonstration supplier behaviors at issue
apparently were unanticipated by HCFA, and HCFA and its contractor have responded, in part by
further developing policies for future demonstration sites. When we looked at the demonstration
suppliers’ concerns and HCFA’s response to those concerns, here is what we found.
First, one nondemonstration supplier confirmed that it had tried to maintain its existing
relationship with referral agents. When referral agents called this supplier, the supplier provided
any nondemonstration products that were required; it then referred requests for demonstration
products to a demonstration supplier. This is the type of relationship that demonstration suppliers
viewed as a “brokering” arrangement; the nondemonstration supplier viewed using this approach
to specialize in nondemonstration products as a way to survive until the demonstration ended.
The arrangement does not appear to violate any demonstration rule. When the Ombudsman was
5-l 1

informed of the arrangement, she visited with referral agents to point out that the practice might
be less advantageous for beneficiaries than a direct referral to a demonstration supplier. For
example, demonstration suppliers would be more accountable for service and product quality to
the original referral agent if they received direct referrals than if the referral came indirectly from a
nondemonstration supplier. After discussion with the Ombudsman, referral agents affiliated with
at least one hospital switched from indirect to direct referrals, Besides ensuring that the referrals
were not accompanied by side-payments between the demonstration and nondemonstration
suppliers, we do not believe that HCFA could have done anything else to discourage “brokering”
arrangements, given the existing demonstration rules. We also believe that it will be difficult to
explicitly ban “brokering arrangements” in future demonstrations.
Both the Ombudsman and our evaluation team investigated reports of demonstration
suppliers subcontracting to nondemonstration suppliers. Subcontracting is explicitly allowed
under the rules of the demonstration, with the demonstration supplier responsible for the quality
and service of its subcontracting, and occasional subcontracting occurs in other DME markets.
Overall, however, subcontracting appears to be relatively uncommon in Polk County. HCFA’s
Ombudsman found that none of the demonstration suppliers were subcontracting 6 months after
the demonstration began, although one demonstration supplier had subcontracted some business
to a nondemonstration supplier earlier in the demonstration. The demonstration supplier had
previously worked with the nondemonstration supplier on managed care contracts. Our
evaluation team reached similar conclusions about the prevalence of subcontracting. Although
subcontracting does not appear to be common rn Polk County, HCFA has reacted to the Polk
County demonstration suppliers’ concerns by limiting the amount of subcontracting allowed in
the second demonstration site in San Antonio. The following rules will apply in San Antonio:
“The Demonstration Supplier may not routinely subcontract its business for
Designated Products. However, the Demonstration Supplier may subcontract
business for Designated Products when needed because of problems with product
availability, transportation or service. For each product category. subcontracting
can account for no more than five percent of the Demonstration Supplier’s
claims.”
The rules of the demonstration specifically allow for mergers or acquisitions between
demonstration and nondemonstration suppliers, with demonstration status transferrable to the
merged or acquiring entity as long as the entity meets all demonstration quality requirements and
is approved by HCFA. In designing the demonstration, HCFA opted for this approach to
guarantee that beneficiaries would continue to have access to demonstration suppliers if a merger
5-12

or acquisition occurred and to give demonstration suppliers the same ability to merge or be
acquired as they would have in the absence of the demonstration (mergers and acquisitions are
common in the OMEPOS industry).
In deciding whether to approve demonstration status for the acquiring supplier, HCFA
considered the acquisition’s likely effect on beneficiary access and whether the acquisition was
fair to demonstration suppliers, including the demonstration supplier that wanted to sell itself as
well as other demonstration suppliers. Ultimately, HCFA approved demonstration status for the
acquiring firm. Given the demonstration rules, HCFA acted appropriately in approving
demonstration status for the acquiring supplier in Polk County, after the supplier met
demonstration quality requirements and standards. However, in setting the rule on acquisitions
and mergers, HCFA did not anticipate that a supplier with a large market share in the
demonstration site would fail to win demonstration status in the bidding competition, and then
gain the status through acquisition. We believe that it is understandable that other demonstration
suppliers would view this result as unfair, after they successfully completed the bidding process
by offering HCFA low prices and meeting quality standards. In addition, we believe that allowing
transferability of demonstration status may cause some suppliers to bid less aggressively because,
if they lose, they still have the option of getting into the demonstration by acquiring a
demonstration supplier. Of course, the supplier would have to pay accluisition costs that might
offset any gain from not bidding aggressively in the first place. ’ Because the less aggressive
behavior could lead to higher demonstration prices, we believe it would be worthwhile for HCFA
to reexamine the issue of transferability of demonstration status. This reexamination would
carefully weigh the benefits of transferability (maintaining access, allowing suppliers to freely buy
or sell their firms), against the potential costs (less aggressive bidding). Besrdes the extreme
options of no transferability and complete transferability, HCFA could consider intermediate
options such as allowing transferability on a case-by-case basis when the transfer is necessary to
maintain beneficiary access or allowing an acquiring nondemonstration supplier to serve the
demonstration supplier’s current patients but not accept any new patients under the
demonstration.
Although HCFA and the Ombudsman appear to have investigated demonstration
suppliers’ concerns about arrangements involving nondemonstration suppliers, some
demonstration suppliers continue to feel HCFA has been unresponsive. This perception may
‘With transferability, some suppliers may actually bid more aggressively, in order to be able to sell their iinn (and demonstration) status to suppliers who bid less aggressively because of transferability. Such behavior might partly offset higher bids from the suppliers who bid less aggressively.
5-13

reflect dissatisfaction with HCFA policies or the outcome of the investigations and/or it may
reflect communication problems between HCFA and its winning suppliers. Regardless of its
cause, the perception may in turn negatively affect other DMEPOS suppliers’ opinions about
competitive bidding and hurt the credibility of the demonstration. Both results could limit
HCFA’s ability to implement competrtive bidding on a wider scale, if the demonstration is
otherwise successful. To address the demonstration suppliers’ perceptions, we recommend that
HCFA staff meet with demonstration suppliers to hear suppliers’ concerns firsthand. Although the
demonstration Ombudsman has met with the demonstration suppliers and relayed their concerns
to HCFA staff, and HCFA staff have met via telephone with a few individual suppliers, meeting
with a group of demonstration suppliers would further demonstrate that HCFA takes the suppliers’
concerns seriously by letting the suppliers meet directly with the HCFA staff responsible for setting
the rules of the demonstration. During the meeting, HCFA could explain what it and its
contractor have done to investigate the suppliers’ concerns. HCFA and the demonstration
suppliers could then discuss potential remedies for these concerns in future demonstrations
Some demonstration suppliers’ concerns about arrangements involving nondemonstration
suppliers appear to be intimately entwined with smaller than expected increases in volume from
the demonstration. Our evaluation suggests that subcontracting by demonstration suppliers and
referral brokering by nondemonstration suppliers is uncommon and has therefore had little overall
impact on the number of patients using demonstration suppliers. The impact of Lincare’s
acquisition of two demonstration suppliers on other demonstration suppliers’ market shares
requires further study. Overall, however, it appears that suppliers’ initial expectations about the
market share to be immediately gained from demonstration status were too high.
Therefore, in future competitive bidding demonstrations, we recommend that HCFA
provide information about volume effects for winning suppliers, based on the Polk County
experience. In the RF6 and the Bidders Conference for Polk County, HCFA properly emphasized
that it could not guarantee that winning bidders would receive a specific volume of patients.
Because the demonstration had never occurred before, both HCFA ancl suppliers faced great
uncertainty about the number of new patients that demonstration suppliers would receive. It
appears that some suppliers may have overestimated the number of new patients. With the data
from Polk County in hand, HCFA can now provide potential bidders with better information about
the potential volume for demonstration suppliers. Specifically, HCFA can note the following, at
least in Polk County:
. Most, if not all, nondemonstration suppliers continued to serve existing oxygen, hospital bed, and enteral nutrition patients under the demonstration’s transition
5-l 4

policies. As a result, demonstration suppliers are unlikely to experience a huge increase in demand on the day that the new demonstration prrces go into effect.
l Over time, volume for demonstration suppliers as a whole will increase, as referral agents refer new patients to demonstration suppliers. Thus, being a demonstration supplier will open some doors for demonstration suppliers, as some referral agents will be willing to try a demonstration supplier for the first time.
l Demonstration suppliers must be ready to take advantage of these opportunities by
providing high levels of quality and service. Based on both the supplier comments and referral agent focus groups, it IS clear that referral agents In the demonstratron look for the same thing they look for in the absence of the demonstration: prompt delivery, reliability, and responsiveness. If a demonstration supplier cannot deliver these
attributes, they are unlikely to receive additional referrals.
l It is possible that the first referral that a demonstration supplier receives from a new
referral agent will come under trying circumstances (e.g., at the end of the day, on a weekend, etc.). Successful performance under these circumstances may lead to additional referrals; unsuccessful performance may cause the referral agent to use other demonstration suppliers.
In short, although demonstration status can open new opportunities for suppliers, demonstration
suppliers will still need to compete for referrals the same way they have always competed for
referrals: with service and hard work.
5.7 Summary and Next Steps
Currently, it appears that the DMEPOS market in Polk County remains reasonably
competitive. A total of 30 suppliers submitted bids and 16 were selected as demonstration
suppliers in at least one product category. Both small and large firms bid successfully, usually
using strategies that varied prices for most procedures. There have been additional changes in the
market since the demonstration began. One nondemonstration supplier acquired two
demonstration suppliers, but it is unclear whether these acquisitions are directly related to the
demonstration. One demonstration supplier and the parent companies of one demonstration and
one nondemonstration supplier have filed for bankruptcy protection, but these filings appear to be
unrelated to the demonstration, and the suppliers continue to provide DMEPOS in Polk County
Increases in volume for demonstration suppliers were generally lower than many suppliers
expected. Expectations may have been too high initially. HCFA should be able to provide better
information on volume effects in future demonstrations, based on the Polk County experience.
Demonstration suppliers were concerned about acquisitions by and brokering and subcontracting
arrangements involving nondemonstration suppliers. These arrangements do not appear to violate
demonstration rules; nevertheless, the arrangements stirred a lingering controversy, with
5-l 5

demonstration suppliers desiring more direct communication with HCFA about policy governing
the arrangements.
We will continue to evaluate the competitiveness of the market throughout the
demonstration. During the next year, we will conduct a supplier survey to gain further insight
into the effect of the demonstration on supplier competition. We intend to analyze the results of
the survey in conjunction with claims data when the data become available. Both the claims and
survey data will be collected in Polk County and the comparison county. These data will allow
us to characterize the supplier market in both the pre- and post-intervention periods and to
evaluate the changes that have occurred in the local market. Specifically, we will make pre- and
post-intervention comparisons of the
l number of suppliers providing each product type;
. number of suppliers who are local or from beyond the market;
. share of demonstration products relative to the suppliers’ total business;
. market competitiveness by product type;
. relative market shares of small, medium, and large suppliers, by product category; and
l financial status of suppliers.
Data from the comparison county will help distinguish the effects of the demonstration in
Polk County from general trends that affect both Polk County and other areas. We will also
collect information on competitiveness during future site visits to Polk County.
5-l 6

SECTION 6 REIMBURSEMENT SYSTEM
In the first year of the evaluation, we have devoted considerable effort to understanding
and documenting the process of implementing the competitive bidding reimbursement system.
We considered questions such as the following:
l How were interested parties notified of the new system?
l What efforts were made to educate beneficiaries, referral agents, and suppliers on how to “navigate the system?”
l How was the bidding process managed?
l How were winners selected?
l What administrative changes were made to accommodate the new payment system and how is system and supplier performance being monitored?
Detailed documentation of the process will assist HCFA in replicating the demonstration as well
as determining what aspects of the demonstration were most successiul and what improvements
might be made.
The key findings in this section are as follows:
l Competitive bidding can be successfully implemented.
l HCFA and its contractor exerted major efforts to educate beneficiaries, suppliers, and referral agents about the demonstration.
l The information included about the demonstration in the RFB and Bidders Conference was useful to suppliers.
l The bid evaluation process did not simply focus on price; supplier capacity and quality were carefully considered during this process. The demonstration contractor has proposed methods for streamlining the bid evaluation process.
l Demonstration claims are being processed smoothly.
l The presence of an on-site Ombudsman has greatly facilitated implementation of the demonstration.
6.1 Publicity, Solicitation, and Education
HCFA and its contractor undertook a series of efforts to publicize the demonstration and
educate stakeholders about its rules and implications. Separate publicity and education efforts
6-1

were aimed at beneficiarres, beneficrary advocacy groups, supplrers. rcierral agents, secondary
insurers, and nursing homes. Below, we describe the efforts armed at each group
l Beneficiaries-A public meeting was held in Lakeland in September 1998 describing the demonstration. This meeting was publicized in the local papers and on the HCFA web site. A letter explaining the demonstration was sent to beneficiaries in Polk County (August 4, 1999). This letter contained a short brochure, “The Medicare DMEPOS Competitive Bidding Demonstration and You,” that outlined why HCFA was undertaking the demonstration, what the changes will mean for beneficiaries, how competitive bidding works, and how Medicare will protect beneficiaries. A follow-up letter and a copy of the demonstration directory of providers were sent immediately prior to October 1, 1999, when the demonstration prices took effect. Presentations at local gatherings (e.g., AARP groups) were made to provide opportunities for open questions and answers. In addition, three separate articles appeared in the Lakeland and Tampa newspapers in the late summer discussing the demonstration. A “hotline” was set up to allow the local Ombudsman to answer beneficiary questions. Numerous beneficiaries have used this hotline to discuss the implications of the demonstration for their healthcare needs. For example, in the months leading up to the demonstration (August, September 1999), the Ombudsman received 295 calls from beneficiaries. While the number of calls has declined somewhat since this peak (110 beneficiary calls in October; an average of 41 calls per month since then), the hotline remains an important avenue for beneficiaries to obtain immediate and personal attention to their questions and their complaints. New Medicare beneficiaries are identified quarterly and sent materials on the demonstration.
l Beneficiary Advocacy Groups-A letter was sent in May 1998, inviting beneficiary groups to a meeting to discuss the demonstration (held on May 29, 1998). The on-site Ombudsman also made a number of presentations to local groups (e.g., AARP, Better Breathers-a group of oxygen users, neighborhood associations, etc.).
l Suppiiers-A letter was sent in April 1998 to all suppliers submitting DMEPOS claims for Polk County beneficiaries in the previous 18 months, informing them of the demonstration. A separate letter was sent in June 1998, inviting approximately 150 local suppliers to a meeting in Lakeland to discuss the demonstration. On February 9, 1999, an announcement of the upcoming demonstration appeared in the Commerce Business Daily. This announcement explained the purpose of the competitive bidding demonstration and provided information on the upcoming bidding process, including contact information for obtaining an RFB package. Suppliers who received Medicare reimbursement for DMEPOS delivered in Polk County in 1997 received a letter (dated January 29, 1999) notifying them of HCFA’s intent to solicit bids. The RFB, detailed instructions, and information regarding the Bidders Conference were sent out to all persons requesting these documents. A Bidders Conference was held 1 month before the bids were due to review bid procedures and answer technical questions. HCFA staff held a general debriefing with suppliers to discuss the results of the bid evaluation process. The on-site presence of the Ombudsman allowed the Ombudsman to personally visit suppliers to discuss the demonstration and answer technical questions both before and after the demonstration prices took effect.
l Referral Agents-Letters were sent to referral sources in August 1999 describing the demonstration, announcing that demonstration winners had been selected, and indicating that a directory would soon follow. In-servrce meetings were scheduled in
6-2
mid- to late-August with hospital discharge planners, and one-on-one meetings were also scheduled with administrators oi home health agencies snti large physician groups to provide referral agents with detailed informatlon concerning the demonstration, including a draft Itst of demonstration winners. Directories listing demonstration providers, their services, and service areas were sent to these agents in early October. The on-site Ombudsman continued to meet with referral agents after the demonstration began.
l Secondary Insurers-A general notification letter on the project and prices was sent to Medicaid, Medigap, and other insurers (August 13, 1999).
l Nursing Homes-A letter explaining the demonstration was sent to nursing homes on August 4, 1999. These providers were asked to indicate the supplier(s) they intended to use by August 23, 1999.
While most stakeholders were generally satisfied with the publicity, solicitation, and
education efforts of HCFA and its contractor, one issue did arise during interviews with suppliers
regarding the Supplier Directory. Because the Directory was compiled from bid information and
not previewed by the suppliers to assure accuracy and comparability of information, some
suppliers had their office hours listed as “24 hours” because someone is always on call, while
others only had the hours that their office was open listed (e.g., 8:00-5:30). A number of suppliers
felt that having office hours listing as “24 hours” was misleading, because the offices were not
technically open 24 hours, and all suppliers are required to have someone on call 24 hours a day.
In addition, some suppliers’ home offices outside Polk County were listed in the Supplier
Directory, even though the supplier had local offices within Polk County. This type of oversight
could be avoided by soliciting supplier feedback on the Supplier Directory or providing a
structured form for information to be included in the Directory.
6.2 Management of the Bidding Process
A detailed RFB package was distributed to all suppliers that requested the materials, which
contained the following information:
l Background information on why the competitive bidding demonstration was being conducted and how competitive bidding works to lower prices.
l Specific discussion of the DMEPOS Competitive Bidding Demonstration process, including how to formulate bids, how bids are evaluated, calculating maximum Medicare allowances, and post-award options.
l An outline of operational policies that would be in effect during the demonstration.
l Forms to be submitted to the DMERC for bid evaluation:
- Form A: Application for Suppliers-contains general information about the supplier and its employees, including identifying information, categories of
6-3

goods/servtces for which the suppiier IS submtttrng a hrti, accreditatron and Itcensure, number of employees, thetr training and certiftcattons, methods for handling customer complaints and assessing customer sattsfaction, presence of disaster and infection control plans, declarations regarding tnvestigattons or claims against the supplier, a list of references, and a Itst of ftnancial institutions with which the supplier does bustness.
Form 8: Bidding Sheets-Suppliers are asked to complete separate bid sheets for each category of goods/services on which they will be submitting a bid. Each bid sheet requests additional details on the processes of care for the particular good/service, specific zip codes that they will service during the demonstration, and bid prices for procedures included in the demonstration.
- Form F: Financial Data-Suppliers are asked to provide detailed information from Income statements and tax returns for the previous 2 years as well as accounts receivable summaries for the past 3 months.
l Forms to be used by bid evaluators and references:
- Form C: On-Site Inspection Checklist-covers examination of physical property, licenses and certifications, staffing, inventory, patient files, and procedures.
- Form D: Bank References-covers loan payments, returned checks, and credit worthiness of supplier.
- Form E: Referral Source References-requests information from references regarding customer services, deliveries, patient satisfaction, quality of products, and patient training.
l Appended materials:
- Requirements and standards for demonstration suppliers.
- 1996-l 997 Medicare utilization data for DMEPOS for Part B beneficiaries permanently residing in Polk County (to assist suppliers in estimating demand).
- Financial Ratios-an explanation of the financial ratios to be used to evaluate bidders.
- Glossary of Terms
A Bidders Conference was held on February 23, 1999 in Lakeland, Florida. Over 100
individuals attended the meeting. Representatives from HCFA and Palmetto CBA, the
demonstration contractor, outlined the rationale for the demonstration, described demonstration
rules and operating procedures, and reviewed the bidding process and RFB materials. A
consultant from the DME industry made a short presentation on developing effective bidding
strategies for the demonstration. During a question-and-answer period that lasted over an hour,
HCFA and Palmetto representattves responded to over SO questions from the audience about the
6-4

demonstratron. WrItten responses to the questions were sent to attendees and made available on
HCFA’s Internet site for the demonstration.
In general, the presentatrons in the Bidders Conference were clear and informative.
During our site visits, suppliers reported that the Conference was useful, although a few suppliers
felt that most oi the material was also contarned in the RFB. The question-and-answer session
gave supplrers a useful opportunity to raise questions about the bidding process and
demonstration rules.
Most suppliers felt that the RFB and Bidders Conference provided them with sufficient
information for bid preparation. Some suppliers would have liked HCFA to say how many
supplrers would be selected as demonstration suppliers and how much business demonstration
suppliers would receive. However, because of the design of the demonstration, HCFA could not
provide that information: one of the criteria for determining the competitive range for the
demonstration was that the firms in the range would have sufficient capacity to serve the entire
market, and the design promoted competition between demonstration, suppliers to maintain
quality and service levels.
Bids were due March 29, 1999. As detailed in previous chapters, 30 suppliers submitted a
total of 73 bids across the five product categories. Suppliers reported spending 40 to 100 hours in
preparing their bids. One supplier reported problems in filling out the financial forms, but
suppliers had few problems filling out the other forms.
6.3 Selection of Winners
Bids were initially reviewed by Palmetto CBA staff for completeness and eligibility of
bidders. Next, a bid evaluation panel of reimbursement and DMEPOS experts reviewed all of the
bids to acquaint themselves with the bids and identify any quality problems. No suppliers were
eliminated as part of these initial reviews. The panel then sought to establish the number of
winning suppliers necessary to meet demand by arraying suppliers in each product category
according to their composite bid price, comparing cumulative supplier volume (current and
estimated capacity) with current utilrzation levels, and selecting a minimum number of suppliers.
The possibility that some suppliers might drop out of the demonstration was considered, and the
minimum number of suppliers was adjusted to accountfor this possrbility.
The panel considered the capacity of these bidders and looked for natural breaks in the
bid prices to select a cutoff price. The panel recommended cutoff points to HCFA for approval.
The only change requested by HCFA was the addition of an enteral supplier to expand capacity.
6-5

After the cututi was selected, only bidders belo\v the cutoff ricer& further consrderation
for selectron. Suppliers who made the cutoff received sate vrstts bv rncpectors who completed
Form C’s On-Site Inspection Checklist. Palmetto CBA staff collected information for Forms D and
E from bank and referral source references, respectrvely. Palmetto CBA obtained at least five
references on each supplier. The panel used the information obtarnetl from Forms C, D, and E to
score each bidder in each of four areas: customer service and satisfaction, ethics, data collection
and retention, and financial stability/creditworthiness. The assessments resulted in a relatively
wide distribution of scores ranging from poor (score of less than 70 total points out of 1 OO), and
average (70-79 points) to good (80-89 points) and excellent (> 90 points). Two suppliers received
less than 70 points; neither of these suppliers was selected, although one asked for
reconsideration and was approved after submitting further documentation. Suppliers in the
average range were given opportunities to take corrective actions.
The review panel met for more than 3 weeks in a secure conference room for at least 6
hours each day. At least 2 weeks of this time were spent discussing issues related to the quality of
goods/services offered by the suppliers. Palmetto CBA made a number of suggestions that might
streamline this process somewhat, since the replication of the demonstration on a national scale
would make this type of time-intensive process relatively impractical. First, a standard review
form for the bids would facilitate a uniform review of the bids by all reviewers and speed up
discussions. In addition, assigning points for certain facets of the suppliers’ processes could
facilitate comparisons (e.g., response time for oxygen delivery: within 8 hours = 5 points, 8-10
hours = 4 points). Finally, each member of the panel reviewed every bid. It may be more
practical to assign primary and secondary reviewers to reduce the reviewer burden and review
time.
After quality was evaluated, the Bid Evaluation Panel recommended a preliminary list of
demonstration suppliers. HCFA reviewed the list and the Panel’s rationale and approved the
Panel’s recommendations. To set the new fee schedule, HCFA returned to the bid prices from all
the suppliers who initially bid at or below the HCFA-approved cutoff price. Their individual bids
were combined to find a single price for each demonstration item (see Appendix A for a detailed
discussion of the method for setting prices).
6-6
6.4 Administration and Monitoring
.
6.4.1 Processing System Changes
DMEPOS claims from Polk County were already being processed by Palmetto CBA. Thus,
there was no confusion as to where to send claims as a result of the new rermbursement system
for Polk County. However, significant computer system changes were necessary to accommodate
the alternative reimbursement structure associated with the demonstration. Palmetto GBA
worked directly with their programming contractor (VIPS) to create additional computer program
modules to handle the new claims. All claims submitted to the DMERC must be screened to
determine whether they are Polk County claims. These claims must then be diverted to special
programs designed to assess
l date of service (pre- or post-implementation of the demonstration fee schedule on October 1, 1999);
l procedure category (demonstration or nondemonstration item);
l supplier status (demonstration/nondemonstration; exemptinonexempt);
l beneficiary/procedure status (grandfathered beneficiary under the demonstration transition policies/item that was still reimbursable to nondemonstration supplier at demonstration price or beneficiary that must seek care from demonstration supplier); and
l grace period status (up to two claims allowed to nondemonstration suppliers, but notice letter sent to beneficiary about demonstration changes).
The modified programs were developed more than 6 months prior to the beginning of the
demonstration, and extensive system testing with mock claims was conducted in order to work
out any program bugs. A procedure manual was developed specifically for the demonstration,
and staff who would be dealing with Polk County suppliers and beneiiciaries underwent intensive
training. In addition, internal education seminars were held for all Palmetto GBA staff in order to
educate them about the demonstration, in case their department came into contact with some
aspect of the demonstration or they received any “stray” calls. Since the commencement of the
demonstration, there have been no unanticipated problems with the new claims processing
modules.
6.4.2 Use of an On-Site Ombudsman
The Medicare Competitive Brdding Ombudsman took up residence in Polk County in
March 1999. The Ombudsman was responsible for answering beneiiciary, supplier, and provider
6-7
rnquirres on the “hotlrnc” as well as education and outreach (town mectrngs. in-service meetrngs,
and one-on-one vrsits) in the months prror to the October 1, 1999 start date ior the demonstration.
Closer to the start date, she was also responsible for coordinating and participating in bid
evaluation site visits Since the Inception of the demonstration, the Ombudsman continues to
answer telephone inquiries and monrtor demonstration suppliers through investigation of
complaints and routine inspections. Our site visit interviews with local beneficiary groups and
suppliers indicate that the Ombudsman’s presence in Polk County has been instrumental to the
smooth functioning of the demonstration. Both beneficiaries and supplrers have expressed strong
support for the presence of a local Ombudsman and open admiration for the skilled manner in
which the Ombudsman has handled her tasks.
6.4.3 Site Monitoring
The Ombudsman has been responsible for monitoring the quality of products and services
offered by the suppliers. A telephone hotline is used by many suppliers and beneficiaries to
request information and to notify the Ombudsman of potential problems. Figure 6-1 shows the
monthly number of calls to the Ombudsman during the period from August 1999 through May
2000. Calls were highest in August and September 1999 as beneficiaries received information
about the demonstration. Calls have generally fallen since the demonstration prices took effect
on October 1, 1999. The calls shown in the table include both requests for information and
complaints. Since the demonstration prices took effect on October 1, 1999, the Ombudsman has
received a total of 23 beneficiary complaints and 15 supplier complaints.
Beneficiary complaints in the early months of the hotline centered around beneficiaries’
dissatisfaction with switching suppliers and/or having to switch name brands (especially for
urological supplies). Most of these complaints are handled over the phone with a detailed
explanation of the demonstration rules and purpose. Later beneficiary complaints usually focused
on a supplier’s inability to deliver the appropriate product on time. For these cases, follow-up
calls were made to the supplier(s) in question to determine the source of the delay. If the problem
appeared to be the result of the supplier’s actions, the Ombudsman addressed the issue with the
supplier and, in some cases, scheduled a site visit to review records and procedures. Three such
site visits have been conducted to date. In all cases, the Ombudsman followed up with the
beneficiary to assure appropriate resolution.
Supplrer complaints usually focused on the potentrally inappropriate behavior of other
suppliers or referral agents. For example, one supplier called to complain about a referral agent
referring patients to a nondemonstration supplier who, in turn, referred the patient to a
6-8

Ombudsman Calls
I !
Figure 6-1. Monthly Number of Calls to the Ombudsman
demonstration supplier for demonstration-related items. While this is not expressly prohibited
under the demonstration, this type of circuitous referral may endanger the ability of the patient to
obtain quality supplies and services in a timely manner. The Ombudsman contacted the referral
agent(s) and suppliers involved in this incident and reminded them that this method may not be in
the patient’s best interest.
In addition to the complaint-driven methods for assuring quality and service, the
Ombudsman has also been conducting annual site visits to demonstration suppliers to review
procedures, assure appropriate inventories, and check transactions records. Ten routine site visits
have been conducted to date.
6.4.4 The Relationship Between the Demonstration Contractor and HCFA
The demonstration contractor, Palmetto GBA, is responsible for implementing and
administering the demonstration on a day-to-day basis. In this role, Palmetto is responsible for
designing the demonstration, educating beneficiaries, suppliers, and other stakeholders about the
demonstration, solicitatrng and evaluating bids, processing claims, and responding to inquiries
and complaints about the demonstration. Most demonstration staff work in Palmetto’s Columbia,
6-9
South Carolrna headquarters; an on-sate Ombudsman resides and works 111 Polk County. Palmetto
has extensive experrence In administering Medicare DMEPOS programs, serving as the DMERC
for 17 southern and western states, providing data analysis for DMEPOS under the Statistical
Analysis DME Regional Carrier Contract, and adminrstering the National Supplier Clearinghouse
which marntains records for DMEPOS suppliers nationwide.
HCFA staff maintain oversight responsibility for the demonstration, review all documents
and Palmetto decisions, and make final decisions about demonstration design and policy. In the
period before the demonstration prices went into effect, HCFA staff participated prominently in
the announcement of competitive bidding, the Bidders Conference, and a general debriefing for
bidders. HCFA and Palmetto staff collaborate closely, with weekly teleconferences and
occasional on-site meetings.
The bid evaluation process provides a fairly representative example of the division of labor
between Palmetto and HCFA. Bids were mailed directly to Palmetto, and Palmetto staff were
responsible for entering and verifying all information on the bid forms. The Bid Evaluation Panel
consisted primarily of Palmetto staff with experience in DMEPOS; the HCFA Project Officer
served as an ex officio, non-voting member of the Bid Evaluation Panel and participated in many
meetings via teleconference. After reviewing bid and capacity information, the Bid Evaluation
Panel recommended cutoff bids to determine the competitive range in each product category.
These recommendations were forwarded to senior HCFA management for approval. HCFA
accepted the panel’s recommendations without revision in four of the product categories and
expanded the competitive range slightly in the remaining category to ensure sufficient supplier
capacity for beneficiaries. Palmetto then evaluated quality and financial data for all suppliers in
the competitive range. Based on these evaluations, the Bid Evaluation Panel recommended that
all suppliers with good or excellent quality rating be accepted as demonstration suppliers. HCFA
reviewed the recommendations and evaluation process, and approved demonstration status for all
of the suppliers recommended by the Panel. In addition, HCFA approved two additional
suppliers in the competitive range whose quality was rated average, conditional on the suppliers
addressing quality issues raised during on-site inspections.
In general, the division of labor between Palmetto and HCFA appears to have worked
reasonably well. Palmetto has strong expertise in the areas of DMEPOS, claims processing and
administration, beneficiary and supplier communication, and customer service. It makes sense to
merge operations of the demonstration with Palmetto’s existing DMERC operations to the full
extent possible. HCFA has provided appropriate oversight and retained ultimate responsibility for
policy decisions. Communication and coordination between Palmetto and HCFA has been
6-10
eiiectrve. After completron ot a longer than expected developmental perrod, the biddrng process
and rmplementation oi the demonstration prices proceeded on schedule.
Communicatron between demonstration suppliers dnd HCFA is one of the few areas
where the division of responsrbilities between Palmetto and hCFA may have caused difhculties,
at least from the perspectrve of suppliers. As noted in Section 5, some demonstration suppliers
have been concerned about demonstration policy regarding actions by nondemonstration
suppliers. They have reported these concerns to Palmetto’s Ombudsman, and Palmetto has in
turn conveyed these concerns to HCFA and investigated the actions in question. Based on these
concerns and investigations, HCFA has reexamined demonstration policies. In some cases, the
reexamination has led to changes in demonstration rules for the next demonstration site; in other
cases, the original rules were reaffirmed, Although Palmetto’s Ombudsman has attempted to
explain HCFA’s policy decisions to demonstration suppliers, some of the suppliers have been
disappointed with the decisions and, knowing that HCFA retains ultimate authority over
demonstration policy, have wanted to discuss the decisions directly with HCFA staff, rather than
by communicating through the Ombudsman. HCFA staff have met individually with a few
demonstration suppliers, but some suppliers still feel that their concerns have not been adequately
addressed.
6.5 Discussion
At this relatively early stage of the demonstration’s history, a number of preliminary
conclusions can be drawn:
l HCFA and its contractor invested considerable time and energies into notifying and
educating stakeholders. A few suppliers and referral agents thought that some stakeholders were not fully informed about the demonstration. Physicians were perhaps the most difficult group to inform and educate because of the many demands on their time. Some hospital-based referral agents were unsure of which suppliers to use during the first few weeks of the demonstration and had to “get up to speed” through conversations with other social workers and discharge planners. It is not clear, however, that greater efforts or alternative methods would have been more successful in educating these groups.
l The presence of an on-site Ombudsman has been extremely popular and usefuul for all stakeholders involved, including beneficiaries, referral agents, suppliers, HCFA, and Palmetto CBA. Beneficiaries have made good use of the Ombudsman to answer both demonstration- and nondemonstration-related Medicare questions. Referral agents and suppliers report feeling less antagonistic toward the demonstration because the Ombudsman is living in the community (“I say hi to her at the movie theater”) and is intimately in touch with the day-to-day operation of the demonstration (“She knows what’s going on.“)
6-l 1
l Bd evaluator was a tune-consummg and bbor-~nterwve process. While some of thts efiort can be attrtbuted to the learntng curve associated vZ/tth running the first compettttve bidding demonstration and a concerted effort to thoroughly evaluate all bids, this type of process and the associated expenditures may not be feasible if competittve bidding is adopted on a more wtdespread basis. Palmetto’s recommendations for changes to the evaluation process have the potenttal to streamline thts aspect of the demonstration. In additton, experienced brd evaluators may be able to more expeditiously evaluate bids.
l Claims are being processed in a time/y manner. Palmetto CBA reports no significant problems in handling the new claims, and suppliers have commended the carrier (during site visit interviews) for the expeditious handling of claims.
l Competitive bidding can be implemented. Our initial data indicate that HCFA and its contractor have been successful in implementing competitive bidding. They have been able to notify and educate stakeholders, solicit and evaluate bids, select winners, and implement the new reimbursement system in a relatively orderly fashion and without stgnrficantly compromisrng access or quality.
u-12

SECTION 7 SUMMARY AND CONCLUSIONS
Based on 9 months of operation, the DMEPOS Competitive BiddIng Demonstration shows
promise in meeting its objectives. Competitive bidding has lowered the prrces paid by Medicare.
Because we do not yet have data on utilization, we cannot definitively conclude that total
DMEPOS allowed charges (the product of price times utilization) will fall. However, if utilization
remains constant, we estimate that Medicare allowed charges for demonstration products will fall
by nearly $1.3 million annually, a reduction of 17 percent.
The demonstration has also shown that HCFA can design, implement, and operate a
reimbursement system that uses competitive bidding. HCFA was able to notify stakeholders about
the demonstration and provide educational materials to interested parties. HCFA was also able to
solicit and evaluate bids and select demonstration suppliers. The administrative claims system
was modified to incorporate competitive bidding, and demonstration claims are being processed
smoothly. Aided by the presence of an on-site Ombudsman, HCFA appears to be monitoring the
demonstration successfully.
However, important evaluation issues remain unresolved. Because the demonstration is
still relatively new, it is not yet possible to evaluate the full effects of the demonstration on
beneficiary access, quality and product selection, and competitiveness of the market. To date, we
have not observed a systematic impact of the demonstration on beneficiary access or quality and
product selection. It is premature to evaluate whether the demonstration will have negative or
positive impacts on access and quality in the long run. Based on our experience to date, quality
problems are most likely to occur in the urological supplies product category, and we will
monitor that product category carefully. It is also premature to evaluate whether the
demonstration will have long-run impacts on market competitiveness in Polk County. In the short
run, the demonstration attracted numerous bidders, and demonstration suppliers appear to be
competing on the basis of quality and service to attract and maintain patients. However, the
long-run effects on competition will only become apparent after a year or more’s experience with
the demonstration.
Given these unresolved issues, it is premature to declare that competitive bidding is either
an appropriate or an inappropriate reimbursement mechanism for DMEPOS. Our evaluation will
continue throughout the duration of the demonstration in Polk County, as well as in the second
7-l

demonstration site in San Antonlo, and LV~ LVIII collect extensive intomlat1on on the
demonstration’s impact over time. WC wtll issue the Year 2 Annu,il E\.lluatlun Report and Report
to Congress 1 year from now and the Final Evaluation Report and Report to Congress after the
demonstratton concludes.
7-2

GLOSSARY
Adjusted Bid Price:
Adjustment Factor:
Allowed Charges:
BEP:
Beneficiary:
Beneficiary Copayment:
Bid Price:
Bidders Conference:
Bidding Round:
Bid Evaluation Panel:
The supplier’s bid price for a demonstration product
multiplied by the supplier’s ratlo.
The ratio of the supplier’s composite bid price to the cutoff
composite bid price chosen by HCFA for the product
category. Used to calculate the demonstration fee
schedule from each winning supplier’s bids.
The Medicare approved charge for a procedure. Medicare
typically pays 80 percent of the allowed charge. The
beneficiary is responsible for the remaining 20 percent.
Bid Evaluation Panel
Person receiving Medicare benefits.
The percentage of covered medical expenses for which the
beneficiary is responsible. For Medicare Part 8, the
copayment equals 20 percent of the maximum Medicare
allowance.
The amount for which a supplier offers to provide a
demonstration item to Medicare and designated
beneficiaries during the demonstration cycle.
A meeting sponsored by HCFA and designed to provide
potential bidders technical details of the demonstration and
the bidding forms. HCFA will respond to questions about
the procurement.
The period of time ranging from the release of the Request
For Bids through selection of the Demonstration Suppliers.
Group of individuals selected by HCFA to evaluate and
score, by assigning points, bidders’ proposals. The panel is
made up of experienced Palmetto CBA DMEPOS staff and
subcontractors.
G-l

Brevard County:
Brokering Arrangement:
Commerce Business Daily:
Comparison County:
Competitive Bidding:
Competitive Environment:
Competitive Range:
Composite Bid Price:
The external comparison group t:) Polk County. It was
chosen because It matches Polk County on several key
characteristics Including locatron in Flortda, a single-
county Metropolttan Statistical Area, Medicare population,
number of DME suppliers, and managed care penetration.
It will be used to identify what changes are due to the
demonstration project and what changes may be general
trends
The practice by nondemonstration suppliers of referring
requests for demonstration products to a demonstration
supplier of their choice.
A daily list of U.S. government procurement invitations,
contract awards, subcontracting leads, sales of surplus
property, and foreign business opportunities.
Brevard County was chosen as the external comparison
county to Polk County. It was chosen because it matches
Polk County on several key characteristics including
location in Florida, a single-county Metropolitan Statistical
Area, Medicare population, number of DME suppliers, and
managed care penetration. It will be used to identify what
changes are due to the demonstrattcn project and what
changes may be general trends.
A process by which individuals or organizations contend
against each other to win a contract by offering the best
value to the customer. The prices and terms offered are
compared and a subset of bidders selected to supply items
and services. It allows the customer to take advantage of
marketplace dynamics that are likely to lower prices.
Factors affecting competition between suppliers.
Phrase used to describe the subset of suppliers whcse
composite bid prices equal or are less than the cutoff
composite bid price for the product category.
The sum of the supplier’s weighted bid prices for each
demonstration product in the product category.
G-2

Consolidated Billing:
Cutoff Composite Bid Price:
Cutoff Supplier:
Debriefing:
Demonstration Cycle:
Demonstration Procedure:
Demonstration Site:
Demonstration Supplier:
Designated Beneficiaries:
DMEPOS:
DMERC:
Estimated Volume:
Exempt Status:
FAMED:
A comprehensive txlling requirement, similar to the one
that has been in eiiect ior inpatient hospital services for
more than a decade, under which a skilled nursing facility
is responsible for billing Medlcare for virtually all of the
services that its residents receive.
The dollar amount that suppliers’ composite bid prices
must be equal to or less than for ihelr bids to be in the
competitive range.
The bidder whose composite bid price equals the cutoff
composite bid price for the product category.
A meeting sponsored by HCFA and designed to notify
bidders of the bid evaluation results.
Preceded by a bidding round, a demonstration cycle is the
period of time ranging from the establishment of
demonstration prices until the next demonstration cycle
begins or the current demonstration cycle ends.
A specific DMEPOS item selected for the demonstration.
Each demonstration procedure is identified by its HCPCS
code.
The geographic region selected in which to conduct the
demonstration. It may consist of all or part of a
Metropolitan Statistical Area.
A bidding supplier chosen by HCFA to provide one or more
product categories to designated beneficiaries.
Specific Medicare Part 6 beneficiaries who are included in
the demonstration because they permanently reside in the
demonstration site.
Durable Medical Equipment, Prosthetics, Orthotics, and
Supplies.
Durable Medical Equipment Regional Carrier.
The quantity of a demonstration product that Medicare paid
for on behalf of beneficiaries during a given year or quarter.
Suppliers of Dh4EPOS who are exempt from the
demonstration, such as physicians.
Florida Association of Medical Equipment Dealers
G-3

FDA: Food and Drug Admlnlstratlon
Federal Acquisition Regulation Created to estsblrsh unrform polrcres and procedures ior
System: certain government acqursrtion contracts and developed in
accordance with the requirements of the Office of Federal
Procurement Policy Act of 1974, as amended in 1985.
Fee Schedule: A list of maximum payments for specified Medicare
services based on the relative value of the procedure.
Financial variables for suppliers that are used to determine
the financial viability of bidding suppliers.
General Accounting Office.
Health Care Financing Admrnistration
Financial Ratios:
GAO:
HCFA:
HCPCS:
Herfindahl Index:
HMO:
Medicare Reimbursement:
Medicare+Choice:
HCFA Common Procedure Coding System
A measure of industry concentratron. It equals the sum of
the squared market shares for each firm in the market.
Health Maintenance Organization.
Eighty percent of the maximum Medicare allowance.
A broader array of health plans in addition to original
Medicare and health maintenance organizations that
includes preferred provider organizations, provider
sponsored organizations, private fee-for-service plans, and
a medical savings account.
Metropolitan Statistical Area: A statistical standard developed by the U.S. Census Bureau
for use by federal agencies in the production, analysis, and
publication of data on geographic areas dominated by a
city.
National Claims History (NCH): Medicare claims.
Nondemonstration Supplier: A supplier that is not eligible for Medicare reimbursement
when providing demonstration products to designated
beneficiaries. Nondemonstration Suppliers may provide
certain demonstration products for designated-beneficiary
residents in skilled nursing facilities but will only be
reimbursed according to demonstration prices.
NSC: National Supplier Clearinghouse.
G-4
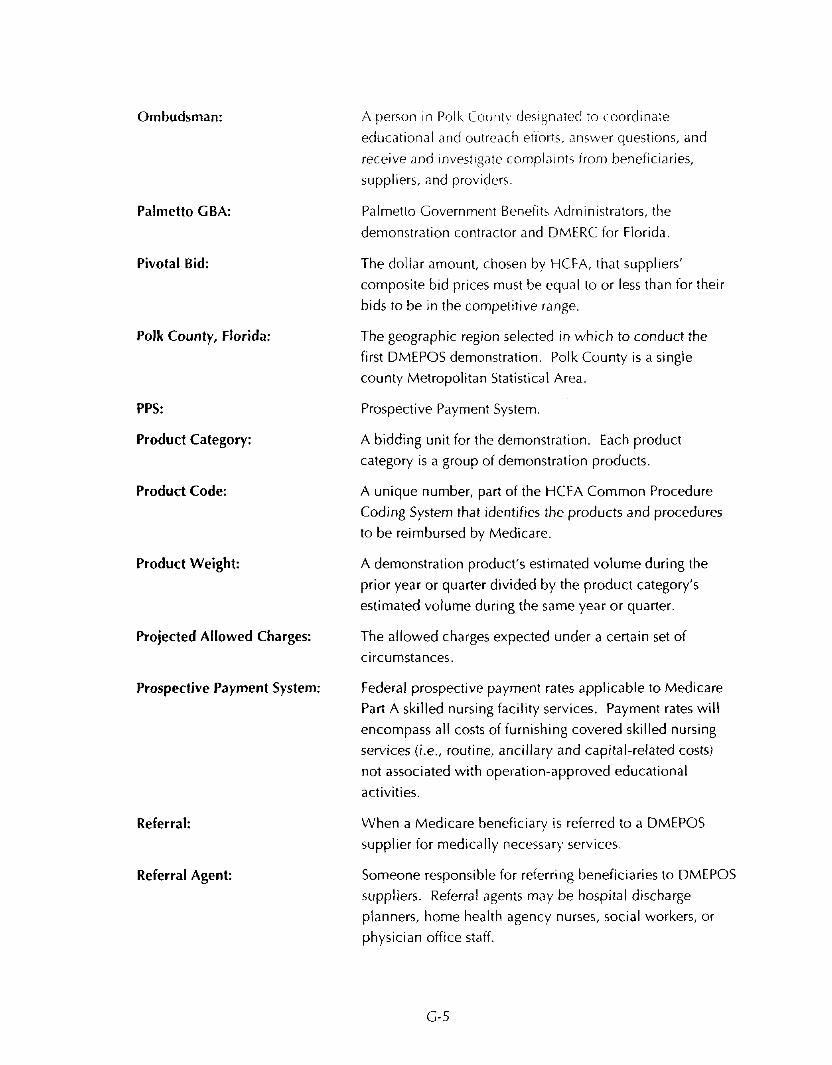
Ombudsman:
Palmetto GBA:
Pivotal Bid:
Polk County, Florida:
PPS:
Product Category:
Product Code:
Product Weight:
A person In Polk County desrgn”ted to coordinate
educational and outreach eftorts, .Inswer questions, and
receive and Investigate complarnts from beneficiaries,
suppliers, and providers.
Palmetto Government Benefits Administrators, the
demonstration contractor and DMERC for Florida.
The dollar amount, chosen by HCFA, that suppliers’
composite bid prices must be equal to or less than for their
bids to be in the competitive range.
The geographic region selected in which to conduct the
first DMEPOS demonstration. Polk County is a single
county Metropolitan Statistical Area.
Prospective Payment System.
A bidding unit for the demonstration. Each product
category is a group of demonstration products.
A unique number, part of the HCFA Common Procedure
Coding System that identifies the products and procedures
to be reimbursed by Medicare.
A demonstration product’s estimated volume during the
prior year or quarter divided by the product category’s
estimated volume during the same year or quarter.
Projected Allowed Charges: The allowed charges expected under a certain set of
circumstances.
Prospective Payment System: Federal prospective payment rates applicable to Medicare
Part A skilled nursing facility services. Payment rates will
encompass all costs of furnishing covered skilled nursing
services (i.e., routine, ancillary and capital-related costs)
not associated with operation-approved educational
activities.
Referral:
Referral Agent:
When a Medicare beneficiary is referred to a DMEPOS
supplier for medically necessary services.
Someone responsible for referring beneficiaries to DMEPOS
suppliers. Referral agents may be hospital discharge
planners, home health agency nurses, social workers, or
physician office staff.
G-5
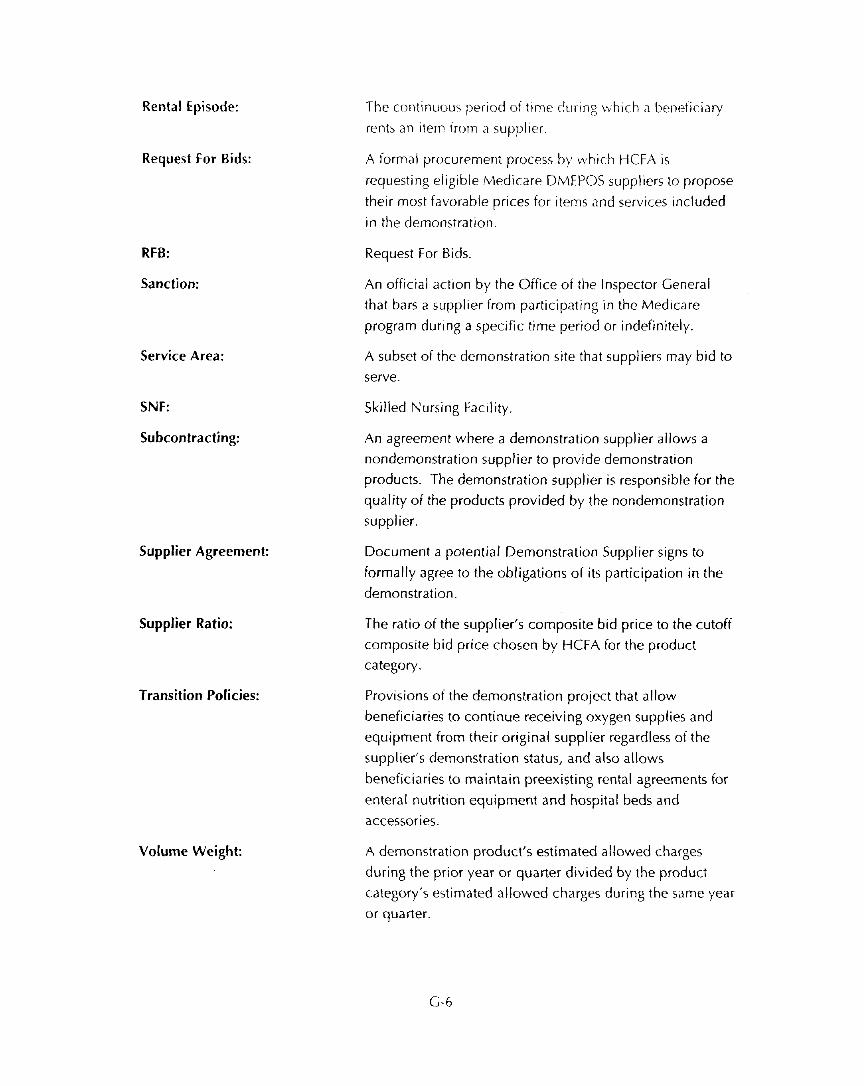
Rental Episode:
Request For Bids:
RFB:
Sanction:
Service Area:
SNF:
Subcontracting:
Supplier Agreement:
Supplier Ratio:
Transition Policies:
Volume Weight:
The continuou? period oi ttme durtng which a beneficiary
rents an item irom ;I suppller.
A iormal procurement process by which HCFA is
requesting eligible Medicare DMEPOS suppliers to propose
their most favorable prices for items and services included
in the demonstration.
Request For Bids
An official action by the Office of the Inspector General
that bars a supplier from participating in the Medicare
program during a specific time period or indefinitely.
A subset of the demonstration site that suppliers may bid to
serve.
Skilled Nursing Facility.
An agreement where a demonstration supplier allows a
nondemonstration supplier to provide demonstration
products. The demonstration supplier is responsible for the
quality of the products provided by the nondemonstration
supplier.
Document a potential Demonstration Supplier signs to
formally agree to the obligations of its participation in the
demonstration.
The ratio of the supplier’s composite bid price to the cutoff
composite bid price chosen by HCFA for the product
category.
Provisions of the demonstration project that allow
beneficiaries to continue receiving oxygen supplies and
equipment from their original supplier regardless of the
supplier’s demonstration status, and also allows
beneficiaries to maintain preexisting rental agreements for
enteral nutrition equipment and hospital beds and
accessories.
A demonstration product’s estimated allowed charges
during the prior year or quarter divided by the product
category’s estimated allowed charges during the same year
or quarter.
G-6

Weighted Bid Price: The suppller’s bItI price for a demonstration product
multiplied by the product’s welght.
G-7


REFERENCES
FAMED et al. v. Kenneth Apfel et al. 194 F.3d 1227 (U.S. Court of Appeals, Eleventh Circuit,
1999).
Integrated Health Servrces. 2000. “Integrated Health Services Form 1 O-K 1999 Annual Report to
the Securities Exchange Commission.” <http://www,secgovlArchives/edgarldata/785814/
0001005150-OO-000524.txt>.
Lincare Holdings, Inc. 2000. “Lincare Holdings, Inc. Form 1 O-K405 1999 Annual Report to the
U.S. Securities Exchange Commission.” <http://www.sec.govlArchives/edgar/datal882235/
0000950144-00-003837.txt>.
Lincare Holdings, inc. 1999. “Lincare Holdings, Inc. Form 1 O-K405 1998 Annual Report to the
US. Securities Exchange Commission.” <http:llwww.sec.govlArchives/edgar/data/
882235/0000950144-99-003402.txt>.
Sun Healthcare Group. 1999. “Sun Healthcare Group Files Voluntary Petition for Bankruptcy
Protection.” <http://www.sunh.com/pages/press-releases/pr991014.htm>.
The Lakeland Ledger. 2000. “Bankruptcies.” <http:Nwww.theledger.com/business/business/
28bank.htm>. As obtained on April 28, 2000.
Turner, C.F., B.H. Forsyth, S.C. Weeless, M.B. Whitt, D.K. Pate, T.K. Smith, and FJ. Mierzwa.
1994. “Field Test of Medicare Beneficiary Health Status Registry: Major Findings and
Recommendations.” Research Triangle Park, NC: Research Triangle Institute.
U.S. Congress, House of Representatives. 1997. “Balanced Budget Act of 1997.” H.R. 2015,
105th Congress, 1 st Session.
R-l

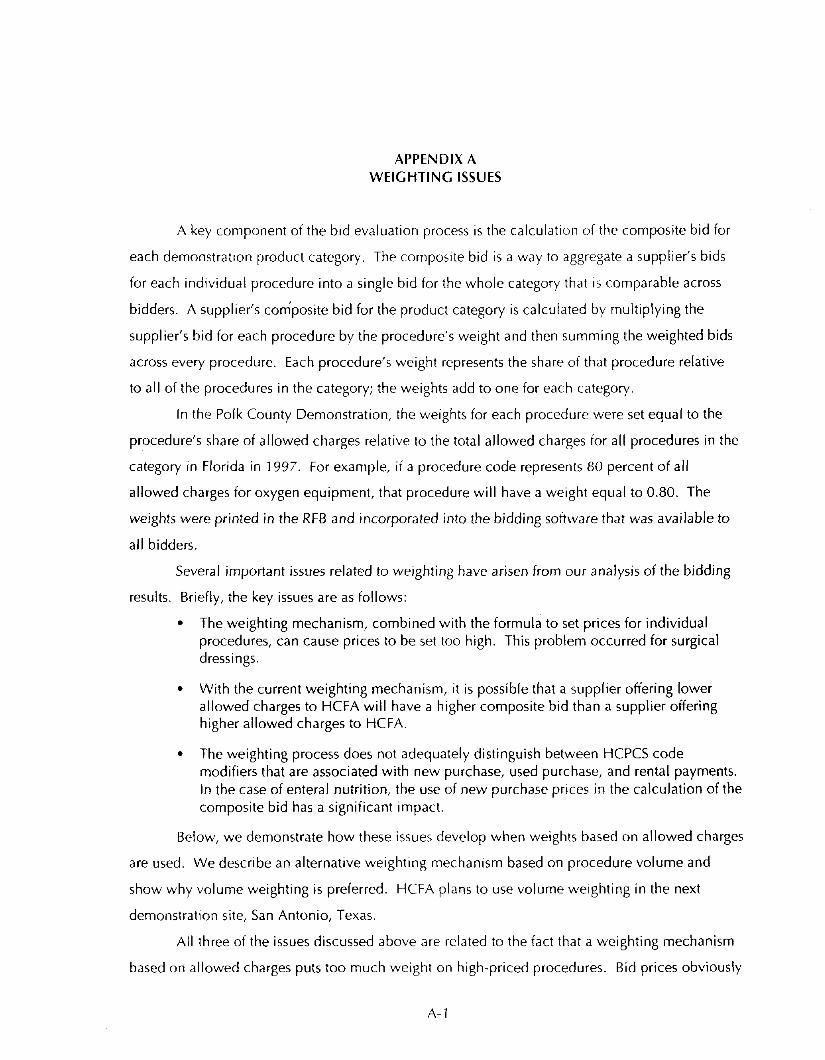
APPENDIX A WEIGHTING ISSUES
A key component of the bid evaluation process is the calculation of the composite bid for
each demonstratron product category. The composrte bid is a way to aggregate a supplier’s bids
for each individual procedure into a single bid for the whole category that is comparable across
bidders. A supplier’s composite bid for the product category is calculated by multiplying the
supplier’s bid for each procedure by the procedure’s weight and then summing the weighted bids
across every procedure. Each procedure’s weight represents the share of that procedure relative
to all of the procedures in the category; the weights add to one for each category.
In the Polk County Demonstration, the weights for each procedure were set equal to the
procedure’s share of allowed charges relative to the total allowed charges for all procedures in the
category in Florida in 1997. For example, if a procedure code represents 80 percent of all
allowed charges for oxygen equipment, that procedure will have a weight equal to 0.80. The
weights were printed in the RFB and incorporated into the bidding software that was available to
all bidders.
Several important issues related to weighting have arisen from our analysis of the bidding
results. Briefly, the key issues are as follows:
l The weighting mechanism, combined with the formula to set prices for individual procedures, can cause prices to be set too high. This problem occurred for surgical dressings.
l With the current weighting mechanism, it is possible that a supplier offering lower allowed charges to HCFA will have a higher composite bid than a supplier offering higher allowed charges to HCFA.
l The weighting process does not adequately distinguish between HCPCS code modifiers that are associated with new purchase, used purchase, and rental payments. In the case of enteral nutrition, the use of new purchase prices in the calculation of the composite bid has a significant impact.
Below, we demonstrate how these issues develop when weights based on allowed charges
are used. We describe an alternative weighting mechanism based on procedure volume and
show why volume weighting is preferred. HCFA plans to use volume weighting in the next
demonstratron site, San Antonio, Texas.
All three of the issues discussed above are related to the fact that a weighting mechanism
based on allowed charges puts too much weight on high-priced procedures. Bid prices obviously
A-l

must enter the calculatron oi the composrte httf. and, as such, higher bds should lead to a higher
composite bid. However, the problem wtth the weights based on allowed charges is that the
price effect IS essentially squared in the calculation oi the composite bid, and squaring a large
price has a disproportionately large impact on higher prices.
Table A-l provides a sample example of the werghting process for a product category
where there are only two procedures. Procedure A has a fee of $1 .OO and a quantity of 9.
Procedure B has a fee of $9.00 and a quantity of 1, Allowed charges are $9.00 for both
procedures. The weights used in Polk County, based on each procedure’s share of allowed
charges, would be 0.5 for each procedure. In the final column of the table, we present an
alternative set of weights, labeled volume weights, which are based on each procedure’s share of
total volume in the demonstration area. For the example, the volume weights are 0.9 for
Procedure A and 0.1 for Procedure B.
Table A-l. Alternative Weights
Procedure Fee Quantity
Polk County Allowed Charge Weight Volume Weight
A $1.00 9 9.00 0.50 0.90
B $9.00 1 9.00 0.50 0.10
Total 10 la.00 1.00 1.00
Table A-2 present bids from three suppliers. Supplier 1 bids $0.80 for Procedure A and
$3.00 for Procedure B. Supplier 2 bids $1 .OO for Procedure A and $8.00 for Procedure B.
Supplier 3 simply bids the existing fee schedule: $1 .OO for Procedure A and $9.00 for
Procedure B.
The composite bid for a supplier is calculated by multiplying the weight for each
procedure by the brd for the procedure and summing across all procedures. For example, the
composite bid for Supplier 1 using the Polk County weights = (0.5 x $0.80) + (0.5 x $3.00) =
$1.90. The composite bids based on the Polk County wetghts appear in Table A-2, along with
composite bids based on the volume weights. The table also shows the projected allowed
charges that would arise if the quantity of each procedure remains constant and is purchased at
fees equal to the supplier’s bids.
A-2
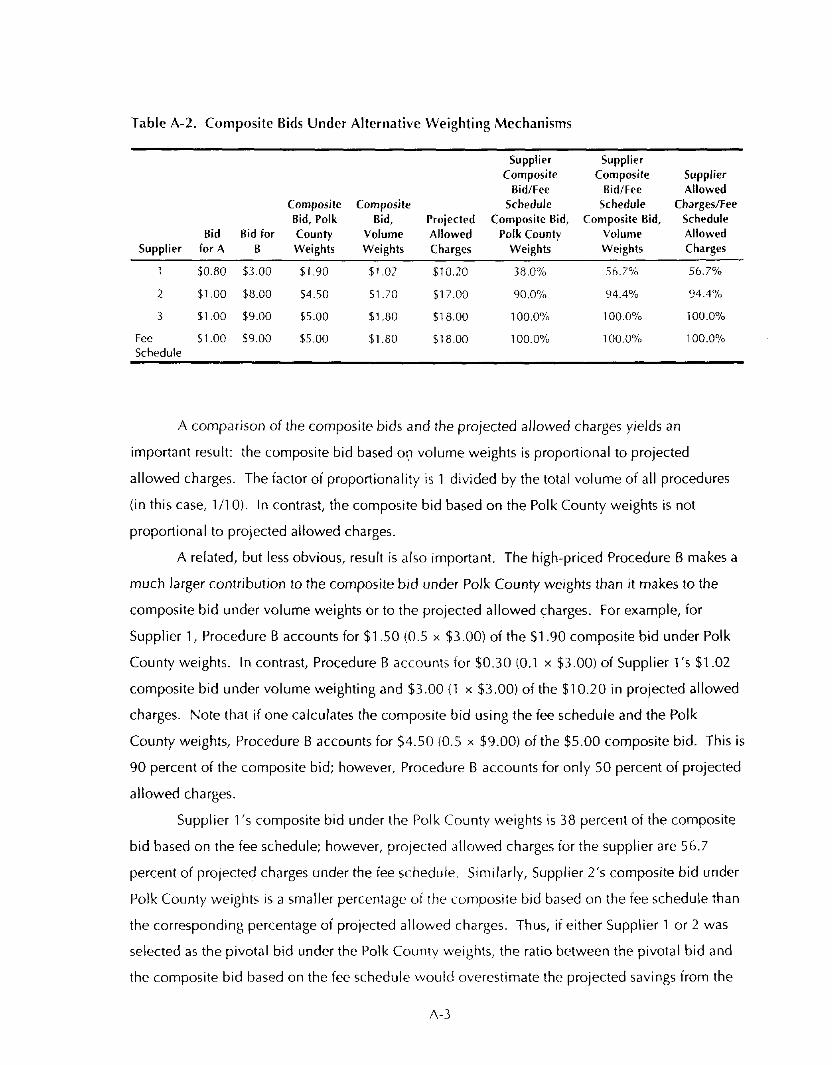
Table A-2. Composite Bids Under Alternative Weighting Mechanisms
Supplier
Composite
Bid/Fee
Composite Composite Schedule
Bid, Polk Bid, Projected Composite Bid,
Bid Bid for County Volume Allowed Polk County
Supplier forA B Weights Weights Charges Weights
7 $0.80 $3.00 $1.90 $1.02 $10.20 38.0%
Supplier
Composite
Bid/Fee
Schedule
Composite Bid,
Volume
Weights
56.7%
Supplier
Allowed
Charges/Fee
Schedule
Allowed
Charges
56.7%
2 $1.00 $8.00 $4.50 $1.70 $17.00 90.0% 94.4% 94.4%
3 $1.00 $9.00 $5.00 $1.80 $18.00 100.0% 100.0% 100.0%
FW $1 .oo $9.00 $5.00 $1.80 918.00 100.0% 100.0% 100.0%
Schedule
A comparison of the composite bids and the projected allowed charges yields an
important result: the composite bid based on volume weights is proportional to projected
allowed charges. The factor of proportionality is 1 divided by the total volume of all procedures
(in this case, l/l 0). In contrast, the composite bid based on the Polk County weights is not
proportional to projected allowed charges.
A related, but less obvious, result is also important. The high-priced Procedure 6 makes a
much larger contribution to the composite bid under Polk County weights than it makes to the
composite bid under volume weights or to the projected allowed charges. For example, for
Supplier 1, Procedure B accounts for $1.50 (0.5 x $3.00) of the $1.90 composite bid under Polk
County weights. In contrast, Procedure B accounts for $0.30 (0.1 x $3.00) of Supplier l’s $1.02
composite bid under volume weighting and $3.00 (1 x $3.00) of the $10.20 in projected allowed
charges. Note that if one calculates the composite bid using the fee schedule and the Polk
County weights, Procedure B accounts for $4.50 (0.5 x $9.00) of the $5.00 composite bid. This is
90 percent of the composite bid; however, Procedure B accounts for only 50 percent of projected
allowed charges.
Supplier l’s composite bid under the Polk County weights is 38 percent of the composite
bid based on the fee schedule; however, projected allowed charges for the supplier are 56.7
percent of projected charges under the fee schedule. Similarly, Supplier 2’s composite bid under
Polk County weights is a smaller percentage of the composite bid based on the fee schedule than
the corresponding percentage of projected allowed charges. Thus, if either Supplier 1 or 2 was
selected as the pivotal bid under the Polk County werghts, the ratio between the pivotal bid and
the composite bid based on the fee schedule would overestimate the projected savings from the
A-3

demonstration. This is not a general result, though it accurately portray<, what happened in the
case of enteral nutrttion. With an appropriate selection oi bid prices, we could have created a bid
that actually underestimated the projected savings In allowed charges. Alternatively, if all bids
were proportionately lower than the fee schedule (i.e., the bid for each procedure was equal to
80 percent of the current fee), the ratlo between the composite bids would be equal to the
relationship between proJected allowed charges. In the example, the relatively low bid for the
high-priced procedure leads to the overestimate because the high-priced procedure accounts for a
disproportionately large share of the composite bid.
In contrast to the ratio based on Polk County weights, if volume weights are used, the ratio
between each supplier’s composite bid and the composite bid based on the fee schedule is
exactly equal to the corresponding ratio for projected allowed charges. This is a general result
that arises from the proportionality between the volume-weighted composite bid and projected
allowed charges.
The example suggests one reason why our estimates of the cost savings for the
demonstration for enteral nutrition and surgical dressings are not the same as the percentage
difference between the composite price based on the demonstration fee schedule and the
composite price based on the Florida fee schedule. There is a second reason: the process used to
set prices for individual procedures is distorted by the weighting mechanism used in Polk County.
To show this, we briefly review how prices are set for individual procedures. This process is
designed to ensure that all winners receive the same set of prices and to ensure that winning
bidders will receive at least as much as they bid (winners would have a legitimate complaint if
prices were, on average, less than their bids). The process involves four steps:
1. The pivotal bid separating winners and losers is selected
The composite bids are first arrayed from lowest to highest. Once the pivotal bid has been selected, all bidders at or below the pivotal bid are selected as winners (for this example, we will assume that all bidders meet quality requirements).
2. The adjustment factor is calculated
For each winning bid, an adjustment factor is calculated by dividing the pivotal bid by that firm’s composite bid. In our example, suppose that Supplier 2 is selected as the pivotal bid. The adjustment factor for Supplier 1 (based on Polk County weights) then equals 2.37 ($4.50/$1.90), while the adjustment factor for Supplier 2 equals 1 ($4.50/$4.50).
3. The supplier’s bids for individual procedures are multiplied by the adjustment factor.
A-4

4. The adjusted bids for each procedure are averaged across suptjlrcrs This yields the demonstration price.
Table A-3 shows the results for the example usrng the Polk County werghts. The
demonstration price for Procedure A is $1.44, while the demonstration price for Procedure B is
$7.56. One unexpected result is immediately apparent. The demonstratton price for Procedure A
is actually higher than both winning firms bid. In this case, it is also higher than the original fee
schedule price. By itself, this result is not necessarily undesirable. For individual procedures,
even an appropriate adjustment process could result in higher fees than any winning supplier bid
(see below for the case of volume weights). But it is surprising that the demonstration price for
Procedure A is so much higher than either supplier bid.
Table A-3. Adjusted Bids and Demonstration Prices, Using Polk County Weights
Adjusted Projected Bid for Bid for Adjustment Adjusted Adjusted Composite Allowed
Supplier A B Factor Bid for A Bid for B Bid Charges
1 $0.80 $3.00 2.37 $1.89 $7.11 $4.50 $24.12
2 $1.00 $8.00 1.00 $1.00 $8.00 $4.50 $17.00
3 $1.00 $9.00 non-winner
Demonstration $1.44 $7.56 $4.50 $20.52 Price
A second unexpected result is less apparent, but definitely undesirable. Projected allowed
charges under the demonstration prices are $20.52, more than the $10.20 and $17.00 that were
calculated for Supplier 1 and 2 on the basis of the unadjusted bids in Table A-2. Somehow, the
adjustment process actually leads to higher projected allowed charges than either winning
supplier actually proposed. Moreover, projected allowed charges with the demonstration prices
are also higher than under the original fee schedule ($18.00 from Table A-2).
The explanation for these results is somewhat complicated but ultimately goes back to the
Polk County weighting mechanism. As we showed, this weighting mechanism puts
disproportionate weight on procedures that are Initially high priced. Therefore, Supplier 1, which
bid especially low on a high-priced procedure, had a composite bid that was much lower than it
should have been, based on its projected reduction In allowed charges. In turn, Supplier l’s low
composite bid produced a disproportionately high adjustment factor. The high adjustment factor
inflated Supplier l’s prices too much, thereby lifting the price of Procedure A much higher than
either firm originally bid. Finally, because Procedure A has a relatively high volume, total
A-5

prolected allowed charges actualI!, rise higher than the prqected amount based on each
supplier’s original bid. Indeed, projected allowed charges rise ei,en hl,qher than they would have
been under the origlnal fee schedule.
The unexpected resulrs In Table A-3 are by no means guaranteed by the Polk County
weighting mechanism. The example was carefully chosen to produce these results. But the
example accurately portrays what happened in the case of surgical dressings. For surgical
dressings, all of the winning bidders submitted bids that produced projected allowed charges that
were less than those under the existing fee schedule. However, because the adjustment factor
was distorted, 56 out of 62 prices rose relative to the existing fee schedule, and projected allowed
charges rose relative to the existing fee schedule. in contrast, we estimated that projected
allowed charges would have been 15 percent lower than the existing fee schedule if volume
weighting had been used instead of the Polk County weights. This estimate assumes that bidders
would submit the same bids under volume weighting as they submitted with the actual Polk
County weights.
Table A-4 reproduces Table A-3 but uses volume weights instead of the Polk County
weights. In this table, the adjustment factor for Supplier 1 is 1.67 ($1.70/$1.02), using the
composite bids under volume weights for Suppliers 1 and 2 from Table A-2, while the adjustment
factor for Supplier 2 is 1 .OO.
Table A-4. Adjusted Bids and Demonstration Prices, Using Volume Weights
Supplier
Adjusted Projected Bid for Bid for Adjustment Adjusted Adjusted Composite Allowed
A B Factor Bid for A Bid for B Bid Charges
1 $0.80 $3.00 1.67 $1.33 $5.01 $1.70 $17.00
2 $1.00 $8.00 1.00 $1.00 $8.00 $1.70 $17.00
3 $1 .oo $9.00 non-winner
Demonstration $1.17 $6.51 $1.70 $17.00 Price
Based on volume weighting, the demonstration price for Procedure A is $1 .17, while the
demonstration price for Procedure B is $6.51. Both of these prices are lower than the
demonstration prices under the Polk County weights. The volume-weighted price of Procedure A
IS still higher than either supplier bid and the exie+ ,,ing fee schedule. This may appear surprising at
first glance; however, because the demonstration price for Procedure B is below Supplier 2’s bid,
the dembnstration price for Procedure A must be higher than Supplier 2’s bid in order to ensure
A-6

that Supplter 2 recetves at least as much as the projected allowed charges that would arise from
its hid.
The improvement irom using volume weights Instead of the Polk County weights is seen
by looking at projected allowed charges under the two weighting mechamsms. Projected allowed
charges are lower under volume weighting. Moreover, the adjusted composite bid based on the
demonstration prices is exactly equal to the unadjusted composite bid for the pivotal bidder.
These results support the use of volume weighting.
Volume werghting has at least two potential drawbacks. However, we believe that both of
these drawbacks can be overcome. The first potential drawback is the need to carefully
distinguish procedure codes that can be provided as new or used purchases or monthly rental
payments. Separate weights could be set up for each modifier, based on the volume associated
with that modifier. Alternatively, the separate modifiers could be converted into a single volume
weight for the underlying HCPCS code using the current payment formula (i.e., one new purchase
claim equals 10 monthly rental payments, etc.), and then suppliers could bid on the most
common modifier used for that HCPCS code. Thus, it would appear that this potential drawback
can be easily overcome.
Second, volume weighting may be somewhat misleading to naive bidders who, focusing
only on the volume weights, may miss the fact that the contribution of an individual procedure to
the composite bid depends on both the volume weight and the bid for that procedure. As a result,
naive bidders might place all of their emphasis on high-volume, low-price procedures, and pay
less attention to higher priced, but low-volume procedures that may nevertheless offer
possibilities for improving the composite bid. Example 1 provides a case where a high-volume,
low-price procedure dominates the volume weights, but the low-volume procedure also has a
major impact on the composite bid due to its high price. Naive bidders might miss this nuance.
In contrast, weighting based on allowed charges has the advantage of combining the effects of
volume and the current fee schedule, although it does lead to the important issues discussed
earlier.
We believe that this potential drawback of volume weighting can be overcome by
educating bidders. HCFA can emphasize in the RF6 and the Bidders Conference that the
composite bid is determined by both the volume weight and the bid for each procedure. In
addition, the bidding sheet could present both the volume weight and the share of allowed
charges accounted for by each procedure. This presentation will help direct bidders’ attention to
the procedures that are likely to have the most effect on the composite bid. Still, the presentation
A-7
must make it clear that it IS the volume weights, not the chares of allo\& charges, that directly
enter the composite bid calculation.
As noted prevrously, HCFA has decided to use volume weighting at the second
demonstration site In San Antonio, Texas.
A.1 Surgical Dressings
The most surprising result reported in Table 2-2 is that projected demonstration allowed
charges are actually higher for surgical dressings than they would have been using the 1999 fee
schedule. This result raised the uncomfortable possibility that the wrong set of suppliers were
selected as winners in the demonstration, since a supplier bidding the 1999 fee schedule would
have had a higher composite bid than the composite based on the demonstration fee schedule
even though the supplier offered lower allowed charges.
To test whether this actually occurred, we calculated composite bids using volume
weighting using each supplier’s bid information. We found that volume weighting accurately
ranks bidders on the basis of projected allowed charges, and the resulting composite bids can be
directly compared to the composite rate based on the fee schedule. The same set of five winning
suppliers would have been selected if volume weighting had been used instead of allowed charge
weighting. In addition, volume weighting produces nearly the same ordering of suppliers as the
allowed charge weighting: The actual selection of winners was based on the fifth lowest bidder
under allowed charge weighting. This bidder also ranked fifth under volume weighting, and the
four lower bidders under allowed charge weighting were also lower under volume weighting.
Therefore, the same bidders would have been selected as winners if volume weighting had been
used and the same number of winners were selected. Moreover, each of the five lowest bidders
offered HCFA a good deal in the sense that projected allowed charges under each supplier’s bids
are lower than projected allowed charges based on the Florida fee schedule.
However, one unintended result does remain for surgical dressings. As noted above,
projected allowed charges under the demonstration fee schedule are actually higher than those
generated by the Florida fee schedule. At first blush, this result does not appear consistent with
the previous paragraph’s finding that projected allowed charges under each supplier’s bids are
lower than projected allowed charges based on the FlorIda fee schedule. The explanation for this
seeming contradiction arises from the way that the fees ior individual procedures are set. The fee
for an individual procedure equals the average of the adjusted bids for that procedure by winning
bidders. The adjustment factor for each winning suppller IS the ratio between the pivotal
composite bid and the supplier’s composite bid. With the appropriate (volume) weighting
A-8
mechanism, the adjustment factor guarantees that (1) all oi the firms’ adjusted composite bids will
be equal to the prvotal composrte bid, and (2) projected allowed charges will be equal under all
of the adjusted bids. Unfortunately, with allowed charge werghting, the composite bid is
distorted, and so is the adjustment factor. With allowed charge weighting, the adjustment factor
still guarantees that all of the firms’ composite bids are equal to the pivotal composite brd, but it is
no longer the case that projected allowed charges will be equal under all of the adjusted bids. In
the case of surgical dressings, some of the adjustment factors are too high (2.58, 1.33, 1.47, 1.12,
and 1, respectively) under the allowed charge weighting versus the appropriate adjustments based
on volume weighting (1.41, 1.09, 1.31, 1.02, and 1). With the overadjustment, prices for
individual procedures are set too high; the overall effect is to raise estimated allowed charges
higher than they would have been under the existing fee schedule.
If the correct adjustment factor had been applied, we estimate that the demonstration fee
schedule would have generated projected allowed charges that were about 15 percent lower than
those generated by the Florida fee schedule, whereas the actual demonstration fee schedule
generates projected allowed charges that are about 10 percent higher than those generated by the
Florida fee schedule. Suppliers appear to have benefitted from the Polk County weights.
A.2 Problems with Modifiers to the HCPCS Codes
In the home oxygen, hospital beds, and enteral nutrition product categories, payment for
some HCPCS codes depends on whether the claim represents a new purchase (procedure
modifier NU), used purchase (modifier UE), monthly rental (modifier RR), or servicing of
equipment that is not incorporated within the preceding modifiers (modifier MS). Under the
existing fee structure, the used purchase allowance equals 75 percent of the new purchase
allowance, the monthly rental allowance equals 10 percent of the new purchase allowance, and
the service charge equals 5 percent of the new purchase allowance. Total rental payments are
limited to the new purchase allowance. The demonstration’s RFB notes that a similar relationship
will hold in the demonstration.
The distribution of claims and allowed charges across modifiers was included in the RFB.
However, only one modifier per HCPCS code was included in Form B’s Bidding Sheets. Only
new purchase modifiers were included for enteral nutrition, while monthly rental rate modifiers
were included for home oxygen, and either new purchase or monthly rental rate modifiers were
included for hospital beds, depending on the HCPCS code. The single weight represents allowed
charges for all modifiers associated with the HCPCS code.
A-9

Because the new purchJsc price IS 10 times the monthly rental rat?, it makes a huge
difference whether the purchase price or rental rate IS included in the calculation of the
composite bid. This difference IS most clearly shown In the case of enteral nutrition. For two
procedures in this category (HCPCS code BYOOO, enteral nutrition infusion pump, without alarm,
and B9002, enteral nutrition infusion pump, with alarm) the bidding weights were explicitly
associated with purchases of new equipment. Rental agreements are most common and account
for most of the allowed charges for these procedures. As mentloned, the RFB weights are actually
based on allowed charges for new and used purchases, monthly rental payments, and servicing.
Multiplying these weights by the new purchase price in the composite bid calculation produces
an unintended and unfortunate result: the bids for these items have a disproportionately large
effect on the composite bid because the new purchase price IS 10 times the rental rate, which
accounts for most of the allowed charges for the procedure. Table A-S shows that the two
procedures, whose weights represent 7.3 percent of allowed charges, account for 91.8 percent of
the composite bid. In this case, the composite bid is almost entirely determined by the bids for
89000 and B9002.
Table A-5. Effects of 89000 and 89002 on Enteral Composite Bid, RFB Weights
Procedure Weight Bid
B9000 0.002774 695.62
89002 0.069952 793.65
All Others 0.927274 5.54
Weight * Bid
1.93
55.52
5.14
Share of Composite Bid
0.0308
0.8870
0.0822
Total 1 .oooooo 62.59 62.59 1 .oooo
To correct for this problem, we recommend that, in addition to using volume weights,
separate weights be used for each of the modifiers associated with enteral nutrition pumps. A
single bid could still be taken for the new purchase price; however, this price would be converted
to the corresponding used purchase and rental prices before multiplication by the weights takes
place.
Adopting the new weighting pattern would impact bid evaluation for enteral nutrition in
several ways. First, each supplier’s composite bid would change. Although the relative ordering
of suppliers could remain the same after the recalculation, it could also change. With a change in
ordering, the set of winning suppliers might also change, ii a supplier whose composite bid was
previously below the old pivotal bid now had a bid higher than the new pivotal bid. Finally, the
A-10

demonstratton prtces for individual procedures WOLIICI be likely to chan:<e. The change in
weighting would change both the supplier’s composrte brd and the prvotal hrd, meaning that the
adjustment factor that determines prices would also be likely to change.
In theory, applying separate weights for each of the modifiers assocrated with home
oxygen and hospital beds would also change the compostte bids in the;e categories. In practice,
however, the changes would be much smaller than the change in enteral nutrition. For home
oxygen, bidders were required to submit bids for the rental rates, and rental rates accounted for
the vast majortty of allowed charges, The same holds for hospital beds.
It is not possible to know whether any of the enteral nutrition bidders responded
strategically to the inclusion of purchase prices instead of rental rates for 69000 and 89002.
However, the top two firms in the allowed charge weighting and purchase price scenario that
ultimately drove winner selection also had the two lowest bids for B9000 and 89002. They each
submitted bids for B9000 that were less than half of the Florida fee schedule amount, and their
bids for 89002 were more than 40 percent below the Florida fee schedule amount. For B9000,
the two suppliers had bids that were much lower than other suppliers. However, there was a
much smaller gap between these suppliers’ bids and the bids of other suppliers for B9002;
because B9002 had a higher weight, this procedure had a larger impact on the composite price
and would have been a better target for strategic price reductions than B9000. One of the two
suppliers had a relatively high bid for 64150, a procedure that makes a disproportionately small
impact under allowed charge weighting, but has a very high weight under volume weighting;
bidding high on this procedure would be consistent with strategic behavior. On the other hand,
the other supplier’s bid for B4150 was in the middle of the bid distribution.
We have focused on enteral nutrition in this section for several reasons. First enteral
nutrition is unique among the five product categories in that using volume weighting produces a
significantly different bid ranking than allowed charge weighting. This result is not just due to the
use of bids for the purchase price for 89000 and B9002; differences in ranking between volume
weighting and allowed charge weighting persist even if rental rates are used instead of purchase
prices. The result appears to be tied to the fact that there are large differences in price between
the procedures included in the enteral nutrition product category. In particular, the most
common enteral procedure code, 841.50, accounts for 37 percent of the allowed charges and
over 70 percent of the volume in the product category, but has a relatively low untt price.
Because of the deficiencies in the allowed charge weighting mechanism, 841 SO accounts for a
woefully small percentage of the composite bid calculated with allowed charge weighting. When
the appropriate volume weighting is applied, 64150 accounts for a much larger share of the
A-l 1

resultrng composite bid. The varration of bids for Bll50 across suppliers 15 wade enough for this
to change the overall rankrng of suppliers.
A-12
APPENDIX B MEDICARE BENEFICIARY SATISFACTION WITH DURABLE
MEDICAL EQUIPMENT SUPPLIERS
B.l Introduction
Medicare’s Part B benefit provides coverage for durable medical equipment (DME) and .
prosthetics, orthotics, and supplies (POS). Part B covers a wide range of DME for use in the
home, including oxygen equipment and supplies, hospital beds, wheelchairs, walkers, and renal
dialysis machines. The coverage for POS, in both home and nursing home settings, includes
enteral nutrition therapy, urological supplies, surgical dressings, and devices such as hand braces
and artificial limbs. DMEPOS benefits are especrally important to sick and disabled Medicare
beneficiaries, allowing them to avoid institutionalization, live more mobile and independent lives,
and maintain their quality of life.
While DMEPOS are of indisputable importance to beneficiaries, the cost of these benefits
has attracted scrutiny from policy makers during recent years. As with other Part B benefits,
expenditures for DMEPOS have risen rapidly during recent years. Part B expenditures for
DMEPOS total more than $5 billion annually, with recent annual rates of increase topping
10 percent in 1996 and 1997. Although expenditures actually fell in 1998 because of reductions
in the fee schedule, future expenditures are projected to rise at a greater than 5 percent annual
rate during the next decade (Board of Trustees, Federal Hospital Insurance Trust Fund, 1999). In
addition, several studies suggest that Medicare pays more for DMEPOS than other purchasers pay
(GAO, 1997; DHHVOIG, 1996a, 1996b, 1996c, 1996d).
As a result of this scrutiny, Congress and the Health Care Financing Administration (HCFA)
have adopted initiatives to reduce DMEPOS fees. As part of the Balanced Budget Act of 1997
(BBA 97), Congress mandated substantial cuts in the Medicare fee schedule for oxygen equipment
and supplies, the largest single component of DMEPOS spending. Also as part of BBA 97,
Congress approved up to three HCFA demonstratron projects to use competitive bidding to set the
prrce of Medicare Part B services. HCFA implemented the DMEPOS Competitive Bidding
Demonstration in Polk County, Florida, with bids for five types of DMEPOS collected in March
1999 and new, lower fees taking effect in October 1999.
B-l

These initiatives raise an important questron: what impact, if any, WIII policy Initiatives
such as reductions in fees and the DMEPOS Competitive Bidding Demonstratron have on
beneficiaries’ satrsfaction with the quality of DMEPOS services they recerve! A necessary step in
answering this question is to have a baseline measure of beneficiary sattsfaction before an
initiative is implemented. This information can then be compared to beneficiary satisfaction after
implementation. Unfortunately, published information about beneficiary satisfaction is extremely
limited.
In this paper, we analyze Medicare beneficiary satisfaction with DMEPOS suppliers using.
data from a random survey of beneficiaries who use five types of DMEPOS in two Florida
counties. Ultimately, this baseline information will be used to evaluate whether Medicare’s
competitive bidding demonstration project for DMEPOS affects beneficiary satisfaction, access to
care, quality of equipment, and product selection. More generally, however, we believe that
these estimates represent current levels of beneficiary satisfaction with DMEPOS suppliers.
Our results indicate that Medicare beneficiaries who use DMEPOS are currently highly
satisfied with their suppliers. Levels of satisfaction are particularly high for oxygen users, but
satisfaction is also high among users of other DMEPOS. Satisfaction levels are significantly
related to the number of contacts with the supplier, time between order and delivery, and how
well the supplier trains beneficiaries on equipment use.
B.2 Methods
As part of a comprehensive evaluation of Medicare’s DMEPOS Competitive Bidding
Demonstration, baseline surveys of DMEPOS users in Polk and Brevard Counties in Florida were
conducted in the spring of 1999. Polk County is the first site for the competitive demonstration;
Brevard County, which is not included in the demonstration, was selected as a comparison site
for the evaluation because it closely resembles Polk County in several key characteristics. Both
counties are located in Florida, have similar numbers of Medicare beneficiaries, have few
beneficiaries enrolled in managed care, and comprise a single-county Metropolitan Statistical
Area. The baseline surveys entered the field 7 months prior to implementing the new
demonstratron fee schedule in Polk County, which began on October 1, 1999; thus, the baseline
results reported here are unlikely to have been affected by the demonstration. Follow-up surveys
in the two countres are scheduled to be conducted 9 months after implementing the
demonstration fee schedule; these results will be compared to the baseline surveys to evaluate the
impact of the demonstration in Polk County.
B-2

Separate survey questionnaires were developed for beneficiaries using home oxygen
equipment and beneficiaries using other types of DMEPOS covered 111 the demonstration (hospital
beds, urological equipment, surgical dressings, and enteral nutrition). An oxygen-specific
questionnaire was developed because home oxygen accounts for the majority of DMEPOS use
and expenditures. Beneficiaries using both home oxygen and other equipment included in the
demonstration received the oxygen survey. To facilitate pooling of the data for evaluation
purposes, many of the questions on the oxygen and other equipment questionnaires were the
same. However, a few questions differed to allow for collection of information specific to oxygen’
and nonoxygen product lines. The surveys included questions about the following:
. medical equipment use,
l quality of service,
. satisfaction with service/equipment,
. access to service,
l health status, and
. respondent characteristics.
More specifically, questions addressed various aspects of service and equipment, including but
not limited to reliability, length of time needed to fill orders or address problems, satisfaction with
overall service, and the frequency of repeat calls for the same problem. Questions concerning a
beneficiary’s level of education, income, and perceived health status were also included.
The data collection design was adapted from the approach used in the Medicare
Beneficiary Health Status Registry pilot study that achieved a response rate of 83 percent from
Medicare beneficiaries (Turner et al., 1994). The protocol included mailing questionnaires to all
members of the sampling frame, a second mailing to nonrespondents, and telephone follow-up
and interviews with remaining nonrespondents.
The samplrng frame for the baseline survey was composed of a list of Medicare recipients
(aged or disabled) with permanent addresses in Polk and Brevard Counties who submitted Part B
claims for home oxygen, hospital beds, urological supplies, surgical dressings, and enteral
nutrition from July through November 1998. The initial list was merged with death dates from the
Medicare Enrollment Database, and indivrduals who were known to have died were deleted from
the sampling frame prior to sample selection. Initial plans called for random samples of 800
oxygen users In Polk County, 800 nonoxygen users in Polk County, 800 oxygen users in Brevard
County, and 800 nonoxygen users in Brevard County to be selected for surveyrng. However,
there were fewer than 800 nonoxygen users rn both Polk and Brevard County, so all nonoxygen
B-3

users were included tn the sample. For oxygen users, a random sample oi 800 beneficiaries from
Polk County was drawn; the sample for the comparison county was then drawn with the objective
of matching the sample drawn from Polk County.
Surveys were mailed to 1,600 oxygen users and 1,295 users of other medical equipment
and supplies, Forty-eight individuals were Ineligible for the survey because they lived outside the
study counties, and 195 individuals in the sample were deceased. A total of 1,953 individuals
responded, for an overall response rate, after excluding ineligibles and deceased, of 74 percent.
The response rate for the oxygen survey was 82 percent, while the response rate for the other
DMEPOS survey was 63 percent. The h&her response rates for oxygen may be because
beneficiaries spend more money and receive more service on oxygen equipment than on other
supplies; thus, they were more interested in the oxygen survey.
In the next section, we present descriptive statistics for patient satisfaction and factors
related to satisfaction. In addition, we estimate an ordered logit model where patient satisfaction
with their supplier is the dependent variable, and patient demographics and supplier factors are
explanatory variables.
B.3 Results
6.3.1 User Demographics
Table B-1 shows the demographics for respondents to the two surveys; the average age is
over 70 years old, and consistent with this age, more respondents are female than male. Not
surprisingly, the surveys reveal a high degree of morbidity. Respondents were asked to rate their
overall health on a scale from 1 to 5, with 1 signifying excellent and 5 stgnifying poor.
Approximately one-third of respondents to each survey rated their overall health as poor, and
75 percent ranked their health as either fair or poor. The majority of respondents reported living
with a spouse or other relative; however, 23 percent of oxygen users and I 2 percent of other
DMEPOS users reported living alone. Additionally, 4 percent of oxygen users and 18 percent of
other DMEPOS users reported living in a nursing home or assisted livtng facility. Survey results
also reveal that over three-quarters of oxygen users responded to the survey themselves; in
contrast, proxy responses were very common (61 percent) for other DMEPOS users.
B.3.2 Safisfaclion
Oxygen users are extremely satisfied with their suppliers, and other DMEPOS users are
also quite satisfted, although slightly less so. Each survey asks respondents to rate their supplier
on a scale from 0 to 10, wrth 10 being the best. Sixty-seven percent of oxygen users and
B-4
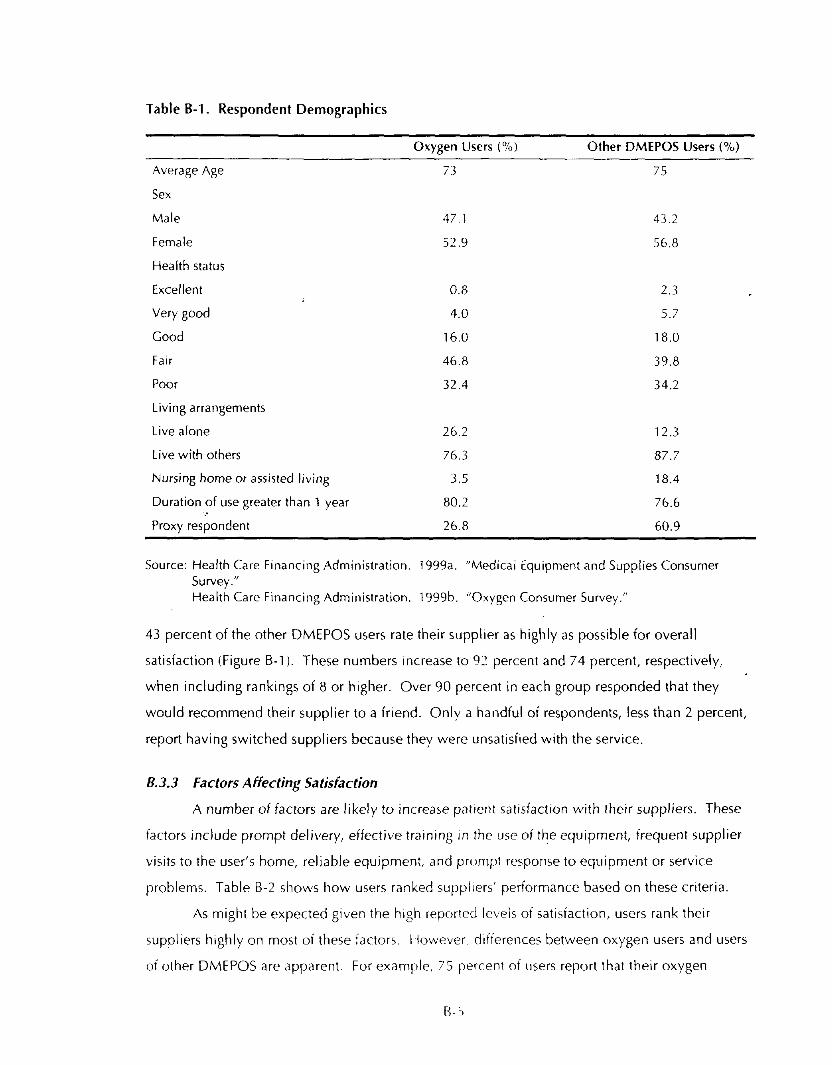
Table B-l. Respondent Demographics
Oxygen Users (%I Other DMEPOS Users (%)
Average Age
Sex
Male
Female
Health status
Excellent
Very good
Good
Fair
Poor
Living arrangements
Live alone
Live with others
Nursing home or assisted living
Duration of use greater than 1 year
Proxv resoondent
73
47.1
52.9
0.8 2.3
4.0 5.7
16.0 18.0
46.8 39.8
32.4 34.2
26.2 12.3
76.3 87.7
3.5 18.4
80.2 76.6
26.8 60.9
75
43.2
56.8
Source: Health Care Financing Administration. 1999a. “Medicai Equipment and Supplies Consumer Survey.” Health Care Financing Administration. 1999b. “Oxygen Consumer Survey.”
43 percent of the other DMEPOS users rate their supplier as highly as possible for overall
satisfaction (Figure B-l). These numbers increase to 91 percent and 74 percent, respectively,
when including rankings of 8 or higher. Over 90 percent in each group responded that they
would recommend their supplier to a friend. Only a handful of respondents, less than 2 percent,
report having switched suppliers because they were unsatisfied with the service.
8.3.3 Factors Affecting Satisfaction
A number of factors are likely to increase patient satisfaction with their suppliers. These
factors include prompt delivery, effective tralnlng In the use of the equipment, frequent supplier
visits to the user’s home, reliable equipment, and prompt response to equipment or service
problems. Table B-2 shows how users ranked suppliers’ performance based on these criteria.
As might be expected given the high reported levels of satisfaction, users rank their
suppliers highly on most of these factors. However, dlffercnces between oxygen users and users
of other DMEPOS are apparent. For example, 75 percent of users report that their oxygen
R-i

0 1 Worst Possible
Supplier
2 3 4 5 6 7 8 9 10
Satistaction Rating Best Possible
Supplier
m Oxygen
Figure B-l. Respondent Satisfaction Ratings
Source: Health Care Financing Administration. 1999a. “Medical Equipment and Supplies Consumer Survey.” Health Care Financing Administration. 1999b. “Oxygen Consumer Survey.”
equipment was delivered on the same day that it was ordered, and another 22 percent received
their equipment between 1 and 2 days after ordering. A much smaller percentage of other
DMEPOS users (45 percent) reported that their equipment was delivered on the same day it was
ordered, although another 37 percent stated that they received it between 1 and 2 days after
ordering. Unlike oxygen therapy where nearly everyone received training, only 74 percent of
other DMEPOS users reported being trarned to use the equipment. However, of the other
DMEPOS users who received training. 75 percent rated their training as either excellent or very
good, about the same percentage reported for oxygen users. Oxygen users and other DMEPOS
users also differed on the frc quency of supplier visits. Among oxygen users, 57 percent report
having had an employee come to the house at least once per month to either deliver or check
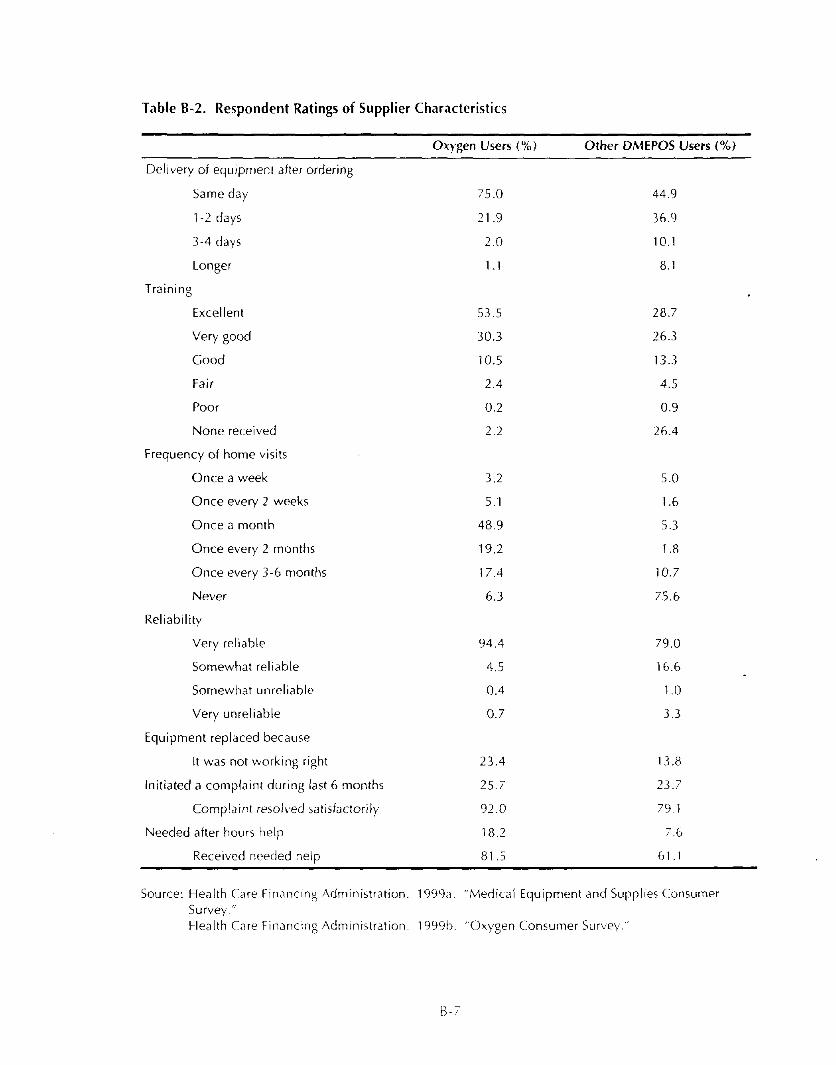
Table B-2. Respondent Ratings of Supplier Characteristics
Oxygen Users (%) Other DMEPOS Users (%)
Delivery of equrpment after ordering
Same day
l-2 days
3-4 days
Longer
Training
Excellent
Very good
Good
Fair
Poor
None received
Frequency of home visits
Once a week
Once every 2 weeks
Once a month
Once every 2 months
Once every 3-6 months
Never
Reliability
Very reliable
SomewJhat reliable
Somewhat unreliable
Very unreliable
Equipment replaced because
It was not working right
Initiated a complaint during last 6 months
Complaint resolved satisfactorily
Needed after hours help
Received needed help
75.0 44.9
21.9 36.9
2.0 10.1
1 .l 8.1
53.5 28.7
30.3 26.3
10.5 13.3
2.4 4.5
0.2 0.9
2.2 26.4
3.2 5.0
5.1 1.6
48.9 5.3
19.2 1.8
17.4 10.7
6.3 75.6
94.4
4.5
0.4
0.7
23.4 13.8
25.7 23.7
92.0 79.1
18.2 7.6
81 .j 61 .l
79.0
16.6
1 .o
3.3
Source: Health Care Flnanclng Administration. 1999a. “Medical Equipment and SuppIles Consumer Survey.” Health Care Financing Admlnlstration. 1555b. “Oxygen Consumer Sur\,ey ”

equrpment. In contrast, over 75 percent of the other DMEPOS users did not have a supplter visit
even once during the preceding 6 months.
These differences are most likely due to the nature of the products. Generally, suppliers
deliver oxygen equipment directly to the home and deliver additional supplies, particularly
portable oxygen tanks, on a routine basis. Because oxygen is potentially dangerous, careful
training is required, and suppliers generally check the equipment while making deliveries.
Delivery, training, and on-site servicing requirements vary for other DMEPOS equipment.
Hospital beds and enteral nutrition equipment are generally delivered by the supplier, while
surgical dressings, urologrcal supplies, and some enteral nutrition supplies, such as nutritional
formula, can be purchased at suppliers’ outlets or received by mail. Some DMEPOS equipment
(e.g., surgical dressings or urological supplies) does not require training, and other equipment
(e.g., enteral nutrition) is primarily used in nursing home settings, where it is operated by trained
staff. On-site servicing is also relatively uncommon for surgical dressings and urological supplies.
As noted, most oxygen users and users of other DME who received training report that the
training was excellent or very good. With a mail and telephone survey, it is not possible to
directly test whether this training is effective. As an indirect measure of training effectiveness, the
survey asked whether users are comfortable operating their equipment. The vast majority of
oxygen respondents reported that they are either very or somewhat comfortable controlling the
rate of oxygen flow (nearly 80 percent), using a humidifier (nearly 80 percent), attaching
regulators (86 percent), and cleaning filters (73 percent). Most of the other DME users
(71 percent) also reported being either very or somewhat comfortable using and maintaining their
equipment.
6.3.4 Multivariate Analysis of Satisfaction
To determine which of the variables discussed above have the largest impact on
satisfaction, we performed multivariate regression analyses. Because of the differing nature of
oxygen and other DMEPOS services, we performed separate analyses for oxygen users and other
DMEPOS users. The regression for other DMEPOS users allowed for additional service-specific
effects by rncluding dichotomous variables for hospital beds, urological supplies, surgical
dressrngs, and enteral nutrition equipment, We tested whether it would be appropriate to run a
pooled regressron on the combined data set; an F-test (not reported) strongly rejected this
hypothesis.
The dependent variable (satrsfaction) hocuses on a beneficiary’s overall satisfaction with
his supplrer and ranges from 0 to 10. The appropriate speriircation for analyzing this type of
8-8
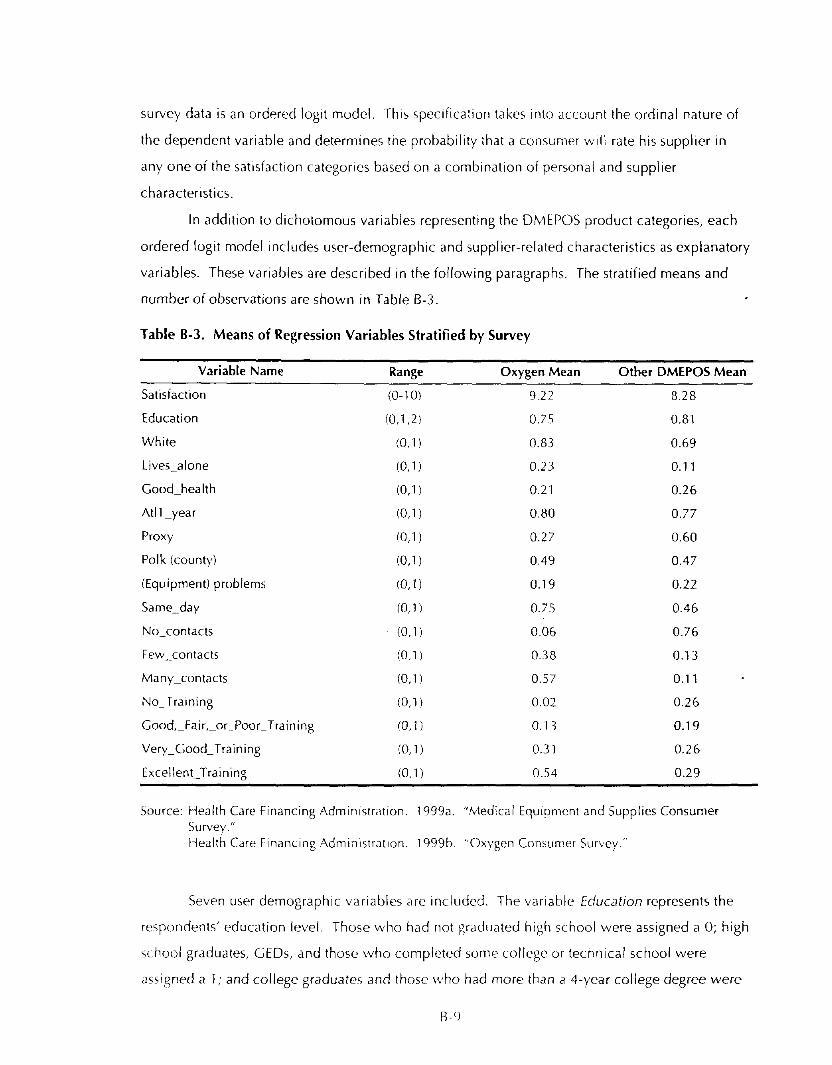
survey data is an ordered logit model. Thus specification takes into account the ordinal nature of
the dependent variable and determines the probability that a consumer WIII rate his supplier rn
any one of the satrsfaction categories based on a combination of personal and supplier
characterrstics.
In additron to dichotomous variables representing the DMEPOS product categories, each
ordered logit model includes user-demographic and supplier-related characteristics as explanatory
variables. These variables are descrrbed in the following paragraphs. The stratified means and
number of observations are shown in Table B-3.
Table B-3. Means of Regression Variables Stratified by Survey
Variable Name Range Oxygen Mean Other DMEPOS Mean
Satisfaction (O-10) 9.22 8.28
Education co,1 a 0.75 0.81
White (O,l) 0.83 0.69
Lives-alone (0.1) 0.23 0.11
Good-health @,l) 0.21 0.26
At11 -year (O,l) 0.80 0.77
Proxy (O,l) 0.27 0.60
Polk (county) (O,l) 0.49 0.47
(Equipment) problems (O,l) 0.19 0.22
Same-day @,I) 0.75 0.46
No-contacts @,I) 0.06 0.76
Few-contacts (O,l) 0.38 0.13
Many-contacts (O,l) 0.57 0.11 .
No-Trarning (0.1) 0.02 0.26
Good,-Fair,-Or-Poor-Training (O,l) 0.13 0.19
Very-Good-Training (O,l) 0.3 1 0.26
Excellent-Training (O,l) 0.54 0.29
Source: Health Care Financing Admimstration. 1999a. “ictedical Equlpment and Supplies Consumer Survey.” Health Care Financing .Admlnlstratlon. 1999b. “Oxygen Consumer Survey.”
Seven user demographic variables are Included. The variable Education represents the
respondents’ education level. Those who had not graduated htgh school were assigned a 0; high
~hool graduates, GE&, and those who completed some college or technical school were
assrpned a 1; and college graduates and those who had more than a d-year college degree were
B-9

assigned a 2. The variable White identifies the respondents’ race and ethnrcity, though only to
the extent that it distinguishes between non-Hispanic whites and all other races. Other variables
include whether the beneficiary lives alone (Lives-alone), reported his health status as at least
“good” as opposed to “fair” or “poor” (Good-health), and whether he has been using his
equipment for at least 1 year (At/J-year). To test whether the use of a proxy respondent implies
differential levels of satisfaction, we include the variable Proxy. Although we do not expect
differences in baseline responses between the demonstration and control locations, we include
the variable Polk (county) to test this hypothesis.
Supplier characteristics include the variable, Problems, identifying those respondents who
reported having major problems with their equipment in the last 6 months. Same-day is a
variable indicating whether the equipment was delivered on the same day that it was ordered.
The dichotomous variables No~contacts, Few-contacts, and Many-contacts indicate the level of
face-to-face contact the respondent had with his supplrer. They signify, respectively, no face-to-
face contact, between one and five contacts over the prior 6 months, or greater than five contacts
over this time period (i.e., at least monthly visits). We distinguished between few and many
contacts because of concern that multiple contacts might be the result of problems with the
supplier and/or the equrpment and thus would have a negative impact on satisfaction. The
regressions also include a variable signifying that the respondent did not receive training
(No-Training), and three addrtional dichotomous variables identifying whether the training was
excellent; very good; or good, fair, or poor.
The regression results are presented in Table B-4. The other DMEPOS regressron reveals
that, after adjusting for the levels of the other independent variables, urinary devices is the only .
type of DMEPOS equipment significantly associated with differential levels of satisfaction.
Both regressions reveal a strong relationship between trainrng and beneficiary satisfaction.
Allowing the variable very_good-training to represent the omitted reference category, those
responding that they received excellent- training rated their suppliers higher, and those receiving
either good,_iair,_or_poor_~rJj~/nS downgraded their suppliers. Oxygen users who did not
receive training were less sattsfied with their supplier, while No-training is not srgnifrcant in the
other DMEPOS regression.’ This finding may reflect the relative difficulty of operating oxygen
equipment as compared to the other DMEPOS products. The Same-day coefficient is positive
and extremely signrficant In both specifications, revealing that customers are lrkely to rate their
‘Specification tests (not reported) rejected the hypothesis that thus coefficient varies by DMEPOS product
tvpe.
B-l 0

Table B-4. Ordered Logistic Regression Results Concerning Overall Satisfaction
Variable Name Oxygen Users
Oxygen -
Cover -
Bed equtpment -
Urinary devices -
Feeding supplies -
Excellent-Training 1.20”
Good,-Fair,-or-Poor-Training -1.36”
No-Training -1.88”
Same-day 0.67YO.17)
Problems -0.27(0.19)
No-contacts -0.81’(0.32)
Many-contacts O.SS”(O.16)
White 0.1610.21)
Education -0.34Y0.12)
At11 -year -0.15(0.20)
Lives-alone -0.06rO.19)
Health -0.03(0.20)
Proxy -0.27(0.17)
Polk 0.18(0.16)
Other DMEPOS Users
-0.16(0.30)
0.2310.26)
0.56YO.27)
0.30(0.353
1.42”
-1 .19”
-0.24
0.69YO.20)
-0.44(0.25)
-0.18fO.29)
-0.18
0.42YO.22)
-0.15(0.14)
0.07(0.24)
-0.08(0.33)
0.57YO.23)
-0.1 l(O.22)
-0.19(0.20)
“Indicates significance at the 0.05 level.
Source: Health Care Financing Administration. 1999a. “Medical Equipment and Supplies Consumer . Survey.” Health Care Financing Administration. 1999b. “Oxygen Consumer Survey.”
suppliers higher if they recerve the equipment promptly. The coefficient associated with an
increase in equipment problems (Probiems) is negative, although Insignificant, in both
specifications.
The two included contact \,ariables measure the marginal rnfluence that these variables
have on satrsfactron as compared to the omrtted reference category, iebv-contacts. In the oxygen
regression, compared to those rn the reference category, those who had significant contact rated
their supplrers higher, whrle those who had no contact were less satisired. These varrables were
R-l 1

insigniflcant in the other DMEPOS regression. ’ Thts agaln may reflect the differing nature of
oxygen and other DMEPOS products. Oxygen equipment IS more complicated and requires more
maintenance than other DMEPOS equipment. Moreover, many oxygen users receive regular
deliveries of portable oxygen tanks. Therefore, we expect that ongoing contact with the Oxygen
supplier is likely to be related to training, maintenance, or delivery service and should be
positively correlated with satisfaction, The correlation between contacts and supplier satisfaction
for the other DMEPOS equipment is less clear; this equipment requires minimal training and
maintenance. The regression results are consistent with these expectations. In summary, these -
results combine to suggest that consumers are acutely aware of the service they receive from their
suppliers, and they reward higher quality service with higher satisfaction ratings.
The coefficients on the demographic variables yield some interesting results. The race
coefficient (White) is positive in both regressions and significant in the other DMEPOS
specification. White respondents may be receiving better service, or they may be less critical of
their suppliers’ performance than their nonwhite counterparts. The variable signifying greater
education is negative in both regressions and significant in the oxygen specification. Although
this result is difficult to explain, individuals with more education may have greater expectations
and therefore may be more critical in evaluating their suppliers’ conduct. The length of time that
an individual has been using the equipment and whether they live alone appear to have no effect
on satisfaction ratings. The other DMEPOS specification shows a positive and significant effect
associated with the health status of the beneficiary. It has been suggested that an individual who
is positive about his own health is more likely to be positive about his supplier’s performance
(Piette, 1999). We find no evidence that the use of a proxy respondent is correlated with _
perceived satisfaction. We also do not find any systematic differences in satisfaction across
counties (Polk), suggesting that Brevard County was an appropriate choice for comparison.
B.4 Discussion
Reported satisfaction ratings for DMEPOS suppliers (in selected Florida counties) are very
high. To put these findings in perspective, It is worth considering satisfaction ratings for other
health care servlces. Our questions on satisfaction were derived from similar questions on the
Consumer Assessment of Health Plans Study (CAHPS’G’). The CAHPV’ survey focuses on
patients’ experiences with several dimensions oi mrdical care and contains four questions asking
consumers to rate the following on a scale from 0 to 10:
‘We tested whether these coefficients vary by DMEPOS product type, and rejected this hypothesis in all cases.
B-l 2

l their personal physrcian,
l the specialist seen most often in the last 6 months,
l the health care received in the previous 6 months, and
l the performance of the health plan itself
Early CAHPV results show mean ratings ranging from a low of 7.6 regarding the health plan to a
high of 8.1 for both the personal doctor and the specialist (Fowler, Gallagher, and Nederend,
1999). Nationwide, the average ranking for Medicare managed care plans in 1998 was 8.7 out of.
10 (Beeuwkes, 1999), and the percentage of enrollees in Florida who rated their health plan as a
10 was 47 percent (Medicare and You, 2000). In comparison, our results reveal the average
rating for oxygen suppliers was 9.2, and the average rating for other DMEPOS suppliers was 8.3.
Sixty-seven percent of oxygen users and 43 percent of other DME users gave their supplier the
highest possible ratrng. Obviously, managed care is a very different service than DME and the
usual cautions about comparing apples to oranges apply; nevertheless, these results add
perspective to the overall high satisfaction ratings for DME suppliers. The ratings for oxygen
suppliers appear higher than satisfaction ratings for other health care services. The ratings for
suppliers of other DMEPOS services are also high but closer to those for other health care
services.
Comparing satisfaction with oxygen supplrers and satisfaction with other DMEPOS
suppliers, we see that fast delivery and quality training are associated with higher satisfaction for
both types of suppliers. In contrast, frequency of contact with the supplier is positively associated
with satisfaction with oxygen suppliers, but it is not significantly associated with satisfaction with
other DMEPOS suppliers. Not surprisingly, oxygen suppliers visit beneficiaries more frequently .
than suppliers of other DMEPOS.
Because our study was limited to two Florida counties, the high satisfaction levels
recorded for oxygen and other DMEPOS suppliers may not generalize to suppliers in other
locations. However, there were no significant differences between the two counties in
beneficiary satisfaction, and Medicare reimbursement policies rn the counties at the time of the
surveys were similar to those in the rest of the country. Thus, it is not inconceivable that the
results will generalrze to other areas.
Given the high baseline levels of beneficiary satisfaction with DME suppliers, the next
important question IS whether policy inttiatives. such as reductrons in reimbursement or the
DMEPOS Competitive Bidding Demonstration, wrll aifect beneficiary satisfaction. Because the
baseline satrsfaction levels are already so high, it IS almost statistically impossible for the
B-l 3
rnitiatrves to cause satrsfaction ratings to Increase. Thus, pi changes in satrsiactron are to be
observed, they are likely to be negative. Conceptually, a DME supplter mrght be expected to
lower service qualrty. and therefore costs, In response to the tightening margins caused by
reductions in reimbursement levels or the competitive brdding demonstration project (to the
extent that it reduces fees). Opposing this Incentive is the fact that reductions in quality are likely
to reduce beneficiary satisfaction, and a supplrer must still compete to attract customers. It will
be important to evaluate how this tradeoff plays out as the policy initiatives are implemented.
Our analysis provides a useful baseline for this evaluation, with data on both satrsfaction as well .
as quality and service variables that are clearly associated with satisfaction.
B.5 Acknowledgments
We thank Claire Gibbons, Kay Jewell, Sarita Karon, and Amy Wofford for their assistance
in developing the survey instruments. Amy Wofford served as survey manager, and Kristine
Broglio provided data analysis.
8.6 References
Beeuwkes, B.: Risk Selection and Product Differentiation in Medicare HMOs. Unpublished
manuscript. Harvard University. 1999.
Department of Health and Human Services, Office of Inspector General (DHHS/OIC): A
Comparison of Albuterol Sulfate Prices. Report Number OEI-03-94-00392. June 1996a.
Department of Health and Human Services, Office of Inspector General (DHHS/OIG): Durable
Medical Equipment Payments in Nursing Homes. Report Number OEl-06-92-00862.
March 1996b.
Department of Health and Human Services, Office of Inspector General (DHHVOIG): Enteral
Nutrient Payments in Nursing Homes. Report Number OEI-06-92-00861. March 1996c.
Department of Health and Human Services, Office of Inspector General \DHHSIOIG): Payments
for Enteral Nutrition: Medicare and Other Payers. Report Number OEI-03-96-00021.
May 1996d.
Fowler, F.J., P.M. Gallagher, and S. Nederend: Comparing Telephone and IMarl Responses to the
CAHPS Survey Instrument. Medical Care 37\3,Supplement):MS41-49, 1999.
Health Care Frnancrng Administratton. 1999a. %tedrcal Equipment and Supplies Consumer
Survey.”
Health Care Frnancing Administration. 199913. “Oxygen Consumer Survey.”
Medrcare and You. <www.medicare.gov/comparison/plansearch/QuaIItyResuIts.asp>. 2000.
B-l 4

Piette, J.O.: Satisfaction With Care Among Patients With Diabetes in .Two Public Health Care
Systems. Medical Care 37(6):538-546, 1999.
The Board of Trustees, Federal Hospital Insurance Trust Fund: 1999 Annual Report of the Board
of Trustees of the Federal Hospital Insurance Trust Fund. 1999.
Turner, C.F., B.H. Forsyth, S.C. Weeless, M.B. Whltt, D.K. Pate, T.K. Smith, and F.J. Mierzwa:
Field Test of Medicare Beneficiary Health Status Registry: Major Findings and
Recommendations. Research Triangle Park, NC: Research Triangle Institute. 1994.
U.S. General Accounting Office (GAO): Medicare: Home Oxygen Program Warrants Continued-
HCFA Attention. Report to the Charrman, Committee on Finance, U.S. Senate. Report
Number GAO/HEHS-98-17. November 1997.
B-15
