of proceedings
TRANSCRIPT

Proceedings of the Eastern Wheat Workers and Southern Small Grain
Workers Conference, May 9-12, 2005 Bowling Green, KY
Compiled and edited by C. S. Swanson, Dept. Of Plant and Soil Sciences, University of Kentucky
All papers contained herein plus additional submissions will be posted at http://www.uky.edu/Ag/Wheat/wheat_breeding/EWW_SSGW/index.html


2005 Eastern Wheat Workers / Southern Small Grain Workers Conference
Papers Session I: Frontiers of Wheat Breeding: Moderator – Paul Murphy, NCSU
Perennial Wheat: The Re-Greening of the Great Plains………….. 1 Stan Cox, Lee DeHaan, The Land Institute, Salina Kansas
Use of Biplot Analysis in Crop Breeding…………………………… 7
Weikai Yan, Eastern Cereal and Oilseed Research Center, Agriculture and Agri-Food Canada. 960 Carling Ave., Ottawa, Ontario, Canada, K1AOC6.
Session II: Marker Use in Wheat: Moderator – Jose Costa, U. of MD. GrainGenes 2.0: Resources for Small Grains Breeding…………... 31 David Matthews1, Victoria Carollo2, Gerard Lazo2, Olin Anderson2 1USDA-ARS and Cornell University, Department of Plant Breeding and Genetics 2USDA-ARS, Western Regional Research Center, Albany, CA
Integrating Marker-Assisted Selection into Conventional Wheat Breeding Programs…………………………………………. 35 Gina Brown-Guedira, USDA/ARS Plant Science Research, Dept. of Crop Science, North Carolina State University, Raleigh, NC 27606 National Wheat Coordinated Agricultural Project
(CAP) Report…………………………………………………………. 39 Carl A. Griffey, Virginia Polytechnic Institute & State University Session III: Wheat Fungal Disease: Moderator – June Hancock, Syngenta USDA/ARS Wheat Powdery Mildew Research……………………. 41 Christina Cowger and David Marshall USDA/ARS, Plant Science Research Unit, Raleigh, NC
2005 Eastern Wheat Workers / Southern Small Grain Workers Conference
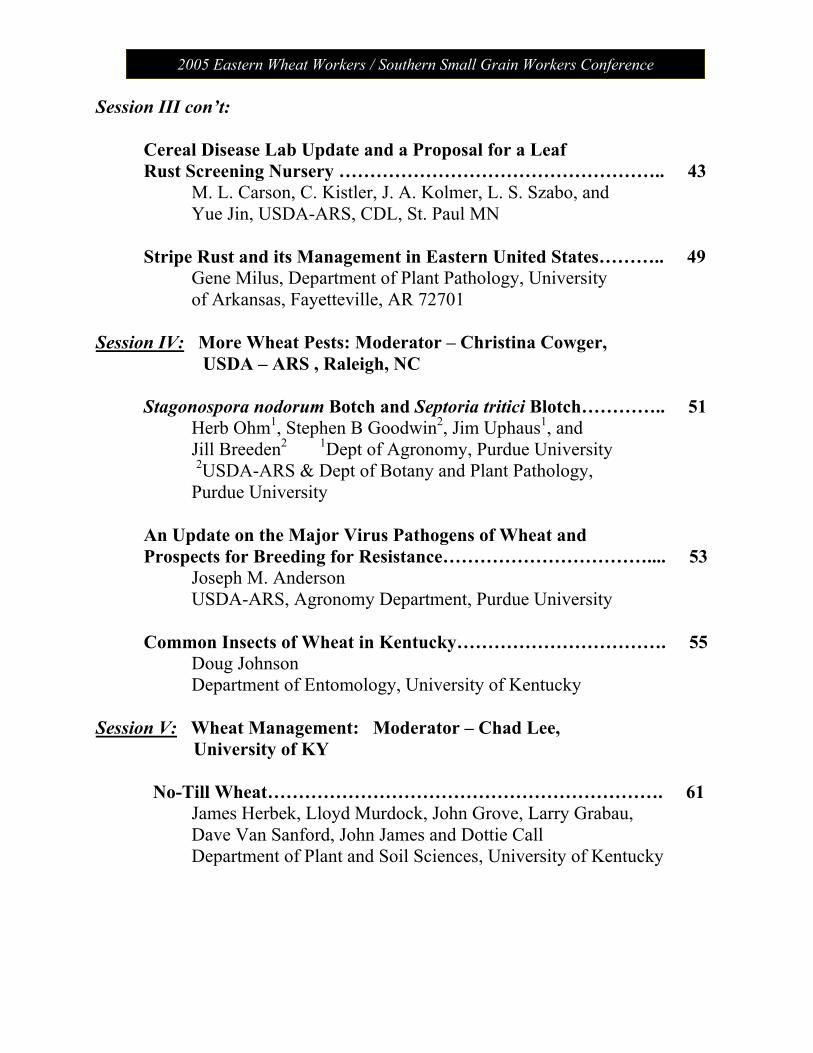
Session III con’t: Cereal Disease Lab Update and a Proposal for a Leaf Rust Screening Nursery …………………………………………….. 43
M. L. Carson, C. Kistler, J. A. Kolmer, L. S. Szabo, and Yue Jin, USDA-ARS, CDL, St. Paul MN
Stripe Rust and its Management in Eastern United States……….. 49 Gene Milus, Department of Plant Pathology, University of Arkansas, Fayetteville, AR 72701
Session IV: More Wheat Pests: Moderator – Christina Cowger, USDA – ARS , Raleigh, NC Stagonospora nodorum Botch and Septoria tritici Blotch………….. 51 Herb Ohm1, Stephen B Goodwin2, Jim Uphaus1, and
Jill Breeden2 1Dept of Agronomy, Purdue University 2USDA-ARS & Dept of Botany and Plant Pathology, Purdue University
An Update on the Major Virus Pathogens of Wheat and Prospects for Breeding for Resistance…………………………….... 53
Joseph M. Anderson USDA-ARS, Agronomy Department, Purdue University
Common Insects of Wheat in Kentucky……………………………. 55 Doug Johnson
Department of Entomology, University of Kentucky
Session V: Wheat Management: Moderator – Chad Lee, University of KY No-Till Wheat………………………………………………………. 61 James Herbek, Lloyd Murdock, John Grove, Larry Grabau,
Dave Van Sanford, John James and Dottie Call Department of Plant and Soil Sciences, University of Kentucky

2005 Eastern Wheat Workers / Southern Small Grain Workers Conference
Session V con’t
Protein Variability in Soft Red Winter Wheat: Nitrogen Timing and Rates………………………………………...................... 75
Dianne Farrer, Randy Weisz, Paul Murphy, Ron Heiniger North Carolina State University, Dept. of Crop Science
Session VI: The Business of Plant Breeding: Moderator - Anne McKendry Update on Variety Release Procedures, Branding,
PVP, Patents………………………………………………………….. 79 David Whitt
Crop and Soil Environmental Sciences Department, Virginia Tech
Session VII: Grain Quality and Utilization: Moderator – Ben Edge Papers from this session (along with all papers) will be posted on the meeting website.
2005 Eastern Wheat Workers / Southern Small Grain Workers Conference
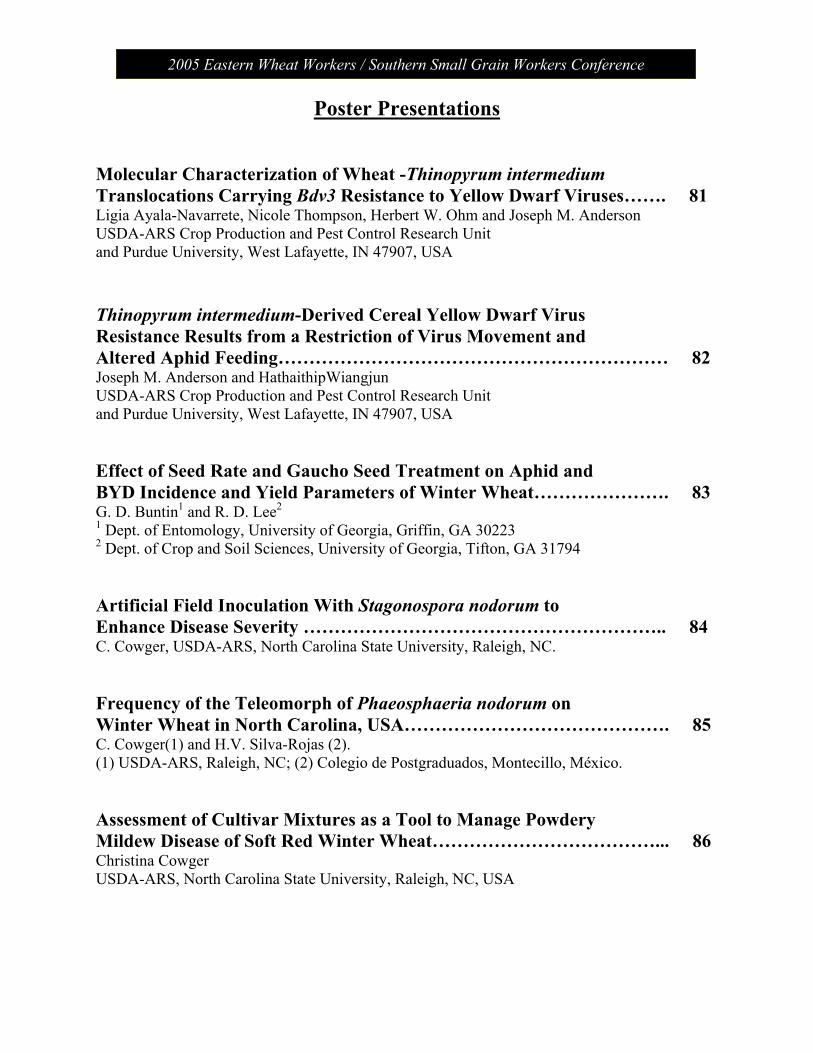
Poster Presentations Molecular Characterization of Wheat -Thinopyrum intermedium Translocations Carrying Bdv3 Resistance to Yellow Dwarf Viruses……. 81 Ligia Ayala-Navarrete, Nicole Thompson, Herbert W. Ohm and Joseph M. Anderson USDA-ARS Crop Production and Pest Control Research Unit and Purdue University, West Lafayette, IN 47907, USA Thinopyrum intermedium-Derived Cereal Yellow Dwarf Virus Resistance Results from a Restriction of Virus Movement and Altered Aphid Feeding……………………………………………………… 82 Joseph M. Anderson and HathaithipWiangjun USDA-ARS Crop Production and Pest Control Research Unit and Purdue University, West Lafayette, IN 47907, USA Effect of Seed Rate and Gaucho Seed Treatment on Aphid and BYD Incidence and Yield Parameters of Winter Wheat…………………. 83 G. D. Buntin1 and R. D. Lee2
1 Dept. of Entomology, University of Georgia, Griffin, GA 30223 2 Dept. of Crop and Soil Sciences, University of Georgia, Tifton, GA 31794 Artificial Field Inoculation With Stagonospora nodorum to Enhance Disease Severity ………………………………………………….. 84 C. Cowger, USDA-ARS, North Carolina State University, Raleigh, NC. Frequency of the Teleomorph of Phaeosphaeria nodorum on Winter Wheat in North Carolina, USA……………………………………. 85 C. Cowger(1) and H.V. Silva-Rojas (2). (1) USDA-ARS, Raleigh, NC; (2) Colegio de Postgraduados, Montecillo, México. Assessment of Cultivar Mixtures as a Tool to Manage Powdery Mildew Disease of Soft Red Winter Wheat………………………………... 86 Christina Cowger USDA-ARS, North Carolina State University, Raleigh, NC, USA
2005 Eastern Wheat Workers / Southern Small Grain Workers Conference
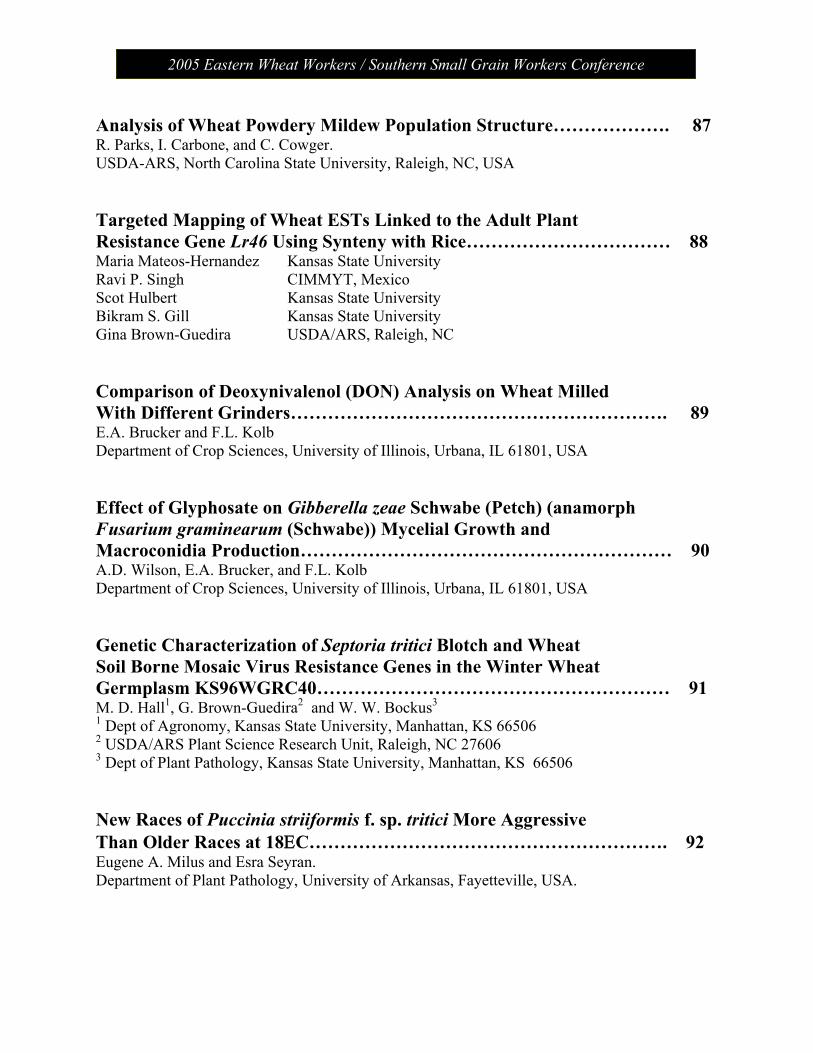
Analysis of Wheat Powdery Mildew Population Structure………………. 87 R. Parks, I. Carbone, and C. Cowger. USDA-ARS, North Carolina State University, Raleigh, NC, USA Targeted Mapping of Wheat ESTs Linked to the Adult Plant Resistance Gene Lr46 Using Synteny with Rice…………………………… 88 Maria Mateos-Hernandez Kansas State University Ravi P. Singh CIMMYT, Mexico Scot Hulbert Kansas State University Bikram S. Gill Kansas State University Gina Brown-Guedira USDA/ARS, Raleigh, NC Comparison of Deoxynivalenol (DON) Analysis on Wheat Milled With Different Grinders……………………………………………………. 89 E.A. Brucker and F.L. Kolb Department of Crop Sciences, University of Illinois, Urbana, IL 61801, USA Effect of Glyphosate on Gibberella zeae Schwabe (Petch) (anamorph Fusarium graminearum (Schwabe)) Mycelial Growth and Macroconidia Production…………………………………………………… 90 A.D. Wilson, E.A. Brucker, and F.L. Kolb Department of Crop Sciences, University of Illinois, Urbana, IL 61801, USA Genetic Characterization of Septoria tritici Blotch and Wheat Soil Borne Mosaic Virus Resistance Genes in the Winter Wheat Germplasm KS96WGRC40………………………………………………… 91 M. D. Hall1, G. Brown-Guedira2 and W. W. Bockus3
1 Dept of Agronomy, Kansas State University, Manhattan, KS 66506 2 USDA/ARS Plant Science Research Unit, Raleigh, NC 27606 3 Dept of Plant Pathology, Kansas State University, Manhattan, KS 66506 New Races of Puccinia striiformis f. sp. tritici More Aggressive Than Older Races at 18ΕC…………………………………………………. 92 Eugene A. Milus and Esra Seyran. Department of Plant Pathology, University of Arkansas, Fayetteville, USA.

2005 Eastern Wheat Workers / Southern Small Grain Workers Conference
Genetic Diversity of Puccinia striiformis f. sp. tritici in the United States………………………………………………………………… 93 Samuel G. Markell1, Eugene A. Milus1, and Xianming Chen2 1University of Arkansas, Fayetteville. 2USDA-ARS, Washington State University, Pullman, USA. Inheritance and Chromosomal Assignment of Powdery Mildew Resistance Genes in Two Winter Wheat Germplasm Lines……………… 94 G. Srnić1, J. P. Murphy2, J.H. Lyerly2, S. Leath3, and D.S. Marshall4
1Pioneer Hi-Bred International, Johnston, IA. 2Department of Crop Science, 3Department of Plant Pathology, and 4USDA-ARS, North Carolina State University, Raleigh.
A Gene Encoding a Novel Chitin Binding Protein is Highly Up-Regulated in Response to Feeding by Avirulent Hessian Fly Larvae…………………………………………………………………… 95 Marcelo P. Giovanini1, Christie E. Williams2, and Herbert W. Ohm1
1Department of Agronomy, Purdue University, 915 W. State St., West Lafayette, IN 47907 2USDA-ARS Crop Production and Pest Control Research Unit Mid-West Area and Department of Entomology, Purdue University, 901 W. State St. West Lafayette, IN 47907 Identification of QTLs Associated With Resistance to Glume Blotch Caused by Stagonospora nodorum…………………………………. 96 J. Uphaus1, E. Walker2, M. Francki2, M. Shankar2, H. Golzar2, R. Loughman2, & H. Ohm1 1Department of Agronomy, Purdue University, W. Lafayette, IN 47907-2054 2Department of Agriculture, Baron-Hay Court, South Perth 6151, Western Australia Tortilla Properties of Hard Wheat Grown in Ohio and the Great Plains……………………………………………………………………….. 97 C. Sneller1 and Gang Guo2
1The Ohio State University, 1680 Madison Av., Wooster OH, 43912 2The Mennel Milling Co. PO Box 1280, Roanoke VA, 24016
2005 Eastern Wheat Workers / Southern Small Grain Workers Conference
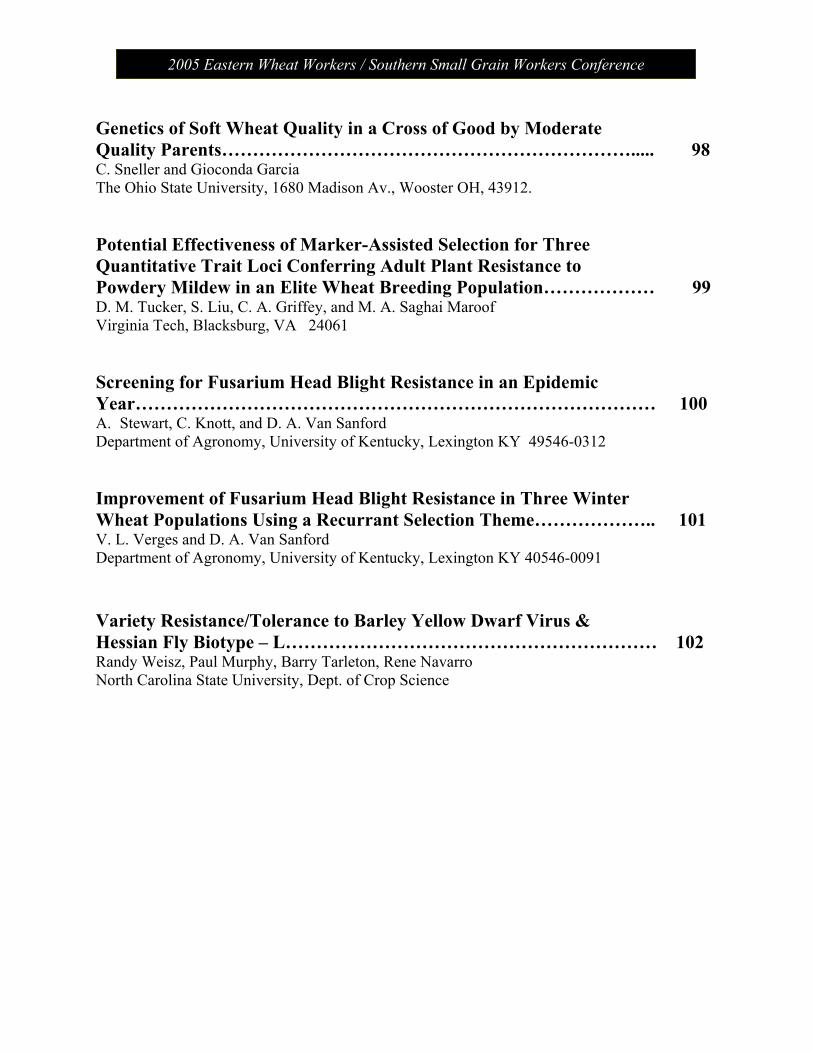
Genetics of Soft Wheat Quality in a Cross of Good by Moderate Quality Parents…………………………………………………………..... 98 C. Sneller and Gioconda Garcia The Ohio State University, 1680 Madison Av., Wooster OH, 43912. Potential Effectiveness of Marker-Assisted Selection for Three Quantitative Trait Loci Conferring Adult Plant Resistance to Powdery Mildew in an Elite Wheat Breeding Population……………… 99 D. M. Tucker, S. Liu, C. A. Griffey, and M. A. Saghai Maroof Virginia Tech, Blacksburg, VA 24061 Screening for Fusarium Head Blight Resistance in an Epidemic Year………………………………………………………………………… 100 A. Stewart, C. Knott, and D. A. Van Sanford Department of Agronomy, University of Kentucky, Lexington KY 49546-0312
Improvement of Fusarium Head Blight Resistance in Three Winter Wheat Populations Using a Recurrant Selection Theme……………….. 101 V. L. Verges and D. A. Van Sanford Department of Agronomy, University of Kentucky, Lexington KY 40546-0091 Variety Resistance/Tolerance to Barley Yellow Dwarf Virus & Hessian Fly Biotype – L…………………………………………………… 102 Randy Weisz, Paul Murphy, Barry Tarleton, Rene Navarro North Carolina State University, Dept. of Crop Science

1
2005 Eastern Wheat Workers / Southern Small Grain Workers Conference
Perennial Wheat: the Re-Greening of the Great Plains
Stan Cox, Lee DeHaan The Land Institute, Salina, Kansas
Introduction Since its very first days, agriculture has rested on a foundation of annual plants. That requires disturbance of the soil resource, either by the ancient practice of tilling or by chemical treatment. Tillage can be done without causing great harm when it’s on a very small scale. But civilizations that have practiced tillage beyond the level of the kitchen garden have suffered, often catastrophically, from soil erosion. Compounding the problem in recent decades is the widespread use of herbicides to supplement or replace tillage. As a result, these herbicides are found in the tissues of nearly all of our nation’s children. Today, satellite images of the planet make for grim viewing, with vast swaths of entire continents having been scoured of their deep-rooted, year-round perennial vegetation, leaving the soil uncovered for months at a time. Even during the growing season when the landscape is green, shallow-rooted annual crops fail to manage water and nutrients the way their perennial predecessors did. The destruction of deep, massive perennial root systems through tillage has wrecked entire underground ecosystems, subtracting from the soil much of what makes it soil. A growing body of research demonstrates conclusively that the cultivation of annual crops in the Midwest and Great Plains of the United States is degrading soils, rendering water unfit to drink, rolling back biodiversity, spreading toxic chemicals, and even creating a hypoxic zone hundreds of miles downstream in the Gulf of Mexico. Many studies show that re-establishing perennial vegetation across the region would solve these problems. But humans obtain two-thirds of our total calories from grains and oilseed crops, none of them perennial. Existing perennial species can produce only a small fraction of the total calories required for direct consumption by a growing human population. Environmentally conscious researchers and farmers are making the most of the only perennial plants available to them, by attempting to put more hay and pasture on the landscape; plant more trees and grass along rivers and streams to soak up the contaminants that escape from cropland; and take more land out of grain production altogether, under the Conservation Reserve Program. In other words, we are forced to treat grain cropping not as a source of life but as a dangerous activity against which humans and nature must be protected. Until perennial grains join the roster of food plants, we have no choice.
2
2005 Eastern Wheat Workers / Southern Small Grain Workers Conference
Perennial wheat’s history Among many potential perennial grain crops (Cox et al., 2002), wheat has probably received the most attention. Wagoner (1990) examined in detail the early history of efforts in the United States, Canada, Germany, and the USSR, citing more than 65 publications on the subject. None of these efforts produced a truly perennial grain cultivar, but they did spin off much valuable annual germplasm with genes for disease resistances and other traits. In the end, most of the effort in the perennial-wheat programs was diverted into producing improved annual cultivars, where progress was more easily achieved. Of the few perennial, grain-producing genotypes developed from wide hybrids at the time of Wagoner’s review, none was agronomically successful. Soviet-developed ‘perennial’ cultivars (Tsitsin, 1965) produced good grain harvests only in the year in which they were established from seed; in the end, they were used mainly as forage cultivars that provided no more than one grain harvest. The US germplasm ‘MT-2’, derived from a hybrid between Triticum turgidum and Thinopyrum intermedium and released by Schulz-Schaeffer and Haller (1987) in Montana, had very low kernel weight and unreliable persistence. In Sweden, Fatih (1983) found that perennial T. aestivum / Th. intermedium partial amphiploids (2n=56) yielded, on average, 48% as much grain as 42-chromosome, annual, backcross-derived lines of similar parentage. In California, amphiploid-derived perennial lines have yielded 70% as much as annual cultivars (Suneson, 1959). More recently, Scheinost et al. (2001) tested perennial lines that yielded up to 64% as much as the annual wheat cultivar ‘Madsen’ in Pullman, Washington. Results and discussion The Land Institute has breeding programs to develop a wide range of perennial grains, including wheat, triticale, intermediate wheatgrass, sorghum, sunflower, and Illinois bundleflower. In addition, we have exploratory or cooperative work in perennial chickpea, maize, rye, flax, and millets. The perennial wheat program at The Land Institute was initiated in 2001. It became obvious almost immediately that we would need to establish our own breeding populations from new hybrids rather than rely on existing wheat / perennial amphiploids from European or west-coast US programs. In repeated tests over the past few years, none of the germplasm developed in other regions has managed to survive the long, hot postharvest period in central Kansas. Among the perennial Triticeae, the wheatgrasses of the genus Thinopyrum have demonstrated the strongest and most consistent summer survival in our observation plots. The rhizomatous hexaploid Th. intermedium seems especially well-adapted in Kansas. This species has a large, diverse germplasm base, which includes a population that has undergone past mass selection for grain production by USDA and Rodale Institute

3
2005 Eastern Wheat Workers / Southern Small Grain Workers Conference
researchers. We have begun selection for yield and seed size within a diverse Th. intermedium population, but have also produced almost 2000 hybrid plants from crosses between perennials (mostly Th. intermedium, the decaploid Th. ponticum, the diploid Th. elongatum, and the diploid Secale montanum) and annual parents, including hexaploid wheat, tetraploid wheat (durum and carthlicum types), and triticale (Table 1). Table 1. Numbers of F1 plants produced in 2002-2004 from annual / perennial crosses Female parent Male parent Tetraploid wheat Hexaploid wheat Triticale Th. elongatum 5 52 60 Th. intermedium 601 772 153 Th. ponticum 21 21 9 S. montanum 157 55 73 We have a long-term field nursery where we maintain many of these sterile F1 hybrids and dig rhizomes or crown parts for use in crossing, etc. Many of them are strongly rhizomatous. Doubling the chromosome number of wheat/Thinopyrum hybrids is very difficult, although partial amphiploids, including MT-2 and TAF46 (Friebe et al., 1992) have been produced in the past. We have been unsuccessful so far in producing amphiploids, but have crossed a large number of the F1s to the either the annual or the perennial parent species, or to a third species. To date, we have obtained 238 plants from such multiple crosses that are at least partially self-fertile (Table 2). Hexaploid wheat is the recurrent parent of all wheat/Th. elongatum//wheat plants. The few wheat/Th. intermedium plants had a tetraploid female parent and came from rare self-fertilization of the F1. Wheat/Th. intermedium/wheat crosses involved bread wheat, winter durum, and carthlicum-type germplasm lines. A large proportion of those were of the type carthlicum/Th. intermedium//bread wheat. The most highly self-fertile plants have come from triticale/Th. intermedium/ triticale crosses (Table 2.) Table 2. Numbers of F2 or F3 plants, numbers of partially fertile plants (i.e., those producing some selfed seed), and mean numbers of selfed seed per fertile plant for seven types of intergeneric crosses. Cross type Genera-
tion Total # plants
# partially fertile plants
# seeds per fertile plant
wheat / Th. elongatum // wheat F2 77 68 52 wheat / Th. intermedium F2 11 10 20 wheat / Th. intermedium // wheat F2 193 113 33 wheat / Th. intermedium // wheat F3 52 19 42 wheat / Th. intermedium // Th. interm. F2 9 3 4 triticale / Th. intermedium // triticale F2 20 19 137 triticale / Th. ponticum F2 18 6 9

4
2005 Eastern Wheat Workers / Southern Small Grain Workers Conference
So far this spring, we have harvested more than 13,000 seed from those plants. We are observing post-harvest re-growth and some rhizome emergence in a portion of such plants in greenhouse pots and field nurseries, but it is too early at this writing to provide numbers or proportions of plants with perennial tendency. However, there are plants that have produced rhizomes and/or new growth after complete senescence of the previous growth cycle’s visible vegetation. Plants from three-way crosses involving Th. elongatum -- genomically the descendants of an ABDE F1 plant pollinated by bread wheat (AABBDD) -- have a small genetic contribution from the perennial parent and show almost no perennial tendency. Three-way crosses involving Th. intermedium (from ABJJS, ABDJJS, or ABRJJS F1s pollinated with wheat or triticale) produce more strongly perennial plants. Triticale / Th. ponticum progenies (from ABRJJJJJ F1s) also show more perenniality. The few backcrosses of F1s to the perennial parent Th. intermedium (Table 2) have so far tended to be highly sterile and less vigorous than either parent. Genes on the Thinopyrum chromosomes 4E and 4J confer post-sexual cycle regrowth (Lammer et al., 2004), but perenniality has many more components, including summer/fall survival, winter survival, and regulation of successive rounds of reproductive development. Perenniality is a highly complex, composite trait; the general rule across different interspecific crosses seems to be that at least 50% of the genome must be derived from the perennial parent if the progeny is to be fully perennial (Cox et al., 2002). Therefore, we are handling the perenniality trait as one would any polygenic trait with strong genotype x environment interaction, such as grain yield. In light of the cytogenetic chaos we have doubtless generated in this material, we are fortunate to have added a cytogeneticist to our staff in 2005. Even the selfed progeny of amphiploids have highly variable chromosomal constitutions because of differential elimination (Jones et al., 1999; Cai et al., 1998; Banks et al., 1993), so these multiparent crosses will require close monitoring of their chromosomal complements. Producing a gene pool of partially fertile plants is only one small step on the very long road to perennial wheat. But with the fate of our soil and water at stake, it is a goal well worth pursuing. References Banks, P. M., Li, S. J., Wang, R. R.-C., and Larkin, P. J. 1993. Varying chromosome composition of 56-chromosome wheat x Thinopyrum intermedium partial amphiploids. Genome 36: 207-215. Cai, X., Jones, S. S., and Murray, T. D. 1998. Molecular cytogenetic characterization of Thinopyrum and wheat-Thinopyrum translocations in a wheat-Thinopyrum amphiploid. Chromosome Res. 6: 183-189.

5
2005 Eastern Wheat Workers / Southern Small Grain Workers Conference
Cox, T.S., M. Bender, C. Picone, D.L. van Tassel, J.B. Holland, C.E. Brummer, B.E. Zoeller, A.H. Paterson, and W. Jackson. 2002. Breeding perennial grain crops. Crit. Rev. Plant Sci. 21:59-91.
Fatih, A. M. B. 1983. Analysis of the breeding potential of wheat-Agropyron and wheat-Elymus derivatives. Hereditas 98: 287-295. Friebe, B., Y. Mukai, B.S. Gill, and Y. Cauderon. 1992. C-banding and in-situ hybridization analyses of Agropyron intermedium, a partial wheat x Ag. intermedium amphiploid, and six derived chromosome addition lines. Theor. Appl. Genet. 84:899-905. Jones, T. A., Zhang, X.-Y., and Wang, R. R.-C. 1999. Genome characterization of MT-2 perennial and OK-906 annual wheat X intermediate wheatgrass hybrids. Crop Sci. 39:1041-1043. Scheinost, P. L., D. L. Lammer, X. Cai, T. D. Murray, and S. S. Jones. 2001. Perennial wheat: the development of a sustainable cropping system for the U.S. Pacific Northwest. Am. J. Alternative Agric. 16:147-151. Schulz-Schaeffer, J. and Haller, S. E. 1987. Registration of Montana-2 perennial X Agrotriticum intermediodurum Khizhnyak. Crop Sci. 27:822-823. Suneson, C. A., El Sharkawy, A., and Hall, W. E. 1963 Progress in 25 years of perennial wheat development. Crop Sci. 3: 437438. Tsitsin, N. V. Remote hybridisation as a method of creating new species and varieties of plants. Euphytica 14: 326-330. Wagoner, P. 1990. Perennial grain development: past efforts and potential for the future. Crit. Rev. Plant Sci. 9:381-408.

6
2005 Eastern Wheat Workers / Southern Small Grain Workers Conference
7
2005 Eastern Wheat Workers / Southern Small Grain Workers Conference
Use of Biplot Analysis in Crop Breeding Weikai Yan
Eastern Cereal and Oilseed Research Center, Agriculture and Agri-Food Canada. 960 Carling Ave., Ottawa, Ontario, Canada, K1A0C6. Email: [email protected],
[email protected]; web: TTTwww.ggebiplot.comTTT.
Introduction A biplot is a scatter plot that approximates and graphically displays a two-way table by both its row and column factors in a way that relationships among row factors, relationships among column factors, and interactions between row and column factors can be simultaneously visualized. Since its first proposal by Gabriel (1971), biplot has been used in visual data analysis by scientists of all disciplines, from economics, sociology, business, medicine, ecology, genetics, to agronomy. It is even used in music studies. Currently, over 24,000 pages containing the keyword “biplot” or “biplots” are available in the World Wide Web, and most major statistical software packages have included procedures or macros for biplot analysis.
The first application of biplot analysis to agricultural data analysis was Bradu and Gabriel (1978), who used a cotton performance trial dataset to illustrate the diagnostic role of biplots in model selection. Other early work of analyzing genotype by environment tables using biplots includes Kempton (1984), Gauch (1992), and Cooper and DeLacy (1994). Kroonenberg (1995) distributed an introduction to biplot analysis of genotype by environment tables downloadable from the internet. More recently, the term “GGE biplot” was proposed and various biplot visualization methods developed to address specific questions relative to genotype by environment data analysis (Yan et al., 2000). The GGE concept is based on the understanding that genotype main effect (G) and genotype by environment interaction (GE) are the two sources of variation that are relevant to genotype evaluation and that they must be considered simultaneously, not alone or separately, for appropriate genotype evaluation. GGE biplot analysis has evolved into a comprehensive biplot analysis system whereby most questions that may be asked of a genotype by environment table can be graphically addressed (Yan 2001, 2002, Yan and Kang 2003). Moreover, the use of this system has been extended to visual analyses of other types of plant breeding related data, such as genotype by trait tables (Yan and Rajcan 2002), host by pathogen tables (Yan and Falk 2002), diallel cross tables (Yan and Hunt 2002), and QTL by environment tables (Yan and Tinker 2005).
User-friendly software for biplot analysis has been developed (Yan 2001; Yan and Kang 2003), which is being improved and enhanced constantly ( TTTwww.ggebiplot.com/functions.htmTTT). This software makes biplot analysis of genotype by environment tables and other types of two-way tables, genotype by environment by trait three-way tables, and year by location by genotype by trait four-way tables extremely easy, informative, and enjoyable. This paper will review the basics of biplot analysis and its applications in crop breeding as facilitated by GGEbiplot. The purpose is not to give
8
2005 Eastern Wheat Workers / Southern Small Grain Workers Conference
an exhausted review of the biplot analysis literature; rather, it is to provide an outlook of, and a workable guide to, biplot analysis of breeding related data. The order of description is mostly a conceptual reconstruction rather than a historical narration, and references are cited only when necessary.
Principles of biplot analysis Biplot and its inner-product property Mathematically, a biplot may be regarded as a graphical display of matrix multiplication. Given a matrix G with m rows and r columns, and a matrix E with r rows and n columns, they can be multiplied to result in a third matrix P with m rows and n columns. If r = 2, then matrix G can be displayed as m points in a 2-D plot, with the 1 PPP
stPPP column as the
abscissa (x-axis) and 2PPP
ndPPP column as the ordinate (y-axis). Similarly, matrix E can be
displayed as n points in a 2-D plot, with the 1PPP
stPPP row as the abscissa and 2 PPP
ndPPP row as the
ordinate. A 2-D biplot is formed if the two plots are superimposed, which would contain m + n points. An interesting property of this biplot is that it not only displays matrices G and E, but also implies matrix P, because each element of P is:
jijijijiij EGyyxxp θcos=+= [1]
where iG is the vector length of Gi, i.e., the distance from the biplot origin to Gi, jE is
the vector length of Ej, and ijθ is the angle between iG and jE . Equation [1] is referred to as the “inner-product” property. It is the most important principle of biplot analysis, whereby matrix P can be visualized in various ways, including ranking the rows relative to any column, ranking the columns relative to any row, comparing any two rows relative to individual columns, comparing any two columns relative to individual rows, identifying the rows with largest values for each column, or vice versa (Yan and Kang, 2003).
Singular value decomposition The practical application of a biplot in data analysis was put most clearly by the founder of biplot (Gabriel, 1971): “any two-way table can be graphically analyzed using a 2-D biplot as soon as it can be sufficiently approximated by a rank-2 (i.e., r = 2) matrix.” Given a genotype by environment two-way table P of m genotypes and n environments, biplot analysis starts with its decomposing into three matrices, via Singular Value Decomposition (SVD):
T
rnrkrmnm ELGP ,,,, = ),min( nmr ≤ [2]
where G is a m row by r column matrix, which characterizes the m genotypes by r eigenvectors; and E is an r row by n column matrix, which characterizes the n environments by r eigenvectors; and L is a diagonal matrix containing r singular values. In summation notation, SVD decomposes P into r principal components (PC), each
containing a genotype vector ( iξ ), an environment vector ( jη ), and a singular value (λ ):

9
2005 Eastern Wheat Workers / Southern Small Grain Workers Conference
∑=
=r
lljlilijp
1
ηλξ 1+≥ ll λλ [3]
where r is rank of the two-way table, i.e., the number of PC required to fully represent P,
with ),min( nmr ≤ . λl is the singular value for PCl, and 2lλ is the eigenvalue, i.e., the sum
of squares explained by PCl. When r = 2, the two-way table P is said to be a rank-2 matrix and can be exactly displayed in a 2-D biplot. The goodness of fit of a 2-D biplot
for P is measured by the ratio ).../()( 222
21
22
21 rλλλλλ ++++ . Because the PC’s are
arranged such that 1+≥ ll λλ , a 2-D biplot of PC1 vs. PC2 always displays the most important patterns of P, even if the goodness of fit is relatively poor. A poor fit implies that P has complicated patterns that require more than two PC’s to present; an extremely poor fit may suggest that there are no discernible patterns at all.
Singular value partitioning The singular values must be partitioned into the genotype and environment eigenvectors before a biplot can be constructed to approximate the two-way table:
∑∑=
−
=
==r
llj
fl
flil
r
lljilijp
1
1
1
** ))(( ηλλξηξ [4]
where f is the partitioning factor, which can be anything between 0 and 1, resulting an unlimited number of ways to singular value partitioning. Among these, two methods are particularly useful.
Column-metric preserving When f = 0, the singular values are entirely partitioned into the column (environment) eigenvectors, referred to as column-metric preserving. Since E* = LE = PPPP
TPPPP, which is the
“variance” matrix of P, this partitioning recovers the covariance among column factors and is, therefore, appropriate for studying the relationships among column factors.
Row-metric preserving When f = 1, the singular values are entirely partitioned into the row eigenvectors, called row-metric preserving. Since G* = GL = PP PPP
TPPP, which is the “form” of matrix P, this
partitioning recovers the Euclidean distance among row factors and is appropriate for visualizing the similarity/dissimilarity among row factors.
Symmetric partitioning A commonly used singular value partitioning method is f = 0.5, referred to as symmetric scaling. It is an approximation of both the row-metric preserving and the column-metric preserving but is not ideal for studying either the similarity among row factors or the relationship among the column factors.
Once the singular values are appropriately partitioned, a 2-D biplot can be generated by
plotting *1iξ against
*2iξ for the m row factors and plotting
*1 jη against
*2 jη for the n
column factors, whereby various questions about the two-way table can be visually examined. All three singular value partitioning methods are built in GGEbiplot.

10
2005 Eastern Wheat Workers / Southern Small Grain Workers Conference
Data centering In a genotype by environment two-way data Y, the value of genotype i in environment j
can be regarded as the grand mean (µ ) modified by the genotype (row) main effect ( iα ),
the environment (column) main effect ( jβ ), and the specific genotype by environment
interaction ( ijφ ), plus any error ( ijε ):
ijijjiijy εφβαµ ++++= The matrix P that is subjected to SVD (equation [3]) can be any of part of Y:
ijjiijij yp φβαµ +++== (Original data) [4]
ijjiijij yp φβαµ ++=−= (Global centered) [5]
ijjiijij yp φβαµ +=−−= (Genotype-centered) [6]
ijijijij yp φαβµ +=−−= (Environment-centered) [7]
ijjiijij yp φβαµ =−−−= (Double-centered) [8]
Obviously, biplots based on different models (equation 4-8) has different interpretations. All models are useful, depending on the research purposes and the questions one wish to address. If one is interested in only in the genotype by environment interactions (GE), equation 8 should be the choice. If one is interested in cultivar evaluation, equation 7 is most appropriate, as it contains both the genotype main effects (G) and GE. Biplot based on Equation 7 is referred to as “GGE biplot”, which is particularly useful in genotype by environment data analysis (Yan et al. 2000). If one is interested in graphically displaying the data per se, equation 4 should be the choice. All centering methods are built in GGEbiplot, along with various data scaling (standardization) and transformation options.
Data scaling The GGE biplot model (Equation [7]) can be more generally presented as:
jijijjijij ssyp /)(/)( φαβµ +=−−= [9]
where js is a scaling factor. Thus, there can be different GGE models, depending how js is defined. Equation [7] is a special case of equation [9] with js = 1. When js refers to
the standard deviation for column j, the data is said to be ‘standardized’ such that all
columns are given the same weight (importance). When js is the standard error within column (environment or trait) j, any heterogeneity among columns will be (supposedly) removed.
11
2005 Eastern Wheat Workers / Southern Small Grain Workers Conference
Four questions to be asked before trying to interpret a biplot To correctly interpret a biplot, four questions have to be asked. First, what is the model on which the biplot is generated? That is, how the data is centered and scaled? This determines what kind of questions can be asked. For example, it is not possible to visualize genotype main effects in a biplot that contains only GE. Second, how singular values are partitioned? This again determines if certain relationships can be visualized. For example, the relationships among environments cannot be accurately visualized in a GGE biplot that is genotype-metric preserving (row-metric preserving). Third, what is the goodness of fit of the biplot for the table? That is, does the biplot adequately approximate the two-way table? If not, some patterns may not be displayed in the primary biplot (i.e., biplot of PC1 vs. PV2). A secondary biplot (e.g. biplot of PC3 vs. PC4) may be needed to test this. When this is the case, the full data should be divided into subsets based on patterns in the primary biplot and biplot analysis conducted for each subset. Finally, are the axes drawn to scale? If not, the biplot may be misleading. GGEbiplot explicitly addresses these concerns.
Biplot analysis of genotype by environment data Objectives of genotype by environment data analysis Performance trials have to be conducted in multiple environments because of the presence of GE. For the same reason, the analysis of genotype by environment data starts with the examination of GE (Fig. 1). The first question to ask is whether there are significant GE in the data. If no, genotypes can be reliably evaluated in any single environment. If yes, the second question to ask is whether there are important crossovers (i.e., genotype rank changes in different environments so that different winners are picked up in different test environments). If no, genotypes can be evaluated in any of the environments but there exists an environment in which the best genotypes can be most easily identified. If yes, the third question to ask is whether the crossover GE patterns are repeatable across years. Apparently, data from multiple years are necessary to address this question. If the answer is yes, then the target environment should be divided into different mega-environments and genotype evaluation should be conducted for each mega-environment separately. Dividing the target environment into meaningful mega-environment is the only way to utilize GE (Yan and Tinker, 2005). If the answer is no, the target environment is a single mega-environments with complex GE. For a single mega-environment, the objectives of data analysis are two-fold: genotype evaluation to identify genotypes with both high performance and high stability, and test environment evaluation to identify test environments that are both informative and representative. In addition, whenever there is significant GE, one should ask what have caused the GE.
Therefore, genotype by environment data analysis should address the following questions:
1) Can the target environment be divided into meaningful mega-environments? This is the only way whereby GE can be explored. Multi-year data are essential to address this question,
2) What are the causes of GE? Data on genetic and environmental covariates are essential to address this question.

12
2005 Eastern Wheat Workers / Southern Small Grain Workers Conference
3) Which test environments are better? (they should representative, discriminating, and unique)
4) Which cultivars are superior? (High and stable performance across environments)
GGE biplot analysis implemented by the GGEbiplot software can help address these questions easily and effectively.
Figure 1. Objectives of multi-environment trial data analysis
Understanding the environments Relationships among test environments
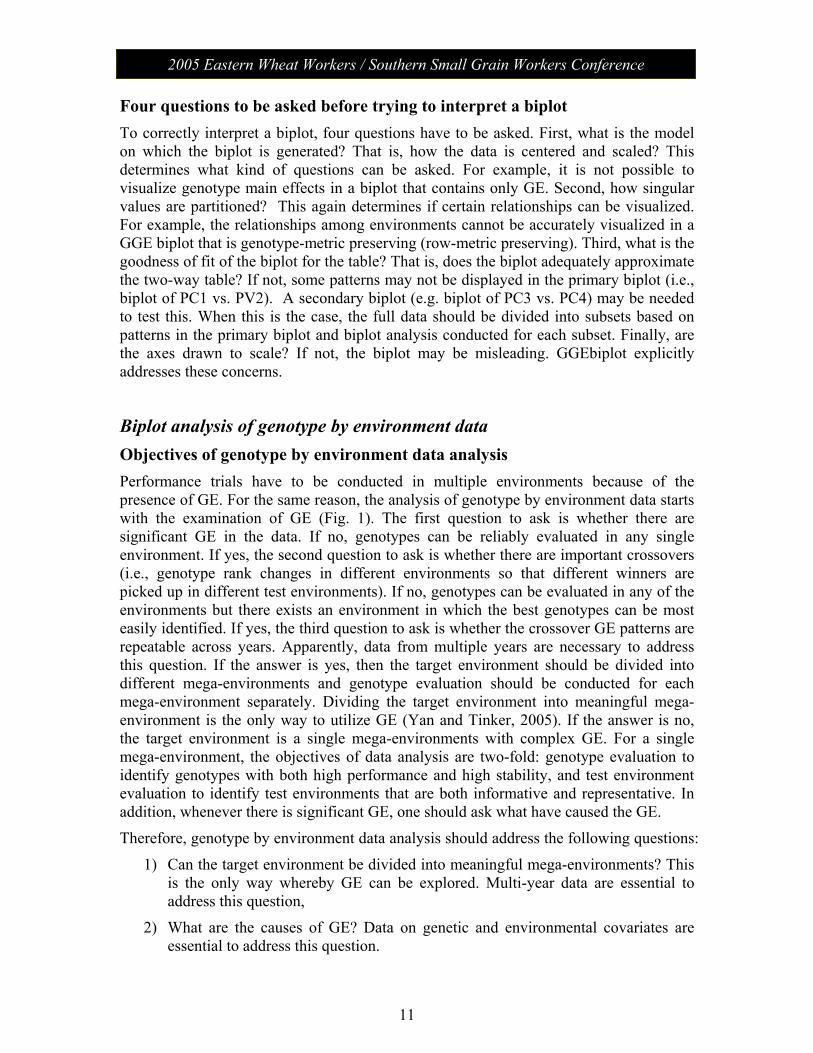
Figure 2 is the GGE biplot for the yield data of an Ontario winter wheat multi-location trial, in which 18 genotypes (G1 to G18) were tested at 9 locations (E1 to E9). It is based on environment-centered (scaling = 2) G by E table without any scaling (scaling = 0), and it is environment-metric preserving (SVP = 2). It explained 78% of the two-way table. Its axes are drawn to scale as always if generated using GGEbiplot. Assuming that it adequately approximated the environment-centered two-way table, Figure 2 can be interpreted as follows.
13
2005 Eastern Wheat Workers / Southern Small Grain Workers Conference
1) The cosine of the angle between the vectors of two environments approximates the correlation between them. For example, E7 and E5 were positively correlated whereas E7 and E8 were slightly negatively correlated.
2) If two test environments are closely correlated consistently across years, removing one of them would not lead to any loss of information.
3) Negative correlations among test environment are an indication of strong crossover GE.
4) The distance between two environments measures their similarity in discriminating the genotypes. Thus the 9 environments fell into two apparent groups: E7 and E5 were similar whereas the other environments were similar.
5) This pattern suggests possible existence of different mega-environments. Multi-year data are required to test this hypothesis, i.e., to see if this pattern is repeatable (Yan et al., 2000). E7 and E5 happened to be from eastern Ontario whereas the others except E1 were from southern Ontario.
Discriminative-ness of test environments 1) The lines that connect the test environments to the biplot origin are called
environment vectors. The length of the vectors approximates the standard deviation within the respective environments, which is a measure of the discriminating ability of the environments. Therefore, E7 and E5 were most discriminating (informative) and E8 least discriminating.
2) Test environments that are consistently non-discriminating (non-informative) provide no information on the genotypes and therefore should not be used as test environments.
14
2005 Eastern Wheat Workers / Southern Small Grain Workers Conference
Figure 2. Similarity among test environments in discriminating genotypes.
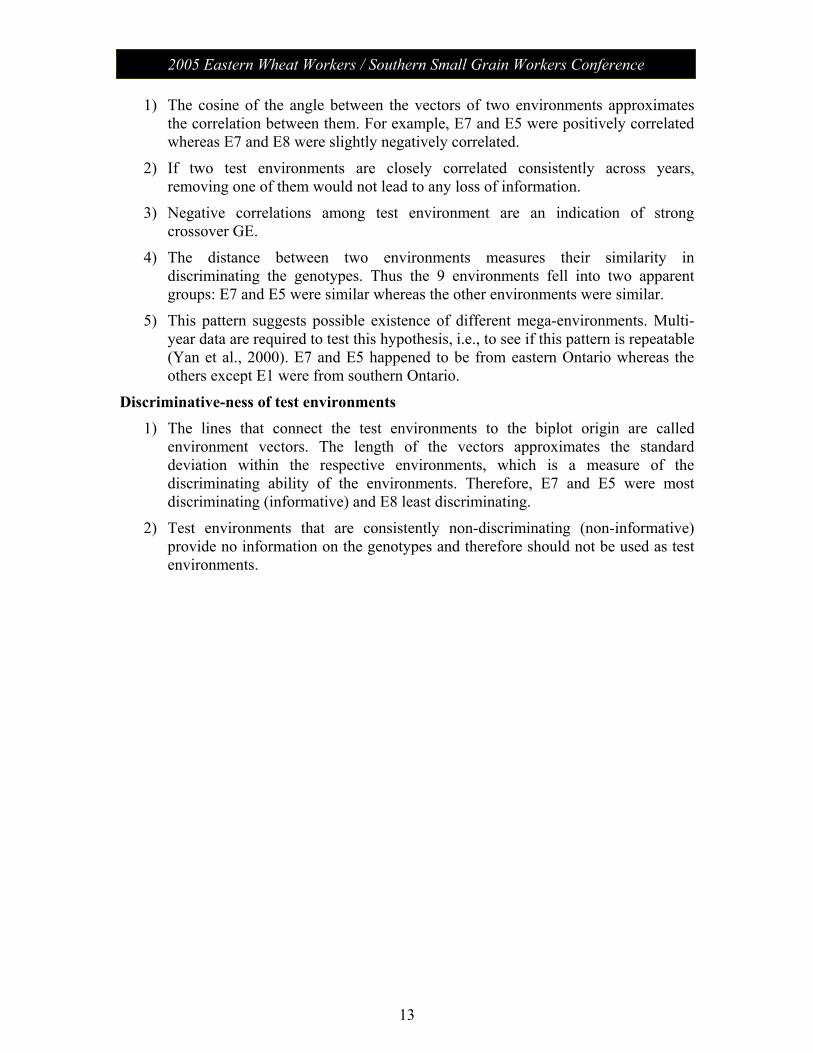
Representativeness of the test environments Figure 3 is the same as Figure 2 except that an “Average-Environment Axis” (AEA, or average-tester-axis, Yan 2001) is added. The average environment has the average coordinates of all test environments, and AEA is the line that passes through the average environment and the biplot origin. Figure 3 can be interpreted as follows:
1) A test environment that has a smaller angle with the AEA is more representative of the target environment. Thus, E1 is most representative whereas E7 and E8 least representative.
2) Discriminating and representative test environments (e.g., E1) are good test environments for selecting generally adapted genotypes.
3) Discriminating but non-representative test environments (e.g. E7 and E8) are useful for selecting specifically adapted genotypes if the target environments can be divided into mega-environments.
4) Discriminating but non-representative test environments (e.g. E7 and E8) are also useful for culling unstable genotypes if the target environment is a single mega-environment.
15
2005 Eastern Wheat Workers / Southern Small Grain Workers Conference
5) Non-discriminating test environments are useless.
Figure 3. Discriminative-ness and representativeness of the test environments.
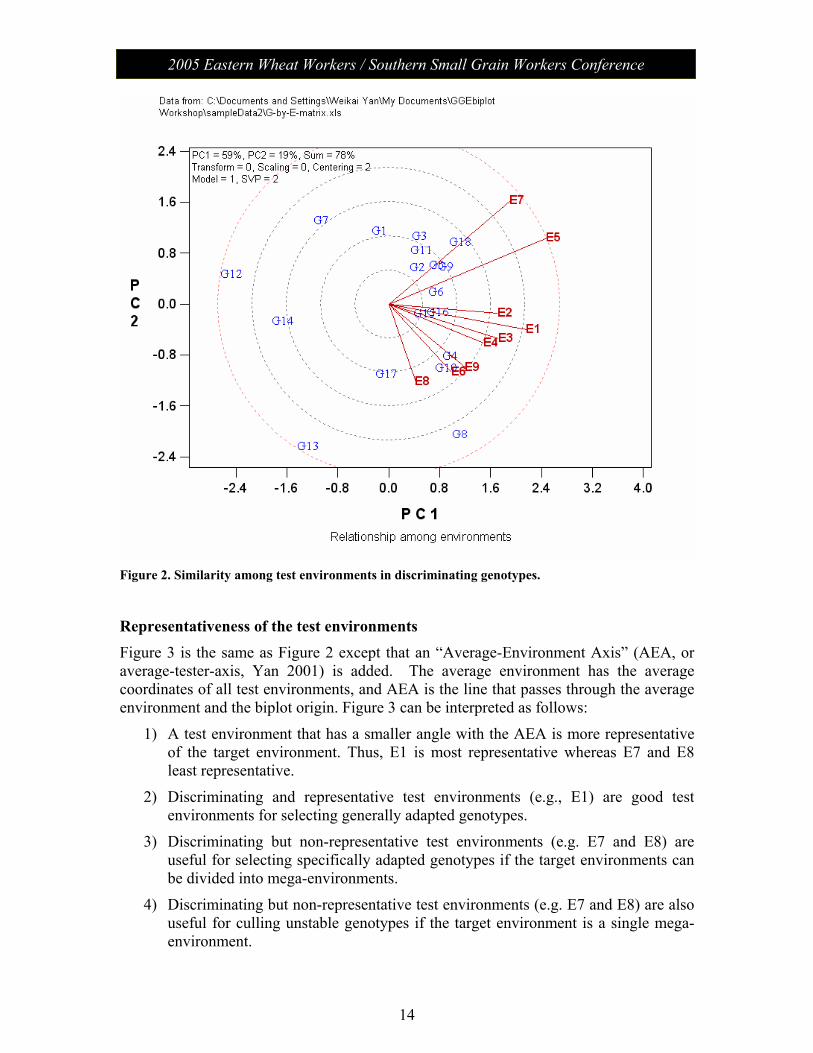
Ideal test environments for selecting high mean performance genotypes The ideal test environment should be most discriminating (informative) and most representative. Figure 4 defines an “ideal test environment”, which is the center of the concentric circles. E1 is closest to it and is, therefore, most ideal, whereas E1 and 5 were least ideal, among all test environments, for selecting cultivars adapted to the whole region. Note but, an ideal test location or environment can be announced as “ideal” only if it is so across years.

16
2005 Eastern Wheat Workers / Southern Small Grain Workers Conference
Figure 4. Best test environments based on discriminative-ness and representativeness.
Understanding the genotypes Similarity among genotypes Figure 5 is the same GGE biplot as above except that it is genotype-metric preserving (SVP = 1) and is, therefore, appropriate for genotype evaluations. It has the following interpretations.
1) The length of the genotype vectors, which are lines connecting the genotypes to the biplot origin, measures the differences of the genotype from the grand mean. Genotypes with long vectors are either the best (e.g., G8) or poorest (e.g., G12) in one or more environments; genotypes located near the biplot origin are close to average in all environments.
2) The cosine of the angle between the vectors of two genotypes measures their similarity in response to (interaction with) the environments, i.e., in specific adaptations.
3) The distance between two genotypes measures their dissimilarity. For example, G8 and G12 are very different whereas G18 and G9 are quite similar.

17
2005 Eastern Wheat Workers / Southern Small Grain Workers Conference
Figure 5. Similarity among genotypes.
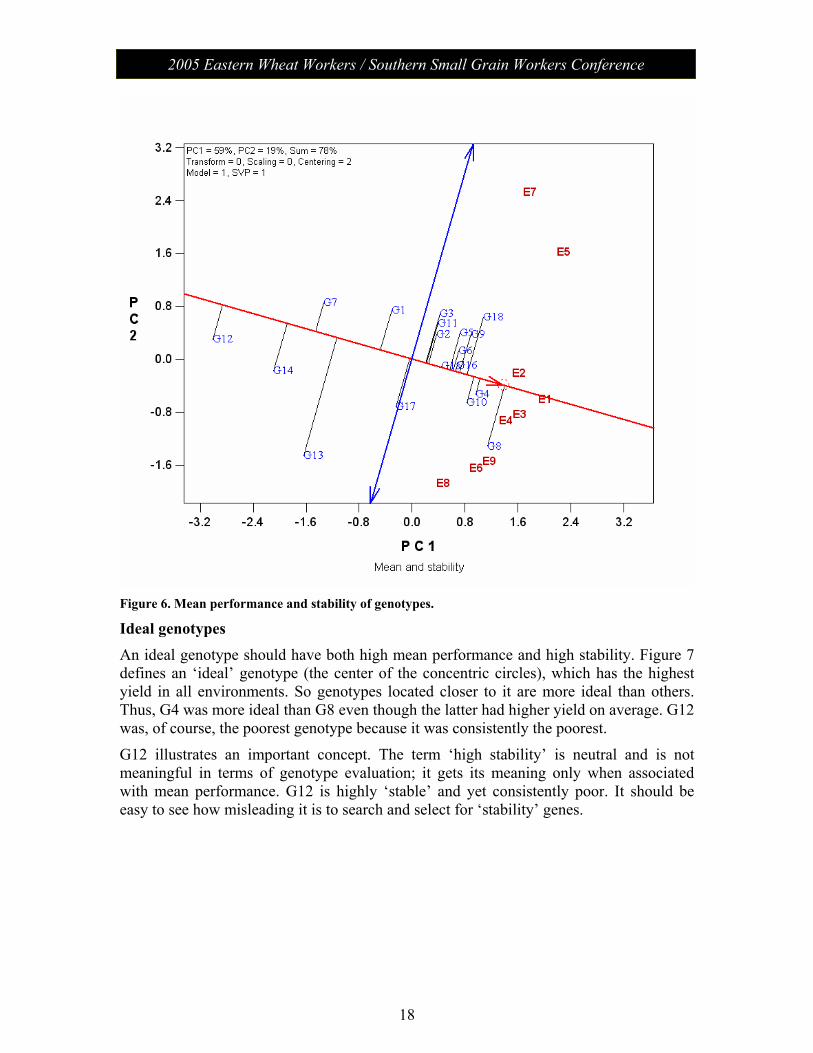
Mean performance and stability of the genotypes In a single mega-environment, genotypes should be evaluated on both mean performance and stability across environments. Figure 6 is the average-environment coordination (AEC) view of the GGE biplot with the following interpretations:
1) The AEA (the single-arrowed line) points to higher average yield. Thus G8 had the highest mean yield, followed by G4, G10, etc.; G17 had a mean yield similar to the grand mean, and G12 had the lowest mean yield.
2) The double-arrowed line is the AEC ordinate; it points to greater variability (smaller stability) in either direction. Thus, G13 was highly unstable whereas G4 was highly stable.
3) G13 was highly unstable because it had lower than expected yield in environments E7 and E5 but higher than expected yield in E8, E6, E9, etc. Its yield in E1 and E2 was just as expected from its average yield.
18
2005 Eastern Wheat Workers / Southern Small Grain Workers Conference
Figure 6. Mean performance and stability of genotypes.
Ideal genotypes An ideal genotype should have both high mean performance and high stability. Figure 7 defines an ‘ideal’ genotype (the center of the concentric circles), which has the highest yield in all environments. So genotypes located closer to it are more ideal than others. Thus, G4 was more ideal than G8 even though the latter had higher yield on average. G12 was, of course, the poorest genotype because it was consistently the poorest.
G12 illustrates an important concept. The term ‘high stability’ is neutral and is not meaningful in terms of genotype evaluation; it gets its meaning only when associated with mean performance. G12 is highly ‘stable’ and yet consistently poor. It should be easy to see how misleading it is to search and select for ‘stability’ genes.

19
2005 Eastern Wheat Workers / Southern Small Grain Workers Conference
Figure 7. Ideal genotypes based on both mean performance and stability across environments.
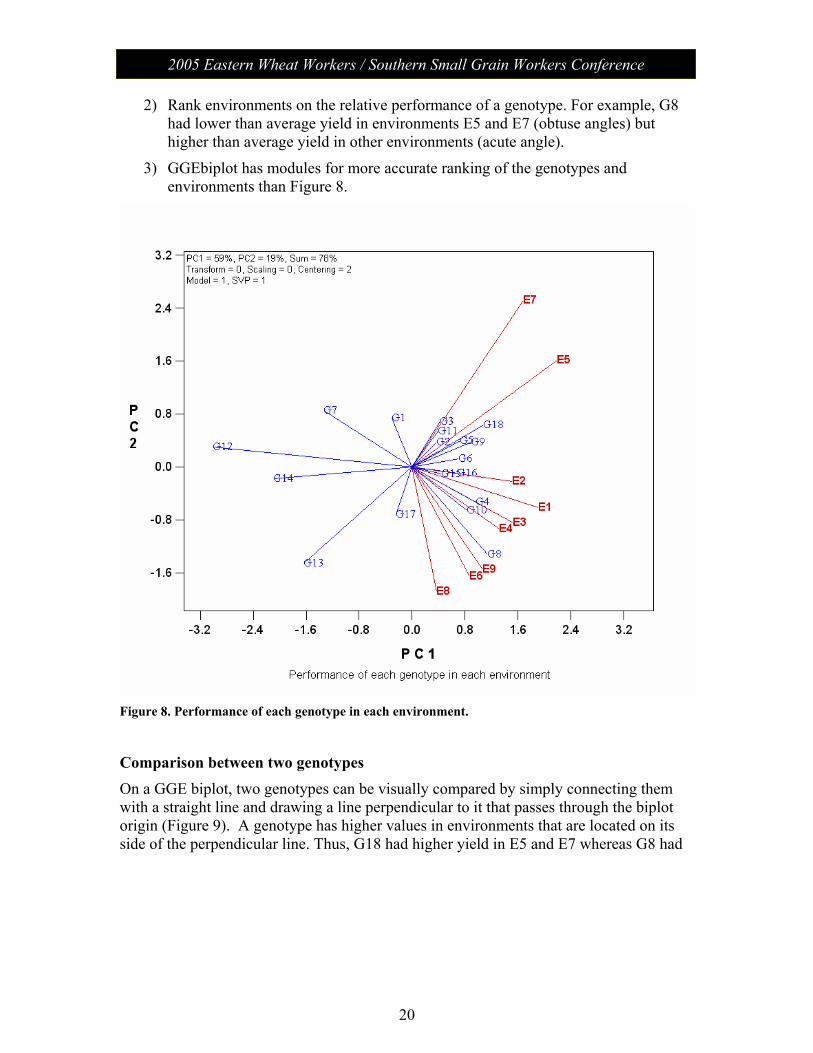
Performance of each genotype in each environment Both the genotype vectors and the environment vectors are drawn in Figure 8 so that the specific interactions between a genotype and an environment can be visualized. The interpretation rule is: the performance of a genotype in an environment is better than average if the angle between its vector and the environment vector is <90°; it is poorer than average if the angle is >90°; and it is average if the angle is 90°. The angle determines the direction of the interaction; the magnitude of the interaction is determined by both the cosine of the angle and the vector length. This can be used to:
1) Rank genotypes based on performance in an environment. For example, in E8, genotypes G8, G17, G10, G4, G13, G15, and G16 had higher than average performance, with G8 the highest (acute angles). G14 and G6 had near average performance (right angles). G7, G1, G3, etc., had lower-than-average yield (obtuse angles).
20
2005 Eastern Wheat Workers / Southern Small Grain Workers Conference
2) Rank environments on the relative performance of a genotype. For example, G8 had lower than average yield in environments E5 and E7 (obtuse angles) but higher than average yield in other environments (acute angle).
3) GGEbiplot has modules for more accurate ranking of the genotypes and environments than Figure 8.
Figure 8. Performance of each genotype in each environment.
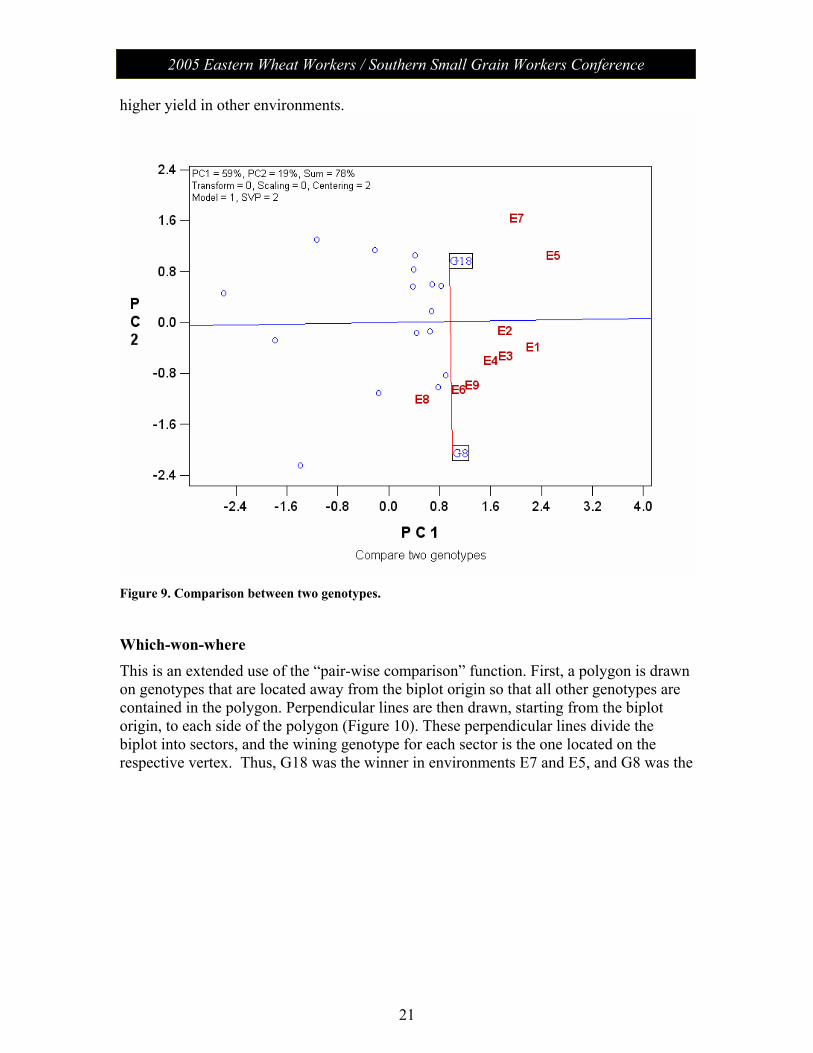
Comparison between two genotypes On a GGE biplot, two genotypes can be visually compared by simply connecting them with a straight line and drawing a line perpendicular to it that passes through the biplot origin (Figure 9). A genotype has higher values in environments that are located on its side of the perpendicular line. Thus, G18 had higher yield in E5 and E7 whereas G8 had
21
2005 Eastern Wheat Workers / Southern Small Grain Workers Conference
higher yield in other environments.
Figure 9. Comparison between two genotypes.
Which-won-where This is an extended use of the “pair-wise comparison” function. First, a polygon is drawn on genotypes that are located away from the biplot origin so that all other genotypes are contained in the polygon. Perpendicular lines are then drawn, starting from the biplot origin, to each side of the polygon (Figure 10). These perpendicular lines divide the biplot into sectors, and the wining genotype for each sector is the one located on the respective vertex. Thus, G18 was the winner in environments E7 and E5, and G8 was the

22
2005 Eastern Wheat Workers / Southern Small Grain Workers Conference
winner for the other environments.
Figure 10. The polygon view of GGE biplot to show which genotypes won in which environments.
Biplot analysis of genotype by trait data When multiple genotypes are measured for multiple traits, the result is a genotype by trait two-way table. The model for biplot analysis of genotype by trait data is SVD of trait-standardized two-way table, i.e., equation [9] with sj being the standard deviation for trait j. Most of the methods described for analyzing genotype by environment tables are applicable to genotype by trait data analysis. Biplot analysis can help understand the relationships among traits and the trait profiles (strength and weakness) of the genotypes. In this section, only two practical utilities of biplot analysis are presented that are particular to genotype by trait data: 1) select for parents, and 2) independent culling.
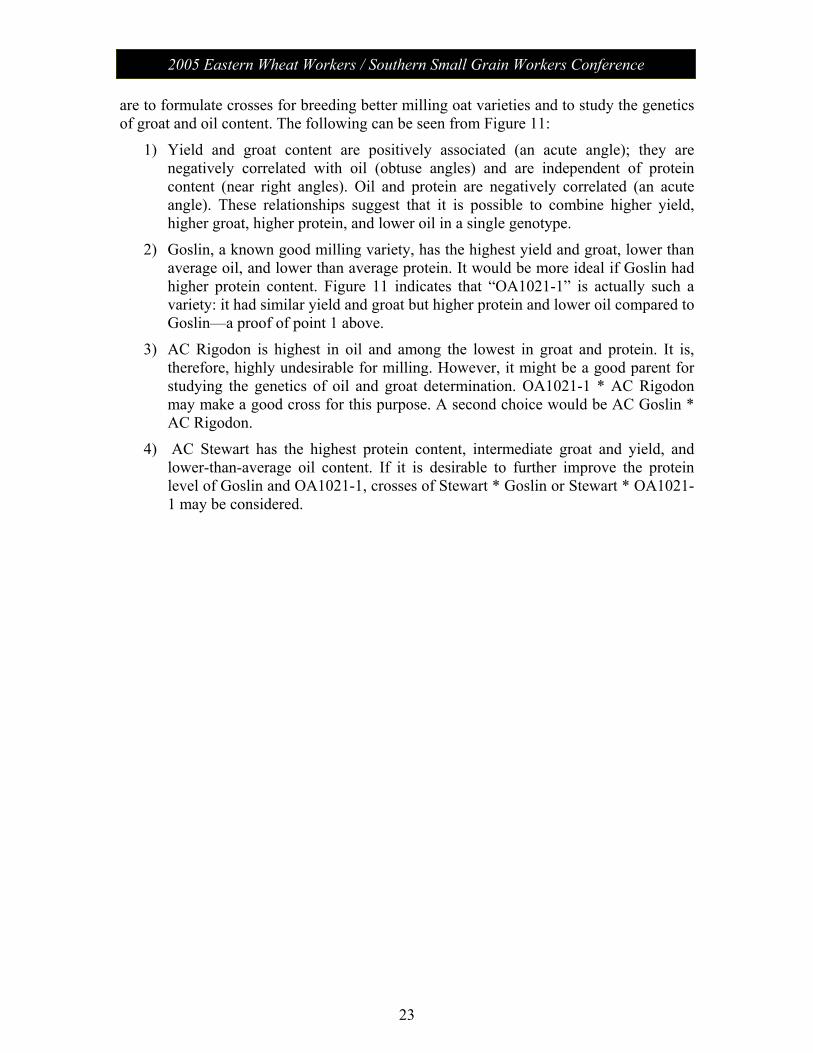
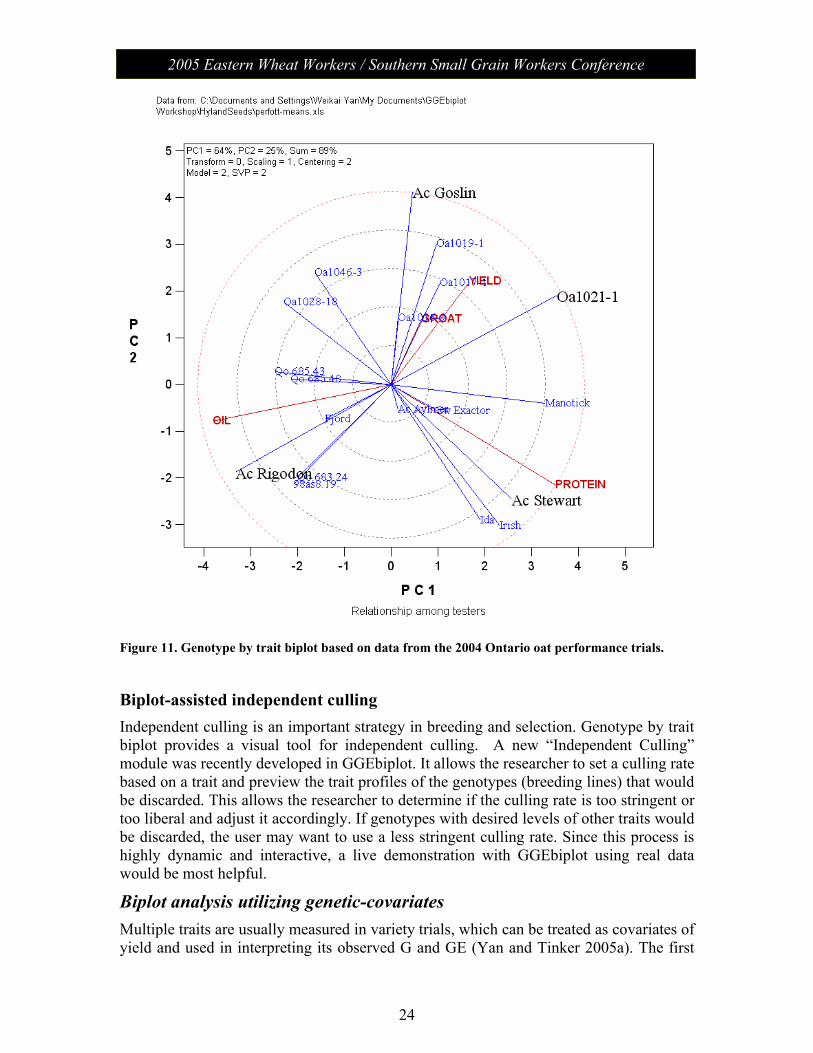
Biplot assisted parent selection for breeding or genetic research The biplot in Figure 11 presents data of 20 oat varieties measured for four traits: yield, groat content, oil, and protein concentration. It is trait-metric preserving (SVP = 2) and is, therefore, appropriate for visualizing relationships among the traits. Higher yield, groat, and protein and lower oil are desirable for milling oats, and the purposes of this exercise
23
2005 Eastern Wheat Workers / Southern Small Grain Workers Conference
are to formulate crosses for breeding better milling oat varieties and to study the genetics of groat and oil content. The following can be seen from Figure 11:
1) Yield and groat content are positively associated (an acute angle); they are negatively correlated with oil (obtuse angles) and are independent of protein content (near right angles). Oil and protein are negatively correlated (an acute angle). These relationships suggest that it is possible to combine higher yield, higher groat, higher protein, and lower oil in a single genotype.
2) Goslin, a known good milling variety, has the highest yield and groat, lower than average oil, and lower than average protein. It would be more ideal if Goslin had higher protein content. Figure 11 indicates that “OA1021-1” is actually such a variety: it had similar yield and groat but higher protein and lower oil compared to Goslin—a proof of point 1 above.
3) AC Rigodon is highest in oil and among the lowest in groat and protein. It is, therefore, highly undesirable for milling. However, it might be a good parent for studying the genetics of oil and groat determination. OA1021-1 * AC Rigodon may make a good cross for this purpose. A second choice would be AC Goslin * AC Rigodon.
4) AC Stewart has the highest protein content, intermediate groat and yield, and lower-than-average oil content. If it is desirable to further improve the protein level of Goslin and OA1021-1, crosses of Stewart * Goslin or Stewart * OA1021-1 may be considered.
24
2005 Eastern Wheat Workers / Southern Small Grain Workers Conference
Figure 11. Genotype by trait biplot based on data from the 2004 Ontario oat performance trials.
Biplot-assisted independent culling Independent culling is an important strategy in breeding and selection. Genotype by trait biplot provides a visual tool for independent culling. A new “Independent Culling” module was recently developed in GGEbiplot. It allows the researcher to set a culling rate based on a trait and preview the trait profiles of the genotypes (breeding lines) that would be discarded. This allows the researcher to determine if the culling rate is too stringent or too liberal and adjust it accordingly. If genotypes with desired levels of other traits would be discarded, the user may want to use a less stringent culling rate. Since this process is highly dynamic and interactive, a live demonstration with GGEbiplot using real data would be most helpful.
Biplot analysis utilizing genetic-covariates Multiple traits are usually measured in variety trials, which can be treated as covariates of yield and used in interpreting its observed G and GE (Yan and Tinker 2005a). The first
25
2005 Eastern Wheat Workers / Southern Small Grain Workers Conference
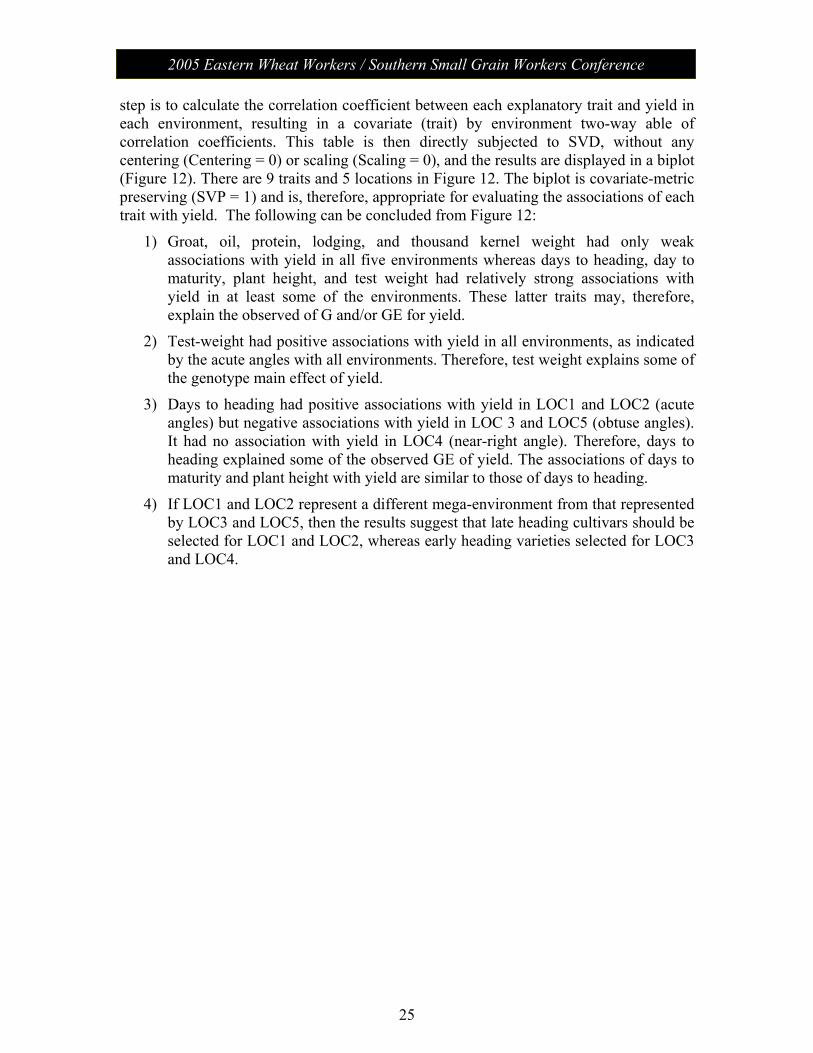
step is to calculate the correlation coefficient between each explanatory trait and yield in each environment, resulting in a covariate (trait) by environment two-way able of correlation coefficients. This table is then directly subjected to SVD, without any centering (Centering = 0) or scaling (Scaling = 0), and the results are displayed in a biplot (Figure 12). There are 9 traits and 5 locations in Figure 12. The biplot is covariate-metric preserving (SVP = 1) and is, therefore, appropriate for evaluating the associations of each trait with yield. The following can be concluded from Figure 12:
1) Groat, oil, protein, lodging, and thousand kernel weight had only weak associations with yield in all five environments whereas days to heading, day to maturity, plant height, and test weight had relatively strong associations with yield in at least some of the environments. These latter traits may, therefore, explain the observed of G and/or GE for yield.
2) Test-weight had positive associations with yield in all environments, as indicated by the acute angles with all environments. Therefore, test weight explains some of the genotype main effect of yield.
3) Days to heading had positive associations with yield in LOC1 and LOC2 (acute angles) but negative associations with yield in LOC 3 and LOC5 (obtuse angles). It had no association with yield in LOC4 (near-right angle). Therefore, days to heading explained some of the observed GE of yield. The associations of days to maturity and plant height with yield are similar to those of days to heading.
4) If LOC1 and LOC2 represent a different mega-environment from that represented by LOC3 and LOC5, then the results suggest that late heading cultivars should be selected for LOC1 and LOC2, whereas early heading varieties selected for LOC3 and LOC4.
26
2005 Eastern Wheat Workers / Southern Small Grain Workers Conference
Figure 12. Explanatory trait by environment biplot to interpret the genotype by location interaction of oat yield.
A more important utility of this approach follow. When the explanatory traits are replaced with genetic markers, the covariate by environment biplot would become a “QQE biplot” (Yan et al. 2005; Yan and Tinker 2005b), which can be used to identify markers with large effect on yield (or other traits) (QTL identification), visualize their effects in individual environments, and study their interactions with the environments. This would help develop strategies for marker-assisted selection specific to individual mega-environments.
Biplot analysis system for genotype by environment by trait three-way data Data from multi-environment trials are typically a genotype by environment by trait three-way table. A three-way MET data can be dissected or re-organized into the various two-way tables, each addressing specific questions:
1) a genotype-by-environment table for each trait, as described above;
2) a genotype-by-trait table in one environment, which can be used to study the phenotypic correlations among traits in an environment;
3) a genotype-by-trait table averaged across a subset of environments, which can be used to study the ‘genetic’ correlations among traits in the selected environments;
4) a genotype-by-trait table averaged across all environments, which can be used to study the ‘genetic’ correlations among traits;
27
2005 Eastern Wheat Workers / Southern Small Grain Workers Conference
5) a trait-by-environment table averaged across all genotypes, which can be used to study environmental correlations among traits;
6) a genotype-environment by trait table, treating each genotype-environment combination as a single observation, which can be used to study phenotypic correlations among traits; and
7) a genotype by trait-environment table, treating each trait-environment combination as a different variable, which can be used in genotype classification.
A full understanding of the three-way MET data involves understanding all of these two-way tables, although they are not equally important for a particular purpose. For example, a production agronomist may be more interested in the phenotypic and environmental correlations among traits whereas a breeder is more interested in the genetic correlations. The 4-way Data Analysis module of GGEbiplot makes MET data analysis very easy (Figure 13).
Figure 13. Options in the 4-way data analysis module of GGEbiplot.
Biplot analysis of other types of plant breeding related data As pointed out by Gabriel (1971), any two-way table can be visually studied using a 2-D biplot if it can be sufficiently approximated by a rank-2 matrix. Other types of breeding related two-way data that can be effectively analyzed using biplots included host variety by pathogen strain data (Yan and Falk 2002) and diallel cross data (Yan and Hunt 2002).
28
2005 Eastern Wheat Workers / Southern Small Grain Workers Conference
GGEbiplot has now a 3-D biplot module which extends biplot analysis of rank-2 matrices to rank -3 matrices.
Conclusions Biplots are a graphical tool for visual analysis of various breeding related two-way data. For genotype by environment data, biplot analysis can help understand the genotypes, their mean performances and stability across environments, and their specific interactions with the environments. Simultaneously, biplots can also help understand the target environment and the test environments. For genotype by trait table, it helps understand the interrelationships among various breeding objectives as well as the trait profiles of the genotypes. This is particularly helpful in early generation selection based on impendent culling and in parent selection for hybridization in breeding and genetics research. Biplot analysis can also make use of genetic covariates in interpreting the observed genotype main effect and the genotype by environment interaction for a given breeding objective. GGE Biplot analysis has become an important tool in plant breeding, and the GGEbiplot software makes biplot analysis easy, informative, and enjoyable.
References Bradu, D, and K.R.Gabriel. 1978. The biplot as a diagnostic tool for models of two-way
tables. Technometrics 20:47-68.
Cooper, M., & DeLacy, I.H. (1994). Relationships among analytic methods used to study genotypic variation and genotype-by-environment interaction in plant breeding Multienvironment experiments. Theoretical and Applied Genetics, 88, 561-572.
Gabriel, K.R. 1971. The biplot graphic display of matrices with application to principal component analysis. Biometrics 58:453-467.
Gauch, H.G. 1992. Statistical Analysis of Regional Yield Trials: AMMI Analysis of Factorial Designs, Elsevier Health Sciences, The Netherlands.
Kempton, R.A. 1984. The use of biplots in interpreting variety by environment interactions. J. Agr. Sci. 103:123-135.
Kroonenberg P.M. 1995. Introduction to biplots for GxE tables. Department of Mathematics, Research Report 51. Australia: Univ. of Queensland. ( TTThttp://three-mode.leidenuniv.nl/document/biplot.pdfTTT)
Yan, W. 2001. TTTGGEbiplot—a Windows application for graphical analysis of multi-environment trial data and other types of two-way dataTTT. Agron J 93(5): 1111-1118.
Yan, W. 2002. TTTSingular value partitioning for biplot analysis of multi-environment trial dataTTT. Agron J 94:990-996.
Yan, W. and D. E. Falk. 2002. TTTBiplot analysis of host-by-pathogen interactionTTT. Plant Disease 86:1396-1401.
Yan, W. and I. Rajcan. 2002. TTTBiplot evaluation of test sites and trait relations of soybean in OntarioTTT. Crop Sci. 42(1): 11-20.
Yan, W. and L. A. Hunt. 2002. TTTBiplot analysis of diallel dataTTT. Crop Sci. 42(1): 21-30.
29
2005 Eastern Wheat Workers / Southern Small Grain Workers Conference
TTTYan, W. and M. S. Kang. 2003 TTT. TTTGGE Biplot Analysis: A Graphical Tool for Breeders, Geneticists, and Agronomists TTT. CRC Press. Boca Raton, FL.
Yan, W. and L. A. Hunt, Q. Sheng, and Z. Szlavnics. 2000. TTTCultivar evaluation and mega-environment investigation based on GGE biplotTTT. Crop Sci. 40(3): 597-605.
Yan, W., and N. A. Tinker. 2005a. An integrated system of biplot analysis for displaying, interpreting, and exploring genotype-by-environment interactions. Crop Science 45(3): in press.
Yan, W. and N. A. Tinker. 2005b. A biplot approach to the investigation of QTL-by-environment patterns. Molecular Breeding 15:31-43.
Yan, W., N. A. Tinker, and D. Falk. 2005. QTL identification, mega-environment classification, and strategy development for marker-based selection using biplots. J. Crop Improvement 14 (1/2): In press

30
2005 Eastern Wheat Workers / Southern Small Grain Workers Conference
31
2005 Eastern Wheat Workers / Southern Small Grain Workers Conference
GrainGenes 2.0: Resources for Small Grains Breeding
David Matthews1, Victoria Carollo2, Gerard Lazo2, Olin Anderson2 1USDA-ARS and Cornell University, Department of Plant Breeding and Genetics
2USDA-ARS, Western Regional Research Center, Albany, CA Introduction GrainGenes, the international database for genetic and genomic data about Triticeae species (e.g. wheat, barley, and rye) and Avena, was extensively redesigned in 2004. As a result it is now much easier to use, both for getting a quick answer to a simple question and for mining the data for new information. Some of the improvements have been designed specifically to address breeders' data needs. Most of these involve tools for identifying markers and alternative markers for desired traits. Another area under development is genotypic data on germplasm lines (their alleles of molecular markers), correlatable to phenotypic data for agronomic and quality traits. Results and Discussion The GrainGenes Database has been running under the ACEDB database management system (DBMS) since 1992. As of 2004 it is now available using the relational DBMS MySQL. Although the changes in the underlying data structure are radical, the new WWW interface software developed as part of the migration project makes it appear 95% similar and familiar to the user, the other 5% being improvements. The new database is at http://wheat.pw.usda.gov. The old one for comparison is at www.graingenes.org. Finding marker(s) for a trait. Known and well-documented molecular markers for important traits, including the MASwheat (http://maswheat.ucdavis.edu/) markers, are available in GrainGenes in the "Trait Marker" Quick Query at http://wheat.pw.usda.gov/-GG2/quickquery.shtml. For barley, a special source of curated markers is in Andy Kleinhofs' binmap database, http://rye.pw.usda.gov/cgi-bin/gbrowse/BarleyBinMaps. QTLs' best markers are usually included as part of the QTL record. The map display of the QTL will show other included markers. Although this quick reference to already-published markers for a desired trait is useful, sometimes the given marker is not ideal for a particular use, e.g. because it is not polymorphic in the parental lines being used, or a PCR-based marker is desired. For example, the GrainGenes "Trait Marker" query shows Xpsr914, an RFLP, as a marker for the AltBH gene for aluminum tolerance in wheat. The database can be mined further for other suitable markers as follows. First, the Locus record for Xpsr914 includes a link "Show Nearby Loci", which generates a table of all loci that are within 10 cM of Xpsr914 on any map (Table 1). In this case a total of 57 such loci are found, including the microsatellite Xwmc513.

32
2005 Eastern Wheat Workers / Southern Small Grain Workers Conference
Table 1. Output from “Show Nearby Loci” for Locus Xpsr914 (excerpt). Query Map Locus Position Distance Xpsr914 Tm-Dubcovsky2-4A Xbcd734 0.7 7.3 Xpsr914 Tm-Dubcovsky2-4A Xcdo541 3.4 4.6 Xpsr914 Tm-Dubcovsky2-4A Xwg464 4.1 3.9 Xpsr914 Tm-Dubcovsky2-4A Xpsr914 8 0.0 Xpsr914 Tm-Dubcovsky2-4A XksuH9-4A 8 0.0 Xpsr914 Tm-Dubcovsky2-4A Xpsr1051 15.3 7.3 Xpsr914 Tm-Dubcovsky2-4A XksuG10 15.3 7.3 Xpsr914 Tm-Dubcovsky2-4A Xmwg2180 16.3 8.3 Xpsr914 Wheat-Composite2004-4A Xglk752 80 3.0 Xpsr914 Wheat-Composite2004-4A Xgwm397b 81 2.0 Xpsr914 Wheat-Composite2004-4A Xglk315 81 2.0 Xpsr914 Wheat-Composite2004-4A Xpsr59a 82 1.0 Xpsr914 Wheat-Composite2004-4A Xpsr914 83 0.0 Xpsr914 Wheat-Composite2004-4A Xwmc513 83 0.0 Xpsr914 Wheat-Composite2004-4A Xcsl102(NBS-LRR) 84 1.0 Xpsr914 Wheat-Composite2004-4A Xglk331 85 2.0
The "Show Nearby Loci" feature currently examines only those maps in which the queried Locus's name was published exactly as given, not other maps using variant names. The Probe report for Probe PSR914 shows three other Locus names of interest, Xpsr914-4A, Xpsr914-4B, and Xpsr914-4D, each with a separate GrainGenes Locus report and link to "Show Nearby Loci". To handle variant Locus names more conveniently, GrainGenes has added a feature called the Marker report. This report encompasses all the information about the named Probe (or Gene) plus all its corresponding mapped Loci. The Marker report for PSR914 for example provides links to "Show Nearby Loci" for all four of the Xpsr914 variant locus names. See http://wheat.pw.usda.gov/cgi-bin/graingenes/report.cgi?class=marker&name=PSR914. In cases where no suitable marker is found by this procedure, the database can be mined more deeply in at least two ways. First, one of the nearby but unsuitable markers can be used as the starting point for another set of "Show Nearby Loci" explorations. For this purpose it is useful to select a marker that has been included in many maps. An example in this case might be XksuH9-4A, and the Marker report for the corresponding Probe pTtksuH9 (see Table 1). Second, the CMap comparative map viewer, http://rye.pw.usda.gov/cmap, can be used to visualize common markers between a map the initial marker is on and some other map in the database, preferably one containing a large number of markers. One good choice for this purpose would be Rudi Appels' Wheat Composite map. A database for genotyping and phenotyping data. A new area of development for GrainGenes is the creation of an appropriate schema and interface for data on molecular polymorphisms of germplasm lines. The current prototype, "Grainotypes", can be seen at http://rye.pw.usda.gov/-grainotypes2/tour.html. It currently holds a set of SSR allele data for 74 barley lines. The Germplasm report for each line lists the allele (amplified fragment size) it possesses
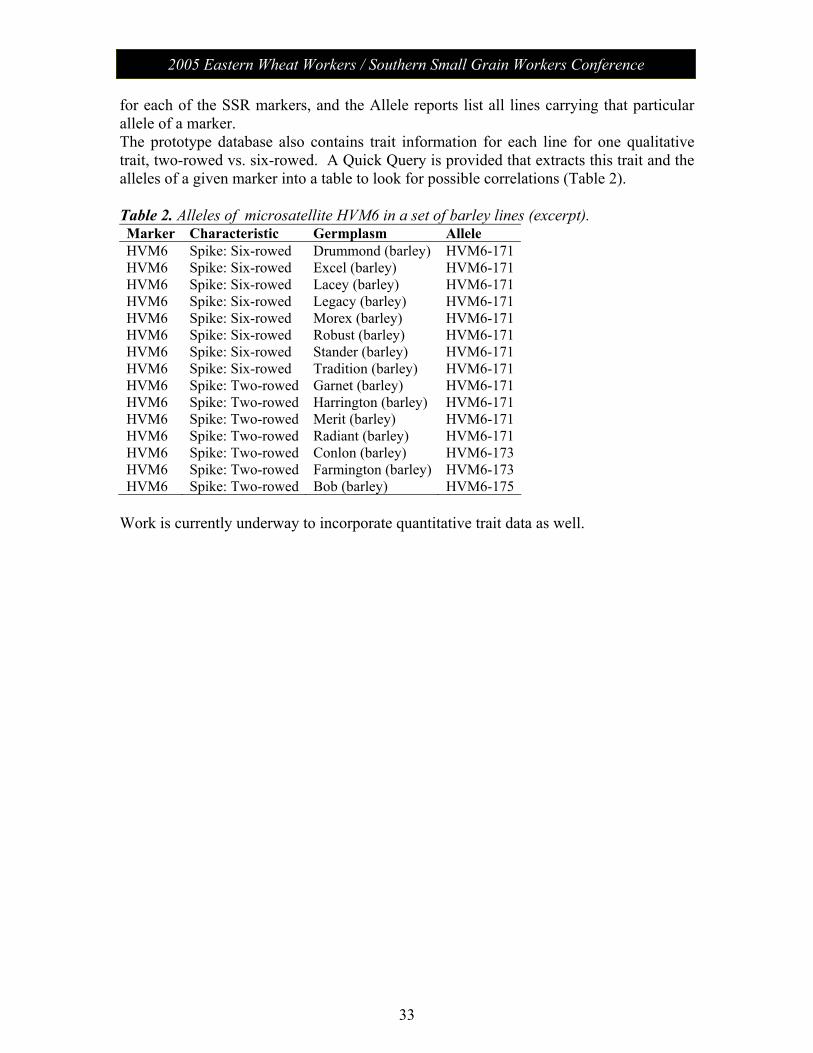
33
2005 Eastern Wheat Workers / Southern Small Grain Workers Conference
for each of the SSR markers, and the Allele reports list all lines carrying that particular allele of a marker. The prototype database also contains trait information for each line for one qualitative trait, two-rowed vs. six-rowed. A Quick Query is provided that extracts this trait and the alleles of a given marker into a table to look for possible correlations (Table 2). Table 2. Alleles of microsatellite HVM6 in a set of barley lines (excerpt). Marker Characteristic Germplasm Allele HVM6 Spike: Six-rowed Drummond (barley) HVM6-171HVM6 Spike: Six-rowed Excel (barley) HVM6-171HVM6 Spike: Six-rowed Lacey (barley) HVM6-171HVM6 Spike: Six-rowed Legacy (barley) HVM6-171HVM6 Spike: Six-rowed Morex (barley) HVM6-171HVM6 Spike: Six-rowed Robust (barley) HVM6-171HVM6 Spike: Six-rowed Stander (barley) HVM6-171HVM6 Spike: Six-rowed Tradition (barley) HVM6-171HVM6 Spike: Two-rowed Garnet (barley) HVM6-171HVM6 Spike: Two-rowed Harrington (barley) HVM6-171HVM6 Spike: Two-rowed Merit (barley) HVM6-171HVM6 Spike: Two-rowed Radiant (barley) HVM6-171HVM6 Spike: Two-rowed Conlon (barley) HVM6-173HVM6 Spike: Two-rowed Farmington (barley) HVM6-173HVM6 Spike: Two-rowed Bob (barley) HVM6-175
Work is currently underway to incorporate quantitative trait data as well.

34
2005 Eastern Wheat Workers / Southern Small Grain Workers Conference

35
2005 Eastern Wheat Workers / Southern Small Grain Workers Conference
Integrating Marker-Assisted Selection into Conventional Wheat Breeding Programs
Gina Brown-Guedira
USDA/ARS Plant Science Research Unit, Dept. of Crop Science, North Carolina State University, Raleigh, NC 27606
Introduction The advent of DNA marker technology has the potential to improve gain from selection in plant breeding programs. In the literature, one can find very optimistic views of the impact of this technology such as that expressed by Peleman & Van der Voort (2003) “[We can] control all allelic variation for all genes of agronomic importance… through a combination of precise genetic mapping, high-resolution chromosome haplotyping and extensive phenotyping.” and ones that are less enthusiastic : “molecular markers have had little impact on crop improvement despite hundreds of published QTL experiments during the last 10 years” (Beavis, 1998). In reality, the current utilization and potential impact of marker technology is probably somewhere between these extremes. Plant breeders have always recognized the potential of new technology and small grains breeders in the US have recently worked together to obtain substantial funds to incorporate markers into conventional breeding programs. As we attempt to integrate the ARS genotyping centers into cultivar development programs and implement marker-assisted selection in wheat, it is appropriate to briefly review the theory behind MAS and discuss use of the molecular markers currently available in wheat. When is MAS appropriate? When considering how to apply MAS in a breeding program, it is important to determine when indirect selection for DNA markers is likely to be more effective than direct phenotypic selection. To evaluate the relative effectiveness of indirect selection using markers, one needs to consider (1) degree of linkage disequilibrium between the marker and trait, (2) the heritability of the target trait(s) under indirect selection, (3) the generation at which genotypic vs phenotypic selection can be applied, and (4) the costs of genotypic vs phenotypic evaluation. Linkage Marker-assisted selection is more effective when there is little recombination between the marker(s) and gene. Plant breeders make hundreds of crosses each year and the best markers for high-throughput selection will be useful in any cross to an appropriate donor source. Markers developed from the causal gene sequence are generally diagnostic in all populations. The dwarfing genes Rht-B1 and Rht-D1, leaf rust resistance gene Lr21, the waxy genes, and the purolindoline genes (Pina-D1 and PinbD1) are cloned wheat genes for which markers are available that can be readily assayed by PCR. Primers are also available for the identification of the HMW glutenin alleles on chromosome 1DL. Although the reported primers do not detect all alleles at the locus, we have used them to identify HWW cultivars having subunits 5 + 10.
36
2005 Eastern Wheat Workers / Southern Small Grain Workers Conference
Diagnostic markers are also available for many genes that have been transferred to wheat from alien species in the form of translocations. Because the translocated segments do not recombine with the wheat homoeolog, linkage disequilibrium is maintained for marker alleles on the alien segment and the target gene(s). Although in some cases undesirable linkage drag is associated with these translocations, MAS is very effective since the markers are essentially “perfect”. A list of genes from alien species for which PCR markers are available that can be evaluated at the genotyping center at Raleigh is available at http://www.cropsci.ncsu.edu./SGgenotyping. Polymorphism The usefulness of a marker in soft winter wheat will depend on the frequency of the target allele in the germplasm pool. The high levels of marker polymorphism observed between the diploid and tetraploid relatives of cultivated wheat have contributed to the identification of markers linked to several genes transferred to wheat from progenitor species (see list at http://www.cropsci.ncsu.edu./SGgenotyping). In most cases, markers linked to these introgressed genes are polymorphic with common wheat genotypes (but not in all cases). Several genes/QTL of T. aestivum origin have also been mapped (see list at http://www.cropsci.ncsu.edu./SGgenotyping). Marker polymorphism between the donor and recipient lines will vary depending on the level of linkage disequilibrium between the marker and gene. Marker alleles derived from sources outside the US soft winter wheat gene pool are more likely to be polymorphic than those from within the local gene pool. It is always necessary to evaluate marker polymorphism between the parents of a cross prior to attempting MAS. Even though a trait may be rare or non-existent in US soft winter wheats, the marker alleles linked to genes affecting the trait may not be rare. This not only affects the ability to do MAS, but also our ability to draw inferences about genes from marker surveys of germplasm. If a line has the same marker alleles as a donor source, it does not mean that they share identity by descent. This is particularly true of SSR markers where high degrees of variation and multiple alleles are present due to instability at the loci over evolutionary time. Several closely linked markers in a region and appropriate sampling of the gene pool and/or lines in a pedigree are needed to draw conclusions from haplotyping studies that compare lines that were used in mapping studies with uncharacterized lines. The heritability caveat Marker-assisted selection is more effective for traits with low heritability but it is difficult to accurately identify linkages between markers and traits with low heritability. Thus, “If phenotypic data are poor indicators of genotypes, you cannot adequately map QTLs to implement MAS. If phenotypic data are good, you do not need MAS” (Holland, 2004). However, for some low heritability traits increasing replication and modifying the testing environment can increase heritability. This is not always practical for phenotypic evaluation of the large number of lines handled each year by a typical breeding program,
37
2005 Eastern Wheat Workers / Southern Small Grain Workers Conference
but can allow more accurate identification of linked marker in QTL mapping experiments. Why do MAS? Most of the markers that can be assayed at the GC at Raleigh are linked to genes of relatively large effect or for traits with moderate to high heritability. So why do MAS? One advantage of MAS is the ability to assay several traits utilizing the same technology. For some traits, DNA marker analysis is cheaper than obtaining accurate phenotypes. As noted above, breeders make 100s of crosses each year but less than 1% of these crosses result in a new variety. Since MAS can be used to enrich populations for favorable alleles, it should increase the probability of deriving a cultivar from a particular cross. In addition, MAS can be used to create genotypes having pyramids of effective genes for resistance to the same pathogen, such as pyramids of leaf rust, stripe rust or powdery mildew resistance genes. Selection for recurrent parent background during backcrossing can be used to reduce linkage drag and to reduce the time to cultivar release. Although accelerated backcrossing is a very conservative breeding method that requires a large number of marker data points, it may be appropriate when there is a need to get cultivars having a much needed trait into the hands of producers. In wheat, accelerated backcrossing coupled with doubled haploid production is being used to develop Canadian cultivars with resistance to scab. Marker-assisted selection is never done in the absence of phenotypic evaluation. The target traits of MAS, as well as all the many other traits needed in a good wheat cultivar, are still evaluated in marker-assisted breeding schemes. Therefore, the time from first cross to cultivar release may not be decreased greatly when using MAS in the absence of doubled haploids or rapid inbreeding. Generations of inbreeding and seed increase are still required as well as multiple years of multi-location, replicated field evaluation. The evolution of MAS For many important traits in wheat, we are still in the initial phase of MAS that includes mapping genes and QTLs and introgressing the target alleles into elite germplasm. For other traits, mapped genes have been introgressed into elite wheat breeding lines by MAS (or phenotypic selection) but most often only one or two genes at a time. It will be necessary to devise crossing and selection schemes to combine these genes in forward breeding. In my opinion, we will then be confronted by problems with lack of polymorphism for markers linked to genes derived from T. aestivum, particularly from adapted sources. Initial selection for the markers followed by confirmation of the phenotype will work to maintain marker-target gene linkage disequilibrium. Even so, the lack of markers that are diagnostic in all populations for some important traits could impede our ability to have truly high-throughput marker-assisted forward breeding schemes. Efforts to identify tightly linked markers and/or causal sequences of genes for important traits (i.e. resistance to FHB and non-race specific resistance to wheat rusts and powdery mildew) should continue so that markers that are diagnostic in all populations can be developed.
38
2005 Eastern Wheat Workers / Southern Small Grain Workers Conference
Current status of the lab We estimate that the genotyping center at Raleigh currently has the capacity to provide 3,000 data points to each of fourteen different public breeding programs in the Eastern region. We are also working on a regional project to deploy FHB resistance QTL by accelerated backcrossing and are evaluating soft winter wheat germplasm with markers linked to FHB resistance and other traits. Protocols are in place to receive samples from breeding programs doing MAS and are available at http://www.cropsci.ncsu.edu./SGgenotyping. Projects should be discussed with me from the onset in order to schedule analysis and assist in evaluating parental material.
39
2005 Eastern Wheat Workers / Southern Small Grain Workers Conference
National Wheat Coordinated Agricultural Project (CAP) Report
Carl A. Griffey Virginia Polytechnic Institute & State University
Background In 2003, Joseph Jen, USDA Under-Secretary, recommended that the wheat research community should initiate a national forum including plant breeders, genomics scientists, producers, millers and bakers, and other wheat professionals to identify critical research needs and priorities for implementing new marker technologies in wheat improvement. The stimulus and research model for the proposed CAP initiative originated with the successful marker assisted selection (MAS) Wheat IFAFS project “Bringing Genomics to the Wheat Fields”. An initial forum including industry representatives, breeders and other wheat researchers was held February 2004 in Kansas City, MO in conjunction with the annual Wheat Quality Council meeting to discuss and prioritize traits of critical importance to be improved via MAS. The potential role of the newly established USDA genotyping centers in wheat improvement also was discussed with respect to the proposed project. A conference was held August 2004 in Denver, CO to develop a research plan and subsequently a proposal for a 2005 CAP Initiative on Wheat Translational Genomics. The proposed research plan was presented to USDA and received excellent reviews. Jorge Dubcovsky is working with regional chairs to prepare and submit a final CAP proposal by June 25, 2005. Proposals will be reviewed in July with a proposed start date of October 1, 2005 if the wheat CAP initiative is selected for funding. The proposed CAP research initiative involves 18 breeding programs representing all wheat classes and production regions. The Eastern Soft Wheat Region was divided into five sub-regions with each being coordinated by a designated chair and having a cooperative research project that focuses on traits of regional importance. Objective Implement a national program for MAS in wheat to facilitate application of wheat translational genomics in cultivar development programs and, thereby accelerate incorporation of traits deemed to be of critical importance by the wheat industry. Target Traits and Populations for the East Region-Soft Winter Wheat Teams Wheat scientists in each of the eastern sub-regions will focus on genetic characterization, mapping and marker-assisted selection for specific traits of interest. The Deep South Region initially will focus on resistance to soilborne mosaic virus in a F4:8 RIL population of ‘Pioneer 26R46’/’SS550’. This population also is being characterized currently for milling and baking quality traits. Subsequent emphasis will be on resistance to stripe rust. The mid-Atlantic Region will focus primarily on adult plant resistance to powdery mildew in a F8:9 RIL population of ‘USG3209’/’Jaypee’. Subsequently, a ‘Jagger’/’McCormick’ SSD population will be characterized for spring growth habit, photoperiod sensitivity and freeze tolerance. This HRW/SRW wheat population also may
40
2005 Eastern Wheat Workers / Southern Small Grain Workers Conference
be useful for characterization of quality traits. The Corn Belt Region will initially focus on resistance to S. nodorum glume blotch in a F8:11 RIL population of P91193/P92201 having resistance derived from both parents. Subsequent studies may focus on resistance to S. tritici leaf blotch in this population as well as in other populations such as F201R/’Patterson’, which also could be characterized for soilborne mosaic virus resistance. The Northeast Soft White Wheat Region will focus on preharvest sprouting tolerance initially in a double haploid population of ‘Cayuga’/ ’Caledonia’ and subsequently in a RIL population of ‘Clarks Cream’/’Caledonia’. The initial population also may be useful in characterization of wheat quality traits. The fifth East Region research team encompasses the entire soft winter wheat region and will focus on characterization of milling and baking quality traits and protein gluten strength initially in a F5:6 RIL population of ‘Pioneer 25R26’/’Foster’. Characterization of soft wheat quality traits is progressing in the Pioneer 26R46/SS550 population.

41
2005 Eastern Wheat Workers / Southern Small Grain Workers Conference
USDA/ARS Wheat Powdery Mildew Research
Christina Cowger and David Marshall USDA/ARS, Plant Science Research Unit, Raleigh, NC
Pathogen Studies While powdery mildew probably causes greater average losses to winter wheat production in the eastern U.S. than any other disease, little is known about the U.S. population of the causal fungus, Blumeria graminis f. sp. tritici. We are studying population structure using non-selected DNA (single-nucleotide polymorphisms in intron regions of housekeeping genes) from single-ascospore isolates to learn whether genetic distance is correlated with geographic distance. From this, we will draw inferences on the relative roles of genetic drift and gene flow in subdividing the population geographically, and the implications for durability of host resistance. We are also developing virulence profiles by testing the isolates on single-R gene differential wheat genotypes. Preliminary data from Kinston, NC, indicate no current virulence to resistance genes Pm1a, Pm16, and Pm17, and rare virulence to Pm8 and Pm25. The proportion of isolates with virulence to Pm2a, Pm4b, and Pm6 has fallen to intermediate since being universal in the early 1990s, possibly due to decreased frequency of those resistance genes in commercial varieties. The last major virulence shift in the mid-Atlantic region was the defeat of Pm3b (Chul) and Pm4a (Roane) in the early 1990s, and virulence to those genes is common. Wheat Population Development In order to increase the diversity of resistance to powdery mildew in soft wheat, new sources must be identified and subsequently introgressed into adapted germplasm. From 2000 through 2002, potential sources of resistance were evaluated at locations in North Carolina, Georgia, and Virginia. In addition to powdery mildew resistance, the germplasm was also evaluated for resistance to other diseases, in addition to acceptable agronomic characteristics such winter hardiness, maturity, lodging, and grain quality. Seventeen lines were identified (Table 1, Entries 1-17) having powdery mildew resistance and good agronomic characteristics. Each source of resistance was used as a pollen donor in crosses with germplasm lines selected from the 2002-03 Uniform Southern Soft Red Winter Wheat Nursery, the 2002-03 Uniform Eastern Soft Red Winter Wheat Nursery, and the 2002-03 Gulf-Atlantic Wheat Nursery. Both male and female plants were staggered for vernalization duration and timing in order to make successful pairings more likely. Approximately 1100 crosses were made. F1s were grown in the greenhouse for increase as well as being used as pollen donors for backcrossing to the recurrent parent or top crossed with adapted soft wheat germplasm.
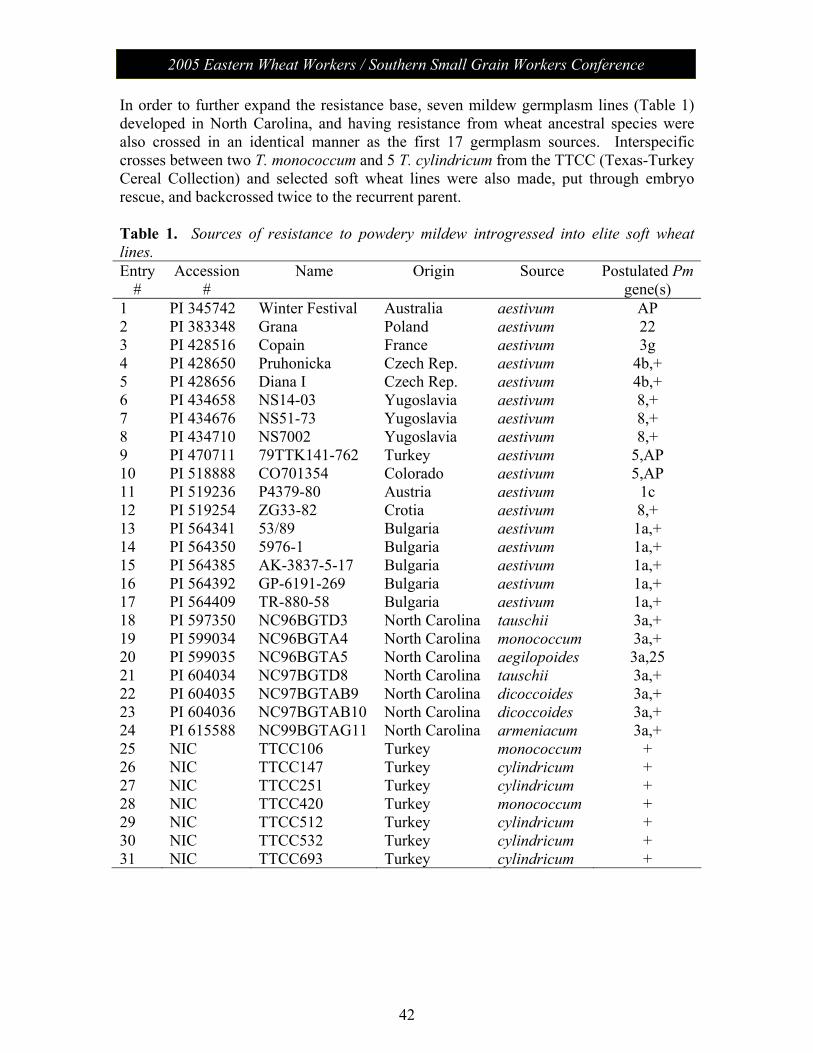
42
2005 Eastern Wheat Workers / Southern Small Grain Workers Conference
In order to further expand the resistance base, seven mildew germplasm lines (Table 1) developed in North Carolina, and having resistance from wheat ancestral species were also crossed in an identical manner as the first 17 germplasm sources. Interspecific crosses between two T. monococcum and 5 T. cylindricum from the TTCC (Texas-Turkey Cereal Collection) and selected soft wheat lines were also made, put through embryo rescue, and backcrossed twice to the recurrent parent. Table 1. Sources of resistance to powdery mildew introgressed into elite soft wheat lines. Entry
# Accession
# Name Origin Source Postulated Pm
gene(s) 1 PI 345742 Winter Festival Australia aestivum AP 2 PI 383348 Grana Poland aestivum 22 3 PI 428516 Copain France aestivum 3g 4 PI 428650 Pruhonicka Czech Rep. aestivum 4b,+ 5 PI 428656 Diana I Czech Rep. aestivum 4b,+ 6 PI 434658 NS14-03 Yugoslavia aestivum 8,+ 7 PI 434676 NS51-73 Yugoslavia aestivum 8,+ 8 PI 434710 NS7002 Yugoslavia aestivum 8,+ 9 PI 470711 79TTK141-762 Turkey aestivum 5,AP 10 PI 518888 CO701354 Colorado aestivum 5,AP 11 PI 519236 P4379-80 Austria aestivum 1c 12 PI 519254 ZG33-82 Crotia aestivum 8,+ 13 PI 564341 53/89 Bulgaria aestivum 1a,+ 14 PI 564350 5976-1 Bulgaria aestivum 1a,+ 15 PI 564385 AK-3837-5-17 Bulgaria aestivum 1a,+ 16 PI 564392 GP-6191-269 Bulgaria aestivum 1a,+ 17 PI 564409 TR-880-58 Bulgaria aestivum 1a,+ 18 PI 597350 NC96BGTD3 North Carolina tauschii 3a,+ 19 PI 599034 NC96BGTA4 North Carolina monococcum 3a,+ 20 PI 599035 NC96BGTA5 North Carolina aegilopoides 3a,25 21 PI 604034 NC97BGTD8 North Carolina tauschii 3a,+ 22 PI 604035 NC97BGTAB9 North Carolina dicoccoides 3a,+ 23 PI 604036 NC97BGTAB10 North Carolina dicoccoides 3a,+ 24 PI 615588 NC99BGTAG11 North Carolina armeniacum 3a,+ 25 NIC TTCC106 Turkey monococcum + 26 NIC TTCC147 Turkey cylindricum + 27 NIC TTCC251 Turkey cylindricum + 28 NIC TTCC420 Turkey monococcum + 29 NIC TTCC512 Turkey cylindricum + 30 NIC TTCC532 Turkey cylindricum + 31 NIC TTCC693 Turkey cylindricum +

43
2005 Eastern Wheat Workers / Southern Small Grain Workers Conference
Cereal Disease Lab Update and a Proposal for a Leaf Rust Screening Nursery
M. L. Carson, C. Kistler, J. A. Kolmer, L. S. Szabo, and Yue Jin,
USDA-ARS, CDL, St. Paul MN
CDL Addition Update: Construction has finally begun on a ~7,000 ft2 addition to the lab. This addition will house two 750 ft2 laboratories, a common prep lab, a BL-2 containment lab for working on exotic pathogens, as well as a large common office for technicians, post-docs and students, and a large conference room/library. Construction will be completed in late Fall/early Winter. Research Highlights: The African Stem Rust Situation: As many of you are aware, reports of a 'new' African wheat stem rust race have been a concern for the wheat improvement community, with Dr. Norman Borlaug lobbying the halls of Washington to raise awareness of the situation at the highest levels. In 1998, a new stem rust race virulent on Sr31 was reported in Uganda. Sr31 has been a very important gene used worldwide for stem rust resistance. There have since been informal reports that similar virulence was occurring in Ethiopia and Kenya, suggesting that this new race may have spread into eastern and northern Africa. In the past several years, most of the CIMMYT wheat (released varieties and elite breeding lines) planted in Kenya and ICARDA wheat planted in Ethiopia became susceptible to stem rust. Most of the stem rust resistance genes used in CIMMYT have been distributed worldwide along with the dissemination of CIMMYT germplasm. Many countries rely on CIMMYT germplasm for wheat improvement, including stem rust resistance. We know that the level and stability of stem rust resistance in CIMMYT wheat is equivalent to that in US spring wheat grown in the Northern Great Plains. The development of new virulence on CIMMYT wheat should be a concern. In December of 2004 and January of 2005, the CDL conducted seedling evaluations of the various classes of US wheat against this new African stem rust race. Included in the test were released varieties and advanced breeding lines that are near release from US wheat breeding programs. The purpose of the study was to assess the degree of susceptibility to this new race, and to identify resistance genes in the adapted US wheat germplasm that are effective against it. The results of evaluations are summarized in Table 1. More than 80% of the US hard red spring wheat varieties and advanced breeding lines were susceptible. Such a degree of susceptibility in the US hard red spring wheat is unprecedented and alarming. The study also evaluated wheat varieties released from CIMMYT and confirmed that most (84%) are susceptible. A high percentage of the soft red winter wheat (>70%) was also susceptible to the new African stem rust race. Hard red winter wheats grown in the Great Plains were less susceptible compared to other classes of wheat because several stem rust resistance genes, i.e. Sr24, Sr36, and SrTmp, effective against this race, are commonly used in the hard red winter wheat. However, 60% of released varieties were susceptible. There appears to be sufficient susceptibility in

44
2005 Eastern Wheat Workers / Southern Small Grain Workers Conference
varieties grown in the southern United States to allow the African race to overwinter. If spread or introduced to North America, the new race would become established and spread, posing a threat to wheat grown in the Central and Northern Great Plains, and elsewhere. Table 1. Susceptibility to an African stem rust race in US wheat.
Wheat class (& type of germplasm tested)
# of lines
tested % susceptible to the African race
Genes for resistance
US hard red spring cultivars 44 82% unknown US hard red spring advanced breeding lines 43 86% unknown US Durum (Northern Great Plains) 40 50% unknown CIMMYT spring wheat cultivars 152 84% unknown US hard red winter cultivars 137 60%
Sr24, Tmp, 36, & unkn
US hard red winter advanced breeding lines 28 36%
Sr24, Tmp,
& unkn. US hard red winter advanced breeding lines 44 39%
Sr24, Tmp,
& unkn. US soft red winter cultivars 36 78%
Sr36, 24, Tmp, & unkn.
US soft red winter advanced breeding lines 76 63% Sr36, 24,
& unkn. Stem rust has been effectively controlled through the use of resistant varieties in wheat for more than 50 years. Although this new African race possesses unprecedented virulence, resistance genes are available in adapted US wheat cultivars and elite breeding germplasm. In addition to Sr24, Sr36, and SrTmp, we have found high levels of resistance of unknown origin in varieties and breeding germplasm in all major classes of wheat. Furthermore, we found that a number of under-utilized resistance genes, such as Sr13, 22, 26, 29, 32, 33, etc. are effective against this and many other stem rust races and
45
2005 Eastern Wheat Workers / Southern Small Grain Workers Conference
could be utilized in breeding. The level of adult plant resistance, traditionally an important part of the stem rust resistance package in most US wheat, has not been studied with regard to the African race. Puccinia graminis genome project: (Les J. Szabo, CDL, Christina Cuomo, Broad Institute, MIT, Ralph Dean, NCSU) This is a 3 year NSF funded project that started Sept. 2004, with the objectives of doing a 8X sequencing of the genome, creating a physical map by restriction fingerprinting 24,000 fosmid clones, end sequencing 40,000 ESTs from four libraries. The genome sequencing has been completed and the assembly is in progress. The fosmid library has be sent to the Genome Sciences Centre, BC Cancer Institute and a fingerprint map is expected to be completed in mid to late summer. Two EST libraries (germinated urediniospores @ 8 hr and teliospores) have been constructed and sequencing will start soon. A urediniospore library is under construction. Chromosome walking has begun around two avirulence genes, AvrT8a and AvrT9a, and Dr. Szabo's group has successfully walked between markers flanking AvrT9a. Population genetics of the wheat and barley scab fungus in the US: In an initial survey conducted in 1999-2000, 94.6% of isolates produced DON and 15-acetyldeoxynivalenol (15ADON chemotype), but 5% of isolates from MN and ND were of the 3ADON chemotype. Nivalenol producers were infrequent (0.4%) and found only in more southern states. Gene flow analysis shows that the 15ADON population in the U.S. is genetically isolated, not interbreeding with the 3ADON population (Nm = 0.5). Surveys of MN and ND wheat fields in 2003 showed that the 3ADON chemotype was more widespread and at a higher frequency (>20%) than in the previous survey. There was also some evidence of recombination (albeit infrequent) between the two chemotypes. The 15 ADON chemotype is still the only chemotype found in other midwestern states. Nivalenol chemotypes were most frequent in isolates from LA. Clearly the F. graminearum population in the US is heterogeneous and in flux. Update on the Fusarium graminearum genomics project: A whole genome shotgun assembly (10X) of the PH-1 strain (MSU) of F. graminearum was completed in collaboration with the Broad Institute with funding from USDA-NRI. The first high quality draft of the DNA sequence assembly was released in May, 2003; a second release in October, 2003 includes the automated annotation with 11,640 'putative' genes (http://www.broad.mit.edu/annotation/fungi/fusarium/). Also, physical and genetic maps of the four chromosomes of F. graminearum have been integrated with over 99% of the genome accounted for. A Fusarium microarray has been developed in a technology transfer agreement with Affymetrix. Using this microarray, the expression profile of Fusarium genes in plants of Morex barley at 24, 48, 72, 96, and 144 hrs post-inoculation is being studied. This will provide valuable information on genes that are critical for pathogenicity at specific stages of disease development.

46
2005 Eastern Wheat Workers / Southern Small Grain Workers Conference
2004 Wheat leaf rust race summary: Fifty races of wheat leaf rust were identified in our 2004 survey. In the south – races with virulence to Lr26, Lr18 (MCRK) and virulence to Lr9, Lr10, and Lr18 (TLGF) were the most common. In the Ohio Valley and northeast, races with virulence to Lr17 and Lr26 (MCDS, TCDS) were the most common. MCDS and TCDS were also found in the southern region. Races with Lr17 virulence (MCDS, MBDS) most likely originated from a foreign introduction, most likely from Mexico, in the mid 1990s. These races were originally found in the Great Plains region, however races with virulence to Lr17 are now found throughout the US. A new race of leaf rust with virulence to almost all currently grown durum wheat cultivars was recently found in Mexico and has spread to durum fields in the Imperial Valley of California. Importance of Leaf Rust Resistance: Table 2 presents data from an experiment conducted by Jochum Wiersma comparing the response of different HRS cultivars to conventional and intensive management practices in the Red River valley. The intensive management consisted of two fungicide and a single insecticide application. Also included are the leaf and stripe rust reactions of those same cultivars. Even though the primary target for the fungicide applications was FHB, there was good correlation between susceptibility to leaf rust and the response to intensive management. This indicates that much of the yield response seen by growers in response to fungicide applications is control of leaf rust, not stripe rust or scab. This also demonstrates the importance of leaf rust as a yield limiting factor in wheat production. Proposal for a Regional Leaf Rust Nursery: An e-mail survey of wheat breeders indicated an interest in increased testing of germplasm for adult plant resistance to leaf rust in southern and eastern soft red wheats. This presents somewhat of a dilemma in fulfilling one of the primary missions of the Cereal Disease Lab: to reduce losses in small grains to rust diseases. Large scale testing of adult plant resistance in soft red wheats at the CDL is problematic for several reasons: Lack of winter hardiness makes field testing of much of the southern SRW germplasm in St. Paul unreliable; large scale screening of adult plants in the greenhouse is also not possible due to lack of resources (both space and manpower). However, the CDL can provide expertise in setting up and running leaf rust screening nurseries in areas where SRW germplasm is adapted. What we are proposing is to work with SRW breeders in establishing nurseries in at least two locations in the southeast with the expressed goal of identifying materials with putative adult plant resistance. Breeders would be responsible for organizing and planting the nurseries. Breeders in the region would be allowed to submit a set number of entries from their program depending on the space available. The CDL will provide inoculum for the trial. A mixture of races that are representative of the region and also have virulence to the common seedling Lr genes present in SRW improvement programs will be used. The CDL would also be involved in rating the plots and distributing the results to cooperators This should allow the tentative identification of materials that either have novel seedling genes or putative adult plant resistance. Selected materials could then be subjected to further genetic tests for resistance identification and characterization.

47
2005 Eastern Wheat Workers / Southern Small Grain Workers Conference
Table 2. Grain yield (Bu/A) and leaf rust reaction of spring wheat varieties grown under two management systems.
Conventional1 Intensive1 Yield diff
Variety Bu/A Rank Bu/A Rank %loss Bu/A Leaf Rust2 Stripe Rust Trooper 69.3 22 103.6 2 33.1 34.3 dead MS-S Marshall 57.9 25 90.9 17 36.3 33.0 20 MS R Walworth 66.6 24 94.3 12 29.4 27.7 dead MS Parshall 69.5 21 91.3 16 23.9 21.8 50 MS-S R HJ98 78.4 17 98.5 9 20.4 20.1 30 MS R Norpro 77.4 19 96.7 10 19.9 19.3 T R MR Oxen 78.2 18 94.0 13 16.8 15.8 dead R Granite 80.7 16 95.9 11 15.9 15.3 T MS MR Ingot 66.8 23 81.3 25 17.8 14.4 dead R Mercury 94.1 2 108.5 1 13.2 14.4 T R R Freyr 88.5 8 102.0 3 13.2 13.5 15 MS-MR R Hanna 73.6 20 86.3 22 14.8 12.8 20 MS R Reeder 87.2 12 99.4 7 12.3 12.2 5 MS-MR R Oklee 88.2 9 100.3 5 12.1 12.1 15 MS-MR R Briggs 90.2 7 98.8 8 8.8 8.7 T R R Alsen 80.8 15 88.5 20 8.7 7.7 T R R Verde 92.9 3 99.8 6 6.9 6.9 T R R Knudson 97.5 1 101.9 4 4.3 4.3 T R MR Banton 87.2 11 90.9 18 4.0 3.6 T R R Steele 82.7 14 86.1 23 4.0 3.4 T R R Polaris 90.4 6 93.0 15 2.8 2.6 10 MS R P 2375 91.3 4 93.5 14 2.3 2.1 5 MS R Dapps 87.3 10 86.6 21 -0.7 -0.6 T R MR Granger 91.0 5 90.3 19 -0.7 -0.7 5 MR R Saturn 83.8 13 83.1 24 -0.9 -0.7 5 MR-MS R Average 82.1 94.2 12.2 1 Conventional management had no pesticide application, Intensive had one insecticide treatment and two fungicide applications. 2 Leaf rust was rated on July 16, 2004. Dead leaves were due to leaf rust or a combination of leaf and stripe rust.

48
2005 Eastern Wheat Workers / Southern Small Grain Workers Conference
49
2005 Eastern Wheat Workers / Southern Small Grain Workers Conference
Stripe Rust and its Management in Eastern United States
Gene Milus Department of Plant Pathology, University of Arkansas,
Fayetteville, AR 72701
Before 2000, stripe rust caused only occasionally losses on wheat in the Great Plains and southern Mississippi Valley, and it was considered a minor disease. Since 2000, stripe rust has caused significant losses every year in the eastern US and has been elevated to the number one disease in the southern soft and hard wheat regions. I believe that the regions now affected by stripe rust have always grown sizeable acreage of susceptible cultivars and have usually had favorable environments for stripe rust. Therefore, the recent epidemics are most likely due to changes in the pathogen population. The most evident change in the pathogen population was virulence for the Yr 9 resistance gene that was first reported in the US in 2000. Virulence for Yr 8 and the cultivar Express also was reported for the first time in the eastern US in 2000, but these virulences do not appear to be necessary to attack cultivars in the region. Isolates since 2000 are in an AFLP fingerprint group different from that of older isolates, indicating an exotic introduction rather than a mutation from the old population. New isolates also are more aggressive than old isolates in that they have shorter latent periods and appear to be better adapted to warm temperatures. This increased aggressiveness likely contributes to the greater speed, severity, and geographic range of stripe rust epidemics since 2000. Perhaps the most significant change in the pathogen population is its ability to establish in wheat fields during the fall at high incidence across Texas, Louisiana, Arkansas, and several other states. Understanding where the pathogen survives over summer and how it migrates in the fall likely will be a key component of long-term disease management. Another key component of management is the use of resistant cultivars. There has been a preference for seedling resistance that is controlled by one or a few major genes and provides a high level of protection throughout the life of the plant. However, this type of resistance eventually is overcome by new races of the pathogen. Using molecular markers to combine several of these resistance genes is hypothesized (hoped) to be a more effective method of deploying these genes. Another type of resistance that has been referred to as adult-plant, minor gene, partial, slow rusting or horizontal is found in wheat. This type of resistance generally has been more durable than seedling resistance, but it tends to be inherited polygenically and confer an intermediate level of resistance. It has been possible to combine several of these genes to give a high level of resistance. Stripe rust can attack heads as well as leaves, and resistance to head infection appears to be controlled by genes different from those controlling resistance to foliage infection. Preliminary results of a genetic study, sources of resistance, available molecular markers, and an integrated management strategy will be discussed.

50
2005 Eastern Wheat Workers / Southern Small Grain Workers Conference
2005 Eastern Wheat Workers / Southern Small Grain Workers Conference
Stagonospora nodorum Blotch and Septoria tritici Blotch
Herb OhmP
1P, Stephen B GoodwinP
2P, Jim UphausP
1P, and Jill BreedenP
2P
P
1PDept of Agronomy, Purdue University
P
2PUSDA-ARS & Dept of Botany and Plant Pathology, Purdue University
We are continuing our research to identify new sources and genes for resistance, characterize inheritance of resistance, map and identify associated markers, and develop improved germ plasm and cultivars that are resistant to Stagonospora nodorum blotch (SNB) and Septoria tritici blotch (STB). SNB. Bostwick et al. (1993) identified the wheat cultivar Cotipora, developed in Brazil, and the cultivar Coker 8427 as having resistance to Snb in leaves and glumes. Cultivar INW0101, which likely has Snb resistance from two or more of its resistant parent lines Cotipora, Montana 36 and the Ohio State University-developed cultivar Glory, was developed and released in 2001 by Purdue University. The Purdue line P91193, which derives Snb resistance from Coker 8427, was crossed with INW0101 and a recombinant inbred (RI) population was developed and phenotyped for resistance to Snb. We have identified a Snb resistance QTL from the parent line P91193 on chromosome 2D near the marker locus Xgwm526; thus, this resistance QTL is different from that of cultivar Arina, which has QSng.sfr-3BS on chromosome 3B (Schnurbusch, et al., 2004). We are continuing to identify Snb resistance QTL in this RI population. We are developing two RI populations from crosses of Snb-resistant Coker 9663 crossed at the University of Arkansas to two Snb-susceptible wheat lines. The populations will be phenotyped and marker-genotyped to identify Snb resistance QTL. STB. Adhikari et al. (2004) located the widely deployed and durable resistance gene Stb 1 on chromosome 5BL, 2.8 cM distal to SSR Xbarc74; and reviewed the literature reporting chromosome locations for Stb 2 to Stb 8. We are pyramiding two or more of the resistance genes Stb 1, Stb 2, Stb 4 and Stb 8 by marker-assisted selection into advanced soft winter wheat lines for release as improved germ plasm and cultivars. QSng.sfr-3BS - Stb 2 - Sr 2 - Qfhs-ndsu-3BS linkage block. Our objective is to develop a germ plasm line with the four genes/QTL in coupling. We have identified by DNA marker genotyping and phenotyping, several lines in which Sr 2 and Qfhs-ndsu-3BS are likely in coupling; and several lines in which QSng.sfr-3BS and Stb 2 are likely in coupling. We are verifying the coupling linkages. Then, we plan to combine the two linkage groups into coupling of the four resistance traits. Adhikari, TB, X Yang, JR Cavaletto, X Hu, G Buechley, HW Ohm, G Shaner, and SB Goodwin. 2004. Molecular mapping of Stb 1, a potentially durable gene for resistance to septoria tritici blotch in wheat. Theor Appl Genet 109:944-953. Bostwick, DE, HW Ohm, and G Shaner. 1993. Inheritance of Septoria glume blotch resistance in wheat. Crop Sci. 33:439-443. Schnurbusch, T, S Paillard, D Fossati, M Messmer, G Schachermayr, M Winzeler, and B Keller. 2003. Detection of QTLs for Stagonospora glume blotch resistance in Swiss winter wheat. Theor Appl Genet 107:1226-1234.
51

52
2005 Eastern Wheat Workers / Southern Small Grain Workers Conference
53
2005 Eastern Wheat Workers / Southern Small Grain Workers Conference
An Update on the Major Virus Pathogens of Wheat and Prospects for Breeding for Resistance.
Joseph M. Anderson
USDA-ARS, Agronomy Department, Purdue University Wheat has four primary viral pathogens. These viruses, depending upon the environmental conditions, can have a significant economic impact in the Eastern and Southern wheat regions. The wheat curl mite and several aphid species are the primary vectors for Wheat Streak Mosaic Virus and the Barley/Cereal Yellow Dwarf Viruses. A parasitic fungus, Polymyxa graminus, transmits Soilborne Mosaic Virus and Spindle Streak Mosaic Virus. The presence or absence of these insects and fungal vectors during the seedling stage play a major role in the severity of the disease. Infection in the fall at the young seedling stage typically leads to a more severe disease phenotype which is manifested as stunting and chlorosis leading to yield loss. Wheat streak mosaic virus, a significant problem in the Great Plains, does not appear to be a major problem in the Eastern and Southern US Region because the mite prefers dry conditions. One source of resistance to WSMV is Wsm1 derived from a Group 4 perennial wheatgrass Thinopyrum intermedium chromosome. Wsm1 containing wheat/Th. translocations are being utilized in breeding programs and a ph/ph-induced recombination strategy by Bikram Gill’s group at Kansas State University is underway to shorten the translocations and increase their usefulness. Of greater concern are Soilborne Mosaic Virus (WSBMV), Wheat Spindle Streak Virus (WSSMV), and the Barley/Cereal Yellow Dwarf Virus complex. Cool wet conditions in the fall produce the most significant infections of WSBMV and WSSMV. There is effective resistance to WSBMV and WSSMV in the cultivated wheat gene pool. Developing wheat resistant to these two viral pathogens requires the identification of a location in which the soil has virus-containing Polymyxa graminus and the appropriate climate. Dr. Fred Kolb, at the University of Illinois, has provided a valuable service to the community by planting material from various breeding programs as well as the Uniform Nurseries in a field, under continuous wheat, that gives consistent viral infection. In the Southern and Eastern Uniform Nursery reports it is clear that these two viruses are quite important yet highly variable in causing disease from year-to-year. Barley and Cereal Yellow Dwarf Viruses (YDVs) appears to be present at most locations in all years but the severity of the disease varies depending upon when infection occurred and subsequent weather conditions. When a fall infection occurs due to a mild fall and consequently high aphid populations, YDV leads to significant yield reductions. Similar to Wheat Streak Mosaic Virus, there is little to no resistance to YDV in the cultivated wheat gene pool. Programs in China, Australia, Canada and the US have integrated resistance from Thinopyrum intermedium and two genes have been identified; Bdv2 and Bdv3. These resistance genes provide moderate to significant levels of resistance to BYDV and total resistance to CYDV. Bdv2 is present in Australian lines and some CIMMYT material. Bdv3 is in Purdue University varieties and, therefore, should be useful adapted material for the Eastern and Southern wheat region. The Bdv3 CYDV resistance appears to cause a significant inhibition in virus movement from the initial site of infection which stops a systemic infection from occurring.

54
2005 Eastern Wheat Workers / Southern Small Grain Workers Conference
55
2005 Eastern Wheat Workers / Southern Small Grain Workers Conference
Common Insects of Wheat in Kentucky
Doug Johnson Department of Entomology, University of Kentucky
Introduction Kentucky is located in a unique ecological situation between the cold winters of northern prairie states and the very mild winters of the deep-south. Though cold enough to stop most insect activity during mid-winter, the great variation in date of first frost, fall onset of continuous cold, and spring onset of general warm weather makes it particularly difficult to predict insect impact in any given year. In Kentucky wheat is grown as a “winter crop” planted in the fall, usually following corn, and harvested the following summer. Most often varieties which mature early enough to allow planting of “double-crop” soybeans are used. This production system divides the insect pests into three groups: those that infest in the fall, and that either do or do not over-winter, and those that infest in the spring. We will examine these pests in order of appearance through the production year. Insect pests are common in Kentucky wheat. Typically, one can find all of these insects in almost every field every year, but rarely do their populations grow to economically important numbers. However, each pest has the potential to cause significant damage under appropriate conditions. Insect Pests1 in General Order of Appearance Fall Only The fall Armyworm, Spodoptera frugiperda ( J.E. Smith), is a common pest of several late planted summer and early planted fall crops. Fall armyworm (FAW) cannot over-winter in Kentucky. FAW migrates into Kentucky from the gulf coast in mid-summer, initially infesting corn as its primary crop host. In late summer / early fall, as corn begins to mature, it colonizes newly seeded grasses. Damage is most common in lawns, reclaimed land, ditch banks, and roadsides, etc., but may also infest small grains. FAW can damage small grains (in fact any host) if it feeds on seedlings before roots are established, resulting in seedling death. If plants are established FAW feeding is rather more like grazing. FAW can remain active until the first killing frost and will survive longer where crop residue provides shelter from the cold. Infestation usually results from early planting. Often, planting after the Hessian fly free date (Johnson1993a) will avoid this situation. However, occasionally frost and onset of
1 Common and scientific names of insects from: Common Names of Insects and Related Organisms. Entomological Society of America. http://www.entsoc.org/pubs/books/common_names/index.htm#About_this_Publication

56
2005 Eastern Wheat Workers / Southern Small Grain Workers Conference
cold weather are late enough to allow infestation of small grains. Insecticidal control is relatively easy; however, there are no established thresholds. Damaged fields are sometimes replanted, but this is a risky technique. Many damaged plants will survive, thus, replanting may result in a denser than desirable stand. Fall and Spring The Hessian Fly, Mayetiola destructor (Say), is another common insect pest infesting small grains in the fall (Johnson1993a). See Cambron’s treatment elsewhere in these proceedings. In general, planting after the “fly free” date will provide adequate control in Kentucky. Agronomic and cultural factors favoring strong stems and stand ability of the plant are preferred, but at last examination all resistance factors can be overcome by the biotypes present in the state. There are no rescue treatments (foliar applied insecticides), though use of systemic insecticides as seed treatments and fall / spring applications of the systemic insecticide disulfoton, (e.g., Di-Syston® 8 and generics), targeted at aphids may have some effect.
There is little doubt that the most important insects in Kentucky-grown wheat are a complex of cereal aphids, HOMOPTERA: Aphididae (Johnson and Townsend 1999). In Kentucky, this complex is primarily composed of the bird cherry-oat aphid, Rhopalosiphum padi (Linnaeus); English grain aphid, Sitobion avenae (Fabricius); corn leaf aphid, Rhopalosiphum maidis (Fitch) and greenbug, Schizaphis graminum (Rondani). In addition, the rice root aphid, Rhopalosiphum rufiabdominalis (Sasaki), is very likely playing an important role, though little is known of this aphid in Kentucky. It is interesting to note that these aphids are not important for their direct damage, but rather as vectors of the viral pathogens that result in Barley Yellow Dwarf (BYD). The risk, real and perceived, of Barley Yellow Dwarf, and by association, the cereal aphid complex is without doubt the driver of insecticide use in Kentucky-grown wheat. Though other insects may require insecticidal control from time to time, only the cereal aphids are treated in a routine manner. Beginning in the early 1990’s, increases in insecticide use, especially disulfoton, and then in the mid-90’s the synthetic pyrethroid lambda-cyhalothrin (primarily Karate® and Warrior®) over the historic use pattern were quite evident (Sandell 2002). Additionally, there has been some use of systemic insecticide seed treatments, primarily imidacloprid (Gaucho®), but this use is very hard to measure. Control of the cereal aphid complex is relatively easy to obtain. It is, as with most other insect pests of wheat, IF treatment is warranted that is hard to decide. The difficulty of finding aphids, combined with the small number required for application, the relative inexpensiveness of insecticides and the fear of catastrophic loss to BYD probably results in more insecticide use than is needed to mitigate the risk. Spring Only The armyworm, Pseudaletia unipuncta (Haworth), also know as the “True armyworm”, is usually the first pest of wheat to appear in the spring (Johnson 1994a). Armyworm
57
2005 Eastern Wheat Workers / Southern Small Grain Workers Conference
(AW) makes its annual appearance each spring in “flights” of the adult moths. These flights can be monitored by capturing males using pheromone baited traps (Johnson1994b, Johnson and McNeill 1993). The numbers caught using this technique can provide an advanced warning of the insect, allow calculation of when the damaging stage (worm) will appear (Johnson, Bessin and Townsend1998) and can be compared to trap capture data from previous years (Lucas 2004).
AW is very common in Kentucky but only rarely does sufficient damage to warrant control. However, spectacular outbreaks of this pest do occur. One recent outbreak occurred in 2001. In this year our early “peak” trap captures were more than three times the “average” (Lucas 2004). Very large populations appeared first in the south, then progressively through the Midwest into Canada. Considerable damage was done to the first cutting of grass hay in Kentucky. However, effects on small grains are debatable because of the late occurrence of the infestation.
AW is most often controlled by naturally occurring predators and parasitoids. For example, eggs of tachinid flies (DIPTERA: Tachinidae) are commonly found just behind the head on armyworm larvae. Very dense stands and especially lodging, along with cool cloudy springs, favor AW populations. Insecticidal control is relatively easy, if necessary.
The cereal leaf beetle, Oulema melanopus (Linnaeus), was first noted feeding in south central Kentucky in the mid-1980s (Johnson 1993b). Since that time it has moved generally westward to the Mississippi River counties. Cereal leaf beetle (CLB) is a sporadic pest with a tendency to damage the later maturing varieties.
Control of CLB is relatively easy. However, determining the need to control in a timely fashion is the more important decision. Work done in the late 1990’s on thresholds for this insect (Herbert and VanDuyn 1999) produced scouting procedures and thresholds that are currently in use. However, this insect is so rarely a problem it is likely the “old” threshold of one CLB per head bearing stem is most often used, except in the most highly managed wheat.
Pests Associate with Particular Events The wheat curl mite, Aceria tosichella Keifer, is a common pest of wheat in Nebraska and other plains states but is rarely a problem in Kentucky (Townsend, Johnson and Hershman 1995). Wheat curl mite (WCM) was first noticed in Kentucky in 1987 with a larger outbreak in 1988. Since that time significant infestation of WCM mite occurred in south central Kentucky in 2000. It was first believed that outbreaks of this pest were the result of mites carried in on winds from more western production areas. Though this is possible, and wind is a method of dispersal, it appears more likely that this outbreak occurred because of the lack of weed control (thus increase in volunteer wheat) in soybeans during the preceding summer. Volunteer wheat provides a “green bridge” that may have allowed the WCM to “over-summer” and build into much larger than normal numbers. This is the normal cause of economic problems with WCM in the western states. Normally in Kentucky
58
2005 Eastern Wheat Workers / Southern Small Grain Workers Conference
there would be no green bridge. However, in some poor soybean production years, weed control is reduced or abandoned and, thus, volunteer wheat remains in fields. Natural Controls There are many natural control agents operating in the small grain fields of Kentucky. As previously mentioned, caterpillars parasitized by tachinid flies, plus braconid wasps (HYMENOPTERA: Braconidae), and infections by fungal and viral pathogens are often seen. Braconid parasitoids in the genus Aphidius have been collected from the grain aphids. In addition there are a plethora of predators, e.g., ground beetles, (COLEPTERA: Carabidae) and syrphid flies (DIPTERA: Syrphidae), easily observed. Though often given short shrift, these natural controls, combined with good cultural practices, probably account for much of the insect pest control in Kentucky wheat. References2
Herbert, Jr., D. A. and J. W. VanDuyn 1999. Cereal Leaf Beetle Biology and Management. 1999. VPI&SU No. 444-350. http://www.ext.vt.edu/pubs/entomology/444-350/444-350.html
Johnson, D. 1993a. Hessian Fly in Kentucky. Entfact-101. Johnson, D. 1993b. Cereal Leaf Beetle in Kentucky Wheat. Entfact-107. Johnson, D. 1994a. Armyworms in Small Grains. Entfact-111. Johnson, D. 1994b.Using Pheromone Traps in Field Crops (A practical cheat sheet). Entfact-112.
Johnson, D. 2005. Small Grain Insecticide Recommendations. ENT-47. http://www.uky.edu/Agriculture/PAT/recs/crop/recgrn/recgrn.htm
Johnson, D., and S. McNeill. 1993. Plans and Parts List for the “Texas” Style Cone Trap for Monitoring Certain Insect Pests. Entfact-010. (HTML only). Johnson, D. and L. Townsend. 1999. Aphids and Barley Yellow Dwarf (BYD) in Kentucky Grown Wheat. Entfact-121. Johnson, D., R. Bessin and L. Townsend. 1998. Predicting Insect Development Using Degree Days. Entfact-123.
Lucas, P. 2004. KY Insect Trap Data. http://www.uky.edu/Agriculture/IPM/trapdata/trapdata.htm. [In] Dillon, P. KY IPM web pages. http://www.uky.edu/Agriculture/IPM/ipm.htm 2 The Entfacts may be found at: http://www.uky.edu/Agriculture/Entomology/entfacts/eflists.htm. Other on-line references contain direct links.
59
2005 Eastern Wheat Workers / Southern Small Grain Workers Conference
Sandell, L. [ed.] 2002. Crop Profile for Winter Wheat in Kentucky. http://pestdata.ncsu.edu/cropprofiles/docs/KYwheat.html Townsend, L., D. Johnson and D. Hershman. 1995. Wheat Streak Mosaic Virus and the Wheat Curl Mite. Entfact-117.

60
2005 Eastern Wheat Workers / Southern Small Grain Workers Conference

61
2005 Eastern Wheat Workers / Southern Small Grain Workers Conference
No-Till Wheat
James Herbek, Lloyd Murdock, John Grove, Larry Grabau, Dave Van Sanford, John James and Dottie Call
Department of Plant and Soil Sciences, University of Kentucky Introduction Wheat planting typically involves tillage, burying a large percentage of residue from the previous crop. No-tillage wheat planting eliminates tillage and reduces soil erosion, particularly on sloping soils, as well as labor, machinery, and energy costs. No-tillage also increases the opportunity for timely planting of wheat, especially when wet fall weather creates a time conflict between harvest of corn and soybeans and tillage for wheat establishment. Kentucky producers became interested in no-till wheat about 25 years ago. Much of this interest was a result of the availability of narrow row (10 inches or less) planting equipment (drills) that were capable of drilling seeds directly through crop residue. From less than 5000 acres in the early 1980’s, no-till wheat acreage increased to over 160,000 acres by 2000. Currently, 29% of the wheat acreage in Kentucky is no-till planted (Table 1). Comparatively, 15% of the small grain acreage (fall and spring seeded) in the United States is no-till seeded.
Table 1. No-Till wheat adoption in Kentucky (1980-2004).*
Year
No-Till Fall Seeded Small Grain (Acres)**
Fall Seeded Small Grain (% No-till)
1980*** <5,000 <1% 1990 110,600 18% 1994 122,400 22% 1997 157,300 26% 2000 162,600 26% 2004 159,500 29%
* Data from National Crop Residue Management Survey coordinated by the
Conservation Tillage Information Center (CTIC). ** Barley and oats comprise <4% of the total fall seeded small grain acreage in
Kentucky on an annual basis. It is estimated that 99% of the no-till fall seeded small grain acreage is wheat and 1% or less is barley and oats.
*** No CTIC information available for 1980. Numbers listed in table are estimates.
62
2005 Eastern Wheat Workers / Southern Small Grain Workers Conference
As a result of the increased interest in no-till wheat in Kentucky, research studies were initiated in the mid-1980’s to determine the feasibility, yield potential, and required management practices for no-till wheat. Although initial studies showed favorable results for no-till wheat, many producers remained skeptical of no-till wheat and felt yield potential was sacrificed, wheat stand establishment was difficult and irregular, pests (weeds, diseases, and insects) would intensify, and increased costs (nitrogen, weed control, and seed) would reduce profitability. To help define this further, additional studies and on-farm tests were conducted to define no-till wheat management practices and obtain long-term comparisons between tilled and no-till wheat for yield, profitability, and effects on succeeding crops in rotation with wheat. In 1992, a long-term study was established to compare no-till and tilled wheat in a three-crop in two-year rotation of corn, wheat, and double-cropped soybeans which is a prevalent cropping system in Kentucky. Nitrogen, disease, insect, and weed control management were compared for both wheat planting systems. The long-term effects of the two wheat planting (tillage) practices on the succeeding soybean and corn crops (which were no-till planted in both wheat tillage systems) and on soil property changes were also evaluated. To determine profitability of no-till wheat, on-farm tests were conducted in the late 1990’s. Additionally, on-farm tests were established in 2000 to substantiate the beneficial effects of no-till wheat on the yield of corn and soybean crops in rotation with wheat that was being achieved in University research studies. Yield Comparisons Some producers feel uncertain about the yield potential of no-till wheat. Many feel that yield is significantly reduced compared to tilled wheat. To provide yield information, research studies and on-farm tests have been conducted in Kentucky over the past 20 years to compare no-till and tilled wheat. Results of several studies and tests are reported in Tables 2-5. Initial studies in 1984-87, provided favorable yield results for no-till wheat (Table 2). Although slight yield differences occurred between the two wheat tillage systems in individual years, the average yields of the 4-year period were very similar for no-till and tilled wheat following a corn or soybean crop. No-till wheat yields were higher in 1984 and 1986 and tilled wheat yields were higher in 1985 and 1987. Climatic conditions seemed to determine the yearly difference between tillage systems.

63
2005 Eastern Wheat Workers / Southern Small Grain Workers Conference
Table 2. Wheat yield response to tillage following a corn and a soybean crop (1984-87). Wheat Yield (bu/acre) Wheat Tillage
System Following
Corn Following Soybeans
Tilled
71
76
No-till 70 76 Recent on-farm research tests provided additional yield comparisons of no-till and tilled wheat (Table 3). Wheat management practices were conducted by the farmer cooperators.
Table 3. On-farm research comparisons of no-till and tilled wheat. Wheat Yield (bu/acre)*
Wheat Tillage System
On-Farm Test A
On-Farm Test B
No-till
77.9
78.6
Tilled
82.1
79.2
Tilled Yield (+ or -) (+4.2) (+0.6) *Yield averaged over multiple tests (location x years).
On-Farm Test A: Eleven tests were conducted over a three-year period (1997-98 to 1999-00). The average yield for tilled plots was 4.2 bu/acre higher than for no-tillage (Table 3). The majority of the tests (10 of the 11 tests) resulted in higher yields for tilled wheat. However, the yield advantage for tilled wheat was quite different among growing seasons as well as growers; ranging from <1 bu/acre to over 12 bu/acre. Wheat management practices were not in common among the tests and varied substantially across the grower cooperators and years, which may account for the wide variation in yield differences that existed among the individual tests. No-till responds to more careful management than some growers are willing to implement. It is our experience that better no-till wheat yields are achieved by experienced no-till wheat growers because they utilize better management. On-Farm Test B: Yield comparisons for no-till and tilled wheat were obtained from 10 fields over a four-year period (2001-2004). Side by side comparisons were made on farmers fields with tillage treatments being 20+ acre blocks. All of the needed wheat management practices were conducted by the farmer cooperators with their equipment. Average yield was very similar for no-till and tilled wheat (with tilled wheat being <1 bu/acre higher than the no-till) (Table 3). The wheat yields were obtained from on-farm research trials established in 2000 and 2001 to verify the beneficial effects of no-till
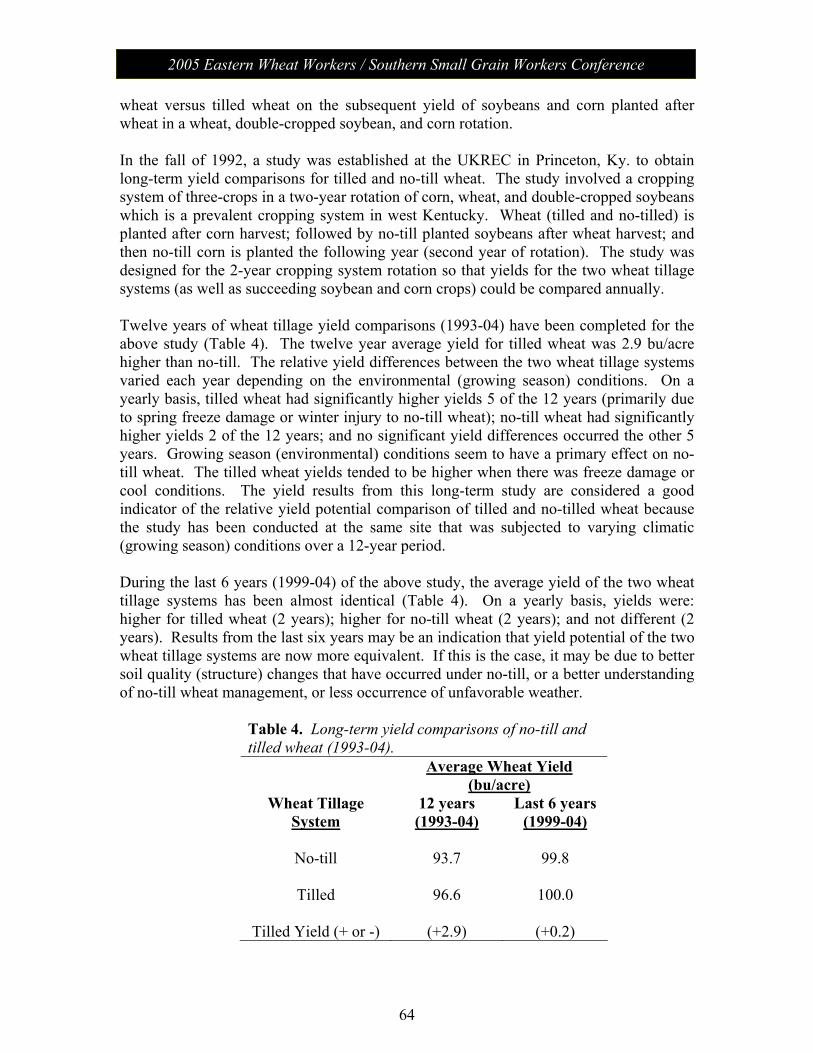
64
2005 Eastern Wheat Workers / Southern Small Grain Workers Conference
wheat versus tilled wheat on the subsequent yield of soybeans and corn planted after wheat in a wheat, double-cropped soybean, and corn rotation. In the fall of 1992, a study was established at the UKREC in Princeton, Ky. to obtain long-term yield comparisons for tilled and no-till wheat. The study involved a cropping system of three-crops in a two-year rotation of corn, wheat, and double-cropped soybeans which is a prevalent cropping system in west Kentucky. Wheat (tilled and no-tilled) is planted after corn harvest; followed by no-till planted soybeans after wheat harvest; and then no-till corn is planted the following year (second year of rotation). The study was designed for the 2-year cropping system rotation so that yields for the two wheat tillage systems (as well as succeeding soybean and corn crops) could be compared annually. Twelve years of wheat tillage yield comparisons (1993-04) have been completed for the above study (Table 4). The twelve year average yield for tilled wheat was 2.9 bu/acre higher than no-till. The relative yield differences between the two wheat tillage systems varied each year depending on the environmental (growing season) conditions. On a yearly basis, tilled wheat had significantly higher yields 5 of the 12 years (primarily due to spring freeze damage or winter injury to no-till wheat); no-till wheat had significantly higher yields 2 of the 12 years; and no significant yield differences occurred the other 5 years. Growing season (environmental) conditions seem to have a primary effect on no-till wheat. The tilled wheat yields tended to be higher when there was freeze damage or cool conditions. The yield results from this long-term study are considered a good indicator of the relative yield potential comparison of tilled and no-tilled wheat because the study has been conducted at the same site that was subjected to varying climatic (growing season) conditions over a 12-year period. During the last 6 years (1999-04) of the above study, the average yield of the two wheat tillage systems has been almost identical (Table 4). On a yearly basis, yields were: higher for tilled wheat (2 years); higher for no-till wheat (2 years); and not different (2 years). Results from the last six years may be an indication that yield potential of the two wheat tillage systems are now more equivalent. If this is the case, it may be due to better soil quality (structure) changes that have occurred under no-till, or a better understanding of no-till wheat management, or less occurrence of unfavorable weather.
Table 4. Long-term yield comparisons of no-till and tilled wheat (1993-04). Average Wheat Yield
(bu/acre) Wheat Tillage
System 12 years (1993-04)
Last 6 years (1999-04)
No-till
93.7
99.8
Tilled
96.6
100.0
Tilled Yield (+ or -) (+2.9) (+0.2)
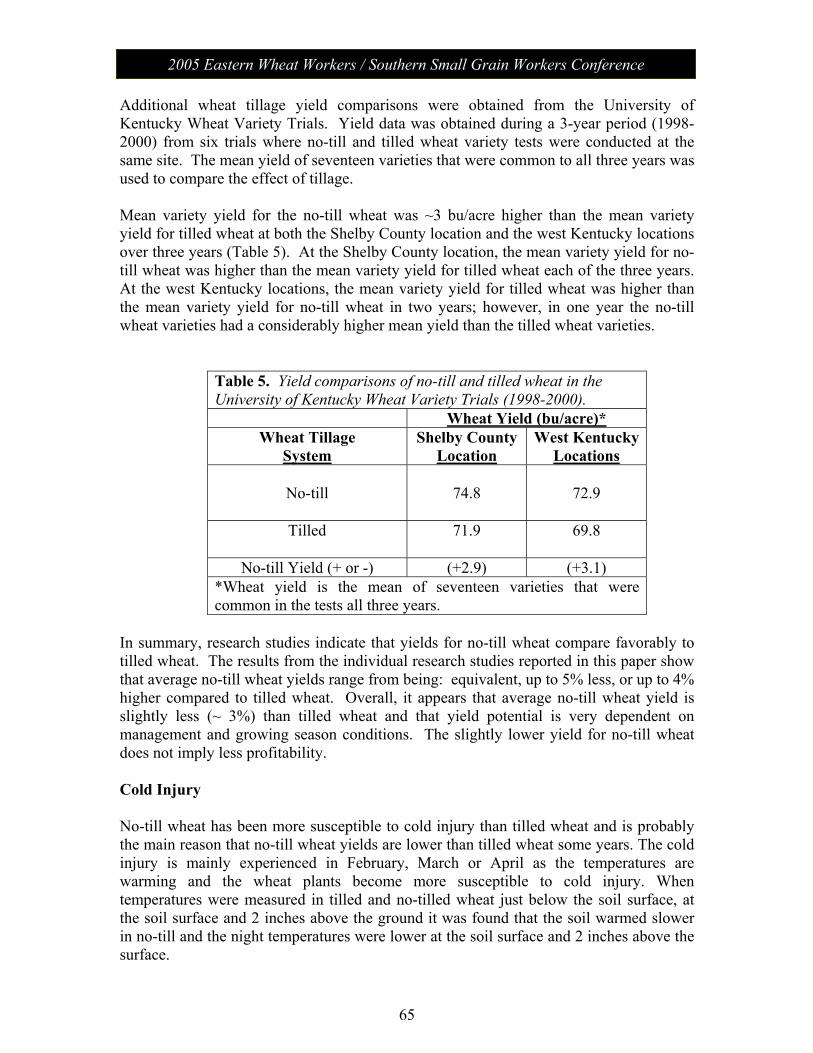
65
2005 Eastern Wheat Workers / Southern Small Grain Workers Conference
Additional wheat tillage yield comparisons were obtained from the University of Kentucky Wheat Variety Trials. Yield data was obtained during a 3-year period (1998-2000) from six trials where no-till and tilled wheat variety tests were conducted at the same site. The mean yield of seventeen varieties that were common to all three years was used to compare the effect of tillage. Mean variety yield for the no-till wheat was ~3 bu/acre higher than the mean variety yield for tilled wheat at both the Shelby County location and the west Kentucky locations over three years (Table 5). At the Shelby County location, the mean variety yield for no-till wheat was higher than the mean variety yield for tilled wheat each of the three years. At the west Kentucky locations, the mean variety yield for tilled wheat was higher than the mean variety yield for no-till wheat in two years; however, in one year the no-till wheat varieties had a considerably higher mean yield than the tilled wheat varieties.
Table 5. Yield comparisons of no-till and tilled wheat in the University of Kentucky Wheat Variety Trials (1998-2000).
Wheat Yield (bu/acre)* Wheat Tillage
System Shelby County
Location West Kentucky
Locations
No-till
74.8
72.9
Tilled 71.9 69.8
No-till Yield (+ or -) (+2.9) (+3.1) *Wheat yield is the mean of seventeen varieties that were common in the tests all three years.
In summary, research studies indicate that yields for no-till wheat compare favorably to tilled wheat. The results from the individual research studies reported in this paper show that average no-till wheat yields range from being: equivalent, up to 5% less, or up to 4% higher compared to tilled wheat. Overall, it appears that average no-till wheat yield is slightly less (~ 3%) than tilled wheat and that yield potential is very dependent on management and growing season conditions. The slightly lower yield for no-till wheat does not imply less profitability. Cold Injury No-till wheat has been more susceptible to cold injury than tilled wheat and is probably the main reason that no-till wheat yields are lower than tilled wheat some years. The cold injury is mainly experienced in February, March or April as the temperatures are warming and the wheat plants become more susceptible to cold injury. When temperatures were measured in tilled and no-tilled wheat just below the soil surface, at the soil surface and 2 inches above the ground it was found that the soil warmed slower in no-till and the night temperatures were lower at the soil surface and 2 inches above the surface.

66
2005 Eastern Wheat Workers / Southern Small Grain Workers Conference
When freeze damage was experienced on one occasion, the temperatures were found to be 5 degrees F lower at the soil surface with no-till as compared to tilled. Since the temperature that night was close to the critical temperature for damage, no-till wheat had about 25% more stem damage than tilled wheat. Fortunately, this does not occur often so the overall yields of the two tillage systems are similar when compared over years. Wheat Stand Comparisons Wheat stand establishment can be a major obstacle for no-till wheat. Most wheat in Kentucky is planted following corn, which results in a large amount of residue that can hinder no-till wheat planting. No-till wheat stands are usually not perfect and is one of the reasons that some producers have not adopted no-till. Their belief is that imperfect wheat stands reduce yield potential. However, with no-till planting experience, careful planting management, and proper no-till planting equipment, very acceptable wheat stands can be obtained. Wheat stand has been measured in several no-till wheat research studies. Wheat stand establishment results from some of these studies are reported in Table 6. Established stands for no-till wheat are usually less than tilled wheat; however, the established stand is usually high enough to achieve maximum yield potential (considered to be >25 plants per sq. ft.).
Table 6. Comparison of wheat stand establishment in no-till and tilled wheat.
Average Wheat Stand (plants/sq. ft.)
Wheat Tillage System
On-Farm Tests (1998 – 2000)
Long-term Research Study
(1993 – 2004)
Tilled
29
29.5
No-till 28 27.4 On-Farm Tests: Average no-till wheat stand was one plant per sq. ft. less than tilled wheat for the 11 tests conducted over a three-year period. However, comparative wheat stands achieved for the two wheat tillage systems differed among growing seasons and farmer cooperators. Of the 11 tests, no-till wheat stands were higher in 4 tests, tilled wheat stands were higher in 5 tests, and stands were equivalent in 2 tests. Wheat seeding rates were not similar for all 11 tests. Higher seeding rates were used for no-till wheat in all the tests, but this did not always result in better no-till stands nor higher stands than tilled wheat. This is evidence that more careful planting management (including residue mgt., properly equipped no-till drills, and drill adjustments for existing planting conditions) is needed for successful no-till wheat stand establishment.

67
2005 Eastern Wheat Workers / Southern Small Grain Workers Conference
Long-Term Study: The average no-till wheat stand was ~2 plants per sq. ft. less than tilled wheat over twelve years with a similar seeding rate of 32 viable seeds per sq. ft. used for both tillage systems every year. The comparative wheat stand difference achieved each year between no-till and tilled wheat varied depending on planting conditions. In some years, no-till wheat achieved a higher stand. Established wheat stands are usually lower for no-till than tilled wheat. A no-till wheat stand of 2-3 plants per sq. ft. less than tilled wheat can usually be expected. Even though lower no-till wheat stands are expected, at optimal seeding rates of 30-35 viable seeds per sq. ft., the no-till wheat stand achieved is usually high enough for maximum yield potential. Current recommendations are to increase the wheat seeding rate for no-till by 10 percent, particularly for inexperienced producers changing from tilled to no-till wheat or in fields where heavy corn residue exists or residue distribution is very non-uniform. However, many experienced no-till wheat producers do not increase the seeding rate for no-till because of their knowledge and experience with no-till wheat planting management and needed adjustments for planting conditions. No-till wheat stands often look irregular. As a result, many producers have not adopted no-till because they believe the irregular stands reduce yield potential. This may not be true because many farmers use tramlines in their wheat for spray application equipment and studies indicate yield is not reduced. The rows on each side of the tramline (unplanted row) seem to compensate for the missing stand in the tramline. Thus, a certain amount of stand irregularity encountered in a no-till wheat field can probably be tolerated. In order to better understand the effects of irregular stands on wheat yield, a study was initiated in the 1999-2000 growing season. Soon after wheat emergence, plants were removed (within-row skips were established) to result in irregular stands. Treatments included length of skip (6 to 18 inches) and also % of area skipped (containing no plants). The % area skipped resulted from varying the number of skips within a plot area. Additionally, two varieties that differed in tillering potential were compared. Wheat yield (Table 7) was affected more by the percent of area containing no plants (i.e. % area skipped) than the length of skip (18 inches or less in this study). When the % area skipped remained the same, but the length of skip increased, there was no significant change in yield. The % area skipped definitely had an effect on yield. This effect was also dependent on variety. The less prolific tillering variety (Pioneer 2552) did not show a yield reduction until 15% of the area contained skips; indicating that fields containing skipped areas of up to 10% could be tolerated. The more prolific tillering variety (Pioneer 25R26) tolerated a skipped area of up to 15% in this study without a significant yield loss.
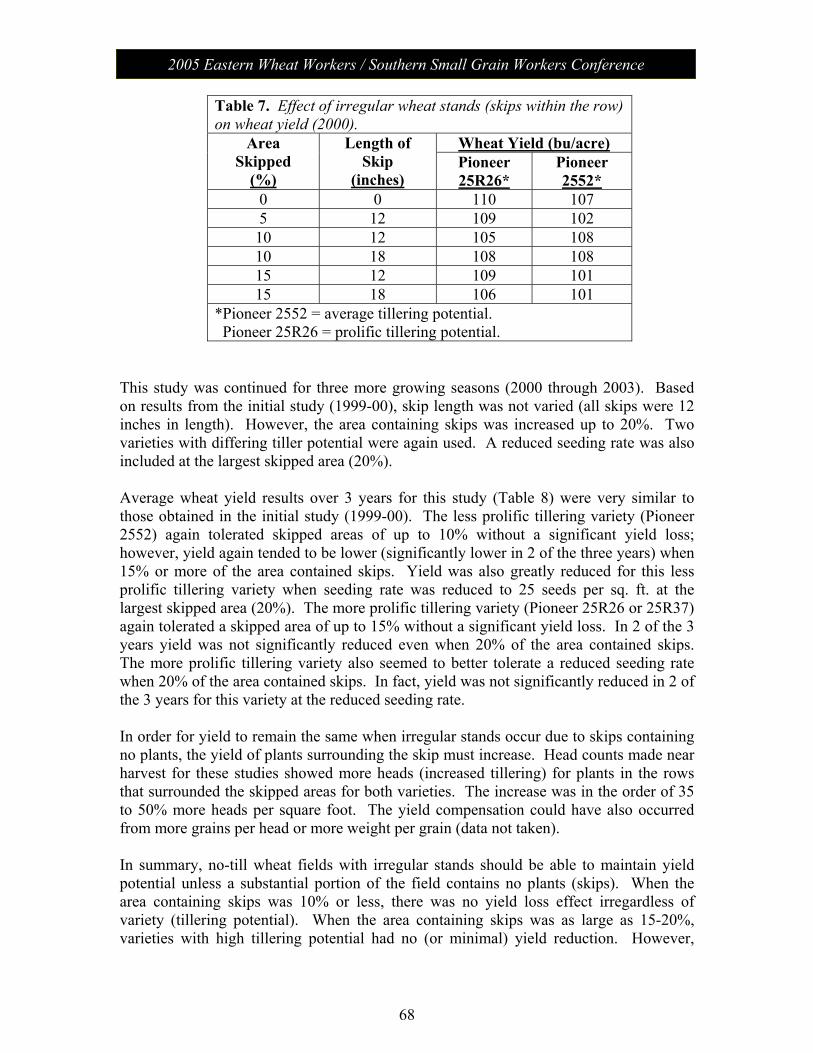
68
2005 Eastern Wheat Workers / Southern Small Grain Workers Conference
Table 7. Effect of irregular wheat stands (skips within the row) on wheat yield (2000).
Wheat Yield (bu/acre) Area Skipped
(%)
Length of Skip
(inches) Pioneer 25R26*
Pioneer 2552*
0 0 110 107 5 12 109 102 10 12 105 108 10 18 108 108 15 12 109 101 15 18 106 101
*Pioneer 2552 = average tillering potential. Pioneer 25R26 = prolific tillering potential.
This study was continued for three more growing seasons (2000 through 2003). Based on results from the initial study (1999-00), skip length was not varied (all skips were 12 inches in length). However, the area containing skips was increased up to 20%. Two varieties with differing tiller potential were again used. A reduced seeding rate was also included at the largest skipped area (20%). Average wheat yield results over 3 years for this study (Table 8) were very similar to those obtained in the initial study (1999-00). The less prolific tillering variety (Pioneer 2552) again tolerated skipped areas of up to 10% without a significant yield loss; however, yield again tended to be lower (significantly lower in 2 of the three years) when 15% or more of the area contained skips. Yield was also greatly reduced for this less prolific tillering variety when seeding rate was reduced to 25 seeds per sq. ft. at the largest skipped area (20%). The more prolific tillering variety (Pioneer 25R26 or 25R37) again tolerated a skipped area of up to 15% without a significant yield loss. In 2 of the 3 years yield was not significantly reduced even when 20% of the area contained skips. The more prolific tillering variety also seemed to better tolerate a reduced seeding rate when 20% of the area contained skips. In fact, yield was not significantly reduced in 2 of the 3 years for this variety at the reduced seeding rate. In order for yield to remain the same when irregular stands occur due to skips containing no plants, the yield of plants surrounding the skip must increase. Head counts made near harvest for these studies showed more heads (increased tillering) for plants in the rows that surrounded the skipped areas for both varieties. The increase was in the order of 35 to 50% more heads per square foot. The yield compensation could have also occurred from more grains per head or more weight per grain (data not taken). In summary, no-till wheat fields with irregular stands should be able to maintain yield potential unless a substantial portion of the field contains no plants (skips). When the area containing skips was 10% or less, there was no yield loss effect irregardless of variety (tillering potential). When the area containing skips was as large as 15-20%, varieties with high tillering potential had no (or minimal) yield reduction. However,
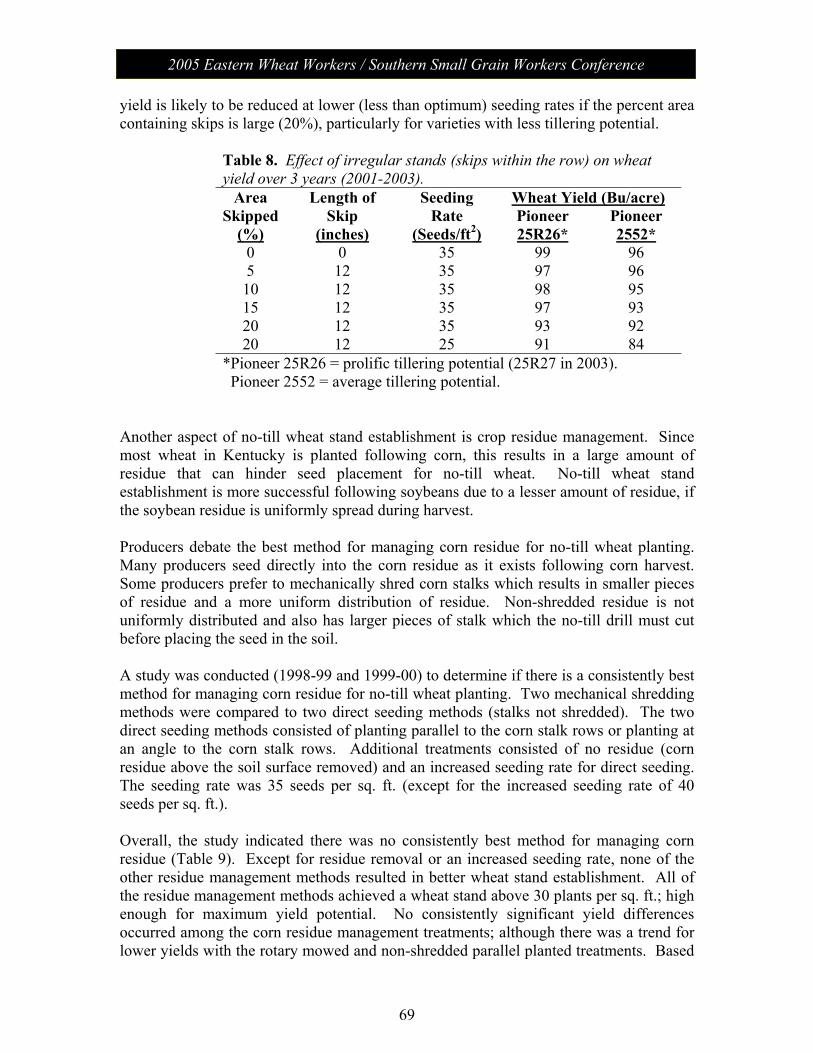
69
2005 Eastern Wheat Workers / Southern Small Grain Workers Conference
yield is likely to be reduced at lower (less than optimum) seeding rates if the percent area containing skips is large (20%), particularly for varieties with less tillering potential.
Table 8. Effect of irregular stands (skips within the row) on wheat yield over 3 years (2001-2003).
Wheat Yield (Bu/acre) Area Skipped
(%)
Length of Skip
(inches)
Seeding Rate
(Seeds/ft2) Pioneer 25R26*
Pioneer 2552*
0 0 35 99 96 5 12 35 97 96 10 12 35 98 95 15 12 35 97 93 20 12 35 93 92 20 12 25 91 84
*Pioneer 25R26 = prolific tillering potential (25R27 in 2003). Pioneer 2552 = average tillering potential.
Another aspect of no-till wheat stand establishment is crop residue management. Since most wheat in Kentucky is planted following corn, this results in a large amount of residue that can hinder seed placement for no-till wheat. No-till wheat stand establishment is more successful following soybeans due to a lesser amount of residue, if the soybean residue is uniformly spread during harvest. Producers debate the best method for managing corn residue for no-till wheat planting. Many producers seed directly into the corn residue as it exists following corn harvest. Some producers prefer to mechanically shred corn stalks which results in smaller pieces of residue and a more uniform distribution of residue. Non-shredded residue is not uniformly distributed and also has larger pieces of stalk which the no-till drill must cut before placing the seed in the soil. A study was conducted (1998-99 and 1999-00) to determine if there is a consistently best method for managing corn residue for no-till wheat planting. Two mechanical shredding methods were compared to two direct seeding methods (stalks not shredded). The two direct seeding methods consisted of planting parallel to the corn stalk rows or planting at an angle to the corn stalk rows. Additional treatments consisted of no residue (corn residue above the soil surface removed) and an increased seeding rate for direct seeding. The seeding rate was 35 seeds per sq. ft. (except for the increased seeding rate of 40 seeds per sq. ft.). Overall, the study indicated there was no consistently best method for managing corn residue (Table 9). Except for residue removal or an increased seeding rate, none of the other residue management methods resulted in better wheat stand establishment. All of the residue management methods achieved a wheat stand above 30 plants per sq. ft.; high enough for maximum yield potential. No consistently significant yield differences occurred among the corn residue management treatments; although there was a trend for lower yields with the rotary mowed and non-shredded parallel planted treatments. Based
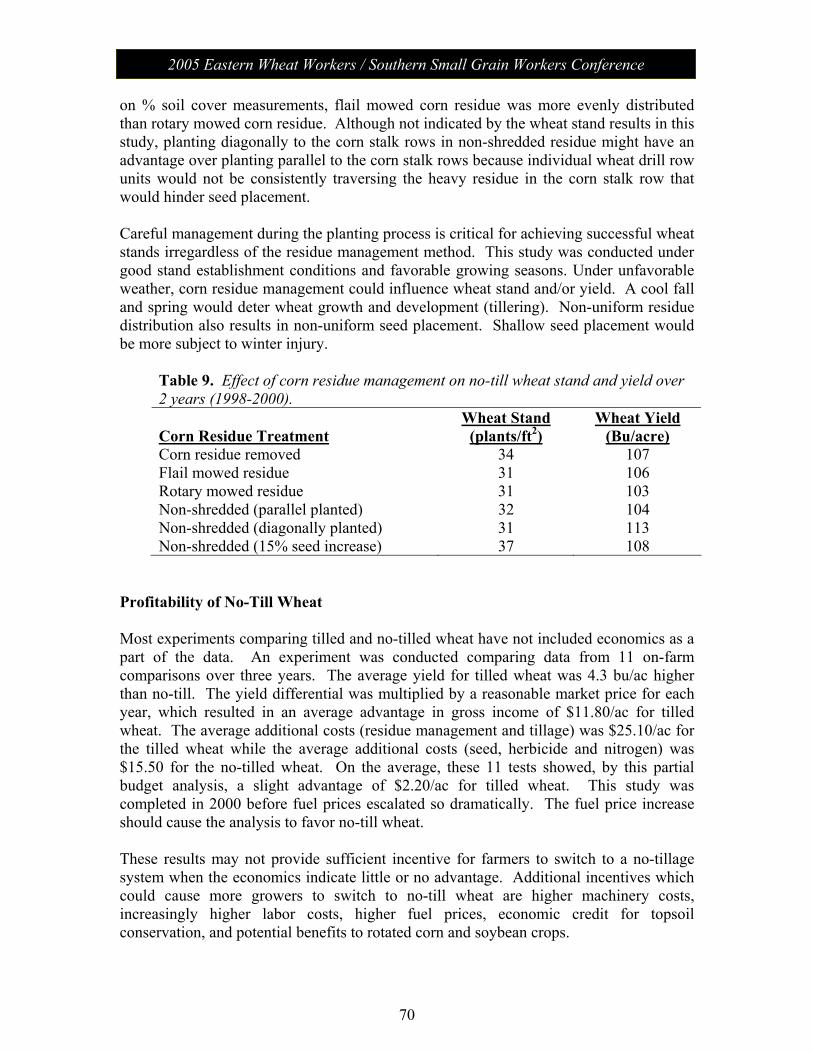
70
2005 Eastern Wheat Workers / Southern Small Grain Workers Conference
on % soil cover measurements, flail mowed corn residue was more evenly distributed than rotary mowed corn residue. Although not indicated by the wheat stand results in this study, planting diagonally to the corn stalk rows in non-shredded residue might have an advantage over planting parallel to the corn stalk rows because individual wheat drill row units would not be consistently traversing the heavy residue in the corn stalk row that would hinder seed placement. Careful management during the planting process is critical for achieving successful wheat stands irregardless of the residue management method. This study was conducted under good stand establishment conditions and favorable growing seasons. Under unfavorable weather, corn residue management could influence wheat stand and/or yield. A cool fall and spring would deter wheat growth and development (tillering). Non-uniform residue distribution also results in non-uniform seed placement. Shallow seed placement would be more subject to winter injury.
Table 9. Effect of corn residue management on no-till wheat stand and yield over 2 years (1998-2000).
Corn Residue Treatment
Wheat Stand (plants/ft2)
Wheat Yield (Bu/acre)
Corn residue removed 34 107 Flail mowed residue 31 106 Rotary mowed residue 31 103 Non-shredded (parallel planted) 32 104 Non-shredded (diagonally planted) 31 113 Non-shredded (15% seed increase) 37 108
Profitability of No-Till Wheat Most experiments comparing tilled and no-tilled wheat have not included economics as a part of the data. An experiment was conducted comparing data from 11 on-farm comparisons over three years. The average yield for tilled wheat was 4.3 bu/ac higher than no-till. The yield differential was multiplied by a reasonable market price for each year, which resulted in an average advantage in gross income of $11.80/ac for tilled wheat. The average additional costs (residue management and tillage) was $25.10/ac for the tilled wheat while the average additional costs (seed, herbicide and nitrogen) was $15.50 for the no-tilled wheat. On the average, these 11 tests showed, by this partial budget analysis, a slight advantage of $2.20/ac for tilled wheat. This study was completed in 2000 before fuel prices escalated so dramatically. The fuel price increase should cause the analysis to favor no-till wheat. These results may not provide sufficient incentive for farmers to switch to a no-tillage system when the economics indicate little or no advantage. Additional incentives which could cause more growers to switch to no-till wheat are higher machinery costs, increasingly higher labor costs, higher fuel prices, economic credit for topsoil conservation, and potential benefits to rotated corn and soybean crops.

71
2005 Eastern Wheat Workers / Southern Small Grain Workers Conference
Wheat Varieties Wheat varieties were compared in no-till and tilled wheat trials to determine whether varieties that perform well under tillage also perform well under no-tillage. Performance data was obtained from the University of Kentucky Wheat Variety Trials where no-till and tilled wheat variety tests were established at the same location site. Performance data collected from six trials over three years (1998-2000) was analyzed. Seventeen wheat varieties were compared that were common in the trials all three years. There was very good agreement between no-till and tilled performance for variety mean yield. There was a correlation coefficient of 0.85 between tilled and no-till wheat performance over 3 years at all locations. The conclusion, after three years of wheat variety tillage trials, was that varieties which performed well under tillage will very likely perform well under no-tillage. Nitrogen Fertility Recommended Nitrogen (N) rates on most no-tilled crops are higher than for tilled crops due to immobilization of N in the surface residue when the N is surface applied. Research studies indicate that an additional 20 to 30 lb/ac of N are needed to maximize yields. The present recommendations for the University of Kentucky reflect this research. Table 10 below shows this extra nitrogen is not always justified. The N in this study was managed for maximum production with one-third applied at Feekes 3 growth stage (February) and the remainder at Feekes 5 (mid-March). The recommended rate of N for no-till is 120 lb/ac and 90 lb/ac for tilled wheat. The no-tilled wheat sometimes appeared to be slightly N deficient before the second application, but in most years this had little effect on yield. Table 10 shows that the increase of N rate from 90 to 120 lbs/ac. had only a small effect on yield for the 11 years (No-till 4 bu/a, tilled 2 bu/a). Although 120 lbs/a N is recommended for no-till plantings, it is not always justified. The years that this rate of N resulted in higher yields were when late winter freezes resulted in wheat damage or when excessive amounts of rain fell after the first application of N. The 120 lb/ac rate of N was significantly higher than the 90 lb/ac rate 5 of the 11 years. The economic returns for the extra 30 lbs/ac of N on no-till wheat would only be slightly above a breakeven situation when considered over the 11 years. Table 10. Effect of nitrogen rates on tilled and no-tilled wheat over 11 years (1993- 2003)
Tillage
Nitrogen Rate (Total)
(Lb/ac)
Yield
(Bu/ac)
No-till 90 91.4 No-till 120 95.3 Tilled 90 95.8 Tilled 120 97.9

72
2005 Eastern Wheat Workers / Southern Small Grain Workers Conference
Weed Control Weed control was found to be one of the most important issues in making no-tillage wheat successful (Table 11). Yield reductions from improper or no weed control varied by year and was almost 40% less some years. On the average, over the 11 years, yield was reduced by 15 to 20%. Without herbicide applications in the fall or spring, weed competition was mainly from henbit and some chickweed, annual bluegrass and field pansy. Good weed control was obtained in no-till wheat by three treatments: 1) Harmony Extra applied in the fall about 30 to 45 days after planting, 2) a contact herbicide at planting plus Harmony Extra in the spring at Feekes 5 to 6 growth stage, and 3) Harmony Extra in the spring at Feekes 5 to 6 growth stage. The recommended method to assure good weed control is a contact herbicide at planting plus Harmony Extra in the spring at Feekes 5 to 6 growth stage. Table 11. Effect of weed control and weed control methods on no-tilled wheat over 11 years (1993-2003)
Tillage
Weed Control Yield (Bu/ac)
No-till Gramoxone at planting 95.3 Harmony Extra in spring
No-till Harmony Extra 30-45 days 94.6 After planting
No-till Harmony Extra in spring 92.9
No-till None 80.4 Insects Insects were monitored in an 11 year trial comparing tilled and no-tilled wheat. Insects were monitored by use of scouting and traps. No significant insect infestations occurred. A few aphids, true army worms and cereal beetles were present but never approached the economic threshold. There was no difference between tilled and no-tilled treatments and no insect problems common to no-tillage have been reported by farmers. An insecticide applied in the fall to control aphids (and the transmission of Barley Yellow Dwarf) is common in both tilled and no-tilled wheat. Diseases Diseases were monitored over the 11 years of the trial. The only significant disease in different trials has been Barley Yellow Dwarf and Head Scab.

73
2005 Eastern Wheat Workers / Southern Small Grain Workers Conference
The Barley Yellow Dwarf was present the first year of an 11 year trial in both tilled and no-tilled wheat and was more prevalent in the no-till wheat treatments. After the first year, insecticides were applied each fall and the disease was never present, to any extent, during the remaining 10 years. Head Scab is a fusarium fungal organism that is common on decaying corn stalks. Many plant pathologists and wheat experts in the U.S. feel that no-till wheat planted after corn would be a disaster when the conditions are right for the expression of the disease in wheat because of the large inoculum base. However, wheat pathologists in Kentucky feel this would not be true in this state where most crops are no-tilled. The inoculum would still be available from surrounding fields or from some corn residue still on the surface after tillage. A 4-year on-farm trial confirms that there seems to be little difference in Head Scab on tilled or no-tilled wheat (Table 12). In this trial, large fields were split for side-by-side comparisons of no-till and tilled wheat planted behind corn. Each treatment had a minimum of 20 acres so the data should somewhat represent a field situation. The disease was significant in 2002 and 2003. It was a severe problem in 2004. The data collected shows no trends to indicate that no-tilled wheat fosters conditions that result in a higher amount of Head Scab. Table 12. Effect of tillage on the incidence and severity of Head Scab in large acreage comparisons in 2002, 2003, and 2004
Year Tillage Incidence* (% of heads)
Severity* (% of head)
Severity* Index (%)
VSK* (%)
2002 No-Till 18.5 33.9 6.6 Tilled 19.4 27.5 5.7
2003 No-Till 24.0 10.6 2.4 Tilled 39.7 24.4 7.4
2004 No-Till 61.5 35.5 21.5 41.1 Tilled 68.2 41.5 27.9 48.3
Average No-Till 34.7 26.7 10.2 41.1 Tilled 42.4 31.1 13.7 48.3
*Incidence - % of heads in field with Head Scab. Severity - % of infected head showing symptoms. Severity Index – Combined rating of Incidence and Severity. VSK - % Visual shriveled kernels
Long Term Rotational Effects No-till wheat established in a crop rotation including no-till double-crop soybeans and no-till corn resulted in a soil structural change and a subsequent increase in yields. A long term (11 years) small plot trial established to compare tilled and no-tilled wheat indicates that both no-till double-cropped soybeans and no-till corn tend to yield more (4.6% for soybeans and 4.4% for corn) when planted behind no-till wheat as compared to tilled wheat (Table 13). The yield increase was statistically significant 40% of the time for no-till corn and 27% of the time for no-till soybeans. These yield differences indicate
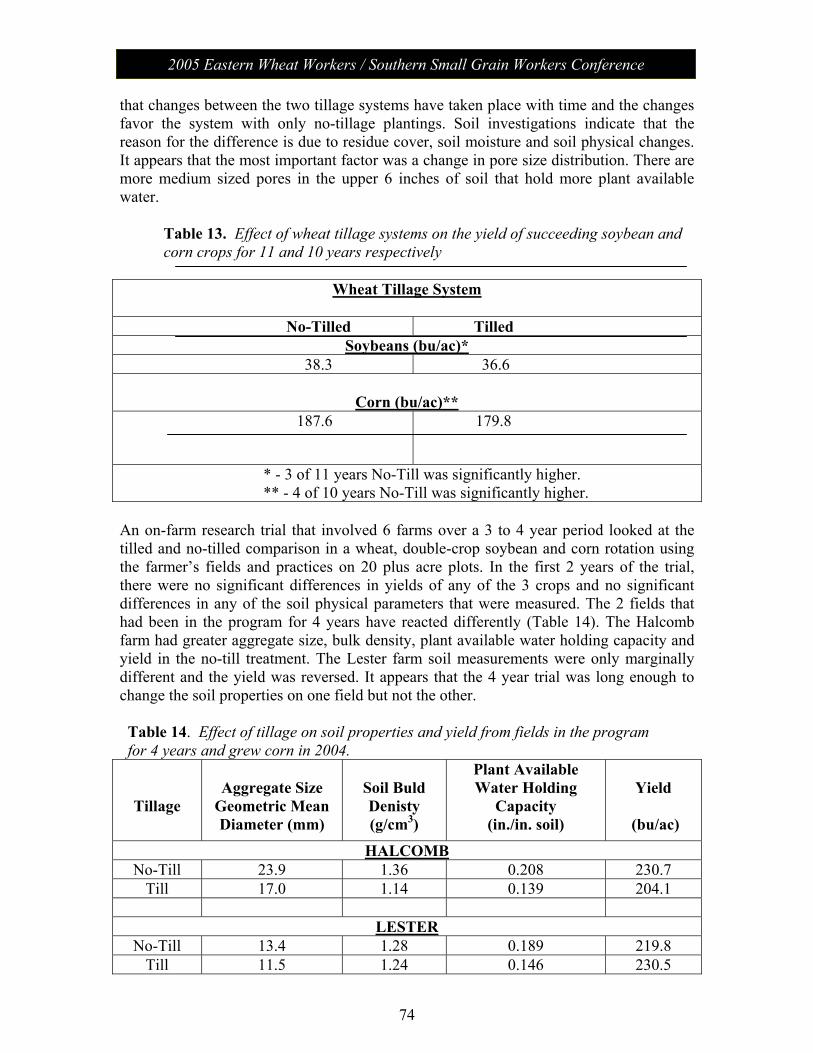
74
2005 Eastern Wheat Workers / Southern Small Grain Workers Conference
that changes between the two tillage systems have taken place with time and the changes favor the system with only no-tillage plantings. Soil investigations indicate that the reason for the difference is due to residue cover, soil moisture and soil physical changes. It appears that the most important factor was a change in pore size distribution. There are more medium sized pores in the upper 6 inches of soil that hold more plant available water. Table 13. Effect of wheat tillage systems on the yield of succeeding soybean and corn crops for 11 and 10 years respectively
Wheat Tillage System
No-Tilled Tilled
Soybeans (bu/ac)* 38.3 36.6
Corn (bu/ac)**
187.6 179.8
* - 3 of 11 years No-Till was significantly higher. ** - 4 of 10 years No-Till was significantly higher.
An on-farm research trial that involved 6 farms over a 3 to 4 year period looked at the tilled and no-tilled comparison in a wheat, double-crop soybean and corn rotation using the farmer’s fields and practices on 20 plus acre plots. In the first 2 years of the trial, there were no significant differences in yields of any of the 3 crops and no significant differences in any of the soil physical parameters that were measured. The 2 fields that had been in the program for 4 years have reacted differently (Table 14). The Halcomb farm had greater aggregate size, bulk density, plant available water holding capacity and yield in the no-till treatment. The Lester farm soil measurements were only marginally different and the yield was reversed. It appears that the 4 year trial was long enough to change the soil properties on one field but not the other. Table 14. Effect of tillage on soil properties and yield from fields in the program for 4 years and grew corn in 2004.
Tillage
Aggregate Size
Geometric Mean Diameter (mm)
Soil Buld Denisty (g/cm3)
Plant Available Water Holding
Capacity (in./in. soil)
Yield
(bu/ac)
HALCOMB No-Till 23.9 1.36 0.208 230.7
Till 17.0 1.14 0.139 204.1
LESTER No-Till 13.4 1.28 0.189 219.8
Till 11.5 1.24 0.146 230.5
75
2005 Eastern Wheat Workers / Southern Small Grain Workers Conference
Protein Variability in Soft Red Winter Wheat: Nitrogen Timing and Rates
Dianne Farrer, Randy Weisz, Paul Murphy, Ron Heiniger North Carolina State University, Dept. of Crop Science
Introduction The demand for soft red winter wheat (Triticum aestivum L.) by the milling and baking industry in the Southeastern USA continues to grow, and the region’s millers generally pay a premium for locally grown high quality grain. However Southeastern grain protein content is highly variable making regional wheat less desirable to millers who currently import approximately 50 % of their soft red winter wheat from the Midwestern USA where protein content is generally more consistent. Given the negative influence grain protein variability has on the marketability of Southeastern wheat, we wanted to determine how different N fertilizer strategies typical to the region might be contributing to this problem. In this light, our primary objective was to determine how different N fertilizer rates and times of application would affect overall grain protein variability. Materials and Methods Experiments were conducted in the North Carolina Piedmont, Coastal Plains, and Tidewater in 2002 and 2003. At each site C 9704 was grown in a split plot design with five replications. Main plots (“GS 25 N”) consisted of five N rates (0, 34, 68, 102, and 136 kg ha-1) applied at GS 25. Sub-plots consisted of an additional five incremental N treatments (0, 34, 68, 102, and 136 kg N ha-1) applied at GS 30 (“GS 30 N”) resulting in 25 different combinations of N rates and application times. Sub-plots were harvested with a small plot Massey-Ferguson MF-8 or Gleaner K2 combine equipped with a Harvest-master grain gauge. Grain N concentration was determined using a CHN analyzer at Waters Agriculture Laboratories. Grain N concentrations were converted to grain protein by multiplying by a conversion factor of 5.83. Statistical analysis was done in PROC MIXED SAS version 8. In addition to testing each effect’s statistical significance, the proportion of the total variance contributed by the effect was also determined. The variance associated with each of the 25 N treatments was further evaluated using two stability indices. First we used the standard deviation of the grain protein associated with each N treatment. The second index, followed methods describe by Eberhart and Russell (1966) for estimating genotype yield stability. We modified this approach using N treatments instead of genotypes, and grain protein content instead of yield. Results Environment, GS 25 N, GS 30 N and all interactions were significant for grain protein (Table 1). However, only 22.8 % of the variability in grain protein was associated with environment. On the other hand, 51.8 % of the protein variability was attributed to N

76
2005 Eastern Wheat Workers / Southern Small Grain Workers Conference
treatments that included differences in the total amount of N applied and the timing of those applications.
Table 1. ANOVA for grain protein.
Source of variation df Grain
protein Variability
(%) Environment (E) 6 *** 22.8 GS 25 (N25) 4 *** 33.6 GS 30 N (N30) 4 *** 18.2 E × N25 24 ** 2.1 E × N30 24 *** 4.1 N25 × N30 16 *** 0.8 E × N25 × N30 88 ** 1.1 Residual 480 9.9
***, **, significant at p = 0.001, and 0.01 respectively. Total Spring Nitrogen Applied: Treatment means for grain protein ranged from 104.3 to 138.8 g kg-1 and were closely associated with the total amount of N applied (Fig. 1). Higher N rates not only resulted in higher mean grain protein (Fig. 1), but also resulted in higher grain protein variability. For all 25 N treatments, the grain protein standard deviations and means were correlated (r = 0.81, Fig. 2). This indicates that as spring N rate increased, grain protein increased (Fig. 1), but at the cost of lowered stability. In fact, for an increase from 106.5 to 134.8 g kg-1 in mean protein, the standard deviation doubled. Treatment grand protein means were positively correlated (r = 0.83) with the treatment Eberhart and Russell regression coefficients (Fig. 3). This is consistent with the results shown in Fig. 2, and further indicated that as mean grain protein increased the protein stability across environments associated with that N treatment decreased. At low N rates grain protein was unresponsive to the environment, and therefore relatively stable. At high N rates, however, there was a large difference between the protein content produced at favorable environments compared to that produced at poorer environments. This indicates that when high spring N rates are widely used, high protein grain may be produced at favorable locations, but those N rates will also result in high protein variability across the entire region. Nitrogen Timing: Some of the spread in the data shown in Fig. 3 could be attributed to the timing of spring N application. To illustrate this timing effect we analyzed two subsets of the data. The first subset consisted of the five “early” treatments that received at least 80 % of the total spring N at GS 25. This contrasted with the second subset consisting of the five “late” treatments that received at least 80 % of the total spring N at GS 30 (Fig. 4). Application timing (“early” or “late”) was statistically significant as a class variable, and both linear and quadratic terms for treatment mean grain protein were statistically significant covariates. On average, at any given mean protein level applying N at GS 25 resulted a regression coefficient that was 0.36 lower compared to applying N at GS 30.

77
2005 Eastern Wheat Workers / Southern Small Grain Workers Conference
Fig. 1. Mean grain protein (g kg-1) and total N applied (kg ha-1) for each N treatment.
JJJ
JJJ
J
J
JJ
JJJJJ J
JJJ
J
JJ
JJ
J
100
105
110
115
120
125
130
135
140
0 50 100 150 200 250 300
Trea
tmen
t Mea
n G
rain
Pro
tein
(g/k
g)
Total Spring N Applied (kg/ha)
Fig. 2. Grain protein standard deviation (g kg-1) and mean (g kg-1) for each N treatment.
E
E
E
E
EE
E
EE E
E
EE
E
E
EE
E
E
E E
E
E E E
4
5
6
7
8
9
10
11
12
100 110 120 130 140
Trea
tmen
t Sta
ndar
d D
evia
tion
(g/k
g)Treatment Mean Grain Protein (g/kg)
Fig. 3. Eberhart and Russell regression coefficients and mean grain protein (g kg-1).
C
C
C
C
C C
C
C
C
C
CC
C
C
C
C
CC
C
CC
C
CC C
0.2
0.4
0.6
0.8
1
1.2
1.4
1.6
100 110 120 130 140
Reg
ress
ion
Coe
ffici
ent
Treatment Mean Grain Protein (g/kg)
Fig. 4. Eberhart and Russell regression coefficients and overall treatment mean grain protein (g kg-1) for “Early” and “Late” N treatments.
B
B
B BB
E
E
EE
E
0.2
0.4
0.6
0.8
1
1.2
1.4
100 105 110 115 120 125 130Treatment Mean Grain Protein (g/kg)
B Early
E Late
Discussion Our objective was to determine how different N fertilizer rates might affect grain protein variability. The majority of protein variability (51.8 %) was attributed to N treatments. Increases in total spring N rates increased grain protein amounts (Fig. 1). Clearly, if producers within a region use different N rates, that fact alone will result in variability in soft red winter wheat grain protein content.
78
2005 Eastern Wheat Workers / Southern Small Grain Workers Conference
Not only did grain protein levels increase at higher N rates, but so also did overall protein variability (Fig. 2). All the protein interaction terms that included environment and N treatment were significant (Table 1). Low N rates resulted in relatively stable grain protein levels across environments. At unfavorable environments (possibly characterized by highly leachable soils, poor soil fertility, or years with very high or low rainfall), increasing N rates had a relatively small effect on grain protein. High N rates, however, when matched with favorable environments resulted in large increases in protein. On a regional basis this means that if a large percentage of producers are applying high N rates, grain protein will be highly unstable. There was a difference in protein stability between treatments that applied the majority of spring N at GS 25 instead of GS 30 (Fig. 4). When the early and late treatments are pooled into two groups, this trend becomes statistically significant and this is perhaps the most surprising of our findings. At a given grain protein content (Fig. 4, X-axis), applying the majority of spring N at GS 25 resulted in a lower Eberhart and Russell regression coefficient (Y-axis), and consequently a protein content that is less sensitive to environmental differences and which would be more regionally stable.
References Eberhart, S.A., and W.A. Russell. 1966. Stability parameters for comparing varieties. Crop Sci. 6:36-40.
79
2005 Eastern Wheat Workers / Southern Small Grain Workers Conference
Update on Variety Release Procedures, Branding, PVP, Patents
David Whitt Crop and Soil Environmental Sciences Department, Virginia Tech
Introduction Point one: Explanation of my role in the plant germplasm release process. Point two: Review Virginia Tech policies and procedures for releasing plant germplasm. Point three: Virginia Tech policy on cultivar protection. Point four: Review types of releases made by Virginia Tech since 2000. Point One - My Role in the Plant Germplasm Release I work for Virginia Tech as Manager of the Virginia Seed Certification Program and serve as Secretary/Treasurer of the Virginia Crop Improvement Association. In addition to the inspection of certified seed, the Virginia Crop Improvement Association is responsible for the collection of research fees/royalties on publicly released crop varieties and for the operation of the Virginia Foundation Seed Division. The Association has also established a Licensed Products Division. One of the primary objections of the VCIA is to provide funding and other support to the Plant Breeders at Virginia Tech. The Manager of the Virginia Foundation Seed Division serves on the College Germplasm Release Committee, which approves variety releases, and on the Plant Germplasm Marketing Committee, which reviews marketing plans submitted by companies wanting to obtain the right to sell Virginia Tech released varieties. Crops that we have worked with include peanuts, soybeans, barley, and wheat. The VCIA has worked with Virginia Tech since 1988 in collecting research fees. The Hutcheson soybean was the first variety we collected royalties on. The amount charged on this variety is $.20/unit, split 50/50 with the collecting state. To date, $1.5 million has been returned to Virginia Tech from Hutcheson. Point Two – Virginia Tech Policies and Procedures for Releasing Plant Germplasm The Policies and Procedures for Releasing Plant Germplasm, approved in 1996, spells out how new varieties are released from Virginia Tech. Two categories of germplasm are listed. A.) New Plant Cultivars, and B.) Basic and Novel-Genetic Materials. All plant materials released as cultivars from Virginia Tech now have a royalty charged. This includes public releases, exclusive releases, and cultivars developed under sponsored research. How is the decision made on the type of release, public or exclusive? Virginia Tech continues to have as one of its primary goals for its Plant Breeding Program, to meet the needs of Virginia producers by developing adapted varieties. Both public and exclusive releases to companies that market seed in Virginia are pursued. The originating Plant Breeder, with input from the Foundation Seed Manager and others, designates which varieties will be released publicly. Lines which have potential to be released exclusively
80
2005 Eastern Wheat Workers / Southern Small Grain Workers Conference
are made available for testing to companies that have shown an interest in Virginia developed material. After receiving approval from the College Germplasm Release Committee, a notice of proposed release is mailed to interested parties. A follow-up letter is sent telling companies when marketing plans are due. Bids in the form of marketing plans that give proposed marketing territory, promotional plans, expected volume, cultivar name, PVPA intentions, fees for marketing rights, and fees for sale of each unit of seed sold are reviewed by a Germplasm Marketing Committee. The Germplasm Marketing Committee makes a recommendation to the Intellectual Properties Manager on which plan will likely offer the widest distribution of seed and maximum return. Point Three – Intellectual Properties Protection Virginia Tech encourages that varieties released by the Virginia Agricultural Experiment Station be protected. Protection under the Plant Variety Protection Act is considered on a case by case basis. The final decision is in the hands of the Virginia Agricultural Experiment Station Director and Virginia Tech Intellectual Properties. Point Four – Virginia Agricultural Experiment Station Plant Releases Since 2000 A total of 30 cultivars have been approved for release since 2000 at Virginia Tech: Two peanut varieties, four soybean varieties, one winter hulless barley variety, two winter barley varieties, and twenty-one winter wheat varieties. Two Peanut Varieties 2 public releases – PVPA Title V Four Soybean Varieties 1 dropped 1 glyphosate tolerant - Exclusive release – no protection 1 developed under sponsored research – Exclusive release – PVPA Title V 1 conventional line (Teejay) – Public release – PVPA Title V One Winter Hulless Barley Variety 1 public release – PVPA Title V Two Winter Feed Barley Varieties 2 public releases – PVPA Title V Twenty-one Winter Wheat Varieties 4 dropped 2 public releases – PVPA Title V 15 Exclusive releases – various forms of protection, PVPA, PVPA Title V, no protection

81
2005 Eastern Wheat Workers / Southern Small Grain Workers Conference
Molecular Characterization of Wheat -Thinopyrum intermedium Translocations Carrying Bdv3 Resistance to Yellow Dwarf Viruses
Ligia Ayala-Navarrete, Nicole Thompson, Herbert W. Ohm and Joseph M. Anderson
USDA-ARS Crop Production and Pest Control Research Unit and Purdue University,
West Lafayette, IN 47907, USA Thinopyrum intermedium translocations, derived from the wheat substitution line P29, were previously characterized. We have further analyzed these lines and additional related germplasm with publicly available STS and SSRs. The resulting 7D/7E chromosome maps appeared as a mosaic of wheat and Th. intermedium chromatin sections although genomic in situ hybridization data could not detect this mosaic pattern. F2 progeny of two crosses (CS/216-1 and CS/260-1) were analyzed with molecular markers to verify the composition of the translocation lines suggested by the RFLP-PCR map. Both populations gave an unexpectedly high number of distinct recombinant individuals. These data suggest that interstitial translocations occur more frequently than previously thought. Using PCR-based molecular markers identified in this study, five out of 12 elite lines, previously selected in the field for low Yellow Dwarf Virus (YDV) symptoms and good yields, contained Th. intermedium chromatin. Because of the multiple components involved in the YDV disease complex, selecting for YDV resistance with the molecular markers and maps identified in this study will increase the efficiency of introgressing Th. intermedium chromatin containing Bdv3 YDV resistance into elite wheat germplasm.
82
2005 Eastern Wheat Workers / Southern Small Grain Workers Conference
Thinopyrum intermedium-Derived Cereal Yellow Dwarf Virus Resistance Results from a Restriction of Virus Movement and Altered
Aphid Feeding
Joseph M. Anderson and HathaithipWiangjun
USDA-ARS Crop Production and Pest Control Research Unit and Purdue University, West Lafayette, IN 47907, USA
The lack of effective resistance to Barley and Cereal Yellow Dwarf Viruses (YDV) required the integration of resistance from Thinopyrum intermedium. This resistance, Bdv3, provides complete resistance to Cereal Yellow Dwarf Virus (CYDV) and partial resistance to Barley Yellow Dwarf Virus (BYDV). Resistance, however, does not inhibit viral replication. Cellular analyses have shown that this CYDV resistance is caused by a significant inhibition of systemic virus movement. Further analysis also demonstrated a negative effect on the feeding behavior of the aphid vector. Consequently, Th. intermedium-derived CYDV resistance appears to act at two levels; aphid feeding and virus spread.
83
2005 Eastern Wheat Workers / Southern Small Grain Workers Conference
Effect of Seed Rate and Gaucho Seed Treatment on Aphid and BYD Incidence and Yield Parameters of Winter Wheat
G. D. Buntin1 and R. D. Lee2
1 Dept. of Entomology, University of Georgia, Griffin, GA 30223
2 Dept. of Crop and Soil Sciences, University of Georgia, Tifton, GA 31794 Recent studies by RDL Have found that full wheat yield could be achieved with modern winter wheat cultivars while reducing seeding rates by 30% or more. Gaucho 480 insecticides seed treatment can reduce aphid infestations and barley yellow dwarf incidence but this treatment generally is not cost effective at higher seedling rate. This study was conduct to evaluate the effect of Gaucho seed treatment at reduced seeding rates on aphid infestation, BYD incidence, wheat tillering and yield. Trials were conducted at Plains and Tifton GA in 2003/2004. Two cultivars 'AGS 2000' and 'Roberts' were planted at four seed rates, 10, 20, 30 and 40 seeds per ft2 with and without Gaucho 480 at 1.5 fl oz per 100 lbs seed. Treatment interactions including cultivar by seed rate usually were not significant. Cultivar did not affect number of plants, final tillers, and stems (with spike). Cultivars also had similar yield at Tifton but Roberts yielded more at Plains. Gaucho did not consistently affect plant or spike number or grain yield, but did increase final tiller number at higher seeding rates. Seeding rate significantly affect all agronomic variables including grain yield. Grain yield were similar at 30 and 40 seeds per ft2 but were lower at 10 seeds per ft2. Aphid infestations and BYD incidence were greater at Tifton than Plains. Aphid numbers per unit area were not different among seeding rates but aphids per plant declined as seeding rate increased. Gaucho effectively controlled aphids at 30 days after planting. BYD incidence at Tifton also declined on both a unit area and per plant basis as seeding rate increased. BYD incidence at Plains was low and not different among seed rate. These results suggest that wheat seedling rates can be reduced without adversely affecting yield. However, reduced seeding rates and thus reduced plant populations may increase the risk of aphid infestation and BYD infection thereby making aphid control more critical.
84
2005 Eastern Wheat Workers / Southern Small Grain Workers Conference
Artificial Field Inoculation With Stagonospora nodorum to Enhance Disease Severity
C. Cowger, USDA-ARS, North Carolina State University, Raleigh, NC.
Stagonospora nodorum blotch (SNB), or “glume blotch,” can cause yield loss throughout the eastern soft red winter wheat region. Breeding for resistance to SNB is hampered by the absence of adequate disease pressure in many years and locations. Using five SRW varieties with different levels of susceptibility to SNB, we compared three artificial inoculation treatments to natural epidemics in two North Carolina locations, Kinston and Plymouth, in 2003-04. Artificial treatments consisted of 1) spores sprayed on plants at early tillering, 2) straw applied to plots at early tillering, or 3) spores sprayed at boot stage. Disease was assessed three times at each location, and yield of each plot was measured and adjusted to account for moisture content. All three artificial inoculation techniques enhanced disease severity as compared to natural inoculum. In both locations, moderately resistant varieties were separated from susceptible varieties by both natural and artificial inoculation, although variety rankings were more consistent among all treatments at Kinston than at Plymouth. This is likely because the results at Plymouth were confounded by severe epidemics of barley yellow dwarf virus (BYDV) and soilborne viruses. Yields were significantly reduced in comparison to naturally inoculated plots by inoculation with straw at Kinston and with spores at boot stage at Plymouth.

85
2005 Eastern Wheat Workers / Southern Small Grain Workers Conference
Frequency of the Teleomorph of Phaeosphaeria nodorum on Winter Wheat in North Carolina, USA.
C. Cowger(1) and H.V. Silva-Rojas (2).
(1) USDA-ARS, Raleigh, NC; (2) Colegio de Postgraduados, Montecillo, México. Ascocarps of Phaeosphaeria nodorum, which causes Stagonospora nodorum blotch of winter wheat, have not been previously reported in the northeastern or southeastern U.S. despite prolonged searching. We sampled tissues from living wheat plants or wheat debris in Kinston, North Carolina, each month except June from May to October 2003. Altogether, over 1,000 fruiting bodies were examined microscopically and tallied as P. nodorum pycnidia or ascocarps, “empty,” or “other fungi.” P. nodorum ascocarps were present each month after May at a frequency of 0.8%-5.4%, and comprised a significantly higher percentage of fruiting bodies from wheat heads than of those from lower stems and leaves. Among fruiting bodies collected in August 2004 at Kinston and examined as described above, about 10% of those from wheat heads were P. nodorum ascocarps. Because the reproductive structures of P. nodorum are easily confused with those of the morphologically similar P. arenaria, the internally transcribed spacer (ITS) regions of Phaeosphaeria isolates from Kinston and Plymouth, NC, were sequenced and compared to known sequences of both species. The mating type of isolates from 2003 and 2004 was also determined, and an approximate balance was found between mating type 1 and mating type 2. We conclude that in the North Carolina P. nodorum population, sexual reproduction plays a role in initiation of new epidemics and the creation of adaptively useful genetic variability, although its relative importance in structuring this population is still unknown.

86
2005 Eastern Wheat Workers / Southern Small Grain Workers Conference
Assessment of Cultivar Mixtures as a Tool to Manage Powdery Mildew Disease of Soft Red Winter Wheat
Christina Cowger
USDA-ARS, North Carolina State University, Raleigh, NC, USA
Seed mixtures, or blends, of small grain cultivars have been widely used to manage foliar fungal diseases and stabilize yield. However, such mixtures are unknown in the eastern U.S. soft red winter wheat region, where powdery mildew and leaf rust regularly take a significant toll, along with other diseases and abiotic stresses. In 2003, a mixture experiment was conducted at Kinston, Plymouth, and Salisbury, NC, with four early-maturing and four medium-late-maturing wheat varieties that are grown commercially in that state. The varieties were planted in pure stands and in four 1:1 mixtures of a resistant and a susceptible variety in each maturity class. All treatments were planted in plots of both 20.4 m2 and 1.1 m2, and replicated three times for each plot size. Plots of barley, a non-host to the wheat mildew pathogen, were interspersed in a checkerboard design, and spreader rows of a mildew-susceptible wheat cultivar were planted. A moderately severe powdery mildew epidemic occurred at Kinston, where disease was assessed four times at seven- or eight-day intervals, and leaf rust severity was also evaluated at that site. Yields and test weights were determined at all locations. The quality characteristics measured were protein content, hardness, seed diameter, and falling number (a parameter related to sprouting tolerance).

87
2005 Eastern Wheat Workers / Southern Small Grain Workers Conference
Analysis of Wheat Powdery Mildew Population Structure R. Parks, I. Carbone, and C. Cowger.
USDA –ARS, North Carolina State University , Raleigh, NC, USA
Throughout the eastern U.S., and several other wheat-growing regions of the world, powdery mildew is a major constraint to the growth of wheat. Currently, resistant cultivars are the most effective and economical method of controlling this disease. Unfortunately, the diversity of the powdery mildew population and its reproductive system confer on the pathogen the ability to rapidly adapt to resistant varieties. Until now, investigation of the population structure of powdery mildew has relied on markers such as AFLPs, as well as virulence assays. Now, however, decreases in the cost of sequencing have made possible the use of genealogy-based methods (coalescent and nested clade analysis) to elucidate the population structure and draw inferences about evolutionary processes. We are using a combination of nonparametric and parametric approaches to estimate the rates of gene flow, mutation, and selection and their consequences for durable resistance.
Samples of mildew cleistothecia from 2003 and 2004 have been collected from the eastern U.S. Single-ascospore isolates are inoculated on 16 cultivars, each with one major resistance gene, as well as one universal suscept, to determine isolates’ virulence profiles. Preliminary results from Kinston, NC, indicate that few or no isolates are virulent on Pm1a, Pm16, and Pm17 while isolates are virulent to Pm8 at very low frequency. Virulence to Pm3a, Pm3b, and Pm5a is ubiquitous in the population. DNA sequence analysis of intron SNPs is also being carried out to reconstruct the phylogenetic relationships among isolates. We will address questions such as whether the population is subdivided, the estimated rate of migration and gene flow across different spatial scales, and the role of geographic features such as the Appalachian Mountains in structuring the population.
88
2005 Eastern Wheat Workers / Southern Small Grain Workers Conference
Targeted Mapping of Wheat ESTs Linked to the Adult Plant Resistance Gene Lr46 Using Synteny with Rice
Maria Mateos-Hernandez Kansas State University
Ravi P. Singh CIMMYT, Mexico Scot Hulbert Kansas State University Bikram S. Gill Kansas State University
Gina Brown-Guedira USDA/ARS, Raleigh, NC
Leaf rust or brown rust (caused by Puccinia triticina) is a widespread fungal disease in wheat growing regions. Breeding for resistant cultivars is the most feasible alternative to control the disease. Two adult plant resistance genes (Lr34 and Lr46) have been reported to confer stable resistance to all known races of the pathogen and are thought to be durable. The Lr46 gene is located in the terminal region of wheat chromosome 1BL. Our objective was to exploit the syntenic relationship between the distal part of chromosome 1BL of wheat and 5L of rice to saturate the Lr46 region and develop markers tightly linked to the gene. Wheat expressed sequence tags (ESTs) that mapped in the FL=0.85-0.89 by the NSF project were blasted against the rice genome sequence and wheat ESTs with significant homology to sequences from 5L of rice were chosen for STS primer design. The STS markers were physically mapped using wheat aneuploids and deletion lines from chromosome 1BL and genetically mapped in two populations segregating for Lr46. A total of 21 STS markers physically mapped in the chromosomal region of Lr46, allowing us to determine the physical location of the gene. Eight polymorphic STS markers were genetically mapped in the Lr46 region. The most closely linked STS markers flanking Lr46 were located 3.0 cM proximal and 0.7 cM distal to the gene. These STS markers can be used to design markers for MAS and will facilitate positional cloning of the gene.

89
2005 Eastern Wheat Workers / Southern Small Grain Workers Conference
Comparison of Deoxynivalenol (DON) Analysis on Wheat Milled With Different Grinders
E.A. Brucker and F.L. Kolb*
Department of Crop Sciences, University of Illinois, Urbana, IL 61801, USA
*Corresponding Author: PH (217) 333-9485, Email: [email protected] Deoxynivalenol (DON), a mycotoxin produced by Fusarium graminearum (Schwabe), is quantified in parts per million (ppm) by performing an ELISA assay on ground wheat samples. When grinding wheat with a coffee grinder, we noticed coarse pieces of bran in the samples. Before the flour is assayed, it is sifted and ungrounded pieces are discarded. This lack of uniformity in the fineness of the flour could cause variability in DON content results if a large portion of the DON is in the bran. Our objective in this study was to determine if the fineness of the wheat flour samples effects the results of DON assays. Six wheat lines from the Northern Uniform Winter Wheat Scab Nursery were selected to cover a range of DON levels from 0.8 to 21 ppm. One sample of scabby grain from each line was mixed and divided between two grinders, a coffee grinder and a Whisper mill. The Whisper mill was used to produce finely ground flour. Three sub-samples from each grinder were assayed for DON content. Using the coffee grinder yielded significantly higher mean DON levels for the two lines with the highest DON content, and a significant line by grinder interaction was also present for these two lines. For the other four wheat lines, the grinder used to mill the wheat sample did not significantly affect the DON levels measured in the assay.
90
2005 Eastern Wheat Workers / Southern Small Grain Workers Conference
Effect of Glyphosate on Gibberella zeae Schwabe (Petch) (anamorph Fusarium graminearum (Schwabe)) Mycelial Growth and Macroconidia
Production
A.D. Wilson, E.A. Brucker, and F.L. Kolb*
Department of Crop Sciences, University of Illinois, Urbana, IL 61801, USA *Corresponding Author: PH (217) 333-9485, Email: [email protected]
Glyphosate application prior to wheat planting has been reported to be associated with increased Fusarium head blight incidence in the wheat crop. The objectives of this study were to: 1) determine the effect of glyphosate on mycelial growth of Fusarium graminearum (Schwabe) (teleomorph Gibberella zeae (Petch)) and 2) determine the effect of glyphosate on macroconidia production by F. graminearum. Three different isolates of F. graminearum were used to determine the effect of glyphosate on growth and spore production. Mycelial growth was recorded daily on isolates grown on PDA amended with different concentrations of glyphosate. Macroconidia production was evaluated by growing F. graminearum in CMC liquid media for five days and counting the resulting macroconidia produced. Both the mycelial growth and macroconidia production were significantly reduced with the 1x concentration (recommended field rate) of glyphosate. No significant differences for mycelial growth or macroconidia production were observed between the control and diluted glyphosate treatments.

91
2005 Eastern Wheat Workers / Southern Small Grain Workers Conference
Genetic Characterization of Septoria tritici Blotch and Wheat Soil Borne Mosaic Virus Resistance Genes in the Winter Wheat Germplasm
KS96WGRC40
M. D. Hall1, G. Brown-Guedira2 and W. W. Bockus3
1 Dept of Agronomy, Kansas State University, Manhattan, KS 66506
2 USDA/ARS Plant Science Research Unit, Raleigh, NC 27606 3 Dept of Plant Pathology, Kansas State University, Manhattan, KS 66506
The winter wheat germplasm KS96WGRC40 has resistance to leaf rust, wheat curl mite, Septoria tritici blotch, Stagonospora nodurum blotch, and wheat soilborne mosaic virus (WSBMV) derived from two accessions of Ae. tauschii. The genes for resistance to leaf rust (Lr39) and wheat curl mite (Cmc4) in this germplasm have been previously mapped, but the inheritance of the leaf blotch and WSBMV resistance in this germplasm has not been determined. The objective of this research was to determine the inheritance of resistance to Stb and WSBMV in KS96WGRC40. A population of 78 F5:7 recombinant inbred lines was developed from the cross KS96WGRC40/Wichita. Greenhouse screening for Stb reaction was completed during Fall 2004 and WSBMV reaction is being evaluated during Spring 2005. The results of the Stb phenotypic screening and the WSBMV phenotypic screening fit expected one dominant gene segregation ratios. KS96WGRC40 has one dominant Stb resistance gene and one dominant WSBMV resistance gene. DNA has been isolated from the population and wheat SSR markers are being used to create a linkage map. Screening of the population with the published molecular markers reportedly linked with the Stb resistance genes from the D-genome will be conducted initially to determine if the resistance in KS96WGRC40 is conferred by a unique gene. This population will also be used to map resistance to Stagonospora nodurum blotch.
92
2005 Eastern Wheat Workers / Southern Small Grain Workers Conference
New Races of Puccinia striiformis f. sp. tritici More Aggressive Than Older Races at 18ΕC
Eugene A. Milus and Esra Seyran.
Department of Plant Pathology, University of Arkansas, Fayetteville, USA.
[email protected] Stripe rust (yellow rust) of wheat is caused by Puccinia striiformis Westend. f. sp. tritici Eriks. and Henn. and has been one of the most important diseases wherever wheat is grown in cool environments. In the United States in 2000, stripe rust occurred in more than 20 states and was unusually severe in Arkansas and surrounding states (Chen et al., 2002). These epidemics were attributed to favorable weather and the occurrence of new races. Sixteen new races with virulence on yellow rust resistance genes Yr8 and/or Yr9 were identified, and this was the first report of virulence on these genes in the United States (Chen et al., 2002). However, Yr8 is not known to be in any wheat cultivar, only a portion of the susceptible cultivars had Yr9, and the weather in 2000 was not dramatically different from previous years. Furthermore, the new races completely replaced the old races that were found before 2000 in states east of the Rocky Mountains, and stripe rust continued to develop long after temperatures were presumed to be too warm for disease development. These data and observations suggested that the new races may be more aggressive than old races. The objective of this study was to determine if increased aggressiveness may be a contributing factor in recent stripe rust epidemics. Six isolates collected before 2000 and 14 isolates collected since 2000 were considered representative of old and new races, respectively. Isolates were evaluated at 12ΕC and 18ΕC for two components of aggressiveness, latent period (time from inoculation to sporulation) and spore germination rate (area under the germination curve and percentage germinated at 12 hours). There were significant (P<0.05) temperature by isolate interactions for latent period and spore germination rate. All new isolates had significantly shorter latent periods at 18ΕC than at 12ΕC. Of the six old isolates, four had similar latent periods at both temperatures, one had a shorter latent period at 18ΕC, and one had a shorter latent period at 12ΕC. As measured by area under the germination curve, eight new isolates and one old isolate had significantly faster spore germination rates at 18ΕC than at 12ΕC, and two old isolates had significantly faster spore germination rates at 12ΕC than at 18ΕC. Results were similar for the percentage of spores germinated at 12 hours. The results of this study indicated that new races appeared to be more aggressive than old races at warmer temperatures and that this increased aggressiveness likely contributed to the expanded geographic range and increased severities of stripe rust that have been observed east of the Rocky Mountains since 2000 . Chen, X.M., Moore, M., Milus, E.A., Long, D.L., Line, R.F., Marshall, D., and Jackson, L. 2002. Wheat stripe rust epidemics and races of Puccinia striiformis f. sp. tritici in the United States in 2000. Plant Disease 86:39-46.
93
2005 Eastern Wheat Workers / Southern Small Grain Workers Conference
Genetic Diversity of Puccinia striiformis f. sp. tritici in the United States
Samuel G. Markell1, Eugene A. Milus1, and Xianming Chen2
1University of Arkansas, Fayetteville. 2USDA-ARS, Washington State University, Pullman, USA.
[email protected] In North America, epidemics of stripe rust, caused by Puccinia striiformis f. sp. tritici, historically have occurred in several regions of Mexico, and in western United States (Washington, Oregon, Idaho, California). Since 2000, stripe rust has emerged as a severe disease in south-central states (Arkansas, Louisiana, Texas) and in the Great Plains (Oklahoma, Kansas, Nebraska, Colorado). Recent epidemics in the south-central states and the Great Plains have been attributed to widespread and consistent overwintering of the pathogen in south-central states, favorable weather, susceptible cultivars, and new races that overcome resistance gene Yr9 that had been effective against all races until 2000. The pathogen has no known sexual stage or alternate host to aid survival between wheat crops, and environmental conditions in the south-central states and Great Plains are not favorable for survival of the uredial stage over summer. The source of inoculum that overwinters in south-central states and the mechanism for evolving new races of the pathogen are not determined. Until recently, virulence/avirulence on differential lines was the only type of marker available to track inoculum dispersal and to determine how new races evolve. Polymorphic AFLP (Justesen et al., 2002) and SSR (Enjalbert et al., 2002) markers for P. striiformis f. sp. tritici were identified recently and may be useful in epidemiology and genetic studies of the pathogen. The objective of this study was to determine if the AFLP and SSR markers were useful for differentiating US isolates and to identify additional polymorphic markers. For each isolate, each polymorphism was scored as present or absent, and the data were analyzed with the Numerical Taxonomy System-pc software. Both AFLP and SSR markers clearly distinguished pre-2000 isolates from isolates collected in 2000 and later. These molecular markers likely would be useful for understanding genetic relationships among isolates, migration patterns among regions that may serve as donors or recipients of inoculum in North America, and determining the mechanism for the evolution of new races. Enjalbert J, Duan X, Giraud T, Vautrin D, de Vallavielle-Pope C, Solignac M, 2002. Isolation of twelve microsattelite loci, using an enrichment protocol, in the phytopathogenic fungus Puccinia striiformis f. sp . tritici. Molecular Ecology Notes 2, 563-565. Justesen AF, Ridout CJ, Hovmrller MS, 2002. The recent history of Puccinia striiformis f. sp. tritici in Denmark as revealed by disease incidence and AFLP markers. Plant Pathology 51, 13-23.

94
2005 Eastern Wheat Workers / Southern Small Grain Workers Conference
Inheritance and Chromosomal Assignment of Powdery Mildew
Resistance Genes in Two Winter Wheat Germplasm Lines G. Srnić1, J. P. Murphy2, J.H. Lyerly2, S. Leath3, and D.S. Marshall4
1Pioneer Hi-Bred International, Johnston, IA. 2Department of Crop Science, 3Department of Plant Pathology, and 4USDA-ARS, North Carolina State University, Raleigh.
Powdery mildew of wheat, caused by Blumeria graminis DC f. sp. tritici Em. Marchal, occurs annually in eastern North America resulting in reduced grain yield and end-use quality in susceptible cultivars. The objectives of this study were to determine the inheritance, chromosomal location and linkage with molecular markers of powdery mildew resistance genes in the two recently released germplasm lines NC96BGTA4 and NC99BGTAG11. Between 99 and 194 F2:3 progenies plus parents in two populations, ‘Saluda’ x NC96BGTA4 and Saluda x NC99BGTAG11, were evaluated in greenhouse and field nurseries for reaction to powdery mildew infection. Results indicated that the germplasm lines each contained a different, partially dominant, major resistance gene. Both resistance genes were located on the long arm of chromosome 7A. The most likely locus order indicated that the resistance gene in NC96BGTA4 was flanked by the SSR loci Xbarc292 and Xwmc525. The resistance gene in NC99BGTAG11 was most likely flanked by the SSR loci Xgwm332 and Xwmc525. Both genes mapped to a chromosome arm that contains the powdery mildew resistance loci Pm1 and Pm9. The resistance genes in the two germplasms are different from the Pm1a allele. Further allelism tests are necessary to determine the relationships both between the two genes themselves and between the two genes and named Pm loci on chromosome 7AL.
95
2005 Eastern Wheat Workers / Southern Small Grain Workers Conference
A Gene Encoding a Novel Chitin Binding Protein is Highly Up-Regulated in Response to Feeding by Avirulent Hessian Fly Larvae
Marcelo P. Giovanini1, Christie E. Williams2; 3, and Herbert W. Ohm1
1Department of Agronomy, Purdue University, 915 W. State St., West Lafayette, IN
47907 2USDA-ARS Crop Production and Pest Control Research Unit Mid-West Area and Department of Entomology, Purdue University, 901 W. State St. West Lafayette, IN
47907 3- Corresponding author: [email protected] FAX: 765-494-5105 During feeding attempts by avirulent Hessian fly larvae on resistant wheat plants, a resistance response is mounted due to a gene-for-gene recognition event that leads to an incompatible interaction causing larval death while still in the first instar. In a compatible interaction, recognition does not take place and the virulent larvae are able to develop on the susceptible plant. Although, the genetic interaction between wheat and Hessian fly is well established, the molecular mechanism of the resistance is poorly understood. In order to gain insights into the molecular response of wheat to Hessian fly larval feeding, identification of differentially expressed sequences was carried out, which has contributed to the cloning of Hfr-3 (Hessian fly-responsive gene – 3). Hfr-3 is highly up-regulated during the initial four days of feeding by avirulent Hessian fly larvae on the crown tissues of resistant wheat plants. The coding region of Hfr-3 has a high GC content and encompasses a 597 bp open reading frame that contains four chitin binding domains (CBD). HFR-3 deduced protein sequence shares 70% identity with WGA (Wheat germ agglutinin). The genomic sequence of Hfr-3 has no introns, a feature commonly observed in high GC content genes in eukaryotic cells. Estimation of the copy number of Hfr-3 in the wheat genome by southern hybridization revealed that Hfr-3 is likely to be member of a gene family, which is expected due to the fact that plants have several genes encoding CBD proteins that are thought to have arisen by duplication during evolution. VIGS (virus induced gene silencing) and immunodetection experiments are in progress to elucidate the functional significance of this rapid up-regulation of Hfr-3 transcript.
96
2005 Eastern Wheat Workers / Southern Small Grain Workers Conference
Identification of QTLs Associated With Resistance to Glume Blotch Caused by Stagonospora nodorum
J. Uphaus1, E. Walker2, M. Francki2, M. Shankar2, H. Golzar2, R. Loughman2, & H.
Ohm1*
1Department of Agronomy, Purdue University, W. Lafayette, IN 47907-2054 2Department of Agriculture, Baron-Hay Court, South Perth 6151, Western Australia
*corresponding author, email: [email protected] Glume blotch (caused by Stagonospora nodorum Berk.) resistance in wheat (Triticum aestivum) was evaluated in 287 F2-derived recombinant inbred (RI) lines from a cross of the Purdue developed lines, 91193D1 and 92201D5, having different sources of glume blotch resistance. Ten replications of all RI lines, parents, and appropriate control lines were evaluated in the 2003 season at West Lafayette, Vincennes, and Evansville, Indiana. Plots were single 1-meter rows 30 cm apart; plots were naturally infected and seeded in a randomized complete block design. In addition, the RI population was evaluated at South Perth (Australia) to further study environmental effects on QTL expression. All lines were evaluated for resistance in the glumes using a zero (no visible disease) to nine (severe disease) or 0% (no visible disease) to 100% (visible disease) numerical evaluation. Variation in the RI population for glume blotch severity was continuous and transgressive. The population is being genotyped for quantitative trait loci (QTL) associated with resistance. The simple sequence repeat (SSR) marker Xgwm526 identified a unique dominant band in P91193D1 where its chromosomal location was not previously reported but appears to be tightly linked with a QTL on chromosome 2D. Other QTLs are currently being investigated and the population is being evaluated for resistance in the flag leaf.
97
2005 Eastern Wheat Workers / Southern Small Grain Workers Conference
Tortilla Properties of Hard Wheat Grown in Ohio and the Great Plains
C. Sneller1* and Gang Guo2
1The Ohio State University, 1680 Madison Av., Wooster OH, 43912: [email protected]
2The Mennel Milling Co. PO Box 1280, Roanoke VA, 24016 Flour tortillas are made from hard wheat varieties Great Plains environments that are ideal for bread. Tortillas and bread though have different quality requirements and it is possible that hard wheat grown in the eastern US, while generally unsuitable for bread, may be suitable for tortillas. To test this hypothesis, we tested flour from hard wheat genotypes that had been grown in NE and OH. The genotypes were selected from a larger set to represent variation for several quality parameters. We assessed flour yield and protein, gluten strength, pentosans content, starch damage and tortilla properties on each There was little difference between NE and OH grown wheat for many tortilla size traits or dough properties. The OH location produced flour with lower protein, weaker gluten, more starch damage, and tortillas with shorter shelf stability than did NE. Despite these results, some hard wheat lines grown in OH made good tortillas. Flour protein and gluten strength were more important in determining tortilla quality in OH than NE. The OH-grown hard wheat in this study was fertilized the same as OH soft wheat so substantial flour protein improvement may be possible with optimized fertility practices and site selection. Unlike other traits we measured, measures of tortilla quality were poorly correlated between NE and OH so tortilla screening must be done on OH grown wheat. The low yield of Great Plains hard wheat grown in OH remains an impediment to wide adaptation, especially if high flour protein is required. Two soft wheats were made into tortillas and flour from Hopewell (moderate gluten strength) made a decent tortilla with a shelf life of 18 days. Soft wheats with better tortilla quality may exist and adapted soft wheats may negate the low yield of Great Plains hard wheats and have better resistance to the OH disease complex. In conclusion, results from the first year of this study indicate that OH grown hard wheat flour can be used to make a commercially viable tortilla.

98
2005 Eastern Wheat Workers / Southern Small Grain Workers Conference
Genetics of Soft Wheat Quality in a Cross of Good by Moderate Quality Parents
C. Sneller1 and Gioconda Garcia1
1The Ohio State University, 1680 Madison Av., Wooster OH, 43912. [email protected] Quality is important to adding value to soft wheat. Improving quality requires information on the genetics of quality traits. New quality assessment techniques such as solvent retention capacity (SRC) tests allow geneticist to perform genetic analyses on large populations and use multiple environments. Our objective was to study segregation patterns as the first phase of determining the genetics of soft wheat quality. We developed 298 RILs from the cross Pioneer 26R46/SS 550. Pioneer 26R46 had the highest quality ranking in the 2005 SWQL report on 734 soft wheat cultivars due to its very low water absorbtion, high flour yield, and large cookie diameter. SS 550 has moderate quality and was ranked 457th. We assessed flour protein and yield, softness equivalent, SRCs, alkaline water retention capacity (AWRC) and test weight using grain from four Ohio environments. Genotype by environment interaction (GEI) was relatively small for all traits and entry mean hertitability exceeded 0.80 for all traits except AWRC. The water absorbtion traits (AWRC, pentosoans, starch damage) were all highly correlated to one another and negatively correlated to flour yield. All other correlations among traits were moderate to low. Quality variation in the population was primarily due to variation for water absorption and flour yield with gluten strength having secondary importance. There was significant genetic variation for all traits. There were very few transgressive segregants for water absorbtion traits and flour yield and none were statistically superior to 26R46: only 6% of the RILs were not significantly different from 26R46 for all of these traits. The distribution of transgressive segregants was skewed for softness equivalent, test weight, flour protein and one measure of gluten strength. Both parents had moderately strong gluten strength. About 8-17% of RILs with significantly stronger gluten than the strong gluten parent and 4-11% were not significantly different from the strong gluten check (Pioneer 25R26). In conclusion, the quality traits exhibited little GEI, high heritability, and transgressive segregation was prominent for gluten strength, test weight, and softness equivalent. But no RILs surpassed the desired water absorbtion and flour yield values of Pioneer 26R46. It is not clear if this was because SS550 did not contributed favorable alleles for these traits or if trait values of 26R46 are simply biologically difficult to surpass. In addition, few RILs were statistically equal to 26R46 indicating that its desired properties are difficult to recover in a good by moderate quality cross.
99
2005 Eastern Wheat Workers / Southern Small Grain Workers Conference
Potential Effectiveness of Marker-Assisted Selection for Three Quantitative Trait Loci Conferring Adult Plant Resistance to Powdery
Mildew in an Elite Wheat Breeding Population
D. M. Tucker, S. Liu, C. A. Griffey, and M. A. Saghai Maroof
Adult plant resistance (APR) in wheat (Triticum aestivum L.) to powdery mildew caused by Blumeria graminis f. sp. tritici, has provided effective and durable resistance compared to that conferred by conventional short-lived race specific genes. Three QTL associated with APR to powdery mildew previously were identified and mapped in Massey. However, Massey is not a desirable parent due to low yield potential, tall plant height, weak straw strength, susceptibility to leaf rust, and poor combining ability. Several elite lines and modern cultivars, such as USG 3209, derived from Massey are agronomically superior and frequently have been used as parents in breeding programs. The objective of the current study was to examine the efficiency of using simple sequence repeat (SSR) markers mapped in the original Becker by Massey F2:3 and recombinant inbred line (RIL) mapping populations in a marker-assisted selection (MAS) program. A 293 RIL breeding population derived from the cross of USG 3209 by Jaypee was used to verify inheritance of Massey’s QTL for APR to powdery mildew in USG 3209. Powdery mildew severity of USG 3209 by Jaypee RILs were evaluated in 2002 (F5:6) and 2003 (F6:7) under natural disease pressure in the field. Adult plants of the RIL population (F7:8) also were evaluated for disease severity in a 2004 greenhouse experiment using a composite of five different isolates of B. graminis. The QTL on chromosome 2B, selected on the basis of flanking markers, had the largest impact on powdery mildew resistance in the field. Lines containing the allele from USG 3209 had a mean mildew severity of 5.8% while RILs containing the Jaypee allele had mean mildew severities of 17.7% and 14.4% in the 2002 and 2003 field experiments, respectively. Selection of RILs possessing the QTL on chromosome 2A and to a lesser extent the one on chromosome 1B was effective in selecting for powdery mildew resistance in both greenhouse and field experiments, whereas the effect of the QTL on chromosome 2B was insignificant in the greenhouse. Overall, selecting RILs having the combination of QTL on chromosomes 2A and 2B was most successful in identifying highly resistant RILs compared to selecting RILs having other QTL combinations. The RILs possessing both QTL on chromosomes 2A and 2B had mean mildew severities of 4.4% and 3.2% in 2002 and 2003 field experiments, respectively. Breeders implementing such MAS programs for APR to powdery mildew via selection of RILs containing the two QTL combination of chromosomes 2A and 2B likely will obtain high levels of resistance in the field. However, combining all three QTL may ensure greater durability of APR, on the basis that resistance conferred by QTL on chromosome 2A and 1B are genetically stable across all environments in this study.

100
2005 Eastern Wheat Workers / Southern Small Grain Workers Conference
Screening for Fusarium Head Blight Resistance in an Epidemic Year
A. Stewart, C. Knott, and D. A. Van Sanford
Department of Agronomy University of Kentucky, Lexington, KY 40546-0312
Kentucky’s 2004 wheat crop was hit with a severe FHB epidemic. During the first three weeks of May 2004 average temperatures ranged between 65- 80oF along with 2.96” of rain at Lexington, KY. During this same time irrigation was provided to the scab nursery to initiate and maintain an ideal disease nursery for FHB. This combination contributed to disease levels that prevented accurate assessment of breeding lines. This problem was not only confined to the scab nursery as the breeding material also was affected. Severity and incidence were recorded in the 2004 scab nursery at 21 days after anthesis. The data collected at 21 days after anthesis had almost no predictive value; at 28 DAA, many lines rated moderately resistant at 21 DAA had been obliterated by FHB. Given these circumstances we were interested to learn what, if any, value could be assigned to the data we collected. Because the spike symptoms from the FHB nursery were not informative, we hoped that Fusarium damaged kernels (FDK) and DON would be reasonable indicators of resistance. Unfortunately, the frequency of tombstone kernels was so high that genotypic differences were masked, and there was often insufficient seed to submit for DON analysis. Too much disease pressure reduced the ability of analyzing breeding lines for FHB resistance. We have often experienced too little or too much FHB for accurate disease assessment. The effect of non-irrigated point inoculated bagged spikes was evaluated in 2004. We wanted to use this method as a way of gathering more useful data for FHB. By incorporating non-irrigated spikes into data collection we can have a variety of environments to screen, increasing the amount of meaningful data collected for both Type 1 and Type 2 resistance. Results from point-inoculated bagged spikes were promising. They allowed for disease severity to be read and analyzed from an off-site station without irrigation. By simultaneously testing plots with and without irrigation resistance, a better estimation of resistance can be made.
101
2005 Eastern Wheat Workers / Southern Small Grain Workers Conference
Improvement of Fusarium Head Blight Resistance in Three Winter Wheat Populations Using a Recurrent Selection Scheme.
V. L. Verges and D. A. Van Sanford
Dept of Agronomy, University of Kentucky, Lexington, KY 40546-0091 Fusarium head blight (FHB) caused by Fusarium graminearum (Schwabe) causes significant losses in the SRW wheat crop in Kentucky and in small grain crops worldwide. FHB epidemics result in significant yield losses, and the toxin deoxynivalenol (DON) can cause serious problems with grain quality and food safety. The amount of genetic variation among and within segregating populations and the generation in which selection is practiced is very important for optimizing selection progress. In this study the response to among and within family selection was evaluated in three winter wheat populations consisting of 40 lines each. Selection of the lowest severity families and selection within families of the lowest severity spikes was carried out in 2003 at Lexington. Selfed progeny were evaluated in hill plots at Lexington and Princeton, KY in 2004. To inoculate plots in the field, F. graminearum colonized corn was spread prior to heading. Plots were mist irrigated daily. At Lexington one cycle of recurrent selection for FHB resistance reduced the percentage of diseased spikelets from 50.8 to 40.3% in Population 1, from 38.9 to 29.5% in Population 2 and from 41.6 to 39.3% in Population 3. The selection response was somewhat lower at Princeton. Realized heritability estimates at Lexington ranged from 0.14 in population 3 to 0.73 in population 1. One cycle of among family selection for low FHB index showed that good progress could be achieved through selecting the top families in each population. Not only was mean severity reduced in the selected families, but some of the top families had a lower percentage of damaged kernels and DON concentration than the population mean.
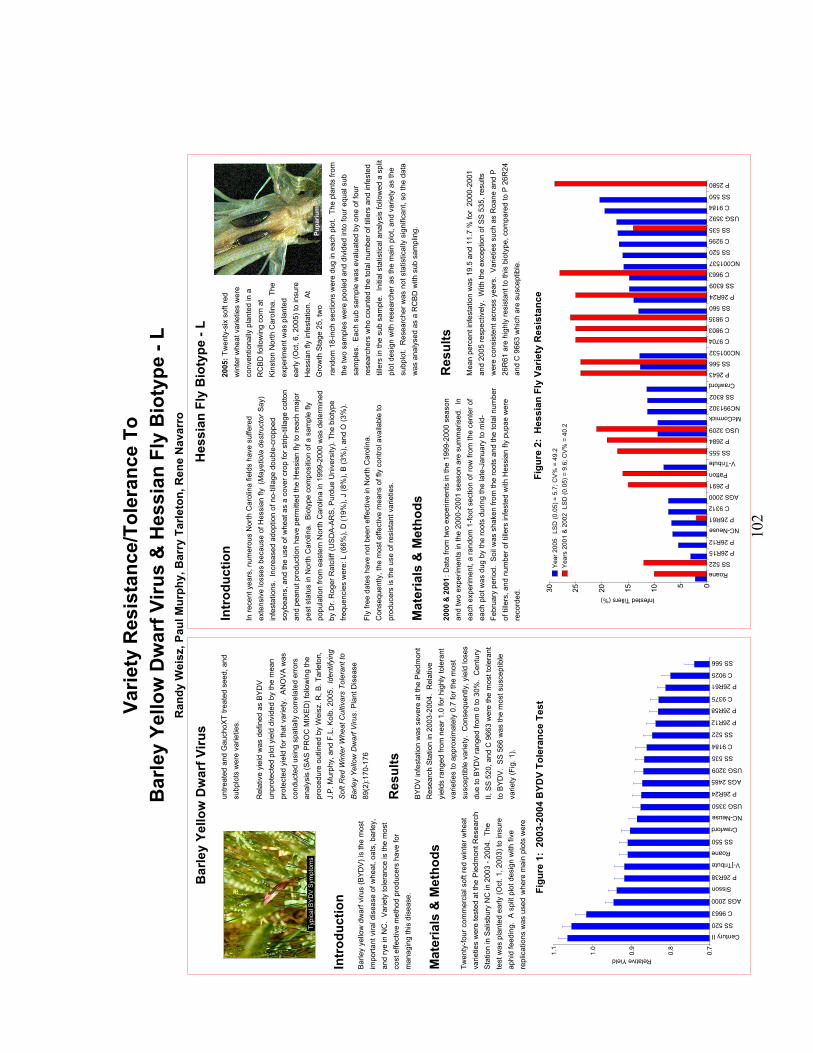
10
2
Intr
oduc
tion
In re
cent
yea
rs, n
umer
ous
Nor
th C
arol
ina
field
s ha
ve s
uffe
red
exte
nsiv
e lo
sses
bec
ause
of H
essi
an fl
y (M
ayet
iola
des
truct
or S
ay)
infe
stat
ions
. In
crea
sed
adop
tion
of n
o-til
lage
dou
ble-
crop
ped
soyb
eans
, and
the
use
of w
heat
as
a co
ver c
rop
for s
trip-
tilla
ge c
otto
n an
d pe
anut
pro
duct
ion
have
per
mitt
ed th
e H
essi
an fl
y to
reac
h m
ajor
pe
st s
tatu
s in
Nor
th C
arol
ina.
Bio
type
com
posi
tion
of a
sam
ple
fly
popu
latio
n fro
m e
aste
rn N
orth
Car
olin
a in
199
9-20
00 w
as d
eter
min
ed
by D
r. R
oger
Rat
cliff
(US
DA
-AR
S, P
urdu
e U
nive
rsity
). Th
e bi
otyp
e fre
quen
cies
wer
e: L
(66%
), D
(19%
), J
(8%
), B
(3%
), an
d O
(3%
).
Fly
free
date
s ha
ve n
ot b
een
effe
ctiv
e in
Nor
th C
arol
ina.
C
onse
quen
tly, t
he m
ost e
ffect
ive
mea
ns o
f fly
con
trol a
vaila
ble
to
prod
ucer
s is
the
use
of re
sist
ant v
arie
ties.
Mat
eria
ls &
Met
hods
2000
& 2
001:
Dat
a fro
m tw
o ex
perim
ents
in th
e 19
99-2
000
seas
on
and
two
expe
rimen
ts in
the
2000
-200
1 se
ason
are
sum
mar
ised
. In
ea
ch e
xper
imen
t, a
rand
om 1
-foot
sec
tion
of ro
w fr
om th
e ce
nter
of
each
plo
t was
dug
by
the
root
s du
ring
the
late
-Jan
uary
to m
id-
Febr
uary
per
iod.
Soi
l was
sha
ken
from
the
root
s an
d th
e to
tal n
umbe
r of
tille
rs, a
nd n
umbe
r of t
iller
s in
fest
ed w
ith H
essi
an fl
y pu
pae
wer
e re
cord
ed.
Hes
sian
Fly
Bio
type
- L
Varie
ty R
esis
tanc
e/To
lera
nce
ToB
arle
y Ye
llow
Dw
arf V
irus
& H
essi
an F
ly B
ioty
pe -
LR
andy
Wei
sz, P
aul M
urph
y, B
arry
Tar
leto
n, R
ene
Nav
arro
RoaneSS 522
P 26R15
P 26R12
NC-Neuse
P 26R61
C 9312
AGS 2000
P 2691Patton
V-Tribute
SS 555
P 2684
USG 3209
McCormickNC991302
SS 8302
Crawford
P 2643
SS 566
NC001532
C 9704
C 9803
C 9835
SS 560
P 26R24
SS 8309
C 9663
NC001537
SS 520
C 9295
SS 535
USG 3592
C 9184
SS 550
P 2580
051015202530
Infested Tillers (%)
Yea
r 200
5Y
ears
200
1 &
200
2LS
D (0
.05)
= 9
.6; C
V%
= 4
0.2
LSD
(0.0
5) =
5.7
; CV
% =
49.
2
Figu
re 2
: H
essi
an F
ly V
arie
ty R
esis
tanc
e
rand
om 1
8-in
ch s
ectio
ns w
ere
dug
in e
ach
plot
. Th
e pl
ants
from
th
e tw
o sa
mpl
es w
ere
pool
ed a
nd d
ivid
ed in
to fo
ur e
qual
sub
sa
mpl
es.
Eac
h su
b sa
mpl
e w
as e
valu
ated
by
one
of fo
ur
rese
arch
ers
who
cou
nted
the
tota
l num
ber o
f till
ers
and
infe
sted
til
lers
in th
e su
b sa
mpl
e. I
nitia
l sta
tistic
al a
naly
sis
follo
wed
a s
plit
plot
des
ign
with
rese
arch
er a
s th
e m
ain
plot
, and
var
iety
as
the
subp
lot.
Res
earc
her w
as n
ot s
tatis
tical
ly s
igni
fican
t, so
the
data
w
as a
naly
sed
as a
RC
BD
with
sub
sam
plin
g.
Res
ults
Mea
n pe
rcen
t inf
esta
tion
was
19.
5 an
d 11
.7 %
for
2000
-200
1 an
d 20
05 re
spec
tivel
y. W
ith th
e ex
cept
ion
of S
S 5
35, r
esul
ts
wer
e co
nsis
tent
acr
oss
year
s. V
arie
ties
such
as
Roa
ne a
nd P
26
R61
are
hig
hly
resi
stan
t to
this
bio
type
, com
pare
d to
P 2
6R24
an
d C
966
3 w
hich
are
sus
cept
ible
.
2005
: Tw
enty
-six
sof
t red
w
inte
r whe
at v
arie
ties
wer
e co
nven
tiona
lly p
lant
ed in
a
RC
BD
follo
win
g co
rn a
t K
inst
on N
orth
Car
olin
a. T
he
expe
rimen
t was
pla
nted
ea
rly (O
ct, 6
, 200
5) to
insu
re
Hes
sian
fly
infe
stat
ion.
At
Gro
wth
Sta
ge 2
5, tw
oPu
pariu
mTy
pica
l BY
DV
Sym
ptom
s
Intr
oduc
tion
Bar
ley
yello
w d
war
f viru
s (B
YD
V) i
s th
e m
ost
impo
rtant
vira
l dis
ease
of w
heat
, oat
s, b
arle
y,
and
rye
in N
C.
Var
iety
tole
ranc
e is
the
mos
t co
st e
ffect
ive
met
hod
prod
ucer
s ha
ve fo
r m
anag
ing
this
dis
ease
.
Mat
eria
ls &
Met
hods
Twen
ty-fo
ur c
omm
erci
al s
oft r
ed w
inte
r whe
at
varie
ties
wer
e te
sted
at t
he P
iedm
ont R
esea
rch
Sta
tion
in S
alis
bury
NC
in 2
003
- 200
4. T
he
test
was
pla
nted
ear
ly (O
ct. 1
, 200
3) to
insu
re
aphi
d fe
edin
g. A
spl
it pl
ot d
esig
n w
ith fi
ve
repl
icat
ions
was
use
d w
here
mai
n pl
ots
wer
e
Bar
ley
Yello
w D
war
f Viru
sun
treat
ed a
nd G
auch
oXT
treat
ed s
eed,
and
su
bplo
ts w
ere
varie
ties.
Rel
ativ
e yi
eld
was
def
ined
as
BY
DV
un
prot
ecte
d pl
ot y
ield
div
ided
by
the
mea
n pr
otec
ted
yiel
d fo
r tha
t var
iety
. A
NO
VA
was
co
nduc
ted
usin
g sp
atia
lly c
orre
late
d er
rors
an
alys
is (S
AS
PR
OC
MIX
ED
) fol
low
ing
the
proc
edur
e ou
tline
d by
Wei
sz. R
, B. T
arle
ton,
J.
P. M
urph
y, a
nd F
.L. K
olb.
200
5. I
dent
ifyin
g So
ft R
ed W
inte
r Whe
at C
ultiv
ars
Tole
rant
to
Barle
y Ye
llow
Dw
arf V
irus.
Pla
nt D
isea
se
89(2
):170
-176
Res
ults
BY
DV
infe
stat
ion
was
sev
ere
at th
e P
iedm
ont
Res
earc
h S
tatio
n in
200
3-20
04.
Rel
ativ
e yi
elds
rang
ed fr
om n
ear 1
.0 fo
r hig
hly
tole
rant
va
rietie
s to
app
roxi
mat
ely
0.7
for t
he m
ost
susc
eptib
le v
arie
ty.
Con
sequ
ently
, yie
ld lo
ses
due
to B
YD
V ra
nged
from
0 to
30%
. C
entu
ry
II, S
S 5
20, a
nd C
966
3 w
ere
the
mos
t tol
eran
t to
BY
DV
. S
S 5
66 w
as th
e m
ost s
usce
ptib
le
varie
ty (F
ig. 1
).
Figu
re 1
: 20
03-2
004
BYD
V To
lera
nce
Test
Century II
SS 520
C 9663
AGS 2000
Sisson
P 26R38
V-]Tribute
Roane
SS 550
Crawford
NC-Neuse
USG 3350
P 26R24
AGS 2485
USG 3209
SS 535
C 9184
SS 522
P 26R12
P 26R58
C 9375
P 26R61
C 9025
SS 566
0.7
0.8
0.9
1.0
1.1
Relative Yield