pct slides - university of nebraska medical center
TRANSCRIPT

Procalcitonin: What To Do with This Biomarker?
Trevor Van Schooneveld, MD Assistant Professor, Infectious Disease University of Nebraska Medical Center
4/27/12

Objectives
• Understand what Procalcitonin (PCT) is and its clinical role
• Recognize clinical situations where PCT may be useful and how to interpret PCT levels
• Review evidence supporting the use of PCT in decreasing antimicrobial use in lower respiratory tract infections (LRTI) and sepsis
• Recognize the drawbacks of PCT

Antimicrobial Use Isn’t Optimal
• From 30-50% of inpatient antimicrobial use is inappropriate
• Antimicrobial use and misuse is the key driver of drug resistance
• Antimicrobials can be toxic
• Antimicrobial is the key risk factor for C. difficile infection

Diagnosis of Bacterial Infection is Difficult
• Sepsis – Etiology determined 30-60%
– Cultures often positive for colonizing organisms
• Pneumonia – Etiology determined in only 39-54%
– Yield of blood cultures 5-10% at best
– Sputum culture and gram stain • 40% can’t produce
• Yield rapidly drops with antibiotic administration

Comparison of Clinical Biomarkers
Biomarker Specific for Infection
Sensitive to Inflammation
Advantages Disadvantages
Fever + ++++ Simple Sensitive
Non-specific
Leukocytes + +++ Simple Sensitive
Non-specific
Cytokines + +++ Sensitive Rapid Induction
Highly variable Short half life (minutes) Expensive
C-reactive protein (CRP)
++ ++ Inexpensive Moderately specific
Moderately specific Slow induction (peak >24h) No correlation with severity
Procalcitonin (PCT)
++++ + Quite specific Rapid Induction (peak 6-12h) Correlates with severity of illness
Expensive Low sensitivity for localized infection
Adapted from Reinhart K, et al. Crit Care Clin. 2006;22:503-19.

Procalcitonin Gene (CALC)
Christ-Crain. Eur Respir J. 2007;30:556.
PCT, procalcitonin; CT, calcitonin; CGRP, CT gene-related peptide; ADM, adrenomedulllin.

Procalcitonin Under Normal Conditions
After P. Linscheid, Endocrinology 2003 Morgenthaler N. et al., Clin Lab. 2002, 48: 263-270
N-ProCT Calcitonin Katacalcin
Physiologic PCT Levels: 46.7 pg/ml (97.5
percentile); median = 12.7 pg/ml*
Thyroid
CALC Gene mRNA

The Presence of Bacterial Infection Stimulates Procalcitonin Production
• Bacterial infection and cytokines stimulate production of PCT in parenchymal tissues
• PCT is rapidly released into bloodstream
• Cytokines produced by viral infection inhibit this

Calcitonin: Sources of production in healthy
people
Müller B. et al., J Clin Endocrin Metab. 2001;86:396-404
• Ubiquitous 10-100 fold increase in production
• More widespread than other common cytokines (TNF-α, IL-6)
Production is Ubiquitous Healthy Sepsis
PCT: Sources of Production in Septic Patients
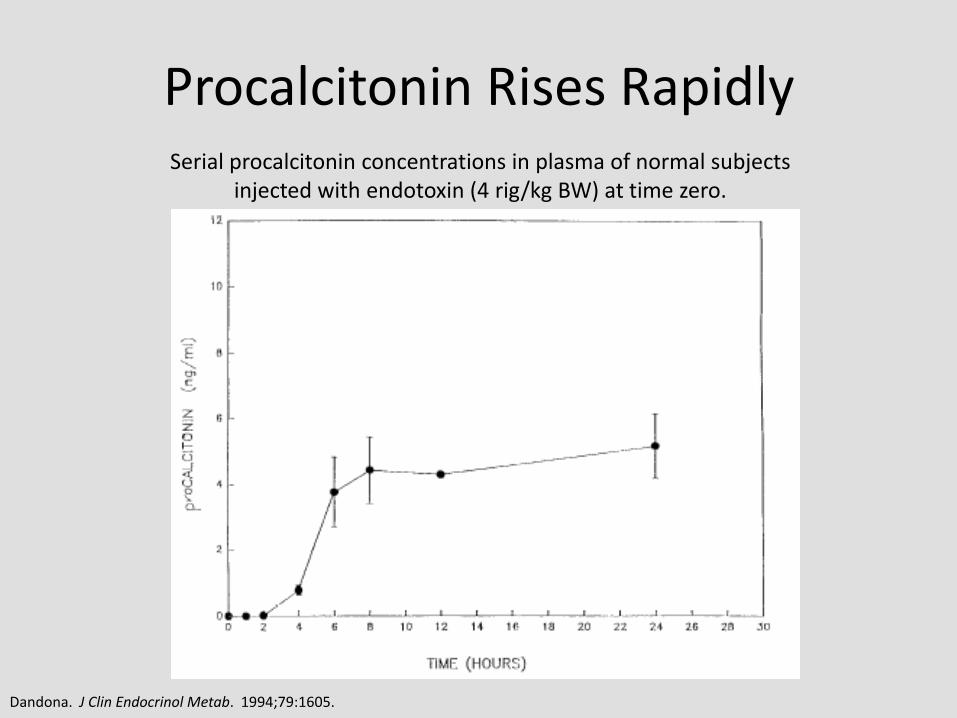
Serial procalcitonin concentrations in plasma of normal subjects injected with endotoxin (4 rig/kg BW) at time zero.
Dandona. J Clin Endocrinol Metab. 1994;79:1605.
Procalcitonin Rises Rapidly

• PCT levels rise within 3-6 hours after infectious challenge
• Peak 6-12 hrs.
• Half-life ~24hrs
PCT is Modulated by Cytokines and Has Predictable Time Dynamics
Brunkhorst FM et al., Intens. Care Med 1998;24: 888-892

PCT Levels Correlate with Severity of Illness
Harbarth S et al. Am J Respir Crit Care Med 2001;164:396-402. Meisner M et al. Critical Care 1999;3:45-50. Krüger S. et al. Eur Respir J 2008;31:349–355.
Organ Dysfunction Pneumonia Sepsis

It Isn’t Affected by Immunosuppression
PCT on the first day of fever among neutropenic patients who presented with infection.
Giamarellos-Bourboulis E J et al. Clin Infect Dis. 2001;32:1718-1725
Similar findings with steroid use and organ transplantation
Median Range
Before Chemo
0.11 ND - 0.80
Afebrile Neutropenia
0.20 ND - 0.64
Fever Day 2 0.45 ND - 129.44
Prospective Daily PCT Levels in 39 Patients with Neutropenia who
Developed Fever of Unknown Source

It’s All About the Dynamics Follow-up of procalcitonin (PCT) over time in patients with bacteremia and with
severe sepsis and their response to administration of antimicrobials
Giamarellos-Bourboulis E J et al. Clin Infect Dis. 2001;32:1718-1725

PCT Levels Can Be Prognostic PCT Peak Level, ng/ml
30 Day Mortality Rate, %
P
<1.0 10.1 --
1.0-5.0 26.4 .001
5.0-20.0 37.8 <.0001
20.0-50.0 46.2 <.0001
>50.0 47.2 <.0001
Mortality Associated with: • Peak PCT • Increasing PCT value Initial PCT level not predictive
Seligman R, et al. Crit Care. 2006;10:R125. Jensen J, et al. Crit Care Med. 2006;34:2596-2602.
Procalcitonin Increase and 90-day Survival in the Intensive Care Unit.
30.7%
56.1%
Kinetics of PCT in VAP Survivors and Non-Survivors

Time-course of procalcitonin plasma concentrations (mean, SEM) in 36 cardiac
surgery patients. 1=CABG with cardiopulmonary bypass (CPB), 2=CABG
without CPB, 3 = Valvular surgery
Procalcitonin plasma concentrations in infection and rejection in liver transplant patients (n = 11, mean and SEM; *p < .05). Day 0 = day the diagnosis was made
Aouifi A, et al. Br J Anaeth. 1999;83:602-7. Kuse ER, et al. Crit Care Med. 2000;28:555-9.
PCT After Surgery

Keep In Mind the Confounders • Physiologic Stress
– Newborns (<48-72 hours; after 72 interpret levels as usual) – Massive stress (severe trauma, surgery, cardiac shock, burns)
• In absence of infection levels trend down
– Prolonged, severe cardiogenic shock or organ perfusion abnormalities
• Non-bacterial cytokine activation – Some forms of vasculitis and acute graft vs. host disease – Malaria and some fungal infections – Chronic renal disease (mild increase in baseline)
• Dysregulated PCT production – Treatment with agents which stimulate cytokines (OKT3, anti-
lymphocyte globulins, alemtuzumab, IL-2, granulocyte transfusion)
– Paraneoplastic syndromes due to medullary thyroid and small cell lung cancer

Procalcitonin: advantages
• Specific for bacterial infection
• Correlates with severity of disease and mortality
• Rapidly rises declines with control of infection
– 50% daily decrease associated with control of infection by host immune system/antimicrobials
• PCT is not impaired by neutropenia or other immunocuppresive states
Schuetz P. BMC Medicine. 2011;9:107 Kibe S., et al. J Antimicrob Chemother. 2011;66(S2):ii33-40.

Is PCT How We Diagnose Bacterial Infection?
• Numerous studies in sepsis • 4 meta-analyses
– “PCT markers were particularly good for differentiating bacterial infections from viral infections.”
– “PCT represents a good biological diagnostic marker for sepsis, severe sepsis, or septic shock, difficult diagnoses in critically ill patients.”
– “ We found the diagnostic performance of PCT test for identifying bacteremia in ED patients to be moderate.”
– “PCT cannot reliably differentiate sepsis from other non-infectious causes of SIRS in critically ill adult patients.”
Simon L, et al. Clin Infect Dis. 2004;39:206-17. Jones AE, et al. Ann Emerg Med. 2007;50:34-41. Uzzan B, et al. Crit Care Med. 2006;34:1996-2003. Tang BM, et al. Lancet Infect Dis. 2007;7:210-7.

Why the Conflicting Results?
Randomized Controlled Studies
Meta-Analysis
Observational Studies
Quality of Evidence
Meta-Analysis
Gold Standard PCT Cut-off Assay Used
Clinical Setting Selection Bias
Variables
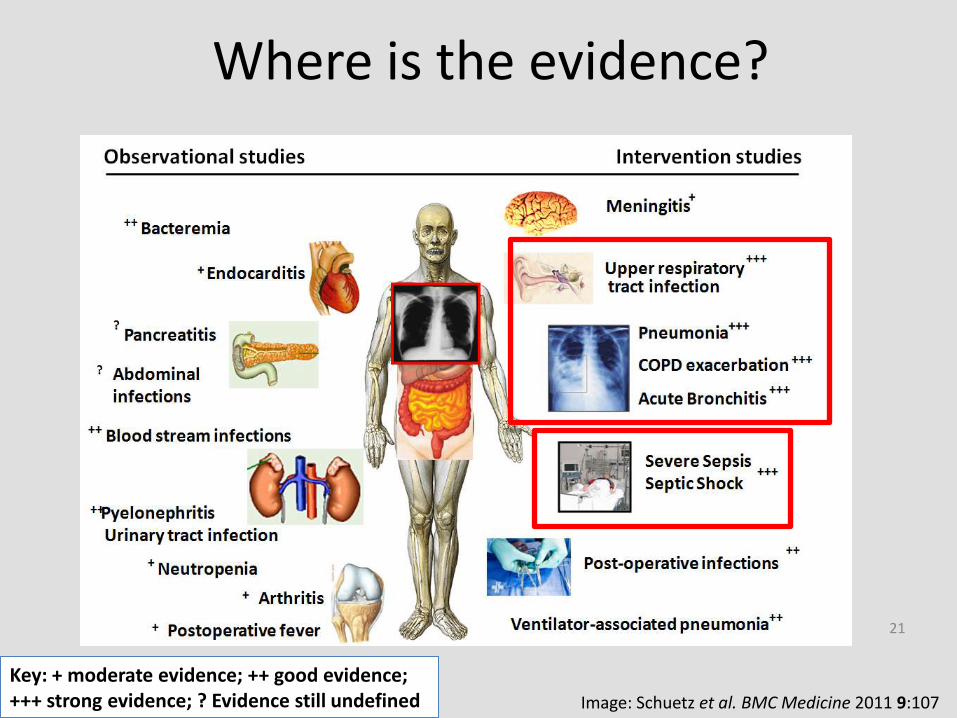
Where is the evidence?
21
Image: Schuetz et al. BMC Medicine 2011 9:107
Key: + moderate evidence; ++ good evidence; +++ strong evidence; ? Evidence still undefined

Lower respiratory tract Infection & antimicrobial therapy
• Pneumonia
– Duration for CAP at least 5 days
– Duration for HCAP/HAP/VAP 7-15 days
• COPD exacerbation
– May be caused by viral and/or bacterial infection
– Duration of antimicrobials not clear
• Acute bronchitis
– Typically viral and antibiotics not recommended

PCT in LRTI
• Single center, randomized, single-blinded trial of PCT in LRTI – PCT guided antibiotic initiation vs. standard care
• PCT <0.1 μg/L – Abx Strongly discouraged
• PCT 0.1-0.25 μg/L – Abx discouraged
• PCT >0.25 μg/L – Abx encouraged
• PCT >0.5 μg/L – Abx strongly encouraged
• Antibiotics not started repeat PCT in 6-24 hours
– Physician over-ruling was allowed • Occurred in 17.7%
Christ-Crain M, et al. Lancet. 2004;363:600-7.

Antibiotic Prescriptions in LRTI
Outcome Standard Care (n=119) PCT (n=124) P
Mortality 3% 3% 0.95
Days Admitted (mean) 11.2 10.7 0.89
Antibiotics Prescribed 83% 44% <0.0001
Antibiotic Use /1000 days 661 332 <0.0001
Christ-Crain M, et al. Lancet. 2004;363:600-7.

ProHOSP Trial
• Multicenter, non-inferiority, randomized trial
– Adults with LRTI presenting to ED
– Excluded immunosuppressed, HAP, those with need for prolonged antibiotics
– PCT levels at admission and if antibiotics started day 3, 5, 7
• Recommendation to stop based on algorithm
– Overruling was allowed due to hemodynamic instability, severe disease, + Legionella Ag
Schuetz P, et al. JAMA 2009; 302:1059-66.

ProHOSP Protocol
Schuetz P, et al. JAMA 2009; 302:1059-66.

Demographics Characteristic Number (N=1359)
Final Diagnosis, No (%)
CAP 925 (68.1)
Exacerbation of COPD 228 (16.8)
Acute Bronchitis 151 (11.1)
Other Diagnosis 55 (4.0)
Pneumonia Severity Index Class, No (%)
Class 1 90 (9.7)
Class 2 173 (18.7)
Class 3 189 (20.4)
Class 4 349 (37.7)
Class 5 124 (13.4)
Hospitalized, No (%) 1257 (92.5)
• Compliance was 90.8% with algorithm • Most non-compliance was with discontinuation of antimicrobials
Schuetz P, et al. JAMA 2009; 302:1059-66.

Antibiotic Use Outcomes
• Reduction in mean antibiotic exposure (32-65%)
• Reduction in rate of antibiotic prescriptions (8-27%)
• Most change seen in COPD and bronchitis
Schuetz P, et al. JAMA 2009; 302:1059-66.

ProHOSP: Results Outcome Control (n=688) PCT (n=671) Statistical Analysis [95% CI]
Antibiotic Prescription Rate
603 (87.7%) 506 (75.4%) -34.8% (-40.3% to -28.7%)
Mean Antibiotic Exposure (days)
8.7
5.7
-12.2% (-16.3% to -8.1%)
Antibiotic Adverse Event Rate
193 (28.1%)
133 (19.9%)
-8.2% (-12.7% to -3.7%)
30 day Adverse Outcomes
130 (18.9%) 103 (15.4%) -3.5% (-7.6% to 0.4%)
Mortality - ITT Mortality - PP
34 (5.1%) 29 (4.6%)
33 (4.8) 31 (4.8%)
Absolute difference: 0.3% (-2.1 to 2.5) Absolute difference: -0.2% (-2.6 to 2)
Adverse Outcome = death, ICU admission, recurrence, disease-specific complications
OR of Combined Adverse Outcome = 0.76 (95% CI, 0.57-1.01), p=0.64
Schuetz P, et al. JAMA 2009; 302:1059-66.

Community-acquired Pneumonia
• Hospitalized CAP
– N=302
• Randomized PCT or usual care
• Median duration therapy 5 vs. 12 days (P<0.001)
• No difference in complications or clinical outcomes
Christ-Crain M, et al. Am J Resp Crit Care Med. 2006;174:84-93.

COPD Exacerbation
• Single-center, randomized trial PCT guided Tx of patients with COPD exacerbation in ED – Enrolled 208 with >70% GOLD stage III-IV
– PCT <0.1 μg/L – Abx discouraged
– PCT 0.1-0.25 μg/L – Base abx on stability
– PCT >0.25 μg/L – Abx encouraged
• Abx use 40% PCT vs. 72% control (p<0.0001)
• No difference clinical success, mortality, LOS, ICU stay, exacerbation rate or hospitalization rate at 6 months
Stolz D, et al. Chest. 2007;131:9-19.

PCT Guided Therapy
Stolz D, et al. Chest. 2007;131:9-19.
Change in FEV1 in Patients not Treated with Antibiotics
Change in FEV1 in Patients Treated with Antibiotics

• Prospective, randomized trial of LRTI comparing PCT management vs. control in adults
– 8 studies – COPD, CAP, VAP, U/LRTI (2), LRTI (3)
– Enrolled 3431 patients
– All used similar algorithms, cutoffs, and assay
– Analyzed mortality, ICU admission, length of stay, antibiotic prescription, and duration of use
Li H, et al. Antimicrob Agent Chemother. 2011;55:5900-6.

Comparison of all-cause mortality between PCT-guided antibiotics and control group
Comparison of ICU admission between PCT-guided antibiotics and control group
Li H, et al. Antimicrob Agent Chemother. 2011;55:5900-6.

Results
• Conclusions – PCT use is safe and unlikely to result in patient harm
– PCT decreases antibiotic use but that effect varies significantly based on underlying patient population and disease
Outcome RR [95% CI] Standardized Mean Difference (95% CI)
I-squared
Overall mortality 0.998 (0.977 - 1.018) - 0%
ICU admissions 0.785 (0.57 - 1.076) - 0%
Antibiotic prescriptions
0.69 (0.55 - 0.88) - 96.9%
Length of Stay - -0.35 (-.077 – 0.06) 95.0%
Duration of Antibiotic Use
- -1.27 (-1.86 - -0.68) 98.2%
Li H, et al. Antimicrob Agent Chemother. 2011;55:5900-6.
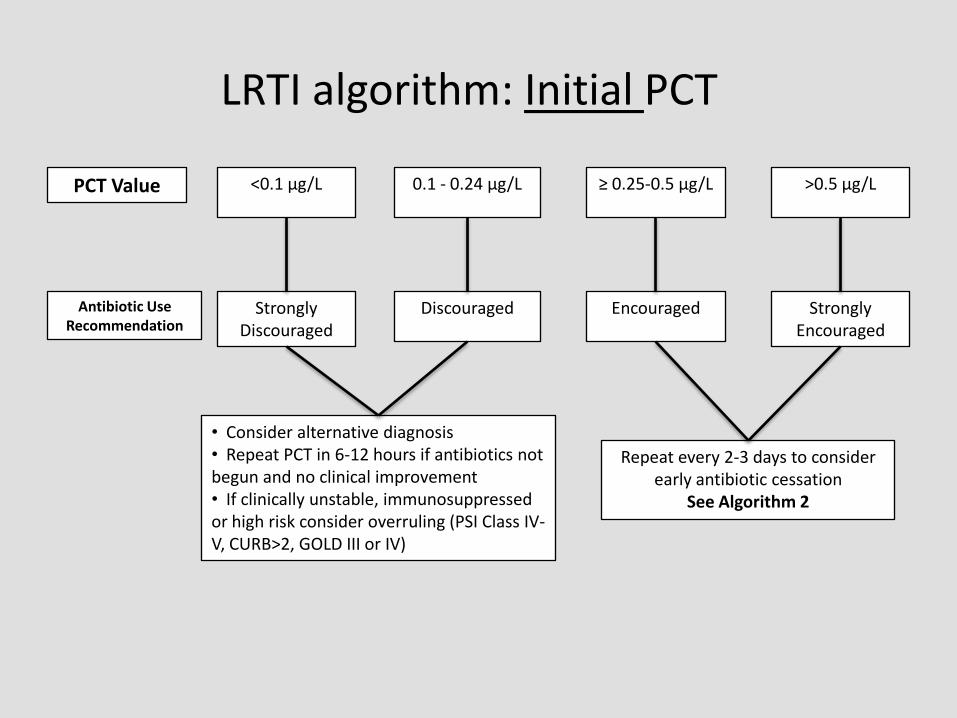
LRTI algorithm: Initial PCT
<0.1 μg/L 0.1 - 0.24 μg/L ≥ 0.25-0.5 μg/L >0.5 μg/L
Strongly Discouraged
Discouraged Encouraged Strongly Encouraged
• Consider alternative diagnosis • Repeat PCT in 6-12 hours if antibiotics not begun and no clinical improvement • If clinically unstable, immunosuppressed or high risk consider overruling (PSI Class IV-V, CURB>2, GOLD III or IV)
Repeat every 2-3 days to consider early antibiotic cessation
See Algorithm 2
PCT Value
Antibiotic Use Recommendation

LRTI algorithm: Follow Up PCT
<0.1 μg/L or drop by >90%
0.1 - 0.24 μg/L or drop by >80%
≥0.25 - 0.5 μg/L >0.5 μg/L
Cessation Strongly
Encouraged
Cessation Encouraged
Cessation Discouraged
Cessation Strongly
Discouraged
Consider continuing if clinically unstable
If PCT rising or not adequately decreasing consider possible treatment
failure and evaluate for need for expanding antibiotic coverage or
further diagnostic evaluation
PCT Value
Antibiotic Use Recommendation

• Post-study surveillance of PCT and antibiotic use – Single center from
ProHOSP study – Compared study and
post-study use – Patients sicker and more
immunocompromised (N=302)
PCT In the Real World Antibiotic Treatment in CAP Patients from ProHOSP
Study and Post-Study Survey Patients
Schuetz P, et al. Eur J Clin Microbiol Infect Dis. 2010;29:269-77.

The Sepsis Dilemma
• Early treatment decreases mortality
• Non-specific criteria
• Cultures take time
• Overuse of antibiotics leads to toxicity, super infection, and resistance
• A way to decide who to treat and for how long is needed
Infection
Trauma
Burns
Sepsis SIRS Severe Sepsis
shock

PCT for Sepsis Diagnosis
• Data worth evaluating – Can assist in the diagnosis of sepsis (or other bacterial
infection)
• Decisions regarding antimicrobial therapy should NOT be based solely on PCT serum concentrations – PCT should be placed into the clinical context of each
patient scenario considering the site of possible infection, the likelihood of bacterial infection, the severity of illness, and any other pertinent clinical data
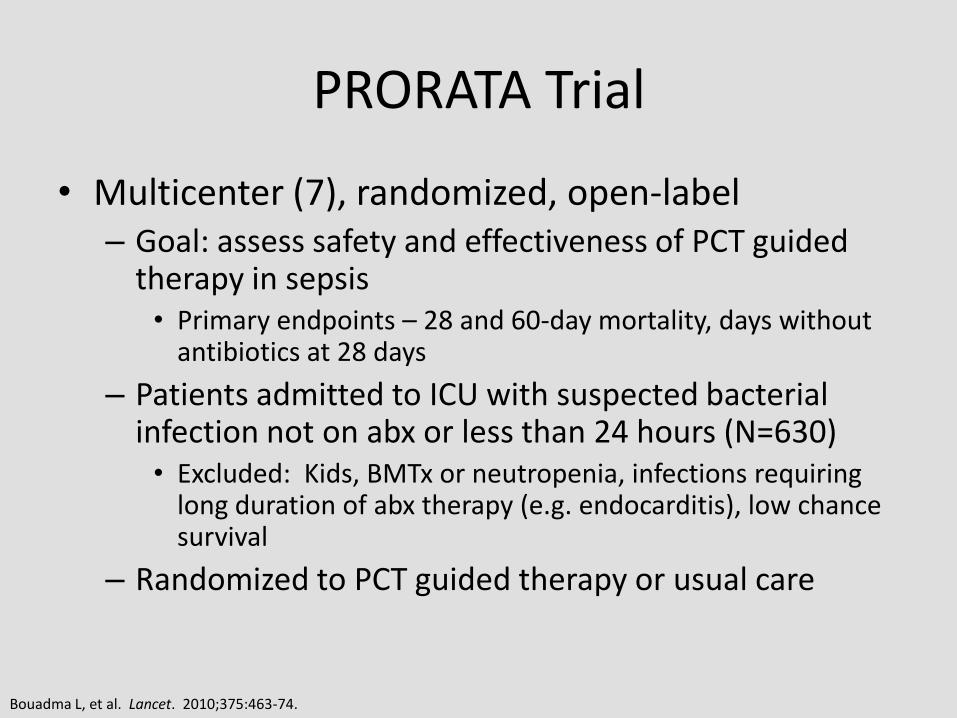
PRORATA Trial
• Multicenter (7), randomized, open-label – Goal: assess safety and effectiveness of PCT guided
therapy in sepsis • Primary endpoints – 28 and 60-day mortality, days without
antibiotics at 28 days
– Patients admitted to ICU with suspected bacterial infection not on abx or less than 24 hours (N=630) • Excluded: Kids, BMTx or neutropenia, infections requiring
long duration of abx therapy (e.g. endocarditis), low chance survival
– Randomized to PCT guided therapy or usual care
Bouadma L, et al. Lancet. 2010;375:463-74.

PRORATA algorithm
Bouadma L, et al. Lancet. 2010;375:463-74.
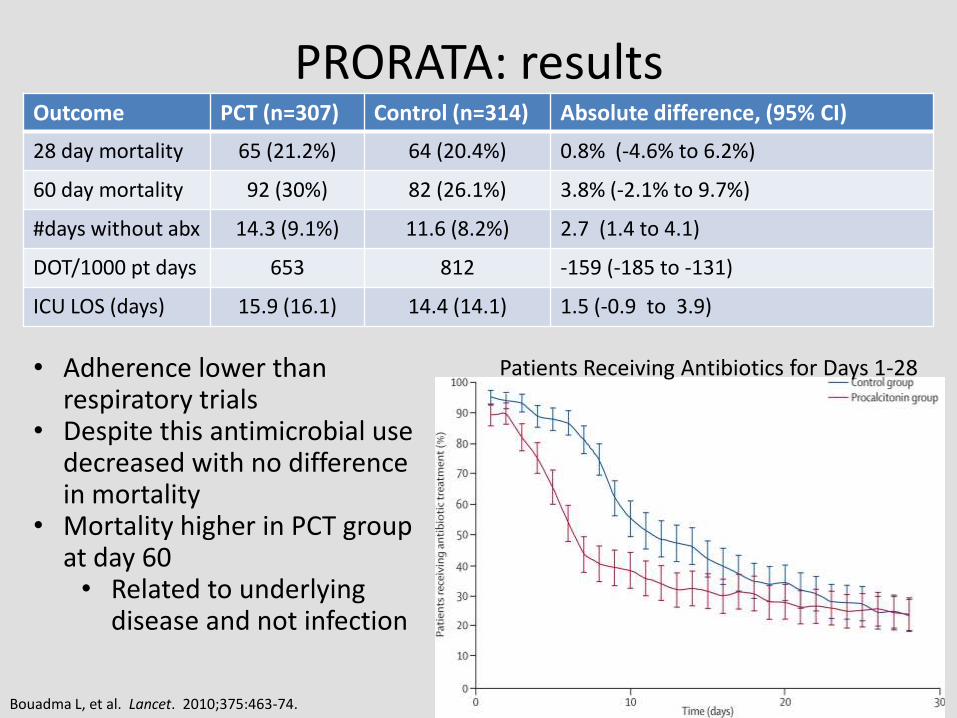
PRORATA: results Outcome PCT (n=307) Control (n=314) Absolute difference, (95% CI)
28 day mortality 65 (21.2%) 64 (20.4%) 0.8% (-4.6% to 6.2%)
60 day mortality 92 (30%) 82 (26.1%) 3.8% (-2.1% to 9.7%)
#days without abx 14.3 (9.1%) 11.6 (8.2%) 2.7 (1.4 to 4.1)
DOT/1000 pt days 653 812 -159 (-185 to -131)
ICU LOS (days) 15.9 (16.1) 14.4 (14.1) 1.5 (-0.9 to 3.9)
• Adherence lower than respiratory trials
• Despite this antimicrobial use decreased with no difference in mortality
• Mortality higher in PCT group at day 60 • Related to underlying
disease and not infection
Bouadma L, et al. Lancet. 2010;375:463-74.
Patients Receiving Antibiotics for Days 1-28
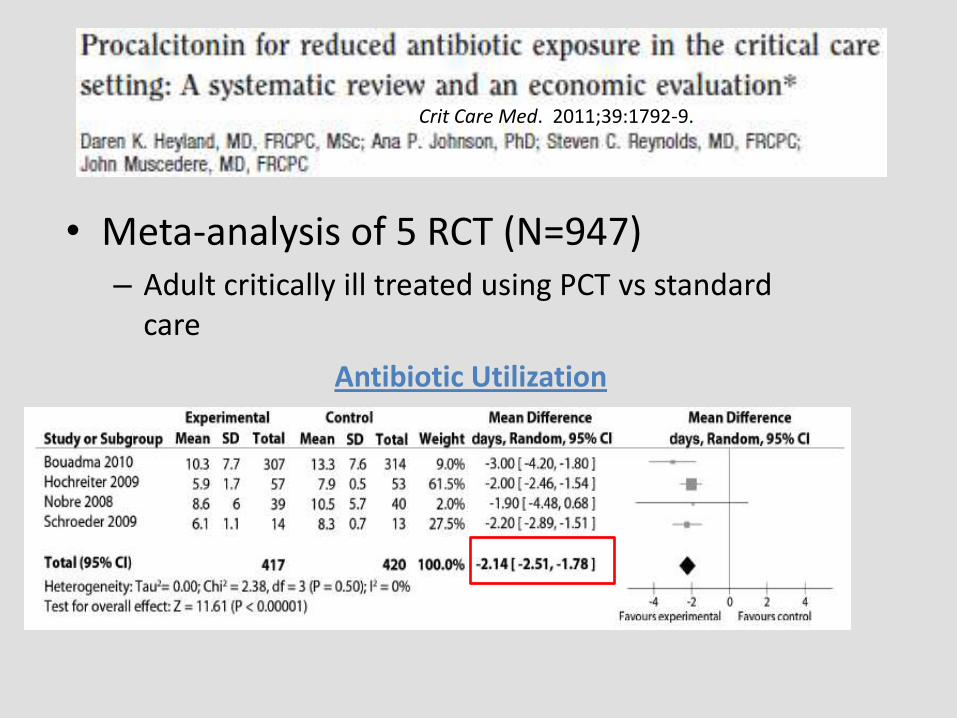
• Meta-analysis of 5 RCT (N=947) – Adult critically ill treated using PCT vs standard
care
Crit Care Med. 2011;39:1792-9.
Antibiotic Utilization

Other Endpoints (# of trials) Relative Risk (95% CI)
28-day Mortality (5) 0.98 (0.75-1.29)
Recurrent/Relapsed Infection (2) 1.26 (0.68-2.35)
Hospital Mortality
Heyland DK, et al. Crit Care Med 2011;39:1792-9.

Sepsis algorithm: Initial PCT
<0.25 μg/L 0.25 - 0.49 μg/L ≥0.5 - 1.0 μg/L >1.0 μg/L
Strongly Discouraged
Discouraged Encouraged Strongly Encouraged
• Consider alternative diagnosis • Repeat PCT in 6-12 hours if antibiotics not begun • If clinically unstable, immunosuppressed or high risk consider overruling
Repeat daily for 3 days to consider early antibiotic discontinuation
See Algorithm 4
PCT Value
Antibiotic Use Recommendation
Strongly consider antibiotic initiation in all patients with suspicion of infection

Sepsis algorithm: Follow up PCT
<0.25 μg/L 0.25 – 0.49 μg/L or drop by >80%
≥ 0.5 μg/L and decreased by <80%
≥0.5 μg/L and rising or not decreasing
Cessation Strongly
Encouraged
Cessation Encouraged
Cessation Discouraged
Cessation Strongly Discouraged
Consider continuation if clinically unstable
• A PCT value which is rising or not declining at least 10% per day is a poor prognostic indicator and suggests infection is not controlled • Consider expanding antibiotic coverage or further diagnostic evaluation
PCT Value
Antibiotic Use Recommendation
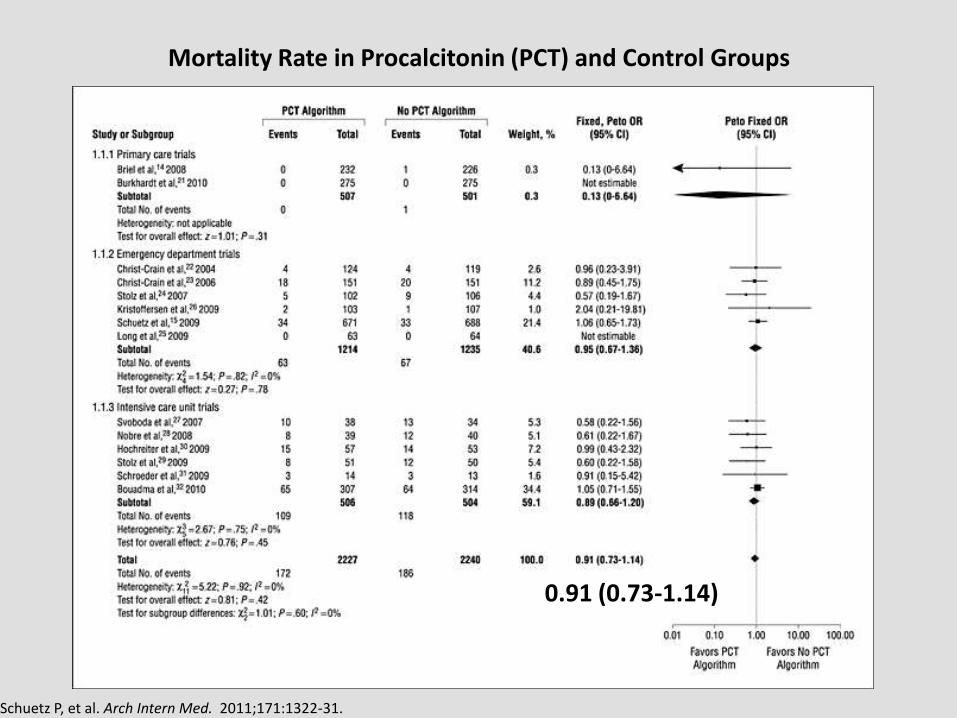
Mortality Rate in Procalcitonin (PCT) and Control Groups
Schuetz P, et al. Arch Intern Med. 2011;171:1322-31.
0.91 (0.73-1.14)

Procalcitonin and Survival Study Group (PASS)
• Multicenter RCT of 1200 critically ill patients
• Randomized to:
1. Standard of care for treatment of infection
2. Procalcitonin group – daily procalcitonin
1. If ≥1 ng/mL or not decreasing by 10%/day, then: – Mandatory escalation of antimicrobial coverage AND
intensified diagnostic procedures (cultures, imaging, etc)
– Antibiotics dependant on if previously on abx (broad spectrum +/- vancomycin or fluconazole)
Jensen JU, et al. Crit Care Med. 2011;39:204

PASS: Results • Outcomes: PCT vs. Standard Care
– 28-day mortality – 31.5% vs. 32% (ARR 0.6%, 95% CI -4.7% to 5.9%)
– ICU length of stay – 6 vs. 5 days (p=0.004)
– Duration of mechanical ventilation increased in PCT group 4.9% (95% CI: 3-6.7%)
– Days of renal dysfunction increased 5% (95% CI:3-6.9%)
– Increased use of broad spectrum antibiotics, combination therapy, cultures, and imaging in PCT group
• Conclusion – No difference mortality, but increased morbidity with this PCT management strategy
Jensen JU, et al. Crit Care Med. 2011;39:204
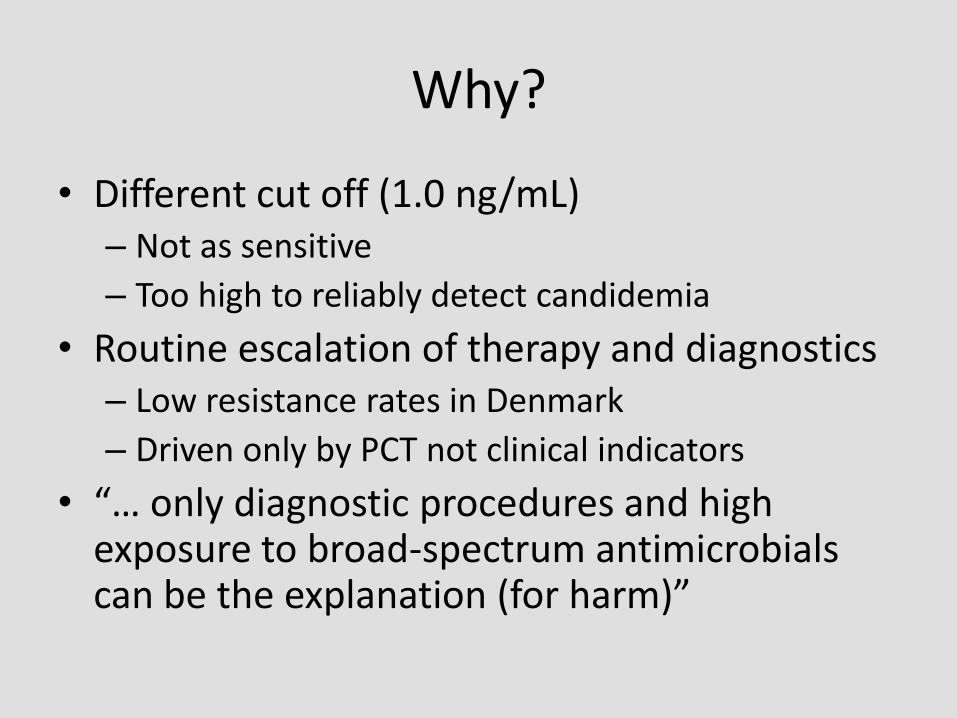
Why?
• Different cut off (1.0 ng/mL) – Not as sensitive
– Too high to reliably detect candidemia
• Routine escalation of therapy and diagnostics – Low resistance rates in Denmark
– Driven only by PCT not clinical indicators
• “… only diagnostic procedures and high exposure to broad-spectrum antimicrobials can be the explanation (for harm)”

Antibiotic Treatment and All-Cause Mortality Within 90d for Patients with Acute Heart Failure
• 1600 Patients presenting to ED with dyspnea • PCT levels measured but treating clinicians blinded to results
Maisel A, et al. Eur J Heart Failure. 2012;14:278-86.

Conclusions
• PCT is the most specific biomarker and has a number of advantages over previous markers
• It isn’t perfect – Interpret in the clinical context of the patient
– Serial measurements are preferred and provide more useful information
– Consider the dynamics of the disease
– Be aware of conditions which may affect PCT levels
• Good clinical judgment should always be applied (Don’t treat or not treat a number)
Final Thoughts
• Use depends on the clinical scenario
– Low-acuity infections (COPD exacerbation, chronic bronchitis)
• Helpful with initiation
– Higher-acuity infections (pneumonia)
• Improves determination of when to stop therapy
– Sepsis
• Most helpful when a clear source is not present (or source is pulmonary)