pcd 1 2676 c-is1448-part-18 - bis.org.in · pdf fileतकनीक ' सिमित:...
TRANSCRIPT

तकनीक सिमित: पी सी ड 01 े षती
1 पे ोिलयम, पे ोिलयम उ पाद और नेहक क पर ण एव ंमापन प ितयॉ ंसिमित, पी सी ड 1 एव ं इसक सभी उपसिमितय के सम त सद य।
2 पे ोिलयम, कोयला एव ंसंबंिधत उ पाद वभाग प रषद (पी सी ड सी) के सद य। 3 िच रखने वाले सभी
महोदय/महोदया, आपके अवलोकन हेतु िन निल खत मसौदा संल न है:
मसौदा सं या व षय
पीसीड 1( 2676) सी
भारतीय मानक मसौदा : पे ोिलयम और इसके उ पाद क पर ण प ितयॉ:ं भाग 18
पे ोिलयम उ पाद का आसवन [आई एस 1448 (भाग 18) का तीसरा पुनर ण] कृपया इस मसोदे का अवलोकन कर अपनी स मितयॉ ंयह बताते हएु भेजे क य द अंतत: यह मानक मसौदा रा ीय मानक के प म
कािशत हो जाए तो इस पर अमल करने म आपके यवसाय अथवा कारोबार म या क ठनाइया ँआ सकती ह ।
स मित भेजने क अंितम ितिथ : 31-07-2013
स मित कृपया संल न ा प म अधो-ह ता र को भेज ।
ध यवाद,
भवद य
ए. द ता वै ािनक ‘एफ’ एव ं मुख (पी सी ड )
ई-मेल : [email protected]; [email protected];
ितः उप रिल खत [email protected]
लेख ेषण सं ापन
संदभ दनांक
पी सी ड 1:3/(ट -16) सी 01-06-2013
यापक प रचालन मसौदा

DRAFT IN WIDE CIRCULATION
Document Dispatch Advice Ref. Date
PCD 1:3/(T-16) C 01-06-2013 Technical Committee: Methods of Measurement and Test for Petroleum, Petroleum Products and Lubricants Sectional Committee, PCD 1 Addressed to:
1) All interested Members of PCDC 2) All Members of Methods of Measurement and Test for Petroleum, Petroleum Products and
Lubricants Sectional Committee, PCD 1, its all subcommittees; and 3) All others interested. Dear Sir(s)/Madam(s),
Please find enclosed the following Draft Indian Standard:
Doc. No. TITLE PCD 1(2676)C Methods of test for petroleum and its products: Part 18 Distillation of
petroleum products [Third Revision IS 1448 (Part 18)]
Kindly examine the draft indian standard and forward your views stating any difficulties which you are likely to experience in your business or profession, if this is finally adopted as National Standard.
Last date for comments: 31 July 2013
Comments, if any, may please be made in the format as given overleaf and mailed to the undersigned
at the above address. In case no comments are received or comments received are of editorial nature, you will kindly permit us to presume your approval for the above document as finalized. However, in case of comments of technical in nature are received then it may be finalized either in consultation with the Chairman, Sectional Committee or referred to the Sectional committee for further necessary action if so desired by the Chairman, Sectional Committee. The document is also hosted on BIS website www.bis.org.in. Thanking you,
Yours faithfully
A. Datta
Sc. ‘F’ & Head (PCD) Office Telephone/Fax No.: 011 23235432
Email: [email protected]; [email protected] Encl.: As above. [email protected]
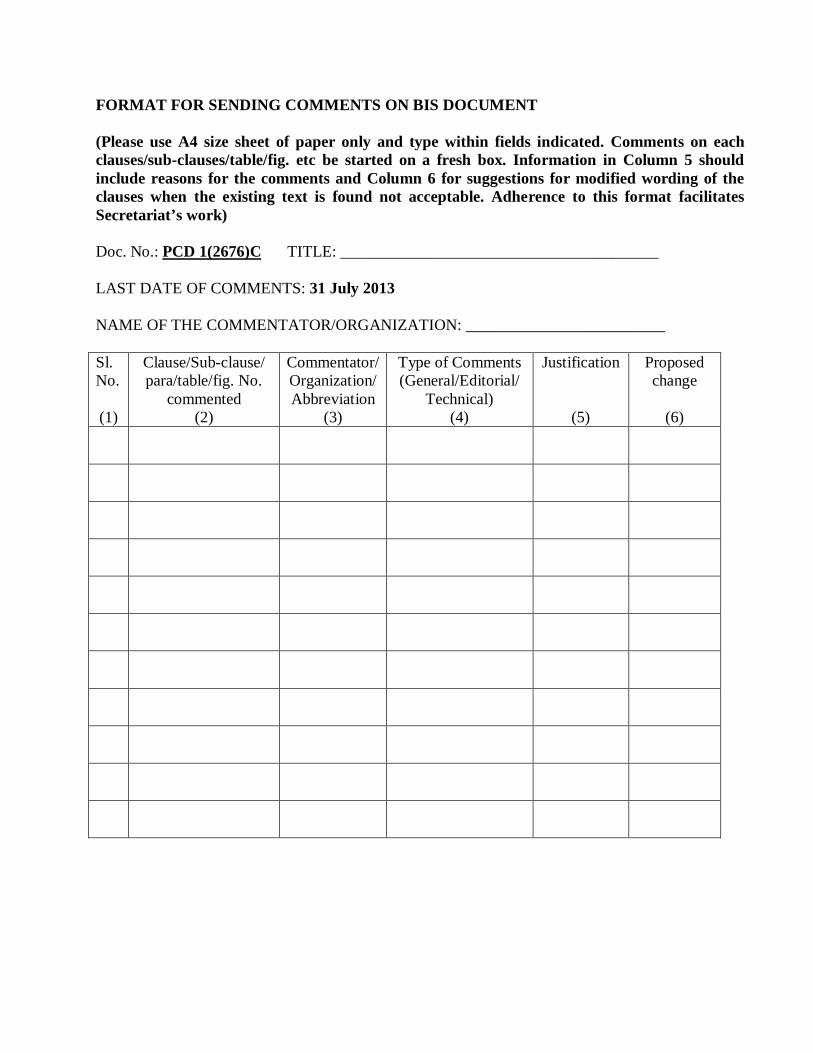
FORMAT FOR SENDING COMMENTS ON BIS DOCUMENT (Please use A4 size sheet of paper only and type within fields indicated. Comments on each clauses/sub-clauses/table/fig. etc be started on a fresh box. Information in Column 5 should include reasons for the comments and Column 6 for suggestions for modified wording of the clauses when the existing text is found not acceptable. Adherence to this format facilitates Secretariat’s work) Doc. No.: PCD 1(2676)C TITLE: ________________________________________ LAST DATE OF COMMENTS: 31 July 2013 NAME OF THE COMMENTATOR/ORGANIZATION: _________________________ Sl. No. (1)
Clause/Sub-clause/ para/table/fig. No.
commented (2)
Commentator/ Organization/ Abbreviation
(3)
Type of Comments (General/Editorial/
Technical) (4)
Justification
(5)
Proposed change
(6)

Draft for Comments Only Doc: PCD 1(2676) C
IS 1448 (Part 18) : June 2013
BUREAU OF INDIAN STANDARDS
Draft Indian Standard
METHODS OF TEST FOR PETROLEUM AND ITS PRODUCTS: PART 18 DISTILLATION OF PETROLEUM PRODUCTS
[Third Revision of IS 1448 (Part 18)]
Not to be reproduced without permission of Last date for receipt of comment is BIS or used as Standard 31 July 2013
Draft prepared by Dr. P. V. S. L. Narasimham, BPCL. ICS 75.080 FOREWORD (Formal clauses will be added later) Second revision of this standard was published in 1991 covering distillation of petroleum products by manual method. This standard was based on joint publication of ASTM D 86-82 and IP 123/84 issued by the American Society for Testing and Materials and The Institute of Petroleum, London, respectively. Since ASTM D 86-82 was subsequently revised in 2011, the Committee decided to revise this Indian standard to align with latest version of ASTM standard. In this revision, automated method for distillation of petroleum products has been included and manual test method has been improved. Also, the precision has been modified in the light of the improved procedure. In the formulation of this draft Indian standard, considerable assistance has been derived from ASTM D 86-11 ‘Standard test method for distillation of petroleum products at atmospheric pressure’. For tropical countries like India, the standard temperature and the relative humidity shall be taken as 27 2C and 65 5 percent respectively. In reporting the results of a test or analysis made in accordance with this standard, if the final value, observed or calculated, is to be rounded off, it shall be done in accordance with IS 2:1960 ‘Rules for rounding off numerical values (revised)’. 1 SCOPE 1.1 This draft standard describes method of atmospheric distillation of petroleum hydrocarbons such as motor gasolines, aviation gasolines, aviation turbine fuels, special boiling point spirits, napthas,

white spirit, kerosenes, gas oils, distillate fuel oils, regular and low sulfur diesel fuel and similar petroleum products having boiling range from 0°C to 400°C.
NOTE — This standard is not intended for distillation of petroleum products containing appreciable quantities of residual fuel and volatile organic liquids or relatively pure solvents. 1.2 It covers both manual and automated instrumental methods. 1.3 For the distillation of aviation turbine fuels and other products of such wide boiling range that the low distillation thermometer specified in Group 3 of Table 1 is inadequate, this method may be applied by substituting the high distillation thermometer together with the other test conditions specified in Group 3.
2 SUMMARY OF THE METHOD 2.1 The sample is placed in the appropriate group based on characteristics like sample composition, vapor pressure, expected initial boiling point/end point etc. Apparatus arrangement, condenser temperature, and other operational variables are defined as per group in which the sample falls. A 100 ml sample is distilled under prescribed conditions which are appropriate to its nature (see Table 1).Systematic observations of thermometer readings and volumes of condensate are made, and from the data, the results of the test are calculated and reported. 3 SIGNIFICANCE 3.1 Distillation (volatility) characteristics of petroleum products are indicative of safety and performance in their intended applications. Petroleum product specifications generally include distillation limits to ensure products of suitable volatility performance. 3.2 The information on distillation characteristics and composition is critical for aviation/automotive gasoline as it influences starting, warm-up and vapour locking phenomenon at high temperature/altitude. The boiling range can also throw light on composition, properties and behavior of the fuels during storage and use. 3.3 Volatility Characteristic of the fuels has got the major bearing on the formation of potentially explosive vapours. Volatility, as it affects rate of evaporation, is an important factor in the application of solvents, particularly those used in paints. 3.4 The empirical results obtained by use of this distillation method have been found to correlate with automotive equipment performance factors and with other characteristics of petroleum products related to volatility. 4 TERMINOLOGY 4.1 For the purpose of this draft Indian Standard, the following definitions shall apply.

4.2 Initial Boiling Point (IBP) The thermometer reading (after correction) which is observed at the instant that the first drop of condensate falls from the lower end of the condenser tube. 4.3 End Point (EP) or Final Boiling Point (FBP) The maximum thermometer reading (after correction) obtained during the test. This usually occurs after the evaporation of all liquid from the bottom of the flask. The term ‘maximum temperature’ is a frequently used synonym. 4.4 Dry Point The thermometer reading (after correction) observed at the instant the last drop of liquid evaporates from the lowest point in the flask. Any drops or film of liquid on the side of the flask or on the thermometer are disregarded.
NOTE — The end point/final boiling point rather than the dry point is intended for general use. The dry point may be reported in connection with special purpose such as naphthas used in the paint industry. Also, it should be substituted for the EP/FBP whenever the sample is of such a nature that the precision of the EP/FBP cannot consistently meet the requirements given in 10.
4.5 Decomposition Point The thermometer reading (after correction) which coincides with the first indication of thermal decomposition of the liquid in the flask.
NOTE — Characteristic indications of thermal decomposition are evolution of fumes and erratic thermometer readings which usually show a decided decrease after any attempt is made to adjust the heat.
4.6 Corrected Percent Recovery The Percent recovery adjusted according to the difference between the observed loss and the corrected loss as under:
RC = R + (L0 – LC) where RC = corrected percent recovery; R = Percent recovery; L0 = Percent loss or observed loss; and LC = Corrected loss.
4.7 Percent Recovery The maximum percent recovered, as observed in accordance with 9.16.
4.8 Percent Total Recovery The combined percent recovery and residue in the flask, as observed in accordance with 9.17.
4.9 Percent Loss 100 minus the percent total recovery
4.10 Percent Recovered The volume, in ml, of condensate observed in the receiving graduate, in connection with simultaneous thermometer reading.
4.11 Corrected Loss Percent loss corrected according to barometric pressure.
4.12 Percent Residue The percent total recovery minus the percent recovery, or the volume of residue, in ml, if measured directly.
4.13 Percent Evaporated The sum of the percent recovered and the percent loss. 4.14 Dynamic Hold Up The amount of distillate content remained in the neck/side arm of the flask and in the condenser tube during the distillation. 4.15 Emergent Stem Effect The difference in temperature reading due to the partial immersion of the total immersion mercury-in-glass thermometers. NOTE — In the partial immersion mode, a portion of the mercury thread, that is, the emergent portion is at a lower temperature than the immersed portion, resulting in shrinkage of the mercury thread and a lower temperature reading.
4.16 Temperature Lag The difference between the temperature reading obtained by a temperature sensing equipment and the true temperature at a given time.

4.17 Temperature Sensing Equipment The thermometer as described in 5.2.8.1 or a temperature sensor as described in 5.2.9 or system that is equivalent to the thermometer reading as described in 5.2.8.2.
4.18 Rate of Change in Temperature. The change in temperature reading per percent evaporated or recovered. 4.19 Front End Loss Cumulative loss of the fuel comprising loss during transferring the fuel from receiving cylinder to distillation flask, vapour loss during distillation and uncondensed vapour remains in the flask after distillation.
4.20 Thermometer Reading The temperature reading measured by the specified thermometer under test condition in the neck of the flask below the vapour tube.
4.21 Thermometer Reading corrected to Barometric Pressure The thermometer reading, as described in 4.20, corrected to barometric pressure. 4.22 Temperature Reading Temperature measurement obtained with the help of temperature measuring device that is equivalent to thermometer reading described in 4.20.
4.23 Temperature Reading corrected to barometric pressure The temperature reading, as described in 4.22, corrected to barometric pressure.
Table 1 Test Conditions
(Clauses 1.3 and 2.1) Sl. No. (1)
Requirements
(2)
Group 0
(3)
Group 1
(4)
Group 2
(5)
Group 3
(6)
Group 4
(7)
1) Sample characteristics: Natural gasoline
a) Vapour pressure at 37.8°C, bar
— 0.66 or above Below 0.66 Below 0.66 Below 0.66
b) Vapour pressure at 37.8°C, kPa
— ≥ 65.5 < 65.5 < 65.5 < 65.5
c) Distillation i) Initial boiling point1,
°C — — — 100 or below Above 100
ii) End point/ final boiling point1, °C
— 250 or below 250 or below Above 250 Above 250

2) Preparation of apparatus: a) Thermometer i) ASTM thermometer
No. — Low : 7C Low : 7C Low : 7C High : 8C
ii) IP thermometer No. — 5C 5C 5C 6C b) Diameter of hole in flask
support, mm — 37.5 37.5 50 50
c) Temperature at start of Test
i) Flask and thermometer, °C
— 13-18 13-18 13-18 Not above ambient
ii) Flask support and shield, °C
— Not above ambient
Not above ambient
Not above ambient
Not above ambient
iii) Graduate and 100 ml charge, °C
— 13-18 13-18 13-18 13 to ambient
d) Flask, ml 125 125 125 125 3) Conditions during test
Procedure:
a) Temperature of condenser bath, °C
0-1 0-1 0-4 (0-5) 0-4 (0-5) 0-602
b) Temperature of bath around graduate, °C
0-4 13-18 13-18 13-18 Within ± 3°C of temperature of distillation charge
c) Time from first application of heat to initial boiling point, minutes
2-5 5-10 5-10 5-10 5-15
d) Time from initial boiling point to 5 percent recovered, seconds
— 60-100 60-100 — —
e) Time from initial boiling Point to 10 percent recovered, minutes
3-4 — — — —
f) Uniform average of condensation from 5 percent recovered to 5 ml residue in flask, ml/min.
4-5 4-5 4-5 4-5 4-5
g) Time from 5 ml residue to end point, minutes, Max
5 5 5 5 5
1 As determined under all test conditions of the group concerned. 2 The proper condenser bath temperature will depend upon the wax content of the sample and of its distillation fraction. The minimum temperature which permits satisfactory operation should be used. In general a bath temperature in 0 to 4°C range is suitable for kerosene/Aviation Turbine Fuel.
5 APPARATUS
5.1 Basic Components of the Apparatus 5.1.1 The basic components of the distillation unit are the distillation flask, the condenser and associated cooling bath, a metal shield or enclosure for the distillation flask, the heat source, the flask support, the temperature measuring device, and the receiving cylinder to collect the distillate. 5.1.2 Figs. 1 and 2 are examples of manual distillation units. 5.1.3 In addition to the basic components described in 5.1.1, automated units also are equipped with a system to measure and automatically record the temperature and the associated recovered volume in the receiving cylinder.

5.2 The detailed description of the apparatus is given below: 5.2.1 Distillation Flasks Distillation flasks of heat-resistant glass and of capacity, shape and dimensions are shown in Fig. 3. 100 ml distillation flask may also be constructed with the ground glass joint, provided the diameter of the neck shall be the same as 125 ml flask. NOTE — Specially selected flasks with bottoms and walls of uniform thickness are desirable for the tests specifying dry point.

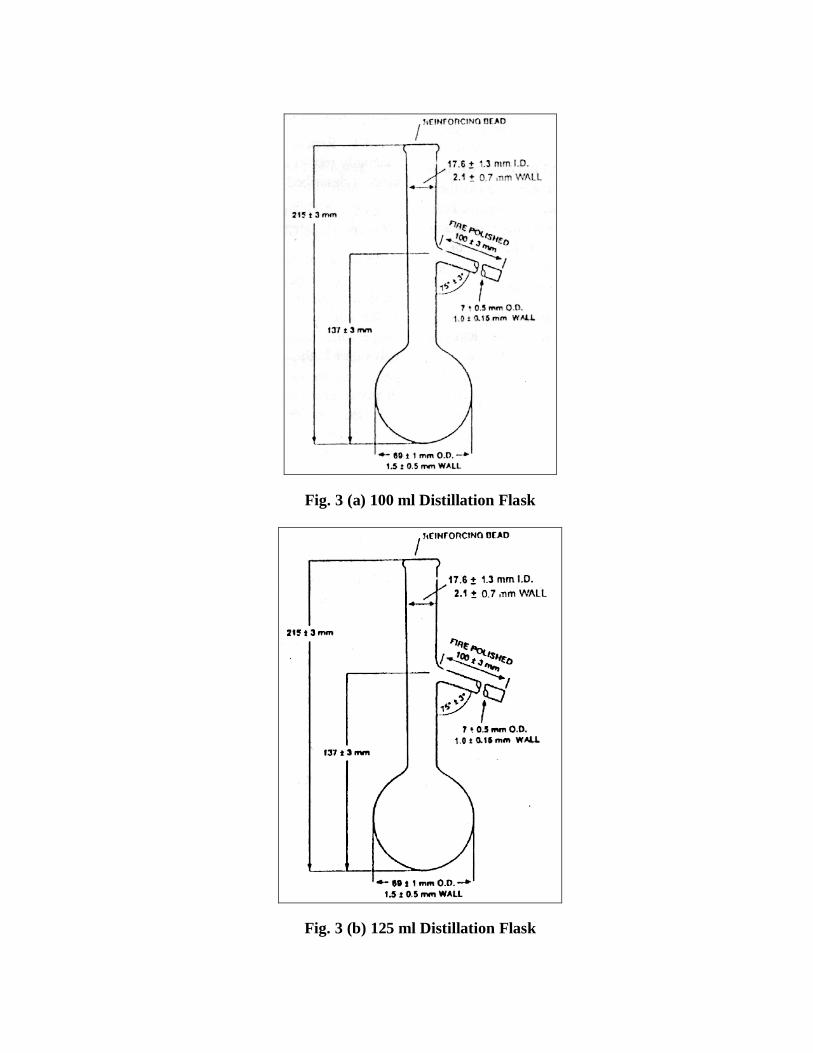
Fig. 3 (a) 100 ml Distillation Flask
Fig. 3 (b) 125 ml Distillation Flask

Fig. 3 (c) 125 ml Ground Glass Joint Flask
Fig. 3 (d) Upper Neck Section Diagram

5.2.2 Condenser and Cooling (Condenser) Bath 5.2.2.1 Typical types of condenser and cooling bath are illustrated in Fig.1 and 2. The condenser shall be made of seamless brass tubing, 560 ± 4 mm in length. It shall be 14 mm in outside diameter and shall have a wall thickness of 0.79 to 0.91 mm. The condenser shall be set so that 393 ± 2 mm of the tube will be in contact with the cooling medium, with 50 ± 2 mm outside the cooling bath at the upper end and 114 ± 2 mm outside at the lower end. The length of tube projecting at the upper end shall be straight and shall be set at an angle of 75 ± 2° with the vertical. The section of the tube inside the cooling bath may be either straight or bent in any suitable continuous, smooth curve. The average gradient shall be 0.26 mm per linear mm of condenser tube. The average gradient shall be 15 ± 1° with respect to the horizontal, with 100 mm section having a gradient outside of the 15 ± 3° range and no section of the immersed portion of the condenser tube shall have a gradient less than 0.24 and 0.28 mm per linear mm of tube. The projecting lower portion of the condenser tube shall be curved downward for a length of 76 mm and slightly backward so as to ensure contact with the wall of the receiving cylinder at a point approximately 25 to 32 mm below the top of the cylinder when it is in position to receive the distillate. The lower end of the condenser tube shall be cut off at an acute angle so that the tip may be brought into contact with the wall of the cylinder (see Fig. 4). NOTE — The flow of distillate down the side of the graduated cylinder may be accomplished either by using a drip deflector which is inserted in the receiver or by having the downward length of the condenser tube curved slightly backwards so as to ensure contact with the wall of the graduated cylinder at a point 25 mm to 32 mm below the top of the graduated cylinder when it is in position to receive distillate.
Fig. 4 Condenser Tube - Lower End

5.2.2.2 The capacity of the cooling bath shall be not less than 5.55 liters of cooling medium. The arrangement of the tube in the cooling bath shall be such that its centre line shall be not less than 32 mm below the plane of the top of the bath at its point of entrance and not less than 19.0 mm above the floor of the bath at its exit.
5.2.2.3 The volume and design of the bath will depend on the cooling medium employed. Cooling capacity of the bath shall be adequate to maintain the required temperature for the desired condenser performance. A single cooling bath can be used for several condenser tubes.
5.2.2.4 Clearance between the condenser tube and the walls of the bath shall be at least 12.7 mm except for the sections adjacent to the points of entrance and exit. Multiple installations are permissible, provided they conform to the dimensional requirements and the capacity of the bath is not less than 5.55 litres per tube.
5.2.3 Metal Shield or Enclosure for Flask 5.2.3.1 Type 1 shield for gas burner (see Fig. 1) is 480 mm high, 280 mm long, and 200 mm wide, made of metal sheet of approximately 0.8 mm. It shall have a door on one narrow side, and two openings 25 mm in diameter, equally spared in each of the two narrow sides, with a slot cut in one side for the vapour tube. The centres of these four openings shall be 216 mm below the top of the shield. There shall be three 12.7 mm holes in each of the four sides, with their centres 25 mm above the base of the shield. The shield is employed for providing protection to the operator while allowing easy access to the burner and to the distillation flask during the operation. The shield shall also have a window to note the dry point at the end of distillation. 5.2.3.2 Type 2 shield for electric heater (see Fig. 2) is 440 mm high, 200 mm long and 200 mm wide, made of metal sheet of approximately 0.8 mm with a window on the front side. The open bottom of the shield shall be spaced approximately 50 mm from the base of the unit. The rear of the shield shall have an elliptical hold for the vapour tube. A flask adjusting knob shall be located on the front of the shield for adjusting the flask support. Also, a heat adjusting indicating dial shall be used to provide stepless heat control when the electric heater is used. The entire mechanism shall be built into the bottom portion of the shield. When an electric heater is employed, the portion of the shield above the board shall be the same as with the gas burner, but the part below may be omitted provided this does not cause the distillation flask to be exposed to draughts. The shield is employed for providing protection to the operator while allowing easy access to the burner and to the distillation flask during the operation. The shield shall also have a window to note the dry point at the end of distillation. 5.2.4 Heat Source 5.2.4.1 Gas burner Gas burner (see Fig. 1), so constructed that sufficient heat from the available gas can be obtained to distil the product at the specified rate. A sensitive regulating valve and gas pressure governor to give complete control of heating may be provided .It is to be ensured that the burner employed can bring

over the first drop from a cold start within the prescribed time and continue distillation at a specified rate. 5.2.4.2 Electric heater Electric Heater (see Fig. 2), may be used instead of a gas burner, provided it is capable of bringing over the first drop from a cold start within the time specified and of continuing the distillation at the specified rate. Heater units of low heat retention, adjustable from 0-1000 W, have been found satisfactory. 5.2.5 Flask Support 5.2.5.1 Type 1 for use with gas burner (see Fig. 1) A ring support of ordinary laboratory type, 100 mm or larger in diameter, supported on a stand inside the shield, or a platform adjustable from the outside of the shield, may be used. Two ceramic heat resistant boards, 3 to 7 mm in thickness, shall rest upon the ring of the platform, whichever is used. The board immediately above the ring or platform shall have a centered opening 76 to 100 mm in diameter and outside line dimensions slightly smaller than the inside boundaries of the shield. The second or flask support board shall be slightly smaller in outside dimensions than the first board and shall have 37.5 mm or 50 mm centered opening. It shall be 3 to 6 mm in thickness at the centre hole rim. This flask support board may be moved slightly in accordance with the direction for placing the distillation flask, and direct heat shall be applied to the flask only through the central opening in this board. 5.2.5.2 Type 2 for use with electric heater (see Fig. 2) The top of the electric heater shall consist of a ceramic or heat resistant flask support board with a centered hole as specified, and a thickness of 3 to 6 mm at the centre hole rim. Provision shall be made for moving the heater unit, with its top, in order to place the distillation flask so that direct heat shall be applied to the flask only through the opening in the flask support board. The whole assembly for Type 1 and Type 2 heater is adjustable from the outside of the shield. Provisions shall be made for moving the flask support assembly vertically so that the flask support board is in direct contact with the bottom of the distillation flask during the distillation. The assembly is moved down to allow for easy mounting and removal of the distillation flask from the unit. 5.2.6 Graduated Cylinder 5.2.6.1 A 100 ml graduated cylinder with 1 ml subdivisions shall be provided. Construction details and tolerances are given in Fig. 5. The shape of the base shall be such that it does not topple the receiver when placed empty on an inclined surface at 13° angle from the horizontal.

5.2.6.2 Automated method — It shall meet the physical requirements with the exception of all Graduation but that at 100 ml mark. Metal base may be used in graduation cylinder in automated unit. If required the receiving cylinder shall be immersed to above the 100 ml graduation line in a cooling bath such as a tall-form beaker of clear glass or transparent plastic, or may be placed in a thermostatically controlled air circulation chamber.
Fig. 5 100 ml Graduated Cylinder
5.2.7 Residue Cylinder
A Graduated cylinder with capacity of 5 ml or 10 ml with minimum graduation of 0.1 ml. 5.2.8 Thermometers
5.2.8.1 Mercury-in-glass thermometers, filled with nitrogen, graduated on the stem and enamel backed. Conforming to the requirements specified in Table 2 can be used. For partly or fully automatic apparatus and procedure, an alternative means of measuring or recording temperature may also be used provided this gives the same reading under distillation test conditions and has a precision not less than that of the prescribed thermometer.
NOTE — The thermometer shall bear a certificate from National Physical Laboratory, New Delhi or any other
Institution authorized by the Government of India to issue such certificate.

Table 2 (Clause 5.2.8.1)
Characteristics Thermometer No. 1 Thermometer No. 2 (1) (2) (3)
Range, °C 2 to + 300 2 to + 400 Graduation, °C 1 1 Immersion Total Total Overall length, mm 380±10 380±10 Stem diameter, mm 5.5 to 8.0 5.5 to 8.0 Bulb shape Cylindrical Cylindrical Bulb length, mm 8 to 16 8 to 16 Bulb diameter, mm Not less than 5.5 and not greater than
stem Not less than 5.5 and not greater than stem
Length of graduated Portion, mm 223 to 254 288 to 329 Distance from bottom of bulb to 0°C, mm
100 to 110 25 to 45
Longer lines at each, °C 5 5 Figured at each, °C 10 10 Expansion chamber Required Required Top Finish Ring Ring Scale error not to exceed, °C ±0.5 upto 150
±1 above 150 ±1 upto 300 ±1.5 above 300
NOTE — Thermometers with the Institute of Petroleum designation IP 5C and IP 6C conform to the requirements for thermometers No.1 and 2 respectively.
5.2.8.2 All the Temperature measuring devices that exhibit same temperature lag, emergent stem effect and accuracy as the equivalent mercury in glass thermometer can be employed in this method. The electronic circuitry or the algorithms or both, used shall include the capability to stimulate the temperature lag of a mercury-in-glass thermometer. Alternatively, place the sensor in a casing with the tip covered so that the assembly because of thermal mass and conductivity has a temperature lag similar to that of mercury-in-glass thermometers. The temperature lag of a thermometer can be as much as 3 seconds in a region where the temperature is changing rapidly during the distillation. In case of dispute, the referee test shall be carried out using specified mercury in glass thermometers.
5.2.9 Temperature Sensor Centering Device The temperature sensor shall be mounted through a tight-fitting device designed for mechanically
centering the sensor in the neck of the flask without vapor leakage. Other centering devices that position and hold the temperature sensing device in the neck of distillation flask as shown in Fig. 6 can be used.
WARNING — The use of a plain cork/stopper with a hole drilled through the centre is not acceptable.

Fig. 6 Position of Thermometer in the Distillation Flask 5.2.10 Barometer Any barometer (except aneroid barometer which are pre-corrected to give sea level reading) capable of measuring local station atmospheric pressure with an accuracy of 0.1 kPa (1 mm Hg) or better at the same elevation relative to sea level can be used to measure in the laboratory. The barometer should ideally be located in the room in which the distillation is carried out. NOTE — Tables of corrected loss from measured loss & barometric loss are given in Annex A. 6 SAMPLING, STORAGE AND SAMPLE CONDITIONING 6.1 Determine the Group characteristics that correspond to the sample to be tested (see Table 1).Where the procedure is dependent upon the group, the section heading will be so marked. 6.2 Sampling 6.2.1 Group 0 Collect the sample in a container previously cooled to below 5°C. Clean the bottle, preferably by immersing it in cold liquid sample and discarding the first sample. When immersion is not possible, the sample shall be drawn off into the bottle pre-chilled to below 10°C in such a manner that agitation is kept at a minimum. Close the container immediately with a tight fitting stopper and place the sample in an ice bath or refrigerator to maintain the sample below the specified temperature. 6.2.2 Group 1 and 2 Collect the sample at a temperature below 10°C. If the sample is at ambient temperature, it shall be drawn into a bottle pre-chilled to below 10°C in such a manner that agitation is kept at a minimum. Close the bottle immediately with a tight fitting closure.

6.2.3 Groups 3 and 4 Collect the sample at ambient temperature. After sampling, close the bottle immediately with a tight
fitting closure.
NOTE — Do not completely fill & tightly seal a cold bottle of sample because of the likelihood of breakage on warming.
6.3 Sample Storage If testing is not to start immediately after collecting, store the samples as given below. All the samples shall be stored away from direct sunlight or sources of direct heat. 6.3.1 Group 0 Store the sample at the temperature below 5°C in a refrigerator. 6.3.2 Groups 1 and 2 Store the sample at the temperature below 10°C. If there are no or inadequate facilities for storage below 10°C, the sample may also be stored at a temperature below 20°C, provided the operator ensures that the sample bottle is tightly closed, leak free and sample is always conditioned to a temperature below 10°C before the container is opened. 6.3.3 Groups 3 and 4 Store the sample at ambient or lower temperature.
6.4 Sample Conditioning Prior to Analysis
6.4.1 Group 0 Sample shall be conditioned to temperature of less than 5°C before opening the sample container.
6.4.2 Groups 1 and 2 Samples shall be conditioned to the temperature of less than 10°C before opening the sample container. 6.4.3 Groups 3 and 4 If the sample is not fluid at ambient temperature, it is to be heated to a temperature of 9 to 21°C above its pour point prior to analysis. If the sample has partially or completely solidified during storage, it shall be vigorously shaken after melting prior to opening the sample container to ensure its homogeneity.

6.5 Wet Samples Samples of material that visibly contain water are not suitable for testing. If the sample is not dry, obtain another sample which is free from suspended water. 6.5.1 Groups 0, 1 and 2 If a dry sample cannot be obtained, the suspended water can be removed by maintaining the sample at 0 to 10°C, adding approximately 10 g of anhydrous sodium sulfate per 100 ml of sample, shaking the mixture for approximately 2 minutes and then allowing the mixture to settle for approximately 15 minutes. Once the sample shows no visible sign of water, use a decanted portion of sample, maintained between 1 and 10 °C, for the analysis. Record that the sample has been dried by the addition of a desiccant. 6.5.2 Groups 3 and 4 In cases, where a water free sample is not practical, remove the suspended water by shaking sample with anhydrous sodium sulfate or any other suitable drying agent and separating it from the drying agent by decantation. Record that the sample has been dried by the addition of a desiccant. 7 CALIBRATION AND STANDARDIZATION
7.1 Calibration and Standardization of Temperature Measuring System 7.1.1 Calibration of the temperature measuring system shall be done once in every six months or
whenever the instrument is replaced or repaired.
NOTE — Thermometers that have been exposed for an extended period above an observed temperature of 370°C, shall be reused after verification of the ice point. 7.1.2 The thermometer bulb approaches critical range at 370°C and hence chances of loosing the calibration are very high. 7.1.3 The accuracy and the calibration of the electronic circuitry or computer algorithms, or both, shall be verified by the use of standard precision resistance bench. When performing this verification, no algorithms shall be used to correct the temperature for lag and the emergent stem effect (see manufacturer’s instructions). 7.1.4 Verification of the calibration of temperature measuring devices shall be conducted by distilling toluene in accordance with Group 1 of this test method and comparing the 50 percent recovered temperature with that shown in Table 3. 7.1.5 To verify the calibration of the temperature measuring system at elevated temperatures, use hexadecane. The temperature measurement system shall indicate, at 50 percent recovered, a temperature comparable to that shown in Table 3 for the respective apparatus under Group 4 distillation conditions.

NOTE — Group 4 verification distillations to be carried out with condenser temperatures greater than 20°C since melting point of the n-hexadecane is high.
Table 3
(Clauses 7.1.4 & 7.1.5) Manual Distillation Automated Distillation Minimum
Conditions Maximum Conditions
Minimum Conditions
Maximum Conditions
True boiling point, °C
50 percent boiling point, °C
50 percent boiling point, °C
50 percent boiling point, °C
50 percent boiling point, °C
Group 0,1,2 & 3 Group 0,1,2 & 3 Group 0,1,2 & 3 Group 0,1,2 & 3
Toluene 110.6 105.9 111.8 108.5 109.7 Group 4 Group 4 Group 4 Group 4
Hexadecane 287.0 272.2 283.1 277.0 280.0 7.1.6 Distill a certified reference fluid of a specific product group, under the manual condition using the appropriate mercury in glass thermometer followed by the alternative temperature measurement device or system. Record the systematic deviation ensuring that the deviation should not exceed the repeatability of this test method and algebraic sum of the deviation is zero. 7.1.7 Level Follower — For an automated distillation apparatus, the level follower/recording mechanism of the apparatus shall have resolution of 0.1 volume percent with a maximum error of 0.3 volume percent between 5 volume percent and 100 volume percent points. The calibration of the assembly shall be verified according to manufacturer’s instruction at intervals of not more than 6 months and after the system has been replaced or repaired. 7.2 Determination of Lag Time Difference between Thermometer and Electronic Measurement System 7.2.1 Generally the electronic temperature measuring device is more rapid as compared to mercury-in-glass thermometer. The electronic measuring device built in the apparatus shall have the sensor and its casing, or an electronic system with associated software, or both, that are designed to simulate the temperature lag of mercury-in-glass thermometer. 7.2.2 In order to determine difference in lag time between electronic measuring device and mercury-in-glass thermometer, a sample like gasoline, kerosene, jet fuels or light diesel fuel is analyzed with electronic measurement device in place as per the procedure described. It should be ensured that a sample typical of the sample load of laboratory is used to obtain the best results. If such sample is not available, a full-range mixture with 5 percent to 95 percent boiling range of atleast 100°C may be used. 7.2.3 The electronic temperature measuring device is replaced with mercury glass thermometer depending on the boiling range of the sample. The distillation can be repeated by noting the temperature at various percentage recoveries manually as per the procedure. NOTE — Avoid using single pure compound, very narrow boiling range product or a synthetic blend less than six compound for the above mention test.

7.2.4 Determine the repeatability for observed slope (dT/dV) for the different readings. The difference in these two measuring devices at any point shall be equal to, or less than, the repeatability of the method at that point. 7.3 Procedure to Emulate the Emergent Stem Error of a Mercury-in-Glass Thermometer 7.3.1 It is ensured that the output of electronic sensor or associated data system should emulate the output of mercury-in-glass thermometer with respect to emergent stem error as well as the lag in response time. 7.3.2 When a low range thermometer is used, no stem correction is required below 20°C. Above this temperature, the correction is calculated using the following formula:
ASTM thermometer 8C or IP thermometer 6C Telr = Tt 0.000162 × (Tt 20°C)2 ........(1)
where Telr = emulated temperature for low range thermometers, in °C; and Tt = true temperature in °C. 7.3.3 In case of usage of high range thermometer, no stem correction is required below 35°C. Above this temperature, the correction is calculated using the following formula above 35°C:
ASTM 8C Tehr = Tt 0.000131 × (Tt 35°C)2 ........(2) where Tehr = emulated temperature for high range thermometers, in °C, and Tt = true temperature, in °C.
8 PREPARATION OF APPARATUS
8.1 Refer to Table 1 and select the flask support and thermometer which are required by the sample to be tested. Bring the respective temperatures of the flask, thermometer, graduate, flask support board and shield to their required values for starting the test.
8.2 Fill the condenser box to cover the condenser tube with a non-flammable coolant which is
suitable for the temperature requirement specified in Table 1, such as chopped ice, water, brine, ethylene glycol solution. If chopped ice is used, add sufficient water to cover the condenser tube. If necessary, make any suitable provision, such as circulation, stirring or air blowing, so as to maintain the required condenser bath temperature throughout the test. Similarly, make any necessary provision so that the temperature of the bath around the graduate will remain within the limit required in Table 1.
8.3 Remove any residual liquid in the condenser tube by swabbing with a piece of soft, lint-free cloth attached to a cord or copper wire.

8.4 Fit the thermometer, provided with a snug-fitting well-rolled cork, tightly into the neck of the flask so that the bulb is centred in the neck and the lower end of the capillary is leveled with the highest point on the bottom of the inner wall of the vapour tube (see Fig. 6)
8.5 Place the flask containing the charge in its support; and by means of a cork through which the vapour tube has been passed; make a tight connection with the condenser tube. Adjust the flask so that it is in a vertical position, and so that the vapour tube extends into the condenser tube for a distance of 25 to 50 mm. Raise and adjust the flask support board to fit tightly against the bottom of the flask.
8.6 Place the graduate that was used to measure the charge, without drying, into its bath under the
lower end of the condenser tube so that the end of the condenser tube is centred in the graduate and extends therein for a distance of at least 25 mm, but not below the 100 ml mark.
8.6 In case of manual method, cover the receiving cylinder with appropriate size blotting paper or similar material that has been cut to fit the condenser tube tightly to reduce evaporation loss. If a receiving deflector is used, start the distillation with the tip of deflector just touching the wall of the receiving cylinder. Note the start time.
8.7 Note and record the prevailing barometric pressure, and proceed at once with the distillation, as given in 9. 9 PROCEDURE 9.1 Group 0, 1 and 2 Use Low range thermometer provided with a tightly fitting cork or stopper of silicon rubber or equivalent polymeric material and fit securely into the neck of the sample container. NOTE — It is important that the difference between the temperature of sample and the temperature of the bath around the receiving cylinder is as minimum as possible. A difference of 5°C can make a difference of 0.7 ml received in cylinder. 9.2 Group 3 and 4 9.2.1 Whenever the sample is not fluid at ambient temperature, heat it upto 9 to 21°C above its pour point. To ensure homogeneity, the sample shall be vigorously shaken after melting if it is partially or completely solidified in the intervening period. 9.2.2 Before commencement of testing, heat the receiving cylinder to approximately the same temperature as the sample, if the sample is not fluid at ambient temperature. 9.2.3 Pour the sample precisely to the 100 ml mark of the receiving cylinder and transfer the contents of the receiving cylinder as completely as possible into the distillation flask, ensuring that none of the liquid flows into the vapour tube.
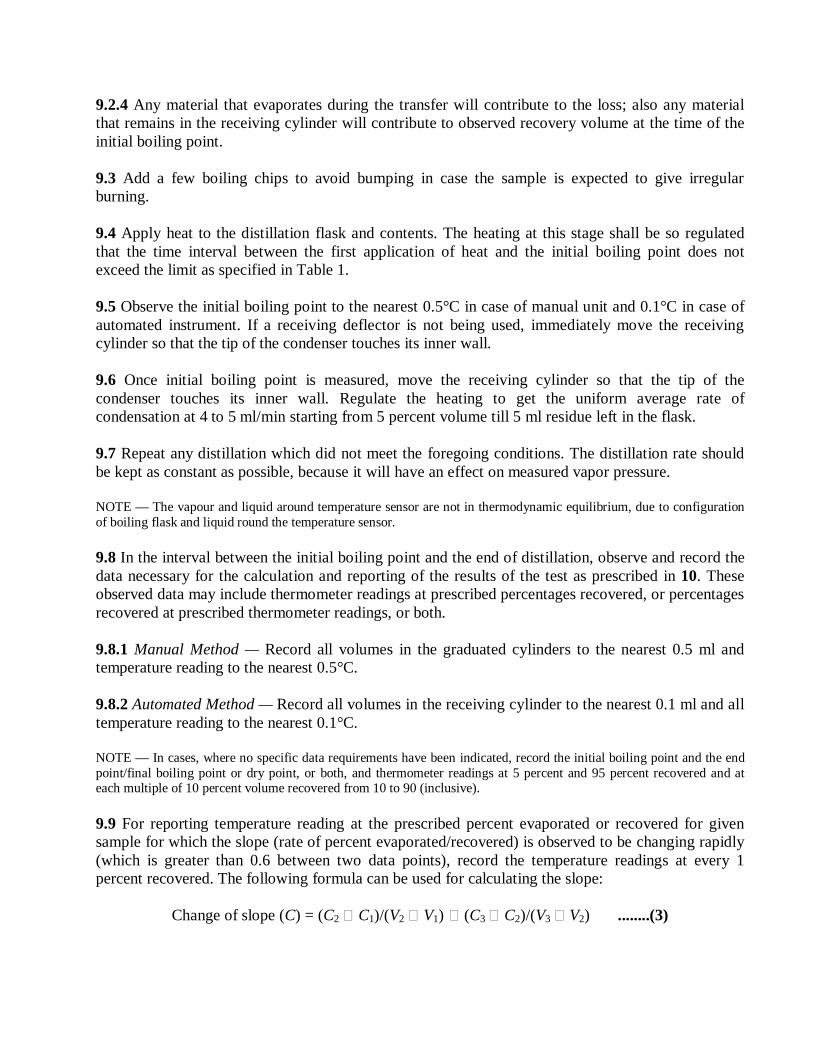
9.2.4 Any material that evaporates during the transfer will contribute to the loss; also any material that remains in the receiving cylinder will contribute to observed recovery volume at the time of the initial boiling point. 9.3 Add a few boiling chips to avoid bumping in case the sample is expected to give irregular burning. 9.4 Apply heat to the distillation flask and contents. The heating at this stage shall be so regulated that the time interval between the first application of heat and the initial boiling point does not exceed the limit as specified in Table 1. 9.5 Observe the initial boiling point to the nearest 0.5°C in case of manual unit and 0.1°C in case of automated instrument. If a receiving deflector is not being used, immediately move the receiving cylinder so that the tip of the condenser touches its inner wall. 9.6 Once initial boiling point is measured, move the receiving cylinder so that the tip of the condenser touches its inner wall. Regulate the heating to get the uniform average rate of condensation at 4 to 5 ml/min starting from 5 percent volume till 5 ml residue left in the flask. 9.7 Repeat any distillation which did not meet the foregoing conditions. The distillation rate should be kept as constant as possible, because it will have an effect on measured vapor pressure. NOTE — The vapour and liquid around temperature sensor are not in thermodynamic equilibrium, due to configuration of boiling flask and liquid round the temperature sensor.
9.8 In the interval between the initial boiling point and the end of distillation, observe and record the data necessary for the calculation and reporting of the results of the test as prescribed in 10. These observed data may include thermometer readings at prescribed percentages recovered, or percentages recovered at prescribed thermometer readings, or both. 9.8.1 Manual Method — Record all volumes in the graduated cylinders to the nearest 0.5 ml and temperature reading to the nearest 0.5°C. 9.8.2 Automated Method — Record all volumes in the receiving cylinder to the nearest 0.1 ml and all temperature reading to the nearest 0.1°C. NOTE — In cases, where no specific data requirements have been indicated, record the initial boiling point and the end point/final boiling point or dry point, or both, and thermometer readings at 5 percent and 95 percent recovered and at each multiple of 10 percent volume recovered from 10 to 90 (inclusive). 9.9 For reporting temperature reading at the prescribed percent evaporated or recovered for given sample for which the slope (rate of percent evaporated/recovered) is observed to be changing rapidly (which is greater than 0.6 between two data points), record the temperature readings at every 1 percent recovered. The following formula can be used for calculating the slope:
Change of slope (C) = (C2 C1)/(V2 V1) (C3 C2)/(V3 V2) ........(3)

where C1 = temperature at the volume percent recorded one reading prior to volume percent in question, °C; C2 = temperature at the volume percent recorded, in question, °C; C3 = temperature at the volume percent recorded following the volume percent in question, °C; V1 = volume percent recorded one reading prior to the volume percent in question; V2 = volume percent recorded at the volume percent in question, and V3 = volume percent recorded following the volume percent, in question. 9.10 If a decomposition point is observed, discontinue the heating and resume the procedure as directed in 9.13.Otherwise, proceed as directed in 9.11.
9.11.1 When the residual liquid in the flask is approximately 5 ml, make a final adjustment of the heat, if necessary, so that the time from the 5 ml of liquid residue in the flask to the end point/final boiling point shall meet the requirements specified in Table 1. If this condition is not satisfied, repeat the test with appropriate modification of the final heat adjustment. 9.11.2 To overcome the difficulty to exactly determine as to when 5 ml of residual liquid left in the flask, it is estimated by observing the amount of liquid left in the cylinder. The dynamic hold up has been determined to be approximately 1.5 ml at this point and thus with no losses the amount of 5 ml in the distillation flask can be assumed to correspond to an amount of 93.5 ml in the receiving cylinder. 9.11.3 When the actual front end loss differs more than 2 ml from the estimated value, the test shall be repeated.
9.12 Observe and record the end point/final boiling point or dry point, or both, as required, and discontinue the heating. At the end (final boiling) point, observe if all the liquid has evaporated from the bottom of the flask. If not, include a note of this fact in the report prescribed in 10. 9.13 While the condenser tube continues to drain into the graduate, observe the volume of condensate at 2 minutes intervals until two successive observations agree. Measure this volume accurately, and record it to the nearest 0.5 ml, as percent recovery. Allow the distillate to drain into the receiving cylinder, after heating has been discontinued. 9.14 If the distillation was previously discontinued under the conditions given in 9.10, deduct the percent recovery from 100, report this difference as ‘Percent Residue and Loss’, and omit the procedure given in 9.17 and 9.18
9.15 If residue obtained is greater than expected and the distillation was not purposely terminated
before the end point, check whether the adequate heat was applied towards the end of distillation and the condition are followed as per table 1 during the test and if not repeat the test. NOTE — Distillation residue for Gasoline, Kerosene and distillate diesel are typically 0.7 - 1.4, 0.8 - 1.4 and 0.9 - 1.5 respectively.

9.16 In case of automated method, the apparatus shall continually monitor the recovered volume until this volume changes by no more than 0.1 ml in 2 minutes. Record the volume in receiving cylinder accurately to the nearest 0.1 ml.
NOTE — The test method is not designed for the analysis of distillate fuel containing appreciable quantities of residual
material. 9.17 After the flask has cooled and no more vapour observed, pour its contents in the cylinder and allow to drain until no appreciable increase in the volume of liquid in the cylinder is observed. Record this volume, to the nearest 0.1 ml as percent residue. Add this observed volume to the percent recovery, in order to obtain percent total recovery. 9.18 Deduct the percent total recovery from 100 to obtain the percent loss. 9.19 Examine the condenser tube and the side arm of the flask for waxy or solid deposits. If found, repeat the test after making necessary adjustments. 10 CALCULATIONS AND REPORT
10.1 For each test, calculate and report whatever data are required by the specification involved, or as customarily established for the sample under test, or in accordance with Note under 9.8.
10.2 Do not correct the barometric pressure for meniscus depression and do not adjust the pressure to what it would be at sea level. 10.3 When ASTM thermometer 8C or IP thermometer 6C is used in testing aviation turbine fuels and similar products, pertinent thermometer readings may be obscured by the cork. To provide the desired data, a second distillation according to Group 3 of Table 1 may be performed. In such cases, readings from ASTM thermometer 7C or IP thermometer 5C may be reported in place of the obscured ASTM thermometer 8C or IP thermometer 6C readings, and the test report shall so indicate. If, by agreement, the obscured readings are waived, the test report shall so indicate. NOTE —The observed barometric reading does not have to be corrected to a standard temperature and to standard gravity. 10.4 When the report is to be based on thermometer readings corrected to 101.3 kPa (760 mm Hg, 1013 mm bar) barometric pressure (see Note), obtain the correction to be applied to each thermometer reading by means of the Sydney Young equation as given in Eq. 4, Eq. 5 or Eq. 6, or by the use of Table 4. After applying the corrections and rounding each results to the nearest 0.5°C, use the corrected thermometer readings in all further calculations and reporting.
Cc = 0.0009 (101.3-Pk) (273 + Tc) ........(4) or
Cc = 0.000 12 (760-P) (273+Tc) ........(5) or
Cc = 0.000 09 (1013-Pb) (273 + Tc) ........(6)

where Cc = corrections to be added algebraically to the observed thermometer readings Tc, respectively; P = barometric pressure, in mm Hg, prevailing at the time of the test; Pb = barometric pressure, in mbar, prevailing at the time of the test, and Pk = barometric pressure, in kPa, prevailing at the time and the place of the test. NOTE — Temperature readings are not corrected to 101.3 kPa when product definition, specification or agreements between the parties involved indicate, specifically that such correction is not required or that correction shall be made to some other base pressure.
Table 4 Approximately Corrected Thermometer Readings (Clause 10.4)
Temperature Range, °C
(1)
Corrections1 per 1.3 kPa (10 mm Hg) Difference in Pressure, °C
(2) 10-30 0.35 30-50 0.38 50-70 0.40 70-90 0.42 90-110 0.45
110-130 0.47 130-150 0.50 150-170 0.52 170-190 0.54 190-210 0.57 210-230 0.59 230-250 0.62 250-270 0.64 270-290 0.66 290-310 0.69 310-330 0.71 330-350 0.74 350-370 0.76 370-390 0.78 390-410 0.81
1Values to be added in case when barometric pressure is below 101.3 kPa (760 mm of Hg) to be subtracted in case barometric pressure is above 101.3 kPa (760 mm of Hg).
10.5 Correct the actual loss to 101.3 kPa (760 mm of Hg) pressure when thermometer readings are corrected to 101.3 kPa pressure. Calculate the corrected loss Lc in percent volume in percent volume from the following equation:
Lc = 0.5 + (L 0.5)/{1+( 101.3 Pk)/8.00} ........(7)
where L = percent loss calculated from test data in percent volume, and Pk = observed barometric pressure, in kPa.
10.6 After barometric corrections of the thermometer, readings have been made, if required. The following data require no further calculation prior to reporting: initial boiling point, dry point, end point/final boiling point, decomposition point, percent recovery, percent total recovery, and all pairs

of corresponding values involving percentages recovered and thermometer readings. Percent loss and percent residue are calculated in accordance with their respective definitions as set forth in 4.9 and 4.12. 10.7 It is advisable to base the report on relationships between thermometer readings and percentages evaporated in any case in which the sample is a gasoline, or any other product classed under Group 1 in Table 1, or in which the percent loss is greater than 2.0. Otherwise, the report may be based on relationships between thermometer readings and percentages evaporated or recovered. Every report shall indicate clearly which basis has been used. 10.8 To report percentages evaporated at prescribed thermometer readings, add the percent loss to each of the observed percentages recovered at the prescribed thermometer readings, and report these results as the respective percentages evaporated. 10.9 To report thermometer readings at prescribed percentages evaporated, use either of the two following procedures, and indicate on the report whether the graphical procedure or the arithmetical procedure has been used. 10.9.1 Graphical Procedure
Using graph paper with uniform subdivisions plot each thermometer reading (corrected for barometric pressure, if required) against its corresponding percent recovered. Plot the initial boiling point at 0 percent recovered. Draw a smooth curve connecting the points. For each prescribed percent evaporated, deduct the distillation loss, in order to obtain the corresponding percent recovered, and take from the graph the thermometer reading which this percent recovered indicates (see Notes under 10.9.2). Values obtained by graphical interpolation procedures are affected by the care with the plot is made.
10.9.2 Arithmetical Procedure Deduct the distillation loss from each prescribed percentage evaporated in order to obtain the corresponding percentage recovered. Calculate each required thermometer reading as follows:
T = TL + ( TH – TL ) ( R – RL ) ........(8)
( RH – RL ) where T = thermometer reading, in °C, at the prescribed percent evaporated; R = percent recovered corresponding to the prescribed percent evaporated; RH = percent recovered adjacent to, and higher than R, at which a thermometer reading ‘TH’ was noted; RL = percent recovered adjacent to, and lower than R, at which a thermometer reading ‘TL’ was noted; TH = temperature reading, in °C, recorded at RH, and TL = temperature reading, in °C, recorded at RL.

NOTES 1 Values obtained by the arithmetical procedure are affected by the extent to which the distillation graph is non-linear. Intervals between successive data points shall, at any stage of the test, be at least as narrow as indicated in Note under 9.8. In no case shall a calculation be made which involved extra-polation. 2 See Annex B for numerical examples illustrating the foregoing graphical and arithmetical procedures. 10.10 If thermometer readings are corrected to 1013 mbar (760 mm Hg) pressure, the actual loss shall be corrected to 1013 mbar (760 mm Hg) pressure, according to the equation given below. The corresponding corrected percent recovery is computed on the basis that is greater than the actual recovery by the same amount as the corrected loss is less than the actual loss. When reporting data, state whether the corrections have or have not been applied.
Corrected loss = AL + B… etc., Pressure ........(9) where, L = percent loss as calculated from test data, and A and B = numerical constants, the values of which depend upon the prevailing barometric pressure. These constants are listed in Table 5, in connection with the prevailing pressure.
Table 5 Values of the Constant ‘A’ and ‘B’ used in Obtaining Corrected Distillation Loss (Clause 10.3)
Observed Barometric Pressure A B Mbar
(1) (mm Hg)
(2)
(3)
(4) 747 560 0.231 0.384 760 570 0.240 0.380 773 580 0.250 0.375 787 590 0.261 0.369 800 600 0.273 0.363 813 610 0.286 0.357 826 620 0.300 0.350 840 630 0.316 0.342 853 640 0.333 0.333 866 650 0.353 0.323 880 660 0.375 0.312 893 670 0.400 0.300 906 680 0.428 0.286 920 690 0.461 0.269 933 700 0.500 0.250 946 710 0.545 0.227 960 720 0.600 0.200 973 730 0.667 0.166 986 740 0.750 0.125
1000 750 0.857 0.071 1013 760 1.000 0.000
11 PRECISION AND BIAS 11.1 Precision — The precision of this test method is as follows: 11.1.1 The statistical determination of the precision of the volume percent evaporated or recovered at a prescribed temperature for manual apparatus has not been directly measured in an inter-laboratory

program. It can be shown that the precision of the volume percent evaporated or recovered at a prescribed temperature is equivalent to the precision of the temperature measurement at that point divided by the rate of change of temperature versus volume percent evaporated or recovered. The estimation of precision becomes less precise at high slope values. 11.1.2 Slope or Rate of Change of Temperature 11.1.2.1 In case of the precision of initial boiling point and end point/final boiling point, slope calculation (dC/dV) is not required for Group 1 in manual method and for all groups in automated method. 11.1.2.2 The precision data reported, are based on the rate of change of temperature at that particular point which is calculated from percent evaporated data for samples in Group1 and percent recovered data for samples in Groups 2, 3 and 4. 11.1.2.3 With the exception stated in 11.1.2.1, the slope at any point during the distillation is calculated from the from Eq. 10, Eq. 11 or Eq. 12, using the values shown in Table 6.
dC/dV = (TU TL)/(VU VL) ........(10)
where dC/dV = slope, °C/volume percent; TU = upper temperature, °C; TL = lower temperature, °C; VU = volume percent recovered or evaporated corresponding to TU, and VL = volume percent recovered or evaporated corresponding to TL. 11.1.2.4 In case, where distillation end point occurs prior to 95 percent point, the slope at the end point is as follows:
dC/dV = (TFBP TH)/(VFBP VH) ........(11) where TFBP = temperature, in °C, at the end point; TH = temperature in °C at the highest reading, either 80 or 90 percent, prior to the end point percent; VFBP =volume in percent at the end point; VH = the volume in percent at the highest reading, either 80 or 90 percent, prior to the end point percent; H = highest volume reading, to the nearest 5 percent v/v, prior to final boiling point. 11.1.2.5 For the points between 10 to 85 percent which are not shown in Table 6 the slope is calculated as follows:
dC/dV = 0.05[T (v+10) T (v-10)] ........(12)
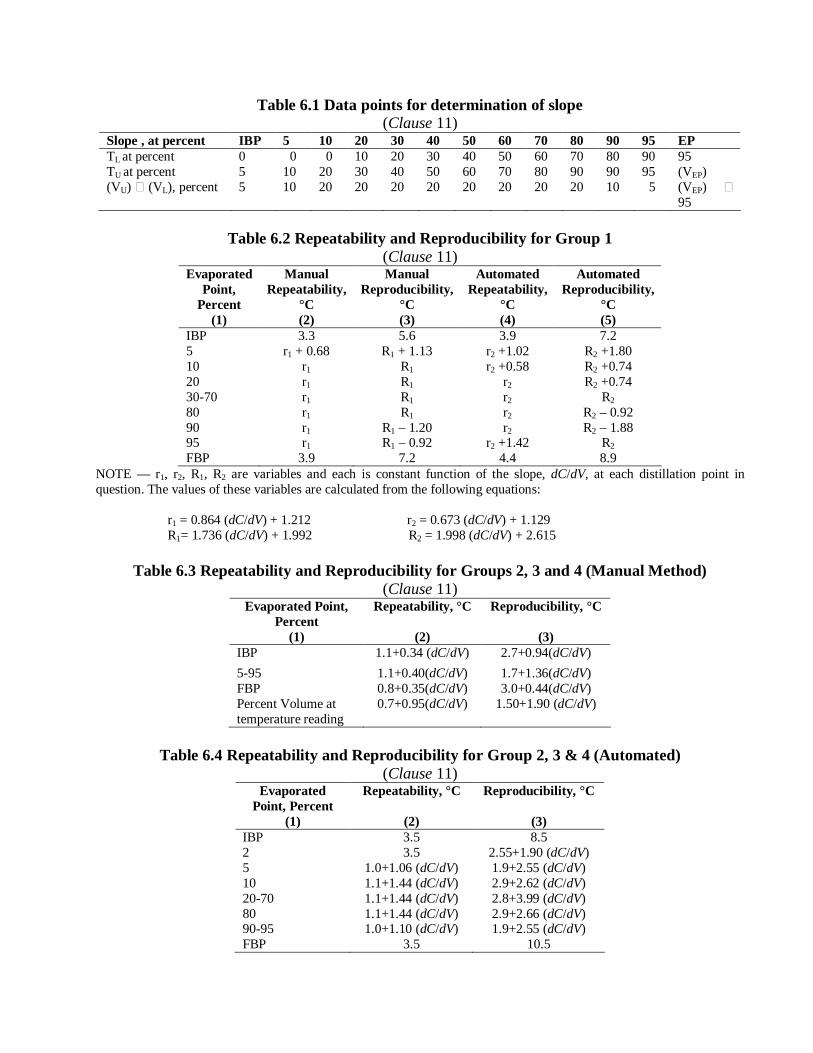
Table 6.1 Data points for determination of slope (Clause 11)
Slope , at percent IBP 5 10 20 30 40 50 60 70 80 90 95 EP TL at percent 0 0 0 10 20 30 40 50 60 70 80 90 95 TU at percent 5 10 20 30 40 50 60 70 80 90 90 95 (VEP) (VU) (VL), percent 5 10 20 20 20 20 20 20 20 20 10 5 (VEP)
95
Table 6.2 Repeatability and Reproducibility for Group 1 (Clause 11)
Evaporated Point,
Percent (1)
Manual Repeatability,
°C (2)
Manual Reproducibility,
°C (3)
Automated Repeatability,
°C (4)
Automated Reproducibility,
°C (5)
IBP 3.3 5.6 3.9 7.2 5 r1 + 0.68 R1 + 1.13 r2 +1.02 R2 +1.80 10 r1 R1 r2 +0.58 R2 +0.74 20 r1 R1 r2 R2 +0.74 30-70 r1 R1 r2 R2 80 r1 R1 r2 R2 – 0.92 90 r1 R1 – 1.20 r2 R2 – 1.88 95 r1 R1 – 0.92 r2 +1.42 R2 FBP 3.9 7.2 4.4 8.9
NOTE — r1, r2, R1, R2 are variables and each is constant function of the slope, dC/dV, at each distillation point in question. The values of these variables are calculated from the following equations:
r1 = 0.864 (dC/dV) + 1.212 r2 = 0.673 (dC/dV) + 1.129 R1= 1.736 (dC/dV) + 1.992 R2 = 1.998 (dC/dV) + 2.615
Table 6.3 Repeatability and Reproducibility for Groups 2, 3 and 4 (Manual Method) (Clause 11)
Evaporated Point, Percent
(1)
Repeatability, °C
(2)
Reproducibility, °C
(3) IBP 1.1+0.34 (dC/dV) 2.7+0.94(dC/dV) 5-95 1.1+0.40(dC/dV) 1.7+1.36(dC/dV) FBP 0.8+0.35(dC/dV) 3.0+0.44(dC/dV) Percent Volume at temperature reading
0.7+0.95(dC/dV) 1.50+1.90 (dC/dV)
Table 6.4 Repeatability and Reproducibility for Group 2, 3 & 4 (Automated)
(Clause 11) Evaporated
Point, Percent (1)
Repeatability, °C
(2)
Reproducibility, °C
(3) IBP 3.5 8.5 2 3.5 2.55+1.90 (dC/dV) 5 1.0+1.06 (dC/dV) 1.9+2.55 (dC/dV) 10 1.1+1.44 (dC/dV) 2.9+2.62 (dC/dV) 20-70 1.1+1.44 (dC/dV) 2.8+3.99 (dC/dV) 80 1.1+1.44 (dC/dV) 2.9+2.66 (dC/dV) 90-95 1.0+1.10 (dC/dV) 1.9+2.55 (dC/dV) FBP 3.5 10.5

11.1.3 Manual Method
11.1.3.1 Repeatability 11.1.3.1.1 Group 0 — Duplicate results obtained for the End Point shall not differ from each other by 3.5°C in one case in 20. Differences in duplicate temperature readings for each prescribed percentage point shall not exceed the amounts equivalent to 2 ml of distillate at each point in question. 11.1.3.1.2 Group 1 — The difference between successive results obtained by the same operator with the same apparatus under constant operating conditions on identical test material would, in the long run, in the normal and correct operations of these test method, exceed the value calculated from Table 6.2 in only one case in 20. 11.1.3.1.3 Groups 2, 3 and 4 — The difference between successive results obtained by the same operator with the same apparatus under constant operating conditions on identical test material would, in the long run, in the normal and correct operations of these test method, exceed the value calculated from Table 6.3 in only one case in 20. 11.1.3.2 Reproducibility 11.1.3.2.1 Group 0 — The reproducibility of the test method for this group has not been determined. 11.1.3.2.2 Group 1 — The difference between two single and independent results obtained by the different operators working in different laboratories on identical test material would, in the normal and correct operations of this method, exceed the values calculated from Table 6.2 in only one case in 20. 11.1.3.2.3 Groups 2, 3 and 4 — The difference between two single and independent results obtained by the different operators working in different laboratories on identical test material would, in the normal and correct operations of this method, exceed the values calculated from Table 6.3 in only one case in 20. 11.1.4 Automated Method
11.1.4.1 Repeatability
11.1.4.1.1 Group 0 — duplicate results obtained for the End Point shall not differ from each other by more than 3.5 °C in one case in 20. Differences in duplicate temperature readings for each prescribed percentage point shall not exceed the amounts equivalent to 2 ml of distillate at each point in question. 11.1.4.1.2 Group 1 — The difference between successive results obtained by the same operator with the same apparatus under constant operating conditions on identical test material would, in the long run, in the normal and correct operations of these test method, exceed the values calculated from Table 6.2 in only one case in 20.
11.1.4.1.3 Group 2, 3 and 4 — The difference between successive results obtained by the same operator with the same apparatus under constant operating conditions on identical test material would, in the long run, in the normal and correct operations of these test method, exceed the values calculated from Table 6.4 in only one case in 20.
11.1.4.2 Reproducibility 11.1.4.2.1 Group 0 — The reproducibility of the test method for this group has not been determined. 11.1.4.2.2 Group 1 — The difference between two single and independent results obtained by the different operators working in different laboratories on identical test material would, in the normal and correct operations of this method, exceed the values calculated from Table 6.2 in only one case in 20. 11.1.4.2.3 Groups 2, 3 and 4 — The difference between two single and independent results obtained by the different operators working in different laboratories on identical test material would, in the normal and correct operations of this method, exceed the values calculated from Table 6.4 in only one case in 20. 11.2 Bias 11.2.1 The distillation temperature in this test method are lower than the true temperatures due to the use of the total immersion thermometers or temperature sensing systems designed to emulate them. The amount of bias depends upon the product being distilled and the thermometer used. 11.2.2 The true boiling point distillation curve and the empirical result of distillation properties obtained by this test method, there is a bias between them. The magnitude of this bias related to test precision has not been studied.
ANNEX A
(Clause 5.2.20) TABLES OF CORRECTED LOSS FROM MEASURED LOSS & BAROMETRIC
PRESSURE
A-1 Table 7 (a) can be used to determine the corrected loss from the measured loss & the barometric pressure in kPa. A-2 Table 7 (b) can be used to determine the corrected loss from the measured loss & the barometric pressure in mm Hg.

Corrected loss from measured loss and the barometric pressure in mm Hg

Corrected loss from measured loss and the barometric pressure in mm Hg

ANNEX B (Clause 10.9.2)
EXAMPLES ILLUSTRATING CALCULATIONS OF THERMOMETER READINGS AT PRESCRIBED PERCENTAGES EVAPORATED
(NON-MANDATORY INFORMATION) B-1 SPECIFIED DISTILLATION DATA B-1.1 General Many Product specifications require specific percentages evaporated or covered, either as maximum, minimum or ranges, at specified temperature readings. These are frequently designated the terms “Exxx” or “Rxxx”. Note — Typical specified temperatures are E70, E100, E180 for gasolines, R200 for kerosines and R350, R360, and R370 for diesel oils. B-1.2 Procedure B-1.2.1 From the observed barometric pressure, calculate the temperature readings equivalent to those desired, using the procedure given in 10.4. B-1.2.2 Carry out a distillation as described in 9, but in the range approximately 10°C above the desired temperature reading calculated in B-1.2.1. Record the temperature readings at intervals of 1 percent (v/v) or smaller. Observe and record the amount of distillate recovered closest to the exact temperature reading required. NOTE — If the intent of the distillation is only to determine Rxxx, the distillation may be discontinued after a minimum of 2 ml of distillate has been recovered above the highest specified temperature. B-1.3 Calculation To determine the value of Exxx, add the observed loss to the observed volume recovered at or around the required corrected temperature reading. Obtain the value at the exact temperature, using either the arithmetical or graphical procedures described in 10.9. B-1.4 Precision Although the statistical determination of precision has not been directly carried out on the basis of Exxx, Rxxx, this can be calculated on the basis that it is equivalent to the precision of temperature measurement divided by the rate of change of temperature measurement versus the volume recovered or evaporated. This calculation becomes less valid at high slope values. The following equations describe this relationship:
rv = r/(dC/dV) ........(13)
Rv= R/(dC/dV) ........(14)
where rv = repeatability of the volume percent evaporated or recovered; r = repeatability of the temperature at the specified temperature, obtained from Table 6.2; Rv = reproducibility of the volume percent evaporated or recovered, and R = reproducibility of the temperature at the specified temperature, obtained from Table 6.2.
B-2 Examples of Data Calculations
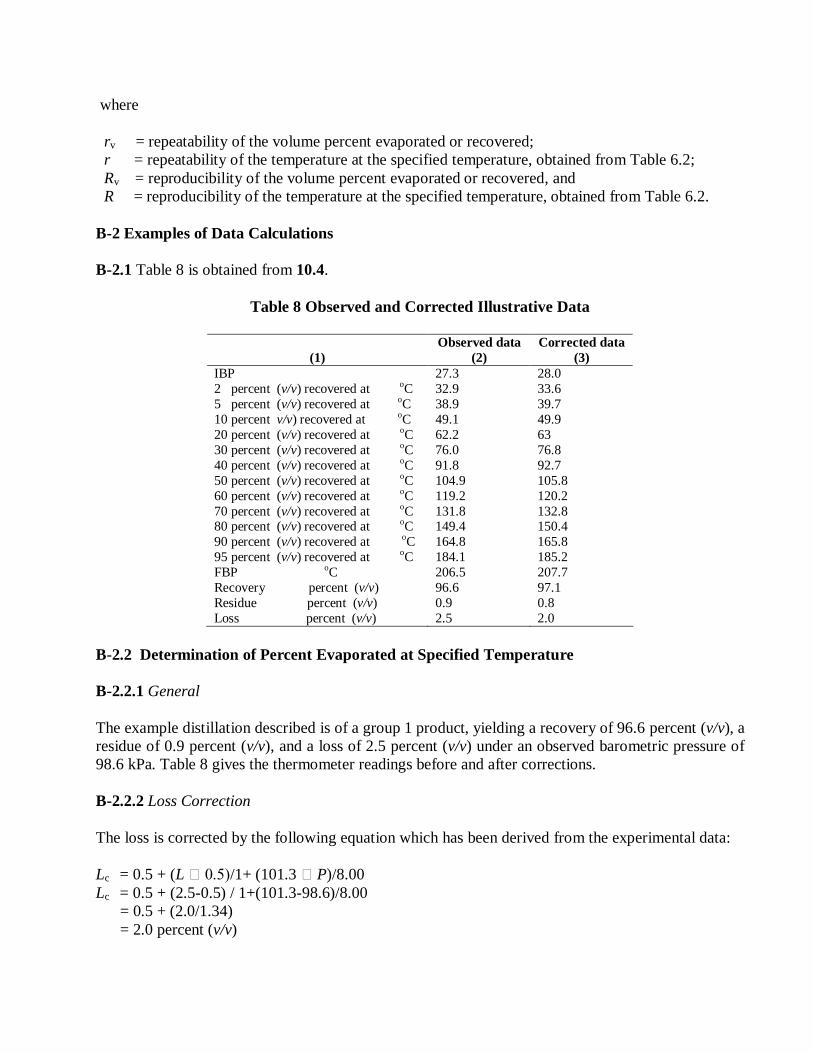
B-2.1 Table 8 is obtained from 10.4.
Table 8 Observed and Corrected Illustrative Data
Observed data Corrected data (1) (2) (3)
IBP 2 percent (v/v) recovered at oC 5 percent (v/v) recovered at oC 10 percent v/v) recovered at oC 20 percent (v/v) recovered at oC 30 percent (v/v) recovered at oC 40 percent (v/v) recovered at oC 50 percent (v/v) recovered at oC 60 percent (v/v) recovered at oC 70 percent (v/v) recovered at oC 80 percent (v/v) recovered at oC 90 percent (v/v) recovered at oC 95 percent (v/v) recovered at oC FBP oC Recovery percent (v/v) Residue percent (v/v) Loss percent (v/v)
27.3 32.9 38.9 49.1 62.2 76.0 91.8 104.9 119.2 131.8 149.4 164.8 184.1 206.5 96.6 0.9 2.5
28.0 33.6 39.7 49.9 63 76.8 92.7 105.8 120.2 132.8 150.4 165.8 185.2 207.7 97.1 0.8 2.0
B-2.2 Determination of Percent Evaporated at Specified Temperature B-2.2.1 General The example distillation described is of a group 1 product, yielding a recovery of 96.6 percent (v/v), a residue of 0.9 percent (v/v), and a loss of 2.5 percent (v/v) under an observed barometric pressure of 98.6 kPa. Table 8 gives the thermometer readings before and after corrections. B-2.2.2 Loss Correction The loss is corrected by the following equation which has been derived from the experimental data: Lc = 0.5 + (L 0.5)/1+ (101.3 P)/8.00 Lc = 0.5 + (2.5-0.5) / 1+(101.3-98.6)/8.00 = 0.5 + (2.0/1.34) = 2.0 percent (v/v)

B-2.2.3 Recovery Correction The corrected recovery according to equation Rc= R + (L Lc) where R is the observed recovery in percent volume; L is the observed percent loss, in percent volume, and Lc is the corrected percent loss, in percent volume. Rc = 96.6 + (2.5-Lc) = 96.6+ (2.5-2.0) = 97.1 percent (v/v) B-2.2.4 Determination The percent evaporated can be easily calculated using the arithmetical or graphical procedures described in 10.0. To calculate directly from the observed thermometer readings, correct the values for the specified temperatures for barometric pressure using the following equation.
Cc = 0.0009 (101.3-98.6) (273+Tc)
70.8oC for 70oC 100.9oC for 100oC 181.1oC for 180oC
B-2.2.5 Precision B-2.2.5.1 To calculate the precision for the above three temperatures, first obtain dC/dV for each as follows: For E70 0.1 (76.8-63) = 1.38 For E100 0.1 (105.8-92.7) =1.31 For E180 0.2 (185.2-165.8) = 3.88 B-2.2.5.2 Obtain the precision from Table 6.2. Use approximately, 30 percent, 50 percent and 95 percent figures. Calculate as follows: r2 70 = 2.06 R2 70 = 5.37 r2 100 = 2.03 R2100 = 5.23 r2 180 = 3.74 R2180 = 10.36

B-2.2.5.3 By the use of Eq. 13 & Eq. 14, the precision becomes: rE70 = 2.06/1.38 = 1.50 percent (v/v) RE70 = 5.37/1.38 = 3.90 percent (v/v) rE100 = 2.03/1.31 = 1.55 percent (v/v) RE100 = 5.23/1.31 = 4.0 percent (v/v) rE180 = 3.74/3.88 = 0.96 percent (v/v) RE180 = 10.36/3.88 = 2.67 percent (v/v)