pbctpbct 1 economic environment: has connecticut joined the recovery? southern new england economic...
TRANSCRIPT

PBCT
1
Economic Environment: Economic Environment:
Has Connecticut Joined the Recovery?Has Connecticut Joined the Recovery?
Southern New England Southern New England Economic Summit & Outlook 2004Economic Summit & Outlook 2004
May 14, 2004
Todd P. MartinEconomic AdvisorPeople’s Bank203.218-9825 [email protected]
PBCT
2
The Fed is on hold … For Now
"As I have noted previously, the federal funds rate must rise at some point to prevent pressures on price inflation from eventually emerging. As yet, the protracted period of monetary accommodation has not fostered an environment in which broad-based inflation pressures appear to be building. But the Federal Reserve recognizes that sustained prosperity requires the maintenance of price stability and will act, as necessary, to ensure
that outcome. ”
Testimony of Chairman Alan Greenspan
Before the Joint Economic Committee, U.S. Senate April 21, 2004

PBCT
3
US Economic Backdrop US Economic Backdrop
• The economic momentum that began in the second half of 2003 is carrying through into 2004. The combination of low interest rates, stimulative fiscal policy, outstanding productivity, and stronger corporate profits should result in real GDP growth of approximately 4%+ this year.
• The Fed has begun to set the stage for higher rates. The fed funds rate should remain at a 46-year low of 1.0% until at least the June or August 2004 FOMC meeting and move towards 1.5% by year-end. 10-year T-note yields should trend slightly higher (5%) by the end of 2004.
• Inflation is well contained, but concerns about the future are increasing.
• Risks: Jobs (insecurity & outsourcing) - Iraq - terrorism - oil prices - divisive election year - growing budget & trade deficits - stocks vulnerable?

PBCT
4
The economy is on track to grow at 4%+ in 2004The economy is on track to grow at 4%+ in 2004
Source: Conference Board,BEA, People’s Bank
Gross Domestic Product (CW$)
Transformation: %Chg, AR Source: Bureau of Economic Analysis
-2
-4
0
2
4
6
8
10
89 90 91 92 93 94 95 96 97 98 99 00 01 02 03 04
PBCT
5
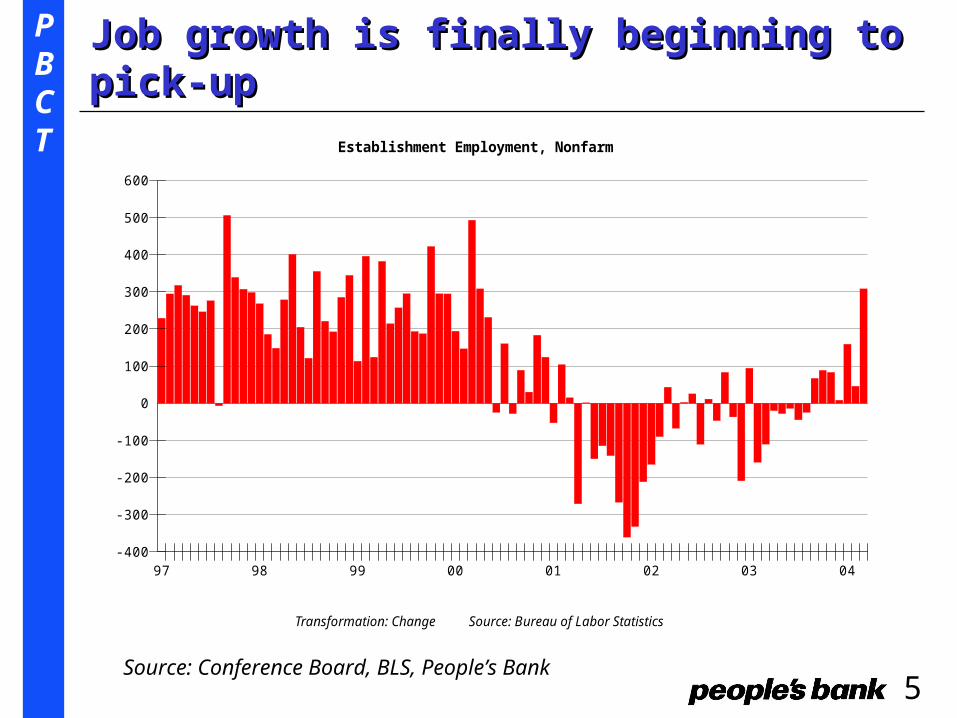
Job growth is finally beginning to pick-upJob growth is finally beginning to pick-up
Source: Conference Board, BLS, People’s Bank
Establishment Employment, Nonfarm
Transformation: Change Source: Bureau of Labor Statistics
-100
-200
-300
-400
0
100
200
300
400
500
600
97 98 99 00 01 02 03 04
monthly change (thousands) SA
PBCT
6
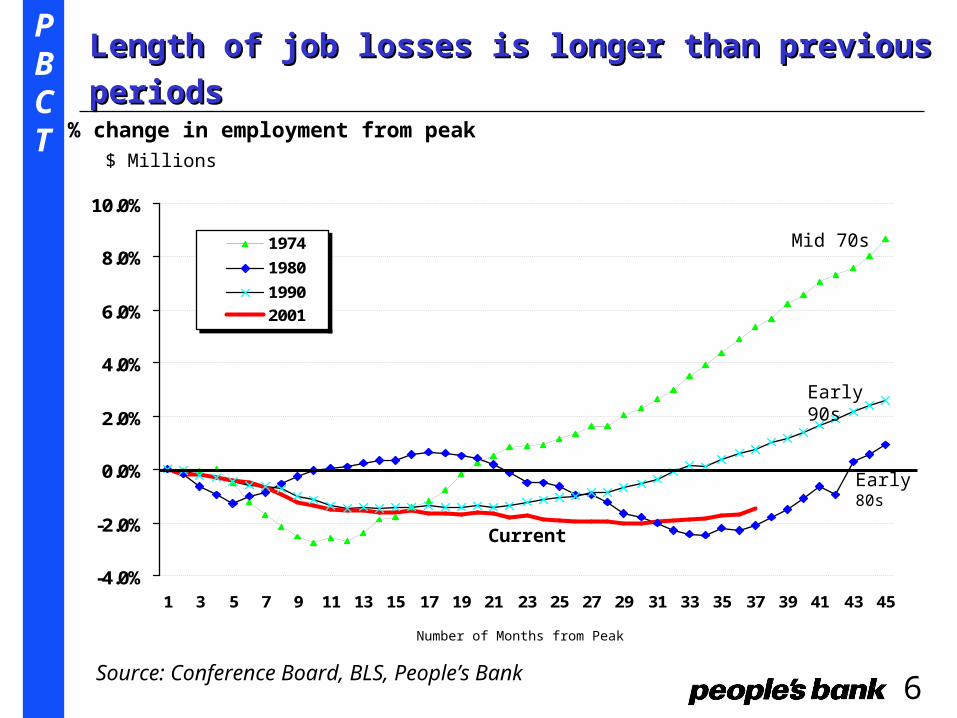
Length of job losses is longer than previous periodsLength of job losses is longer than previous periods
Source: Conference Board, BLS, People’s Bank
% change in employment from peak
-4.0%
-2.0%
0.0%
2.0%
4.0%
6.0%
8.0%
10.0%
1 3 5 7 9 11 13 15 17 19 21 23 25 27 29 31 33 35 37 39 41 43 45
1974
1980
1990
2001
$ Millions
Current
Early 90s
Early 80s
Mid 70s
Number of Months from Peak

PBCT
7
Major discrepancies between labor surveysMajor discrepancies between labor surveys
Source: The Conference Board, BLS, People’s Bank
Household vs. Establishment Survey Change (000's) since 11/01 (SA)
(1,500)
(1,000)
(500)
-
500
1,000
1,500
2,000
2,500
3,000
Household Survey
Establishment Survey
- 323,000
+ 2.1million

PBCT
8
Jobless Claims at the lowest level since Jan. 2001Jobless Claims at the lowest level since Jan. 2001
Source: Bloomberg, BLS, People’s Bank
US Weekly Initial Jobless Claims - 4 week MA
200.0
250.0
300.0
350.0
400.0
450.0
500.0
550.0Ja
n-89
Jul-8
9Ja
n-90
Jul-9
0Ja
n-91
Jul-9
1Ja
n-92
Jul-9
2Ja
n-93
Jul-9
3Ja
n-94
Jul-9
4Ja
n-95
Jul-9
5Ja
n-96
Jul-9
6Ja
n-97
Jul-9
7Ja
n-98
Jul-9
8Ja
n-99
Jul-9
9De
c-99
Jun-
00De
c-00
Jun-
01De
c-01
Jun-
02De
c-02
Jun-
03De
c-03
Below 400,000 for 5-months
Similar Pattern to early 1990s?

PBCT
9
The US creates - and destroys - more jobsThe US creates - and destroys - more jobs
Source: Tom Peters “Re-Imagine”
Total jobs lost & created – 1980 – 1998 – US vs. Europe (millions)
-44
73
29
04 4
-60
-40
-20
0
20
40
60
80
Job Losses Job Gains Net Gain
US Europe

PBCT
10
Outsourcing will continue Outsourcing will continue
Quotes:
“We will never again be as dominant as we are today. But we can remain in the top spot as long as we obsess on five things: Research-Innovation, Entrepreneurship, Education, Free Trade-Open Society, Self-Reliance”
[Tom Peters: Off-shoring" Manifesto/Rant: Twenty Hard Truths about Inevitabilities, Pitfalls, and Matchless Opportunities ]
“The Americans’ self-image that this tech thing was their private preserve is over. This is a wake-up call to U.S. workers to redouble their efforts at education and research. If they do that it will spur a whole new cycle of innovation, and we’ll both win. If we each pull down our shutters, we will both lose."
[Indian software exec to Tom Friedman/New York Times]
"The notion that God intended Americans to be permanently wealthier than the rest of the world, that gets less and less likely as time goes on."
[Robert Solow, Nobel Laureate in Economics]
PBCT
11
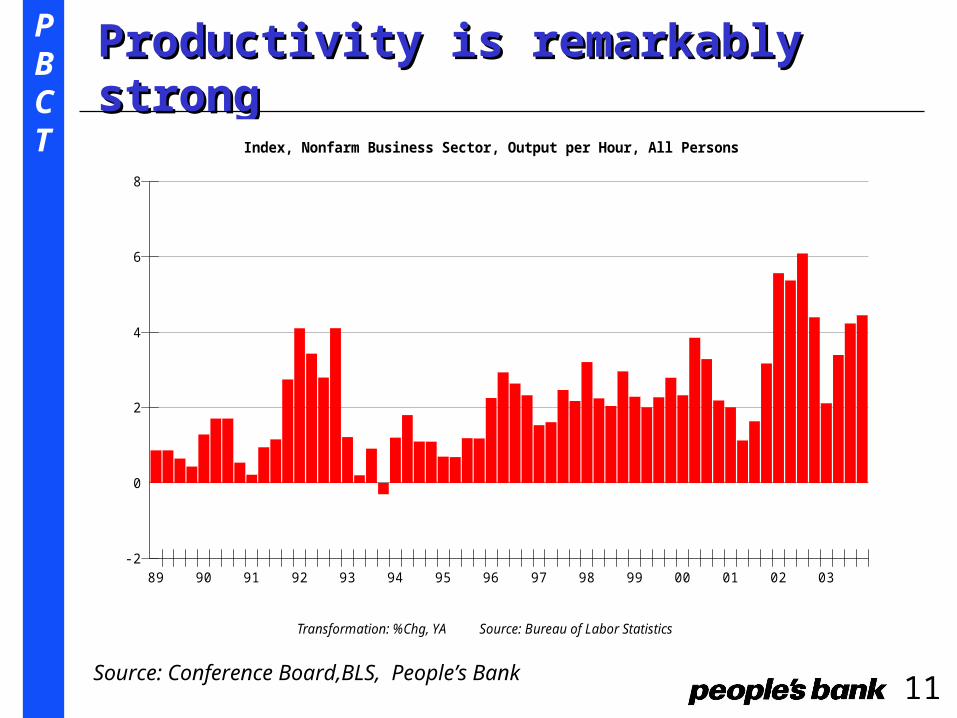
Productivity is remarkably strongProductivity is remarkably strong
Source: Conference Board,BLS, People’s Bank
Index, Nonfarm Business Sector, Output per Hour, All Persons
Transformation: %Chg, YA Source: Bureau of Labor Statistics
-2
0
2
4
6
8
89 90 91 92 93 94 95 96 97 98 99 00 01 02 03
PBCT
12
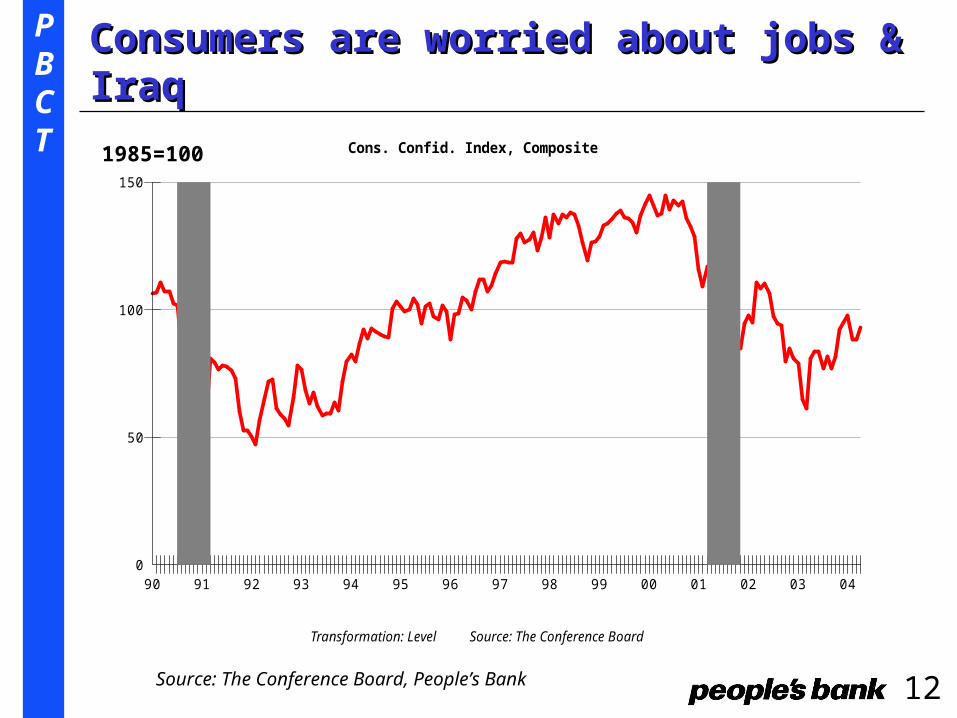
Consumers are worried about jobs & IraqConsumers are worried about jobs & Iraq
Source: The Conference Board, People’s Bank
Cons. Confid. Index, Composite
Transformation: Level Source: The Conference Board
0
50
100
150
90 91 92 93 94 95 96 97 98 99 00 01 02 03 04
1985=100

PBCT
13
Capital Spending has rebounded nicelyCapital Spending has rebounded nicely
Source: Conference Board,BEA, People’s Bank
Investment, Equipment and Software (CW$)
Transformation: %Chg, YA Source: Bureau of Economic Analysis
-5
-10
0
5
10
15
20
91 92 93 94 95 96 97 98 99 00 01 02 03 04
PBCT
14
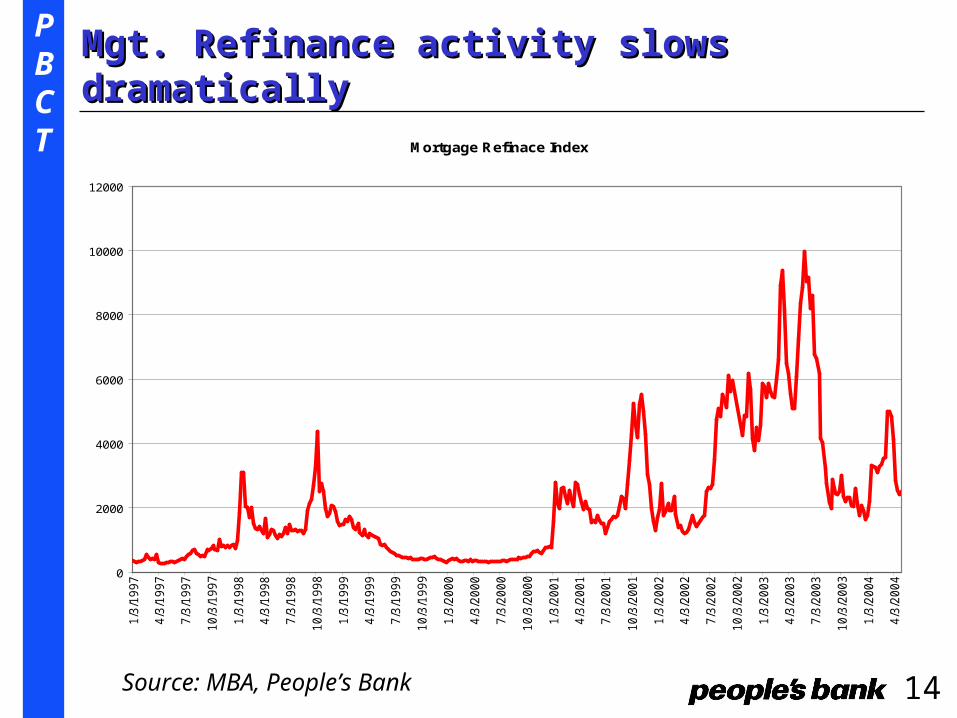
Mgt. Refinance activity slows dramaticallyMgt. Refinance activity slows dramatically
Source: MBA, People’s Bank
Mortgage Refinace Index
0
2000
4000
6000
8000
10000
12000
1/3
/19
97
4/3
/19
97
7/3
/19
97
10
/3/1
99
7
1/3
/19
98
4/3
/19
98
7/3
/19
98
10
/3/1
99
8
1/3
/19
99
4/3
/19
99
7/3
/19
99
10
/3/1
99
9
1/3
/20
00
4/3
/20
00
7/3
/20
00
10
/3/2
00
0
1/3
/20
01
4/3
/20
01
7/3
/20
01
10
/3/2
00
1
1/3
/20
02
4/3
/20
02
7/3
/20
02
10
/3/2
00
2
1/3
/20
03
4/3
/20
03
7/3
/20
03
10
/3/2
00
3
1/3
/20
04
4/3
/20
04

PBCT
15
Home sales are at record high levelsHome sales are at record high levels
Source: Conference Board, Bloomberg, People’s Bank
US New & Existing Home Sales - millions of units (SAAR)Housing Sales, New and Existing Homes
Transformation: Level Source: Bureau of the Census
3
4
5
6
7
8
89 90 91 92 93 94 95 96 97 98 99 00 01 02 03 04

PBCT
16
Housing affordability is still historically highHousing affordability is still historically high
Source: Conference Board, NAR, People’s Bank
Index, Housing Affordability
Transformation: Level Source: WEFA, NAR
100
110
120
130
140
150
90 91 92 93 94 95 96 97 98 99 00 01 02 03 04

PBCT
17
ISM index at a 20-year high - Strong orders ISM index at a 20-year high - Strong orders
Source: Conference Board, ISM, People’s Bank
Institute of Supply Management Survey (formally NAPM)Purchasing Managers' Index
Transformation: Level Source: NAPM
30
40
50
60
70
89 90 91 92 93 94 95 96 97 98 99 00 01 02 03 04

PBCT
18
Fed funds usually track nominal GDP growthFed funds usually track nominal GDP growth
Source: Conference Board, Bloomberg, People’s Bank
Targeted Fed Funds vs. Nominal GDP Growth (YOY%)
Nominal GDP Targeted Fed Funds
1
3
5
7
9
11
86 87 88 89 90 91 92 93 94 95 96 97 98 99 00 01 02 03

PBCT
19
Targeted fed funds rate less nominal GDP growthTargeted fed funds rate less nominal GDP growth
Source: Conference Board, Bloomberg, People’s Bank
Fed Funds less Nominal GDP
Transformation: Level Source: N/A
-1
-2
-3
-4
-5
0
1
2
3
4
86 87 88 89 90 91 92 93 94 95 96 97 98 99 00 01 02 03
The Gap has never been wider

PBCT
20
Core Inflation rate beginning to move higher?Core Inflation rate beginning to move higher?
Source: Conference Board, Bloomberg, People’s Bank
CPI vs. CPI less Food & Energy
CPI CPI less F&E
0
5
10
15
66 73 80 87 94 01
YOY% change “core” inflation rate the lowest since early 1960s, up just 1.1% YOY

PBCT
21
CT Economic OutlookCT Economic Outlook
• Connecticut’s Economy appears to be stabilizing, but a sustainable recovery is not yet evident in labor market.
• According to NEEP, state should add 8,200 jobs in 2004 and 22,000 in 2005. Unemployment rate will remain below national average.
• State’s economy is more diversified and performed much better than early 1990’s downturn. Manufacturing continues to be the hardest hit sector.
• Housing permits totaled 9,985 in 2003 -- the strongest since 1999. Not overbuilt like the late 1980s.
• CT vulnerable to national (and global) economy, stock market, energy prices, and deteriorating state fiscal condition.

PBCT
22
CT unemployment rate is well below the US rateCT unemployment rate is well below the US rate
Source: CT Labor Department
Unemployment Rate CT vs. US
Unemployment Rate CT Unemployment Rate US
2
4
6
8
10
89 90 91 92 93 94 95 96 97 98 99 00 01 02 03 04
% of labor force (SA)

PBCT
23
CT Job growth lags the US and is still neg. YOYCT Job growth lags the US and is still neg. YOY
Source: CT Labor Department, the Conference Board
% of labor force (SA)
CT vs. US Employment Growth YOY% change
CT Non-Farm Employment US Non Farm Employment
-1
-2
-3
-4
-5
0
1
2
3
4
5
6
83 84 85 86 87 88 89 90 91 92 93 94 95 96 97 98 99 00 01 02 03 04

PBCT
24
CT has lost 62,000 jobs since July 2000 peakCT has lost 62,000 jobs since July 2000 peak
Source: CT Labor Department, the Conference Board
% of labor force (SA)
CT Non-Farm Employment
Transformation: Level Source: CT Labor Dept., User
1500
1550
1600
1650
1700
88 89 90 91 92 93 94 95 96 97 98 99 00 01 02 03 04
[Thousands]

PBCT
25
CT construction employment levels-offCT construction employment levels-off
Source: CT Labor Department, the Conference Board
Connecticut, Employment, Construction
Transformation: Level Source: Bureau of Labor Statistics
40
50
60
70
80
90
88 89 90 91 92 93 94 95 96 97 98 99 00 01 02
[Thousands]

PBCT
26
CT Manufacturing has been the hardest hit sectorCT Manufacturing has been the hardest hit sector
Source: CT Labor Department, the Conference Board
Connecticut, Employment, Manufacturing
Transformation: Level Source: Bureau of Labor Statistics
150
181
212
243
274
305
90 91 92 93 94 95 96 97 98 99 00 01 02 03 04
[Thousands]

PBCT
27
CT Manufacturing still shedding 8,000 jobs a yearCT Manufacturing still shedding 8,000 jobs a year
Source: CT Labor Department, the Conference Board
Connecticut, Employment, Manufacturing
Transformation: Chg, YA Source: Bureau of Labor Statistics
-5
-10
-15
-20
0
5
10
91 92 93 94 95 96 97 98 99 00 01 02 03 04
[Change - Thousands]

PBCT
28
CT Service sector is where job growth has beenCT Service sector is where job growth has been
Source: CT Labor Department, the Conference Board
Connecticut, Employment, Services
Transformation: Level Source: Bureau of Labor Statistics
400.00
450.00
500.00
550.00
89 90 91 92 93 94 95 96 97 98 99 00 01 02
[Thousands]

PBCT
29
CT Claims are moving in the right directionCT Claims are moving in the right direction
Source: CT Labor Department
CT Average Weekly Initial Unemployment Claims
Transformation: Level Source: Ct Dept. of Labor, U, User
3000.00
4000.00
5000.00
6000.00
7000.00
8000.00
9000.00
90 91 92 93 94 95 96 97 98 99 00 01 02 03 04

PBCT
30
Unemployment rates up sharply from 2000 Unemployment rates up sharply from 2000
CT Unemployment Rates % by Labor Market Area (NSA)
3.3
3.5
3.7
4.7
4.9
5.0
5.6
5.7
6.1
6.8
1.1
1.3
1.3
1.9
1.5
2.0
2.0
2.3
2.3
2.3
0.0 1.0 2.0 3.0 4.0 5.0 6.0 7.0 8.0
Stamford
Danbury
Lower River
New London
Torrington
New Haven
Hartford
Danielson
Bridgeport
Waterbury
8/31/2000
3/31/2004
Source: CT Labor Dept.

PBCT
31
CT Job losses across the board YOYCT Job losses across the board YOY
-3,000
-2,700
-1,600
-1,300
-1,200
-1,000
-900
-900
-700
-700
-600
-500
-400
-400
-300
-200
-200
-200-200
-3,500 -3,000 -2,500 -2,000 -1,500 -1,000 -500 0
Professional & Business Services
State Gov.
Machinery
Computer & Electronic Product
Transportation Equipment
Other Non-Durable Goods
Fabricated Metal
Information
Chemicals
Federal Gov.
Printing & Related
Food & Beverage Stores
Insurance
Local Gov.
Utilities
Electrical Equipment
Wholesale Trade
General Merchandise
Utilities
Change in CT Non-Farm Employment March 2004 vs. March 2003 ( Not SA)
Source: CT Labor Department

PBCT
32
Fewer industries adding jobs in CT YOYFewer industries adding jobs in CT YOY
200
200
300
400
400
400
400
500
1,000
1,000
1,900
2,600
0 500 1,000 1,500 2,000 2,500 3,000 3,500
Motor Vehicle & Parts Dealers
Other Retail
Securities & Commodity
Transportation & Warehousing
Credit Intermediation
Real Estate & Rental & Leasing
Other Services
Educational Services
Construction & Mining
Arts, Ent. & Recreation
Health Care & Social Assistance
Accommodation & Food Services
Change in CT Non-Farm Employment March 2004 vs. March 2003 ( Not SA)
Source: CT Labor Department

PBCT
33
Housing permits very strong so far in 2004Housing permits very strong so far in 2004
Source: CT DECD
% Change in CT New Housing Permits Authorized YTD January - March 2004 vs. 2002 by LMA
-25.0%
0.0%
7.8%
12.5%
18.0%
21.4%
45.1%
70.5%
128.2%
29.3%
29.7%
-50.0% 0.0% 50.0% 100.0% 150.0%
Lower River
New Haven
Stamford
Torrington
Hartford
Danielson
New London
Waterbury
Danbury
Bridgeport
Connecticut
Permits totaled 9,985 last year, the strongest since 1999 and the 3rd strongest since 1989. Total 2,176 YTD in 2004 vs. 1,683 in 2003.

PBCT
34
Housing is not overbuild like the mid-1980sHousing is not overbuild like the mid-1980s
Source:CT DECD, New England Economic Project
Total housing permits authorized in CT in units
16,9
27 19,3
92
26,2
46
30,1
63
27,4
15
19,5
47
11,9
70
7,58
0
7,48
0
8,01
0
9,25
0
9,46
0
8,55
0
8,53
7
9,31
1 11,8
63
10,6
37
9,37
6
9,29
0
9,73
1
9,98
5
8,65
8
8,62
0
8,77
0
8,66
2
0.0
5,000.0
10,000.0
15,000.0
20,000.0
25,000.0
30,000.0
35,000.0
2004-2007 is forecast

PBCT
35
Auto registrations down 4.4% YTDAuto registrations down 4.4% YTD
Source: CT Labor Department
Connecticut New Auto Registrations Processed YTD - (January - March)
0
10,000
20,000
30,000
40,000
50,000
60,000
70,000
80,0001
98
0
19
82
19
84
19
86
19
88
19
90
19
92
19
94
19
96
19
98
20
00
20
02
20
04

PBCT
36
Tax revenues up 6.9% this yearTax revenues up 6.9% this year
Source: State of CT Dept. of Revenue Services
Year-to-Date % change in CT Tax Revenues ( FY 03-04 vs. FY 02-03 July - March)
-13.9%
2.6%
5.5%
6.9%
4.7%
15.1%
22.2%
-40.0% -30.0% -20.0% -10.0% 0.0% 10.0% 20.0% 30.0%
Corp. Business
Sales & Use
Real Estate Conv.
Motor Fuel
Income
Cigarette
Total Up $419 million

PBCT
37
SummarySummary• Economic growth continues to improve in 2004 due to: low rates - fiscal stimulus -
productivity - corporate profits - capital spending - weaker dollar
• Fed’s “Patience” is coming to and end – tightening of monetary policy should begin by August 2004.
• Connecticut economic growth has lagged the US - meaningful job growth not likely until 2005 - Higher taxes, higher costs, impeachment hearings are not helping recovery
• Watch: Jobless Claims - employment - purchasing managers’ index - oil prices - home prices - consumer confidence
• Risks: Companies don’t hire - Iraq & Middle East - nasty election year - more terrorist attacks - higher oil prices - stock correction - deficits

PBCT
38
For more information...For more information...
Please visit our web site at www.peoples.com