paying new york state hospitals more fairly for their care to uninsured patients
TRANSCRIPT

Paying New York State Hospitals More Fairly for Their Care to Uninsured Patients
A Report to the Commission on the Public’s Health System (CPHS)
Alan Sager, Ph.D. Professor of Health Policy and Management
Director, Health Reform Program
Boston University School of Public Health
31 August 2011 This work is financed by a grant from the Robert Sterling Clark Foundation and by a donor-advised North Star Fund grant to CPHS.

i
INTRODUCTION BY JUDY WESSLER August 5, 2011 The Commission on the Public’s Health System (CPHS) is a city-wide, community-based, membership health advocacy organization located in New York City, whose mission is to “fight for equal access to quality health care services for everyone regardless of race, ethnicity, language spoken, diagnosis, or ability to pay.” For the last fifteen years, CPHS has monitored the allocation of public dollars to health care institutions with an eye toward ensuring that those dollars are spent in the most equitable and transparent way. The State of New York has an unusual political history, in which political and monetary influences are used to tilt policy towards the protection of academic medical centers, often to the detriment of community hospitals and the communities that they serve. New York, like Massachusetts and New Jersey, deregulated its rate setting while maintaining funding of “public goods.” One of those defined goods is paying hospitals for the care of uninsured and underinsured patients. Over a period of years, CPHS documented the allocation of public dollars from the State’s $847 million Hospital Indigent Care Pool intended to compensate hospitals for the indigent care they provided. As a result of this effort, CPHS published two reports that showed little or no relationship between the actual dollars received by the hospitals from the hospital Charity Care Pool and the amount of health care services they provided to the uninsured. It is interesting to note that there is a separate community health center pool to pay for the care of the uninsured. This pool of dollars is much smaller than the hospital pool and is funding allocated to health centers based on their reporting care that they provide to the uninsured. Massachusetts and New Jersey required hospitals to document care provided to uninsured patients in order to access their state’s charity care pool. In those states, the money follows the patient. This has not been the case in New York, where—despite efforts by advocates to change the allocation of charity care dollars—money continues to be allocated on the basis of an antiquated accounting methodology and also compensates hospitals for bad debt as well as charity care. Despite recent efforts to change the allocation of these dollars, political provider resistance has maintained the system almost untouched. There has, however, been movement over the last several years to ensure that the uninsured receive health services regardless of their ability to pay. The first change was passage of the Hospital Financial Assistance Law (Subdivision 9-a of Section 2807-k of the New York State Public Health Law) -- also called Manny’s Law, which for the first time required all hospitals to develop a charity care sliding fee policy for New York residents with incomes at or below 300% of the Federal Poverty Level, post these policies, and notify patients of their right to a sliding fee scale for payments based on income and family size. The second important change is the requirement that 10% of the total $847 million in the hospital Charity Care pool be distributed on the strength of the hospital showing they had cared for numbers of uninsured patients. The benefit of this very small movement, is that in order to receive a share of the 10%, hospitals have to report all of the care they

ii
delivered to people with no health insurance. This reporting has enabled a more in-depth look at what hospitals are doing to provide care and to match that care to the dollars being distributed to these institutions, thus making this report possible. With passage of the Affordable Care Act in 2010 has come concern about continued funding to provide services for the uninsured, since a portion of these federal dollars are targeted to pay for expansion of health insurance coverage – an important goal. For the population that will not be eligible, or able to take advantage of eligibility for this expanded coverage, it becomes even more important to propose ways for continuing access to care and payment for that care. The Report With support from the Robert Sterling Clark Foundation and a donor-advised grant from the North Star Fund, CPHS contracted with Dr. Alan Sager, Professor of Health Policy and Management and Director of the Health Reform Program at the Boston University School of Public Health. Dr. Sager was asked to review the efficacy of the current system and propose alternative allocation methods. CPHS set up an advisory committee which participated in reviewing the concepts that were being developed. CPHS also committed to develop messaging about and organizing for the alternative methods developed. This report describes the current system of charity care allocation in New York State, which includes reimbursement for “claimed” bad debt costs. Anyone with a casual understanding of the geography of hospitals throughout the state will recognize that there is little rhyme or reason to the current system of charity care reimbursement. Hospitals in overlapping or contiguous neighborhoods with near-identical patient populations nevertheless receive wildly divergent payments. Comparing public and some voluntary hospitals, along with community-based health centers, that traditionally make up the healthcare safety-net to larger academic medical centers which see a smaller share of Medicaid and uninsured patients reinforces the notion that the current system does not reflect the stated intent of charity care. A review of data shows that some hospitals may be overpaid and others underpaid. Dr. Sager has proposed a new system to more fairly compensate hospitals for the care of the uninsured patients. The very complex current system is made less complicated and is based on funding following the uninsured patients. Data is now available from all hospitals showing the amounts and types of care (e.g., inpatient, outpatient, emergency) provided for people with no insurance, or whose insurance does not cover the service being provided. The system developed also recognizes the extra effort of some hospitals in providing a larger share of care for these patients.

iii
The Proposal Dr. Sager constructs new methods of allocating uncompensated care funds: CARE; BASE and BASE STEEP. The first measure is named CARE and reflects the money follows the patient principle. CARE rests on the provision of actual volumes of care as measured through four areas of services (acute inpatient discharges, ER visits, general clinic visits, and ambulatory surgery). This volume of care is then multiplied based on a weighted mean statewide Medicaid rate. CARE does not, however, recognize regional differences in costs or the acuity (complexity) of the care provided. So the next measure, BASE differs from CARE because it attempts to recognize inter-hospital variation by adjusting for severity of patient mix and institution-specific costs. To recognize the efforts of hospitals that provide larger shares of care for the uninsured, Dr. Sager developed BASE STEEP which involves progressively increasing funding based on increased care provided for the uninsured. Finally in recognition of federal changes likely to occur in the availability of federal Disproportionate Share Hospital (DSH) dollars, Dr. Sager looked at ways of structuring the pools so that the 21 major public hospitals in the state (of a total of 200 hospitals) would be positioned to gain a larger share of the State’s charity care dollars than they currently receive. The public hospitals share is currently capped at $139 million of the $847 million distributed annually across the state. The capping of these dollars does not consider any increases, or decreases, in the level of care provided to uninsured patients. Public hospitals in the past have had access to other public dollars, but this too is subject to change. Although representing a small number of the hospitals statewide, in 2008, the 21 major public hospitals provided 25.3% of uninsured discharges, 31.4% of ER visits, 55.5% of regular clinic visits, and 43.7% of ambulatory surgery procedures. Of particular note, the large numbers and percent of clinic visits for the uninsured is one way of preventing unnecessary hospitalizations. If these changes are made and the public hospitals receive a greater share of the statewide pool, Dr. Sager recommends the use of the BASE method as the one that most fairly compensates both public and private hospitals for the volume of uncompensated care they provide. Conclusion The report's recommended changes are necessary on an ethical and financial basis, but could be disruptive if not done thoughtfully. Public funds should be used for their intended purpose—in this instance, paying for the care of uninsured people. Had the changes proposed over the years by CPHS and others been implemented earlier, the reallocation of dollars recommended in this report would not have as large an impact. CPHS has made other payment reform proposals for safety-net providers that are outside the purview of this report. Special attention should be paid to Medicaid payment reform that ensures the continued viability of safety net health care providers in low-income, medically underserved communities. CPHS would like to thank Dr. Alan Sager for his hard work and his willingness to go back to the drawing board to help us arrive methods which ensure that the money follows the patients who actually receive care. We also thank the members of our

iv
Advisory Group for their important contributions to the understanding of the current situation and their astute proposals for change. Given the compelling evidence offered in this report, CPHS believes that a realignment of the charity care funds is in the best interest of the people of New York State. CPHS provides this report with the intent of making a clear cut argument for the need for change in New York State’s Charity Care pools and an important contribution to the ways that the allocations can be made more fair and equitable so that uninsured patients can benefit from these changes. We hope that you will join us! Judy Wessler Director Commission on the Public’s Health System (CPHS) 45 Clinton Street New York, New York 10002 212-246-0803 www.cphsnyc.org

v
SUMMARY OF FINDINGS Since 1983, New York State has made special payments to hospitals providing uncompensated care. But the state’s methods of doing so have been criticized as unfair and unaccountable for their failure to focus on services to uninsured lower-income patients, and for failure to compensate hospitals in reasonable proportion to the volumes of care they provide or the added costs they incur. A number of hospitals are paid large sums even though they appear to provide relatively little uncompensated care. The current methods of allocating scarce uncompensated care funds do not reward hospitals in fair relation to their efforts. Therefore, these methods don’t encourage hospitals to sustain or increase care for uninsured lower-income patients. In some cases, they appear to reflect hospitals’ political power more than hospitals’ efforts on behalf of patients in need. This report puts forth alternative methods of distributing uncompensated care funds to hospitals and assesses their fairness. It seeks to realize two main principles held by the Commission on the Public’s Health System (CPHS). The first is that uncompensated care payments to hospitals should follow the uninsured patient. This means that more money should go to hospitals providing greater volumes of uncompensated care to uninsured lower-income patients, and less money should go to hospitals providing smaller volumes. The second policy is that hospitals devoting greater shares of their caregiving to uncompensated services to uninsured lower-income patients should be paid by more generous standards. This means use of a progressive sliding scale of some sort. At the same time, uncompensated care payments should fairly and reasonably recognize two main variations in hospitals’ own costs of providing uncompensated care. One is the different input costs (for workers or electricity, for example) faced by hospitals in different parts of the state. The other is the severity of patient need, measured by a case mix index. The report relies heavily on data and formulas provided in spreadsheet form by the New York State Department of Health. Without this material, the report could not have been written. The author is grateful to the Department. By law, the state’s $847 million Hospital Indigent Care Pool carves out only $139.3 million (one-sixth of the total) for the state’s 21 major public hospitals even though they provide between 25 percent and 56 percent of the uncompensated care services statewide.1 The 21 major public hospitals receive added payments to help cover the costs of their uncompensated care; these payments originate outside the formal boundary of the Hospital Indigent Care Pool. These payments are comprised of Medicaid disproportionate share (DSH) funds, matched mainly funds from some of the state's cities or counties. With budget problems at the local level, there is no guarantee that these local funds will continue to be available to match the federal DSH dollars. The report focuses first on the remaining $707.7 million portion of the $847 million Hospital Indigent Care Pool that goes to the state’s remaining 179 hospitals. Here,

vi
dollars are reallocated only among the non-major-publics. This is done partly because many parties believe that movement of pool dollars must respect the long-standing public hospital carve-out. A second analysis in this report ignores the long-standing carve-out. It does consider allocations of the full $847 million across all 200 New York State hospitals together. This is done to illustrate how various methods, consistently applied, would affect each hospital. It also is done contingently, to help prepare for the possible reduction in dollars that now finance the bulk of the separate uncompensated care payments to the major public hospitals, and the resulting need to apportion all remaining dollars as fairly as possible. The 2010 federal Affordable Care Act reduces federal Medicaid DSH dollars that now pay for care of uninsured people. However, the law allows the secretary of the federal Department of Health and Human Services to determine reductions to states based on the number of remaining uninsured residents in the population.2 Under ACA, the secretary of HHS will make a determination about the allocation of the remaining DSH dollars based on states’ number of residents remaining uninsured, and on the allocation of DSH/charity care dollars to hospitals providing care to uninsured or Medicaid patients. If New York State does not change its current method of distributing DSH funds, it stands to lose hundreds of millions of dollars. Even if the 2010 federal health reform law is successfully implemented, the residual need for uncompensated care for people who remain uninsured will still be considerable, and it is very reasonable to expect that a great share of that care will continue to be provided by major public hospitals. In 2008, they provided 25.3 percent of uninsured discharges, 31.4% of ER visits, 55.5 percent of regular clinic visits, and 43.7 percent of ambulatory surgery procedures. The large share of regular clinic visits may be particularly salient, since these can be vital to preventing unnecessary hospital admissions, and because many of these visits are for follow-up specialty care, which can be in short supply to many uninsured patients. Major public hospitals’ provision of uncompensated care far exceeded their share of statewide hospital costs, 18.8 percent, or their share of the uncompensated care pool, 16.5 percent. Further, for clarity, as the report describes and tests the fairness of various methods of allocating either the $707.7 million among the 179 non-major-publics or the entire $847 million among all 200 hospitals, it consistently treats either sum as if it could be distributed by a single method. Thus, the report does not consider the boundaries of the various sub-pools of money that exist today, such as the voluntary hospital high-need reserve pool and two smaller rural hospital pools. In doing so, the report follows CPHS’s two principles. But the report is mindful of the importance of identifying and preserving all hospitals and emergency rooms needed to protect the health of the public—particularly hospitals located in or serving disproportionate numbers of people who are medically underserved, low-income, immigrants, or people of color.

vii
After all, New York State lost 19 percent of its acute care hospitals from 1995 to 2010. Following CPHS’s policies, the report does not assert that the aim of distributing uncompensated care money is to protect hospitals; rather, it is to pay hospitals fairly for the uncompensated care they provide to uninsured lower-income patients. The report describes the main issues in distributing uncompensated care funds, the methods of doing so, options for reform, and the effects of reformed methods on hospitals—both individually and grouped by region or teaching status. This means comparing the distribution of the funds by various methods currently employed, and new methods as well. The report concludes that a method of distributing uncompensated care funds among hospitals under which the money follows that patient according to a sliding scale of effort and that is fair to hospitals can be constructed. Any such method will depend on three factors: actual volumes of care provided, the price to be paid for each unit of care, and the method and extent of rewarding hospitals for providing greater shares of their services to uninsured lower-income patients. We build two main new methods of allocating uncompensated care funds. One is called CARE. It was created mainly as a standard to show what it would mean for individual hospitals for the money to starkly follow the patient. CARE rests on actual volumes of care provided in four main areas—acute inpatient discharges, ER visits, regular clinic visits, and ambulatory surgery procedures. (These four services comprised 90 percent of hospitals’ cost of uncompensated care, measured by 2008 volumes at 2010 Medicaid prices.) The CARE formula measures hospitals’ provision of uncompensated care across the four areas by multiplying the volume of care in each of each of the four types by the weighted mean statewide Medicaid rate for each type. The sum of the products measures care provided across the four types, regardless of an individual hospital’s cost structure or its own Medicaid prices. Were hospital uncompensated care allocated only by CARE, the money would truly follow the patient. The other measure is called BASE. BASE resembles CARE in that it starts with each hospital’s own volumes of care in the four services. But it multiplies each of the three outpatient volumes by the hospital’s own Medicaid price prevailing late in 2010. And it multiplies each hospital’s acute care discharges by a hospital-specific price that we cal-culate from elements of the state’s own Medicaid rate-setting process. For acute in-patient discharges, BASE starts with one updated statewide base price for all hospitals. It multiplies this by a hospital-specific measure of input prices, and then by the hospital’s own case mix index for Medicaid acute care patients. BASE differs from CARE by recognizing inter-hospital variations in input costs and severity of patient illness. We tested the effects of adding several sliding scales to CARE and BASE. One was the statutory method used by the New York State Department of Health (NYS DOH) today to calculate the Nominal Payment Amount (NPA) for each hospital. That NPA is a factor in the distribution of most uncompensated care funds under the current 90% model. We also constructed and tested the effects on both CARE and BASE of two successively steeper sliding scales than the NPA used today. Neither NPA nor its two

viii
steeper cousins had much effect on the allocations of uncompensated care funds among hospitals. This is because all three make incremental increases in payments for each successive marginal increase in a hospital’s uncompensated care effort. Abandoning this marginal approach for most purposes, we constructed an approach that reflects simply each hospital’s costs of uncompensated care, extrapolated from BASE, as a share of total costs of CARE. We applied this measure, called STEEP, to BASE. This measure, BASE STEEP, rests on actual volumes of care. It recognizes inter-hospital variation in input costs and in severity of patient illness. It modulates payments in proportion to hospitals’ uncompensated care efforts as a share of total cost. It boosts payments to hospitals that exert themselves more strenuously to serve uninsured patients, and it reduces payments to hospitals that exert themselves less strenuously. We assessed the effects of Actual allocations, CARE, BASE, and BASE STEEP on hospitals by region and by teaching status—and also on the 179 individual hospitals. After doing so, we recommend that this measure, BASE STEEP, be used to allocate uncompensated care funds among the 179 New York State hospitals (respecting the long-standing carve-out of payments to the state’s 21 major public hospitals). We show the effects that payment by this method would have had on individual hospitals in 2010, using the volumes of care reported by hospitals. Finally, we considered allocations of uncompensated care funds among all 200 New York State hospitals. We did so in order to move toward a clear, simple, and consistent method of compensating all hospitals for providing uncompensated care to uninsured lower-income people, and also to begin to prepare for the expected substantial reduction in Medicaid disproportionate care funds that now finance special payments to the 21 major public hospitals through channels outside the $847 million uncompensated care pool. Were that reduction to materialize, pressure to divide the $847 million fairly among all 200 hospitals would be substantial. We recommend that BASE be used to allocate funds among all 200 hospitals statewide. BASE STEEP works well for the 179 non-major public hospitals alone, but it appears to over-adjust and probably over-pay many or even most of the 21 major public hospitals when employed for all 200 hospitals. BASE appears to allocate reasonably across all 200 hospitals. One of the mild sliding scales could be added to BASE.3 Caution: This report’s analyses have addressed allocations of the $847 million Hospital Indigent Care Pool. They have not addressed other special payments to public or other hospitals associated with provision of uncompensated care. BASE is appropriate if only the $847 million is considered; if other sources of funds are considered, BASE STEEP or a blend of BASE and BASE STEEP might well be appropriate. BASE seems to be a reasonable way to place New York State’s 21 major public hospitals on a fair financial footing with the other 179 hospitals. This conclusion would need to be checked against all-source financing of uncompensated care currently, and also against post-2014 volumes of care provided by individual hospitals.

ix
ACKNOWLEDGEMENTS This report has been inspired by Judy Wessler, Director of CPHS, and has been prepared at her request. Judy’s insights and energy are manifested throughout. The report could not have been prepared without data and analyses generously provided by the New York State Department of Health. CPHS established an advisory committee to offer reactions and suggestions to drafts of the report. We are grateful for their many constructive comments.
Nisha Agarwal, New York Lawyers for the Public Interest LaRay Brown, Health and Hospitals Corporation Linda DeHart, Health and Hospitals Corporation Moira Dolan, District Council 37 Tim Foley, Committee of Interns and Residents Jack O’Connell, Nassau University Medical Center Carol Santangelo in place of Lisa Sbrana, Legal Aid Society Denise Soffel, consultant, formerly Executive Director, New York Senate Health Committee Jennifer Torres in place of Jenny Rejeske, New York Immigration Coalition Justin Wood, Committee of Interns and Residents Marlene Zurack, Health and Hospitals Corporation
Additionally, thanks to Sharon Salit and Barry Skura, who provided important data. Any errors or omissions are the author’s responsibility.

x
DEFINITIONS and CLASSIFICATION METHODS 1. Types and numbers of hospitals a. 200 hospitals. We have worked extensively with spreadsheets provided by the New York State Department of Health (NYS DOH), spreadsheets that the DOH used to calculate 2010 allocations of the $847 million uncompensated care pool in accord with state law. Those spreadsheets list 200 hospitals. To make data merges unambiguous, we have standardized our work to consistently include those 200 hospitals. In doing so, we recognize that at least two (St. Vincent’s and North General) have now closed, that others have merged with other institutions, and that still others do not now provide any of the four main types of uncompensated care examined here. It does not seem that retaining the 200-hospital list has resulted in meaningful errors or distortions. Appendix Exhibit 4 lists all 200 hospitals alphabetically, providing each hospital’s operating certificate number to enable cross-referencing. The list also indicates whether the hospital is a major public hospital, the number of the region in which it’s located, and whether it is a non-teaching, teaching, or major COTH teaching hospital. b. Major public hospital. These are 21 hospitals designated by New York State. They receive a carved-out $139.3 million of the uncompensated care pool. The following text exhibit displays major public hospitals and other hospitals by region.
Region
Major public?
1 2 3 4 5 6 7 8 N.Y. State
Non-major public
20 39 33 17 22 14 12 22 179
Major public 2 14 2 0 0 1 0 2 21
All 22 53 35 17 22 15 12 24 200
These are New York State’s 21 major public hospitals, sorted by region. As noted in the preceding text table fully 14 of the 21 are located in region 2, New York City. Operating Cert. No. Hospital Name Region 2950002 Nassau Medical Center 1 5151001 University Hospital At Stony Brook 1 7000002 Jacobi Medical Center 2 7000008 Lincoln Medical & Mental Health Center 2 7000024 North Central Bronx Hospital 2 7001009 Coney Island Hospital 2

xi
7001016 Kings County Hospital Center 2 7001037 State University Hospital Downstate Medical Center 2 7001045 Woodhull Medical And Mental Health Center 2 7002001 Bellevue Hospital Center 2 7002009 Harlem Hospital Center 2 7002021 Metropolitan Hospital Center 2 7002050 Goldwater Memorial Hospital 2 7002051 Coler Memorial Hospital 2 7003000 City Hospital Center At Elmhurst 2 7003007 Queens Hospital Center 2 4322000 Helen Hayes Hospital 3 5957001 Westchester Medical Center 3 3301007 SUNY Health Science Center At Syracuse 6 1401005 Erie County Medical Center 8 1401010 Roswell Park Memorial Institute 8
c. Teaching status. Hospitals are also classified by teaching status. New York State classifies hospitals as teaching hospitals or non-teaching hospitals. We further divided the teaching hospitals between major COTH teaching hospitals and other teaching hospitals. The major COTH hospitals are the members of the Council of Teaching Hospitals of the American Association of Medical Colleges.
Region Non-teaching TeachingMajor (COTH)
Teaching Totals
1 4 14 4 22
2 8 18 27 53
3 29 4 2 35
4 13 3 1 17
5 18 3 1 22
6 9 4 2 15
7 8 3 1 12
8 17 7 0 24
N.Y. State 106 56 38 200
Note: Unfortunately, one hospital actually located in region 1 was listed in most data as located in region 2. This error was not identified until near the end of data analyses for this report. It has not been possible to re-do tables and analyses. The resulting problems and distortions are believed to be very minor.

xii
d. Regions. Hospitals are divided geographically. A number of years ago, NYPHRM—New York State’s program to regulate hospital payments—divided the state into eight regions. NYPHRM is largely defunct, but the eight regions persist. This map shows the locations of the regions and the counties included in each. New York State’s Eight NYPHRM Regions 1 Long Island 2 New York City 3 Northern Metro. 4 Northeast
5 Utica/Watertown 6 Central 7 Rochester 8 Western

xiii
Listing of New York State Counties by NYPHRM Region
1 2 3 4
Long Island New York Northern
Metropolitan Northeast
Nassau Bronx Columbia Albany
Suffolk Kings Delaware Clinton
New York Dutchess Essex
Queens Orange Fulton
Richmond Putnam Greene
Rockland Montgomery
Sullivan Rensselaer
Ulster Saratoga
Westchester Schenectady
Schoharie
Warren
Washington
5 6 7 8
Utica/Watertown Central Rochester Western
Franklin Broome Livingston Allegany
Chenago Cayuga Monroe Cattaraugus
Hamilton Chemung Ontario Chautauqua
Herkimer Cortland Seneca Erie
Jefferson Onondaga Wayne Genesee
Lewis Schuyler Yates Niagara
Madison Steuben Orleans
Oneida Tioga Wyoming
Oswego Tompkins
Otsego
St Lawrence
2. Uncompensated care a. Uncompensated care. Uncompensated care is a broad all-embracing term. It can refer to bad debt and charity care together. It can include care given to low-income uninsured people, and it can also include unpaid out-of-pocket costs associated with care provided to both lower-income and higher-income insured people. New York State’s $847-million pool to compensate hospitals is officially called an “indigent care pool” but is usually referred to as an uncompensated care pool—and sometimes as one

xiv
with seven sub-pools. The broad language reflects the general lack of either legal or practical boundaries among the various elements included as uncompensated care. In 2007, “Manny’s Law” sought to bring greater precision to New York hospitals’ classification of uncompensated care. It also obligated hospitals to create sliding fee schedules for patients, depending on their income and family size, and to notify patients about when they were eligible for discounted fees. It is not likely that implementation has matched intent. When New York State created its new 10 percent formula, one of the two factors in the new formula was volumes of specific services provided by hospitals to uninsured patients. The state considered a patient uninsured if they lacked insurance entirely or if their insurance did not pay for a service they received. Hospitals therefore had to report these volumes. New York State counts care provided by hospitals to patients in two categories, “uninsured/self pay” and “free (charity, Hill Burton)” patients. The great majority of patients are placed on a sliding fee scale consistent with the hospital’s charity care policy. These numbers are reported by each hospital in its annual Institutional Cost Report (ICR). Exhibit 32 reports acute care discharges and Exhibit 33 reports emergency room visits, regular clinic visits, and ambulatory surgery procedures. The ICR does not categorize these patients by income and family size. These volumes of care reported by hospitals are multiplied by Medicaid rates. Those products are summed. Any income from these patients is subtracted from that sum. The result largely determines the inter-hospital allocation of funds under the new 10 percent formula. For these reasons, the volumes of care reported by hospitals and counted by New York State that are employed to calculate three alternative methods of allocating uncompensated care funds in this report include more than low-income uninsured patients. Self-pay patients could include some middle- and upper-income uninsured patients. In this report, we follow the state’s practice of subtracting income garnered by hospitals when they care for these patients from the sums to which hospitals would otherwise be entitled. The boundary between free care and bad debt is not a sharp one. The ICR’s Exhibit 50 details numbers of total patients hospital-wide who are approved to pay by a sliding fee scale because of lower income. But it does not break down the types of services that lower income patients use. Once accurate counts of volumes of care provided to low-income uninsured people, service-by-service, are available, the same three methods used in this report can be employed to re-calculate allocations that respect those new measures of care provided to low-income uninsured patients. BDCC is the abbreviation for a combination of bad debt and charity care. Bad debt is a charge for care that has been written off by the hospital as uncollectable. It differs from charity care in that the charge in question was originally thought to have been collectable—usually because that care was given to a person thought to be insured

xv
or otherwise thought to have been able to pay. Typically, the hospital intended or sought to collect the money before the charge was written off as a bad debt. Charity care is care for which the patient was determined to be unable to pay and therefore eligible for charity care, according to state law or a hospital’s policy, either before or after the care was given, and either fully or partly on a sliding scale. Typically, the hospital would not attempt to collect money from a patient deemed eligible for charity care. Manny’s Law requires that children and pregnant women with incomes under 100 percent of the poverty level must be provided free care.
3. Alternative methods of paying hospitals for uncompensated care that are used in New York State or are analyzed in this report.
a. 90% method. This is the method—actually a set of methods—that currently governs allocation of 90 percent of the $847 million uncompensated care pool, or $762.3 annually. This set of methods was strongly criticized by the 2008 NYS DOH Report on the Hospital Indigent Care Pool, but it remains largely in effect.
b. 10% method. Introduced in 2009, this method currently governs allocation of 10 percent of the $847 million uncompensated care pool, or $84.7 million annually. This 10 percent method prescribes an allocation very similar to that of the main reform method proposed by the 2008 NYS DOH Report. Essentially, it entails valuing uncompensated care at actual units of care reported by the hospital, multiplied by the appropriate Medicaid rate paid to that hospital.
The 90% method and the 10% method sum to actual allocations in 2010. These are sometimes presented together as one sum per hospital.
c. CARE. Allocation as if CARE had governed distribution of the entire uncompensated care pool. The CARE method reflects the simplest money-follows-patient principle. That’s because it multiplies each hospital’s actual provision of each of the four main types of uncompensated care (discharges, ER visits, regular clinic visits, and ambulatory surgery procedures) by the weighted statewide mean Medicaid rate in effect in 2010 for each type of care.
For acute hospital discharges, for example, it’s useful to think of this weighted statewide mean as the average Medicaid rate paid statewide in 2010, across all hospitals and all patients. If we added all Medicaid payments for acute inpatient care for all Medicaid patients discharged in 2010, and divided that sum by the total number of Medicaid patients discharged, the result would be the weighted mean Medicaid rate prevailing in 2010.
We then calculated this combined measure of volume of care actually provided by each hospital by multiplying each hospital’s uncompensated care discharges in 2008 by the statewide weighted mean Medicaid rate prevailing in 2010. We did the same for ER visits, regular clinic visits, and ambulatory surgery procedures. We then summed these four products to yield one combined measure of care actually provided.
Please think of CARE as a reasonable measure of the sum of the actual amounts—volumes--of uncompensated care provided by each hospital across the four types of services. In that sense, CARE is a very basic measure of how much uncompensated

xvi
care a hospital provides, and could be considered a candidate measure for allocating uncompensated care pool dollars so that the money follows the patient. CARE deliberately ignores reasonable factors affecting a hospital’s actual cost of providing care. It ignores local wage rates. It ignores severity of patient illness and cost of treating it. BASE considers both of these.
d. BASE attempts to build in those reasonable costs. Like the 10 percent and CARE formulas, BASE begins with actual volumes of the four types of uncompensated care provided by each hospital in 2008.
BASE then uses three of the core elements that New York State employs to set hospital-specific Medicaid rates for acute inpatient care.4 It begins with a statewide Base rate, the same for all hospitals. This is updated annually. The Base rate is multiplied by an institution-specific adjustment factor (ISAF). Each hospital’s ISAF reflects the labor and other input costs prevailing in the area where that hospital is located. The product of Base * ISAF is then multiplied by the hospital’s Medicaid case mix index (CMI). This is an adjustment for severity of patient illness, which is expected to be correlated closely with cost of care. The CMI employed to calculate BASE is a blend of each hospital’s Medicaid fee-for-service patients and its Medicaid managed care patients. Our BASE calculation does not reflect graduate medical education costs (GME). Both direct medical education (DME) and indirect medical education (IME) are excluded. Medicare pays these costs and so does Medicaid in New York State (though apparently not in most other states). First, we believe that money used to pay hospitals for care of uninsured and other uncompensated patients should not also cover the costs of GME. Second, there is no assurance that payments for GME actually go to GME. (Of course, the same may well be true today for uncompensated care payments themselves.) Third, as will be shown in the report, GME costs are a very substantial add-on to the average Medicaid payment per discharge at New York State teaching hospitals. For the same reasons, our BASE calculation does not reflect payments for hospital capital or certain “non-comparables,” such as ambulances or schools of nursing. Summary of Three Aspects of Five Methods of Paying for Uncompensated Care 5
Method Volumes of care Pricing Progressivity
90% As asserted by hospital but not reported
Charges, reduced to cost by hospital-wide cost-to-charge ratio
NPA – negligible
10% As reported by hospital, but not subject to audit, income level, or insurance status
Price paid by Medicaid to each hospital for each of the four services
None
CARE As 10% Statewide weighted mean Medicaid price for each of the four services.
None
BASE As 10% Inpatient: Statewide base price, adjusted for each hospital’s input costs and case mix; excludes GME and capital Outpatient: APG prices paid by Medicaid in 2010 to each hospital
None
BASE-STEEP
As 10% As BASE Proportional to BASE % of cost

xvii
4. Detailed elements of payment methods APG refers to Ambulatory Payment Group. Ambulatory visits to emergency rooms or clinics have been categorized into APGs for purposes of Medicaid payment. NYS DOH uses the APGs in effect at a given time to calculate payments for various types of uncompensated care in order to calculate the 10 percent formulas. We used the APGs in effect during 2010 to calculate the statewide weighted mean prices for the CARE formula and also, separately, to calculate the three ambulatory components (ER visits, general clinic visits, and ambulatory surgery procedures) of the BASE formula. DRG refers to Diagnosis-related Group. New York State’s Medicaid program pays hospitals for inpatient care under its fee-for-service program by the DRG associated with a particular patient. DRG grouper software takes data on each patient, abstracted from the medical record, and categorizes patients into DRGs. Each DRG has a case weight, which is greater for a DRG of patients who are costlier to treat and smaller for a DRG of patients who are cheaper to treat. (In New York State, case weights are usually called service intensity weights (SIW). The average of the case weights of the DRGs of all patients at a given hospital is that hospital’s case mix index (CMI). A higher CMI generates a higher payment from Medicaid. We used hospitals’ blended CMIs to help calculate the values costs of inpatient care for inclusion in BASE. APR-DRG refers to the All-payer Refined DRG that was incorporated into New York State’s calculation of Medicaid payments in 2009. ISAF is a hospital’s Institution-specific Adjustment Factor. It registers the costs to a hospital of providing care in a particular place. It is designed to capture the cost of the market basket of services and goods that the hospital must purchase—from people, electric utilities, and others---in order to provide care. A higher ISAF means that a hospital must pay higher wages, higher prices per kilowatt-hour, and the like. We multiplied the statewide base cost by each hospital’s ISAF (and then by the hospital’s blended CMI) to generate an average price for acute inpatient care. We multiplied that price by the number of uncompensated care patients to build the inpatient component of BASE. CMI is a hospital’s case mix index, the average case weight associated with the DRGs of the patients admitted to the hospital. In New York State, separate CMIs are calculated for Medicaid fee-for-service (FFS) patients and for Medicaid managed care patients. A weighted average of the two is called the blended case mix index. We used each hospital’s blended Medicaid CMI as a factor in calculating the average price of an acute inpatient admission of an uncompensated care patient. This became the inpatient component of BASE. As mentioned elsewhere, we did not include GME or capital or other unusual costs in our calculation of the price of inpatient care for BASE. 5. Sliding scales. We apply several sliding scales to the CARE and BASE allocations. Each sliding scale is designed to shift more money to hospitals that exert themselves more heavily in providing uncompensated care. Exertion is measured simply by the share of hospital cost devoted to uncompensated care.

xviii
This share is measured by CARE/cost and by BASE/cost. But, in each case, CARE and BASE are scaled up to equal each hospital’s share of cost, as calculated by NYS DOH. This has been done so that the NPA and other, steeper sliding scales to CARE and BASE will have effects similar to that of the application of the NPA today. As explained in the report, we have initially employed three sliding scales; these increase in steepness. The first is the nominal payment amount (NPA) calculation, using New York State’s statutory coverage ratios. As discussed in Section A-2, the NPA is applied to slightly over two-thirds of the $847 million in uncompensated care funds distributed yearly. But, as shown in Section B-3, the existing NPA sliding scale has only small effects on the allocations of funds. We therefore introduced a second and third sliding scale (Steeper-A and Steeper-B) that we expected would have substantially and increasingly strong effects in rewarding hospitals devoting greater shares of their care to uncompensated care. All three sliding scales had surprisingly slight effects on most hospitals. We have concluded that this is attributable to the design of the NPA: It applies its progressive formula in the same way as does the federal income tax—to one slice at a time. In response, we have developed a simpler and stronger sliding scale (SASSS). This directly translates a hospital’s CARE or BASE as a share of total cost into a share of CARE or BASE recognized for reimbursement as uncompensated care. The direct translation might be to multiply the hospital’s CARE as share of total cost—for example, 2.5 percent—by a factor of 10, such that 25 percent of CARE would be reimbursed from the uncompensated care pool. Statutory coverage ratios. These are the successive shares of each slice of uncompensated care that currently influence a hospital’s payment for uncompensated care. As discussed in Section F, Steeper-A and Steeper-B greatly widened the range of coverage ratios. Rationale for sliding scales and progressivity. In all cases, the underlying logic of a sliding scale is that if a hospital’s uncompensated care inpatients, ER or clinic visitors, or ambulatory surgery patients represent only small shares of all patients—a few daily—then the hospital will not need to incur substantial additional costs in order to deliver that uncompensated care. In particular, relatively small numbers of added people will have to be hired. Incremental costs would be low—meds, food, marginal costs of imaging and labs, and the like. Also, the very small numbers of uncompensated care patients won’t be associated with any meaningful share of fixed costs, so insured patients won’t need to be asked to bear any visible fixed costs actually associated with service to uncompensated care patients. But if a greater share of all patients are uncompensated, then the hospital will be likelier to incur substantial added costs—particularly of nurses. Also, it will be appropriate to recognize and reimburse a greater share of their uncompensated care costs because, otherwise, Medicare, Medicaid, and privately insured patients will have to bear some of the substantial fixed costs associated with service to uncompensated patients.)

xix
CONTENTS Introduction by Judy Wessler, Director, CPHS iSummary of Findings vAcknowledgements ixDefinitions and Classification Methods xContents xixExhibits xxi A. Aims 1 1. Two policies 1 2. What’s wrong with current distribution methods? 3. Conserving all needed hospitals 4. Focus of the work B. Four Challenges 7 1. Benchmark 2. Quantifying uncompensated care volume across four services 3. The sliding scale or progressivity 4. Data C. Actual Distribution of Uncompensated Care Pool Dollars, 2005 – 2010 17 D. Actual Provision of Uncompensated Care Services, 2006 – 2008 19 1. Provision of uncompensated care services in 2008 2. Breakdown of volumes of uncompensated care, 2006 – 2008, by individual hospital E. Distribution of Uncompensated Care Funds in 2010 and Actual Volumes of Care in 2008—Excluding Major Public Hospitals
24
F. Improving the Fairness of Uncompensated Care Payments to 179 Hospitals in New York State—Excluding Major Public Hospitals—Money Follows Patients and Steeper Sliding Scale to Recognize Real Burdens of Greater Effort 36 1. Introduction 2. Five different allocation methods 3. The sliding scale 4. Comparison of five methods of allocation among the eight regions 5. Comparison of five methods of allocation by teaching status 6. Allocations by the various sliding scales 7. A fair and reasonable allocation method G. Equitable Allocations of $847 Million Pool among All 200 New York State Hospitals (Including Major Public Hospitals)
59
1. This is a what-if analysis 2. Actual allocations of $847 million by region and teaching status, compared with allocations by CARE, BASE, and BASE STEEP. 3. Choosing a fair and reasonable allocation method

xx
Appendix Exhibits 72 Endnotes 140

xxi
MAIN EXHIBITS No. Title Page
1-A Seven Methods of Allocating $847 Million in Hospital Uncompensated Care Funds, New York State, 2007 2
1-B Acute Care Hospitals in New York State, 1995-2010 42 Types of Uncompensated Care and Their Shares of the Total, 2008
Volumes of Care with Cost Calculated from Each Hospital’s Own Medicaid Rate of Payment, 200 New York Hospitals 8
3 Correlations among Volumes of Care at 200 New York State Hospitals, 2008 10
4 Sliding Scale for Nominal Need and Associated Coverage Ratios 125 Calculation of Nominal Payment Amount and Distribution 136 Nominal Payment Amount for Uncompensated Care as % of
Uncompensated Care at Cost, 2010 147 The Current Sliding Scale Is Not as Steep as It Might Seem 158 Uncompensated Care Need as % of Cost Versus Nominal Payment
Amount as % of Uncompensated Care at Cost, 2010 159-A Distribution of Uncompensated Care Dollars in 2010 by Region of
State and Hospital Teaching Status, All 200 Hospitals 179-B Count of New York State Hospitals in 2010 by Region of State and
Hospital Teaching Status, All 200 Hospitals 189-C Population and Acute Hospital Discharges by Region of State,
2008 1810-A-1 Provision of Uncompensated Care Discharges by 200 New York
State Hospitals by Region and Teaching Status, 2008 2010-A-2 Uncompensated Care Discharges as Share of Total Discharges by
200 New York State Hospitals, 2008 2010-B-1 Provision of Uncompensated Care ER Visits by 200 New York
State Hospitals by Region and Teaching Status, 2008 2110-B-2 Uncompensated Care ER Visits as a Share of Total ER Visits by
200 New York State Hospitals, 2008 2110-C Provision of Uncompensated Care Clinic Visits by 200 New York
State Hospitals by Region and Teaching Status, 2008 2210-D Provision of Uncompensated Care Ambulatory Surgery Procedures
by 200 New York State Hospitals by Region and Teaching Status, 2008 22
11 Shares of Statewide Volumes of Uncompensated Care in Four Types of Services Provided by Major Public and other Hospitals, New York State, 2008 25
12-A CARE by Region and Teaching, 2008 2712-B Actual Distributions of $707.7 Million in Uncompensated Care Pool
Funds to 179 Non-Major-Public Hospitals, by Region and Teaching, 2010 27
12-C Comparison of Allocation by CARE, Actual Distribution, and Nominal Payment Amount (Current Sliding Scale), $707.7 Million for 179 Non-Major-Public Hospitals, by Region, 2010 28
12-D Comparison of Allocation by CARE, Actual Distribution, and

xxii
Nominal Payment Amount (Current Sliding Scale), $707.7 Million for 179 Non-Major-Public Hospitals, by Teaching Status, 2010 28
12-E Cumulative CARE vs. Cumulative ACTUAL, 2010 2912-F Constructing the Cumulative CARE vs. Cumulative ACTUAL and
Similar Exhibits 3012-G
Illustration of Hold Harmless Allocation to New York City: Apply CARE Proportions of CARE Regional Total of $302.1M to Actual 2010 Total Allocation of $395.1M 32
12-H
Comparison of Actual, CARE, and CARE Hold-harmless Allocations among New York City Hospitals by Teaching Status, 2008 35
13
Medicaid Graduate Medical Education (GME) Payments Expressed as Dollars per Discharge and as a Percentage of BASE, 27 New York State Teaching Hospitals with Medicaid GME/Discharge Exceeding $2,400, 2010 38
5 Calculation of NPA and Distribution, modified 4114-A
Summary Results of Five Methods of Allocation among Eight New York State Regions, 2010 43
14-B
Five Methods’ Percentage Allocations among Eight New York State Regions, 2010 44
14-C
Five Methods’ Percentage Allocations by Teaching Status, 2010 44
15-A
Comparison of Nine Methods of Allocating Uncompensated Care Funds: Effects across New York State Regions, 2010 45
15-B
Comparison of Changes in Allocating Uncompensated Care Funds across Regions: Comparisons of Actual 90+10, CARE, BASE, and BASE-STEEP Methods 46
15-C
Nine Methods’ Percentage Allocations among Eight New York State Regions, 2010 46
15-D
Nine Methods’ Percentage Statewide Allocations by Teaching Status, 2010 47
15-E BASE STEEP Dollar Allocations by Region and Teaching Status, 2010
47
15-F
Percentage Allocations by BASE STEEP by Region and Teaching Status, 2010 48
16 Allocations by Individual Hospital: Actual, CARE, BASE, and BASE STEEP, with BASE Percent of Cost, 2010: Excludes Major Public Hospitals—All Allocations Total $707.7 Million Statewide (All Dollars in Thousands) 54
17-A
Dollar Allocations to 200 New York State Hospitals by Region: Actual, CARE, BASE, and BASE STEEP , 2010 60
17-B
Percentage Allocations to 200 New York State Hospitals by Region: Actual, CARE, BASE, and BASE STEEP , 2010
61
17-C
Percentage Allocations to 200 New York State Hospitals by Teaching Status: Actual, CARE, BASE, and BASE STEEP , 2010
61
17-D
Comparison of Allocations by Actual, CARE, BASE, and BASE STEEP to Hospitals in New York City: 179 Hospitals (Excluding Major Publics) versus All 200 New York State Hospitals
62

xxiii
17-E Comparison of Actual, CARE, BASE, and BASE STEEP
Allocations among 179 Hospitals with Allocations among 200 Hospitals 64
18 Allocations by Individual Hospital: Actual, CARE, BASE, and BASE STEEP, with BASE Percent of Cost, 2010: All 200 New York State Hospitals—All Allocations Total $847 Million Statewide 66

xxiv
APPENDIX EXHIBITS App. 1 Actual Uncompensated Care Distributions to New York State
Hospitals, 2005-2010 73App. 2 –A Volumes of Uncompensated Care, 2006-2008:
Part A: Acute Care Discharges and ER Visits 83App. 2-B Volumes of Uncompensated Care, 2008-2008:
Part B: Clinic Visits and Ambulatory Surgery Procedures 92App. 3
Actual Uncompensated Care Distributions in 2010, Actual Volumes of Uncompensated Care in 2008, and Composite CARE Measure, 2008: 179 New York State Hospitals (Excluding 21 Major Public Hospitals) 97
App. 4 200 New York State Hospitals, Listed Alphabetically, With Operating Certificate Number, Region, Teaching Status, and Major Public Hospital Status 107
App. 5 Acute Self-pay and Free Discharges, Total Discharges, and Self-pay/Free Share of Total, 179 Hospitals Excluding Major Publics, 2008 113
App. 6-A Dollar Gain (Loss) for CARE, BASE, and BASE STEEP versus Actual, 2010: Excludes Major Public Hospitals (All Dollars in Thousands) 118
App. 6-B Percentage Gain (Loss) for CARE, BASE, and BASE STEEP versus Actual, 2010: Excludes Major Public Hospitals 123
App. 7-A Dollar Gain (Loss) for CARE, BASE, and BASE STEEP versus Actual, 2010: All 200 New York State Hospitals (All Dollars in Thousands) 128
App. 7-B Percentage Gain (Loss) for CARE, BASE, and BASE STEEP versus Actual, 2010: All 200 New York State Hospitals 134

1
A. AIMS OF THE WORK This report will explore the fairness of uncompensated care payments to hospitals in New York State under the different payment methods that have been used since 2007. It will then analyze the effects of those different methods and also of several new alternative methods for individual hospitals, teaching versus non-teaching hospitals, and hospitals located in different regions of New York State. 1. Two policies. This work will be guided by two CPHS policies. The first is that uncompensated care payments should follow the uninsured low-income patient. This means that more money should go to hospitals providing greater volumes of uncompensated care to uninsured low-income patients, and less money should go to hospitals providing smaller volumes. Hospitals provide many different types of inpatient and outpatient services without compensation. It is therefore important to develop a summary measure of hospital uncompensated care that will capture services to patients. CPHS proposes that uncompensated care payments should follow care to lower-income uninsured patients. But available data on the volumes of care reported by hospitals and counted by New York State that are employed in this report to calculate three alternative methods of allocating uncompensated care funds include more than low-income uninsured patients. New York State counts care provided by hospitals to patients in two categories, “uninsured/self pay” and “free (charity, Hill Burton)” patients. The great majority of patients fall in the latter category. These numbers are reported by each hospital in its annual Institutional Cost Report (ICR). Exhibit 32 reports acute care discharges and Exhibit 33 reports emergency room visits, regular clinic visits, and ambulatory surgery procedures. The ICR does not categorize these patients by income and family size. Self-pay patients could include some middle- and upper-income uninsured patients. In this report, we follow the state’s practice of subtracting income garnered by hospitals when they care for these patients from the sums to which hospitals would otherwise be entitled. The boundary between free care and bad debt is not a sharp one. Once accurate counts of volumes of care provided to low-income uninsured people are available, the three methods used in this report can be employed to re-calculate allocations that respect those new measures of care provided to low-income uninsured patients. The second policy is that hospitals devoting greater shares of their caregiving to uncompensated services to uninsured low-income patients should be paid by more generous standards. This means reliance on some sort of sliding scale, sometimes called a progressivity factor. For illustration only, such a scale or factor could mean that a hospital devoting 1 percent of its caregiving to serving uninsured patients might receive funds to cover half

2
of the costs it incurs, while a hospital devoting 5 percent of its caregiving to serving uninsured patients might receive funds to cover three-quarters of its costs. Such a sliding scale is has actually been used in New York State to influence some of the distribution of uncompensated care funds among hospitals. But, as will be shown below, the existing sliding scale has a very low slope, and probably does not do a good job of fairly compensating hospitals that exert themselves more strenuously on behalf of uninsured patients. A sliding scale makes great practical sense. A hospital can devote a very small percentage of its care to uninsured patients without incurring substantial increases in costs. The nurses and other caregivers already working at the hospital might be able to fit in just a few uninsured patients from time to time without increased staffing. The added costs actually incurred by serving just a few uninsured patients—as a percentage of all patients—would include medications, supplies, meals, and the like. These are variable or incremental costs—the costs that vary with volume of care. Fixed costs are insignificant. Since uninsured patients are a very small share of all patients, the uncompensated care pool does not need to relieve third party payers by shouldering a share of fixed costs. But as a hospital serves more and more uninsured patients—as a percentage of all patients—more nurses and other caregivers will be obliged to work more hours. They must be paid for those hours. Variable costs become much more substantial. Also, as the uninsured percentage of all patients grows, it would be fair for uncompensated care payments to the hospital to cover a share of fixed costs. Otherwise, Medicare, Medicaid, and private insurers will have to bear that share of fixed costs, or they will go uncovered. A steeper sliding scale is one way to compensate hospitals for the much higher variable and fixed costs associated with serving uninsured patients. 2. What’s wrong with current distribution methods? New York State’s methods of paying for uncompensated care have been criticized as unfair and unaccountable for their failure to channel money to hospitals in proportion to the volumes of care they provide or the added cost they incur. The current methods of allocating scarce uncompensated care funds do not reward hospitals in fair proportion to their efforts. They do not encourage hospitals to work harder to serve uninsured lower-income patients. In some cases, they appear to reflect hospitals’ political power more than hospitals’ efforts on behalf of patients in need. Back in 2007, seven separate methods governed the distribution of $847 million in hospital uncompensated care funds.6 Exhibit 1 – A summarizes the methods used to distribute various shares of those funds and the approximate number of hospitals receiving that money. Currently, 90 percent ($762.3 million) of the $847 million continues to be distributed by the methods listed in Exhibit 1 – A. Beginning in 2009, the remaining 10 percent ($84.7 million) has been distributed in proportion to hospitals’ actual volumes of uncompensated care multiplied by their different Medicaid rates for care.

3
Exhibit 1 – A
Seven Methods of Allocating $847 Million in Hospital Uncompensated Care Funds, New York State, 2007 7
$ millions Hospitals Beneficiaries Method
$562.7 183 Voluntary hospitals BDCC targeted need, subject to nominal payment scale
$19.5 183 Supplementary voluntary hospitals
Same
$17.5 62 Rural distribution BDCC, with extra aid to smaller hospitals $72.0 29 Voluntary hospital
high-need reserve For hospitals whose targeted need exceeded 4% of costs
$139.3 21 Major public hospitals
Depended on funds received in 1996—which reflected historic reimbursable cost
$27.0 76 Supplemental indigent care
Higher indigent care payments replaced reduced graduate medical education funding
$9.0 62 Rural grants Each receives $140,000
$847.0 207
Notes:
BD is bad debt, money that patients are charged but that they do not pay, resulting in a write-off of charges.
CC is charity care, care provided to patients without charge or at a reduced charge, because it is decided—before, during, or after provision of care—that the patients will not be able to pay.
Targeted need is bad debt plus charity care as a percentage of costs of hospital care.
The nominal payment scale is a progressive or sliding scale that awards higher uncompensated care payments to hospitals that devote a greater share of their costs to uncompensated care.
These seven methods were established at different times to pursue different aims. A 2008 Report from the New York State Department of Health criticized the methods on a number of grounds; these are four of the most salient: First, the hospitals’ own reports on their bad debt and charity care are the foundations for most of the payments. Hospitals may vary in how and when they recognize bad debt and charity care. 8 A number of individual hospitals reported surprisingly large year-to-year variations in bad debt plus charity care. These variations seem much greater than likely actual service to uninsured or other patients, raising further questions about the accuracy of hospital reporting. The ways in which hospitals report (and provide) uncompensated care makes it very difficult for the state to audit hospital reports at a level of detail that could validate those reports. The Department of Health wrote that "There is little correlation between hospitals' reported BDCC need and units of service provided to self-pay and free care patients. There are significant swings from year-to-year on reported BDCC need. These swings cannot be explained from reported data."9 Second, “Indigent care dollars do not follow services to individual patients and the BDCC need as current reported by hospitals cannot be connected back to care delivered to specific patients, absolute numbers of patients, or the cost of care provided to uninsured patients.” 10

4
Third, hospitals set their own charges for various services, resulting in inter-hospital inequities. Fourth, “There is no connection between the Financial Aid Law requirements that hospitals offer accessible sliding fee scales to low-income uninsured patients and the distributions” of the funds. 11 (To try to address this problem, the legislature enacted “Manny’s Law” in 2007. The law requires hospitals to inform patients up-front if they are eligible for free or heavily discounted care. It is not clear how closely practices adhere to this requirement; a 2010 study found considerable cause for concern nationally. 12) Recognizing these and other problems, the New York State Department of Health made seven specific recommendations. 13 These included:
Collapsing the seven pools into three;
Calculating need by units of uncompensated service, valued at Medicaid rates; and
Retaining the sliding scale that increases payments with uncompensated care’s share of hospital costs.
Generally, these recommendations have had little effect on the legislature’s actual allocations of uncompensated care funds. Beginning in 2009, in line with the second recommendation, 10 percent of total uncompensated care funds ($84.7 million) indeed has been distributed to hospitals in proportion to the product of services’ volumes multiplied by Medicaid rates, summed across services. (It is said that a proposal to allocate 50 percent of total uncompensated care funds by this new method was abandoned in the face of lobbying from hospital organizations that persuaded the legislature to drop that share to 10 percent.) This new formula could be seen as one attempt to have the money follow the patient. Even disregarding its application to only 10 percent of the money, it has been only partly successful. In this report, we consider the effects of this change on hospitals, and on the fairness of allocation. The 10 percent formula indeed results in different distributions across many individual hospitals (see 90/10 ratio) but, surprisingly, it results in little change in the allocations when viewed across hospitals grouped by region or by teaching/non-teaching status. Significantly, volume of service is one of the two factors; Medicaid payment rate is the other. Still, we consider the present 10 percent formula a useful step forward, a useful foundation. It points toward the need to collect accurate data on actual volumes of inpatient and outpatient uncompensated care provided by each hospital to the uninsured lower-income patients of interest. We will suggest and test several ways to modify the 10 percent method’s volume-times-price approach to make it a stronger way to direct the money to follow the uninsured lower-income patient. 3. Conserving needed hospitals. Ultimately, the job of identifying and preserving all hospitals and services needed to protect the health of New Yorkers must include commitments to all needed hospitals. Such commitments are meaningless unless backed by adequate financing from all payers. Adequacy means that payments from all payers, together, must be sufficient to finance the efficient provision of needed care.

5
The vital job of preserving all needed hospitals can’t rest on allocations of uncompen-sated care dollars. And that job should not distort the allocations of those care dollars. Still, better allocations of uncompensated care dollars (the money follows the patient and hospitals are rewarded appropriately for their provision of uncompensated care—may have the effect of helping to preserve a number of needed but vulnerable hospitals. This is particularly important at a time of sharp reductions in Medicaid payments to hospitals and other caregivers in New York State (among many other states). As shown in Exhibit 1 – B, 187 acute care hospitals remained open in New York State in 2010, down 43 from the 230 open in 1995, a loss of 19 percent of all hospitals in 15 years.
Exhibit 1 – B Acute Care Hospitals in New York State, 1995 – 2010 14
Year Hospitals
1995 2302000 2152005 2032010 187
Please note: These are all of the state’s acute care hospitals, non-profit or public. The reader will note that 200 New York State hospitals received—or were listed as candidates to receive—hospital uncompensated care funds in 2010. (Of these, two closed.) How to square the 187 acute hospitals with the 200 recipients? Primarily by noting that not all of the hospitals receiving this money were acute care institutions. The challenge to conserve needed safety net hospitals is greatest, since these institutions are generally more vulnerable financially. Hospital survival is not the subject of this report, but appropriate allocation of uncompensated care funds would help to sustain many safety net hospitals. Safety net hospitals are often politically and financially weaker. They are more than likely located in low-income and medically underserved immigrant and communities of color, where they are needed and even indispensable. This has made them more vulnerable to closing, and hospital closing or consolidation have been pushed by some as a solution to high and rising health care costs.15 Since the 1960s, various individuals and groups have suggested that excess hospitals or beds have been responsible for high hospital costs in New York State. Excess beds have received excessive attention as a cause of high hospital costs. Hospitals serving uninsured or Medicaid patients, and those located in neighborhoods in which a high percentage of residents are people of color have been disproportionately likely to close. These hospitals and neighborhoods have therefore suffered excessively from efforts that purport to address the notional problem of excess hospitals or beds.16 A study of 1,200 hospitals in 52 large and mid-size U.S. cities from 1936 to-date has found that hospitals located in some communities of color have been likelier to close in each decade, controlling for efficiency, competition, finances, and other reasonable factors. Only hospital size and teaching status had more predictive power than did race.17 It is central to note that efficiency never correlates with hospital survival.

6
In 2009, New York’s hospital costs per person were fourth-highest in the nation, 29.5 percent above the U.S. average, according to data reported by hospitals to the American Hospital Association.18 Only Massachusetts, North Dakota, and Maine had higher costs per person. A number of forces clearly make for higher costs, such as the very large share of New York State’s patients served in costly teaching hospitals. In 2004, 45.3 percent of New York’s hospital inpatients were admitted to major teaching hospitals affiliated with the Council of Teaching Hospitals of the American Association of Medical Colleges.19 This was the fourth-highest share in the nation; only Delaware, Connecticut, and Rhode Island had higher shares of patients in major teaching hospitals. And New York’s major teaching hospitals are, on average, probably more teaching-intensive than their counterparts in most other states. That can be seen in New York’s highest-in-the-nation ratio of residents (doctors-in-training) per thousand people. 20 4. Focus of the work. We first address the $707.7 million distributed to some 179 of the 200 hospitals listed on the NYS DOH uncompensated care allocation spreadsheets for that year. These are the 200 hospitals listed minus the 21 major public hospitals. These 179 (less a few that closed or did not receive pool funds) hospitals are the non-major-public hospitals that received funds from the state’s $847 million uncompensated care pool. These funds were distributed in 2010 in various relationships to costs of care and volumes of care at New York State hospitals in 2008. The remaining 21 hospitals and their $139.3 million share of the $847 million pool were excluded from some of the analyses. These 21 are major public hospitals, institutions that receive a share of the $847 million that is much smaller than their share of uncompensated care services. The $847 million uncompensated care pool has not been the main source of state support for these hospitals’ uncompensated care. That state support has been financed largely through Medicaid disproportionate share funds and additional means other than the $847 million pool. Those federal funds are usually matched by city or county dollars, not state dollars. Second, because very substantial cuts in Medicaid disproportionate share (DSH) funds are scheduled under the 2010 federal health reform law, and because of concerns that current methods of allocating pool funds will not satisfy requirements for continued DSH funding, it will be important to ensure a fair allocation of all uncompensated care funds statewide. Therefore, we address the uncompensated care needs of all New York hospitals statewide, and also on the effects of various methods of distributing uncompensated care funds on all hospitals. These analyses will look beyond the traditional cap of $139.3 million on major public hospitals’ share of the pool. The aim here will be to identify fair allocations of funds across all hospitals at some future time, when it may be more necessary and appropriate to ensure consideration of all hospitals’ needs in a balanced manner.

7
B. FOUR CHALLENGES The project has faced four main challenges. These concern
1. The benchmark 2. Quantifying volume of care across services (the first two are connected) 3. Sliding scale or progressivity 4. Data
The challenges are now described; their resolutions are addressed in the sections that follow. 1. The benchmark challenge. How to measure fairness, the extent to which the money follows the patient, and how to compare this benchmark for fairness with
The original distribution formula, which largely governs distribution of 90 percent of funds today?
The formula now governing 10 percent of the distribution? Proposed reforms that would modify method governing the 10 percent of the
distribution? Other methods of distribution?
In other words, what constitutes a fair distribution formula, how much to current methods comport with or depart from that measure of fairness, and how can we measure such departures? 2. Quantifying volume of across services challenge. If money is to follow the patient, it is necessary to learn where the patient is actually going. That is, what is a good composite or proxy measure of patient volume across all of the types of services that different hospitals provide? New York State hospitals are paid for uncompensated care in proportion to volumes of inpatient and outpatient/emergency care, valued at different prices/costs. Payments for uncompensated care are combined; they are not made separately for inpatient and outpatient care. To measure fairness of payments (the degree to which payment has followed the patient), we have had to develop a combined measure of a hospital’s volume of care that respects its actual inpatient and outpatient/ emergency contributions. a. A first consideration involved the services to be employed to construct the composite measure. Indeed, New York State reimburses hospitals for seven types of uncompensated inpatient care (such as acute care discharges or rehabilitation days or inpatient psychiatric days) and seventeen types of uncompensated outpatient care (such as emergency room visits, hospital clinic visits, or outpatient dialysis or chemotherapy treatments). It would be complicated and time-consuming to account for each hospital’s volume of service on the 24 different measures to prepare a composite measure of patient volume.

8
Fortunately, we quickly learned that four types of care accounted for almost 90 percent of the cost of uncompensated care, as measured at each hospital’s own Medicaid reimbursement rate. Please refer to Exhibit 2 for this calculation, which employed 2008 volumes of care—those factor into the distribution of uncompensated care funds for the 2010 pool year. The data in Exhibit 2 are drawn from all 200 New York State hospitals, including the 21 major public hospitals. (Because this volume of care measure does not consider about 10 percent of costs of uncompensated care in 2008, as measured by each hospital’s own Medicaid rates for each service, it will not be fair to hospitals that devoted disproportionate shares of their own uncompensated care to the 20 services (of the total of 24) that were excluded from the volume of care measurement. Therefore, if the general approach to measuring volume of care taken up in this report is considered broadly useful, it will be important to calculate volume of care across all 24 services. )
Exhibit 2
Types of Uncompensated Care and Their Shares of the Total, 2008 Volumes of Care,
With Cost Calculated from Each Hospital’s Own Medicaid Rate of Payment,
200 New York Hospitals
Type of care, 2008
Volumes, type of care and their cost,
at Medicaid rate Costs only
% of total cost
2008 Acute Self-Pay & Free Discharges 71,101 Average Medicaid DRG Rate Acute Self-Pay & Free Cost of Care $ 693,002,046 $ 693,002,046 42.6% 2008 Specialty Exempt Selfpay and Free Days 9,392 Specialty Exempt Rates Specialty Exempt Self-Pay & Free Cost of Care $ 14,091,995 $ 14,091,995 0.9% Psych Exempt Self-Pay & Free Days 74,021 Psych Exempt Rates Psych Exempt Self-Pay & Free Cost of Care $ 57,503,695 $ 57,503,695 3.5% Chemical Dependency Exempt Unins. & Free Days 7,031 Chemical Dependency Exempt Rate Chemical Dependency Exempt Unins. & Free Cost of Care $ 2,673,030 $ 2,673,030 0.2% Med Rehab & BI/Coma Exempt Unins. & Free Days 6,354 Med Rehab & BI/Coma Exempt Rates Med Rehab Exempt Unins. & Free Cost of Care $ 7,355,822 $ 7,355,822 0.5%

9
Detox Exempt Unins. & Free Days 12,702 Detox Exempt Unins Rates Detox Exempt Unins. & Free Cost of Care $ 11,837,263 $ 11,837,263 0.7% CAH Uninsured & Free Days 568 CAH Rates CAH Unins. & Free Cost of Care $ 931,977 $ 931,977 0.1% Inpatient costs, subtotal $ 787,395,829 Emergency Room Unins. and Free Visits 1,105,841 Emergency Room APG Emergency Room Unins. and Free Cost of Care $ 296,610,659 $ 296,610,659 18.2% Total Clinic Unins. & Free Visits 1,859,023 General Clinic APG Clinic Unins. & Free Cost of Care $ 405,593,421 $ 405,593,421 24.9% Ambulatory Surgery Unins. and Free Procedures 49,554 Ambulatory Surgery APG Ambulatory Surgery Unins. and Free Cost of Care $ 67,509,978 $ 67,509,978 4.2% MMTP Unins. and Free Visits 873,140 Weekly Price / 4.3 visits MMTP Unins. and Free Cost of Care $ 27,625,744 $ 27,625,744 1.7% Renal Dialysis Unins. And Free Visits 19,784 Renal APG Renal Dialysis Unins. And Free Cost of Care $ 4,741,755 $ 4,741,755 0.3% Chemo & Oncology Clinic Unins. and Free Visits 41,368 Oncology APG Chemo & Oncology Clinic Unins. and Free Cost of Care $ 11,643,760 $ 11,643,760 0.7% HIV 5 Tier Unins. and Free Visits 108,037 HIV APG HIV Cost of Care $ 25,082,056 $ 25,082,056 1.5% Outpatient Costs, subtotal $ 838,807,372 TOTAL COST $ 1,626,203,201 100.0% Acute inpatient, ER, clinic, and ambulatory surgery share of total cost 89.9%

10
b. Now that it’s known that these four types of care account for almost 90 percent of the cost of uncompensated care, the question arises whether any one of the four would, by itself, adequately capture where uninsured patients were actually going. If one type of care could serve as a proxy for all four, it would probably not be necessary to build a composite measure. But, as Exhibit 3 shows, the volumes of the four main types of care—inpatient discharges, ER visits, other outpatient clinic visits, and ambulatory surgery volume—are only moderately well-correlated. They are certainly not so well-correlated that only one single type of care (such as the number of inpatient discharges) could be used as a proxy for overall volume of uncompensated care. Exhibit 3 calls for a little explanation. It considers individual relationships among volumes of discharges, ER visits, clinic visits, and ambulatory surgery. From the upper-left corner to lower-right corner, each type of service is correlated with itself at 1.0 and no statistical significance is given. Not surprising! But consider the correlation between discharges and ER visits, 0.8034, significant at p = 0.00. This relation is highly statistically significant. Further, by squaring the correlation of 0.8034, we get 0.6455, or 64.6 percent, meaning that variation in one predicts 64.6 percent of the variation in the other. Variation between discharges and clinic visits, and between discharges and ambulatory surgery volume, though, is much lower. Further, these correlations across the 200 hospitals obscure enormous differences in volumes of uncompensated inpatient care versus uncompensated outpatient care at a number of individual hospitals. Some hospitals provide substantial amounts of uncompensated inpatient care but very little uncompensated outpatient care; the reverse seems even more common. All these factors argue in favor of a composite measure over a proxy measure.
Exhibit 3
Correlations among Volumes of Care at 200 New York State Hospitals, 2008
Discharges ER Clinic Amb Surg
Discharges 1.0000 .8034 .5857 .5676
p= --- P=0.00 p=0.00 P=.000
ER .8034 1.0000 .7721 .7062
p=0.00 P= --- p=0.00 P=0.00
Clinic .5857 .7721 1.0000 .8189
p=0.00 P=0.00 p= --- P=0.00
Amb Surg .5676 .7062 .8189 1.0000
p=.000 P=0.00 p=0.00 P= ---
Please note: As always, the phrase “all 200” refers to non-profit and public hospitals (including the state’s 21 major public hospitals. And it refers to all teaching and non-teaching hospitals in all eight regions of the state.

11
c. A third consideration concerned the price to be used to combine the volumes of uncompensated care across the four services at the various hospitals to create a single measure of volume of uncompensated care provided. We decided to use, for each of the four types of care, a single statewide weighted mean Medicaid price, across all hospitals and patients. A statewide weighted mean Medicaid price for acute inpatient discharges, for example, would be each hospital’s Medicaid price multiplied by its uncompensated care acute discharges, summed across all hospitals, with that sum divided by total uncompensated care acute discharges statewide. We then multiplied the weighted mean Medicaid price of inpatient discharges by each hospital’s uninsured inpatient discharges. We did the same for ER visits, regular clinic visits, and ambulatory surgery procedures. We summed these four products for each hospital and have employed this as the composite measure of volume of uninsured care given by each hospital. This is the measure of CARE provided by each hospital. 3. The sliding scale or progressivity challenge New York State’s uses a sliding scale as one step in the calculation of the distribution of important uncompensated care funds to hospitals. The sliding scale applies to two of the seven sub-pools, the main voluntary hospital pool containing $562.7 million and the much smaller supplementary voluntary hospital pool containing $19.5 million. Together, these total $582.2 million, or 68.7 percent of the $847 million in the uncompensated care pool as a whole. This activity includes four steps:
a. Calculation of Nominal Need b. Calculation of a Targeted Need Percentage c. Application of the sliding scale to nominal need in light of the Targeted Need
Percentage d. Calculation of a projected distribution to hospitals, one that is constrained by the
resources available statewide. a. Nominal Need is based on each hospital’s own report of its inpatient and outpatient uncompensated care services, measured at charges. (It’s important to note that free care/charity care and bad debt have equal standing in the nominal need calculation. This has been strongly criticized.) Inpatient charges for uncompensated care services are reduced to cost by multiplying charges by the hospital’s ratio of inpatient cost to inpatient charges. Outpatient charges for uncompensated care services are reduced to cost by multiplying those charges by the hospital’s ratio of outpatient cost to outpatient charges. b. The Targeted Need Percentage is a hospital’s Nominal Need divided by its costs of inpatient and outpatient care. c. The sliding scale shown in Exhibit 4 is applied to nominal need in light of the hospital’s Targeted Need Percentage. This is the job of calculating a Nominal Payment Amount (NPA) for each hospital.

12
Exhibit 4 21
Sliding Scale for Nominal Need Currently in Use
Targeted Need Percent Coverage Ratio
0% to 0.5% 60% 0.5% to 2% 65% 2% to 3% 70% 3% to 4% 75% 4% to 5% 80% 5% to 6% 85% 6% to 7% 90% 7% to 8% 95%
8% and above 100% The NPA is applied to nominal cost in a particular way. All dollars of nominal need are sliced by their share of hospital cost. Higher nominal need shares of hospital cost are covered at a higher ratio. As shown in Exhibit 4, nominal need dollars under 0.5% of hospital cost is covered at 60% while nominal need dollars ranging between 0.5% and 2% of hospital costs are covered at 65%, and so on. This may be clearer by considering how the current sliding scale does not work today. The sliding scale does not mean that if a certain hospital has a Targeted Need Percentage of, say, 4.5 percent, that all of its Nominal Need is covered at a ratio of 80%. Instead, Nominal Need is partitioned among the various levels of the sliding scale. Exhibit 5 describes the process in greater detail. It begins by showing the calculation of the Targeted Need Percentage. It proceeds by partitioning the hospital’s Targeted Need dollars among the various levels of targeted need as percentage of cost. At each level, the hospital’s Targeted Need dollars are multiplied by that level’s statutory coverage ratio. Those products are summed to calculate the hospital’s total Nominal Payment Amount. d. Calculating the projected distribution to each hospital. Then, each hospital’s Nominal Payment Amount is multiplied by the statewide coverage ratio (the resources available divided by the sum of Nominal Payment Amounts across all hospitals). That is each hospital’s projected distribution of uncompensated care dollars. In other words, the NPA is not the amount actually paid to a hospital. Instead, the hospital is paid a share of its NPA. That share depends on the statewide Coverage Ratio for NPAs. The Coverage Ratio is calculated by dividing Resources Available by the sum of all hospitals NPAs. That ratio is then multiplied by each hospital’s NPA to learn the dollars to be distributed using this method.

13
Exhibit 5 22
Calculation of Nominal Payment Amount and Distribution
Elements Hospital Inpatient and Outpatient Uncompensated Care at cost $4,500,000 Hospital Inpatient and Outpatient Cost $100,000,000 Targeted Need Percentage 4.50%
Targeted Need Percentage of Costs
Targeted Need
Statutory Coverage Ratio
Nominal Payment Amount
0% to <0.5% $50,000 60% $30,000 5% to <2% $1,500,000 65% $975,000 2% to <3% $1,000,000 70% $700,000 3% to <4% $1,000,000 75% $750,000 4% to <5% $950,000 80% $760,000 5% to <6% $0 85% $0 6% to <7% $0 90% $0 7% to <8% $0 95% $0 8% and above $0 100% $0 Total $4,500,000 $3,215,000 Resources Available $562,700,000 Total Voluntary Nominal Payment Amount (NPA) $773,364,486 Coverage ratio of NPA (= Resources Available/Total NPA) 72.76% Hospital Projected Distribution (= Coverage ratio * Hospital NPA) $2,339,234 A surprisingly flat sliding scale. The sliding scale applies nine different coverage ratios—ranging from 60 percent to 100 percent—to nine different slices of targeted need as a percentage of cost. It might therefore be expected that the sliding scale would work to direct substantially more money to hospitals providing greater shares of uncompensated care services. But this is not true in practice. Application of the sliding scale does relatively little to channel more money to hospitals that exert themselves more heavily to provide uncompensated care. There are perhaps three reasons for this:
Each successive higher percentage (statutory coverage ratio) is applied only to the next slice of Targeted Need. This is consequential. This approach, which parallels that of the progressive income tax, might be called “next-slice-only marginal progressivity.
The coverage ratios range only from 60 percent to 100 percent. They might start at a lower ratio.

14
Many hospitals’ need as a percentage of cost may be clustered in the 2% to 4% range, so the small increases in current coverage ratios may have little practical effect.
Looking forward, in keeping with the second CPHS policy (hospitals devoting greater shares of their caregiving to uncompensated services should be paid by more generous standards), it will be desirable to look into ways to improve the sliding scale by making it steeper—that is, so it succeeds in channeling more money to hospitals providing greater volumes of uncompensated care. In this report, we apply the existing NPA and statutory coverage ratios to the entire $847 million in distributions. We also apply it to several ways in which the money might follow the patient. Finally, we suggest abandoning the current NPA and statutory coverage ratios entirely; we test the effects of substituting direct progressivity in place of the next-slice-only marginal progressivity of the NPA. By direct progressivity, we mean that a Hospital A, whose uncompensated care was twice as great a share of cost as Hospital B, would receive double the share of cost from the uncompensated care pool. That would be very large change from current practice, as is now shown. Exhibit 6 shows the Nominal Payment Amount (NPA) for each hospital as a share of nominal need, measured at cost. It displays the very flat slope of the relation between NPA and nominal need.
Exhibit 6
Nominal Payment Amount for Uncompensated Care as % of Uncompensated Care at Cost, 2010
0.0%
10.0%
20.0%
30.0%
40.0%
50.0%
60.0%
70.0%
80.0%
1 7 13 19 25 31 37 43 49 55 61 67 73 79 85 91 97 103 109 115 121 127 133 139 145 151 157 163 169 175

15
Exhibit 7 divides the hospitals among four categories. Over four-fifths of New York State hospitals’ NPA share of nominal need ranged between 53.0% and 62.9%. Again—a very flat slide.
Exhibit 7
The Current Sliding Scale Is Not as Steep as It Might Seem
Nominal Payment Amount (NPA) as Percentage of Need (Cost of a Hospital’s Own Uncompensated Care as a Share of Cost, as Measured for the 90% Formula)
Number of Hospitals
Percent of Hospitals
0 to 52.9% 7 3.9% 53.0% to 62.9% 147 82.1% 63.0% to 72.9% 23 12.8% 73.0 % and above 2 1.1% All hospitals 179 99.9%
Note: Percentages do not sum to 100.0% owing to rounding errors.
It is interesting to note that hospitals’ need as a share of cost varies much more than does NPA as a share of need, as shown in Exhibit 8. Specifically, the coefficient of variation for need as a share of cost was 65.0%, while the coefficient of variation of NPA as a share of need was only 19.8%. (The coefficient of variation is the standard deviation across all 179 hospitals divided by the mean across 179. It is sometimes called the relative standard deviation. A higher CoV means higher relative dispersal or spread of a variable.)
Exhibit 8
Uncompensated Care Need as % of Cost versus Nominal Payment Amount as % of Uncompensated Care at Cost, 2010
0.0%
10.0%
20.0%
30.0%
40.0%
50.0%
60.0%
70.0%
80.0%
0.0% 2.0% 4.0% 6.0% 8.0% 10.0% 12.0% 14.0% 16.0%
Need % of cost
NP
A %
Un
co
mp
en
sa
ted
Ca
re a
t C
os
t

16
4. The data challenge—how to obtain needed data in usable form that will allow calculation of a reasonable benchmark, quantifying volumes of care provided across services, and assessing alternative sliding scale or progressivity methods? We have gone through three phases.23 a. Compiling data in-hand from various photocopy, scanned, and clean .pdf files, and converting these into Excel spreadsheets to permit analysis. Software to perform this (without keying in all of the data afresh) was identified and obtained. Although using this software still required a considerable amount of time to yield clean Excel files, this was much quicker and much more accurate than re-keying the data. b. We learned from various sources that DoH spreadsheets with complete data were available, and undertook to obtain them. This we did gradually and with some success. c. We then inquired whether DoH had and could share complete spreadsheets including the distribution methods, how values were actually calculated (spreadsheet formulas), and also the underlying data on volumes of inpatient and outpatient care and the Medicaid rates and other factors determining the actual distributions of uncompensated care pool dollars.

17
C. ACTUAL DISTRIBUTIONS OF UNCOMPENSATED CARE POOL DOLLARS IN NEW YORK STATE, 2005 – 2010
In 2010, the $847 million in uncompensated care funds were distributed unevenly across regions of the state and across teaching and non-teaching hospitals. This is not surprising. Data on the distributions of the $847 million are presented in Exhibit 9 – A. Almost one-fifth of distributions went to non-teaching hospitals, over one-third to minor teaching hospitals, and almost one-half to major teaching hospitals that are members of the Council of Teaching Hospitals of the American Association of Medical Colleges.24 Almost three-fifths of the funds were distributed to hospitals in New York City; in five regions, hospitals received between three and four percent of the funds.
Exhibit 9 – A
Distribution of Uncompensated Care Dollars in 2010 by Region of State and Hospital Teaching Status,
All 200 Hospitals NYPHRM region Non-teaching Minor Teaching Major
(COTH) teaching
All hospitals % of state-wide
1 Long Island $6,147,637 $46,848,884 $35,352,703 $88,349,224 10.4%2 N. Y. City $16,813,956 $185,140,815 $301,164,613 $503,119,384 59.4%3 North. Metro. $62,737,276 $23,645,102 $18,919,384 $105,301,762 12.4%4 Northeast $19,197,793 $7,455,331 $5,067,711 $31,720,835 3.7%5 Utica/ W’town $17,372,546 $6,939,113 $3,476,216 $27,787,875 3.3%6 Central $12,343,906 $11,340,628 $8,327,241 $32,011,775 3.8%7 Rochester $7,267,022 $13,379,444 $7,673,718 $28,320,184 3.3%8 Western $13,233,796 $16,839,901 $0 $30,073,697 3.6%
Statewide $155,113,932 $311,589,218 $379,981,586 $846,684,735 100.0%% of statewide 18.3% 36.8% 44.9% 100.0%
Exhibit 9 – B displays the number of hospitals in each region of the state, sorted by teaching status. A comparison of exhibits 9 – A and 9 – B reveals that the distribution of uncompensated care dollars does not closely parallel the location and type of hospital. Again, that is not surprising. Hospitals in some regions are larger than others. Some hospitals provide more uncompensated care than others. And other factors influencing the distribution of the $847 million—such as input costs, case mix, and prices paid for care—affect some hospitals more than others. Exhibit 9 – C shows estimated 2008 population by region along with 2008 hospital discharges by region. As might be expected, discharges more closely parallel allocations of uncompensated care dollars than does population.

18
Exhibit 9 – B
Count of New York State Hospitals in 2010 by Region of State and Hospital Teaching Status,
All 200 Hospitals
NYPHRM region Non-teaching
Teaching Major (COTH) teaching
All hospitals
% of statewide
1 Long Island 4 13 4 21 10.5%2 New York City 8 19 27 54 27.0%3 Northern Metro. 29 4 2 35 17.5%4 Northeast 13 3 1 17 8.5%5 Utica/Watertown 18 3 1 22 11.0%6 Central 9 4 2 15 7.5%7 Rochester 8 3 1 12 6.0%8 Western 17 7 0 24 12.0%
Statewide 106 56 38 200 100.0%% of statewide 53.0% 28.0% 19.0%
Exhibit 9 – C
Population and Acute Hospital Discharges by Region of State, 2008 25
NYPHRM Region PopulationTotal
Discharges
Long Island 14.7% 14.6%New York City 42.9% 47.3%Northern Metro 12.3% 10.7%Northeast 6.4% 5.8%Utica/Watertown 4.7% 3.8%Central 5.8% 5.6%Rochester 5.4% 5.1%Western 7.8% 7.2%
New York State 100.0% 100.0%
Appendix Exhibit 1 presents the actual dollar uncompensated care distributions to individual New York State hospitals from 2005 through 2010.26 Generally, the appendix exhibits report considerable detail on individual hospitals. This detail includes actual distributions of uncompensated care in recent years, provision of the four types of care in recent years, and also affects of the various methods of distributing uncompensated care in 2010.

19
D. ACTUAL PROVISION OF UNCOMPENSATED CARE BY NEW YORK STATE HOSPITALS, 2007 - 2009 Care provided in 2008 influences distribution of uncompensated care funds in 2010, two years later. That is, provision of uncompensated care, as reported by New York State hospitals on their institutional cost reports, influences the distribution of uncompensated care funds for the pool year that comes two years after care is provided. This two-year lag allows time for hospitals to complete their reports, for DOH to audit some aspects of those multi-hundred-page reports, and for DOH to prepare to accurately implement the fairly detailed and complex rules established by state legislation to govern the distribution of funds. (As noted in Part A, this audit does not, and probably can not, reach levels of detail adequate to validate hospital reports of uncompensated care.) Additionally, because the uncompensated care pool funds are considered Medicaid Disproportionate Share funds by the federal government, payments to hospitals must not exceed caps established by federal law and regulation. A 2007 DOH report found that in 2004, “only 6 hospitals had their Indigent Care distribution reduced due to the DSH cap for 2004, which resulted in a gross impact of $13.2 million.” 27 1. How much uncompensated care did hospitals provide in 2008? We provide two types of information to address this question. First, we provide the breakdown of acute inpatient discharges, ER visits, regular
clinic visits, and ambulatory surgery by region and type of hospital for all 200 New York State hospitals for 2008. As always, the phrase “all 200” refers to non-profit and public hospitals (including the state’s 21 major public hospitals. And it refers to all teaching and non-teaching hospitals in all eight regions of the state.
Second, to provide some comparisons over time, we provide a hospital-by-hospital
breakdown of actual volumes of the four types of service, for the various years, 2006 through 2008, for which the relevant data are now available. This detailed hospital-by-hospital information is presented in Appendix Exhibit 2 – A and 2 – B.
Exhibit 10 – A – 1 displays the provision of uncompensated care discharges by New York State hospitals in 2008, by region and type of hospital. Non-teaching hospitals provide about one-fifth of the discharges. Teaching hospitals provide about one-third. And major teaching hospitals provide almost one-half of the discharges. It’s noteworthy that those major teaching hospitals located in New York City clearly provided a disproportionate share of the care. This deserves a closer look, particularly since a large share of these are also major public hospitals. Exhibit 10 – A – 2 examines each hospital type’s uncompensated care discharges as a percentage of total discharges. This might be called “relative effort.” The large inter-

20
region and other differences largely disappear. It’s noteworthy, though, that hospitals in the Northern Metro region show the highest level of relative effort in serving uncompensated care patients. There’s no systematic difference in relative effort by teaching status. Not surprisingly, at the 21 major public hospitals across the state 5.1 percent of discharges were categorized as uncompensated, more than double the 2.3 percent share at all other hospitals. (These data are not displayed in a separate exhibit.) All major public hospitals in New York City (excepting Coler and Goldwater) are major teaching hospitals and provide care for a large portion of the uninsured patients served in new York City.
Exhibit 10 – A – 1
Provision of Uncompensated Care Discharges by 200 New York State Hospitals, 2008
NYPHRM region Non-teaching
Teaching Major (COTH) teaching
All hospitals
% of statewide
1 Long Island 912 4,398 5,228 10,538 14.8%2 New York City 438 9,729 23,665 33,832 47.6%3 Northern Metro. 5,966 1,496 1,758 9,220 13.0%4 Northeast 1,934 905 666 3,505 4.9%5 Utica/Watertown 1,691 857 288 2,836 4.0%6 Central 1,146 1,319 1,095 3,560 5.0%7 Rochester 673 1,663 797 3,133 4.4%8 Western 1,339 3,067 0 4,406 6.2%
Statewide 14,099 23,434 33,497 71,030 100.0%% of statewide 19.8% 33.0% 47.2% 100.0%
Exhibit 10 – A – 2
Uncompensated Care Discharges as Share of Total Discharges by 200 New York State Hospitals, 2008
NYPHRM region Non-
teaching Teaching Major (COTH)
teaching All
hospitals
1 Long Island 3.3% 2.3% 3.6% 2.9% 2 New York City 0.8% 4.1% 2.7% 3.0% 3 Northern Metro. 2.8% 5.8% 5.0% 3.4% 4 Northeast 2.6% 1.9% 2.1% 2.3% 5 Utica/Watertown 3.3% 2.1% 2.9% 2.8% 6 Central 2.5% 2.0% 3.1% 2.4% 7 Rochester 2.7% 2.6% 2.0% 2.4% 8 Western 2.1% 2.4%
Statewide 2.5% 3.0% 2.8% 2.8%

21
Exhibits 10 – B – 1 and 10 – B – 2 display the provision of uncompensated ER visits. Exhibit 10 – B – 1 shows a pattern of concentration of care in New York City that is even more dramatic than was found for uncompensated care discharges, particularly for major COTH teaching hospitals. Almost three-fifths of all uncompensated care ER visits statewide were provided by hospitals in New York City. Again, it is worth recalling that the major public hospitals are included throughout this Exhibit – 10 series of data.
Exhibit 10 – B – 1
Provision of Uncompensated Care ER Visits by 200 New York State Hospitals, 2008
NYPHRM region Non-teaching
Teaching Major (COTH) teaching
All hospitals
% of statewide
1 Long Island 8,995 57,448 41,879 108,322 9.8%2 New York City 5,932 161,579 478,080 645,591 58.5%3 Northern Metro. 85,796 21,384 12,661 119,841 10.9%4 Northeast 29,459 11,791 6,556 47,806 4.3%5 Utica/Watertown 27,082 24,863 1,369 53,314 4.8%6 Central 17,225 15,881 10,238 43,344 3.9%7 Rochester 10,066 16,863 7,100 34,029 3.1%8 Western 19,317 32,483 0 51,800 4.7%
Statewide 203,872 342,292 557,883 1,104,047 100.0%% of statewide 18.5% 31.0% 50.5% 100.0%
Exhibit 10 – B – 2 shows that fully 18% of ER visits to hospitals in New York City in 2008 were by patients whose care was considered uncompensated. The statewide average was one visit in seven. The uncompensated share of ER visits rises with teaching status.
Exhibit 10 – B – 2
Uncompensated Care ER Visits as a Share of Total ER Visits by 200 New York State Hospitals, 2008
NYPHRM region Non-teaching
Teaching Major (COTH) teaching
All hospitals
1 Long Island 8.8% 10.6% 14.1% 11.5% 2 New York City 8.4% 16.4% 18.9% 18.0% 3 Northern Metro. 13.8% 19.9% 17.9% 15.0% 4 Northeast 9.0% 11.3% 9.7% 9.6% 5 Utica/Watertown 11.1% 20.8% 6.4% 13.9% 6 Central 9.3% 10.8% 9.7% 9.9% 7 Rochester 8.7% 10.2% 8.1% 9.2% 8 Western 8.0% 8.7% 8.4%
Statewide 10.7% 13.4% 17.6% 14.5%

22
Again, it is worth noting that fully 27.3 percent of ER visits to the 21 major public hospitals were considered uncompensated in 2008, more than double the 11.9 percent at all other hospitals (data not shown in a separate exhibit). Exhibits 10 – C, and 10 – D also reveal substantially disproportionate provision of uncompensated general clinic care and of ambulatory surgery by hospitals in New York City. Data glitches preclude calculations of uncompensated care percentages of total care by region or type of hospital.
Exhibit 10 – C
Provision of Uncompensated Care Clinic Visits by 200 New York State Hospitals, 2008
NYPHRM region Non-teaching
Teaching Major (COTH) teaching
All hospitals
% of statewide
1 Long Island 8,728 33,573 65,266 107,567 5.8%2 New York City 10,109 90,653 1,203,728 1,304,490 70.2%3 Northern Metro. 59,212 14,993 12,968 87,173 4.7%4 Northeast 41,612 21,219 60 62,891 3.4%5 Utica/Watertown 39,824 27,616 20,007 87,447 4.7%6 Central 20,708 36,831 24,041 81,580 4.4%7 Rochester 6,504 66,909 6,065 79,478 4.3%8 Western 16,674 31,457 0 48,131 2.6%
Statewide 203,872 342,292 557,883 1,104,047 100.0%% of statewide 18.5% 31.0% 50.5% 100.0%
Exhibit 10 – D
Provision of Uncompensated Care Ambulatory Surgery by 200 New York State Hospitals, 2008
NYPHRM region Non-
teaching Teaching Major (COTH)
teaching All
hospitals % of
statewide
1 Long Island 181 1,293 2,586 4,060 8.2%2 New York City 2,485 3,943 26,948 33,376 67.4%3 Northern Metro. 1,893 302 786 2,981 6.0%4 Northeast 961 996 92 2,049 4.1%5 Utica/Watertown 1,093 282 552 1,927 3.9%6 Central 925 754 504 2,183 4.4%7 Rochester 333 533 130 996 2.0%8 Western 740 1,237 0 1,977 4.0%
Statewide 8,611 9,340 31,598 49,549 100.0%% of statewide 17.4% 18.9% 63.8% 100.0%

23
2. Breakdown of volumes of uncompensated care, 2006 – 2008 by individual hospital We have compiled data on the provision of the four types of uncompensated care for each individual hospital for 2006, 2007, and 2008. Data for all three years are available for discharges and ER visits; these are presented in Part A of Appendix Exhibit 2. We have data only for 2007 and 2008 for regular clinic visits and for ambulatory surgery; these are presented in Part B of Appendix Exhibit 2. Hospitals vary enormously in their reported provision of uncompensated care. Also, some hospitals report fairly stable provision of uncompensated care over time, but others report very wide year-to-year fluctuations. The latter raise questions about the accuracy of some hospitals’ reports.
24
E. DISTRIBUTION OF UNCOMPENSATED CARE FUNDS in 2010 AND ACTUAL VOLUMES OF CARE in 2008—Excluding Major Public Hospitals In this section, we describe current allocations of the $707.7 million in uncompensated care funds to the 179 hospitals other than major publics. We contrast these allocations with how the funds would be allocated under the CARE method, the strict money-follows-the-patient method. We do so statewide, modeling free movement of funds across hospitals and regions. We also illustrate how money would move only within regions, holding regions harmless from any loss (or gain) in uncompensated care funds from the 2010 actual levels. In the later case, funds move only among the non-major-public hospitals within a given region. To describe current allocations and contrast them with allocations under the CARE method, we combine the information on distribution of uncompensated care funds in 2010 with information on the actual volumes of care provided by different hospitals in 2008. (The 2008 care volumes are used to calculate the distribution of uncompensated care funds in 2010. A two-year lag prevails at all times.) 1. Focus here on 179 hospitals—excluding major public hospitals. We focus in this section on the $707,659,495—83.5 percent of the $847 million uncompensated care pool that currently flows to the 179 non-major-public hospitals. We do so for two reasons. The first is that, in the short run, it might be more feasible in the short run to consider
changes in the distribution of uncompensated care pool among these 179 hospitals. (As noted earlier, the formulas for distributing the $847 million in uncompensated care funds examined in this report have long capped the dollars that can flow to the 21 major public hospitals at 16.5 percent of the total, or $139,336,454.)
The second is that New York State does currently distribute other funds, not part of
the $847 million examined here, to help finance the costs of uncompensated care provided by the 21 major public hospitals. As noted earlier, those other funds are partly federal Medicaid DSH dollars matched mainly by city and county funds.
2. Subsequent examination of all hospitals together. In section G, we will examine ways of distributing the entire $847 million uncompensated care pool among all 200 New York State hospitals, eliminating the long-standing wall between uncompensated care payments to various types of hospitals. We do that for two reasons. First, as noted earlier, if the 2010 Affordable Care Act (ACA) is implemented as planned, the number of uninsured people and the amount of uncompensated care will shrink substantially. The ACA therefore provides for a substantial reduction in Medicaid disproportionate share funds, which help to finance a very large share of the special

25
uncompensated care payments to major public hospitals, outside the $847 million uncompensated care pool. In one respect, that reduction is logical in light of the ACA’s improvement in coverage. But, second, the residual need for uncompensated care for people who remain uninsured will still be considerable, and it is very reasonable to expect that a great share of that care will be provided by major public hospitals. It is therefore vital to freely examine statewide allocations of the $847 million because major public hospitals consistent provide very large shares of the actual volumes of uncompensated care given by hospitals in New York State. In 2008, for example, as shown in Exhibit 11, they provided 25.3 percent of uninsured discharges, 31.4% of ER visits, 55.5 percent of regular clinic visits, and 43.7 percent of ambulatory surgery procedures. The large share of regular clinic visits may be particularly salient, since these can be vital to preventing unnecessary hospital admissions, and because many of these visits are for follow-up specialty care, which can be in short supply to many uninsured patients. Major public hospitals’ provision of uncompensated care far exceeded their share of statewide hospital costs, 18.8 percent. That provision also far exceeds their share of the uncompensated care pool, 16.5 percent.
Exhibit 11
Shares of Statewide Volumes of Uncompensated Care in Four Types of Services Provided by Major Public and other Hospitals, New York State, 2008
3. Comparison by region and teaching status of actual volumes of uncompensated care in 2008 with distributions of the $707.7 million in uncompensated care pool funds in 2010 We begin by comparing distribution of uncompensated care funds with actual volumes of care provided for four services: inpatient discharges, ER visits, general or routine clinic visits, and ambulatory surgery procedures.
Share of care provided by Type of care 21 major public hospitals 179 other hospitals
Acute discharges 25.3% 74.7%ER visits 31.4% 68.6%General clinic visits 55.5% 44.5%Ambulatory surgery procedures
43.7% 43.7%
Total reported cost, 2010 18.8% 81.2%Share of $847 million pool 16.5% 83.5%

26
As noted earlier, these four types of services accounted for almost 90 percent of the total value of uncompensated care provided by New York State hospitals in 2008, as measured at each hospital’s own Medicaid rate for each service. In Appendix Exhibit 3, we provide these data for each of the 179 hospitals. Actual uncompensated care distributions are in the first column of data, followed by uncompensated hospital discharges, ER visits, clinic visits, and ambulatory surgery procedures. We then add a sixth column of information in Appendix Exhibit 3. This is the CARE measure of the combined value of the four types of uncompensated care services that each hospital actually provided in 2008. Since each hospital receives only one payment annually, in some relation to all of the uncompensated care it provided two years earlier, it is useful to have one measure of the volume of care—to compare with the one annual payment. As discussed earlier, it is important to be able to add across the four main types of uncompensated care services to come up with one measure of the volume of care provided in a given year by a given hospital. To do this, we calculated the statewide weighted mean Medicaid rate prevailing in 2010 for each of the four types of services. It’s useful to think of this as the average Medicaid rate paid statewide in 2010, across all hospitals and all patients. If we added all Medicaid payments for acute inpatient care for all Medicaid patients discharged in 2010, and divided that sum by the number of Medicaid patients discharged, that figure would be the weighted mean Medicaid rate prevailing in 2010. We then calculated this combined measure of volume of care actually provided by each hospital by multiplying each hospital’s uncompensated care discharges in 2008 by the statewide weighted mean Medicaid rate prevailing in 2010. We did the same for ER visits, regular clinic visits, and ambulatory surgery procedures. We then summed these four products to yield one combined measure of care actually provided. For convenience, we call this the CARE measure. We will compare CARE actually provided by each hospital with the uncompensated care payments distributed by state law to each hospital. Then, for inpatient care only, we will analyze the uninsured patient discharges as a share of all patient discharges in 2008 among hospitals. Allocations by region and teaching status. Exhibit 12 – A now shows the distribution of CARE by region and teaching status in 2010. It is useful to contrast Exhibit 12 – A with the data in Exhibit 12 – B, which shows the actual distribution of the $707.7 million in uncompensated care dollars to hospitals other than major public hospitals in 2010. CARE, which reflects actual volumes of services valued at statewide weighted mean Medicaid rates, would have directed less money to teaching hospitals and to New York City hospitals than did the actual distribution.
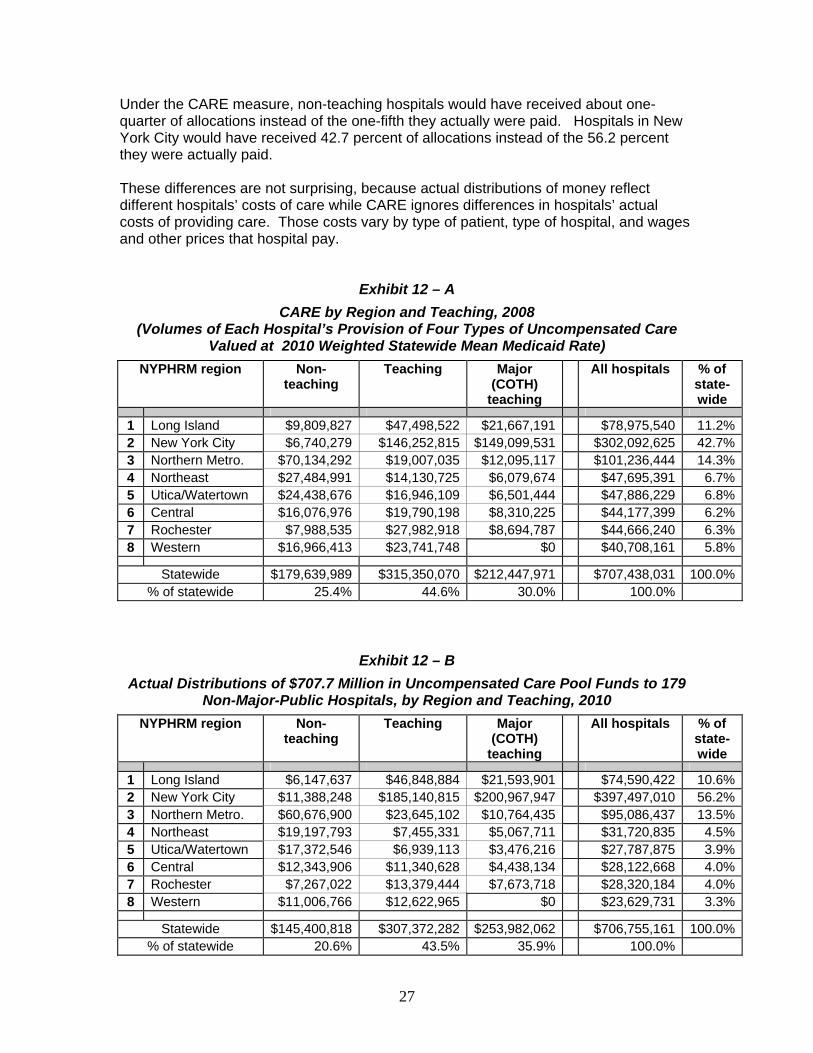
27
Under the CARE measure, non-teaching hospitals would have received about one-quarter of allocations instead of the one-fifth they actually were paid. Hospitals in New York City would have received 42.7 percent of allocations instead of the 56.2 percent they were actually paid. These differences are not surprising, because actual distributions of money reflect different hospitals’ costs of care while CARE ignores differences in hospitals’ actual costs of providing care. Those costs vary by type of patient, type of hospital, and wages and other prices that hospital pay.
Exhibit 12 – A
CARE by Region and Teaching, 2008 (Volumes of Each Hospital’s Provision of Four Types of Uncompensated Care
Valued at 2010 Weighted Statewide Mean Medicaid Rate)
NYPHRM region Non-teaching
Teaching Major (COTH)
teaching
All hospitals % of state-wide
1 Long Island $9,809,827 $47,498,522 $21,667,191 $78,975,540 11.2%2 New York City $6,740,279 $146,252,815 $149,099,531 $302,092,625 42.7%3 Northern Metro. $70,134,292 $19,007,035 $12,095,117 $101,236,444 14.3%4 Northeast $27,484,991 $14,130,725 $6,079,674 $47,695,391 6.7%5 Utica/Watertown $24,438,676 $16,946,109 $6,501,444 $47,886,229 6.8%6 Central $16,076,976 $19,790,198 $8,310,225 $44,177,399 6.2%7 Rochester $7,988,535 $27,982,918 $8,694,787 $44,666,240 6.3%8 Western $16,966,413 $23,741,748 $0 $40,708,161 5.8%
Statewide $179,639,989 $315,350,070 $212,447,971 $707,438,031 100.0%% of statewide 25.4% 44.6% 30.0% 100.0%
Exhibit 12 – B
Actual Distributions of $707.7 Million in Uncompensated Care Pool Funds to 179 Non-Major-Public Hospitals, by Region and Teaching, 2010
NYPHRM region Non-teaching
Teaching Major (COTH)
teaching
All hospitals % of state-wide
1 Long Island $6,147,637 $46,848,884 $21,593,901 $74,590,422 10.6%2 New York City $11,388,248 $185,140,815 $200,967,947 $397,497,010 56.2%3 Northern Metro. $60,676,900 $23,645,102 $10,764,435 $95,086,437 13.5%4 Northeast $19,197,793 $7,455,331 $5,067,711 $31,720,835 4.5%5 Utica/Watertown $17,372,546 $6,939,113 $3,476,216 $27,787,875 3.9%6 Central $12,343,906 $11,340,628 $4,438,134 $28,122,668 4.0%7 Rochester $7,267,022 $13,379,444 $7,673,718 $28,320,184 4.0%8 Western $11,006,766 $12,622,965 $0 $23,629,731 3.3%
Statewide $145,400,818 $307,372,282 $253,982,062 $706,755,161 100.0%% of statewide 20.6% 43.5% 35.9% 100.0%

28
To help compare the allocations by the two different methods, we summarized the data originally presented in exhibits 12 – A and 12 – B two different ways. First, Exhibit 12 – C compares the two methods by region, ignoring teaching status. It is clear that all regions—excepting New York City—receive slightly to substantially more money when dollars are distributed in proportion to volumes of CARE provided than they do under the Actual uncompensated care allocations for 2010.
Exhibit 12 – C
Comparison of Allocation by CARE and by Actual Distribution, $707.7 Million for 179 Non-Major Public Hospitals,
by Region, 2010
CARE Actual
NYPHRM region $ % of state-wide
$ % of state-wide
1 Long Island $78,975,540 11.2% $74,590,422 10.6% 2 New York City $302,092,625 42.7% $397,497,010 56.2% 3 Northern Metro. $101,236,444 14.3% $95,086,437 13.5% 4 Northeast $47,695,391 6.7% $31,720,835 4.5% 5 Utica/Watertown $47,886,229 6.8% $27,787,875 3.9% 6 Central $44,177,399 6.2% $28,122,668 4.0% 7 Rochester $44,666,240 6.3% $28,320,184 4.0% 8 Western $40,708,161 5.8% $23,629,731 3.3%
Statewide $707,438,031 100.0% $706,755,161 100.0%
Second, Exhibit 12 – D summarizes the data originally presented in exhibits 12 – A and 12 – B by teaching status, this time ignoring the regions. The non-teaching hospitals do substantially better under the CARE formula than under the Actual allocation method. In Section F, we will explore the effects of different allocations in greater detail.
Exhibit 12 – D
Comparison of Allocation by CARE and by Actual Distribution, $707.7 Million for 179 Non-Major Public Hospitals,
by Teaching Status, 2010
CARE Actual $ % of state-wide $ % of state-wide

29
Non-teaching $179,639,989 25.4% $145,400,818 20.6%Teaching $315,350,070 44.6% $307,372,282 43.5%Major (COTH) tchng. $212,447,971 30.0% $253,982,062 35.9%
Statewide $707,438,031 100.0% $706,755,161 100.0%
We then graphically compared cumulative payments that would have been made to hospitals under the CARE method with the payments Actually made in 2010. Exhibit 12 – E displays the results. The gap between the cumulative payment line and the equality line shows the extent to which Actual payments departed from CARE. To this extent, the Actual distribution of money failed to follow the patient. But CARE does not reflect either of two considerations. One is progressivity or use of a sliding scale. This would channel more money to hospitals exerting themselves more strenuously on behalf of (providing greater shares of their care to) uninsured patients. This is addressed shortly. The other consideration is legitimate differences in hospital input costs and in patient severity of illness. This is taken up in the next section.
Exhibit 12 - E
Cumulative CARE vs. Cumulative ACTUAL, 2010
$0
$100,000,000
$200,000,000
$300,000,000
$400,000,000
$500,000,000
$600,000,000
$700,000,000
$800,000,000
$0 $100,000,000 $200,000,000 $300,000,000 $400,000,000 $500,000,000 $600,000,000 $700,000,000 $800,000,000
CUMULATIVE CARE
CU
MU
LA
TIV
E A
CT
UA
L
Data are sorted by Cumulative dollars to hospitals according to CARE, paired with cumulative dollars to hospitals according to ACTUAL. This line graphs those pairs of data for all 179 hospitals.
EQUALITY LINE--WHERE CARE = ACTUAL
When this line is above the equality line, cumulative ACTUAL exceedscumulative CARE

30
The method of constructing the cumulative CARE and Actual figures in Exhibit 12 – E is not intuitively obvious. To help explain this, Exhibit 12 – F displays a portion of the data table that was used. It includes the first 29 of the 179 hospitals. The hospital are listed by dollars that would have been distributed by the CARE method, from highest to lowest. First, we placed the allocations of the $707.7 million according to the CARE method in column (1) and the Actual allocations in column (4). The hospital names are included in the left-hand column to make the data more imageable. The data were sorted by CARE, such that the first hospital listed was the hospital receiving the most money under the CARE method. That would have been Jamaica Hospital. We then calculated the cumulative payments under CARE to each hospital plus all others appearing higher up on the list. This information appears in column (2). So, for example, the cumulative payments under CARE (column 2) on the line for Montefiore Hospital included the payments to Jamaica plus the payments to Montefiore. That is, each hospital’s line includes its own payments plus those of all hospitals listed previously. We did this for all 179 non-major-public hospitals. We then repeated this for the Actual allocations in column (4). Cumulative actual payments appear in column (3). We then created a scattergram of the two sets of cumulative payments, CARE and Actual, from columns (2) and (3). That scattergram is the jagged line in Exhibit 12 – E.
Exhibit 12 – F
Constructing the Cumulative CARE vs. Cumulative ACTUAL and Similar Exhibits
CARE CUMULATIVE CARE
CUMULATIVE ACTUAL
ACTUAL
Benchmark Calculations (1) (2) (3) (4)
Jamaica Hospital $29,851,598 $29,851,598 $34,640,623 $34,640,623Montefiore Hospital & Med Ctr $20,525,733 $50,377,331 $57,929,639 $23,289,016St Luke’s - Roosevelt Hosp Ctr $19,429,237 $69,806,568 $83,042,075 $25,112,436St Barnabas Hospital $18,578,884 $88,385,452 $105,601,781 $22,559,706Bronx Lebanon Hospital-Fulton Div $17,694,816 $106,080,268 $150,259,977 $44,658,196Rochester General Hospital $15,691,295 $121,771,563 $158,319,174 $8,059,197Staten Island Univ. Hospital - N + S $14,670,927 $136,442,489 $166,549,981 $8,230,807North Shore University Hospital $13,679,279 $150,121,768 $183,202,291 $16,652,310Mount Sinai Hospital $13,271,439 $163,393,207 $196,749,559 $13,547,268Sound Shore Med Ctr Westchester $12,095,117 $175,488,324 $207,513,994 $10,764,435Maimonides Medical Center $11,986,112 $187,474,436 $222,463,405 $14,949,411Flushing Hosp and Med Ctr $11,665,871 $199,140,307 $230,041,640 $7,578,235New York-Presbyterian Hospital $10,999,793 $210,140,101 $250,393,018 $20,351,378Faxton - St Luke’s Health Care $10,504,119 $220,644,219 $252,865,673 $2,472,655Long Island Jewish-Hillside Med Ctr $9,861,620 $230,505,839 $261,650,128 $8,784,455Brookdale Hospital Med Ctr $9,529,521 $240,035,360 $284,778,778 $23,128,650Wyckoff Heights Hospital $9,326,913 $249,362,273 $293,479,766 $8,700,988New York Hospital Med Ctr Queens $9,120,953 $258,483,226 $301,108,618 $7,628,852

31
Lutheran Medical Center $8,858,006 $267,341,232 $335,585,174 $34,476,556Brookhaven Memorial Hospital $8,846,734 $276,187,966 $342,953,820 $7,368,646Orange Regional Medical Center $8,834,869 $285,022,835 $344,906,967 $1,953,147Strong Memorial Hospital $8,694,787 $293,717,621 $352,580,685 $7,673,718Vassar Brothers Hospital $8,672,571 $302,390,193 $357,708,022 $5,127,337St Vincent’s Hospital and Med Ctr $8,523,493 $310,913,686 $360,959,057 $3,251,035St Josephs Hospital Yonkers $8,477,452 $319,391,138 $369,565,310 $8,606,253United Health Services, Inc $8,310,225 $327,701,363 $374,003,444 $4,438,134Winthrop University Hospital $7,987,913 $335,689,276 $378,945,035 $4,941,591New York Methodist H of Brooklyn $7,904,353 $343,593,629 $383,037,024 $4,091,989Glens Falls Hospital $7,491,232 $351,084,861 $387,044,564 $4,007,540
4. Which hospitals are affected if hospitals are held harmless by region? An illustrative analysis. We now offer an analysis to illustrate the effects on hospitals of moving money only within one region. That is, supposing that the CARE formula were applied to reallocated uncompensated care payments within one region, which hospitals would benefit and which would be harmed. Clearly, it would be most interesting to perform this analysis within region 2, New York City. That’s because this region showed the largest dollar gap in allocations under the current Actual method and the CARE method. This analysis is performed in three main steps. a. In the first, we compare New York City hospitals on their (still excluding the city’s 14 major public hospitals) Actual versus CARE allocations. As shown in Exhibit 12 C, hospitals in the city actually received $397.5 million, or 56.2 percent of the statewide total. Under the CARE allocation, they would have received $302.1 million, or 42.7 percent of the statewide total, for a drop of $95.4 million (24 percent). b. We then take each New York City hospital’s share of the regional total of $302.1 million in allocations according to CARE. (It’s worth noting that 40 of New York City’s 54 hospitals are involved in this analysis; the remaining 14 are major public hospitals.) c. We note each hospital’s percentage of CARE and apply this figure to the Actual regional total allocation of $397.5 million. We call this allocation CARE-Act. We then compare the allocation to each hospital according to CARE-Act with the Actual Allocation and note the intra-hospital differences. We also note movement of money by teaching status. The results of this analysis are presented in Exhibit 12 – G.

32
Exhibit 12 – G
Illustration of Hold Harmless Allocation to New York City (Excluding Major Public Hospitals): Apply CARE Proportions of CARE Regional Total of $302.1M to Actual 2010 Total Allocation of $395.1M
Gains/Losses Gains/Losses as % of
Actual
Opcert Hospital Name CARE
($302.1M)
Actual 2010 Allocation of $397.5M by
90+10 Model
Apply Share of Regional CARE
$302.1M to Actual
($397.5M)
CARE $302.1M
minus $ Actual
CARE $397.5M minus $ Actual
CARE $302.1M minus $ Actual
CARE $397.5M minus $ Actual
7000001 Bronx-Lebanon H. Ctr. $17,694,816 $44,658,196 $23,283,045 (26,963,380) (21,375,151) -60.4% -47.9% 7000006 Montefiore H. + M.C. $20,525,733 $23,289,016 $27,008,000 (2,763,283) 3,718,984 -11.9% 16.0% 7000011 Calvary Hospital $0 $686,321 $0 (686,321) (686,321) -100.0% -100.0% 7000014 St Barnabas Hospital $18,578,884 $22,559,706 $24,446,313 (3,980,822) 1,886,607 -17.6% 8.4% 7000025 NY Westchester Square M C $2,345,308 $1,028,580 $3,085,984 1,316,728 2,057,404 128.0% 200.0% 7001002 Brookdale Hosp M C $9,529,521 $23,128,650 $12,539,055 (13,599,129) (10,589,595) -58.8% -45.8% 7001003 Brooklyn Hospital $6,374,712 $4,612,165 $8,387,921 1,762,547 3,775,756 38.2% 81.9% 7001008 New York Community / Brooklyn $1,094,862 $630,656 $1,440,632 464,206 809,976 73.6% 128.4% 7001017 Long Island College Hospital $6,048,771 $6,153,303 $7,959,044 (104,532) 1,805,741 -1.7% 29.3% 7001019 Lutheran Medical Center $8,858,006 $34,476,556 $11,655,468 (25,618,550) (22,821,088) -74.3% -66.2% 7001020 Maimonides Medical Center $11,986,112 $14,949,411 $15,771,467 (2,963,299) 822,056 -19.8% 5.5% 7001021 NY Methodist H of Brooklyn $7,904,353 $4,091,989 $10,400,640 3,812,364 6,308,651 93.2% 154.2% 7001024 Episcopal Health Services, Inc $2,266,668 $1,765,807 $2,982,508 500,861 1,216,701 28.4% 68.9% 7001033 Kingsbrook Jewish M C $3,857,872 $1,504,177 $5,076,233 2,353,695 3,572,056 156.5% 237.5% 7001035 Wyckoff Heights Hospital $9,326,913 $8,700,988 $12,272,461 625,925 3,571,473 7.2% 41.0% 7001041 Beth Israel M C - Kings Hwy Div $1,226,387 $1,291,175 $1,613,695 (64,788) 322,520 -5.0% 25.0% 7001046 Interfaith Medical Center $4,102,999 $12,917,697 $5,398,774 (8,814,698) (7,518,923) -68.2% -58.2% 7002000 New York D'town $5,532,677 $6,531,943 $7,279,961 (999,266) 748,018 -15.3% 11.5% 7002002 Beth Israel Medical Center $4,765,312 $13,372,697 $6,270,253 (8,607,385) (7,102,444) -64.4% -53.1% 7002012 Hospital for Special Surgery $0 $966,032 $0 (966,032) (966,032) -100.0% -100.0% 7002017 Lenox Hill Hospital $4,348,605 $7,653,348 $5,721,945 (3,304,743) (1,931,403) -43.2% -25.2%

33
Exhibit 12 – G (Continued)
Illustration of Hold Harmless Allocation to New York City (Excluding Major Public Hospitals): Apply CARE Proportions of CARE Regional Total of $302.1M to Actual 2010 Total Allocation of $395.1M
Gains/Losses Gains/Losses as % of
Actual
Opcert Hospital Name CARE
($302.1M)
Actual 2010 Allocation of $397.5M by
90+10 Model
Apply Share of Regional CARE
$302.1M to Actual
($397.5M)
CARE $302.1M
minus $ Actual
CARE $397.5M minus $ Actual
CARE $302.1M minus $ Actual
CARE $397.5M minus $ Actual
7002020 Memorial H. for Cancer $2,073,721 $7,708,682 $2,728,627 (5,634,961) (4,980,055) -73.1% -64.6% 7002024 Mount Sinai Hospital $13,271,439 $13,547,268 $17,462,714 (275,829) 3,915,446 -2.0% 28.9% 7002026 New York Eye+Ear Infirmary $3,478,869 $1,913,494 $4,577,537 1,565,375 2,664,043 81.8% 139.2% 7002031 Rockefeller University Hospital $0 $42,834 $0 (42,834) (42,834) -100.0% -100.0% 7002032 St Luke’s / Roosevelt H. Center $19,429,237 $25,112,436 $25,565,217 (5,683,199) 452,781 -22.6% 1.8% 7002037 St Vincent’s Hospital $8,523,493 $3,251,035 $11,215,312 5,272,458 7,964,277 162.2% 245.0% 7002052 North General Hospital $2,262,560 $1,602,560 $2,977,103 660,000 1,374,543 41.2% 85.8% 7002053 NY University Med Ctr $1,218,101 $5,195,446 $1,602,792 (3,977,345) (3,592,654) -76.6% -69.2% 7002054 New York Presbyterian H. $10,999,793 $20,351,378 $14,473,657 (9,351,585) (5,877,721) -46.0% -28.9% 7003001 Flushing H. and Medical Center $11,665,871 $7,578,235 $15,350,089 4,087,636 7,771,854 53.9% 102.6% 7003003 Jamaica Hospital $29,851,598 $34,640,623 $39,279,082 (4,789,025) 4,638,459 -13.8% 13.4% 7003004 Long Island Jewish-Hillside $9,861,620 $8,784,455 $12,976,035 1,077,165 4,191,580 12.3% 47.7% 7003006 Peninsula Hospital Center $2,968,420 $1,547,764 $3,905,881 1,420,656 2,358,117 91.8% 152.4% 7003010 New York Medical Ctr of Queens $9,120,953 $7,628,852 $12,001,456 1,492,101 4,372,604 19.6% 57.3% 7003013 Forest Hills - North Shore $3,173,233 $1,848,759 $4,175,377 1,324,474 2,326,618 71.6% 125.8% 7003015 Mount Sinai H. of Queens $5,334,013 $4,909,036 $7,018,557 424,977 2,109,521 8.7% 43.0% 7004003 Staten Island University H. $14,670,927 $8,230,807 $19,304,177 6,440,120 11,073,370 78.2% 134.5% 7004010 Richmond University Medical $7,137,456 $7,484,123 $9,391,548 (346,667) 1,907,425 -4.6% 25.5%
Totals $301,409,816 $396,346,200 $396,598,562 -94,936,384 252,362 -24.0% 0.1% Note: Totals are slightly off because one hospital was originally mis-classified by region, requiring small corrections.

34
CARE’s effects. As shown in Exhibit 12 – G, the statewide allocation of uncompensated care dollars by the care method has pronounced consequences for New York City hospitals (region 2). The overall loss would have been 24.0 percent or about $95 million annually—from $396 million to about $301 million. Twenty of 39 hospitals see reduced allocations under CARE—that is, less money than they receive under Actual allocations. A few hospitals, mainly those with small allocations, lose all of their uncompensated care funds. That’s almost certainly because they had not been providing any of the four services that were used to create the CARE measure. A number of major teaching hospitals, such as New York Presbyterian and NYU Medical Center suffer substantial losses as they had previously been paid in ways that recognized their higher prices; CARE does not do so because it prices all services at the statewide weighted mean Medicaid price across all hospitals and patients. A number of hospitals with high levels of uncompensated care, such as Jamaica Hospital, suffer moderate reductions. Others, such as Lutheran, Bronx-Lebanon, and Interfaith—suffer very heavy losses, measured both in dollars and in percentage of Actual allocations. CARE, hold harmless. As would be expected, CARE’s effects are substantially modulated by application of the regional hold-harmless principle. If New York Cty (region 2) hospitals continue to receive about $396 million in uncompensated care funds, and if these funds are allocated in accord with hospitals share of the regional total—as measured by CARE, only 12 of 39 hospitals receive less money than under Actual allocations. Major teaching hospitals generally continue to lose money, but their losses are attenuated. Jamaica Hospital now receives more money than was Actually allocated. Lutheran, Bronx-Lebanon, and Interfaith see only small reductions in their losses, compared with Actual allocations. Summary of changes by teaching status As shown in Exhibit 12 – H, non-teaching hospitals lose $4.6 million (40.8 percent) when CARE allocates without a hold harmless rule and $2.5 million (22.1 percent) under a regional hold harmless rule. Teaching hospitals lose $38.4 million (20.9 percent) when CARE allocates instead of the Actual allocation and without a hold harmless rule, but they gain $7.6 million (4.1 percent) under a regional hold harmless rule.

35
Major teaching hospitals suffer the greatest dollar loss when CARE is used to allocated uncompensated care funds instead of the Actual allocation. This is true whether CARE entails movement of money across regions ($51.9 million loss and 25.8 percent) or whether the hold harmless rule is in effect ($4.8 million loss and 2.4 percent).
Exhibit 12 – H
Comparison of Actual, CARE, and CARE Hold-harmless Allocations among New York City Hospitals by Teaching Status, 2008
Major Public Hospitals Are Excluded
Teaching Status (number of hospitals)
Actual CARE scaled to $301M
CARE scaled to $396M
(regional hold harmless)
CARE @$301M - Actual
CARE @$396M -
Actual
Non-teaching (6) $11,388,248 $6,740,279 $8,868,937 $(4,647,969) $(2,519,310)
Teaching (18) $183,990,005 $145,570,005 $191,542,716 $(38,419,999) $7,552,711
Major teaching (15) $200,967,947 $149,099,532 $196,186,907 $(51,868,415) $(4,781,039)
All hospitals (39) $396,346,200 $301,409,816 $396,598,561 $(94,936,384) $252,362
Percentage change from
actual
Non-teaching (6) -40.8% -22.1%Teaching (18) -20.9% 4.1%Major teaching (15) -25.8% -2.4%All hospitals (39) -24.0% -------
The hold harmless approach can be applied to alternative methods of allocation other than CARE. Those particularly include BASE and the various sliding scale measures.

36
F. IMPROVING THE FAIRNESS OF UNCOMPENSATED CARE PAYMENTS TO 179 HOSPITALS IN NEW YORK STATE—Excluding Major Public Hospitals—MONEY FOLLOWS PATIENTS PLUS STEEPER SLIDING SCALES TO RECOGNIZE REAL BURDENS OF GREATER EFFORT 1. Introduction. Section F now continues Section E’s focus on the 179 New York State hospitals that are not major public hospitals. We begin by comparing the effects of different allocation methods on the 179 hospitals other than major publics. We do so first by grouping hospitals by region and by teaching status, and second by reporting on presenting data on individual hospitals. To allow straightforward apples – apples comparisons, each method of allocation is applied to (or scaled to) the full $707.7 million available to the 179 non-major-public hospitals out of the $847 million distributed in 2010 under the methods examined in this report. That is, each method is shown as if it had been used to distribute the entire $707.7 million among the 179 non-major-public hospitals in New York State. This allows us to see the effects of the different methods using one uniform scale. For example, we show the effects of the 10 percent method, as if it had it been used to allocate the entire $707.7 million. This makes it easy to compare its effects with the effects of allocating that entire sum using the 90 percent method, CARE, BASE, or other methods. Occasionally, the totals will depart from the $707.7 million total by small sums, typically less than one-half of one percent. This seems to be caused by small shifts in the internal composition of payments by type of service (inpatient acute discharges, ER visits, general clinic visits, and ambulatory surgery procedures). 2. Five different allocation methods will be presented in this standard sequence:
a. Actual Allocation, 90%+10% b. Actual 90% allocation c. Actual 10% allocation d. CARE alone and with sliding scales e. BASE alone and with sliding scales
a. Uncompensated care dollars paid to the 179 hospitals in 2010. This is the actual distribution of dollars following the 90 percent and 10 percent methods combined. Each method is plagued by several problems. These include payment for bad debt and difficulty in documenting care delivery. b. Allocation as if the 90 percent method had governed distribution of the full $707.7 million. This is the method strongly criticized by the 2008 NYS DOH Report on the Hospital Indigent Care Pool,28 CPHS, and others. These were summarized earlier in Section A-2.

37
c. Allocation using the 10 percent method only. Essentially, this entails valuing uncompensated care at actual units of care reported by the hospital, multiplied by the Medicaid rate paid to that hospital. This 10 percent method prescribes an allocation very similar to that of the main reform method proposed by the 2008 NYS DOH Report. We question whether Medicaid rates are appropriate ways to value uncompensated care. Volumes of care should include services provided to uninsured lower-income patients only. d. Allocation as if CARE had governed distribution of the uncompensated care pool’s $707.7 million. The CARE method reflects the simplest and purest money-follows-patient principle because it multiplies each hospital’s actual provision of each of the four main types of uncompensated care (discharges, ER visits, regular clinic visits, and ambulatory surgery procedures) by the weighted statewide mean Medicaid rate in effect in 2010 for each type of care. CARE is a very good measure of the actual volumes of uncompensated care provided by a particular hospital. But it has five possible distinct shortcomings as a method of payment.
1. Because it ignores hospitals’ reported costs, it redistributes substantial sums away from hospitals with high reported costs.
2. It ignores inter-hospital differences Medicaid prices. 3. It ignores any differences in hospitals costs of providing care, both costs
stemming from differences in input prices—for people, electricity, and everything else hospitals purchase.
4. CARE ignores differences in hospital costs stemming from the severity of illness of patients treated.
5. It does not consider the greater burden of provision of uncompensated care services on hospitals that provide greater shares of uncompensated care—or of care to Medicaid patients.
For accounting and other reasons discussed in Section A-2, we are not very concerned about failure to rely on hospitals’ own reported costs. Reported costs are a shaky foundation on which to build a $847 million uncompensated care structure. Incorporating differences in Medicaid prices is appropriate to the degree that they reflect differences in input costs and in patient case mix that are relevant and appropriate to paying hospitals for uncompensated care. The BASE formula attempts to do just that. Acknowledging and paying hospitals more money to cover greater cost burdens associated with devoting greater shares of their services to uncompensated care is entirely appropriate. That’s why New York State applied the NPA formula to the bulk of the 90 percent allocations. But the NPA formula has little actual effect, as we will see shortly. e. Allocation by the BASE formula. Like the 10 percent and CARE formulas, BASE begins with actual volumes of the four types of uncompensated care provided by each hospital in 2008.
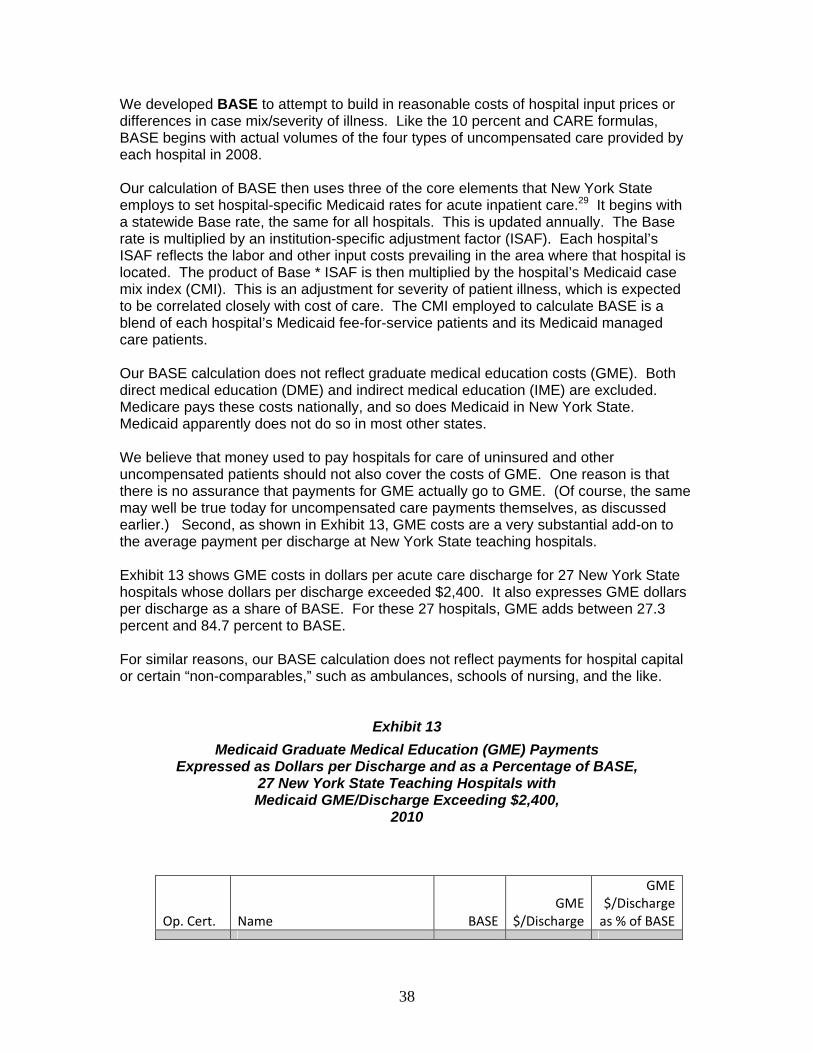
38
We developed BASE to attempt to build in reasonable costs of hospital input prices or differences in case mix/severity of illness. Like the 10 percent and CARE formulas, BASE begins with actual volumes of the four types of uncompensated care provided by each hospital in 2008. Our calculation of BASE then uses three of the core elements that New York State employs to set hospital-specific Medicaid rates for acute inpatient care.29 It begins with a statewide Base rate, the same for all hospitals. This is updated annually. The Base rate is multiplied by an institution-specific adjustment factor (ISAF). Each hospital’s ISAF reflects the labor and other input costs prevailing in the area where that hospital is located. The product of Base * ISAF is then multiplied by the hospital’s Medicaid case mix index (CMI). This is an adjustment for severity of patient illness, which is expected to be correlated closely with cost of care. The CMI employed to calculate BASE is a blend of each hospital’s Medicaid fee-for-service patients and its Medicaid managed care patients. Our BASE calculation does not reflect graduate medical education costs (GME). Both direct medical education (DME) and indirect medical education (IME) are excluded. Medicare pays these costs nationally, and so does Medicaid in New York State. Medicaid apparently does not do so in most other states. We believe that money used to pay hospitals for care of uninsured and other uncompensated patients should not also cover the costs of GME. One reason is that there is no assurance that payments for GME actually go to GME. (Of course, the same may well be true today for uncompensated care payments themselves, as discussed earlier.) Second, as shown in Exhibit 13, GME costs are a very substantial add-on to the average payment per discharge at New York State teaching hospitals. Exhibit 13 shows GME costs in dollars per acute care discharge for 27 New York State hospitals whose dollars per discharge exceeded $2,400. It also expresses GME dollars per discharge as a share of BASE. For these 27 hospitals, GME adds between 27.3 percent and 84.7 percent to BASE. For similar reasons, our BASE calculation does not reflect payments for hospital capital or certain “non-comparables,” such as ambulances, schools of nursing, and the like.
Exhibit 13
Medicaid Graduate Medical Education (GME) Payments Expressed as Dollars per Discharge and as a Percentage of BASE,
27 New York State Teaching Hospitals with Medicaid GME/Discharge Exceeding $2,400,
2010
Op. Cert.
Name BASE
GME $/Discharge
GME $/Discharge as % of BASE

39
7000006 Montefiore Medical Center $7,354 $4,517 61.4%
7002012 Hospital For Special Surgery $14,166 $4,498 31.8%
7001016 Kings County Hospital Center $5,951 $4,407 74.1%
7002024 Mount Sinai Hospital $9,531 $4,395 46.1%
7002009 Harlem Hospital Center $5,136 $4,350 84.7%
7002001 Bellevue Hospital Center $6,768 $4,218 62.3%
7002053 NYU Hospitals Center $10,499 $3,910 37.2%
5957001 Westchester Medical Center $10,891 $3,878 35.6%
7001037 State Univ Hosp / Downstate $7,205 $3,745 52.0%
7000002 Jacobi Medical Center $6,311 $3,716 58.9%
7002054 NY Presbyterian Hospital $8,551 $3,666 42.9%
7000001 Bronx‐Lebanon Hospital Ctr $5,620 $3,566 63.5%
3301007 Univ Hosp SUNY Hlth Sci Ctr $8,107 $3,373 41.6%
7003004 Long Island Jewish $7,871 $3,329 42.3%
5151001 Univ Hosp At Stony Brook $7,494 $3,219 43.0%
2701005 Strong Memorial Hospital $8,528 $3,192 37.4%
7002021 Metropolitan Hospital Center $4,419 $3,155 71.4%
7002032 St Luke’s / Roosevelt Hosp $7,408 $3,118 42.1%
7001046 Interfaith Medical Center $6,512 $2,901 44.6%
7002002 Beth Israel Medical Center $6,545 $2,744 41.9%
2951001 North Shore University Hosp $9,439 $2,740 29.0%
7001002 Brookdale Hospital Med Ctr $6,532 $2,685 41.1%
7001045 Woodhull Medical $4,753 $2,665 56.1%
1401005 Erie County Medical Center $9,146 $2,540 27.8%
7002017 Lenox Hill Hospital $8,997 $2,460 27.3%
7000014 St Barnabas Hospital $5,284 $2,449 46.4%
7000008 Lincoln Medical $5,182 $2,441 47.1% 3. The sliding scale We have applied various sliding scales to the CARE and BASE allocations. First, we applied New York State’s method currently used to attempt to build a measure of progressivity into the 90 percent Actual allocation formula. To do so, we applied the state’s own formula to CARE and then to BASE. These are called CARE-NPA and BASE-NPA, respectively. To do this work, we first scaled up each hospital’s CARE and BASE allocations so that their statewide totals equaled the statewide sum of hospitals’ own reported costs of uncompensated care as a percentage of cost. In other words, we scaled CARE up to reported costs, statewide, and then did the same for BASE. We then applied the NYS DOH’s own formulas for calculating the sliding scale. This was done separately for targeted need percentages below and above 4.0 percent of

40
costs; this corresponds to state statute, which separates high-need hospitals, those with targeted needs exceeding 4.0 percent of costs. As discussed in Section B-3, and as will be seen shortly, applying the statutory formula had very little effect on actual allocations. As noted earlier, this happens for two reasons. The first is that the progressive scale is applied only to marginal percentages of hospital uncompensated care effort. And the second is that the statutory coverage ratios for the sliding scale make for a very shallow slope. They range only from 65 percent of costs between 0.5 percent and 2.0 percent to 100 percent of uncompensated care costs exceeding 8 percent of total costs.30 Initially, we expected that making the sliding scale steeper would have substantial effects in allocating more money to hospitals devoting greater shares of their total costs to uncompensated care, and thereby recognizing and helping to cover more of those greater costs. We built two steeper sliding scales. In each, we started with the state’s own statutory allocations and changed the percentages of each slice of uncompensated care costs (as shares of total costs). We consider this question in two ways. The first was to consider the effects of three alternative methods of allocating hospital free care using the current statutory formula and two steeper versions of it. The second way was to abandon the current approach to the sliding scale and instead distribute funds in simple proportion to CARE or BASE, scaled up to hospitals’ own reported total statewide uncompensated care costs, as a share of total costs of hospital care. a. The three sliding scale methods using or building on the statutory formula are
1. Application to the current targeted need percentages and Statutory Coverage Ratios to each hospital’s CARE (actual volumes of the four types of care, priced at statewide weighted mean Medicaid rates) as a share of actual inpatient plus outpatient cost, as used in the current uncompensated care allocations for the 90% Model. In other words, we substituted our calculated CARE for each hospital in place of each hospital’s reported costs of uncompensated care, as used for the 90% Model.
2. Retaining the current targeted need percentages but substituting the STEEPER-
A coverage ratios.
3. Retaining the current targeted need percentages but substituting the STEEPER-B coverage ratios.
Results of the applying the three methods to CARE are presented in Exhibit 5-Modified. It is important to note that, in each case, we relied on the New York State Department of Health’s Model of calculating the sliding scale, a part of the 90% Model. In the NPA method, we simply substituted CARE (scaled up to total statewide uncompensated care costs) for reported costs and then applied the state’s formula.

41
In Steeper-A and Steeper-B, we edited the state’s formula, substituting the steeper coverage ratios shown in Exhibit 5, Modified. We relied on the state’s formula for two reasons: first, to ensure consistency and second because the calculation in Excel is far from easy. All three methods retain the state’s nine-part division of need as a percentage of cost. After dividing hospital need for uncompensated care revenue into nine slices of need measured as a percentage of cost, a rising coverage ratio can be applied to the slices of need that are greater percentages of cost. In a sense, this approach rewards hospitals with greater uncompensated care revenue when they devote greater shares of their total costs to uncompensated care. This nine-part division was first shown in Exhibit 5. The nine categories of targeted need as a percentage of cost and are repeated here in the first column of Exhibit 5 – Modified, below. Also repeated is the column of Statutory Coverage Ratios associated with each of the nine slices of need as a percentage of cost. In Exhibit 5, Modified, we present two steeper coverage ratios, each starting with a lower coverage ratio than the Statutory Coverage Ratio at lower need as a percentage of costs. So, for example, the Steeper-A coverage ratio assigns a 65 percent coverage ratio to targeted need, as a share of cost between 0.5% and 2.0%, and the Steeper-B coverage ratio assigns a 25% coverage ratio to that slice. The current statutory coverage ratio is 65%.
Exhibit 5, Modified 31
Calculation of Nominal Payment Amount and Distribution
Coverage Ratio
Targeted Need Percentage of Costs
Statutory Coverage Ratio
STEEPER-A
STEEPER-B
0% to <0.5% * 60% 0% 0%0.5% to <2% 65% 40% 20%2% to <3% 70% 50% 35%3% to <4% 75% 60% 50%4% to <5% 80% 70% 65%5% to <6% 85% 80% 80%6% to <7% 90% 90% 95%7% to <8% 95% 95% 105%8% and above 100% 100% 110%
* Although the NYS DOH indicates at statutory coverage ratio of 60 percent for uncompensated care dollars ranging between 0% and 0.5% of costs, the state does not pay hospitals for uncompensated care costs within that range.

42
b. Substituting average provision for sliding percentages of slices The new sliding scale method abandons the state’s current statutory formula—and its steeper cousins—with their shallow slopes. This discards the current pattern of recognizing rising marginal slices of uncompensated care shares with rising percentage coverage ratios. We call this new method STEEP. The new method is simply to apply each hospital’s uncompensated care costs, taken as a percentage of its total costs, to its entire uncompensated care provision. This entails abandoning the current application of rising coverage ratios to different slices of targeted need as a percentage of costs. It entails allocating uncompensated care in direct proportion to each hospital’s uncompensated care percentage of total cost. The resulting allocations are, of course, then scaled to $847 million. (And, for analyses such as the present, that exclude the major public hospitals, the resulting allocations are re-scaled to $707.7 million.) 4. Comparison of five core methods of allocation among the eight regions Exhibit 14 – A summarizes the allocations among the eight regions in accord with the five main allocation methods. Again, please note that All allocations are standardized to equal the actual 2010 allocation to the 179
hospitals (excluding major public hospitals) of $707.7 million. This allows straightforward comparisons of the effects of the different methods—if they were to govern the allocation of the entire $707.7 million.
It is possible to design allocation methods that combine three main elements in
different ways The core allocation method itself—90 percent, 10 percent, CARE, or
BASE, With or without one of the sliding scales of various slopes—NPA,
Steeper-A, Steeper-B, and STEEP, and With or without the constraint of a regional hold-harmless limit.
The first striking result for most regions is the great similarity in allocation according to the 90 percent method and the 10 percent method. The 10 percent method was hailed by some as a substantial reform, but it does not result in the movement of very large sums of money among the regions.

43
(Although there is not much difference between the 90 percent and 10 percent methods within most regions, many individual hospitals are treated very differently by the two methods. This can be seen in Exhibit 16, which includes a column of data labeled “Ratio of 90% to 10%.” Hospitals with a ratio below 0.9 fare better under the 10 percent formula, and the lower the ratio the better they fare under the 10 percent formula. Hospitals with a ratio above 0.9 fare better under the 90 percent formula.) The Northern Metro region stands out in its loss of just over $8 million, about one-twelfth, if the 10 percent method were substituted for the 90 percent method. The Northeast region, though, would gain over 10 percent and the Western region would gain almost 20 percent. A great difference arises between allocations by the CARE method and Actual allocations. Compared to the Actual 90%+10% allocation, CARE drops uncompensated care payments to New York City hospitals by about $90 million, or 24 percent. The remaining seven regions enjoy increases ranging from just under 10 percent to over 50 percent. As noted earlier, CARE rests on volumes of care valued at statewide mean prices; it ignores differences in input costs and severity of illness of patients treated. Allocations by the BASE method fall half-way between those of the Actual 90+10 method and those of the CARE method. That is not surprising. BASE incorporates Medicaid’s ISAF measure of wage and other input costs for individual hospitals, and also each hospital’s Medicaid case mix index, a measure of severity of illness (and expected cost) of patients treated.
Exhibit 14 – A
Summary Results of Five Methods of Allocation among Eight New York State Regions, 2010
$ Millions
Method of Allocation
Region Actual 90+10 Actual 90 Actual 10 CARE BASE
1 Long Island $74.6 $74.8 $72.8 $79.0 $89.12 New York City $397.5 $397.7 $397.1 $302.1 $346.13 Northern Metro. $95.7 $96.5 $88.4 $101.5 $91.74 Northeast $31.7 $31.3 $35.5 $47.7 $38.45 Utica/Watertown $27.8 $27.7 $28.6 $47.9 $34.96 Central $28.1 $28.2 $27.6 $44.2 $33.97 Rochester $28.3 $28.1 $30.0 $44.7 $40.48 Western $23.6 $23.2 $27.7 $40.7 $33.1 Statewide $707.3 $707.7 $707.7 $707.7 $707.7
Exhibit 14 – B displays the percentage allocations of the $707.7 million across the eight regions according to the same five measures. It is a convenient way to summarize effects of the five methods.

44
Exhibit 14 – B
Five Methods’ Percentage Allocations among Eight New York State Regions, 2010
Method of Allocation
Region Actual 90+10 Actual 90 Actual 10 CARE BASE
1 Long Island 10.5% 10.6% 10.3% 11.2% 12.6%
2 New York City 56.2% 56.2% 56.1% 42.7% 48.9%
3 Northern Metro. 13.5% 13.6% 12.5% 14.3% 13.0%
4 Northeast 4.5% 4.4% 5.0% 6.7% 5.4%
5 Utica/Watertown 3.9% 3.9% 4.0% 6.8% 4.9%
6 Central 4.0% 4.0% 3.9% 6.2% 4.8%
7 Rochester 4.0% 4.0% 4.2% 6.3% 5.7%
8 Western 3.3% 3.3% 3.9% 5.8% 4.7%
Statewide 100.0% 100.0% 100.0% 100.0% 100.0% 5. Summary of five methods’ percentage allocation by teaching status Exhibit 14 – C displays the allocation of uncompensated care funds to non-teaching hospitals, teaching hospitals, and major teaching hospitals by the five methods, across the entire state. Three findings are noteworthy. First, the 90 percent and 10 percent methods again yield strikingly and surprisingly similar results. Second, as would be expected, CARE boosts payments to non-teaching hospitals substantially over Actual levels. Non-teaching hospitals may well have lower input costs and also less severely ill and less costly-to-treat patients. Somewhat surprisingly, teaching hospitals’ share rises very slightly above the Actual share. But, as would be expected, major teaching hospitals’ share drops sharply. Third, allocations by teaching status according to BASE very closely resemble Actual allocations. It would have been hard to predict this. Even major teaching hospitals would receive very close to their Actual allocations. It would have been very reasonable to expect that exclusion of GME costs from the price of acute inpatient care—almost one-half of total uncompensated care dollars would have resulted in a pronounced drop in major teaching hospitals’ share.
Exhibit 14 – C
Five Methods’ Percentage Allocations by Teaching Status, 2010
Method of Allocation Actual 90+10 90 percent 10 percent CARE BASE
Non-teaching 20.6% 20.8% 19.3% 25.4% 20.7%Teaching 43.5% 43.5% 43.0% 44.6% 42.0%
Major (COTH) teaching 35.9% 35.7% 37.8% 30.0% 37.3%All 100.0% 100.0% 100.0% 100.0% 100.0%

45
6. Allocations by the various sliding scales We apply various sliding scales to the BASE method and compare the results with those of other methods of allocating uncompensated care funds across regions, across teaching status, and across individual hospitals. Exhibit 15 – A recapitulates the five methods of allocating funds just discussed. It then presents results of the application of four sliding scales to the BASE method. Application of New York State’s statutory NPA method to BASE allocations resulted in very little movement of money across regions. Movement of money across hospitals is equally small, as will be shown. Applications of the successively sharper Steeper-A and Steeper-B methods to BASE allocations also typically have small effects. The one exception is the Northern Metro region which, for some reason we have not yet been able to analyze, sees a visible rise in allocations with each successive rise in the slope of the sliding scale. Application of the STEEP formula to BASE has a pronounced effect on allocations across the regions, even compared with Base + Steeper-A. Northern Metro gains 27 percent , Utica/Watertown gains 11 percent, and New York City gains 4 percent. But the remaining five regions suffer losses of between 15 and 25 percent.
Exhibit 15 – A
Comparison of Nine Methods of Allocating Uncompensated Care Funds: Effects across New York State Regions, 2010
($ millions)
Region Actual 90+10
Actual 90
Actual 10 CARE BASE
BASE NPA
BASE Steepe
r-A
BASE Steepe
r-BBASE
STEEP
1 Long Island $74.6 $74.8 $72.8 $79.0 $89.1 $87.2 $87.6 $87.4 $74.42 New York City $397.5 $397.7 $397.1 $302.1 $346.1 $347.3 $342.9 $339.6 $352.93 Northern Metro. $95.7 $96.5 $88.4 $101.5 $91.7 $97.5 $100.5 $103.8 $131.74 Northeast $31.7 $31.3 $35.5 $47.7 $38.4 $36.9 $36.5 $35.9 $28.85 Utica/Watertown $27.8 $27.7 $28.6 $47.9 $34.9 $35.7 $36.6 $37.5 $41.56 Central $28.1 $28.2 $27.6 $44.2 $33.9 $32.4 $32.4 $32.3 $24.27 Rochester $28.3 $28.1 $30.0 $44.7 $40.4 $38.9 $38.9 $38.8 $29.88 Western $23.6 $23.2 $27.7 $40.7 $33.1 $31.8 $32.2 $32.3 $24.3 Statewide $707.3 $707.7 $707.7 $707.7 $707.7 $707.7 $707.7 $707.7 $707.7
In another sense, the BASE STEEP method is somewhat conservative. That it, it moves most regional totals closer to the Actual method now in force. Under BASE STEEP, six regions are within 15 percent of their Actual allocations. Utica/ Watertown and Northern Metro are big winners, at 49 percent and 38 percent, respectively. (Please refer to Exhibit 15 – B. Exhibit 15 – C complements Exhibit 15 – B by displaying the percentage of statewide distribution of uncompensated care among the eight regions according to the nine

46
methods of allocation first presented in Exhibit 15 – A. New York City drops from 56 percent of the statewide total by Actual allocations to 50 percent by BASE STEEP. As would be expected, application of BASE STEEP has profound effects on many individual hospitals, particularly those whose uncompensated care, measured by BASE, is much greater or much smaller than the statewide average. The hospital-specific data will be presented shortly.
Exhibit 15 – B
Comparison of Changes in Allocating Uncompensated Care Funds across Regions: Comparisons of Actual 90+10, CARE, BASE, and BASE-STEEP Methods
Difference as Percentage
of Actual 90+10
Region Actual 90+10 CARE BASE
BASE STEEP CARE BASE
BASE STEEP
1 Long Island $74.6 $79.0 $89.1 $74.4 5.9% 19.5% -0.2%2 New York City $397.5 $302.1 $346.1 $352.9 -24.0% -12.9% -11.2%3 Northern Metro. $95.7 $101.5 $91.7 $131.7 6.0% -4.1% 37.7%4 Northeast $31.7 $47.7 $38.4 $28.8 50.4% 20.9% -9.4%5 Utica/Watertown $27.8 $47.9 $34.9 $41.5 72.3% 25.7% 49.3%6 Central $28.1 $44.2 $33.9 $24.2 57.1% 20.6% -13.9%7 Rochester $28.3 $44.7 $40.4 $29.8 57.7% 42.7% 5.3%8 Western $23.6 $40.7 $33.1 $24.3 72.3% 40.0% 2.9% Statewide $707.3 $707.7 $707.7 $707.7 -- -- --
Exhibit 15 – C
Nine Methods’ Percentage Allocations among Eight New York State Regions, 2010
Percentage of allocations
Region Actual 90+10
Actual 90
Actual 10 CARE BASE
BASE NPA
BASE Steepe
r-A
BASE Steepe
r-B BASE
STEEP 1 Long Island 10.5% 10.6% 10.3% 11.2% 12.6% 12.3% 12.4% 12.4% 10.5%2 New York City 56.2% 56.2% 56.1% 42.7% 48.9% 49.1% 48.5% 48.0% 49.9%3 Northern Metro. 13.5% 13.6% 12.5% 14.3% 13.0% 13.8% 14.2% 14.7% 18.6%4 Northeast 4.5% 4.4% 5.0% 6.7% 5.4% 5.2% 5.2% 5.1% 4.1%5 Utica/Watertown 3.9% 3.9% 4.0% 6.8% 4.9% 5.0% 5.2% 5.3% 5.9%6 Central 4.0% 4.0% 3.9% 6.2% 4.8% 4.6% 4.6% 4.6% 3.4%7 Rochester 4.0% 4.0% 4.2% 6.3% 5.7% 5.5% 5.5% 5.5% 4.2%8 Western 3.3% 3.3% 3.9% 5.8% 4.7% 4.5% 4.6% 4.6% 3.4% Statewide 100.0% 100.0% 100.0% 100.0% 100.0% 100.0% 100.0% 100.0% 100.0%

47
Allocations of uncompensated care dollars by teaching status across the nine methods differ substantially. As shown in Exhibit 15 – D, non-teaching hospitals garner very close to 20 percent of statewide uncompensated care funds by eight methods. Only CARE treats them more generously. That’s not surprising, given CARE’s lack of any input price or patient severity adjustment. Teaching hospitals receive very close to 43 percent of funds by all method excepting BASE STEEP, which provides them with 54 percent of statewide dollars. Major COTH teaching hospitals receive close to 36 percent of funds by all methods by two. CARE pays them 30 percent and BASE STEEP pays them only 27 percent of statewide dollars. Both teaching hospitals and major COTH teaching hospitals are concentrated in New York City.
Exhibit 15 – D
Nine Methods’ Percentage Statewide Allocations by Teaching Status, 2010
Teaching status Actual 90+10
Actual 90
Actual 10 CARE BASE
BASE NPA
BASE Steepe
r-A
BASE Steepe
r-BBASE
STEEP
Non-teaching 20.6% 20.8% 19.3% 25.4% 20.7% 20.6% 20.9% 21.1% 20.0%Teaching 43.5% 43.5% 43.0% 44.6% 42.0% 43.7% 44.4% 45.2% 53.5%Major (COTH) tchng. 35.9% 35.7% 37.8% 30.0% 37.3% 35.7% 34.7% 33.7% 26.5% All 100.0% 100.0% 100.0% 100.0% 100.0% 100.0% 100.0% 100.0% 100.0%
Exhibits 15 – E and 15 – F now present detailed allocations and percentage allocations according to BASE STEEP by both region and teachings status. This detailed look will tie in with the presentation of allocations by four main methods to individual hospitals in Exhibit 16.
Exhibit 15 – E
BASE STEEP Dollar Allocations by Region and Teaching Status, 2010
Teaching Status
Region Non-teaching TeachingMajor (COTH)
teaching All
New York City $4.0 $221.5 $127.5 $352.9Northern Metro. $62.2 $47.0 $22.5 $131.7Northeast $16.5 $8.1 $4.2 $28.8Utica/Watertown $23.4 $13.6 $4.4 $41.5Central $9.4 $10.3 $4.6 $24.2Rochester $3.9 $20.0 $5.9 $29.8Western $10.4 $13.9 $0.0 $24.3 Statewide $141.6 $378.5 $187.6 $707.7

48
Exhibit 15 – F
Percentage Allocations by BASE STEEP by Region and Teaching Status, 2010
Teaching Status
Region Non-teaching TeachingMajor (COTH)
teaching All
Long Island 1.7% 6.2% 2.6% 10.5%
New York City 0.6% 31.3% 18.0% 49.9%
Northern Metro. 8.8% 6.6% 3.2% 18.6%
Northeast 2.3% 1.1% 0.6% 4.1%
Utica/Watertown 3.3% 1.9% 0.6% 5.9%
Central 1.3% 1.5% 0.7% 3.4%
Rochester 0.5% 2.8% 0.8% 4.2%
Western 1.5% 2.0% 0.0% 3.4%
Statewide 20.0% 53.5% 26.5% 100.0%

49
7. A fair and reasonable allocation method a. We recommend moving to allocate uncompensated care dollars among the 179 non-major public hospitals in New York State by the BASE STEEP method. We have several reasons for making this recommendation. Some have to do with deficiencies in alternative allocation methods; others have to do with the strengths of BASE STEEP. First, the Actual allocations are governed overwhelmingly by the discredited 90 percent formula. 32 Second, the 10 percent reform formula proposed by the 2008 NYS DOH report strongly resembles the 90 percent formula in its allocations by region and teaching status. Differences at the individual hospital level are more substantial, as shown shortly in Exhibit 16. Still, the 10 percent formula gives excessive weight to Medicaid prices—prices that reward major teaching hospitals with excessive GME payments that should not originate from a fund to finance uncompensated care. Third, the CARE formula is purely volume-driven. Paying hospitals for CARE’s version of uncompensated care would have the money exclusively follow the patient—with no allowance for inter-hospital differences in input costs or in patient severity of illness. These deserve some recognition. To fail to do so could deter some hospitals from sustaining their uncompensated care or undermine their capacity to provide such care. Fourth, BASE generally pays hospitals at a level between that of Actual and CARE. That’s because BASE acknowledges and depends heavily on volumes of care provided (as does CARE) but also recognizes wage rates in a hospital’s area and other input costs, along with severity of illness of a hospital’s patients. It multiplies actual inpatient acute volumes by a modified version of Medicaid price per discharge in effect in 2010 (excluding GME and capital), and outpatient volumes by Medicaid prices in effect in 2010. Fifth, BASE STEEP builds on BASE by rewarding hospitals that devote a higher percentage of cost to uncompensated care (measured by BASE percent of cost) and by making less generous payments than did BASE to hospitals that devote a lower percentage of cost to uncompensated care. Sixth, BASE STEEP therefore reflects CPHS’s two policies, as discussed in Section A-1. The first is that uncompensated care payments should follow the uninsured lower-income patient. The second is that hospitals devoting greater shares of their caregiving to uncompensated care services should be paid by more generous standards. BASE STEEP also recognizes what we believe to be legitimate differences in hospitals’ costs of providing uncompensated care—the ISAF recognizes differences in input prices, and the blended CMI acknowledges differences in the severity of illness of inpatients. Seventh, alternative sliding scales—such as the statutory NPA, Steeper-A, and Steeper-B—do very little to make allocations more progressive. That is, they do little to bestow

50
higher uncompensated care allotments on hospitals that exert themselves heavily on behalf of uninsured patients. b. The option of gradual change. Movement to BASE STEEP could be phased in over perhaps five years. To do so, it could be blended with a combination of Actual allocations, with Actual diminishing in weight over time and BASE STEEP growing in weight. Some would argue that this is desirable in order to buffer hospitals from sharp and substantial changes in their revenue. (A phased approach did, for example, govern the introduction of Medicare's DRG-based prospective payment system starting in 1983.) Others would argue for a phased approach on political grounds. Possibly, though, the state has missed the opportunity to phase in these changes. With federal health reform scheduled for implementation in 2014, and with the potential for greater loss of federal DSH funds if uncompensated care dollars are not appropriately allocated, the implementation may have to be much less gradual than many would desire. Similarly, movement to BASE STEEP could be combined with a regional hold-harmless provision. In this way, initially, BASE STEEP might be used only to move money among the hospitals of one region. Subsequently, inter-region movement would be gradually introduced until, after perhaps five years, BASE STEEP would govern allocations throughout the state. It is possible that a phased approach would have been more feasible in the recent past than it is today. Passage of the 2010 health reform law and the threat of loss of Medicaid DSH funds may require more urgent action. c. Effects of the four allocation methods on New York State’s 179 non-major-public hospitals. Exhibit 16 now presents the allocations of uncompensated care dollars to New York State’s 200 hospitals for 2010 according to four different methods: Actual total allocation (by 90 percent method plus 10 percent method) CARE BASE BASE STEEP
Exhibit 16 also presents the ratio of allocations by the 90 percent formula to allocations by the 10 percent formula. This is intended as a short-hand way to display the relative generosity of the two formulas. The ratio is set such that a ratio of 0.9 would be calculated when these allocations are proportionate—equally generous to a hospital. A ratio higher than 0.9 indicates that the 90 percent allocation is more generous to the hospital. For example, a ratio of 1.8 would indicate that the 90 percent formula is twice as generous to a hospital than the 10 percent formula. Similarly, a ratio of 0.3 would indicate that the 90 percent formula is one-third as generous to the hospital as the 10 percent formula.

51
Exhibit 16 also includes each hospital’s BASE allocation as a percentage of its cost. BASE was first scaled up such that the sum of all hospitals’ BASE costs equaled the 2010 statewide total uncompensated care claimed by hospitals (at cost). Exhibit 16 is included in the body of this report, rather than in an appendix exhibit, because of its central importance in displaying the effects of the four allocation methods on hospitals. d. Illustration and discussion of the effects of the four allocation methods: Application to eighteen hospitals in New York City. To illustrate these points, it is worthwhile to examine allocations to eighteen selected hospitals in New York City under the four payment methods. (Please refer to extract from Exhibit 16. Also, dollar gains and losses—compared with Actual—are presented in Appendix Exhibit 6 – A, and percentage gains and losses are presented in Appendix Exhibit 6 – B.) Bronx-Lebanon actually received $44.7 million in 2010. It would have received only $17.7 million by CARE and $19.6 million by BASE. But BASE STEEP would have allocated $27.1 million—because it devoted 7.01 percent of cost to uncompensated care as measured by BASE. CARE, which is purely volume-driven, cut some 60 percent of Actual allocation—perhaps because the hospital is paid high prices and perhaps for other reasons. BASE restored some $2 million of the cut, acknowledging some combination of relatively high input prices and case mix. BASE STEEP restored another $7.5 million or so—reflecting the hospital’s high 7.1 percent of cost devoted to uncompensated care (as measured by BASE). Montefiore lost a few million by CARE and more than regained its loss by BASE, but suffered a cut of almost 50 percent of Actual by BASE STEEP, reflecting its relatively low 2.54 BASE percent of cost of care. St. Barnabas suffered moderate cuts from Actual by both CARE and BASE, but was paid 75 percent above Actual by BASE STEEP because of its very high 10.79 percent BASE percent of cost. Long Island College Hospital had the reverse experience. It wasn’t penalized by either CARE or BASE but was hit by BASE STEEP owing to a BASE percent of cost that was only about two-thirds of the statewide average of 4.45 percent. Lutheran Medical Center’s position seems to resemble that of Bronx-Lebanon—high Actual payments and big hits from both CARE and BASE. Unlike Bronx-Lebanon, Lutheran didn’t see a substantial partial offset from BASE STEEP. Its BASE percent of cost was slightly below the statewide average, while Bronx-Lebanon’s was almost three-fifths higher than average. Maimonides suffered moderate losses from both CARE and BASE, and greater losses from BASE STEEP. Its BASE percent of cost equaled that of Long Island College.

52
Wyckoff Heights, apparently a low-cost and low-price hospital, benefited by CARE, was cut from Actual by BASE, but enjoyed a $2 million rise over Actual by BASE STEEP, reflecting a relatively high BASE percent of cost. New York Downtown suffered successive moderate attrition under CARE and BASE, but was hit hard by BASE STEEP owing to its very low BASE percent of cost. Lenox Hill saw a very large cut from Actual owing to CARE but this was restored by BASE. BASE STEEP, however, would have cut more than one-half of Actual payments, again because of a very low BASE percent of cost. Mt. Sinai was barely affected by CARE and was rewarded substantially by BASE. That gain, though, was more than erased by BASE STEEP for the usual reason. Application of CARE cost NYU more than three-quarters of Actual. BASE more than restored that cut. But BASE STEEP cut even deeper than CARE owing to the hospital’s lowest BASE percentage of cost among the eighteen hospitals. Presbyterian fared about as badly as NYU, losing about two-thirds of Actual payments under BASE STEEP. Interestingly, Flushing was rewarded generously by CARE, almost as generously by BASE, and would have been paid two and one-half times as much by BASE STEEP as by Actual. Its 9.35 percent BASE share of cost explains the last. Jamaica Hospital did even better than Flushing, rising from $34.7 million in Actual uncompensated care payments to $85.6 million by BASE STEEP owing to its 14.4 percent BASE share of cost. Peninsula General shows a similar trend, though on a more modest scale.
Exhibit 16 (Extract)
Allocations by Individual Hospital: Actual, CARE, BASE, and BASE STEEP, with BASE Percent of Cost, 2010
Excludes Major Public Hospitals—All Allocations Total $707.7 Million Statewide
(All Dollars in Thousands)
Opcert Hospital Name Total Actual
Allocation
Ratio of
90% to
10%
CARE BASE BASE
STEEP
BASE % of cost
7000001 Bronx-Lebanon H. Ctr. $44,678 1.5 $17,695 $19,592 $27,055 7.01%7000006 Montefiore H. + M.C. $23,299 0.8 $20,526 $24,161 $12,109 2.54%7000014 St Barnabas Hospital $22,570 1.0 $18,579 $18,649 $39,675 10.79%7001017 Long Island College Hospital $6,156 1.1 $6,049 $6,327 $3,834 3.07%7001019 Lutheran Medical Center $34,492 1.4 $8,858 $9,933 $8,166 4.17%7001020 Maimonides Medical Center $14,956 1.1 $11,986 $12,952 $7,832 3.07%7001035 Wyckoff Heights Hospital $8,705 1.1 $9,327 $8,660 $10,610 6.22%

53
7002000 New York Downtown $6,535 1.6 $5,533 $4,729 $1,772 1.90%7002017 Lenox Hill Hospital $7,657 1.4 $4,349 $7,449 $3,444 2.35%7002024 Mount Sinai Hospital $13,553 0.7 $13,271 $19,157 $10,757 2.85%7002053 NY University Med Ctr $5,198 1.3 $1,218 $5,356 $912 0.86%7002054 New York Presbyterian H. $20,360 0.8 $11,000 $23,492 $7,023 1.52%7003001 Flushing H. and M.C. $7,582 0.4 $11,666 $10,646 $19,631 9.35%7003003 Jamaica Hospital $34,656 0.9 $29,852 $30,128 $85,516 14.40%7003006 Peninsula Hospital Center $1,548 0.6 $2,968 $3,095 $3,990 6.54%7003010 New York M.C. of Queens $7,632 0.9 $9,121 $9,395 $5,790 3.13%7003015 Mount Sinai H. of Queens $4,911 1.2 $5,334 $6,439 $13,791 10.87%7004003 Staten Island University H. $8,234 0.4 $14,671 $16,159 $15,578 4.89% New York Medical Center of Queens was boosted by both CARE and BASE but lost almost one-quarter of Actual by BASE STEEP. Mt. Sinai of Queens saw the same effect from CARE and BASE but would have been paid fully two and three-quarters times as much as Actual by BASE STEEP. Its 10.87 percent BASE share of cost is the reason. Staten Island University is unusual in that it received roughly double its Actual payments under CARE, BASE, and BASE STEEP. It apparently provides either high volumes of care or has been paid (or chose to claim) low costs currently—or both. High BASE payments suggest modesty in claiming costs currently. Exhibit 16 which now follows, presents the Actual 2010 allocations, the 90/10 ratio, allocations according to CARE and BASE and BASE STEEP, and BASE cost as a percentage of total cost. Exhibit 16 is complemented by two appendix exhibits, Appendix Exhibits 6 – A and 6 – B. Appendix Exhibit 6 – A shows dollar changes from Actual versus CARE, BASE, and BASE STEEP, and Appendix Exhibit 6 – B shows percentage changes from Actual. We then turn in Section G to the question, mentioned earlier, of developing a fair method to allocate increasingly scarce hospital uncompensated care funds in the wake of scheduled cuts in the Medicaid DSH funds that have for years borne the bulk of the state’s burden in financing uncompensated care at the 21 major public hospitals.

54
Exhibit 16
Allocations by Individual Hospital: Actual, CARE, BASE, and BASE STEEP, with BASE Percent of Cost, 2010
Excludes Major Public Hospitals—All Allocations Total $707.7 Million Statewide
(All Dollars in Thousands)
Opcert Hospital Name Total Actual
Allocation
Ratio of
90% to
10%
CARE BASE BASE
STEEP
BASE % of cost
0101000 Albany Medical Center H. $5,070 0.7 $6,080 $7,761 $4,217 2.76%0101003 Albany, Memorial Hospital of $1,211 1.0 $2,000 $1,863 $1,651 4.50%0101004 St Peters Hospital $3,469 0.7 $6,877 $5,272 $3,100 2.98%0101005 Albany M C South Clin Cam $59 0.0 $642 $695 $951 6.94%0226700 Cuba Memorial Hospital Inc $790 3.5 $257 $232 $281 6.16%0228000 Memorial H. of W+G Jones $664 0.5 $2,148 $1,421 $2,648 9.45%0301001 Our Lady of Lourdes Meml H. $1,927 0.8 $5,060 $3,026 $1,823 3.06%0303001 United Health Services, Inc $4,440 0.8 $8,310 $6,528 $4,603 3.58%0401001 Olean General Hospital $1,320 0.6 $4,106 $2,724 $3,749 6.98%0427000 TLC Health Network $1,616 1.2 $1,705 $1,115 $1,322 6.01%0501000 Auburn Memorial Hospital $1,028 1.1 $2,057 $1,405 $1,120 4.05%0601000 Brooks Memorial Hospital $564 2.0 $845 $452 $242 2.72%0602001 Woman’s Christian Association $1,566 1.0 $2,529 $1,813 $1,529 4.28%0632000 Westfield Memorial Hospital Inc $293 2.1 $378 $201 $188 4.75%0701000 Arnot-Ogden Memorial Hospital $1,591 1.0 $3,205 $2,465 $1,786 3.67%0701001 St Josephs Hospital of Elmira $1,059 0.9 $1,568 $1,166 $870 3.78%0824000 Chenango Memorial Hospital Inc $1,646 0.4 $4,571 $3,555 $12,050 17.20%0901001 Champlain Valley Physicians H. $2,067 2.5 $1,650 $1,132 $280 1.25%1001000 Columbia Memorial Hospital $2,320 2.0 $2,187 $1,493 $929 3.16%1101000 Cortland Memorial Hospital Inc $1,346 1.6 $1,744 $1,131 $867 3.89%1226701 Margaretville Memorial Hospital $583 $0 $0 $0 0.00%1227001 Tri-Town Regional Healthcare $593 3.5 $221 $0 $0 0.00%1229700 Delaware Valley Hospital Inc $554 11.2 $25 $0 $0 0.00%1254700 O’Connor Hospital $436 3.5 $140 $113 $51 2.28%1302000 St Francis H. of Poughkeepsie $3,936 1.1 $2,150 $2,461 $1,611 3.32%1302001 Vassar Brothers Medical Center $5,130 0.8 $8,673 $8,840 $9,172 5.26%1327000 Northern Dutchess Hospital $1,461 3.1 $913 $730 $363 2.52%1401002 Kaleida Hlth/Women+Childrens H $1,403 0.4 $3,717 $3,095 $1,870 3.06%1401006 Sheehan Memorial Emergency H. $25 0.0 $75 $59 $12 1.05%1401008 Mercy Hospital of Buffalo $2,098 1.1 $3,614 $2,973 $1,353 2.31%1401013 Sisters of Charity Hospital $2,357 0.6 $3,096 $2,929 $1,956 3.39%1401014 Millard Fillmore - Kaleida Health $4,211 0.6 $7,283 $8,825 $3,952 2.27%1404000 Kenmore Mercy Hospital $818 0.9 $1,420 $1,477 $785 2.70%1427000 Bertrand Chaffee Hospital $390 2.5 $289 $215 $165 3.90%1455000 St Joseph Hospital $589 $464 $0 $0 0.00%1552701 Elizabethtown Community H. $419 2.3 $193 $172 $84 2.49%

55
Exhibit 16 (Continued)
Allocations by Individual Hospital: Actual, CARE, BASE, and BASE STEEP, with BASE Percent of Cost, 2010
Excludes Major Public Hospitals—All Allocations Total $707.7 Million Statewide
(All Dollars in Thousands)
Opcert Hospital Name Total
Actual Allocation
Ratio of
90% to
10%
CARE BASE BASE
STEEP
BASE % of cost
1564701 Moses-Ludington Hospital $439 6.8 $161 $59 $15 1.28%1623001 Adirondack Medical Center $1,806 1.8 $1,531 $1,449 $1,587 5.56%1624000 Alice Hyde Memorial Hospital $1,154 1.5 $2,225 $1,344 $1,534 5.79%1701000 Nathan Littauer Hospital $2,035 1.3 $3,336 $1,952 $2,635 6.85%1801000 United Memorial M.C. $881 1.5 $1,558 $1,036 $715 3.50%2129700 Little Falls Hospital $845 $103 $36 $3 0.37%2201000 Samaritan Medical Center $2,615 2.0 $2,674 $1,833 $1,004 2.78%2221700 River Hospital $515 1.9 $286 $287 $378 6.70%2238001 Carthage Area Hospital Inc $619 1.3 $1,007 $611 $592 4.92%2424000 Lewis County General Hospital $886 2.4 $912 $553 $505 4.63%2527000 Nicholas H Noyes Meml. H. $845 2.3 $611 $435 $159 1.85%2601001 Oneida Healthcare Center $1,018 1.9 $1,144 $779 $558 3.63%2625000 Community Memorial Hospital $753 1.2 $1,572 $907 $856 4.79%2701001 Highland Hospital of Rochester $1,733 0.4 $7,193 $5,480 $5,030 4.66%2701003 Rochester General Hospital $8,063 0.6 $15,691 $13,662 $13,186 4.90%2701005 Strong Memorial Hospital $7,677 2.0 $8,695 $12,126 $5,941 2.49%2701006 Monroe Community Hospital $0 $0 $0 $0 0.00%2728001 Lakeside Memorial Hospital $360 0.7 $1,075 $626 $582 4.72%2754001 Park Ridge Hospital $3,590 0.8 $5,099 $4,053 $1,801 2.25%2801000 Amsterdam Memorial Hospital $207 4.6 $84 $0 $0 0.00%2801001 St Mary’s H. at Amsterdam $1,196 0.6 $2,979 $2,133 $2,044 4.86%2901000 Glen Cove - North Shore $3,214 1.1 $3,454 $4,121 $4,171 5.14%2902000 Long Beach Medical Center $1,559 0.4 $2,484 $2,674 $4,112 7.80%2908000 Winthrop University Hospital $4,944 0.7 $7,988 $8,293 $4,535 2.77%2909000 Mercy Medical Center $2,798 0.7 $3,441 $3,797 $2,820 3.77%2910000 Franklin Hospital M.C. $2,946 1.4 $2,624 $3,130 $2,459 3.99%2950001 South Nassau Communities H. $3,762 0.7 $6,497 $6,187 $4,612 3.78%2951001 North Shore University Hospital $16,660 0.9 $13,679 $20,815 $13,897 3.39%2952005 Plainview - North Shore $976 0.9 $1,729 $1,480 $485 1.66%2952006 New Island Hospital $1,364 0.6 $2,437 $3,435 $4,336 6.40%2953000 St Francis Hospital of Roslyn $1,058 1.0 $686 $1,926 $374 0.98%3101001 Lockport Memorial Hospital $418 1.2 $841 $196 $42 1.10%3102000 Niagara Falls Meml M C $1,239 1.1 $1,926 $1,389 $1,024 3.74%3121001 Mt. St. Mary’s H. of Nia.Falls $636 0.6 $1,948 $1,734 $1,641 4.80%3154000 Inter-Comm. Mem. H. Newfane $578 2.5 $695 $163 $56 1.75%3201002 Rome H. and Murphy Meml. $956 0.9 $1,788 $1,367 $1,146 4.25%

56
Exhibit 16 (Continued)
Allocations by Individual Hospital: Actual, CARE, BASE, and BASE STEEP, with BASE Percent of Cost, 2010
Excludes Major Public Hospitals—All Allocations Total $707.7 Million Statewide
(All Dollars in Thousands)
Opcert Hospital Name Total Actual
Allocation
Ratio of
90% to
10%
CARE BASE BASE
STEEP
BASE % of cost
3202002 St Elizabeth Medical Center $1,853 0.6 $3,768 $3,948 $3,172 4.08%3202003 St Luke’s / Faxton Memorial H. $2,474 0.3 $10,504 $7,715 $9,417 6.19%3301000 Community-Genl. H of Gr. Syr. $1,167 1.2 $2,298 $1,916 $1,174 3.11%3301003 St Josephs H.+ Health Center $4,610 0.9 $6,547 $5,912 $3,297 2.83%3301008 Crouse Hospital $3,642 0.6 $5,885 $5,645 $3,969 3.57%3402000 Geneva General Hospital $1,389 1.3 $2,183 $1,243 $860 3.51%3421000 Clifton Springs H. + Clinic $433 0.8 $452 $459 $225 2.49%3429000 F F Thompson Hospital $805 0.9 $1,654 $1,183 $767 3.29%3522000 St. Luke's - Cornwall H $3,521 0.9 $5,536 $4,609 $5,091 5.60%3523000 Orange Regional M.C. $1,954 0.3 $8,835 $7,700 $8,419 5.55%3529000 St Anthony Community H. $390 0.5 $1,154 $959 $705 3.73%3535001 Bon Secours Community H. $3,538 1.4 $2,798 $2,268 $2,798 6.26%3622000 Medina Memorial Hospital $493 1.5 $724 $407 $259 3.23%3701000 Albert Lindley Lee Meml H. $0 $0 $0 $0 3702000 Oswego Hospital $1,633 1.3 $2,558 $1,254 $963 3.89%3801000 Aurelia Osborn Fox Meml. H. $1,584 1.9 $1,968 $1,262 $942 3.79%3824000 Mary Imogene Bassett Hospital $3,478 0.8 $6,501 $5,275 $4,439 4.27%3950000 Putnam Community Hospital $2,056 0.9 $3,001 $2,911 $2,475 4.31%4102002 Samaritan Hospital of Troy $2,059 0.9 $2,941 $2,208 $1,830 4.20%4102003 Seton Health System $2,129 2.1 $2,550 $1,514 $711 2.38%4324000 Nyack Hospital $2,441 0.9 $3,138 $3,398 $2,609 3.90%4329000 Good Samaritan H. / West Islip $4,419 1.1 $3,488 $3,208 $1,297 2.05%4353000 Summit Park H./Rockland Co. $3,737 3.0 $0 $0 $0 0.00%4401000 Claxton-Hepburn M.C. $820 1.0 $1,649 $1,036 $572 2.80%4402000 Massena Memorial Hospital $1,136 1.2 $2,396 $1,293 $1,369 5.37%4423000 Edward J. Noble / Gouverneur $553 2.7 $628 $313 $316 5.12%4429000 Canton-Potsdam Hospital $1,264 $1 $0 $0 0.00%4458700 Clifton-Fine Hospital $193 2.1 $100 $109 $70 3.27%4501000 Saratoga Hospital $2,002 0.9 $3,629 $2,872 $2,461 4.35%4601001 Ellis Hospital $3,931 0.9 $6,611 $5,302 $4,019 3.85%4601004 Sunnyview H. + Rehab Ctr $519 0.0 $0 $0 $0 0.00%4720001 Cobleskill Reg. H. Bassett/Sch. $913 3.3 $471 $371 $265 3.63%4823700 Schuyler Hospital $747 2.3 $370 $288 $144 2.54%5001000 Corning Hospital $2,159 4.1 $1,457 $941 $550 2.97%5002001 St James Mercy Hospital $1,332 1.3 $2,108 $1,151 $1,036 4.56%5022000 Ira Davenport Memorial H. $1,246 1.8 $1,308 $854 $2,106 12.50%

57
Exhibit 16 (Continued)
Allocations by Individual Hospital: Actual, CARE, BASE, and BASE STEEP, with BASE Percent of Cost, 2010
Excludes Major Public Hospitals—All Allocations Total $707.7 Million Statewide
(All Dollars in Thousands)
Opcert Hospital Name Total Actual
Allocation
Ratio of
90% to
10%
CARE BASE BASE
STEEP
BASE % of cost
5123000 Brookhaven Memorial H. $7,372 1.2 $8,847 $8,659 $11,136 6.52%5126000 Southampton Hospital $1,371 0.5 $3,623 $3,168 $4,898 7.84%5127000 Eastern Long Island Hospital $861 0.5 $948 $1,539 $2,415 7.96%5149000 John T Mather Memorial H. $2,052 1.0 $1,970 $2,631 $1,391 2.68%5149001 St Charles Hospital $1,603 1.1 $1,613 $1,470 $503 1.74%5153000 Huntington Hospital $3,769 2.3 $3,042 $2,478 $985 2.02%5154000 Southside Hospital $7,916 1.6 $6,842 $6,142 $6,265 5.18%5154001 Good Samaritan H.l / Suffern $8,531 2.6 $3,802 $4,417 $1,791 2.06%5155000 Peconic Bay M.C. / Ctl. Suffolk $1,866 0.9 $3,269 $2,774 $3,138 5.74%5157003 St Catherine of Siena $1,151 2.2 $683 $771 $118 0.78%5263000 Catskill Reg. M C - G Hermann $9,198 2.4 $4,698 $3,387 $5,986 8.97%5263700 Catskill Regional M.C. $547 7.0 $112 $87 $61 3.56%5401001 Cayuga M C at Ithaca $1,841 1.5 $2,260 $1,474 $876 3.01%5501000 Benedictine Hospital $2,174 1.9 $1,847 $1,486 $1,019 3.48%5501001 Kingston H. $2,386 1.3 $2,362 $1,823 $1,549 4.31%5526700 Ellenville Regional Hospital $1,767 7.0 $411 $180 $116 3.27%5601000 Glens Falls Hospital $4,009 1.1 $7,491 $5,054 $4,492 4.51%5820000 Wayne Health Care $2,519 2.8 $1,953 $1,101 $1,265 5.83%5901000 Hudson Valley Hospital $1,727 0.7 $2,409 $2,194 $1,878 4.34%5902001 White Plains H. Med Ctr $2,130 0.6 $5,055 $5,352 $4,393 4.16%5902002 Burke Rehabilitation Center $173 $3 $40 $1 0.12%5903000 Mount Vernon Hospital $10,485 1.3 $6,320 $6,805 $19,178 14.30%5904000 Sound Shore M. C. W’chester $10,769 1.2 $12,095 $9,766 $22,473 11.67%5907001 St Johns Riverside Hospital $3,960 0.5 $7,114 $6,869 $10,235 7.56%5907002 St Josephs Hospital Yonkers $8,610 0.9 $8,477 $8,493 $25,247 15.08%5920000 Northern Westchester Hospital $1,334 1.4 $1,412 $1,220 $354 1.47%5922000 Lawrence Hospital $1,393 0.6 $3,376 $2,999 $2,529 4.28%5925000 Community H. at Dobbs Ferry $260 1.5 $429 $0 $0 0.00%5932000 Phelps Meml. H. Association $1,541 0.8 $2,837 $2,127 $1,130 2.70%5957000 Blythedale Childrens Hospital $201 0.1 $239 $214 $37 0.87%6027000 Wyoming County Comm. H. $689 1.1 $1,089 $633 $519 4.16%6120700 Soldiers and Sailors Meml. H. $919 5.4 $59 $58 $8 0.67%7000001 Bronx-Lebanon H. Ctr. $44,678 1.5 $17,695 $19,592 $27,055 7.01%7000006 Montefiore H. + M.C. $23,299 0.8 $20,526 $24,161 $12,109 2.54%7000011 Calvary Hospital $687 $0 $0 $0 0.00%7000014 St Barnabas Hospital $22,570 1.0 $18,579 $18,649 $39,675 10.79%

58
Exhibit 16 (Continued)
Allocations by Individual Hospital: Actual, CARE, BASE, and BASE STEEP, with BASE Percent of Cost, 2010
Excludes Major Public Hospitals—All Allocations Total $707.7 Million Statewide
(All Dollars in Thousands)
Opcert Hospital Name Total Actual
Allocation
Ratio of
90% to
10%
CARE BASE BASE
STEEP
BASE % of cost
7000025 NY Westchester Square M C $1,029 0.8 $2,345 $2,037 $1,757 4.38%7001002 Brookdale Hosp M C $23,139 2.4 $9,530 $10,720 $9,468 4.48%7001003 Brooklyn Hospital $4,614 0.8 $6,375 $5,824 $3,642 3.17%7001008 NY Community / Brooklyn $631 0.8 $1,095 $1,188 $636 2.72%7001017 Long Island College Hospital $6,156 1.1 $6,049 $6,327 $3,834 3.07%7001019 Lutheran Medical Center $34,492 1.4 $8,858 $9,933 $8,166 4.17%7001020 Maimonides Medical Center $14,956 1.1 $11,986 $12,952 $7,832 3.07%7001021 NY Methodist H of Brooklyn $4,094 0.5 $7,904 $8,018 $4,523 2.86%7001024 Episcopal Health Services, Inc $1,767 0.9 $2,267 $2,387 $1,229 2.61%7001033 Kingsbrook Jewish M C $1,505 0.2 $3,858 $3,557 $2,593 3.70%7001035 Wyckoff Heights Hospital $8,705 1.1 $9,327 $8,660 $10,610 6.22%7001041 Beth Israel M C - Kings Hwy $1,292 1.5 $1,226 $1,482 $720 2.46%7001046 Interfaith Medical Center $12,923 3.0 $4,103 $4,469 $3,581 4.07%7002000 New York Downtown $6,535 1.6 $5,533 $4,729 $1,772 1.90%7002002 Beth Israel Medical Center $13,379 0.9 $4,765 $6,298 $1,888 1.52%7002012 Hospital for Special Surgery $966 $0 $0 $0 0.00%7002017 Lenox Hill Hospital $7,657 1.4 $4,349 $7,449 $3,444 2.35%7002020 Memorial H. for Cancer $7,712 0.6 $2,074 $5,515 $854 0.79%7002024 Mount Sinai Hospital $13,553 0.7 $13,271 $19,157 $10,757 2.85%7002026 New York Eye+Ear Infirmary $1,914 0.4 $3,479 $4,037 $6,632 8.33%7002031 Rockefeller University Hospital $43 0.0 $0 $0 $0 0.00%7002032 St Luke’s / Roosevelt H. Center $25,123 1.1 $19,429 $24,114 $20,772 4.37%7002037 St Vincent’s Hospital $3,252 0.8 $8,523 $4,077 $932 1.16%7002052 North General Hospital $1,603 1.2 $2,263 $1,247 $476 1.94%7002053 NY University Med Ctr $5,198 1.3 $1,218 $5,356 $912 0.86%7002054 New York Presbyterian H. $20,360 0.8 $11,000 $23,492 $7,023 1.52%7003001 Flushing H. and M.C. $7,582 0.4 $11,666 $10,646 $19,631 9.35%7003003 Jamaica Hospital $34,656 0.9 $29,852 $30,128 $85,516 14.40%7003004 Long Island Jewish-Hillside $8,788 0.5 $9,862 $14,476 $8,121 2.85%7003006 Peninsula Hospital Center $1,548 0.6 $2,968 $3,095 $3,990 6.54%7003010 New York M.C. of Queens $7,632 0.9 $9,121 $9,395 $5,790 3.13%7003013 Forest Hills - North Shore $1,850 0.8 $3,173 $2,861 $1,865 3.31%7003015 Mount Sinai H. of Queens $4,911 1.2 $5,334 $6,439 $13,791 10.87%7004003 Staten Island University H. $8,234 0.4 $14,671 $16,159 $15,578 4.89%7004010 Richmond University Medical $7,487 1.0 $7,137 $6,697 $5,756 4.36% Statewide total $707,659 0.9 $707 659 $707 4.45%

59
G. EQUITABLE ALLOCATIONS OF $847 MILLION POOL AMONG ALL 200 NEW YORK STATE HOSPITALS (Including Major Public Hospitals) 1. This is a what-if analysis What if: DSH funds were cut dramatically—and more deeply than the drop in need for uncompensated care for uninsured lower-income New Yorkers? New York State’s separately-targeted financing of uncompensated care at the state’s 21 major public hospitals now rests heavily on Medicaid DSH funds. The ACA of 2010 will shift a substantial share of those Medicaid DSH funds to help finance the main ACA insurance coverage expansions that are to take effect in 2014. If that happens as anticipated, it is very possible that hospitals’ need for outside special financing of their uncompensated care will shrink substantially more slowly than that financing’s availability.33 Reasons include: many New York State patients will lack coverage after 2014; many insured patients will need services not covered by their insurance; and many lower income patients will gain insurance under the 2010 health reform law but
will be unable to afford the substantial out-of-pocket costs they will be obliged to shoulder, and that inability may result in substantial uncompensated care costs for many hospitals—particularly those that now provide large amounts of uncompensated care. The bronze-level insurance plans will cover only an average of 60 percent of health care costs.
It will then be important for the state to anticipate the possible loss of most Medicaid DSH dollars by developing fair methods of alternative financing of uncompensated care for all hospitals statewide. One such alternative is to treat the current $847-million uncompensated care pool as indeed one pool. If this is done, it would be possible to allocate that one pool among hospitals in some fair proportion to a) hospitals’ volumes of uncompensated care, b) a progressive or sliding scale formula that recognizes the low incremental costs of providing only a relatively small proportion of uncompensated care and the high incremental costs of providing a relatively high proportion of uncompensated care, and c) actual costs of providing uncompensated care at different hospitals—in light varying input costs and severity of patient illness. 2. Actual allocations of $847 million by region and teaching status, compared with allocations by CARE, BASE, and BASE STEEP It is important to note that the following analyses rest on 2008 volumes of uncompensated care provided by the individual hospitals and 2010 prices paid to or calculated for those hospitals. Following implementation of the 2010 reform law’s main provisions in 2014, hospitals’ shares of uncompensated care might change. Allocations of dollars according to the CARE, BASE, and BASE STEEP formulas would therefore change as well.

60
As shown in Exhibit 17 – A, $503 million of today’s $847 million is Actually allocated to hospitals in New York City. That’s almost three-fifths of the total (Exhibit 17 – B). Relying on volume-only CARE allocation results in surprisingly small changes in dollar allocations. Long Island sees virtually no change. New York City loses $11 million, but that’s only two percent of Actual. Northern Metro is the largest loser, in both dollars and as a share of actual ($23 million and 22 percent). The five remaining regions gain between $5 and $11 million but these are fairly substantial percentage increases. BASE tends to push most regions back up toward—or even above—their Actual allocations. Northern Metro is the exception, suffering an added $5 million loss. BASE STEEP profoundly reallocates payments toward New York City—up to 71.7 percent of the statewide total. That’s because it strongly rewards BASE care’s percentage of total cost, and New York City’s hospitals—particularly its major public hospitals—devote very large shares of their care and costs to uncompensated care. Indeed, New York City’s voluntary non-profit hospitals as a group see a substantially lower share of in allocations under BASE STEEP. In this connection, it is important to note that major public hospitals’ share of a single $847 million statewide pool rises from
16.4% of Actual ($139.3 million) 36.7% of CARE (310.9 million) 38.3% of BASE (324.4 million) 58.1% of BASE STEEP (492.4 million)
The four methods’ allocations by teaching status, shown in Exhibit 17 – C, bear this out. Major COTH teaching hospitals’ share of the $847 million pool rises from just under one-half by Actual to just over one-half by CARE to three-fifths by BASE and to two-thirds by STEEP. This is not surprising since fully 16 of the 21 major public hospitals are also major COTH teaching hospitals.
Exhibit 17 – A
Dollar Allocations to 200 New York State Hospitals by Region: Actual, CARE, BASE, and BASE STEEP , 2010
Region Actual 90+10 CARE BASE
BASE STEEP
1 Long Island $88.3 $88.1 $98.0 $72.9 2 New York City $503.1 $491.8 $518.3 $607.0 3 Northern Metro. $105.3 $82.1 $77.4 $70.0 4 Northeast $31.7 $36.1 $28.3 $14.4 5 Utica/Watertown $27.8 $36.3 $25.8 $20.8 6 Central $32.0 $37.8 $30.9 $14.4 7 Rochester $28.3 $33.8 $29.8 $14.9 8 Western $30.1 $40.9 $38.3 $32.5
Statewide $846.7 $847.0 $846.8 $847.0

61
Exhibit 17 – B
Percentage Allocations to 200 New York State Hospitals by Region: Actual, CARE, BASE, and BASE STEEP , 2010
Region Actual 90+10 CARE BASE
BASE STEEP
1 Long Island 10.4% 10.4% 11.6% 8.6%
2 New York City 59.4% 58.1% 61.2% 71.7%
3 Northern Metro. 12.4% 9.7% 9.1% 8.3%
4 Northeast 3.7% 4.3% 3.3% 1.7%
5 Utica/Watertown 3.3% 4.3% 3.0% 2.5%
6 Central 3.8% 4.5% 3.6% 1.7%
7 Rochester 3.3% 4.0% 3.5% 1.8% 8 Western 3.6% 4.8% 4.5% 3.8% Statewide 100.0% 100.0% 100.0% 100.0%
Exhibit 17 – C
Percentage Allocations to 200 New York State Hospitals by Teaching Status: Actual, CARE, BASE, and BASE STEEP , 2010
Actual 90+10 CARE BASE BASE STEEP
Non-teaching 18.3% 16.1% 12.8% 8.4%Teaching 36.8% 29.4% 27.5% 24.8%Major COTH teaching 44.9% 54.5% 59.7% 66.8% Statewide 100.0% 100.0% 100.0% 100.0% 3. Choosing a fair and reasonable allocation method Subject to an important caution, we recommend using BASE itself to allocate uncompensated care funds among New York State’s 200 hospitals in the event that DSH funds were cut substantially. Caution: This report’s analyses have addressed allocations of the $847 million Hospital Indigent Care Pool. They have not addressed other special payments to public or other hospitals associated with provision of uncompensated care. BASE is appropriate if only the $847 million is considered; if other sources of funds are considered, BASE STEEP or a blend of BASE and BASE STEEP might well be appropriate. It appears that BASE would be a reasonable way to place New York State’s 21 major public hospitals on a fair financial footing along with the other 179 hospitals. But this conclusion would need to be checked against all-source financing of uncompensated care currently, and also against post-2014 volumes of care provided by individual hospitals.

62
We offer several reasons for this recommendation: First, BASE has the advantages of respecting hospitals’ actual volumes of care while recognizing actual input prices and severity of patient illness. We believe it would be generally reasonable and fair; its political feasibility is to be learned. Second, if desired, a gradual sliding scale such as Steeper-A or Steeper-B might be added to BASE. BASE STEEP should not be used among the 200 hospitals. The former raises New York City’s share from BASE’s 61.2 percent to 63.3 percent, and the latter raises the city’s share to 63.7 percent. Shares to individual hospitals by BASE Steeper-A or BASE Steeper-B are not presented in this report by are available on request. BASE STEEP, on the other hand, would raise New York City hospitals’ share of the $847 million to 71.7 percent. It could be reasonable to apply Steeper-A or Steeper-B to BASE for the 200-hospital calculations because it introduces modest progressivity. And it does so without removing the great bulk of uncompensated care’s financial oxygen from many hospitals—as application of BASE STEEP clearly does across the 200 hospitals Third, it is salient that when both CARE and BASE methods are applied to all of New York State’s 200 hospitals and eight regions, they result in much smaller changes in the allocation of dollars across the eight regions than they did when applied only to the 179 hospitals (excluding major public hospitals). That is probably because cuts in some hospitals and regions by CARE or BASE are largely offset by consistent application of CARE and BASE to the 21 major public hospitals that were Actually treated very differently because only their segregated total of $139.3 million was available to them. For a clear example, please consider Exhibit 17 – D’s comparison of allocations to New York City hospitals by Actual, CARE, BASE, and BASE STEEP when applied to the 179 hospitals versus the 200 hospitals. This comparison draws on exhibits 15 – B and 17 – B.
Exhibit 17 – D
Comparison of Allocations by Actual, CARE, BASE, and BASE STEEP to Hospitals in New York City:
179 Hospitals (Excluding Major Publics) versus All 200 New York State Hospitals
Share of State Total to New York City Hospitals by Each Allocation Method
Allocation applied to which hospitals statewide?
Actual 90+10 CARE BASE
BASE STEEP
179 hospitals (Ex. 15-B) 56.2% 42.7% 48.9% 49.9%
All 200 hospitals (Ex. 17-B) 59.4% 58.1% 61.2% 71.7%

63
For the 179 hospitals, CARE and BASE resulting in much smaller uncompensated care allocations to New York City’s hospitals than did the Actual allocation. New York City hospitals actually received 56.2 percent of non-major-public hospitals’ share of the $707.7 million that such hospitals Actually received statewide in 2010. They would have received only 42.7 percent by CARE (since CARE ignores input prices and severity of patient illness) and only 48.9 percent by BASE (which considers input prices and severity of illness). And BASE STEEP would have added only about $7 million to the city’s hospitals. But for the allocations of $847 million among all 200 hospitals, CARE’s distribution to New York City hospitals is only 1.3 percentage points below the Actual, and BASE is only 1.8 percentage points higher. Fourth, BASE STEEP, though, awards 12.3 more percentage points of the statewide total to New York City hospitals. BASE STEEP operates much more sharply when applied to all 200 hospitals statewide than it does when applied only to the 179 non-major-public hospitals. That is because so many of the 21 major public hospitals, particularly the 14 major publics located in New York City, devote very high shares of costs to uncompensated care, especially as measured by BASE. BASE STEEP therefore would reduce payments to hospitals outside New York City—and to many voluntary non-profit hospitals in New York City—to such a degree that it seems visibly unfair and therefore starkly infeasible politically. For these four reasons, BASE itself might be a useful and equitable and acceptable method of allocating uncompensated care funds among New York State’s 200 hospitals in the event that DSH funds were cut substantially. Were a progressive sliding scale desired, BASE Steeper-A or BASE Steeper-B might be employed. Exhibit 18 will present allocations among 200 hospitals statewide by the current Actual method, CARE, BASE, and BASE STEEP. As would be expected, Actual allocations to each of the 179 hospitals appearing in exhibits 16 and 18 remain the same in both exhibits. Total Actual allocation, by the 90 percent and 10 percent formulas, is what actually was allocated. It doesn’t change. But it is important to note that, for many hospitals, allocations by CARE, BASE, and BASE STEEP among all 200 hospitals presented in Exhibit 18 differ greatly from those among the 179 hospitals, excluding major publics, that were presented in Exhibit 16. That’s because allocations among the 179 hospitals involved only these hospitals’ shares of the $707.7 million left after removing the major public hospitals’ segregated $139.3 million from the $847 million uncompensated care pool. Allocations among the 179 hospitals did not consider any claims by the major publics.

64
But allocations of the static total pool of $847 million among all 200 hospitals by the CARE, BASE, and BASE STEEP methods awarded all funds by consistently applied statewide principles. This led to substantial gains and losses by individual hospitals under the different methods. Appendix 17 – E presents a few examples to illustrate these points. It draws on paired data from exhibits 16 and 18 for six hospitals. For each hospital, the first line of data is copied from Exhibit 16, showing allocations only among the 179 hospitals, and the second line of data is copied from Exhibit 18, showing allocations among all 200 hospitals. When allocating $707.7 million among the 179 non-major-public hospitals, Chenango Memorial, St. Joseph’s of Yonkers, and Mt. Sinai of Queens would have gained substantial sums by CARE, BASE, and BASE STEEP. This is attributable to their high volumes of uncompensated care and very high shares of uncompensated care. Neither gained as much from allocations of the full $847 million among all 200 hospitals because of competition from a number of major public hospitals. Corning Hospital fared poorly under the new methods among the 179 hospitals, and it did even worse among the 200 hospitals. Presbyterian displayed a somewhat sharper version of this pattern. Mount Sinai held its own by CARE in re-allocation among the 179—apparently because its volumes of uncompensated care were fairly high, and it gained by BASE, but it suffered in allocations among the 200 owing to its below-average uncompensated care share of costs.
Exhibit 17 - E
Comparison of Actual, CARE, BASE, and BASE STEEP Allocations among 179 Hospitals with Allocations among 200 Hospitals
Op Cert. Hospital Name
Total Actual
Allocation CARE BASE BASE
STEEP
BASE % of cost
179 824000 Chenango Memorial Hospital $1,646 $4,571 $3,555 $12,050 17.20%200 824000 Chenango Memorial Hospital $1,646 $3,463 $2,625 $6,038 17.20%
179 5001000 Corning Hospital $2,159 $1,457 $941 $550 2.97%200 5001000 Corning Hospital $2,159 $1,104 $695 $276 2.97%
179 5907002 St Josephs Hospital Yonkers $8,610 $8,477 $8,493 $25,247 15.08%200 5907002 St Josephs Hospital Yonkers $8,610 $6,422 $6,270 $12,650 15.08%
179 7002024 Mount Sinai Hospital $13,553 $13,271 $19,157 $10,757 2.85%200 7002024 Mount Sinai Hospital $13,553 $10,054 $14,143 $5,390 2.85%
179 7002054 New York Presbyterian H. $20,360 $11,000 $23,492 $7,023 1.52%200 7002054 New York Presbyterian H. $20,360 $8,333 $17,344 $3,519 1.52%
179 7003015 Mount Sinai H. of Queens $4,910 $5,334 $6,439 $13,791 10.87%200 7003015 Mount Sinai H. of Queens $4,910 $4,041 $4,753 $6,910 10.87%

65
Finally, Appendix exhibits 7 – A and 7 – B present each of the 200 hospitals’ dollar gains or losses under CARE, BASE, and BASE STEEP compared with Actual allocations, and also percentage gains or losses.

66
Exhibit 18
Allocations by Individual Hospital: Actual, CARE, BASE, and BASE STEEP, with BASE Percent of Cost, 2010: All 200 New York State Hospitals—
All Allocations Total $847 Million Statewide (All Dollars in Thousands)
Hospital Name
Total Actual
Allocation CARE BASE BASE
STEEP
BASE % of cost
101000 Albany Medical Center H. $5,068 $4,606 $5,729 $2,113 2.76%101003 Albany, Memorial Hospital of $1,211 $1,515 $1,375 $827 4.50%101004 St Peters Hospital $3,468 $5,210 $3,892 $1,553 2.98%101005 Albany M C South Clin Cam $59 $487 $513 $477 6.94%226700 Cuba Memorial Hospital Inc $789 $195 $171 $141 6.16%228000 Memorial H. of W+G Jones $663 $1,627 $1,049 $1,327 9.45%301001 Our Lady of Lourdes Meml H. $1,926 $3,833 $2,234 $913 3.06%303001 United Health Services, Inc $4,438 $6,296 $4,820 $2,306 3.58%401001 Olean General Hospital $1,319 $3,111 $2,011 $1,879 6.98%427000 TLC Health Network $1,616 $1,291 $823 $662 6.01%501000 Auburn Memorial Hospital $1,028 $1,558 $1,037 $561 4.05%601000 Brooks Memorial Hospital $563 $640 $333 $121 2.72%602001 Woman’s Christian Association $1,566 $1,916 $1,338 $766 4.28%632000 Westfield Memorial Hospital Inc $293 $287 $149 $94 4.75%701000 Arnot-Ogden Memorial Hospital $1,590 $2,428 $1,820 $895 3.67%701001 St Josephs Hospital of Elmira $1,058 $1,188 $861 $436 3.78%824000 Chenango Memorial Hospital Inc $1,645 $3,463 $2,625 $6,038 17.20%901001 Champlain Valley Physicians H. $2,066 $1,250 $836 $140 1.25%
1001000 Columbia Memorial Hospital $2,319 $1,657 $1,102 $465 3.16%1101000 Cortland Memorial Hospital Inc $1,346 $1,321 $835 $434 3.89%1226701 Margaretville Memorial Hospital $582 $0 $0 $0 0.00%1227001 Tri-Town Regional Healthcare $593 $168 $0 $0 0.00%1229700 Delaware Valley Hospital Inc $554 $19 $0 $0 0.00%1254700 O’Connor Hospital $436 $106 $84 $26 2.28%1302000 St Francis H. of Poughkeepsie $3,934 $1,629 $1,817 $807 3.32%1302001 Vassar Brothers Medical Center $5,127 $6,570 $6,526 $4,596 5.26%1327000 Northern Dutchess Hospital $1,460 $692 $539 $182 2.52%1401002 Kaleida Hlth/Women+Childrens H $1,402 $2,816 $2,285 $937 3.06%1401005 Erie County Medical Center $4,217 $10,029 $13,714 $20,330 11.08%1401006 Sheehan Memorial Emergency H. $25 $57 $44 $6 1.05%1401008 Mercy Hospital of Buffalo $2,097 $2,738 $2,195 $678 2.31%1401010 Roswell Park Memorial Institute $2,227 $72 $186 $4 0.16%1401013 Sisters of Charity Hospital $2,356 $2,345 $2,162 $980 3.39%1401014 Millard Fillmore - Kaleida Health $4,210 $5,518 $6,515 $1,980 2.27%1404000 Kenmore Mercy Hospital $818 $1,076 $1,090 $393 2.70%1427000 Bertrand Chaffee Hospital $390 $219 $159 $83 3.90%1455000 St Joseph Hospital $588 $352 $0 $0 0.00%1552701 Elizabethtown Community H. $419 $146 $127 $42 2.49%1564701 Moses-Ludington Hospital $438 $122 $43 $7 1.28%

67
Exhibit 18 (Continued)
Allocations by Individual Hospital: Actual, CARE, BASE, and BASE STEEP, with BASE Percent of Cost, 2010: All 200 New York State Hospitals—
All Allocations Total $847 Million Statewide (All Dollars in Thousands)
Hospital Name
Total Actual
Allocation CARE BASE BASE
STEEP
BASE % of cost
1623001 Adirondack Medical Center $1,805 $1,160 $1,070 $795 5.56%1624000 Alice Hyde Memorial Hospital $1,154 $1,685 $992 $768 5.79%1701000 Nathan Littauer Hospital $2,034 $2,527 $1,441 $1,321 6.85%1801000 United Memorial Medical Center $881 $1,180 $765 $358 3.50%2129700 Little Falls Hospital $845 $78 $26 $1 0.37%2201000 Samaritan Medical Center $2,614 $2,026 $1,353 $503 2.78%2221700 River Hospital $514 $216 $212 $190 6.70%2238001 Carthage Area Hospital Inc $619 $763 $451 $297 4.92%2424000 Lewis County General Hospital $886 $691 $408 $253 4.63%2527000 Nicholas H Noyes Meml. H. $845 $463 $321 $80 1.85%2601001 Oneida Healthcare Center $1,018 $867 $575 $279 3.63%2625000 Community Memorial Hospital $753 $1,191 $669 $429 4.79%2701001 Highland Hospital of Rochester $1,732 $5,449 $4,046 $2,520 4.66%2701003 Rochester General Hospital $8,059 $11,888 $10,086 $6,607 4.90%2701005 Strong Memorial Hospital $7,674 $6,587 $8,952 $2,977 2.49%2701006 Monroe Community Hospital $0 $0 $0 $0 0.00%2728001 Lakeside Memorial Hospital $360 $815 $462 $292 4.72%2754001 Park Ridge Hospital $3,588 $3,863 $2,992 $902 2.25%2801000 Amsterdam Memorial Hospital $207 $63 $0 $0 0.00%2801001 St Mary’s Hospital at Amsterdam $1,196 $2,257 $1,575 $1,024 4.86%2901000 Glen Cove - North Shore $3,213 $2,617 $3,042 $2,090 5.14%2902000 Long Beach Medical Center $1,558 $1,882 $1,974 $2,060 7.80%2908000 Winthrop University Hospital $4,942 $6,052 $6,122 $2,272 2.77%2909000 Mercy Medical Center $2,797 $2,607 $2,803 $1,413 3.77%2910000 Franklin Hospital Medical Center $2,944 $1,988 $2,311 $1,232 3.99%2950001 South Nassau Communities H. $3,761 $4,922 $4,568 $2,311 3.78%2950002 Nassau University Medical Center $7,424 $17,579 $17,638 $26,023 11.03%2951001 North Shore University Hospital $16,652 $10,363 $15,367 $6,963 3.39%2952005 Plainview - North Shore $976 $1,310 $1,093 $243 1.66%2952006 New Island Hospital $1,364 $1,846 $2,536 $2,173 6.40%2953000 St Francis Hospital of Roslyn $1,057 $520 $1,422 $187 0.98%3101001 Lockport Memorial Hospital $418 $637 $145 $21 1.10%3102000 Niagara Falls Meml M C $1,239 $1,459 $1,026 $513 3.74%3121001 Mt. St. Mary’s H. of Nia.Falls $636 $1,476 $1,280 $822 4.80%3154000 Inter-Comm. Mem. H. Newfane $578 $527 $120 $28 1.75%3201002 Rome H. and Murphy Meml. $955 $1,354 $1,009 $574 4.25%3202002 St Elizabeth Medical Center $1,852 $2,855 $2,915 $1,590 4.08%3202003 St Luke’s / Faxton Memorial H. $2,473 $7,958 $5,696 $4,718 6.19%3301000 Community-General H of Gr. Syr. $1,166 $1,741 $1,415 $588 3.11%

68
Exhibit 18 (Continued)
Allocations by Individual Hospital: Actual, CARE, BASE, and BASE STEEP, with BASE Percent of Cost, 2010: All 200 New York State Hospitals—
All Allocations Total $847 Million Statewide (All Dollars in Thousands)
Hospital Name
Total Actual
Allocation CARE BASE BASE
STEEP
BASE % of cost
3301003 St Josephs Hospital Health Center $4,608 $4,960 $4,365 $1,652 2.83%3301007 SUNY Hlth Sci Ctr. at Syracuse $3,889 $4,375 $5,867 $2,254 2.87%3301008 Crouse Hospital $3,640 $4,458 $4,167 $1,989 3.57%3402000 Geneva General Hospital $1,388 $1,654 $918 $431 3.51%3421000 Clifton Springs H. + Clinic $433 $342 $339 $113 2.49%3429000 F F Thompson Hospital $804 $1,253 $874 $384 3.29%3522000 St. Luke's - Cornwall H $3,519 $4,194 $3,403 $2,551 5.60%3523000 Orange Regional M.C. $1,953 $6,693 $5,685 $4,219 5.55%3529000 St Anthony Community Hospital $389 $874 $708 $353 3.73%3535001 Bon Secours Community H. $3,536 $2,120 $1,674 $1,402 6.26%3622000 Medina Memorial Hospital $493 $549 $301 $130 3.23%3701000 Albert Lindley Lee Meml H. $0 $0 $0 $0 3702000 Oswego Hospital $1,632 $1,938 $926 $482 3.89%3801000 Aurelia Osborn Fox Meml. H. $1,583 $1,491 $932 $472 3.79%3824000 Mary Imogene Bassett Hospital $3,476 $4,925 $3,894 $2,224 4.27%3950000 Putnam Community Hospital $2,055 $2,274 $2,149 $1,240 4.31%4102002 Samaritan Hospital of Troy $2,058 $2,228 $1,630 $917 4.20%4102003 Seton Health System $2,128 $1,932 $1,118 $356 2.38%4322000 Helen Hayes Hospital $1,467 $0 $0 $0 0.00%4324000 Nyack Hospital $2,440 $2,377 $2,508 $1,307 3.90%4329000 Good Samaritan H. / West Islip $4,417 $2,642 $2,369 $650 2.05%4353000 Summit Park H./Rockland Co. Inf. $3,736 $0 $0 $0 0.00%4401000 Claxton-Hepburn Medical Center $820 $1,249 $765 $287 2.80%4402000 Massena Memorial Hospital $1,135 $1,815 $955 $686 5.37%4423000 Edward John Noble / Gouverneur $552 $476 $231 $158 5.12%4429000 Canton-Potsdam Hospital $1,263 $1 $0 $0 0.00%4458700 Clifton-Fine Hospital $193 $76 $80 $35 3.27%4501000 Saratoga Hospital $2,002 $2,749 $2,120 $1,233 4.35%4601001 Ellis Hospital $3,929 $5,008 $3,914 $2,014 3.85%4601004 Sunnyview H. + Rehab Ctr $519 $0 $0 $0 0.00%4720001 Cobleskill Reg. H. Bassett/Schoh $913 $357 $274 $133 3.63%4823700 Schuyler Hospital $747 $280 $212 $72 2.54%5001000 Corning Hospital $2,158 $1,104 $695 $276 2.97%5002001 St James Mercy Hospital $1,331 $1,597 $850 $519 4.56%5022000 Ira Davenport Memorial H. $1,246 $991 $631 $1,055 12.50%5123000 Brookhaven Memorial H. $7,369 $6,702 $6,393 $5,580 6.52%5126000 Southampton Hospital $1,370 $2,744 $2,339 $2,454 7.84%5127000 Eastern Long Island Hospital $861 $718 $1,136 $1,210 7.96%5149000 John T Mather Memorial H. $2,051 $1,493 $1,943 $697 2.68%

69
Exhibit 18 (Continued)
Allocations by Individual Hospital: Actual, CARE, BASE, and BASE STEEP, with BASE Percent of Cost, 2010: All 200 New York State Hospitals—
All Allocations Total $847 Million Statewide (All Dollars in Thousands)
Hospital Name
Total Actual
Allocation CARE BASE BASE
STEEP
BASE % of cost
5149001 St Charles Hospital $1,602 $1,222 $1,085 $252 1.74%5151001 University H. at Stony Brook $6,334 $10,693 $14,537 $9,614 4.94%5153000 Huntington Hospital $3,768 $2,305 $1,829 $493 2.02%5154000 Southside Hospital $7,913 $5,183 $4,534 $3,139 5.18%5154001 Good Samaritan Hospital / Suffern $8,528 $2,880 $3,261 $897 2.06%5155000 Peconic Bay M.C. / Ctl. Suffolk $1,866 $2,477 $2,048 $1,573 5.74%5157003 St Catherine of Siena $1,151 $517 $569 $59 0.78%5263000 Catskill Reg. M C - G Hermann $9,193 $3,559 $2,501 $2,999 8.97%5263700 Catskill Regional Medical Center $547 $85 $65 $31 3.56%5401001 Cayuga M C at Ithaca $1,840 $1,712 $1,088 $439 3.01%5501000 Benedictine Hospital $2,173 $1,399 $1,097 $511 3.48%5501001 Kingston H. $2,385 $1,790 $1,346 $776 4.31%5526700 Ellenville Regional Hospital $1,766 $312 $133 $58 3.27%5601000 Glens Falls Hospital $4,008 $5,675 $3,731 $2,251 4.51%5820000 Wayne Health Care $2,518 $1,480 $813 $634 5.83%5901000 Hudson Valley Hospital $1,727 $1,825 $1,620 $941 4.34%5902001 White Plains H. Med Ctr $2,129 $3,830 $3,951 $2,201 4.16%5902002 Burke Rehabilitation Center $173 $2 $29 $0 0.12%5903000 Mount Vernon Hospital $10,481 $4,788 $5,024 $9,609 14.30%5904000 Sound Shore M. C. Westchester $10,764 $9,163 $7,210 $11,260 11.67%5907001 St Johns Riverside Hospital $3,958 $5,389 $5,071 $5,128 7.56%5907002 St Josephs Hospital Yonkers $8,606 $6,422 $6,270 $12,650 15.08%5920000 Northern Westchester Hospital $1,334 $1,070 $901 $177 1.47%5922000 Lawrence Hospital $1,392 $2,558 $2,214 $1,267 4.28%5925000 Community H. at Dobbs Ferry $259 $325 $0 $0 0.00%5932000 Phelps Meml. H. Association $1,540 $2,149 $1,570 $566 2.70%5957000 Blythedale Childrens Hospital $201 $181 $158 $18 0.87%5957001 Westchester Medical Center $8,155 $5,239 $9,656 $4,023 3.11%6027000 Wyoming County Community H. $689 $825 $467 $260 4.16%6120700 Soldiers and Sailors Meml. H. $919 $45 $42 $4 0.67%7000001 Bronx-Lebanon H. Ctr. $44,658 $13,405 $14,465 $13,556 7.01%7000002 Jacobi Medical Center $8,791 $23,082 $23,132 $28,615 9.25%7000006 Montefiore H. + M.C. $23,289 $15,550 $17,838 $6,067 2.54%7000008 Lincoln Medical + Mental Hlth Ctr $9,618 $24,785 $24,612 $42,945 13.04%7000011 Calvary Hospital $686 $0 $0 $0 0.00%7000014 St Barnabas Hospital $22,560 $14,075 $13,768 $19,879 10.79%7000024 North Central Bronx Hospital $4,842 $11,277 $9,635 $15,327 11.89%7000025 NY Westchester Square M C $1,029 $1,777 $1,504 $880 4.38%7001002 Brookdale Hosp M C $23,129 $7,220 $7,914 $4,744 4.48%

70
Exhibit 18 (Continued)
Allocations by Individual Hospital: Actual, CARE, BASE, and BASE STEEP, with BASE Percent of Cost, 2010: All 200 New York State Hospitals—
All Allocations Total $847 Million Statewide (All Dollars in Thousands)
Hospital Name
Total Actual
Allocation CARE BASE BASE
STEEP
BASE % of cost
7001003 Brooklyn Hospital $4,612 $4,829 $4,300 $1,825 3.17%7001008 New York Community / Brooklyn $631 $829 $877 $319 2.72%7001009 Coney Island Hospital $4,153 $15,997 $16,569 $24,161 10.90%7001016 Kings County Hospital Center $15,302 $36,697 $37,790 $71,658 14.17%7001017 Long Island College Hospital $6,153 $4,583 $4,671 $1,921 3.07%7001019 Lutheran Medical Center $34,477 $6,711 $7,333 $4,091 4.17%7001020 Maimonides Medical Center $14,949 $9,081 $9,562 $3,924 3.07%7001021 New York Methodist H of Brooklyn $4,092 $5,988 $5,920 $2,266 2.86%7001024 Episcopal Health Services, Inc $1,766 $1,717 $1,762 $616 2.61%7001033 Kingsbrook Jewish M C $1,504 $2,923 $2,626 $1,299 3.70%7001035 Wyckoff Heights Hospital $8,695 $7,066 $6,393 $5,316 6.22%7001037 State University H. Downstate $5,418 $8,431 $9,950 $6,604 4.96%7001041 Beth Israel M C - Kings Hwy Div $1,291 $929 $1,094 $361 2.46%7001045 Woodhull Medical + Mental Hlth Ctr $8,021 $26,816 $25,009 $46,094 13.78%7001046 Interfaith Medical Center $12,918 $3,108 $3,299 $1,794 4.07%7002000 New York Downtown $6,532 $4,192 $3,491 $888 1.90%7002001 Bellevue Hospital Center $14,507 $30,920 $32,212 $48,233 11.19%7002002 Beth Israel Medical Center $13,373 $3,610 $4,650 $946 1.52%7002009 Harlem Hospital Center $8,243 $14,023 $13,576 $16,761 9.23%7002012 Hospital for Special Surgery $966 $0 $0 $0 0.00%7002017 Lenox Hill Hospital $7,653 $3,294 $5,499 $1,726 2.35%7002020 Memorial H. for Cancer $7,709 $1,571 $4,072 $428 0.79%7002021 Metropolitan Hospital Center $7,288 $16,958 $15,576 $23,795 11.42%7002024 Mount Sinai Hospital $13,547 $10,054 $14,143 $5,390 2.85%7002026 New York Eye+Ear Infirmary $1,913 $2,636 $2,980 $3,323 8.33%7002031 Rockefeller University Hospital $43 $0 $0 $0 0.00%7002032 St Luke’s / Roosevelt H. Center $25,112 $14,719 $17,802 $10,408 4.37%7002037 St Vincent’s Hospital $3,250 $6,457 $3,010 $467 1.16%7002050 Goldwater Memorial Hospital $3,212 $0 $0 $0 0.00%7002051 Coler Memorial Hospital $2,214 $0 $0 $0 0.00%7002052 North General Hospital $1,602 $1,714 $920 $239 1.94%7002053 NY University Med Ctr $5,195 $923 $3,954 $457 0.86%7002054 New York Presbyterian H. $20,351 $8,333 $17,344 $3,519 1.52%7003000 City Hospital Ctr at Elmhurst $7,479 $30,515 $31,881 $59,092 13.85%7003001 Flushing H. and Medical Center $7,578 $8,838 $7,860 $9,836 9.35%7003003 Jamaica Hospital $34,641 $22,615 $22,243 $42,849 14.40%7003004 Long Island Jewish-Hillside M C $8,784 $7,471 $10,687 $4,069 2.85%7003006 Peninsula Hospital Center $1,548 $2,249 $2,285 $1,999 6.54%7003007 Queens Hospital Center $6,535 $23,393 $22,830 $46,887 15.35%

71
Exhibit 18 (Continued)
Allocations by Individual Hospital: Actual, CARE, BASE, and BASE STEEP, with BASE Percent of Cost, 2010: All 200 New York State Hospitals—
All Allocations Total $847 Million Statewide (All Dollars in Thousands)
Hospital Name
Total Actual
Allocation CARE BASE BASE
STEEP
BASE % of cost
7003010 New York Medical Ctr of Queens $7,629 $6,910 $6,936 $2,901 3.13%7003013 Forest Hills - North Shore $1,849 $2,404 $2,112 $935 3.31%7003015 Mount Sinai H. of Queens $4,909 $4,041 $4,753 $6,910 10.87%7004003 Staten Island University H. $8,231 $11,115 $11,930 $7,805 4.89%7004010 Richmond University Medical $7,484 $5,407 $4,944 $2,884 4.36%

72
APPENDIX Exhibits

Appendix Exhibit 1
Actual Uncompensated Care Distributions to New York State Hospitals, 2005 - 2010
Dollar Uncompensated Care Distributions in Name (listed alphabetically)
2005 2006 2007 2008
2009 2010 *
k Medical Center 652,011 789,524 1,322,080 1,620,907 1,220,457 $1,804,808
edical Center Hospital 2,931,590 3,406,576 4,318,301 6,022,734 5,713,667 $5,067,711
edical Center South Campus 44,470 301 39,102 40,565 36,948 $58,542
Hospital Association 748,730 664,511 477,396 713,197 1,360,177 $1,153,914
m Memorial Hospital 303,068 251,909 385,917 442,251 199,039 $206,567
rton sum ‐ two hospitals 2,246,058 1,940,926 1,480,785 1,597,956 1,209,134 $1,953,147
en Medical Center 1,009,393 895,512 974,614 1,394,731 1,634,775 $1,590,012
emorial Hospital 682,532 768,572 934,807 1,374,778 1,239,358 $1,027,548
m (000155, 000156) 1,735,754 1,974,544 2,414,626 2,954,772 3,551,336 $3,476,216
ospital Of Schoharie County 527,536 745,266 784,990 832,777 1,148,086 $912,505
ospital Center 14,324,406 14,324,406 14,324,406 14,324,406 14,324,406 $14,506,897
Women’s Hospital 89,822 45,487 38,252
ne Hospital 1,193,069 1,742,108 2,280,455 2,000,890 3,320,811 $2,173,392
Chaffee Hospital 313,384 502,074 322,118 565,547 567,296 $389,829
l Kings Highway Hospital 650,645 0 1,348,407 1,444,797 435,941 $1,291,175
l Medical Center 40,087,707 39,463,138 30,614,455 24,038,443 11,934,105 $13,372,697
e Children's Hospital 394,221 363,853 520,570 683,771 271,413 $200,697
anon Hospital Center 29,096,469 57,512,577 60,251,668 37,650,751 46,745,155 $44,658,196
University Hospital 23,027,399 15,356,907 19,262,468 13,591,233 24,516,368 $23,128,650
en Memorial Hospital M.C. 3,707,643 4,072,520 4,132,111 6,675,578 7,252,043 $7,368,646

74
Appendix Exhibit 1 (Continued)
Actual Uncompensated Care Distributions to New York State Hospitals, 2005 - 2010 Dollar Uncompensated Care Distributions in Op. Cert. No.
Hospital Name 2005 2006 2007 2008 2009 2010 *
7001003 Brooklyn Hospital Center 9,151,491 7,132,260 9,068,009 6,488,181 4,599,640 $4,612,165
0601000 Brooks Memorial Hospital 408,142 443,438 426,806 478,279 553,268 $563,383
5120000 Brunswick Hospital Center, Inc. 1,511,676 1,688,635 1,282,620
5902002 Burke Rehabilitation Hospital 0 513,587 162,934 119,066 183,803 $172,670
7002003 Cabrini Medical Center 3,245,583 1,317,362 2,022,813 606,716
7000011 Calvary Hospital, Inc. 478,659 655,395 828,452 585,684 697,034 $686,321
4429000 Canton‐Potsdam Hospital 786,172 663,216 492,757 2,126,831 1,569,959 $1,263,497
2238001 Carthage Area Hospital, Inc 346,668 370,845 476,838 509,543 427,762 $618,629
7003027 Catholic Med. Ctr. Brook/Qns/Caritas 15,371,022 16,214,695 11,956,314 11,851,907
5401001 Cayuga Medical Center At Ithaca 782,380 864,655 1,254,631 1,610,223 1,457,083 $1,840,419
5155000 Central Suffolk Hospital 1,254,513 506,695 765,933 1,090,737 1,445,182 $1,865,577
0901001 Champlain Valley Physicians Hospital 1,333,098 1,527,978 1,561,262 2,002,577 1,977,688 $2,065,925
0824000 Chenango Memorial Hospital 1,584,037 1,416,702 1,320,908 1,638,424 1,749,271 $1,645,289
3421000 Clifton Springs Hospital And Clinic 141,592 285,274 326,825 300,782 398,534 $433,273
4458700 Clifton sum(999994, 000056) 215,785 196,644 286,538 222,944 277,686 $193,184
7002051 Coler Memorial Hospital 2,434,621 2,434,621 2,434,621 2,434,621 2,434,621 $2,214,098
1001000 Columbia Memorial Hospital 1,231,371 1,447,437 2,068,667 1,855,570 2,141,284 $2,318,849
5263700 Com Gen Hosp ‐ Grover Hermann Div 289,976 1,108,137 387,564 620,865 615,626 $546,619
3301000 Community General Hospital 816,124 727,060 863,567 963,654 1,021,869 $1,166,388
5263000 Community General Hospital Of SC 8,330,153 3,944,408 7,442,527 8,317,814 9,059,556 $9,193,498
5925000 Community Hospital At Dobbs Ferry 157,797 340,192 299,778 254,741 414,176 $259,481
2625000 Community Memorial Hospital, Inc. 627,104 617,629 544,857 531,198 700,883 $752,834
7001009 Coney Island Hospital 3,857,457 3,857,457 3,857,457 3,857,457 3,857,457 $4,153,473

75
Appendix Exhibit 1 (Continued)
Actual Uncompensated Care Distributions to New York State Hospitals, 2005 - 2010 Dollar Uncompensated Care Distributions in Op. Cert. No.
Hospital Name 2005 2006 2007 2008 2009 2010 *
5001000 Corning Hospital 1,839,795 1,540,643 2,354,733 2,240,858 772,353 $2,157,942
3522000 Cornwall/St. Luke’s sum – two hosps 2,097,245 2,742,308 2,920,294 3,901,680 3,639,787 $3,519,072
1101000 Cortland Memorial Hospital 1,077,792 1,203,749 1,045,541 1,774,624 1,169,125 $1,345,583
3301008 Crouse Hospital 1,928,630 2,341,105 2,678,740 2,904,510 3,198,019 $3,639,982
0226700 Cuba Memorial Hospital, Inc. 527,689 314,703 389,181 484,377 578,909 $789,459
1229700 Delaware Valley Hospital 712,288 1,190,549 939,979 1,020,570 618,750 $554,207
5127000 Eastern Long Island Hospital 390,711 285,817 253,384 370,515 666,558 $860,545
4423000 Edward John Noble Hospital 385,712 452,670 509,328 487,904 451,758 $552,394
1552701 Elizabethtown Community Hospital 396,635 349,933 289,670 362,215 409,167 $418,944
5526700 Ellenville Community Hospital 3,121,882 1,698,704 1,534,309 1,267,994 1,212,791 $1,766,415
4601001 Ellis Hospital 1,182,540 1,420,126 1,708,448 4,782,366 4,685,410 $3,928,892
7003000 Elmhurst Hospital Center 6,774,681 6,774,681 6,774,681 6,774,681 6,774,681 $7,478,708
7001024 Episcopal sum ‐ three hospitals 3,398,216 3,269,171 3,557,491 3,298,114 2,896,717 $1,765,807
1401005 Erie County Medical Center 4,171,029 4,171,029 4,171,029 4,171,029 4,171,029 $4,216,936
3429000 F.F. Thompson Hospital 662,242 745,218 847,412 976,505 853,794 $804,348
3202003 Faxton St. Luke’s ‐ three hospitals 1,439,170 1,654,382 1,632,111 1,736,423 1,689,099 $2,472,655
7003001 Flushing Hospital Medical Center 7,974,376 9,881,200 9,344,275 7,933,768 11,124,589 $7,578,235
3801000 Fox Memorial Hospital, A.O. 1,255,237 1,673,735 1,362,126 1,626,877 1,682,003 $1,582,895
2910000 Franklin Hospital Medical Center 2,843,029 2,120,238 1,366,212 1,713,034 2,386,878 $2,944,310
3402000 Geneva General Hospital 1,431,352 1,027,229 1,300,163 1,167,293 1,494,751 $1,387,966
5601000 Glens Falls Hospital 2,396,751 2,636,768 2,465,136 2,373,907 3,162,524 $4,007,540
7002050 Goldwater Memorial Hospital 3,520,356 3,520,356 3,520,356 3,520,356 3,520,356 $3,211,610
4329000 Good Samaritan Hospital 2,007,738 2,877,853 3,821,462 3,371,896 2,786,370 $4,416,633

76
Appendix Exhibit 1 (Continued)
Actual Uncompensated Care Distributions to New York State Hospitals, 2005 - 2010 Dollar Uncompensated Care Distributions inOp. Cert. No.
Hospital Name 2005 2006 2007 2008 2009 2010 *
5154001 Good Samaritan Hospital 4,423,482 3,503,196 4,127,100 5,919,256 7,149,819 $8,527,566
7002009 Harlem Hospital Center 8,554,787 8,554,787 8,554,787 8,554,787 8,554,787 $8,242,942
4322000 Helen Hayes Hospital 1,630,284 1,630,284 1,630,284 1,630,284 1,630,284 $1,467,256
4401000 Hepburn Medical Center 2,008,313 1,001,508 624,588 795,722 821,390 $819,858
2701001 Highland Hospital Of Rochester 884,420 1,458,721 1,454,068 1,374,235 1,761,262 $1,731,973
7002011 Hospital For Joint Diseases 1,467,796 1,399,007 1,430,555 1,315,827
7002012 Hospital For Special Surgery 745,373 869,560 1,012,203 1,227,851 1,232,217 $966,032
5901000 Hudson Valley Hospital Center 460,947 1,468,047 897,205 1,031,672 1,161,299 $1,726,687
5153000 Huntington Hospital 2,086,496 1,616,930 2,789,178 3,359,086 3,857,706 $3,767,766
3154000 Inter Community Memorial Hospital 636,472 517,368 604,009 663,207 543,193 $578,192
7001046 Interfaith Medical Center 23,999,154 6,652,638 12,905,413 21,214,450 12,820,295 $12,917,697
5022000 Ira Davenport Memorial Hospital 802,034 849,411 777,529 1,166,525 942,091 $1,245,931
7000002 Jacobi Medical Center 8,596,565 8,596,565 8,596,565 8,596,565 8,596,565 $8,791,419
7003003 Jamaica Hospital Medical Center 32,105,338 43,361,588 31,946,228 35,305,887 35,428,610 $34,640,623
5149000 John T. Mather Memorial Hospital 1,048,152 1,846,713 1,228,158 865,110 1,212,373 $2,051,361
0228000 Jones Memorial Hospital 444,798 795,714 449,706 446,263 965,294 $663,385
1401014 Kaleida summary ‐ see below
1404000 Kenmore Mercy Hospital 384,320 473,449 506,175 556,239 602,583 $818,060
7001016 Kings County Hospital Center 15,013,975 15,013,975 15,013,975 15,013,975 15,013,975 $15,301,576
7001033 Kingsbrook Jewish Medical Center 2,070,981 5,970,135 5,582,805 2,500,476 2,538,139 $1,504,177
5501001 Kingston Hospital 1,347,368 1,113,231 1,623,113 1,512,744 2,159,584 $2,384,860
7001017 L.I. College Hospital 11,646,984 21,571,912 12,840,610 17,082,551 8,518,496 $6,153,303
7003004 L.I. Jewish Med Ctr 14,119,493 14,732,411 12,727,174 8,523,477 8,133,003 $8,784,455
2728001 Lakeside Memorial Hospital 207,950 461,032 513,203 325,292 413,023 $359,933

77
Appendix Exhibit 1 (Continued)
Actual Uncompensated Care Distributions to New York State Hospitals, 2005 - 2010 Dollar Uncompensated Care Distributions inOp. Cert. No.
Hospital Name 2005 2006 2007 2008 2009 2010 *
5922000 Lawrence Hospital 806,252 971,978 1,140,384 962,579 1,110,624 $1,392,195
3701000 Lee Memorial Hospital, A. L. 639,363 678,026 899,745 1,035,238 404,444 $0
7002017 Lenox Hill Hospital 4,776,000 4,928,091 4,898,249 5,296,630 5,882,530 $7,653,348
2424000 Lewis County General Hospital 549,673 619,766 571,111 511,262 688,057 $885,659
7000008 Lincoln Medical And Mental Hlth Ctr 9,421,550 9,421,550 9,421,550 9,421,550 9,421,550 $9,618,489
2129700 Little Falls Hospital 550,761 682,521 747,643 727,919 735,294 $844,518
3101000 Lockport Memorial Hospital 317,420 310,354 301,901 290,523 377,062 $417,909
2902000 Long Beach Medical Center 1,612,388 1,098,649 1,153,842 1,621,672 1,602,314 $1,558,320
7001019 Lutheran Medical Center 19,326,237 16,673,501 26,963,815 25,551,089 34,207,879 $34,476,556
7001020 Maimonides Medical Center 15,527,271 17,760,376 16,542,360 15,474,593 13,019,535 $14,949,411
7002019 Manhattan Eye Ear & Throat Hospital 2,960,959 3,323,781 1,275,576 834,980 1,222,752
1226701 Margaretville Memorial Hospital 4,200,332 437,039 140,000 611,297 445,061 $582,330
4402000 Massena Memorial Hospital 686,519 829,431 785,308 952,527 1,013,131 $1,135,071
3622000 Medina Memorial Hospital 481,163 535,404 569,847 468,346 632,205 $493,136
7002020 Memorial Hospital For Cancer And All 6,850,247 5,576,285 6,415,913 6,320,429 7,430,884 $7,708,682
0101003 Memorial Hospital, Albany 650,014 775,069 663,813 834,114 773,572 $1,210,885
3535001 Mercy Community Hospital 989,340 1,538,146 1,725,592 2,862,217 3,083,116 $3,536,049
1401008 Mercy Hospital Of Buffalo 1,185,043 1,419,122 1,621,668 1,524,687 1,509,595 $2,097,104
2909000 Mercy Medical Center 1,629,589 2,401,134 2,104,115 2,495,949 2,247,149 $2,797,050
7002021 Metropolitan Hospital Center 7,345,640 7,345,640 7,345,640 7,345,640 7,345,640 $7,288,090
2701006 Monroe Community Hospital 0 0 7,308 7,877
7000006 Montefiore Medical Center 25,097,294 21,713,824 19,430,449 20,620,392 26,793,526 $23,289,016
1564701 Moses Ludington Hospital 145,260 142,157 549,260 411,383 464,476 $438,413
7002024 Mount Sinai Hospital 14,847,460 16,025,267 13,863,578 11,812,403 13,380,617 $13,547,268

78
Appendix Exhibit 1 (Continued)
Actual Uncompensated Care Distributions to New York State Hospitals, 2005 - 2010 Dollar Uncompensated Care Distributions inOp. Cert. No.
Hospital Name 2005 2006 2007 2008 2009 2010 *
7003015 Mount Sinai Hospital Of Queens 2,342,459 2,291,527 1,978,721 1,999,069 3,580,205 $4,909,036
5903000 Mount Vernon Hospital 7,743,154 9,264,921 10,364,787 8,360,264 13,789,972 $10,480,597
3121001 Mt. St. Mary's Hospital 143,478 170,277 335,119 345,697 426,059 $635,869
7001008 N.Y. Community Hospital Of Brooklyn 359,470 387,643 753,709 390,882 547,950 $630,656
2950002 Nassau County Medical Center 7,547,805 7,547,805 7,547,805 7,547,805 7,547,805 $7,424,335
1701000 Nathan Littauer Hospital & Nurs Home 816,393 779,546 1,556,987 1,508,342 1,654,645 $2,034,085
2952006 New Island Hospital 714,283 0 604,780 1,006,033 823,210 $1,363,814
7002054 New York ‐ Presbyterian – four hosps 34,453,166 30,839,357 29,546,966 26,486,207 27,856,365 $20,351,378
7002026 New York Eye And Ear Infirmary 1,351,260 1,679,475 1,921,559 2,984,867 2,828,972 $1,913,494
7001021 New York Methodist Hospital 10,667,686 8,829,738 5,833,605 4,104,386 3,629,542 $4,091,989
7002053 New York University ‐ three hospitals 4,065,559 5,200,053 4,541,839 4,720,020 6,133,280 $5,195,446
5820000 Newark‐Wayne Community Hospital 789,160 1,170,301 1,263,008 1,607,669 2,231,786 $2,518,376
3102000 Niagara Falls Memorial Medical Ctr. 475,802 450,302 596,471 1,345,561 881,957 $1,238,660
2527000 Nicholas H. Noyes Memorial Hospital 590,024 642,863 601,521 469,484 749,798 $844,567
7000024 North Central Bronx Hospital 4,940,311 4,940,311 4,940,311 4,940,311 4,940,311 $4,841,757
7002052 North General Hospital 8,847,447 5,002,932 5,280,198 6,424,404 3,100,439 $1,602,560
2951001 North Shore summary ‐ see below
2952005 North Shore Univ Hosp At Plainview 878,309 1,309,283 1,039,578 978,857 680,976 $976,003
1327000 Northern Dutchess Hospital 902,138 654,294 747,468 1,004,612 988,671 $1,460,048
5920000 Northern Westchester Hospital 713,029 1,003,092 1,199,827 1,151,160 895,278 $1,333,518
7003013 NSUH @ Forest Hills 3,189,004 2,102,791 1,763,343 2,617,504 1,972,114 $1,848,759
7003010 NY Medical Ctr Of Queens 7,884,477 8,209,592 7,176,367 7,272,783 6,111,664 $7,628,852
7000025 NY Westchester Sq. 681,564 619,710 708,820 718,135 627,706 $1,028,580
4324000 Nyack Hospital 1,283,046 1,720,846 2,769,339 2,105,301 2,142,510 $2,439,854

79
Appendix Exhibit 1 (Continued)
Actual Uncompensated Care Distributions to New York State Hospitals, 2005 - 2010 Dollar Uncompensated Care Distributions inOp. Cert. No.
Hospital Name 2005 2006 2007 2008 2009 2010 *
7002000 NYU Downtown Hospital 3,473,536 1,521,512 4,580,648 2,440,569 2,762,191 $6,531,943
1254700 O'Connor sum ‐ two hospitals 383,834 369,852 400,940 457,040 565,759 $436,106
0401001 Olean General Hospital 1,118,572 1,048,730 1,008,772 913,191 1,283,759 $1,319,367
2601001 Oneida Healthcare Center 666,273 774,926 690,079 1,245,835 1,087,123 $1,017,657
3702000 Oswego Hospital 1,264,380 1,106,718 891,285 1,003,085 1,575,395 $1,632,439
0301001 Our Lady Of Lourdes Memorial Hosp. 1,141,237 1,518,214 1,963,938 2,521,940 2,411,012 $1,926,264
7000005 Our Lady Of Mercy Medical Center 5,347,844 5,347,628 4,435,770 4,459,279
2754001 Park Ridge sum ‐ three hospitals 1,891,089 2,425,052 2,962,941 3,359,233 3,413,757 $3,588,274
7003020 Parkway 1,006,009 358,504 671,614 464,233
7003006 Peninsula Hospital Center 1,954,481 1,306,716 1,963,410 1,110,988 1,237,921 $1,547,764
5932000 Phelps Memorial Hospital Center 1,025,869 1,000,791 1,514,186 1,187,003 1,073,655 $1,539,863
3950000 Putnam Hospital Center 809,757 1,208,959 823,400 1,470,247 1,651,630 $2,054,930
7003007 Queens Hospital Center 6,144,656 6,144,656 6,144,656 6,144,656 6,144,656 $6,535,095
2221700 River 315,135 140,000 287,120 796,983 391,861 $514,421
2701003 Rochester General Hospital 5,601,074 5,620,066 5,489,036 7,544,521 7,393,612 $8,059,197
7002031 Rockefeller University 0 0 0 0 0 $42,834
3201002 Rome Memorial Hospital 755,545 557,243 606,349 687,350 713,252 $955,479
1401010 Roswell Park Cancer Institute 2,474,478 2,474,478 2,474,478 2,474,478 2,474,478 $2,227,030
3529000 Saint Anthony Community Hospital 399,684 433,234 469,130 571,935 375,050 $389,372
4102002 Samaritan Hospital 1,026,418 1,000,233 1,012,656 1,424,622 1,533,286 $2,057,903
2201000 Samaritan Medical Center 1,604,835 1,535,821 1,519,885 1,758,709 2,070,098 $2,614,340
4501000 Saratoga Hospital And Nursing Home 684,631 842,917 1,048,235 1,069,386 1,332,189 $2,001,529
4823000 Schuyler Hospital 682,344 983,367 1,061,858 658,579 1,465,611 $746,823
4102003 Seton Health System, Inc. 734,142 1,285,121 1,316,761 1,559,338 1,996,683 $2,128,434
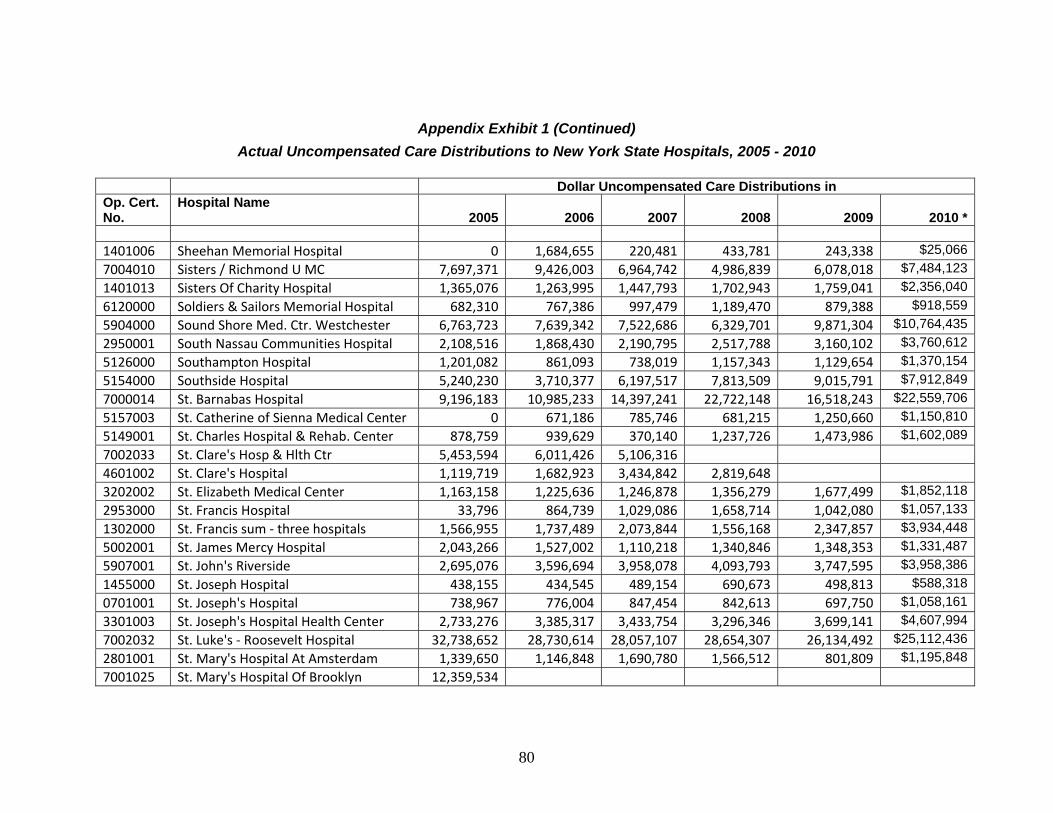
80
Appendix Exhibit 1 (Continued)
Actual Uncompensated Care Distributions to New York State Hospitals, 2005 - 2010 Dollar Uncompensated Care Distributions inOp. Cert. No.
Hospital Name 2005 2006 2007 2008 2009 2010 *
1401006 Sheehan Memorial Hospital 0 1,684,655 220,481 433,781 243,338 $25,066
7004010 Sisters / Richmond U MC 7,697,371 9,426,003 6,964,742 4,986,839 6,078,018 $7,484,123
1401013 Sisters Of Charity Hospital 1,365,076 1,263,995 1,447,793 1,702,943 1,759,041 $2,356,040
6120000 Soldiers & Sailors Memorial Hospital 682,310 767,386 997,479 1,189,470 879,388 $918,559
5904000 Sound Shore Med. Ctr. Westchester 6,763,723 7,639,342 7,522,686 6,329,701 9,871,304 $10,764,435
2950001 South Nassau Communities Hospital 2,108,516 1,868,430 2,190,795 2,517,788 3,160,102 $3,760,612
5126000 Southampton Hospital 1,201,082 861,093 738,019 1,157,343 1,129,654 $1,370,154
5154000 Southside Hospital 5,240,230 3,710,377 6,197,517 7,813,509 9,015,791 $7,912,849
7000014 St. Barnabas Hospital 9,196,183 10,985,233 14,397,241 22,722,148 16,518,243 $22,559,706
5157003 St. Catherine of Sienna Medical Center 0 671,186 785,746 681,215 1,250,660 $1,150,810
5149001 St. Charles Hospital & Rehab. Center 878,759 939,629 370,140 1,237,726 1,473,986 $1,602,089
7002033 St. Clare's Hosp & Hlth Ctr 5,453,594 6,011,426 5,106,316
4601002 St. Clare's Hospital 1,119,719 1,682,923 3,434,842 2,819,648
3202002 St. Elizabeth Medical Center 1,163,158 1,225,636 1,246,878 1,356,279 1,677,499 $1,852,118
2953000 St. Francis Hospital 33,796 864,739 1,029,086 1,658,714 1,042,080 $1,057,133
1302000 St. Francis sum ‐ three hospitals 1,566,955 1,737,489 2,073,844 1,556,168 2,347,857 $3,934,448
5002001 St. James Mercy Hospital 2,043,266 1,527,002 1,110,218 1,340,846 1,348,353 $1,331,487
5907001 St. John's Riverside 2,695,076 3,596,694 3,958,078 4,093,793 3,747,595 $3,958,386
1455000 St. Joseph Hospital 438,155 434,545 489,154 690,673 498,813 $588,318
0701001 St. Joseph's Hospital 738,967 776,004 847,454 842,613 697,750 $1,058,161
3301003 St. Joseph's Hospital Health Center 2,733,276 3,385,317 3,433,754 3,296,346 3,699,141 $4,607,994
7002032 St. Luke's ‐ Roosevelt Hospital 32,738,652 28,730,614 28,057,107 28,654,307 26,134,492 $25,112,436
2801001 St. Mary's Hospital At Amsterdam 1,339,650 1,146,848 1,690,780 1,566,512 801,809 $1,195,848
7001025 St. Mary's Hospital Of Brooklyn 12,359,534

81
Appendix Exhibit 1 (Continued)
Actual Uncompensated Care Distributions to New York State Hospitals, 2005 - 2010 Dollar Uncompensated Care Distributions inOp. Cert. No.
Hospital Name 2005 2006 2007 2008 2009 2010 *
0101004 St. Peter's Hospital 1,021,299 1,218,923 3,121,697 3,706,064 3,725,555 $3,467,897
7002037 St. Vincent's Hospital ‐ two hospitals 16,991,848 11,598,318 8,413,023 8,063,791 10,470,744 $3,251,035
5907002 St. Joseph’s Medical Center 4,023,241 3,964,099 4,869,079 4,997,581 6,972,064 $8,606,253
7004003 Staten Island Univ. Hosp. ‐ two hosps 6,544,908 4,615,648 4,842,654 5,611,387 6,148,609 $8,230,807
2701005 Strong Memorial Hospital 7,059,287 7,170,883 7,980,786 9,360,254 10,505,420 $7,673,718
4353000 Summit Park Hospital – Detox 2,506,684 4,162,752 4,729,434 4,841,621 5,645,573 $3,735,844
4601004 Sunnyview Hospital 0 0 0 0 300,008 $519,215
0427000 TLC Lake Shore sum ‐ three hospitals 697,308 953,136 755,228 1,009,202 1,242,229 $1,615,746
1227000 Tri‐town Regional Hospital 459,947 0 0 0 $593,120
0303001 United Health Services Hospitals 3,174,735 3,744,503 4,716,485 4,221,085 4,864,480 $4,438,134
1801000 United Mem sum ‐ three hospitals 1,075,737 1,023,038 1,018,999 866,923 855,258 $880,922
3301007 University Hospital @ Syracuse 4,116,766 4,116,766 4,116,766 4,116,766 4,116,766 $3,889,107
5151001 University Hospital At Stony Brook 6,488,961 6,488,961 6,488,961 6,488,961 6,488,961 $6,334,467
7001037 University Hospital Of Brooklyn 5,635,643 5,635,643 5,635,643 5,635,643 5,635,643 $5,417,604
1302001 Vassar Brothers Hospital 1,701,999 2,389,244 2,902,660 2,832,555 4,235,170 $5,127,337
7001032 Victory Memorial Hospital 1,011,348 879,444 1,232,479 1,588,304
5957001 Westchester Medical Center 8,709,412 8,709,412 8,709,412 8,709,412 8,709,412 $8,154,949
0632000 Westfield Memorial Hospital 285,166 318,787 271,221 346,114 299,533 $292,889
5902001 White Plains Hospital Center 1,811,431 2,127,569 2,142,293 2,276,215 2,170,530 $2,128,645
2908000 Winthrop‐University Hospital 3,175,201 3,058,265 2,613,858 3,288,150 4,149,259 $4,941,591
0602001 Woman's Christian Association 1,081,009 917,116 1,019,742 1,059,650 1,222,726 $1,565,697
7001045 Woodhull Medical Center 7,637,122 7,637,122 7,637,122 7,637,122 7,637,122 $8,020,616
7001035 Wyckoff Heights Medical Center 12,748,056 9,292,422 13,032,482 23,878,762 16,601,998 $8,700,988
6027000 Wyoming County Community Hospital 603,944 556,224 575,343 568,319 593,076 $688,906

82
Appendix Exhibit 1 (Continued)
Actual Uncompensated Care Distributions to New York State Hospitals, 2005 - 2010 Notes * Sum of distributions for hospitals listed in 2010 totals $842,475,139
Hospitals are listed in slightly different orders or are groups in slightly different ways in various tables either because the data were originally compiled in those ways or to present the clearest possible comparisons over time (owing to hospital mergers, closings, and other changes over time).
This seems to be attributable to hospitals having been grouped in different ways in the two sets of data employed to prepare this table. Sources 2005-2005: 2009 distributions from 2007 need DOH database 2010: 2010 Pools final

83
Appendix Exhibit 2 presents the provision of the four types of uncompensated care, by individual hospitals, for 2006, 2007, and 2008. Data for all three years are available for discharges and ER visits; these are presented in Part A. We have data only for 2007 and 2008 for regular clinic visits and for ambulatory surgery; these are presented in Part B.
Appendix Exhibit 2 – A
Volumes of Uncompensated Care, 2006 – 2008:
Part A: Acute Care Discharges and ER Visits
Acute Care Discharges ER Visits
2006 2007 2008 2006 2007 2008Operating Cert. No. Hospital Name
1623001 Adirondack Medical Center 102 113 96 1,497 1,554 1,652 0101000 Albany Medical Center Hospital 516 638 666 7,911 6,913 6,556 0101005 Albany Medical Ctr South Clinical Cam 7 12 9 0 1 0 0101003 Albany, Memorial Hospital Of 114 146 104 3,570 4,776 4,644 1624000 Alice Hyde Memorial Hospital 73 141 226 1,183 1,316 1,324 2801000 Amsterdam Memorial Hospital 0 0 820 833 669 0701000 Arnot-Ogden Memorial Hospital 327 322 272 4,104 4,281 4,746 0501000 Auburn Memorial Hospital 181 99 156 6,022 2,539 0 3801000 Aurelia Osborn Fox Memorial Hospital 107 189 131 1,544 1,525 1,224 Bassett Hospital Of Schoharie 18 1,2927002001 Bellevue Hospital Center 1,529 1,545 1,853 26,251 25,949 25,987 Bellevue Woman’s Hospital 44 05501000 Benedictine Hospital 174 172 170 2,704 2,981 2,569 1427000 Bertrand Chaffee Hospital 19 24 24 664 660 637 7002002 Beth Israel Medical Center 395 336 315 9,827 9,798 10,436 7001041 Beth Israel Medical Center - Kings Highway Div 106 105 92 2,294 2,200 2,475 5957000 Blythedale Childrens Hospital 0 0 0 0 3535001 Bon Secours Community Hospital 500 513 220 4,021 3,698 3,788 7000001 Bronx-Lebanon Hospital Center 1,763 2,367 1,140 45,218 35,590 28,210 7001002 Brookdale Hospital Medical Center 392 407 498 19,353 18,233 16,957 5123000 Brookhaven Memorial Hospital Medical 667 1,012 944 7,198 7,853 7,372

84
Appendix Exhibit 2 – A (Continued)
Volumes of Uncompensated Care, 2006 – 2008:
Part A: Acute Care Discharges and ER Visits
Acute Care Discharges ER Visits
2006 2007 2008 2006 2007 2008Operating Cert. No. Hospital Name
7001003 Brooklyn Hospital 187 160 419 9,820 8,270 8,946 0601000 Brooks Memorial Hospital 75 66 71 1,427 1,513 1,433 Brunswick Hospital Center Inc 0 05902002 Burke Rehabilitation Center 0 0 0 4,328 0 Cabrini Medical Center 162 3,2227000011 Calvary Hospital 0 0 0 0 4429000 Canton-Potsdam Hospital 231 151 76 1,592 1,625 1,735 2238001 Carthage Area Hospital Inc 48 43 45 703 708 763 Catholic Medical Ctr of Brooklyn & Queens 996 2,696 16,962 17,2255263000 Catskill Regional Med Ctr - G Hermann S 0 448 484 489 4,901 5263700 Catskill Regional Medical Center 582 589 0 5,198 5,074 586 5401001 Cayuga Medical Center At Ithaca 142 174 151 622 2,557 2,734 Central Suffolk Hospital 251 8800901001 Champlain Valley Physicians Hospital M 304 396 266 3,441 3,433 110 0824000 Chenango Memorial Hospital Inc 115 83 102 6,367 5,164 5,085 7003000 City Hospital Center At Elmhurst 420 840 1,048 28,642 27,131 29,808 4401000 Claxton-Hepburn Medical Center 144 105 120 2,409 1,426 1,401 3421000 Clifton Springs Hospital And Clinic 25 32 37 779 759 971 4458700 Clifton-Fine Hospital 0 0 123 154 141 4720001 Cobleskill Regional Hospital 26 9 1,366 1,416 7002051 Coler Memorial Hospital 0 0 0 0 1001000 Columbia Memorial Hospital 191 219 151 3,951 4,111 3,995 5925000 Community Hospital At Dobbs Ferry 74 53 0 923 1,118 797 2625000 Community Memorial Hospital Inc 48 62 83 1,189 1,334 1,415 3301000 Community-General H. of Greater Syracuse 149 206 223 2,114 2,250 2,166

85
Appendix Exhibit 2 – A (Continued)
Volumes of Uncompensated Care, 2006 – 2008:
Part A: Acute Care Discharges and ER Visits
Acute Care Discharges ER Visits
2006 2007 2008 2006 2007 2008Operating Cert. No. Hospital Name
7001009 Coney Island Hospital 527 637 746 16,562 16,637 16,690 5001000 Corning Hospital 96 144 139 2,555 2,468 2,456 3522000 Cornwall Hospital 461 8,732 1101000 Cortland Memorial Hospital Inc 142 137 145 2,176 2,186 2,182 3301008 Crouse Hospital 619 565 382 3,219 3,447 3,297 0226700 Cuba Memorial Hospital Inc 0 0 1,528 1,559 1,474 1229700 Delaware Valley Hospital Inc 0 0 546 437 370 5127000 Eastern Long Island Hospital 158 147 59 767 770 871 Eddy Cohoes Rehabilitation Center 0 04423000 Edward John Noble / Gouverneur 56 50 52 593 668 731 1552701 Elizabethtown Community Hospital 0 0 355 354 384 5526700 Ellenville Regional Hospital 0 0 1,543 1,652 1,734 4601001 Ellis Hospital 207 215 492 3,601 4,426 8,245 7001024 Episcopal Health Services, Inc 329 200 150 3,008 4,793 3,668 1401005 Erie County Medical Center 614 586 1,232 6,913 6,761 6,672 3429000 F F Thompson Hospital 116 149 134 1,678 1,847 1,824 7003013 Forest Hills - North Shore 419 354 325 2,854 2,703 2,879 3202003 St Luke’s / Faxton Memorial Hospital Center 438 432 397 17,412 18,076 18,079 7003001 Flushing Hospital And Medical Center 520 587 341 5,803 6,699 7,248 2910000 Franklin Hospital Medical Center 392 633 261 3,118 3,776 4,521 3402000 Geneva General Hospital 281 376 212 2,006 2,219 2,137 2901000 Glen Cove - North Shore 156 172 164 2,574 2,737 2,684 5601000 Glens Falls Hospital 417 465 563 5,513 5,398 5,718 7002050 Goldwater Memorial Hospital 0 0 0 0 5154001 Good Samaritan Hospital / Suffern 446 397 341 5,242 4,068 9,609 4329000 Good Samaritan Hospital / West Islip 1,200 1,001 301 12,118 9,772 4,297

86
Appendix Exhibit 2 – A (Continued)
Volumes of Uncompensated Care, 2006 – 2008:
Part A: Acute Care Discharges and ER Visits
Acute Care Discharges ER Visits
2006 2007 2008 2006 2007 2008Operating Cert. No. Hospital Name
7002009 Harlem Hospital Center 417 466 463 18,035 18,050 17,837 4322000 Helen Hayes Hospital 0 0 0 0 2701001 Highland Hospital Of Rochester 403 632 565 2,295 1,995 2,150 Hospital For Joint Disease - Orthopedic I 66 07002012 Hospital For Special Surgery 89 85 151 0 0 5901000 Hudson Valley Hospital Center 167 201 215 4,700 5,422 5,197 5153000 Huntington Hospital 700 226 423 4,901 5,026 4,575 3154000 Inter-Community Memorial Hospital At 45 55 48 153 567 567 7001046 Interfaith Medical Center 555 466 209 7,844 8,265 8,370 5022000 Ira Davenport Memorial Hospital Inc 99 93 80 1,233 1,386 1,264 7000002 Jacobi Medical Center 685 1,005 1,210 21,989 22,462 28,320 7003003 Jamaica Hospital 2,318 891 961 22,344 23,183 23,764 5149000 John T Mather Memorial Hospital 244 240 211 2,104 2,235 2,179 0228000 Memorial Hospital Of Wm F & Gertrude F Jones 126 166 154 1,018 1,114 1,129 1401002 Kaleida Health / Women And Childrens H 515 416 323 2,823 2,894 2,806 1404000 Kenmore Mercy Hospital 111 137 112 2,016 2,232 1,879 7001016 Kings County Hospital Center 1,341 1,485 1,535 36,895 38,925 43,880 7001033 Kingsbrook Jewish Medical Center 60 73 104 2,637 2,863 0 5501001 Kingston Hospital 496 521 197 3,214 3,302 3,016 2728001 Lakeside Memorial Hospital 44 58 59 980 1,076 868 5922000 Lawrence Hospital 304 359 359 3,068 2,927 3,031 Lee Memorial, Albert Lindley 168 147 1,324 1,6057002017 Lenox Hill Hospital 506 449 600 3,256 3,461 4,338 2424000 Lewis County General Hospital 76 71 81 927 952 1,026 7000008 Lincoln Medical & Mental Health Center 727 1,117 1,002 38,842 40,246 41,523 2129700 Little Falls Hospital 0 0 1,282 1,319 1,440

87
Appendix Exhibit 2 – A (Continued)
Volumes of Uncompensated Care, 2006 – 2008:
Part A: Acute Care Discharges and ER Visits
Acute Care Discharges ER Visits
2006 2007 2008 2006 2007 2008Operating Cert. No. Hospital Name
3101001 Lockport Memorial Hospital 133 112 82 148 1,269 1,150 2902000 Long Beach Medical Center 74 156 137 2,122 2,210 1,652 7001017 Long Island College Hospital 471 480 452 6,345 7,002 7,639 7003004 Long Island Jewish-Hillside Med Ctr 910 852 870 4,868 1 4,635 7001019 Lutheran Medical Center 892 1,239 1,035 9,087 10,355 11,718 7001020 Maimonides Medical Center 587 599 536 7,614 8,131 8,912 Manhattan Eye Ear And Throat Hospital 567 398 01226701 Margaretville Memorial Hospital 0 0 426 547 479 3824000 Mary Imogene Bassett Hospital 282 336 288 1,094 1,171 1,369 4402000 Massena Memorial Hospital 94 106 134 1,343 1,591 2,058 3622000 Medina Memorial Hospital 135 109 70 813 1,045 859 7002020 Memorial Hospital For Cancer And Allied 0 0 0 344 0 1401008 Mercy Hospital Of Buffalo 327 473 280 4,025 4,819 5,224 2909000 Mercy Medical Center 449 361 350 2,616 3,051 3,839 7002021 Metropolitan Hospital Center 293 369 644 17,499 17,068 16,240 1401014 Millard Fillmore - Kaleida Health 661 509 560 8,675 8,501 8,319 2701006 Monroe Community Hospital 1 0 0 0 7000006 Montefiore Hospital & Medical Center 389 1,487 807 17,364 20,823 21,172 1564701 Moses-Ludington Hospital 0 0 816 869 829 7002024 Mount Sinai Hospital 355 662 595 8,810 13,187 14,365 7003015 Mount Sinai Hospital Of Queens 452 479 431 7,756 8,647 10,462 3121001 Mount St Mary’s Hospital Health Center 144 185 181 1,091 1,142 1,104 5903000 Mount Vernon Hospital 62 483 510 4,121 7,520 2950002 Nassau University Medical Center 1,426 2,065 1,537 19,349 19,559 21,203 1701000 Nathan Littauer Hospital 128 167 159 3,243 3,274 3,048 2952006 New Island Hospital 247 297 249 0 2,568 2,776

88
Appendix Exhibit 2 – A (Continued)
Volumes of Uncompensated Care, 2006 – 2008:
Part A: Acute Care Discharges and ER Visits
Acute Care Discharges ER Visits
2006 2007 2008 2006 2007 2008Operating Cert. No. Hospital Name
7001008 New York Community / Brooklyn 69 76 88 1,277 1 1,814 7002000 New York Downtown H. (Formerly NYU D’town) 478 485 479 5,399 6,313 6,653 7003010 New York Medical Ctr Of Queens 340 407 927 6,877 8,036 8,866 7001021 New York Methodist Hospital Of Brooklyn 505 482 641 6,204 6,693 7,326 7002054 New York Presbyterian Hospital 741 938 1,933 23,361 25,042 26,925 3102000 Niagara Falls Memorial Medical Center 487 204 140 3,034 3,091 2,775 2527000 Nicholas H Noyes Memorial Hospital 74 70 45 849 857 905 7000024 North Central Bronx Hospital 335 420 490 12,524 15,936 16,957 7002052 North General Hospital 0 372 255 0 5,981 6,156 2951001 North Shore University Hospital 1,024 1,055 1,038 5,961 6,480 6,471 1327000 Northern Dutchess Hospital 58 72 83 1,345 1,539 1,514 5920000 Northern Westchester Hospital 103 114 124 1,425 1,525 1,882 7002026 New York Eye And Ear Infirmary 229 159 124 0 0 7000025 NY Westchester Square Medical Center 185 221 258 1,677 1,677 1,643 4324000 Nyack Hospital 151 290 217 3,571 3,866 4,622 7002053 NY University Med Ctr 488 408 442 2,667 3,466 3,528 1254700 O’Connor Hospital 0 0 492 473 532 0401001 Olean General Hospital 365 352 357 2,458 3,007 3,211 2601001 Oneida Healthcare Center 103 91 71 1,965 2,141 2,488 3523000 Orange Regional Medical Center 705 664 806 8,547 8,656 8,804 3702000 Oswego Hospital 256 251 336 1,517 1,544 1,525 0301001 Our Lady Of Lourdes Memorial Hospital 207 207 183 3,569 3,569 4,213 Our Lady of Mercy Med. Ctr. (Montefiore later) 351 660 8,617 7,104 Parkway Hospital 172 7895155000 Peconic Bay Medical Center 260 299 3,824 3,948 7003006 Peninsula Hospital Center 159 201 240 4,753 5,221 4,640

89
Appendix Exhibit 2 – A (Continued)
Volumes of Uncompensated Care, 2006 – 2008:
Part A: Acute Care Discharges and ER Visits
Acute Care Discharges ER Visits
2006 2007 2008 2006 2007 2008Operating Cert. No. Hospital Name
5932000 Phelps Memorial Hospital Association 248 308 232 1,415 1,455 1,406 2952005 Plainview - North Shore 165 229 184 1,705 1,921 2,004 3950000 Putnam Community Hospital 238 303 346 1,720 2,033 2,189 7003007 Queens Hospital Center 745 918 1,091 19,298 23,715 19,934 7004010 Richmond University Medical 231 623 3,263 6,112 2221700 River Hospital 0 771 0 730 8,105 668 2701003 Rochester General Hospital 1,102 899 12,017 729 11,915 7002031 Rockefeller University Hospital 0 940 0 0 11,842 0 3201002 Rome Hospital And Murphy Memorial Ho 241 138 2,021 2,406 1401010 Roswell Park Memorial Institute 0 200 0 0 1,918 0 4102002 Samaritan Hospital Of Troy 206 191 4,317 4,931 2201000 Samaritan Medical Center 212 247 187 3,227 5,225 3,666 4501000 Saratoga Hospital 266 245 262 3,800 4,101 3,278 4823700 Schuyler Hospital 0 294 0 916 3,126 476 4102003 Seton Health System 273 221 2,822 857 857 1401006 Sheehan Memorial Emergency Hospital 7 310 0 0 4,004 0 1401013 Sisters Of Charity Hospital 128 83 175 2,615 3,476 Sisters Of Charity Medical Center 408 8,1056120700 Soldiers And Sailors Memorial Hospital 0 0 657 746 706 5904000 Sound Shore Medical Center Of Westchester 168 349 1,060 5,228 5,377 9,307 2950001 South Nassau Communities Hospital 341 424 574 3,419 3,739 3,875 5126000 Southampton Hospital 264 236 343 2,696 2,367 1,997 5154000 Southside Hospital 744 787 613 10,807 12,789 11,547 3529000 St Anthony Community Hospital 124 76 91 1,544 1,852 2,008 7000014 St Barnabas Hospital 231 199 1,385 19,182 20,636 19,927 5157003 St Catherine Of Siena 96 165 93 1,282 1,470 664

90
Appendix Exhibit 2 – A (Continued)
Volumes of Uncompensated Care, 2006 – 2008:
Part A: Acute Care Discharges and ER Visits
Acute Care Discharges ER Visits
2006 2007 2008 2006 2007 2008Operating Cert. No. Hospital Name
5149001 St Charles Hospital 101 107 57 2,640 2,951 2,515 St Clare’s Hospital Of Schenectady 0 03202002 St Elizabeth Medical Center 168 253 273 3,711 4,299 3,118 1302000 St Francis Hospital Of Poughkeepsie 241 304 117 3,780 4,988 4,988 2953000 St Francis Hospital Of Roslyn 254 103 101 436 521 479 5002001 St James Mercy Hospital 122 135 78 1,091 1,297 1,318 5907001 St Johns Riverside Hospital 367 829 534 3,976 4,398 4,734 1455000 St Joseph Hospital 72 128 0 1,609 1,876 2,005 3301003 St Josephs Hospital Health Center 245 492 531 6,364 6,478 6,205 0701001 St Josephs Hospital Of Elmira 153 172 125 2,300 2,192 2,049 5907002 St Josephs Hospital Yonkers 624 734 619 7,615 7,726 8,279 7002032 St Luke’s / Roosevelt Hospital Center 1,379 2,054 1,498 21,742 25,712 28,117 St Luke’s Cornwall Hospital / Cornwall 619 502 8,947 8,6752801001 St Mary’s Hospital At Amsterdam 139 174 159 2,671 3,644 3,575 0101004 St Peters Hospital 1,017 1,144 404 3,563 3,798 3,546 7002037 St Vincent’s Hospital 714 867 734 9,048 11,121 11,754 7004003 Staten Island University Hospital 1,068 857 972 7,651 8,363 5,753 5151001 University Hospital At Stony Brook 1,744 1,873 1,662 13,011 14,243 11,074 2701005 Strong Memorial Hospital 668 765 797 8,344 8,142 7,100 4353000 Summit Park Hospital / Rockland Co Infirmary 0 0 0 0 4601004 Sunnyview Hospital And Rehabilitation 0 0 0 0 2754001 Park Ridge Hospital 244 267 199 3,507 3,250 2,798 0427000 TLC Health Network 75 115 109 1,444 1,556 1,314 1227001 Tri-Town Regional Healthcare 0 1,064 0303001 United Health Services, Inc 859 592 592 5,125 5,055 5,013

91
Appendix Exhibit 2 – A (Continued)
Volumes of Uncompensated Care, 2006 – 2008:
Part A: Acute Care Discharges and ER Visits
Acute Care Discharges ER Visits
2006 2007 2008 2006 2007 2008Operating Cert. No. Hospital Name
1801000 United Memorial Medical Center 77 108 158 1,356 1,302 1,547 7001037 State University Hospital Downstate 926 1,026 921 7,799 8,592 10,173 3301007 SUNY Health Science Center At Syracuse 567 569 503 5,199 5,300 5,225 1302001 Vassar Brothers Medical Center 610 882 746 7,657 8,686 9,346 Victory Memorial Hospital 177 2,1495820000 Wayne Health Care 181 158 186 2,359 2,713 2,655 5957001 Westchester Medical Center 565 976 698 2,826 2,977 3,354 0632000 Westfield Memorial Hospital Inc 56 71 43 194 204 202 5902001 White Plains Hospital Medical Center 413 405 515 5,396 5,291 4,800 2908000 Winthrop University Hospital 705 719 991 2,354 2,716 3,131 0602001 Woman’s Christian Association 201 261 196 2,591 2,929 2,952 7001045 Woodhull Medical And Mental Health C 661 973 1,291 24,281 23,825 30,429 7001035 Wyckoff Heights Hospital 189 1,775 815 11,060 11,571 11,741 6027000 Wyoming County Community Hospital 113 93 91 1,081 1,111 1,065
Note: Hospitals lacking operating certificate numbers generally either closed or merged over the span of these three years.

92
Appendix Exhibit 2 – B
Volumes of Uncompensated Care, 2006 – 2008:
Part B: Clinic Visits and Ambulatory Surgery Procedures
Clinic uninsured visits
Ambulatory surgery
procedures Operating Cert. No.
Hospital Name
2007
2008
2007
2008
1623001 Adirondack Medical Center 1,883 2,080 37 34 0101000 Albany Medical Center Hospital 54 60 75 92 0101005 Albany Medical Ctr South Clinical Cam 0 832 537 0101003 Albany, Memorial Hospital Of 588 487 73 127 1624000 Alice Hyde Memorial Hospital 1,822 1,747 40 49 2801000 Amsterdam Memorial Hospital 380 244 26 36 0701000 Arnot-Ogden Memorial Hospital 158 173 113 127 0501000 Auburn Memorial Hospital 2,251 2,902 92 273 3801000 Aurelia Osborn Fox Memorial Hospital 3,819 3,782 38 29
Bassett Hospital Of Schoharie 7002001 Bellevue Hospital Center 93,274 109,449 2,550 2,772
Bellevue Woman’s Hospital 5501000 Benedictine Hospital 443 300 94 125 1427000 Bertrand Chaffee Hospital 1 10 7 7002002 Beth Israel Medical Center 9,331 6,183 561 492 7001041 Beth Israel Medical Center - Kings Highway Div 0 16 8 5957000 Blythedale Childrens Hospital 1,158 1,329 0 3535001 Bon Secours Community Hospital 1,374 1,235 11 7 7000001 Bronx-Lebanon Hospital Center 51,377 9,832 2,387 886 7001002 Brookdale Hospital Medical Center 3,845 3,866 38 78 5123000 Brookhaven Memorial Hospital Medical 910 2,621 220 201 7001003 Brooklyn Hospital 4,137 6,484 144 128 0601000 Brooks Memorial Hospital 44,664 0 36 27
Brunswick Hospital Center Inc 5902002 Burke Rehabilitation Center 166 340 0
Cabrini Medical Center 7000011 Calvary Hospital 1,396 0 0 4429000 Canton-Potsdam Hospital 1,776 2,570 50 69 2238001 Carthage Area Hospital Inc 2,001 2,616 12 13
Catholic Medical Center Of Brooklyn & 7,517 2395263000 Catskill Regional Med Ctr - G Hermann S 252 124 5263700 Catskill Regional Medical Center 1,377 0 165 0 5401001 Cayuga Medical Center At Ithaca 3,383 3,480 175 161
Central Suffolk Hospital 0901001 Champlain Valley Physicians Hospital M 19 0 120 109 0824000 Chenango Memorial Hospital Inc 17,878 11,969 458 500 7003000 City Hospital Center At Elmhurst 120,953 145,620 1,421 1,542 4401000 Claxton-Hepburn Medical Center 1,708 2,032 53 33 3421000 Clifton Springs Hospital And Clinic 478 271 21 12 4458700 Clifton-Fine Hospital 410 410 0
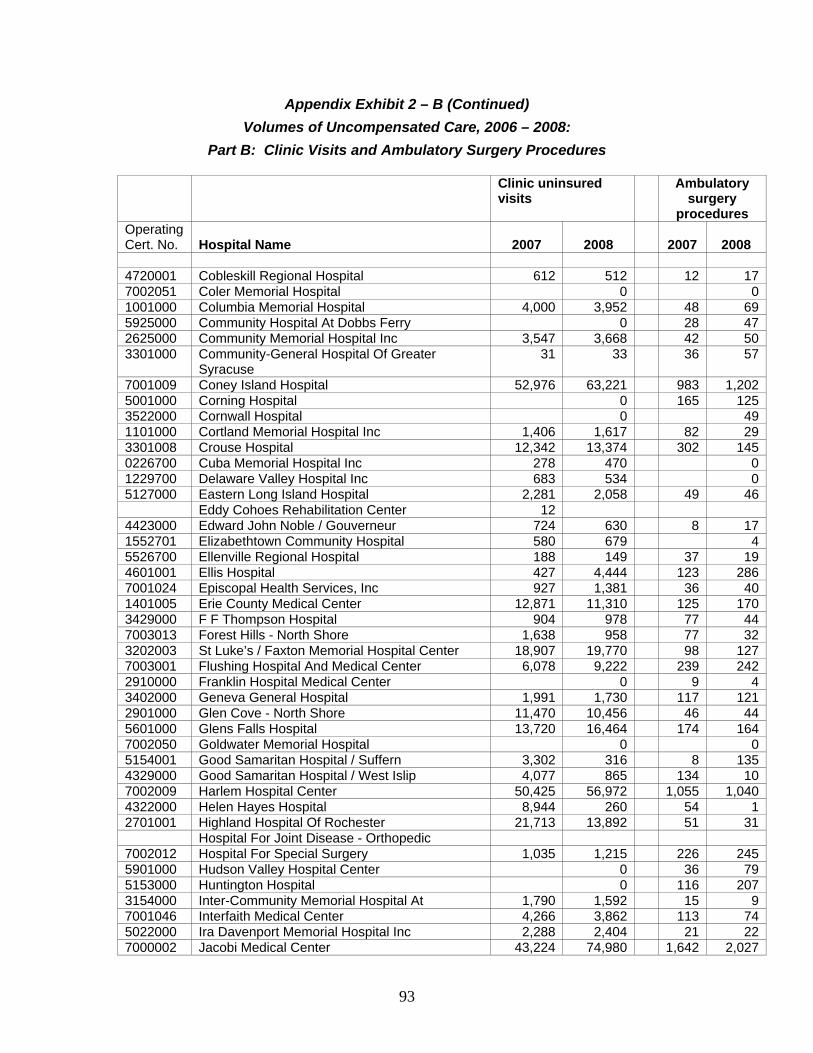
93
Appendix Exhibit 2 – B (Continued)
Volumes of Uncompensated Care, 2006 – 2008:
Part B: Clinic Visits and Ambulatory Surgery Procedures
Clinic uninsured visits
Ambulatory surgery
procedures Operating Cert. No.
Hospital Name
2007
2008
2007
2008
4720001 Cobleskill Regional Hospital 612 512 12 17 7002051 Coler Memorial Hospital 0 0 1001000 Columbia Memorial Hospital 4,000 3,952 48 69 5925000 Community Hospital At Dobbs Ferry 0 28 47 2625000 Community Memorial Hospital Inc 3,547 3,668 42 50 3301000 Community-General Hospital Of Greater
Syracuse 31 33 36 57
7001009 Coney Island Hospital 52,976 63,221 983 1,202 5001000 Corning Hospital 0 165 125 3522000 Cornwall Hospital 0 49 1101000 Cortland Memorial Hospital Inc 1,406 1,617 82 29 3301008 Crouse Hospital 12,342 13,374 302 145 0226700 Cuba Memorial Hospital Inc 278 470 0 1229700 Delaware Valley Hospital Inc 683 534 0 5127000 Eastern Long Island Hospital 2,281 2,058 49 46
Eddy Cohoes Rehabilitation Center 12 4423000 Edward John Noble / Gouverneur 724 630 8 17 1552701 Elizabethtown Community Hospital 580 679 4 5526700 Ellenville Regional Hospital 188 149 37 19 4601001 Ellis Hospital 427 4,444 123 286 7001024 Episcopal Health Services, Inc 927 1,381 36 40 1401005 Erie County Medical Center 12,871 11,310 125 170 3429000 F F Thompson Hospital 904 978 77 44 7003013 Forest Hills - North Shore 1,638 958 77 32 3202003 St Luke’s / Faxton Memorial Hospital Center 18,907 19,770 98 127 7003001 Flushing Hospital And Medical Center 6,078 9,222 239 242 2910000 Franklin Hospital Medical Center 0 9 4 3402000 Geneva General Hospital 1,991 1,730 117 121 2901000 Glen Cove - North Shore 11,470 10,456 46 44 5601000 Glens Falls Hospital 13,720 16,464 174 164 7002050 Goldwater Memorial Hospital 0 0 5154001 Good Samaritan Hospital / Suffern 3,302 316 8 135 4329000 Good Samaritan Hospital / West Islip 4,077 865 134 10 7002009 Harlem Hospital Center 50,425 56,972 1,055 1,040 4322000 Helen Hayes Hospital 8,944 260 54 1 2701001 Highland Hospital Of Rochester 21,713 13,892 51 31
Hospital For Joint Disease - Orthopedic 7002012 Hospital For Special Surgery 1,035 1,215 226 245 5901000 Hudson Valley Hospital Center 0 36 79 5153000 Huntington Hospital 0 116 207 3154000 Inter-Community Memorial Hospital At 1,790 1,592 15 9 7001046 Interfaith Medical Center 4,266 3,862 113 74 5022000 Ira Davenport Memorial Hospital Inc 2,288 2,404 21 22 7000002 Jacobi Medical Center 43,224 74,980 1,642 2,027

94
Appendix Exhibit 2 – B (Continued)
Volumes of Uncompensated Care, 2006 – 2008:
Part B: Clinic Visits and Ambulatory Surgery Procedures
Clinic uninsured visits
Ambulatory surgery
procedures Operating Cert. No.
Hospital Name
2007
2008
2007
2008
[7003003 Jamaica Hospital 18,586 16,023 194 229
5149000 John T Mather Memorial Hospital 2,644 2,147 46 47 0228000 Memorial Hospital Of Wm F & Gertrude F Jones 3,462 4,134 29 40 1401002 Kaleida Health / Women And Childrens H 3,426 3,056 55 87 1404000 Kenmore Mercy Hospital 1,039 1,003 253 213 7001016 Kings County Hospital Center 120,765 130,330 3,829 4,347 7001033 Kingsbrook Jewish Medical Center 1,223 0 32 0 2728001 Lakeside Memorial Hospital 1,396 2,601 9 6 5922000 Lawrence Hospital 0 95 76
Lee Memorial, Albert Lindley 166 77002017 Lenox Hill Hospital 118 3,521 114 322 2424000 Lewis County General Hospital 392 514 28 37 7000008 Lincoln Medical & Mental Health Center 69,620 76,251 3,025 1,727 2129700 Little Falls Hospital 749 546 11 13 3101001 Lockport Memorial Hospital 0 20 17 2902000 Long Beach Medical Center 6,256 6,928 25 86 7001017 Long Island College Hospital 4,517 4,812 164 142 7003004 Long Island Jewish-Hillside Med Ctr 25 25,587 327 250 7001019 Lutheran Medical Center 3,431 0 345 398 7001020 Maimonides Medical Center 28,231 31,558 108 129
Manhattan Eye Ear And Throat Hospital 3,774 2,1061226701 Margaretville Memorial Hospital 675 684 4 2 3824000 Mary Imogene Bassett Hospital 20,654 20,007 176 552 4402000 Massena Memorial Hospital 3,905 4,610 36 49 3622000 Medina Memorial Hospital 0 19 15 7002020 Memorial Hospital For Cancer And Allied 4,800 10,109 2,476 2,431 1401008 Mercy Hospital Of Buffalo 3,268 2,919 126 128 2909000 Mercy Medical Center 1,249 1,418 105 91 7002021 Metropolitan Hospital Center 58,417 71,655 1,152 1,501 1401014 Millard Fillmore - Kaleida Health 6,850 6,680 142 249 2701006 Monroe Community Hospital 0 0 7000006 Montefiore Hospital & Medical Center 50,879 34,479 414 472 1564701 Moses-Ludington Hospital 0 9 8 7002024 Mount Sinai Hospital 35,522 34,738 831 814 7003015 Mount Sinai Hospital Of Queens 1,303 1,394 61 42 3121001 Mount St Mary’s Hospital Health Center 671 970 33 92 5903000 Mount Vernon Hospital 5,144 3,312 143 29 2950002 Nassau University Medical Center 34,933 40,639 732 740 1701000 Nathan Littauer Hospital 6,356 7,909 35 40 2952006 New Island Hospital 64 0 105 232 7001008 New York Community / Brooklyn 0 2 9 7002000 New York Downtown (Earlier NYU Downtown) 1,674 2,070 124 113 7003010 New York Medical Ctr Of Queens 2,892 2,963 179 198

95
Appendix Exhibit 2 – B (Continued)
Volumes of Uncompensated Care, 2006 – 2008:
Part B: Clinic Visits and Ambulatory Surgery Procedures
Clinic uninsured visits
Ambulatory surgery
procedures Operating Cert. No.
Hospital Name
2007
2008
2007
2008
7001021 New York Methodist Hospital Of Brooklyn 3,117 2,743 912 813 7002054 New York Presbyterian Hospital 20,497 20,971 714 953 3102000 Niagara Falls Memorial Medical Center 1,062 582 71 93 2527000 Nicholas H Noyes Memorial Hospital 440 589 57 66 7000024 North Central Bronx Hospital 20,205 39,214 411 552 7002052 North General Hospital 141 0 168 2951001 North Shore University Hospital 22,524 24,567 1,310 1,363 1327000 Northern Dutchess Hospital 220 34 65 62 5920000 Northern Westchester Hospital 208 0 125 182 7002026 New York Eye And Ear Infirmary 13,365 13,579 1,617 1,671 7000025 NY Westchester Square Medical Center 0 53 37 4324000 Nyack Hospital 3,034 50 55 7002053 NY University Med Ctr 7,036 3,959 236 213 1254700 O’Connor Hospital 194 234 1 0401001 Olean General Hospital 969 2,524 125 118 2601001 Oneida Healthcare Center 326 279 23 35 3702000 Oswego Hospital 664 591 20 12 0301001 Our Lady Of Lourdes Memorial Hospital 14,859 15,909 328 413
Our Lady of Mercy Med. Ctr. (Montefiore later) 2,544 49 Parkway Hospital
5155000 Peconic Bay Medical Center 0 28 29 7003006 Peninsula Hospital Center 19,402 1,321 28 51 5932000 Phelps Memorial Hospital Association 6,122 5,489 37 47 2952005 Plainview - North Shore 0 34 33 3950000 Putnam Community Hospital 139 0 68 68 7003007 Queens Hospital Center 78,416 94,689 1,122 1,354 7004010 Richmond University Medical 2,859 4,664 340 161 2221700 River Hospital 10,193 786 3,335 1 2701003 Rochester General Hospital 596 36,028 316 7002031 Rockefeller University Hospital 25,383 0 357 0 3201002 Rome Hospital And Murphy Memorial Ho 994 152 1401010 Roswell Park Memorial Institute 1,451 800 100 0 4102002 Samaritan Hospital Of Troy 108 2,484 71 2201000 Samaritan Medical Center 2,050 1,614 78 86 4501000 Saratoga Hospital 1,982 3,541 77 178 4823700 Schuyler Hospital 3,096 1,140 117 98 4102003 Seton Health System 4,931 4,832 38 125 1401006 Sheehan Memorial Emergency Hospital 5,935 443 140 0 1401013 Sisters Of Charity Hospital 360 4,386 392
Sisters Of Charity Medical Center 6120700 Soldiers And Sailors Memorial Hospital 319 335 102 42 5904000 Sound Shore Medical Center Of Westchester 6,321 6,222 332 583 2950001 South Nassau Communities Hospital 6,896 7,261 62 56 5126000 Southampton Hospital 3,128 4,523 70 59

96
Appendix Exhibit 2 – B (Continued)
Volumes of Uncompensated Care, 2006 – 2008:
Part B: Clinic Visits and Ambulatory Surgery Procedures
Clinic uninsured visits
Ambulatory surgery
procedures Operating Cert. No.
Hospital Name
2007
2008
2007
2008
5154000 Southside Hospital 96 233 108 3529000 St Anthony Community Hospital 0 7 0 7000014 St Barnabas Hospital 16,074 17,653 218 123 5157003 St Catherine Of Siena 0 34 38 5149001 St Charles Hospital 5,284 4,473 71 64
St Clare’s Hospital Of Schenectady 3202002 St Elizabeth Medical Center 7,314 6,232 50 69 1302000 St Francis Hospital Of Poughkeepsie 403 460 83 36 2953000 St Francis Hospital Of Roslyn 83 4 39 32 5002001 St James Mercy Hospital 7,139 8,179 48 59 5907001 St Johns Riverside Hospital 10,987 11,914 79 90 1455000 St Joseph Hospital 96 101 99 109 3301003 St Josephs Hospital Health Center 7,175 7,515 105 139 0701001 St Josephs Hospital Of Elmira 775 813 41 31 5907002 St Josephs Hospital Yonkers 8,446 9,649 77 104 7002032 St Luke’s / Roosevelt Hospital Center 20,417 20,579 619 523
St Luke’s Cornwall Hospital / Cornwall 772801001 St Mary’s Hospital At Amsterdam 4,209 4,460 51 82 0101004 St Peters Hospital 15,035 16,775 127 173 7002037 St Vincent’s Hospital 10,560 9,688 204 213 7004003 Staten Island University Hospital 22,703 30,208 528 465 5151001 University Hospital At Stony Brook 57 520 381 2701005 Strong Memorial Hospital 5,947 6,065 117 130 4353000 Summit Park Hospital / Rockland Co Infirmary 22,174 0 2754001 Park Ridge Hospital 18,241 16,989 257 186 0427000 TLC Health Network 3,106 3,450 23 15 1227001 Tri-Town Regional Healthcare 0 0 0303001 United Health Services, Inc 22,760 18,320 390 433 1801000 United Memorial Medical Center 766 626 41 51 7001037 State University Hospital Downstate 7,181 7,860 295 246 3301007 SUNY Health Science Center At Syracuse 5,476 5,721 89 71 1302001 Vassar Brothers Medical Center 4,088 4,305 255 329 5820000 Wayne Health Care 0 28 42 5957001 Westchester Medical Center 5,045 6,746 134 203 0632000 Westfield Memorial Hospital Inc 58 67 45 43 5902001 White Plains Hospital Medical Center 1,320 1,558 182 135 2908000 Winthrop University Hospital 902 3 78 102 0602001 Woman’s Christian Association 2,874 2,382 92 77 7001045 Woodhull Medical And Mental Health C 55,671 96,618 1,256 1,791 7001035 Wyckoff Heights Hospital 1,803 2,009 72 72 6027000 Wyoming County Community Hospital 417 635 26 25
Note: Hospitals lacking an operating certificate number generally closed or merged during the span of these two years.

Appendix Exhibit 3
compensated Care Distributions in 2010, Actual Volumes of Uncompensated Care in 2008, and Composite CARE Measure, 2008
179 New York State Hospitals (Excluding 21 Major Public Hospitals)
Hospital Name $707.7M Total Distributions
in 2010
2008 Acute Self-Pay &
Free Discharges
2008 Emergency
Room Unins. and Free Visits
2008 Total Clinic
Unins. + Free Visits
2008 Ambulatory
Surgery Unins. +
Free Procedures
CARE = CARE after
income offset, =
$707,659,495
ical Center Hospital $5,067,711 666 6,556 60 92 $6,079,674
morial Hospital $1,210,885 104 4,644 487 127 $1,999,636ospital $3,467,897 404 3,546 16,775 173 $6,877,454ical Center Hospital – S. Campus $58,542 9 0 0 537 $642,387rial Hospital Inc $789,459 0 1,474 470 0 $257,416orial Hospital $663,385 154 1,129 4,134 40 $2,147,547f Lourdes Memorial Hospital $1,926,264 183 4,213 15,909 413 $5,059,709th Services, Inc $4,438,134 592 5,013 18,320 433 $8,310,225ral Hospital $1,319,367 357 3,211 2,524 118 $4,105,971Care Network $1,571,425 109 1,314 3,450 15 $1,704,527
morial Hospital $1,027,548 156 0 2,902 273 $2,057,012morial Hospital $563,383 71 1,433 0 27 $845,061hristian Association $1,565,697 196 2,952 2,382 77 $2,529,163emorial Hospital Inc $292,889 43 202 67 43 $378,254n Memorial Hospital $1,590,012 272 4,746 173 127 $3,204,972Hospital Of Elmira $1,058,161 125 2,049 813 31 $1,568,172
Memorial Hospital Inc $1,645,289 102 5,085 11,969 500 $4,570,614Valley Physicians Hospital $2,065,925 266 110 0 109 $1,649,753reene Medical Center $2,318,849 151 3,995 3,952 69 $2,186,777

98
Appendix Exhibit 3 (Continued)
Actual Uncompensated Care Distributions in 2010, Actual Volumes of Uncompensated Care in 2008, and Composite CARE Measure, 2008
179 New York State Hospitals (Excluding 21 Major Public Hospitals) Oper. Cert.
Hospital Name $707.7M Total Distributions
in 2010
2008 Acute Self-Pay &
Free Discharges
2008 Emergency
Room Unins. and Free Visits
2008 Total Clinic
Unins. + Free Visits
2008 Ambulatory
Surgery Unins. +
Free Procedures
CARE = CARE after
income offset, =
$707,659,495
1101000 Cortland Memorial Hospital Inc $1,345,583 145 2,182 1,617 29 $1,743,603 1226701 Margaretville Memorial Hospital $582,330 0 479 684 2 $0 1227001 Tri-Town Regional Healthcare $593,120 0 1,064 0 0 $221,464 1229700 Delaware Valley Hospital Inc $554,207 0 370 534 0 $25,219 1254700 O'Connor Hospital $436,106 0 532 234 1 $139,903 1302000 St Francis Hospital Of Poughkeepsie $3,934,448 117 4,988 460 36 $2,149,671 1302001 Vassar Brothers Hospital $5,127,337 746 9,346 4,305 329 $8,672,571 1327000 Northern Dutchess Hospital $1,460,048 83 1,514 34 62 $913,376 1401002 Kaleida Health - Women And Childrens $1,402,198 323 2,806 3,056 87 $3,716,762 1401006 Sheehan Memorial Emergency Hospital Inc $25,066 0 0 443 0 $74,810 1401008 Mercy of Buffalo & Our Lady Of Victory $2,097,104 280 5,224 2,919 128 $3,613,954 1401013 Sisters Of Charity Hospital $2,356,040 175 3,476 4,386 392 $3,095,526 1401014 M. Fillmore Sub/Kaleida (Excl. Women/Child) $4,209,956 560 8,319 6,680 249 $7,283,416 1404000 Kenmore Mercy Hospital $818,060 112 1,879 1,003 213 $1,420,133 1427000 Bertrand Chaffee Hospital $389,829 24 637 1 7 $289,491 1455000 St Joseph Intercomm. Hosp (Cheektowaga) $588,318 0 2,005 101 109 $464,145 1552701 Elizabethtown Community Hospital $418,944 0 384 679 4 $193,152 1564701 Moses-Ludington Hospital $438,413 0 829 0 8 $161,188 1623001 Adirondack Medical Center $1,804,808 96 1,652 2,080 34 $1,530,587

99
Appendix Exhibit 3 (Continued)
Actual Uncompensated Care Distributions in 2010, Actual Volumes of Uncompensated Care in 2008, and Composite CARE Measure, 2008
179 New York State Hospitals (Excluding 21 Major Public Hospitals) Oper. Cert.
Hospital Name $707.7M Total Distributions
in 2010
2008 Acute Self-Pay &
Free Discharges
2008 Emergency
Room Unins. and Free Visits
2008 Total Clinic
Unins. + Free Visits
2008 Ambulatory
Surgery Unins. +
Free Procedures
CARE = CARE after
income offset, =
$707,659,495
1624000 Alice Hyde Memorial Hospital $1,153,914 226 1,324 1,747 49 $2,224,709 1701000 Nathan Littauer Hospital $2,034,085 159 3,048 7,909 40 $3,335,561 1801000 United Memorial $880,922 158 1,547 626 51 $1,558,188 2129700 Little Falls Hospital $844,518 0 1,440 546 13 $103,005 2201000 Samaritan Medical Center $2,614,340 187 3,666 1,614 86 $2,673,834 2221700 River Hospital $514,421 0 668 786 1 $285,719 2238001 Carthage Area Hospital Inc $618,629 45 763 2,616 13 $1,007,075 2424000 Lewis County General Hospital $885,659 81 1,026 514 37 $912,478 2527000 Nicholas H Noyes Memorial Hospital $844,567 45 905 589 66 $611,494 2601001 Oneida Healthcare Center $1,017,657 71 2,488 279 35 $1,144,340 2625000 Community Memorial Hospital Inc $752,834 83 1,415 3,668 50 $1,572,046 2701001 Highland Hospital Of Rochester $1,731,973 565 2,150 13,892 31 $7,192,719 2701003 Rochester General Hospital $8,059,197 899 11,915 36,028 316 $15,691,295 2701005 Strong Memorial Hospital $8,375,740 797 7,100 6,065 130 $8,694,787 2701006 Monroe Community Hospital $0 0 0 0 0 $0 2728001 Lakeside Memorial Hospital $359,933 59 868 2,601 6 $1,075,229 2754001 The Unity Hospital Of Rochester $3,588,274 199 2,798 16,989 186 $5,098,905 2801000 Amsterdam Memorial $206,567 0 669 244 36 $83,642 2801001 St Mary’s Hospital At Amsterdam $1,195,848 159 3,575 4,460 82 $2,978,687

100
Appendix Exhibit 3 (Continued)
Actual Uncompensated Care Distributions in 2010, Actual Volumes of Uncompensated Care in 2008, and Composite CARE Measure, 2008
179 New York State Hospitals (Excluding 21 Major Public Hospitals) Oper. Cert.
Hospital Name $707.7M Total Distributions
in 2010
2008 Acute Self-Pay &
Free Discharges
2008 Emergency
Room Unins. and Free Visits
2008 Total Clinic
Unins. + Free Visits
2008 Ambulatory
Surgery Unins. +
Free Procedures
CARE = CARE after
income offset, =
$707,659,495
2901000 Glen Cove Hospital $3,212,726 164 2,684 10,456 44 $3,453,954 2902000 Long Beach Medical Center $1,558,320 137 1,652 6,928 86 $2,483,704 2908000 Winthrop University Hospital $4,941,591 991 3,131 3 102 $7,987,913 2909000 Mercy Medical Center $2,797,050 350 3,839 1,418 91 $3,441,153 2910000 Franklin General Hospital $2,944,310 261 4,521 0 4 $2,624,002 2950001 South Nassau Communities Hospital $3,760,612 574 3,875 7,261 56 $6,497,467 2951001 North Shore University Hospital $16,652,310 1,038 6,471 24,567 1,363 $13,679,279 2952005 Plainview Hospital $976,003 184 2,004 0 33 $1,729,381 2952006 New Island Hospital $1,363,814 249 2,776 0 232 $2,437,043 2953000 St Francis Hospital Of Roslyn $1,057,133 101 479 4 32 $686,260 3101001 Lockport Memorial Hospital $417,909 82 1,150 0 17 $840,617 3102000 Niagara Falls Memorial Medical Ctr. $1,238,660 140 2,775 582 93 $1,926,119 3121001 Mount St Mary’s H. of Niagara Falls $635,869 181 1,104 970 92 $1,948,458 3154000 Inter-Community Memorial H. at Newfane $578,192 48 567 1,592 9 $695,066 3201002 Rome Memorial Hospital $955,479 138 2,406 994 152 $1,787,816 3202002 St Elizabeth Hospital $1,852,118 273 3,118 6,232 69 $3,768,156 3202003 Faxton - St Luke’s Health Care $2,472,655 397 18,079 19,770 127 $10,504,119 3301000 Community-General H. of Greater Syracuse $1,166,388 223 2,166 33 57 $2,298,037 3301003 St Joseph’s Hospital Health Center (Syracuse) $4,607,994 531 6,205 7,515 139 $6,547,463

101
Appendix Exhibit 3 (Continued)
Actual Uncompensated Care Distributions in 2010, Actual Volumes of Uncompensated Care in 2008, and Composite CARE Measure, 2008
179 New York State Hospitals (Excluding 21 Major Public Hospitals) Oper. Cert.
Hospital Name $707.7M Total Distributions
in 2010
2008 Acute Self-Pay &
Free Discharges
2008 Emergency
Room Unins. and Free Visits
2008 Total Clinic
Unins. + Free Visits
2008 Ambulatory
Surgery Unins. +
Free Procedures
CARE = CARE after
income offset, =
$707,659,495
3301008 Crouse-Irving Memorial Hospital $3,639,982 382 3,297 13,374 145 $5,884,988 3402000 Geneva General Hospital $1,387,966 212 2,137 1,730 121 $2,182,999 3421000 Clifton Springs Hospital And Clinic $433,273 37 971 271 12 $451,929 3429000 F F Thompson Hospital $804,348 134 1,824 978 44 $1,654,024 3522000 Cornwall Hospital $3,519,072 461 8,732 0 49 $5,536,303 3523000 Orange Regional Medical Center $1,953,147 806 8,804 410 405 $8,834,869 3529000 St Anthony Community Hospital $389,372 91 2,008 0 0 $1,153,631 3535001 Bon Secours Community Hospital $3,536,049 220 3,788 1,235 7 $2,798,295 3622000 Medina Memorial Hospital $493,136 70 859 0 15 $724,274 3701000 Albert Lindley Lee Memorial Hospital $0 0 0 0 0 $0 3702000 Oswego Hospital $1,632,439 336 1,525 591 12 $2,558,074 3801000 Aurelia Osborn Fox Memorial Hospital $1,582,895 131 1,224 3,782 29 $1,967,868 3824000 Mary Imogene Bassett Hospital $3,476,216 288 1,369 20,007 552 $6,501,444 3950000 Putnam Community Hospital $2,054,930 346 2,189 0 68 $3,000,953 4102002 Samaritan Hospital of Troy $2,057,903 191 4,931 2,484 71 $2,941,077 4102003 Seton Health System $2,128,434 221 857 4,832 125 $2,550,468 4324000 Nyack Hospital $2,439,854 217 4,622 3,034 55 $3,138,030 4329000 Good Samaritan Hospital of Suffern $4,416,633 301 4,297 865 10 $3,488,014 4353000 Summit Park Hospital-Rockland County $3,775,686 0 0 22,174 0 $0

102
Appendix Exhibit 3 (Continued)
Actual Uncompensated Care Distributions in 2010, Actual Volumes of Uncompensated Care in 2008, and Composite CARE Measure, 2008
179 New York State Hospitals (Excluding 21 Major Public Hospitals) Oper. Cert.
Hospital Name $707.7M Total Distributions
in 2010
2008 Acute Self-Pay &
Free Discharges
2008 Emergency
Room Unins. and Free Visits
2008 Total Clinic
Unins. + Free Visits
2008 Ambulatory
Surgery Unins. +
Free Procedures
CARE = CARE after
income offset, =
$707,659,495
4401000 Claxton Hepburn Medical Center $819,858 120 1,401 2,032 33 $1,648,507 4402000 Massena Memorial Hospital $1,135,071 134 2,058 4,610 49 $2,396,266 4423000 Edward John Noble Hospital of Gouverneur $552,394 52 731 630 17 $628,260 4429000 Canton-Potsdam Hospital $1,263,497 76 1,735 2,570 69 $988 4458700 Clifton-Fine Hospital $193,184 0 141 410 0 $100,325 4501000 Saratoga Hospital $2,001,529 262 3,278 3,541 178 $3,629,099 4601001 Ellis H. (Includes St. Clare's Schenectady) $3,928,892 492 8,245 4,444 286 $6,610,884 4601004 Sunnyview H. And Rehabilitation Center $125,260 0 0 0 0 $0 4720001 Cobleskill Regional Hospital $912,505 9 1,416 512 17 $471,496 4823700 Schuyler Hospital $746,823 0 476 1,140 98 $369,983 5001000 Corning Hospital $2,157,942 139 2,456 0 125 $1,457,227 5002001 St James Mercy Hospital $1,331,487 78 1,318 8,179 59 $2,107,723 5022000 Ira Davenport Memorial Hospital Inc $1,245,931 80 1,264 2,404 22 $1,307,960 5123000 Brookhaven Memorial Hospital Med. Ctr. $7,368,646 944 7,372 2,621 201 $8,846,734 5126000 Southampton Hospital $1,370,154 343 1,997 4,523 59 $3,622,590 5127000 Eastern Long Island Hospital $860,545 59 871 2,058 46 $947,941 5149000 John T Mather Memorial Hospital $2,051,361 211 2,179 2,147 47 $1,970,067 5149001 St Charles Hospital $1,602,089 57 2,515 4,473 64 $1,612,754 5153000 Huntington Hospital $3,767,766 423 4,575 0 207 $3,042,118

103
Appendix Exhibit 3 (Continued)
Actual Uncompensated Care Distributions in 2010, Actual Volumes of Uncompensated Care in 2008, and Composite CARE Measure, 2008
179 New York State Hospitals (Excluding 21 Major Public Hospitals) Oper. Cert.
Hospital Name $707.7M Total Distributions
in 2010
2008 Acute Self-Pay &
Free Discharges
2008 Emergency
Room Unins. and Free Visits
2008 Total Clinic
Unins. + Free Visits
2008 Ambulatory
Surgery Unins. +
Free Procedures
CARE = CARE after
income offset, =
$707,659,495
5154000 Southside Hospital $7,912,849 613 11,547 96 108 $6,841,919 5154001 Good Samaritan Hospital Med. Ctr. $8,527,566 341 9,609 316 135 $3,802,034 5155000 Peconic Bay Medical Center $1,865,577 299 3,948 0 29 $3,269,228 5157003 St Catherine of Siena $1,150,810 93 664 0 38 $682,810 5263000 Catskill Regional Hospital - Harris $9,193,498 448 4,901 252 124 $4,698,327 5263700 Catskill Regional Hospital - Herman $546,619 0 586 0 0 $112,281 5401001 Cayuga Medical Center At Ithaca $1,840,419 151 2,734 3,480 161 $2,260,325 5501000 Benedictine Hospital $2,173,392 170 2,569 300 125 $1,847,122 5501001 Kingston Hospital $2,384,860 197 3,016 1,732 44 $2,362,176 5526700 Ellenville Community Hospital $1,766,415 0 1,734 149 19 $411,477 5601000 Glens Falls Hospital $4,007,540 563 5,718 16,464 164 $7,491,232 5820000 Via Health of Wayne $2,518,376 186 2,655 0 42 $1,953,405 5901000 Hudson Valley Hospital Center $1,726,687 215 5,197 0 79 $2,409,424 5902001 White Plains Hospital Medical Center $2,128,645 515 4,800 1,558 135 $5,055,472 5902002 Burke Rehabilitation Center $172,670 0 0 340 0 $2,967 5903000 Mount Vernon Hospital $10,480,597 510 7,520 3,312 29 $6,320,285 5904000 Sound Shore Med Ctr of Westchester $10,764,435 1,060 9,307 6,222 583 $12,095,117 5907001 St John’s Riverside-Yonkers $3,958,386 534 4,734 11,914 90 $7,113,837 5907002 St Joseph’s Hospital Yonkers $8,606,253 619 8,279 9,649 104 $8,477,452

104
Appendix Exhibit 3 (Continued)
Actual Uncompensated Care Distributions in 2010, Actual Volumes of Uncompensated Care in 2008, and Composite CARE Measure, 2008
179 New York State Hospitals (Excluding 21 Major Public Hospitals) Oper. Cert.
Hospital Name $707.7M Total Distributions
in 2010
2008 Acute Self-Pay &
Free Discharges
2008 Emergency
Room Unins. and Free Visits
2008 Total Clinic
Unins. + Free Visits
2008 Ambulatory
Surgery Unins. +
Free Procedures
CARE = CARE after
income offset, =
$707,659,495
5920000 Northern Westchester Hospital $1,333,518 124 1,882 0 182 $1,412,389 5922000 Lawrence Hospital $1,392,195 359 3,031 0 76 $3,376,030 5925000 Community Hospital at Dobbs Ferry $259,481 0 797 0 47 $429,307 5932000 Phelps Memorial Hospital Association $1,539,863 232 1,406 5,489 47 $2,836,606 5957000 Blythedale Childrens Hospital $200,697 0 0 1,329 0 $238,562 6027000 Wyoming County Community Hospital $689,740 91 1,065 635 25 $1,089,262 6120700 Soldiers and Sailors Mem. H. of Yates County $918,559 0 706 335 42 $59,456 7000001 Bronx Lebanon Hospital Center-Fulton Div. $44,658,196 1,140 28,210 9,832 886 $17,694,816 7000006 Montefiore Hospital & Medical Center $23,289,016 807 21,172 34,479 472 $20,525,733 7000011 Calvary Hospital $686,321 0 0 0 0 $0 7000014 St Barnabas Hospital $22,559,706 1,385 19,927 17,653 123 $18,578,884 7000025 NY Westchester Square Medical Center $1,028,580 258 1,643 0 37 $2,345,308 7001002 Brookdale Hospital Medical Center $23,128,650 498 16,957 3,866 78 $9,529,521 7001003 Brooklyn Hospital $4,612,165 419 8,946 6,484 128 $6,374,712 7001008 New York Community – Brooklyn $630,656 88 1,814 0 9 $1,094,862 7001017 Long Island College Hospital $6,153,303 452 7,639 4,812 142 $6,048,771

105
Appendix Exhibit 3 (Continued)
Actual Uncompensated Care Distributions in 2010, Actual Volumes of Uncompensated Care in 2008, and Composite CARE Measure, 2008
179 New York State Hospitals (Excluding 21 Major Public Hospitals) Oper. Cert.
Hospital Name $707.7M Total Distributions
in 2010
2008 Acute Self-Pay &
Free Discharges
2008 Emergency
Room Unins. and Free Visits
2008 Total Clinic
Unins. + Free Visits
2008 Ambulatory
Surgery Unins. +
Free Procedures
CARE = CARE after
income offset, =
$707,659,495
7001019 Lutheran Medical Center $34,476,556 1,035 11,718 0 398 $8,858,006 7001020 Maimonides Medical Center $14,949,411 536 8,912 31,558 129 $11,986,112 7001021 New York Methodist H. of Brooklyn $4,091,989 641 7,326 2,743 813 $7,904,353 7001024 Episcopal Health Services $1,765,807 150 3,668 1,381 40 $2,266,668 7001033 Kingsbrook Jewish Medical Center $1,504,177 104 0 0 0 $3,857,872 7001035 Wyckoff Heights Hospital $8,711,830 815 11,741 2,009 72 $9,326,913 7001041 Beth Israel Medical Ctr. - Kings Hwy. Div. $1,291,175 92 2,475 0 8 $1,226,387 7001046 Interfaith Medical Center $12,917,697 209 8,370 3,862 74 $4,102,999 7002000 New York Downtown Hospital $6,531,943 479 6,653 2,070 113 $5,532,677 7002002 Beth Israel Medical Center $13,372,697 315 10,436 6,183 492 $4,765,312 7002012 Hospital For Special Surgery $966,032 151 0 1,215 245 $0 7002017 Lenox Hill H. (Incl. Manh. Eye And Ear) $7,653,348 600 4,338 3,521 322 $4,348,605 7002020 Memorial H. For Cancer and Allied Diseases $7,708,682 0 0 10,109 2,431 $2,073,721 7002024 Mount Sinai Hospital $13,547,268 595 14,365 34,738 814 $13,271,439 7002026 NY Eye And Ear Infirmary $1,913,494 124 0 13,579 1,671 $3,478,869 7002031 Rockefeller University Hospital $42,834 0 0 0 0 $0 7002032 St Luke’s - Roosevelt Hospital Center $25,112,436 1,498 28,117 20,579 523 $19,429,237 7002037 St. Vincent’s Hospital $3,251,035 734 11,754 9,688 213 $8,523,493 7002052 North General Hospital $1,602,560 255 6,156 0 168 $2,262,560

106
Appendix Exhibit 3 (Continued)
Actual Uncompensated Care Distributions in 2010, Actual Volumes of Uncompensated Care in 2008, and Composite CARE Measure, 2008
179 New York State Hospitals (Excluding 21 Major Public Hospitals) Oper. Cert.
Hospital Name $707.7M Total Distributions
in 2010
2008 Acute Self-Pay &
Free Discharges
2008 Emergency
Room Unins. and Free Visits
2008 Total Clinic
Unins. + Free Visits
2008 Ambulatory
Surgery Unins. +
Free Procedures
CARE = CARE after
income offset, =
$707,659,495
7002053 NYU Hospitals (Includes H. for Joint Diseases) $5,195,446 442 3,528 3,959 213 $1,218,101 7002054 New York-Presbyterian Hospital $20,351,378 1,933 26,925 20,971 953 $10,999,793 7003001 Flushing Hospital And Medical Center $7,578,235 341 7,248 9,222 242 $11,665,871 7003003 Jamaica Hospital $34,640,623 961 23,764 16,023 229 $29,851,598 7003004 Long Island Jewish-Hillside Med Ctr $8,784,455 870 4,635 25,587 250 $9,861,620 7003006 Peninsula Hospital Center $1,547,764 240 4,640 1,321 51 $2,968,420 7003010 New York H. Medical Center of Queens $7,628,852 927 8,866 2,963 198 $9,120,953 7003013 Forest Hills Hospital $1,848,759 325 2,879 958 32 $3,173,233 7003015 Mount Sinai Hospital of Queens $4,909,036 431 10,462 1,394 42 $5,334,013 7004003 Staten Island Univ. H. – N. and S. Divisions $8,230,807 972 5,753 30,208 465 $14,670,927 7004010 Richmond University Medical Center $7,484,123 623 6,112 4,664 161 $7,137,456 Totals - 179 hospitals, excluding 21 major
public hospitals. $707,663,546 53,104 758,741 826,365 27,882 $707,659,495
TOTALS for 200 hospitals $847,000,000 71,101 1,105,841 1,859,023 49,554 $847,000,000
179 hospitals' shares of totals for 200 83.5% 74.7% 68.6% 44.5% 56.3% 83.5%

107
Appendix Exhibit 4
200 New York State Hospitals, Listed Alphabetically, With Operating Certificate Number, Region, Teaching Status, and
Major Public Hospital Status
Opcert Hospital Name Region Teaching 0-
1-2 Major public
0=non-tchng 1=teaching
2=major COTH
1=yes
1623001 Adirondack Medical Center 5 0 00101005 Albany M C South Clinical Cam 4 1 00101000 Albany Medical Center Hospital 4 2 00101003 Albany, Memorial H. of 4 0 03701000 Albert Lindley Lee Meml H. 5 0 01624000 Alice Hyde Memorial Hospital 5 0 02801000 Amsterdam Memorial Hospital 4 0 00701000 Arnot-Ogden Memorial Hospital 6 0 00501000 Auburn Memorial Hospital 6 0 03801000 Aurelia Osborn Fox Meml. H. 5 0 07002001 Bellevue Hospital Center 2 2 15501000 Benedictine Hospital 3 1 01427000 Bertrand Chaffee Hospital 8 0 07001041 Beth Israel M C - Kings Hwy Div 2 0 07002002 Beth Israel Medical Center 2 2 05957000 Blythedale Childrens Hospital 3 0 03535001 Bon Secours Community H. 3 0 07000001 Bronx-Lebanon H. Ctr. 2 2 07001002 Brookdale Hosp M C 2 1 05123000 Brookhaven Memorial H. 1 1 07001003 Brooklyn Hospital 2 2 00601000 Brooks Memorial Hospital 8 0 05902002 Burke Rehabilitation Center 3 0 07000011 Calvary Hospital 2 0 04429000 Canton-Potsdam Hospital 5 0 02238001 Carthage Area Hospital Inc 5 0 05263000 Catskill Reg. M C - G Hermann 3 0 05263700 Catskill Regional Medical Center 3 0 05401001 Cayuga M C at Ithaca 6 0 00901001 Champlain Valley Physicians H. 4 0 00824000 Chenango Memorial Hospital Inc 5 0 07003000 City Hospital Ctr at Elmhurst 2 2 14401000 Claxton-Hepburn Medical Center 5 0 03421000 Clifton Springs H. + Clinic 7 0 04458700 Clifton-Fine Hospital 5 0 0

108
Appendix Exhibit 4 (Continued)
200 New York State Hospitals, Listed Alphabetically, With Operating Certificate Number, Region, Teaching Status, and
Major Public Hospital Status
Opcert Hospital Name Region Teaching 0-
1-2 Major public
0=non-tchng 1=teaching
2=major COTH
1=yes
4720001 Cobleskill Reg. H. Bassett/Schoh 4 0 07002051 Coler Memorial Hospital 2 0 11001000 Columbia Memorial Hospital 3 0 05925000 Community H. at Dobbs Ferry 3 0 02625000 Community Memorial Hospital 5 0 03301000 Community-General H of Gr. Syr. 6 1 07001009 Coney Island Hospital 2 2 15001000 Corning Hospital 6 0 01101000 Cortland Memorial Hospital Inc 6 0 03301008 Crouse Hospital 6 1 00226700 Cuba Memorial Hospital Inc 8 0 01229700 Delaware Valley Hospital Inc 3 0 05127000 Eastern Long Island Hospital 1 0 04423000 Edward John Noble / Gouverneur 5 0 01552701 Elizabethtown Community H. 4 0 05526700 Ellenville Regional Hospital 3 0 04601001 Ellis Hospital 4 1 07001024 Episcopal Health Services, Inc 2 1 01401005 Erie County Medical Center 8 1 13429000 F F Thompson Hospital 7 0 07003001 Flushing H. and Medical Center 2 1 07003013 Forest Hills - North Shore 2 1 02910000 Franklin Hospital Medical Center 1 1 03402000 Geneva General Hospital 7 0 02901000 Glen Cove - North Shore 1 1 05601000 Glens Falls Hospital 4 0 07002050 Goldwater Memorial Hospital 2 0 14329000 Good Samaritan H. / West Islip 3 0 05154001 Good Samaritan Hospital / Suffern 1 1 07002009 Harlem Hospital Center 2 2 14322000 Helen Hayes Hospital 3 0 12701001 Highland Hospital of Rochester 7 1 07002012 Hospital for Special Surgery 2 2 05901000 Hudson Valley Hospital 3 0 05153000 Huntington Hospital 1 1 0

109
Appendix Exhibit 4 (Continued)
200 New York State Hospitals, Listed Alphabetically, With Operating Certificate Number, Region, Teaching Status, and
Major Public Hospital Status
Opcert Hospital Name Region Teaching 0-
1-2 Major public
0=non-tchng 1=teaching
2=major COTH
1=yes
3154000 Inter-Comm. Mem. H. Newfane 8 0 07001046 Interfaith Medical Center 2 1 05022000 Ira Davenport Memorial H. 6 0 07000002 Jacobi Medical Center 2 2 17003003 Jamaica Hospital 2 1 05149000 John T Mather Memorial H. 1 0 01401002 Kaleida Hlth/Women+Childrens H 8 1 01404000 Kenmore Mercy Hospital 8 0 07001016 Kings County Hospital Center 2 2 17001033 Kingsbrook Jewish M C 2 1 05501001 Kingston H. 3 1 02728001 Lakeside Memorial Hospital 7 0 05922000 Lawrence Hospital 3 0 07002017 Lenox Hill Hospital 2 2 02424000 Lewis County General Hospital 5 0 07000008 Lincoln Medical + Mental Hlth Ctr 2 2 12129700 Little Falls Hospital 5 0 03101001 Lockport Memorial Hospital 8 0 02902000 Long Beach Medical Center 1 1 07001017 Long Island College Hospital 2 2 07003004 Long Island Jewish-Hillside Med Ctr 2 2 07001019 Lutheran Medical Center 2 1 07001020 Maimonides Medical Center 2 2 01226701 Margaretville Memorial Hospital 3 0 03824000 Mary Imogene Bassett Hospital 5 2 04402000 Massena Memorial Hospital 5 0 03622000 Medina Memorial Hospital 8 0 07002020 Memorial H. for Cancer 2 0 00228000 Memorial H. of W+G Jones 8 0 01401008 Mercy Hospital of Buffalo 8 1 02909000 Mercy Medical Center 1 1 07002021 Metropolitan Hospital Center 2 2 11401014 Millard Fillmore - Kaleida Health 8 1 02701006 Monroe Community Hospital 7 0 07000006 Montefiore H. + M.C. 2 2 0
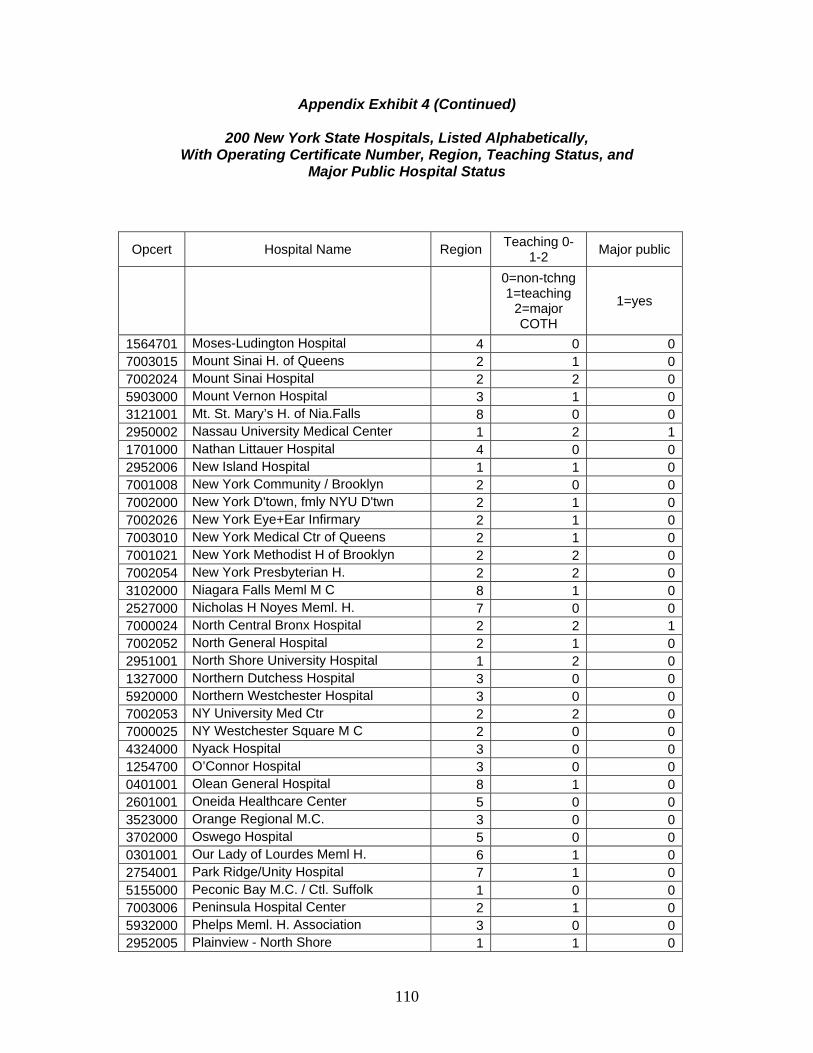
110
Appendix Exhibit 4 (Continued)
200 New York State Hospitals, Listed Alphabetically, With Operating Certificate Number, Region, Teaching Status, and
Major Public Hospital Status
Opcert Hospital Name Region Teaching 0-
1-2 Major public
0=non-tchng 1=teaching
2=major COTH
1=yes
1564701 Moses-Ludington Hospital 4 0 07003015 Mount Sinai H. of Queens 2 1 07002024 Mount Sinai Hospital 2 2 05903000 Mount Vernon Hospital 3 1 03121001 Mt. St. Mary’s H. of Nia.Falls 8 0 02950002 Nassau University Medical Center 1 2 11701000 Nathan Littauer Hospital 4 0 02952006 New Island Hospital 1 1 07001008 New York Community / Brooklyn 2 0 07002000 New York D'town, fmly NYU D'twn 2 1 07002026 New York Eye+Ear Infirmary 2 1 07003010 New York Medical Ctr of Queens 2 1 07001021 New York Methodist H of Brooklyn 2 2 07002054 New York Presbyterian H. 2 2 03102000 Niagara Falls Meml M C 8 1 02527000 Nicholas H Noyes Meml. H. 7 0 07000024 North Central Bronx Hospital 2 2 17002052 North General Hospital 2 1 02951001 North Shore University Hospital 1 2 01327000 Northern Dutchess Hospital 3 0 05920000 Northern Westchester Hospital 3 0 07002053 NY University Med Ctr 2 2 07000025 NY Westchester Square M C 2 0 04324000 Nyack Hospital 3 0 01254700 O’Connor Hospital 3 0 00401001 Olean General Hospital 8 1 02601001 Oneida Healthcare Center 5 0 03523000 Orange Regional M.C. 3 0 03702000 Oswego Hospital 5 0 00301001 Our Lady of Lourdes Meml H. 6 1 02754001 Park Ridge/Unity Hospital 7 1 05155000 Peconic Bay M.C. / Ctl. Suffolk 1 0 07003006 Peninsula Hospital Center 2 1 05932000 Phelps Meml. H. Association 3 0 02952005 Plainview - North Shore 1 1 0

111
Appendix Exhibit 4 (Continued)
200 New York State Hospitals, Listed Alphabetically, With Operating Certificate Number, Region, Teaching Status, and
Major Public Hospital Status
Opcert Hospital Name Region Teaching 0-
1-2 Major public
0=non-tchng 1=teaching
2=major COTH
1=yes
3950000 Putnam Community Hospital 3 0 07003007 Queens Hospital Center 2 2 17004010 Richmond University Medical 2 1 02221700 River Hospital 5 0 02701003 Rochester General Hospital 7 1 07002031 Rockefeller University Hospital 2 0 03201002 Rome H. and Murphy Meml. 5 0 01401010 Roswell Park Memorial Institute 8 0 14102002 Samaritan Hospital of Troy 4 0 02201000 Samaritan Medical Center 5 1 04501000 Saratoga Hospital 4 0 04823700 Schuyler Hospital 6 0 04102003 Seton Health System 4 0 01401006 Sheehan Memorial Emergency H. 8 0 01401013 Sisters of Charity Hospital 8 1 06120700 Soldiers and Sailors Meml. H. 7 0 05904000 Sound Shore M. C. Westchester 3 2 02950001 South Nassau Communities H. 1 1 05126000 Southampton Hospital 1 0 05154000 Southside Hospital 1 1 03529000 St Anthony Community Hospital 3 0 07000014 St Barnabas Hospital 2 1 05157003 St Catherine of Siena 2 !!-> 1 1 05149001 St Charles Hospital 1 1 03202002 St Elizabeth Medical Center 5 1 01302000 St Francis H. of Poughkeepsie 3 0 02953000 St Francis Hospital of Roslyn 1 1 05002001 St James Mercy Hospital 6 0 05907001 St Johns Riverside Hospital 3 0 01455000 St Joseph Hospital 8 0 03301003 St Josephs Hospital Health Center 6 1 00701001 St Josephs Hospital of Elmira 6 0 05907002 St Josephs Hospital Yonkers 3 1 03202003 St Luke’s / Faxton Memorial H. 5 1 07002032 St Luke’s / Roosevelt H. Center 2 2 0

112
Appendix Exhibit 4 (Continued)
200 New York State Hospitals, Listed Alphabetically, With Operating Certificate Number, Region, Teaching Status, and
Major Public Hospital Status
Opcert Hospital Name Region Teaching 0-
1-2 Major public
0=non-tchng 1=teaching
2=major COTH
1=yes
2801001 St Mary’s Hospital at Amsterdam 4 0 00101004 St Peters Hospital 4 1 07002037 St Vincent’s Hospital 2 1 03522000 St. Luke's - Cornwall H 3 0 07001037 State University H. Downstate 2 2 17004003 Staten Island University H. 2 2 02701005 Strong Memorial Hospital 7 2 04353000 Summit Park H./Rockland Co. Inf. 3 0 04601004 Sunnyview H. + Rehab Ctr 4 0 03301007 SUNY Hlth Sci Ctr. at Syracuse 6 2 10427000 TLC Health Network 8 0 01227001 Tri-Town Regional Healthcare 3 0 00303001 United Health Services, Inc 6 2 01801000 United Memorial Medical Center 8 0 05151001 University H. at Stony Brook 1 2 11302001 Vassar Brothers Medical Center 3 0 05820000 Wayne Health Care 7 0 05957001 Westchester Medical Center 3 2 10632000 Westfield Memorial Hospital Inc 8 0 05902001 White Plains H. Med Ctr 3 0 02908000 Winthrop University Hospital 1 2 00602001 Woman’s Christian Association 8 0 07001045 Woodhull Medical + Mental Hlth Ctr 2 2 17001035 Wyckoff Heights Hospital 2 1 06027000 Wyoming County Community H. 8 0 0
Note: St. Catherine of Sienna was placed in Region 2, New York City, in the spreadsheets we employed. It is actually in Region 1, Long Island. Most of the tabulations for this report were prepared before this problem was identified. Minor mis-calculations have resulted.

113
Appendix Exhibit 5
Acute Self-pay and Free Discharges, Total Discharges, and Self-pay/Free Share of Total,
179 Hospitals Excluding Major Publics, 2008
2008 Acute Self-Pay &
Free Discharges
2008 Total Discharges
2008 Acute Self-pay +
Free Discharges/
Total Discharges
Statewide 74,276 2,614,260 2.7% 179 hospitals, excluding major public
hospitals 53,104 2,269,295 2.3%
0101000 Albany Medical Center Hospital 666 31,249 2.1%0101003 Albany Memorial Hospital 104 4,826 2.2%0101004 St Peters Hospital 404 24,986 1.6%0101005 Albany Med. Ctr. Hospital – S. Campus 9 31 29.0%0226700 Cuba Memorial Hospital Inc 0 114 0.0%0228000 Jones Memorial Hospital 154 2,705 5.7%0301001 Our Lady of Lourdes Mem Hosp. 183 10,526 1.7%0303001 United Health Services, Inc 592 19,505 3.0%0401001 Olean General Hospital 357 8,538 4.2%0427000 TLC Health Care Network 109 3,115 3.5%0501000 Auburn Memorial Hospital 156 5,273 3.0%0601000 Brooks Memorial Hospital 71 3,318 2.1%0602001 Woman’s Christian Association 196 8,635 2.3%0632000 Westfield Memorial Hospital Inc 43 175 24.6%0701000 Arnot-Ogden Memorial Hospital 272 11,461 2.4%0701001 St Josephs Hospital Of Elmira 125 5,515 2.3%0824000 Chenango Memorial Hospital Inc 102 2,144 4.8%0901001 Champlain Valley Physicians Hosp. 266 10,824 2.5%1001000 Columbia-Greene Medical Center 151 5,803 2.6%1101000 Cortland Memorial Hospital Inc 145 5,276 2.7%1226701 Margaretville Memorial Hospital 0 381 0.0%1227001 Tri-Town Regional Healthcare 0 703 0.0%1229700 Delaware Valley Hospital Inc 0 711 0.0%1254700 O'Connor Hospital 0 257 0.0%1302000 St Francis Hospital of Poughkeepsie 117 9,358 1.3%1302001 Vassar Brothers Hospital 746 21,931 3.4%1327000 Northern Dutchess Hospital 83 4,152 2.0%1401002 Kaleida Health - Women And Childrens 323 13,817 2.3%1401006 Sheehan Meml. Emergency Hosp. 0 1,520 0.0%1401008 Mercy of Buffalo & Our Lady Of Victory 280 20,223 1.4%1401013 Sisters Of Charity Hospital 175 14,922 1.2%1401014 M. Fillmore Sub/Kaleida (Excl. W+C) 560 47,901 1.2%

114
Appendix Exhibit 5 (Continued)
Acute Self-pay and Free Discharges, Total Discharges, and Self-pay/Free Share of Total,
179 Hospitals Excluding Major Publics, 2008
2008 Acute Self-Pay &
Free Discharges
2008 Total Discharges
2008 Acute Self-pay +
Free Discharges/
Total Discharges
1404000 Kenmore Mercy Hospital 112 7,744 1.4%1427000 Bertrand Chaffee Hospital 24 1,122 2.1%1455000 St Joseph Intercomm. (Cheektowaga) 0 6,095 0.0%1552701 Elizabethtown Community Hospital 0 474 0.0%1564701 Moses-Ludington Hospital 0 253 0.0%1623001 Adirondack Medical Center 96 2,932 3.3%1624000 Alice Hyde Memorial Hospital 226 3,161 7.1%1701000 Nathan Littauer Hospital 159 4,074 3.9%1801000 United Memorial 158 5,604 2.8%2129700 Little Falls Hospital 0 1,114 0.0%2201000 Samaritan Medical Center 187 10,237 1.8%2221700 River Hospital 0 189 0.0%2238001 Carthage Area Hospital Inc 45 1,730 2.6%2424000 Lewis County General Hospital 81 2,043 4.0%2527000 Nicholas H Noyes Memorial Hospital 45 3,180 1.4%2601001 Oneida Healthcare Center 71 3,525 2.0%2625000 Community Memorial Hospital Inc 83 2,427 3.4%2701001 Highland Hospital of Rochester 565 19,108 3.0%2701003 Rochester General Hospital 899 29,561 3.0%2701005 Strong Memorial Hospital 797 40,202 2.0%2701006 Monroe Community Hospital 0 11 0.0%2728001 Lakeside Memorial Hospital 59 2,742 2.2%2754001 The Unity Hospital Of Rochester 199 16,494 1.2%2801000 Amsterdam Memorial 0 275 0.0%2801001 St Mary’s Hospital at Amsterdam 159 6,847 2.3%2901000 Glen Cove Hospital 164 9,420 1.7%2902000 Long Beach Medical Center 137 4,408 3.1%2908000 Winthrop University Hospital 991 34,832 2.8%2909000 Mercy Medical Center 350 12,071 2.9%2910000 Franklin General Hospital 261 10,929 2.4%2950001 South Nassau Communities Hospital 574 21,144 2.7%2951001 North Shore University Hospital 1,038 53,948 1.9%2952005 Plainview Hospital 184 14,865 1.2%2952006 New Island Hospital 249 7,912 3.1%2953000 St Francis Hospital of Roslyn 101 18,388 0.5%3101001 Lockport Memorial Hospital 82 4,365 1.9%

115
Appendix Exhibit 5 (Continued)
Acute Self-pay and Free Discharges, Total Discharges, and Self-pay/Free Share of Total,
179 Hospitals Excluding Major Publics, 2008
2008 Acute Self-Pay &
Free Discharges
2008 Total Discharges
2008 Acute Self-pay +
Free Discharges/
Total Discharges
3102000 Niagara Falls Memorial Medical Ctr. 140 7,415 1.9%3121001 Mount St Mary’s H. of Niagara Falls 181 6,633 2.7%3154000 Inter-Community Meml. H. at Newfane 48 2,190 2.2%3201002 Rome Memorial Hospital 138 5,477 2.5%3202002 St Elizabeth Hospital 273 12,160 2.2%3202003 Faxton - St Luke’s Health Care 397 18,990 2.1%3301000 Community-General H. Gr. Syracuse 223 9,660 2.3%3301003 St Joseph’s Hosp. Hlth. Ctr. (Syracuse) 531 22,159 2.4%3301008 Crouse-Irving Memorial Hospital 382 23,557 1.6%3421000 Clifton Springs Hospital 37 3,123 1.2%3429000 F F Thompson Hospital 134 5,126 2.6%3522000 Cornwall Hospital 461 13,622 3.4%3523000 Orange Regional Medical Center 806 21,287 3.8%3529000 St Anthony Community Hospital 91 3,450 2.6%3535001 Bon Secours Community Hospital 220 4,894 4.5%3622000 Medina Memorial Hospital 70 2,588 2.7%3701000 Albert Lindley Lee Memorial Hosp. 0 1,797 0.0%3702000 Oswego Hospital 336 6,334 5.3%3801000 Aurelia Osborn Fox Memorial Hosp. 131 4,501 2.9%3824000 Mary Imogene Bassett Hospital 288 9,809 2.9%3950000 Putnam Community Hospital 346 8,450 4.1%4102002 Samaritan Hospital of Troy 191 8,301 2.3%4102003 Seton Health System 221 8,590 2.6%4324000 Nyack Hospital 217 15,723 1.4%4329000 Good Samaritan Hosp. of Suffern 301 17,041 1.8%4353000 Summit Park Hosp. - Rockland County 0 988 0.0%4401000 Claxton Hepburn Medical Center 120 5,052 2.4%4402000 Massena Memorial Hospital 134 3,283 4.1%4423000 Edward John Noble Hosp. - Gouverneur 52 1,178 4.4%4429000 Canton-Potsdam Hospital 76 4,579 1.7%4458700 Clifton-Fine Hospital 0 163 0.0%4501000 Saratoga Hospital 262 8,936 2.9%4601001 Ellis H. (Includes St. Clare's Schn'dy) 492 22,638 2.2%4601004 Sunnyview H. and Rehab. Center 0 1,928 0.0%4720001 Cobleskill Regional Hospital 9 703 1.3%4823700 Schuyler Hospital 0 1,344 0.0%5001000 Corning Hospital 139 4,419 3.1%

116
Appendix Exhibit 5 (Continued)
Acute Self-pay and Free Discharges, Total Discharges, and Self-pay/Free Share of Total,
179 Hospitals Excluding Major Publics, 2008
2008 Acute Self-Pay &
Free Discharges
2008 Total Discharges
2008 Acute Self-pay +
Free Discharges/
Total Discharges
5002001 St James Mercy Hospital 78 3,982 2.0%5022000 Ira Davenport Memorial Hospital Inc 80 1,310 6.1%5123000 Brookhaven Memorial Hosp. Med. Ctr. 944 16,730 5.6%5126000 Southampton Hospital 343 6,579 5.2%5127000 Eastern Long Island Hospital 59 2,900 2.0%5149000 John T Mather Memorial Hospital 211 11,591 1.8%5149001 St Charles Hospital 57 11,502 0.5%5153000 Huntington Hospital 423 17,693 2.4%5154000 Southside Hospital 613 18,270 3.4%5154001 Good Samaritan Hosp. Med. Ctr. 341 29,688 1.1%5155000 Peconic Bay Medical Center 299 6,578 4.5%5157003 St Catherine of Siena 93 14,346 0.6%5263000 Catskill Regional Hospital - Harris 448 6,173 7.3%5263700 Catskill Regional Hospital - Herman 0 176 0.0%5401001 Cayuga Medical Center At Ithaca 151 7,546 2.0%5501000 Benedictine Hospital 170 7,183 2.4%5526700 Ellenville Community Hospital 0 433 0.0%5601000 Glens Falls Hospital 563 17,112 3.3%5820000 Via Health of Wayne 186 3,766 4.9%5901000 Hudson Valley Hospital Center 215 7,300 2.9%5902001 White Plains Hospital Med. Ctr. 515 15,484 3.3%5902002 Burke Rehabilitation Center 0 3,523 0.0%5903000 Mount Vernon Hospital 510 4,474 11.4%5904000 Sound Shore Med Ctr of Westchester 1,060 10,891 9.7%5907001 St John’s Riverside-Yonkers 534 16,578 3.2%5907002 St Joseph’s Hospital Yonkers 619 7,176 8.6%5920000 Northern Westchester Hospital 124 11,347 1.1%5922000 Lawrence Hospital 359 12,385 2.9%5925000 Community Hosp. at Dobbs Ferry 0 1,756 0.0%5932000 Phelps Memorial Hospital Association 232 8,818 2.6%5957000 Blythedale Childrens Hospital 0 432 0.0%6027000 Wyoming County Community Hosp. 91 2,872 3.2%6120700 Soldiers, Sailors Mem. H. - Yates Cty. 0 1,243 0.0%7000001 Bronx Lebanon Hosp. Ctr.-Fulton Div. 1,140 31,572 3.6%7000006 Montefiore Hosp. & Medical Center 807 89,121 0.9%7000011 Calvary Hospital 0 3,100 0.0%7000014 St Barnabas Hospital 1,385 24,302 5.7%

117
Appendix Exhibit 5 (Continued)
Acute Self-pay and Free Discharges, Total Discharges, and Self-pay/Free Share of Total,
179 Hospitals Excluding Major Publics, 2008
2008 Acute Self-Pay &
Free Discharges
2008 Total Discharges
2008 Acute Self-pay +
Free Discharges/
Total Discharges
7000025 NY Westchester Square Med. Ctr. 258 7,602 3.4%7001002 Brookdale Hospital Medical Center 498 19,704 2.5%7001003 Brooklyn Hospital 419 19,245 2.2%7001008 New York Community – Brooklyn 88 7,171 1.2%7001017 Long Island College Hospital 452 19,738 2.3%7001019 Lutheran Medical Center 1,035 35,623 2.9%7001020 Maimonides Medical Center 536 44,420 1.2%7001021 New York Methodist H. of Brooklyn 641 34,524 1.9%7001024 Episcopal Health Services 150 9,782 1.5%7001033 Kingsbrook Jewish Medical Center 104 9,486 1.1%7001035 Wyckoff Heights Hospital 815 20,064 4.1%7001041 Beth Israel Med. Ctr. - Kings Hwy. Div. 92 11,315 0.8%7001046 Interfaith Medical Center 209 9,310 2.2%7002000 New York Downtown Hospital 479 10,770 4.4%7002002 Beth Israel Medical Center 315 41,306 0.8%7002012 Hospital For Special Surgery 151 11,263 1.3%7002017 Lenox Hill H. (Incl. Manh. Eye And Ear) 600 30,852 1.9%7002020 Memorial H. - Cancer 0 22,618 0.0%7002024 Mount Sinai Hospital 595 57,456 1.0%7002026 NY Eye And Ear Infirmary 124 1,382 9.0%7002031 Rockefeller University Hospital 0 43 0.0%7002032 St Luke’s - Roosevelt Hospital Center 1,498 49,777 3.0%7002037 St. Vincent’s Hospital 734 21,671 3.4%7002053 NYU Hospitals (Incl. H. Joint Diseases) 442 39,575 1.1%7002054 New York-Presbyterian Hospital 1,933 103,724 1.9%7003001 Flushing Hospital And Medical Center 341 16,881 2.0%7003003 Jamaica Hospital 961 24,732 3.9%7003004 Long Island Jewish-Hillside Med Ctr 870 49,946 1.7%7003006 Peninsula Hospital Center 240 5,112 4.7%7003010 New York H. Med. Ctr. Of Queens 927 33,613 2.8%7003013 Forest Hills Hospital 325 15,044 2.2%7003015 Mount Sinai Hospital Of Queens 431 9,989 4.3%7004003 Staten Island Univ. H. – N. and S. Div's. 972 40,536 2.4%7004010 Richmond University Medical Center 623 16,919 3.7%

118
Appendix Exhibit 6 – A
Dollar Gain (Loss) for CARE, BASE, and BASE STEEP versus Actual, 2010 Excludes Major Public Hospitals
(All Dollars in Thousands)
Op. Cert. Hospital Actual
CARE minus Actual
BASE minus Actual
BASE STEEP
minus Actual
0101000 Albany Medical Center H. $ 5,070 $ 1,010 $ 2,691 $ (853) 0101003 Albany, Memorial Hospital of $ 1,211 $ 788 $ 651 $ 440 0101004 St Peters Hospital $ 3,469 $ 3,408 $ 1,802 $ (369) 0101005 Albany M C South Clin Cam $ 59 $ 584 $ 637 $ 893 0226700 Cuba Memorial Hospital Inc $ 790 $ (532) $ (558) $ (508) 0228000 Memorial H. of W+G Jones $ 664 $ 1,484 $ 758 $ 1,984 0301001 Our Lady of Lourdes Meml H. $ 1,927 $ 3,133 $ 1,099 $ (105) 0303001 United Health Services, Inc $ 4,440 $ 3,870 $ 2,088 $ 162 0401001 Olean General Hospital $ 1,320 $ 2,786 $ 1,405 $ 2,430 0427000 TLC Health Network $ 1,616 $ 88 $ (501) $ (294) 0501000 Auburn Memorial Hospital $ 1,028 $ 1,029 $ 377 $ 92 0601000 Brooks Memorial Hospital $ 564 $ 281 $ (112) $ (322) 0602001 Woman’s Christian Association $ 1,566 $ 963 $ 247 $ (37) 0632000 Westfield Memorial Hospital Inc $ 293 $ 85 $ (92) $ (105) 0701000 Arnot-Ogden Memorial Hospital $ 1,591 $ 1,614 $ 875 $ 195 0701001 St Josephs Hospital of Elmira $ 1,059 $ 510 $ 108 $ (189) 0824000 Chenango Memorial Hospital Inc $ 1,646 $ 2,925 $ 1,909 $ 10,404 0901001 Champlain Valley Physicians H. $ 2,067 $ (417) $ (935) $ (1,787) 1001000 Columbia Memorial Hospital $ 2,320 $ (133) $ (827) $ (1,391) 1101000 Cortland Memorial Hospital Inc $ 1,346 $ 397 $ (215) $ (479) 1226701 Margaretville Memorial Hospital $ 583 $ (583) $ (583) $ (583) 1227001 Tri-Town Regional Healthcare $ 593 $ (372) $ (593) $ (593) 1229700 Delaware Valley Hospital Inc $ 554 $ (529) $ (554) $ (554) 1254700 O’Connor Hospital $ 436 $ (296) $ (323) $ (385) 1302000 St Francis H. of Poughkeepsie $ 3,936 $ (1,787) $ (1,475) $ (2,325) 1302001 Vassar Brothers Medical Center $ 5,130 $ 3,543 $ 3,710 $ 4,042 1327000 Northern Dutchess Hospital $ 1,461 $ (547) $ (730) $ (1,097) 1401002 Kaleida Hlth/Women+Childrens $ 1,403 $ 2,314 $ 1,692 $ 467 1401006 Sheehan Mem’l Emergency H. $ 25 $ 50 $ 34 $ (13) 1401008 Mercy Hospital of Buffalo $ 2,098 $ 1,516 $ 875 $ (745) 1401013 Sisters of Charity Hospital $ 2,357 $ 738 $ 572 $ (401) 1401014 Millard Fillmore - Kaleida Health $ 4,211 $ 3,072 $ 4,613 $ (260) 1404000 Kenmore Mercy Hospital $ 818 $ 602 $ 658 $ (33) 1427000 Bertrand Chaffee Hospital $ 390 $ (101) $ (175) $ (225) 1455000 St Joseph Hospital $ 589 $ (124) $ (589) $ (589) 1552701 Elizabethtown Community H. $ 419 $ (226) $ (248) $ (335) 1564701 Moses-Ludington Hospital $ 439 $ (277) $ (380) $ (424) 1623001 Adirondack Medical Center $ 1,806 $ (275) $ (356) $ (219) 1624000 Alice Hyde Memorial Hospital $ 1,154 $ 1,070 $ 190 $ 379

119
Appendix Exhibit 6 – A (Continued)
Dollar Gain (Loss) for CARE, BASE, and BASE STEEP versus Actual, 2010 Excludes Major Public Hospitals
(All Dollars in Thousands)
Op. Cert. Hospital Actual
CARE minus Actual
BASE minus Actual
BASE STEEP
minus Actual
1701000 Nathan Littauer Hospital $ 2,035 $ 1,301 $ (83) $ 600 1801000 United Memorial Medical Center $ 881 $ 677 $ 154 $ (167) 2129700 Little Falls Hospital $ 845 $ (742) $ (809) $ (842) 2201000 Samaritan Medical Center $ 2,615 $ 58 $ (782) $ (1,612) 2221700 River Hospital $ 515 $ (229) $ (228) $ (136) 2238001 Carthage Area Hospital Inc $ 619 $ 388 $ (8) $ (27) 2424000 Lewis County General Hospital $ 886 $ 26 $ (333) $ (381) 2527000 Nicholas H Noyes Meml. H. $ 845 $ (233) $ (410) $ (686) 2601001 Oneida Healthcare Center $ 1,018 $ 126 $ (239) $ (461) 2625000 Community Memorial Hospital $ 753 $ 819 $ 153 $ 103 2701001 Highland Hospital of Rochester $ 1,733 $ 5,460 $ 3,747 $ 3,298 2701003 Rochester General Hospital $ 8,063 $ 7,629 $ 5,599 $ 5,123 2701005 Strong Memorial Hospital $ 7,677 $ 1,018 $ 4,449 $ (1,736) 2701006 Monroe Community Hospital $ - $ - $ - $ - 2728001 Lakeside Memorial Hospital $ 360 $ 715 $ 266 $ 222 2754001 Park Ridge Hospital $ 3,590 $ 1,509 $ 463 $ (1,789) 2801000 Amsterdam Memorial Hospital $ 207 $ (123) $ (207) $ (207) 2801001 St Mary’s H. at Amsterdam $ 1,196 $ 1,782 $ 937 $ 848 2901000 Glen Cove - North Shore $ 3,214 $ 240 $ 907 $ 957 2902000 Long Beach Medical Center $ 1,559 $ 925 $ 1,115 $ 2,553 2908000 Winthrop University Hospital $ 4,944 $ 3,044 $ 3,349 $ (409) 2909000 Mercy Medical Center $ 2,798 $ 643 $ 998 $ 22 2910000 Franklin Hospital Medical Center $ 2,946 $ (322) $ 184 $ (487) 2950001 South Nassau Communities H. $ 3,762 $ 2,735 $ 2,425 $ 850 2951001 North Shore University Hospital $ 16,660 $ (2,980) $ 4,155 $ (2,763) 2952005 Plainview - North Shore $ 976 $ 753 $ 504 $ (491) 2952006 New Island Hospital $ 1,364 $ 1,073 $ 2,071 $ 2,972 2953000 St Francis Hospital of Roslyn $ 1,058 $ (371) $ 868 $ (684) 3101001 Lockport Memorial Hospital $ 418 $ 423 $ (222) $ (376) 3102000 Niagara Falls Meml M C $ 1,239 $ 687 $ 150 $ (215) 3121001 Mt. St. Mary’s H. of Nia.Falls $ 636 $ 1,312 $ 1,098 $ 1,005 3154000 Inter-Comm. Mem. H. Newfane $ 578 $ 117 $ (415) $ (522) 3201002 Rome H. and Murphy Meml. $ 956 $ 832 $ 411 $ 190 3202002 St Elizabeth Medical Center $ 1,853 $ 1,915 $ 2,095 $ 1,320 3202003 St Luke’s / Faxton Memorial H. $ 2,474 $ 8,030 $ 5,241 $ 6,943 3301000 Community-Gen’l H of Gr. Syr. $ 1,167 $ 1,131 $ 749 $ 7 3301003 St Josephs H. Health Center $ 4,610 $ 1,937 $ 1,302 $ (1,313) 3301008 Crouse Hospital $ 3,642 $ 2,243 $ 2,003 $ 327 3402000 Geneva General Hospital $ 1,389 $ 794 $ (145) $ (529)

120
Appendix Exhibit 6 – A (Continued)
Dollar Gain (Loss) for CARE, BASE, and BASE STEEP versus Actual, 2010 Excludes Major Public Hospitals
(All Dollars in Thousands)
Op. Cert. Hospital Actual
CARE minus Actual
BASE minus Actual
BASE STEEP
minus Actual
3421000 Clifton Springs H. + Clinic $ 433 $ 18 $ 25 $ (209) 3429000 F F Thompson Hospital $ 805 $ 849 $ 379 $ (38) 3522000 St. Luke's - Cornwall H $ 3,521 $ 2,016 $ 1,088 $ 1,570 3523000 Orange Regional M.C. $ 1,954 $ 6,881 $ 5,746 $ 6,465 3529000 St Anthony Community Hospital $ 390 $ 764 $ 569 $ 316 3535001 Bon Secours Community H. $ 3,538 $ (739) $ (1,270) $ (740) 3622000 Medina Memorial Hospital $ 493 $ 231 $ (86) $ (234) 3701000 Albert Lindley Lee Meml H. $ - $ - $ - $ - 3702000 Oswego Hospital $ 1,633 $ 925 $ (379) $ (670) 3801000 Aurelia Osborn Fox Meml. H. $ 1,584 $ 384 $ (322) $ (641) 3824000 Mary Imogene Bassett Hospital $ 3,478 $ 3,024 $ 1,797 $ 961 3950000 Putnam Community Hospital $ 2,056 $ 945 $ 856 $ 420 4102002 Samaritan Hospital of Troy $ 2,059 $ 882 $ 149 $ (229) 4102003 Seton Health System $ 2,129 $ 421 $ (615) $ (1,419) 4324000 Nyack Hospital $ 2,441 $ 697 $ 957 $ 169 4329000 Good Samaritan H. / West Islip $ 4,419 $ (931) $ (1,210) $ (3,121) 4353000 Summit Park H./Rockland Co. $ 3,737 $ (3,737) $ (3,737) $ (3,737) 4401000 Claxton-Hepburn M C $ 820 $ 828 $ 216 $ (248) 4402000 Massena Memorial Hospital $ 1,136 $ 1,261 $ 158 $ 233 4423000 Edward J. Noble / Gouverneur $ 553 $ 76 $ (239) $ (237) 4429000 Canton-Potsdam Hospital $ 1,264 $ (1,263) $ (1,264) $ (1,264) 4458700 Clifton-Fine Hospital $ 193 $ (93) $ (84) $ (123) 4501000 Saratoga Hospital $ 2,002 $ 1,627 $ 869 $ 458 4601001 Ellis Hospital $ 3,931 $ 2,680 $ 1,371 $ 88 4601004 Sunnyview H. + Rehab Ctr $ 519 $ (519) $ (519) $ (519) 4720001 Cobleskill Reg. H. Bassett/Scho $ 913 $ (441) $ (542) $ (647) 4823700 Schuyler Hospital $ 747 $ (377) $ (459) $ (603) 5001000 Corning Hospital $ 2,159 $ (702) $ (1,218) $ (1,609) 5002001 St James Mercy Hospital $ 1,332 $ 776 $ (181) $ (296) 5022000 Ira Davenport Memorial H. $ 1,246 $ 61 $ (392) $ 860 5123000 Brookhaven Memorial H. $ 7,372 $ 1,475 $ 1,287 $ 3,764 5126000 Southampton Hospital $ 1,371 $ 2,252 $ 1,797 $ 3,528 5127000 Eastern Long Island Hospital $ 861 $ 87 $ 678 $ 1,554 5149000 John T Mather Memorial H. $ 2,052 $ (82) $ 579 $ (661) 5149001 St Charles Hospital $ 1,603 $ 10 $ (133) $ (1,100) 5153000 Huntington Hospital $ 3,769 $ (727) $ (1,292) $ (2,785) 5154000 Southside Hospital $ 7,916 $ (1,074) $ (1,775) $ (1,651) 5154001 Good Samaritan H.l / Suffern $ 8,531 $ (4,729) $ (4,115) $ (6,740) 5155000 Peconic Bay M.C. / Ctl. Suffolk $ 1,866 $ 1,403 $ 908 $ 1,272

121
Appendix Exhibit 6 – A (Continued)
Dollar Gain (Loss) for CARE, BASE, and BASE STEEP versus Actual, 2010 Excludes Major Public Hospitals
(All Dollars in Thousands)
Op. Cert. Hospital Actual
CARE minus Actual
BASE minus Actual
BASE STEEP
minus Actual
5157003 St Catherine of Siena $ 1,151 $ (469) $ (380) $ (1,033) 5263000 Catskill Reg. M C - G Hermann $ 9,198 $ (4,499) $ (5,810) $ (3,212) 5263700 Catskill Regional Medical Center $ 547 $ (435) $ (459) $ (485) 5401001 Cayuga M C at Ithaca $ 1,841 $ 419 $ (367) $ (966) 5501000 Benedictine Hospital $ 2,174 $ (327) $ (688) $ (1,155) 5501001 Kingston H. $ 2,386 $ (24) $ (563) $ (837) 5526700 Ellenville Regional Hospital $ 1,767 $ (1,356) $ (1,587) $ (1,651) 5601000 Glens Falls Hospital $ 4,009 $ 3,482 $ 1,044 $ 482 5820000 Wayne Health Care $ 2,519 $ (566) $ (1,419) $ (1,254) 5901000 Hudson Valley Hospital $ 1,727 $ 682 $ 466 $ 151 5902001 White Plains H. Med Ctr $ 2,130 $ 2,926 $ 3,222 $ 2,263 5902002 Burke Rehabilitation Center $ 173 $ (170) $ (133) $ (172) 5903000 Mount Vernon Hospital $ 10,485 $ (4,165) $ (3,681) $ 8,692 5904000 Sound Shore M. C. Westchester $ 10,769 $ 1,326 $ (1,003) $ 11,704 5907001 St Johns Riverside Hospital $ 3,960 $ 3,154 $ 2,909 $ 6,274 5907002 St Josephs Hospital Yonkers $ 8,610 $ (133) $ (117) $ 16,637 5920000 Northern Westchester Hospital $ 1,334 $ 78 $ (114) $ (981) 5922000 Lawrence Hospital $ 1,393 $ 1,983 $ 1,606 $ 1,137 5925000 Community H. at Dobbs Ferry $ 260 $ 170 $ (260) $ (260) 5932000 Phelps Meml. H. Association $ 1,541 $ 1,296 $ 587 $ (410) 5957000 Blythedale Childrens Hospital $ 201 $ 38 $ 14 $ (164) 6027000 Wyoming County Community H. $ 689 $ 400 $ (57) $ (170) 6120700 Soldiers and Sailors Meml. H. $ 919 $ (860) $ (861) $ (911) 7000001 Bronx-Lebanon H. Ctr. $ 44,678 $(26,983) $ (25,085) $(17,623) 7000006 Montefiore H. + M.C. $ 23,299 $ (2,774) $ 862 $(11,190) 7000011 Calvary Hospital $ 687 $ (687) $ (687) $ (687) 7000014 St Barnabas Hospital $ 22,570 $ (3,991) $ (3,921) $ 17,105 7000025 NY Westchester Square M C $ 1,029 $ 1,316 $ 1,008 $ 728 7001002 Brookdale Hosp M C $ 23,139 $(13,609) $ (12,419) $(13,670) 7001003 Brooklyn Hospital $ 4,614 $ 1,761 $ 1,210 $ (972) 7001008 New York Community / Brooklyn $ 631 $ 464 $ 557 $ 5 7001017 Long Island College Hospital $ 6,156 $ (107) $ 171 $ (2,322) 7001019 Lutheran Medical Center $ 34,492 $(25,634) $ (24,559) $(26,326) 7001020 Maimonides Medical Center $ 14,956 $ (2,970) $ (2,004) $ (7,124) 7001021 NY Methodist H of Brooklyn $ 4,094 $ 3,811 $ 3,924 $ 429 7001024 Episcopal Health Services, Inc $ 1,767 $ 500 $ 620 $ (538) 7001033 Kingsbrook Jewish M C $ 1,505 $ 2,353 $ 2,052 $ 1,088 7001035 Wyckoff Heights Hospital $ 8,705 $ 622 $ (45) $ 1,905 7001041 Beth Israel M C - Kings Hwy Div $ 1,292 $ (65) $ 191 $ (572)

122
Appendix Exhibit 6 – A (Continued)
Dollar Gain (Loss) for CARE, BASE, and BASE STEEP versus Actual, 2010 Excludes Major Public Hospitals
(All Dollars in Thousands)
Op. Cert. Hospital Actual
CARE minus Actual
BASE minus Actual
BASE STEEP
minus Actual
7001046 Interfaith Medical Center $ 12,923 $ (8,820) $ (8,455) $ (9,342) 7002000 New York Downtown $ 6,535 $ (1,002) $ (1,806) $ (4,763) 7002002 Beth Israel Medical Center $ 13,379 $ (8,613) $ (7,080) $(11,491) 7002012 Hospital for Special Surgery $ 966 $ (966) $ (966) $ (966) 7002017 Lenox Hill Hospital $ 7,657 $ (3,308) $ (208) $ (4,212) 7002020 Memorial H. for Cancer $ 7,712 $ (5,638) $ (2,197) $ (6,858) 7002024 Mount Sinai Hospital $ 13,553 $ (282) $ 5,603 $ (2,796) 7002026 New York Eye+Ear Infirmary $ 1,914 $ 1,565 $ 2,122 $ 4,717 7002031 Rockefeller University Hospital $ 43 $ (43) $ (43) $ (43) 7002032 St Luke’s / Roosevelt H. Center $ 25,123 $ (5,694) $ (1,010) $ (4,351) 7002037 St Vincent’s Hospital $ 3,252 $ 5,271 $ 825 $ (2,321) 7002052 North General Hospital $ 1,603 $ 659 $ (357) $ (1,127) 7002053 NY University Med Ctr $ 5,198 $ (3,980) $ 158 $ (4,286) 7002054 New York Presbyterian H. $ 20,360 $ (9,361) $ 3,132 $(13,338) 7003001 Flushing H. and Medical Center $ 7,582 $ 4,084 $ 3,065 $ 12,050 7003003 Jamaica Hospital $ 34,656 $ (4,804) $ (4,528) $ 50,860 7003004 Long Island Jewish-Hillside M C $ 8,788 $ 1,073 $ 5,688 $ (668) 7003006 Peninsula Hospital Center $ 1,548 $ 1,420 $ 1,546 $ 2,441 7003010 New York M C of Queens $ 7,632 $ 1,489 $ 1,763 $ (1,842) 7003013 Forest Hills - North Shore $ 1,850 $ 1,324 $ 1,011 $ 16 7003015 Mount Sinai H. of Queens $ 4,911 $ 423 $ 1,527 $ 8,880 7004003 Staten Island University H. $ 8,234 $ 6,436 $ 7,924 $ 7,343 7004010 Richmond University Medical $ 7,487 $ (350) $ (790) $ (1,731) Sum of gains and losses $0 $0 $0

123
Appendix Exhibit 6 – B
Percentage Gain (Loss) for CARE, BASE, and BASE STEEP versus Actual, 2010 Excludes Major Public Hospitals
Opcert
Hospital Name
Total Actual
Allocation
($ K)
(CARE minus
Actual) / Actual
(BASE minus
Actual) / Actual
(BASE STEEP minus
Actual) / Actual
0101000 Albany Medical Center H. $5,070 19.9% 53.1% -16.8%0101003 Albany, Memorial Hospital of $1,211 65.1% 53.7% 36.3%0101004 St Peters Hospital $3,469 98.2% 51.9% -10.6%0101005 Albany M C South Clin Cam $59 996.8% 1086.9% 1524.1%0226700 Cuba Memorial Hospital Inc $790 -67.4% -70.6% -64.4%0228000 Memorial H. of W+G Jones $664 223.6% 114.1% 298.9%0301001 Our Lady of Lourdes Meml H. $1,927 162.6% 57.0% -5.4%0303001 United Health Services, Inc $4,440 87.2% 47.0% 3.7%0401001 Olean General Hospital $1,320 211.1% 106.4% 184.1%0427000 TLC Health Network $1,616 5.4% -31.0% -18.2%0501000 Auburn Memorial Hospital $1,028 100.1% 36.6% 9.0%0601000 Brooks Memorial Hospital $564 49.9% -19.9% -57.0%0602001 Woman’s Christian Association $1,566 61.5% 15.7% -2.4%0632000 Westfield Memorial Hospital Inc $293 29.1% -31.3% -35.7%0701000 Arnot-Ogden Memorial Hospital $1,591 101.5% 55.0% 12.2%0701001 St Josephs Hospital of Elmira $1,059 48.1% 10.2% -17.8%0824000 Chenango Memorial Hospital Inc $1,646 177.7% 116.0% 632.1%0901001 Champlain Valley Physicians H. $2,067 -20.2% -45.2% -86.5%1001000 Columbia Memorial Hospital $2,320 -5.7% -35.7% -60.0%1101000 Cortland Memorial Hospital Inc $1,346 29.5% -16.0% -35.6%1226701 Margaretville Memorial Hospital $583 -100.0% -100.0% -100.0%1227001 Tri-Town Regional Healthcare $593 -62.7% -100.0% -100.0%1229700 Delaware Valley Hospital Inc $554 -95.5% -100.0% -100.0%1254700 O’Connor Hospital $436 -67.9% -74.1% -88.3%1302000 St Francis H. of Poughkeepsie $3,936 -45.4% -37.5% -59.1%1302001 Vassar Brothers Medical Center $5,130 69.1% 72.3% 78.8%1327000 Northern Dutchess Hospital $1,461 -37.5% -50.0% -75.1%1401002 Kaleida Hlth/Women+Childrens H $1,403 165.0% 120.6% 33.3%1401006 Sheehan Memorial Emergency H. $25 198.3% 136.5% -50.9%1401008 Mercy Hospital of Buffalo $2,098 72.3% 41.7% -35.5%1401013 Sisters of Charity Hospital $2,357 31.3% 24.2% -17.0%1401014 Millard Fillmore - Kaleida Health $4,211 72.9% 109.5% -6.2%1404000 Kenmore Mercy Hospital $818 73.5% 80.4% -4.0%1427000 Bertrand Chaffee Hospital $390 -25.8% -44.9% -57.7%1455000 St Joseph Hospital $589 -21.1% -100.0% -100.0%1552701 Elizabethtown Community H. $419 -53.9% -59.1% -79.9%1564701 Moses-Ludington Hospital $439 -63.2% -86.6% -96.6%1623001 Adirondack Medical Center $1,806 -15.2% -19.7% -12.1%1624000 Alice Hyde Memorial Hospital $1,154 92.7% 16.4% 32.9%1701000 Nathan Littauer Hospital $2,035 63.9% -4.1% 29.5%1801000 United Memorial Medical Center $881 76.8% 17.5% -18.9%

124
Appendix Exhibit 6 – B (Continued)
Percentage Gain (Loss) for CARE, BASE, and BASE STEEP versus Actual, 2010 Excludes Major Public Hospitals
Opcert
Hospital Name
Total Actual
Allocation
($ K)
(CARE minus
Actual) / Actual
(BASE minus
Actual) / Actual
(BASE STEEP minus
Actual) / Actual
2129700 Little Falls Hospital $845 -87.8% -95.8% -99.7%2201000 Samaritan Medical Center $2,615 2.2% -29.9% -61.6%2221700 River Hospital $515 -44.5% -44.3% -26.5%2238001 Carthage Area Hospital Inc $619 62.7% -1.4% -4.3%2424000 Lewis County General Hospital $886 3.0% -37.6% -43.0%2527000 Nicholas H Noyes Meml. H. $845 -27.6% -48.6% -81.2%2601001 Oneida Healthcare Center $1,018 12.4% -23.5% -45.2%2625000 Community Memorial Hospital $753 108.7% 20.4% 13.7%2701001 Highland Hospital of Rochester $1,733 315.1% 216.3% 190.3%2701003 Rochester General Hospital $8,063 94.6% 69.4% 63.5%2701005 Strong Memorial Hospital $7,677 13.3% 57.9% -22.6%2701006 Monroe Community Hospital $0 2728001 Lakeside Memorial Hospital $360 198.6% 73.8% 61.7%2754001 Park Ridge Hospital $3,590 42.0% 12.9% -49.8%2801000 Amsterdam Memorial Hospital $207 -59.5% -100.0% -100.0%2801001 St Mary’s Hospital at Amsterdam $1,196 149.0% 78.3% 70.8%2901000 Glen Cove - North Shore $3,214 7.5% 28.2% 29.8%2902000 Long Beach Medical Center $1,559 59.3% 71.5% 163.8%2908000 Winthrop University Hospital $4,944 61.6% 67.7% -8.3%2909000 Mercy Medical Center $2,798 23.0% 35.7% 0.8%2910000 Franklin Hospital Medical Center $2,946 -10.9% 6.2% -16.5%2950001 South Nassau Communities H. $3,762 72.7% 64.5% 22.6%2951001 North Shore University H. $16,660 -17.9% 24.9% -16.6%2952005 Plainview - North Shore $976 77.1% 51.6% -50.3%2952006 New Island Hospital $1,364 78.6% 151.8% 217.8%2953000 St Francis Hospital of Roslyn $1,058 -35.1% 82.1% -64.7%3101001 Lockport Memorial Hospital $418 101.1% -53.2% -89.8%3102000 Niagara Falls Meml M C $1,239 55.4% 12.1% -17.3%3121001 Mt. St. Mary’s H. of Nia.Falls $636 206.3% 172.6% 158.0%3154000 Inter-Comm. Mem. H. Newfane $578 20.2% -71.8% -90.3%3201002 Rome H. and Murphy Meml. $956 87.0% 43.0% 19.9%3202002 St Elizabeth Medical Center $1,853 103.4% 113.1% 71.2%3202003 St Luke’s / Faxton Memorial H. $2,474 324.6% 211.9% 280.7%3301000 Community-General H of Gr. Syr. $1,167 96.9% 64.2% 0.6%3301003 St Josephs H. Health Center $4,610 42.0% 28.2% -28.5%3301008 Crouse Hospital $3,642 61.6% 55.0% 9.0%3402000 Geneva General Hospital $1,389 57.2% -10.5% -38.1%3421000 Clifton Springs H. + Clinic $433 4.3% 5.9% -48.1%3429000 F F Thompson Hospital $805 105.5% 47.1% -4.7%3522000 St. Luke's - Cornwall H $3,521 57.3% 30.9% 44.6%3523000 Orange Regional M.C. $1,954 352.1% 294.1% 330.9%

125
Appendix Exhibit 6 – B (Continued)
Percentage Gain (Loss) for CARE, BASE, and BASE STEEP versus Actual, 2010 Excludes Major Public Hospitals
Opcert
Hospital Name
Total Actual
Allocation
($ K)
(CARE minus
Actual) / Actual
(BASE minus
Actual) / Actual
(BASE STEEP minus
Actual) / Actual
3529000 St Anthony Community Hospital $390 196.1% 146.1% 81.1%3535001 Bon Secours Community H. $3,538 -20.9% -35.9% -20.9%3622000 Medina Memorial Hospital $493 46.8% -17.5% -47.4%3701000 Albert Lindley Lee Meml H. $0 3702000 Oswego Hospital $1,633 56.6% -23.2% -41.0%3801000 Aurelia Osborn Fox Meml. H. $1,584 24.3% -20.3% -40.5%3824000 Mary Imogene Bassett Hospital $3,478 86.9% 51.7% 27.6%3950000 Putnam Community Hospital $2,056 46.0% 41.6% 20.4%4102002 Samaritan Hospital of Troy $2,059 42.9% 7.2% -11.1%4102003 Seton Health System $2,129 19.8% -28.9% -66.6%4324000 Nyack Hospital $2,441 28.6% 39.2% 6.9%4329000 Good Samaritan H. / West Islip $4,419 -21.1% -27.4% -70.6%4353000 Summit Park H./Rockland Co. Inf. $3,737 -100.0% -100.0% -100.0%4401000 Claxton-Hepburn Medical Center $820 101.0% 26.3% -30.2%4402000 Massena Memorial Hospital $1,136 111.0% 13.9% 20.6%4423000 Edward John Noble / Gouverneur $553 13.7% -43.3% -42.8%4429000 Canton-Potsdam Hospital $1,264 -99.9% -100.0% -100.0%4458700 Clifton-Fine Hospital $193 -48.1% -43.7% -63.6%4501000 Saratoga Hospital $2,002 81.2% 43.4% 22.9%4601001 Ellis Hospital $3,931 68.2% 34.9% 2.2%4601004 Sunnyview H. + Rehab Ctr $519 -100.0% -100.0% -100.0%4720001 Cobleskill Reg. H. Bassett/Schoh $913 -48.4% -59.4% -70.9%4823700 Schuyler Hospital $747 -50.5% -61.5% -80.7%5001000 Corning Hospital $2,159 -32.5% -56.4% -74.5%5002001 St James Mercy Hospital $1,332 58.2% -13.6% -22.3%5022000 Ira Davenport Memorial H. $1,246 4.9% -31.5% 69.0%5123000 Brookhaven Memorial H. $7,372 20.0% 17.5% 51.1%5126000 Southampton Hospital $1,371 164.3% 131.1% 257.3%5127000 Eastern Long Island Hospital $861 10.1% 78.8% 180.5%5149000 John T Mather Memorial H. $2,052 -4.0% 28.2% -32.2%5149001 St Charles Hospital $1,603 0.6% -8.3% -68.6%5153000 Huntington Hospital $3,769 -19.3% -34.3% -73.9%5154000 Southside Hospital $7,916 -13.6% -22.4% -20.9%5154001 Good Samaritan H / Suffern $8,531 -55.4% -48.2% -79.0%5155000 Peconic Bay M.C. / Ctl. Suffolk $1,866 75.2% 48.6% 68.2%5157003 St Catherine of Siena $1,151 -40.7% -33.0% -89.8%5263000 Catskill Reg. M C - G Hermann $9,198 -48.9% -63.2% -34.9%5263700 Catskill Regional Medical Center $547 -79.5% -84.0% -88.8%5401001 Cayuga M C at Ithaca $1,841 22.8% -20.0% -52.4%5501000 Benedictine Hospital $2,174 -15.0% -31.7% -53.1%5501001 Kingston H. $2,386 -1.0% -23.6% -35.1%

126
Appendix Exhibit 6 – B (Continued)
Percentage Gain (Loss) for CARE, BASE, and BASE STEEP versus Actual, 2010 Excludes Major Public Hospitals
Opcert
Hospital Name
Total Actual
Allocation
($ K)
(CARE minus
Actual) / Actual
(BASE minus
Actual) / Actual
(BASE STEEP minus
Actual) / Actual
5526700 Ellenville Regional Hospital $1,767 -76.7% -89.8% -93.4%5601000 Glens Falls Hospital $4,009 86.8% 26.0% 12.0%5820000 Wayne Health Care $2,519 -22.5% -56.3% -49.8%5901000 Hudson Valley Hospital $1,727 39.5% 27.0% 8.7%5902001 White Plains H. Med Ctr $2,130 137.4% 151.3% 106.3%5902002 Burke Rehabilitation Center $173 -98.3% -77.0% -99.4%5903000 Mount Vernon Hospital $10,485 -39.7% -35.1% 82.9%5904000 Sound Shore M. C. Westchester $10,769 12.3% -9.3% 108.7%5907001 St Johns Riverside Hospital $3,960 79.6% 73.5% 158.4%5907002 St Josephs Hospital Yonkers $8,610 -1.5% -1.4% 193.2%5920000 Northern Westchester Hospital $1,334 5.9% -8.6% -73.5%5922000 Lawrence Hospital $1,393 142.4% 115.3% 81.6%5925000 Community H. at Dobbs Ferry $260 65.4% -100.0% -100.0%5932000 Phelps Meml. H. Association $1,541 84.1% 38.1% -26.6%5957000 Blythedale Childrens Hospital $201 18.8% 6.8% -81.6%6027000 Wyoming County Community H. $689 58.0% -8.2% -24.7%6120700 Soldiers and Sailors Meml. H. $919 -93.5% -93.7% -99.2%7000001 Bronx-Lebanon H. Ctr. $44,678 -60.4% -56.1% -39.4%7000006 Montefiore H. + M.C. $23,299 -11.9% 3.7% -48.0%7000011 Calvary Hospital $687 -100.0% -100.0% -100.0%7000014 St Barnabas Hospital $22,570 -17.7% -17.4% 75.8%7000025 NY Westchester Square M C $1,029 127.9% 97.9% 70.8%7001002 Brookdale Hosp M C $23,139 -58.8% -53.7% -59.1%7001003 Brooklyn Hospital $4,614 38.2% 26.2% -21.1%7001008 New York Community / Brooklyn $631 73.5% 88.2% 0.8%7001017 Long Island College Hospital $6,156 -1.7% 2.8% -37.7%7001019 Lutheran Medical Center $34,492 -74.3% -71.2% -76.3%7001020 Maimonides Medical Center $14,956 -19.9% -13.4% -47.6%7001021 NY Methodist H of Brooklyn $4,094 93.1% 95.9% 10.5%7001024 Episcopal Health Services, Inc $1,767 28.3% 35.1% -30.4%7001033 Kingsbrook Jewish M C $1,505 156.4% 136.4% 72.3%7001035 Wyckoff Heights Hospital $8,705 7.1% -0.5% 21.9%7001041 Beth Israel M C - Kings Hwy Div $1,292 -5.1% 14.8% -44.3%7001046 Interfaith Medical Center $12,923 -68.3% -65.4% -72.3%7002000 New York Downtown $6,535 -15.3% -27.6% -72.9%7002002 Beth Israel Medical Center $13,379 -64.4% -52.9% -85.9%7002012 Hospital for Special Surgery $966 -100.0% -100.0% -100.0%7002017 Lenox Hill Hospital $7,657 -43.2% -2.7% -55.0%7002020 Memorial H. for Cancer $7,712 -73.1% -28.5% -88.9%7002024 Mount Sinai Hospital $13,553 -2.1% 41.3% -20.6%7002026 New York Eye+Ear Infirmary $1,914 81.7% 110.9% 246.4%

127
Appendix Exhibit 6 – B (Continued)
Percentage Gain (Loss) for CARE, BASE, and BASE STEEP versus Actual, 2010 Excludes Major Public Hospitals
Opcert
Hospital Name
Total Actual
Allocation
($ K)
(CARE minus
Actual) / Actual
(BASE minus
Actual) / Actual
(BASE STEEP minus
Actual) / Actual
7002031 Rockefeller University Hospital $43 -100.0% -100.0% -100.0%7002032 St Luke’s / Roosevelt H. Center $25,123 -22.7% -4.0% -17.3%7002037 St Vincent’s Hospital $3,252 162.1% 25.4% -71.4%7002052 North General Hospital $1,603 41.1% -22.2% -70.3%7002053 NY University Med Ctr $5,198 -76.6% 3.0% -82.5%7002054 New York Presbyterian H. $20,360 -46.0% 15.4% -65.5%7003001 Flushing H. and Medical Center $7,582 53.9% 40.4% 158.9%7003003 Jamaica Hospital $34,656 -13.9% -13.1% 146.8%7003004 Long Island Jewish-Hillside M C $8,788 12.2% 64.7% -7.6%7003006 Peninsula Hospital Center $1,548 91.7% 99.9% 157.7%7003010 New York Medical Ctr of Queens $7,632 19.5% 23.1% -24.1%7003013 Forest Hills – North Shore $1,850 71.6% 54.7% 0.8%7003015 Mount Sinai H. of Queens $4,911 8.6% 31.1% 180.8%7004003 Staten Island University H. $8,234 78.2% 96.2% 89.2%7004010 Richmond University Medical $7,487 -4.7% -10.6% -23.1%

128
Appendix Exhibit 7 – A
Dollar Gain (Loss) for CARE, BASE, and BASE STEEP versus Actual, 2010— All 200 New York State Hospitals
(All Dollars in Thousands) Operating Cert. No.
Hospital Name
Total Actual
Allocation
CARE minus Actual
BASE minus Actual
BASE STEEP
minus Actual
101000 Albany Medical Center H. $5,068 -$462 $662 -$2,955101003 Albany, Memorial Hospital of $1,211 $304 $164 -$384101004 St Peters Hospital $3,468 $1,742 $424 -$1,915101005 Albany M C South Clin Cam $59 $428 $455 $418226700 Cuba Memorial Hospital Inc $789 -$594 -$618 -$648228000 Memorial H. of W+G Jones $663 $964 $386 $663301001 Our Lady of Lourdes Meml H. $1,926 $1,907 $308 -$1,013303001 United Health Services, Inc $4,438 $1,858 $382 -$2,132401001 Olean General Hospital $1,319 $1,791 $692 $559427000 TLC Health Network $1,616 -$324 -$792 -$953501000 Auburn Memorial Hospital $1,028 $531 $9 -$466601000 Brooks Memorial Hospital $563 $77 -$230 -$442602001 Woman’s Christian Association $1,566 $350 -$227 -$799632000 Westfield Memorial Hospital Inc $293 -$6 -$144 -$198701000 Arnot-Ogden Memorial Hospital $1,590 $838 $230 -$695701001 St Josephs Hospital of Elmira $1,058 $130 -$197 -$622824000 Chenango Memorial Hospital Inc $1,645 $1,817 $979 $4,393901001 Champlain Valley Physicians H. $2,066 -$816 -$1,230 -$1,926
1001000 Columbia Memorial Hospital $2,319 -$662 -$1,217 -$1,8541101000 Cortland Memorial Hospital Inc $1,346 -$25 -$511 -$9111226701 Margaretville Memorial Hospital $582 -$582 -$582 -$5821227001 Tri-Town Regional Healthcare $593 -$425 -$593 -$5931229700 Delaware Valley Hospital Inc $554 -$535 -$554 -$5541254700 O’Connor Hospital $436 -$330 -$353 -$4111302000 St Francis H. of Poughkeepsie $3,934 -$2,306 -$2,117 -$3,1271302001 Vassar Brothers Medical Center $5,127 $1,443 $1,399 -$5321327000 Northern Dutchess Hospital $1,460 -$768 -$921 -$1,2781401002 Kaleida Hlth/Women+Childrens $1,402 $1,414 $883 -$4651401005 Erie County Medical Center $4,217 $5,812 $9,497 $16,1131401006 Sheehan Meml Emergency H. $25 $32 $19 -$191401008 Mercy Hospital of Buffalo $2,097 $641 $98 -$1,4191401010 Roswell Park Memorial Institute $2,227 -$2,155 -$2,041 -$2,2231401013 Sisters of Charity Hospital $2,356 -$11 -$194 -$1,3761401014 Millard Fillmore - Kaleida Health $4,210 $1,308 $2,305 -$2,2291404000 Kenmore Mercy Hospital $818 $258 $272 -$4251427000 Bertrand Chaffee Hospital $390 -$171 -$231 -$3071455000 St Joseph Hospital $588 -$237 -$588 -$5881552701 Elizabethtown Community H. $419 -$273 -$292 -$377

129
Appendix Exhibit 7 – A (Continued)
Dollar Gain (Loss) for CARE, BASE, and BASE STEEP versus Actual, 2010— All 200 New York State Hospitals
(All Dollars in Thousands) Operating Cert. No.
Hospital Name
Total Actual
Allocation
CARE minus Actual
BASE minus Actual
BASE STEEP
minus Actual
1564701 Moses-Ludington Hospital $438 -$316 -$395 -$4311623001 Adirondack Medical Center $1,805 -$645 -$735 -$1,0101624000 Alice Hyde Memorial Hospital $1,154 $532 -$162 -$3851701000 Nathan Littauer Hospital $2,034 $493 -$593 -$7141801000 United Memorial Medical Center $881 $300 -$116 -$5232129700 Little Falls Hospital $845 -$766 -$818 -$8432201000 Samaritan Medical Center $2,614 -$589 -$1,261 -$2,1112221700 River Hospital $514 -$298 -$303 -$3252238001 Carthage Area Hospital Inc $619 $144 -$168 -$3222424000 Lewis County General Hospital $886 -$194 -$477 -$6332527000 Nicholas H Noyes Meml. H. $845 -$381 -$524 -$7652601001 Oneida Healthcare Center $1,018 -$151 -$442 -$7382625000 Community Memorial Hospital $753 $438 -$84 -$3242701001 Highland Hospital of Rochester $1,732 $3,717 $2,314 $7892701003 Rochester General Hospital $8,059 $3,828 $2,027 -$1,4522701005 Strong Memorial Hospital $7,674 -$1,087 $1,278 -$4,6972701006 Monroe Community Hospital $0 $0 $0 $02728001 Lakeside Memorial Hospital $360 $455 $102 -$682754001 Park Ridge Hospital $3,588 $275 -$596 -$2,6862801000 Amsterdam Memorial Hospital $207 -$143 -$207 -$2072801001 St Mary’s H. at Amsterdam $1,196 $1,061 $379 -$1722901000 Glen Cove - North Shore $3,213 -$596 -$170 -$1,1232902000 Long Beach Medical Center $1,558 $323 $415 $5022908000 Winthrop University Hospital $4,942 $1,110 $1,181 -$2,6692909000 Mercy Medical Center $2,797 -$190 $6 -$1,3842910000 Franklin H. Medical Center $2,944 -$956 -$634 -$1,7122950001 South Nassau Communities H. $3,761 $1,162 $807 -$1,4502950002 Nassau University M C $7,424 $10,154 $10,213 $18,5992951001 North Shore University H. $16,652 -$6,289 -$1,285 -$9,6892952005 Plainview - North Shore $976 $334 $117 -$7332952006 New Island Hospital $1,364 $482 $1,172 $8092953000 St Francis Hospital of Roslyn $1,057 -$537 $365 -$8703101001 Lockport Memorial Hospital $418 $219 -$273 -$3973102000 Niagara Falls Meml M C $1,239 $221 -$213 -$7253121001 Mt. St. Mary’s H. of Nia.Falls $636 $840 $645 $1863154000 Inter-Comm. Mem. H. Newfane $578 -$52 -$458 -$5503201002 Rome H. and Murphy Meml. $955 $399 $54 -$3813202002 St Elizabeth Medical Center $1,852 $1,003 $1,062 -$2633202003 St Luke’s / Faxton Memorial H. $2,473 $5,485 $3,223 $2,246

130
Appendix Exhibit 7 – A (Continued)
Dollar Gain (Loss) for CARE, BASE, and BASE STEEP versus Actual, 2010— All 200 New York State Hospitals
(All Dollars in Thousands) Operating Cert. No.
Hospital Name
Total Actual
Allocation
CARE minus Actual
BASE minus Actual
BASE STEEP
minus Actual
3301000 Comm.-Genl. H. Gr. Syracuse $1,166 $575 $248 -$5783301003 St Josephs H. Health Center $4,608 $352 -$243 -$2,9563301007 SUNY Hlth Sci Ctr. at Syracuse $3,889 $486 $1,978 -$1,6363301008 Crouse Hospital $3,640 $818 $527 -$1,6513402000 Geneva General Hospital $1,388 $266 -$470 -$9573421000 Clifton Springs H. + Clinic $433 -$91 -$94 -$3213429000 F F Thompson Hospital $804 $449 $69 -$4203522000 St. Luke's - Cornwall H $3,519 $675 -$116 -$9683523000 Orange Regional M.C. $1,953 $4,740 $3,732 $2,2653529000 St Anthony Community Hospital $389 $485 $318 -$363535001 Bon Secours Community H. $3,536 -$1,416 -$1,862 -$2,1343622000 Medina Memorial Hospital $493 $56 -$193 -$3633701000 Albert Lindley Lee Meml H. $0 $0 $0 $03702000 Oswego Hospital $1,632 $306 -$706 -$1,1503801000 Aurelia Osborn Fox Meml. H. $1,583 -$92 -$651 -$1,1113824000 Mary Imogene Bassett Hospital $3,476 $1,449 $418 -$1,2523950000 Putnam Community Hospital $2,055 $219 $94 -$8154102002 Samaritan Hospital of Troy $2,058 $170 -$428 -$1,1414102003 Seton Health System $2,128 -$196 -$1,011 -$1,7724322000 Helen Hayes Hospital $1,467 -$1,467 -$1,467 -$1,4674324000 Nyack Hospital $2,440 -$63 $69 -$1,1324329000 Good Samaritan H. / West Islip $4,417 -$1,774 -$2,048 -$3,7674353000 Summit Park H./Rockland Co. $3,736 -$3,736 -$3,736 -$3,7364401000 Claxton-Hepburn Medical Center $820 $429 -$55 -$5334402000 Massena Memorial Hospital $1,135 $680 -$180 -$4494423000 Edward John Noble / Gouverneur $552 -$76 -$321 -$3944429000 Canton-Potsdam Hospital $1,263 -$1,263 -$1,263 -$1,2634458700 Clifton-Fine Hospital $193 -$117 -$113 -$1584501000 Saratoga Hospital $2,002 $748 $119 -$7694601001 Ellis Hospital $3,929 $1,079 -$15 -$1,9154601004 Sunnyview H. + Rehab Ctr $519 -$519 -$519 -$5194720001 Cobleskill Reg.-Bassett/Schoh $913 -$555 -$639 -$7794823700 Schuyler Hospital $747 -$467 -$534 -$6755001000 Corning Hospital $2,158 -$1,054 -$1,463 -$1,8825002001 St James Mercy Hospital $1,331 $265 -$482 -$8135022000 Ira Davenport Memorial H. $1,246 -$255 -$615 -$1915123000 Brookhaven Memorial H. $7,369 -$666 -$976 -$1,7895126000 Southampton Hospital $1,370 $1,374 $969 $1,0845127000 Eastern Long Island Hospital $861 -$142 $276 $349

131
Appendix Exhibit 7 – A (Continued)
Dollar Gain (Loss) for CARE, BASE, and BASE STEEP versus Actual, 2010— All 200 New York State Hospitals
(All Dollars in Thousands) Operating Cert. No.
Hospital Name
Total Actual
Allocation
CARE minus Actual
BASE minus Actual
BASE STEEP
minus Actual
5149000 John T Mather Memorial H. $2,051 -$559 -$109 -$1,3545149001 St Charles Hospital $1,602 -$380 -$517 -$1,3505151001 University H. at Stony Brook $6,334 $4,358 $8,203 $3,2805153000 Huntington Hospital $3,768 -$1,463 -$1,939 -$3,2745154000 Southside Hospital $7,913 -$2,729 -$3,379 -$4,7745154001 Good Samaritan H. / Suffern $8,528 -$5,647 -$5,267 -$7,6305155000 Peconic Bay M.C. / Ctl. Suffolk $1,866 $611 $183 -$2935157003 St Catherine of Siena $1,151 -$634 -$581 -$1,0925263000 Catskill Reg. M C - G Hermann $9,193 -$5,634 -$6,693 -$6,1945263700 Catskill Regional Medical Center $547 -$462 -$482 -$5165401001 Cayuga M C at Ithaca $1,840 -$128 -$752 -$1,4025501000 Benedictine Hospital $2,173 -$774 -$1,076 -$1,6635501001 Kingston H. $2,385 -$595 -$1,039 -$1,6095526700 Ellenville Regional Hospital $1,766 -$1,455 -$1,634 -$1,7085601000 Glens Falls Hospital $4,008 $1,668 -$277 -$1,7575820000 Wayne Health Care $2,518 -$1,038 -$1,706 -$1,8845901000 Hudson Valley Hospital $1,727 $99 -$107 -$7865902001 White Plains H. Med Ctr $2,129 $1,701 $1,823 $725902002 Burke Rehabilitation Center $173 -$170 -$143 -$1725903000 Mount Vernon Hospital $10,481 -$5,692 -$5,457 -$8715904000 Sound Shore M C Westchester $10,764 -$1,601 -$3,555 $4965907001 St Johns Riverside Hospital $3,958 $1,431 $1,113 $1,1705907002 St Josephs Hospital Yonkers $8,606 -$2,184 -$2,336 $4,0445920000 Northern Westchester Hospital $1,334 -$264 -$433 -$1,1565922000 Lawrence Hospital $1,392 $1,165 $822 -$1255925000 Community H. at Dobbs Ferry $259 $66 -$259 -$2595932000 Phelps Meml. H. Association $1,540 $609 $31 -$9745957000 Blythedale Childrens Hospital $201 -$20 -$42 -$1825957001 Westchester Medical Center $8,155 -$2,915 $1,501 -$4,1326027000 Wyoming County Community H. $689 $136 -$222 -$4296120700 Soldiers and Sailors Meml. H. $919 -$874 -$876 -$9157000001 Bronx-Lebanon H. Ctr. $44,658 -$31,253 -$30,194 -$31,1027000002 Jacobi Medical Center $8,791 $14,290 $14,340 $19,8237000006 Montefiore H. + M.C. $23,289 -$7,739 -$5,451 -$17,2227000008 Lincoln Medical + Mental Hlth Ctr $9,618 $15,167 $14,994 $33,3277000011 Calvary Hospital $686 -$686 -$686 -$6867000014 St Barnabas Hospital $22,560 -$8,484 -$8,792 -$2,6807000024 North Central Bronx Hospital $4,842 $6,435 $4,793 $10,4867000025 NY Westchester Square M C $1,029 $748 $475 -$148

132
Appendix Exhibit 7 – A (Continued)
Dollar Gain (Loss) for CARE, BASE, and BASE STEEP versus Actual, 2010— All 200 New York State Hospitals
(All Dollars in Thousands) Operating Cert. No.
Hospital Name
Total Actual
Allocation
CARE minus Actual
BASE minus Actual
BASE STEEP
minus Actual
7001002 Brookdale Hosp M C $23,129 -$15,909 -$15,214 -$18,3847001003 Brooklyn Hospital $4,612 $217 -$312 -$2,7877001008 New York Community/Brooklyn $631 $199 $246 -$3127001009 Coney Island Hospital $4,153 $11,844 $12,416 $20,0087001016 Kings County Hospital Center $15,302 $21,395 $22,488 $56,3567001017 Long Island College Hospital $6,153 -$1,571 -$1,482 -$4,2327001019 Lutheran Medical Center $34,477 -$27,766 -$27,143 -$30,3857001020 Maimonides Medical Center $14,949 -$5,869 -$5,387 -$11,0257001021 N. Y. Methodist H of Brooklyn $4,092 $1,896 $1,828 -$1,8267001024 Episcopal Health Services, Inc $1,766 -$49 -$4 -$1,1507001033 Kingsbrook Jewish M C $1,504 $1,419 $1,122 -$2057001035 Wyckoff Heights Hospital $8,695 -$1,629 -$2,301 -$3,3787001037 State University H. Downstate $5,418 $3,014 $4,532 $1,1867001041 Beth Israel M C- Kings Hwy $1,291 -$362 -$197 -$9307001045 Woodhull Med + Mental Hlth Ctr $8,021 $18,795 $16,988 $38,0737001046 Interfaith Medical Center $12,918 -$9,809 -$9,619 -$11,1237002000 New York Downtown $6,532 -$2,340 -$3,040 -$5,6447002001 Bellevue Hospital Center $14,507 $16,413 $17,705 $33,7267002002 Beth Israel Medical Center $13,373 -$9,763 -$8,723 -$12,4277002009 Harlem Hospital Center $8,243 $5,780 $5,334 $8,5187002012 Hospital for Special Surgery $966 -$966 -$966 -$9667002017 Lenox Hill Hospital $7,653 -$4,359 -$2,154 -$5,9287002020 Memorial H. for Cancer $7,709 -$6,138 -$3,637 -$7,2817002021 Metropolitan Hospital Center $7,288 $9,670 $8,288 $16,5077002024 Mount Sinai Hospital $13,547 -$3,493 $596 -$8,1577002026 New York Eye+Ear Infirmary $1,913 $722 $1,067 $1,4097002031 Rockefeller University Hospital $43 -$43 -$43 -$437002032 St Luke’s / Roosevelt H. Center $25,112 -$10,393 -$7,310 -$14,7047002037 St Vincent’s Hospital $3,250 $3,208 -$240 -$2,7837002050 Goldwater Memorial Hospital $3,212 -$3,212 -$3,212 -$3,2127002051 Coler Memorial Hospital $2,214 -$2,214 -$2,214 -$2,2147002052 North General Hospital $1,602 $112 -$682 -$1,3637002053 NY University Med Ctr $5,195 -$4,273 -$1,242 -$4,7387002054 New York Presbyterian H. $20,351 -$12,018 -$3,008 -$16,8337003000 City Hospital Ctr at Elmhurst $7,479 $23,036 $24,402 $51,6137003001 Flushing H. and Medical Center $7,578 $1,260 $282 $2,2587003003 Jamaica Hospital $34,641 -$12,025 -$12,398 $8,2087003004 L.I. Jewish-Hillside Med Ctr $8,784 -$1,313 $1,903 -$4,7157003006 Peninsula Hospital Center $1,548 $701 $737 $451

133
Appendix Exhibit 7 – A (Continued)
Dollar Gain (Loss) for CARE, BASE, and BASE STEEP versus Actual, 2010— All 200 New York State Hospitals
(All Dollars in Thousands) Operating Cert. No.
Hospital Name
Total Actual
Allocation
CARE minus Actual
BASE minus Actual
BASE STEEP
minus Actual
7003007 Queens Hospital Center $6,535 $16,857 $16,295 $40,3527003010 New York M C of Queens $7,629 -$719 -$693 -$4,7287003013 Forest Hills - North Shore $1,849 $555 $263 -$9147003015 Mount Sinai H. of Queens $4,909 -$868 -$156 $2,0017004003 Staten Island University H. $8,231 $2,884 $3,699 -$4257004010 Richmond University Medical $7,484 -$2,077 -$2,540 -$4,600

134
Appendix Exhibit 7 – B
Percentage Gain (Loss) for CARE, BASE, and BASE STEEP versus Actual, 2010— All 200 New York State Hospitals
Operating Cert. No.
Hospital Name
Total Actual
Allocation
(CARE minus
Actual) as % of
Actual
(BASE minus
Actual) as % of
Actual
(BASE STEEP
minus Actual) as
% of Actual
101000 Albany Medical Center H. $5,067,711 -9.1% 13.1% -58.3%101003 Albany, Memorial Hospital of $1,210,885 25.1% 13.6% -31.7%101004 St Peters Hospital $3,467,897 50.2% 12.2% -55.2%101005 Albany M C South Clin Cam $58,542 731.3% 776.6% 714.1%226700 Cuba Memorial Hospital Inc $789,459 -75.3% -78.3% -82.1%228000 Memorial H. of W+G Jones $663,385 145.3% 58.2% 100.0%301001 Our Lady of Lourdes Meml H. $1,926,264 99.0% 16.0% -52.6%303001 United Health Services, Inc $4,438,134 41.9% 8.6% -48.0%401001 Olean General Hospital $1,319,367 135.8% 52.5% 42.4%427000 TLC Health Network $1,615,746 -20.1% -49.0% -59.0%501000 Auburn Memorial Hospital $1,027,548 51.7% 0.9% -45.4%601000 Brooks Memorial Hospital $563,383 13.6% -40.8% -78.5%602001 Woman’s Christian Association $1,565,697 22.4% -14.5% -51.1%632000 Westfield Memorial Hospital Inc $292,889 -2.2% -49.3% -67.8%701000 Arnot-Ogden Memorial Hospital $1,590,012 52.7% 14.5% -43.7%701001 St Josephs Hospital of Elmira $1,058,161 12.3% -18.6% -58.8%824000 Chenango Memorial Hospital Inc $1,645,289 110.5% 59.5% 267.0%901001 Champlain Valley Physicians H. $2,065,925 -39.5% -59.5% -93.2%
1001000 Columbia Memorial Hospital $2,318,849 -28.6% -52.5% -79.9%1101000 Cortland Memorial Hospital Inc $1,345,583 -1.8% -37.9% -67.7%1226701 Margaretville Memorial Hospital $582,330 -100.0% -100.0% -100.0%1227001 Tri-Town Regional Healthcare $593,120 -71.7% -100.0% -100.0%1229700 Delaware Valley Hospital Inc $554,207 -96.6% -100.0% -100.0%1254700 O’Connor Hospital $436,106 -75.7% -80.8% -94.1%1302000 St Francis H. of Poughkeepsie $3,934,448 -58.6% -53.8% -79.5%1302001 Vassar Brothers Medical Center $5,127,337 28.1% 27.3% -10.4%1327000 Northern Dutchess Hospital $1,460,048 -52.6% -63.1% -87.5%1401002 Kaleida Hlth/Women+Childrens $1,402,198 100.8% 62.9% -33.2%1401005 Erie County Medical Center $4,216,936 137.8% 225.2% 382.1%1401006 Sheehan Meml Emergency H. $25,066 126.1% 74.7% -75.4%1401008 Mercy Hospital of Buffalo $2,097,104 30.6% 4.7% -67.7%1401010 Roswell Park Memorial Institute $2,227,030 -96.8% -91.6% -99.8%1401013 Sisters of Charity Hospital $2,356,040 -0.5% -8.2% -58.4%1401014 Millard Fillmore - Kaleida Health $4,209,596 31.1% 54.8% -53.0%1404000 Kenmore Mercy Hospital $818,060 31.5% 33.3% -51.9%1427000 Bertrand Chaffee Hospital $389,829 -43.7% -59.3% -78.8%1455000 St Joseph Hospital $588,318 -40.2% -100.0% -100.0%1552701 Elizabethtown Community H. $418,944 -65.1% -69.8% -89.9%

135
Appendix Exhibit 7 – B (Continued)
Percentage Gain (Loss) for CARE, BASE, and BASE STEEP versus Actual, 2010— All 200 New York State Hospitals
Operating Cert. No.
Hospital Name
Total Actual
Allocation
(CARE minus
Actual) as % of
Actual
(BASE minus
Actual) as % of
Actual
(BASE STEEP
minus Actual) as
% of Actual
1564701 Moses-Ludington Hospital $438,413 -72.1% -90.1% -98.3%1623001 Adirondack Medical Center $1,804,808 -35.8% -40.7% -55.9%1624000 Alice Hyde Memorial Hospital $1,153,914 46.1% -14.0% -33.4%1701000 Nathan Littauer Hospital $2,034,085 24.2% -29.1% -35.1%1801000 United Memorial Medical Center $880,922 34.0% -13.2% -59.3%2129700 Little Falls Hospital $844,518 -90.8% -96.9% -99.8%2201000 Samaritan Medical Center $2,614,340 -22.5% -48.2% -80.8%2221700 River Hospital $514,421 -57.9% -58.9% -63.1%2238001 Carthage Area Hospital Inc $618,629 23.3% -27.1% -52.0%2424000 Lewis County General Hospital $885,659 -21.9% -53.9% -71.4%2527000 Nicholas H Noyes Meml. H. $844,567 -45.1% -62.0% -90.6%2601001 Oneida Healthcare Center $1,017,657 -14.8% -43.5% -72.5%2625000 Community Memorial Hospital $752,834 58.2% -11.1% -43.0%2701001 Highland Hospital of Rochester $1,731,973 214.6% 133.6% 45.5%2701003 Rochester General Hospital $8,059,197 47.5% 25.2% -18.0%2701005 Strong Memorial Hospital $7,673,718 -14.2% 16.7% -61.2%2701006 Monroe Community Hospital $0 2728001 Lakeside Memorial Hospital $359,933 126.3% 28.4% -18.9%2754001 Park Ridge Hospital $3,588,274 7.7% -16.6% -74.9%2801000 Amsterdam Memorial Hospital $206,567 -69.3% -100.0% -100.0%2801001 St Mary’s H. at Amsterdam $1,195,848 88.7% 31.7% -14.4%2901000 Glen Cove – North Shore $3,212,726 -18.6% -5.3% -34.9%2902000 Long Beach Medical Center $1,558,320 20.7% 26.7% 32.2%2908000 Winthrop University Hospital $4,941,591 22.5% 23.9% -54.0%2909000 Mercy Medical Center $2,797,050 -6.8% 0.2% -49.5%2910000 Franklin H. Medical Center $2,944,310 -32.5% -21.5% -58.2%2950001 South Nassau Communities H. $3,760,612 30.9% 21.5% -38.5%2950002 Nassau University M C $7,424,335 136.8% 137.6% 250.5%2951001 North Shore University H. $16,652,310 -37.8% -7.7% -58.2%2952005 Plainview – North Shore $976,003 34.2% 12.0% -75.1%2952006 New Island Hospital $1,363,814 35.4% 86.0% 59.3%2953000 St Francis Hospital of Roslyn $1,057,133 -50.8% 34.5% -82.3%3101001 Lockport Memorial Hospital $417,909 52.4% -65.4% -94.9%3102000 Niagara Falls Meml M C $1,238,660 17.8% -17.2% -58.6%3121001 Mt. St. Mary’s H. of Nia.Falls $635,869 132.1% 101.4% 29.3%3154000 Inter-Comm. Mem. H. Newfane $578,192 -8.9% -79.2% -95.1%3201002 Rome H. and Murphy Meml. $955,479 41.8% 5.7% -39.9%3202002 St Elizabeth Medical Center $1,852,118 54.1% 57.4% -14.2%3202003 St Luke’s / Faxton Memorial H. $2,472,655 221.8% 130.3% 90.8%

136
Appendix Exhibit 7 – B (Continued)
Percentage Gain (Loss) for CARE, BASE, and BASE STEEP versus Actual, 2010— All 200 New York State Hospitals
Operating Cert. No.
Hospital Name
Total Actual
Allocation
(CARE minus
Actual) as % of
Actual
(BASE minus
Actual) as % of
Actual
(BASE STEEP
minus Actual) as
% of Actual
3301000 Comm.-Genl. H. Gr. Syracuse $1,166,388 49.3% 21.3% -49.6%3301003 St Josephs H. Health Center $4,607,994 7.6% -5.3% -64.2%3301007 SUNY Hlth Sci Ctr. at Syracuse $3,889,107 12.5% 50.9% -42.1%3301008 Crouse Hospital $3,639,982 22.5% 14.5% -45.4%3402000 Geneva General Hospital $1,387,966 19.2% -33.9% -69.0%3421000 Clifton Springs H. + Clinic $433,273 -21.0% -21.8% -74.0%3429000 F F Thompson Hospital $804,348 55.8% 8.6% -52.2%3522000 St. Luke's - Cornwall H $3,519,072 19.2% -3.3% -27.5%3523000 Orange Regional M.C. $1,953,147 242.7% 191.1% 116.0%3529000 St Anthony Community Hospital $389,372 124.5% 81.8% -9.2%3535001 Bon Secours Community H. $3,536,049 -40.0% -52.7% -60.4%3622000 Medina Memorial Hospital $493,136 11.3% -39.1% -73.6%3701000 Albert Lindley Lee Meml H. 3702000 Oswego Hospital $1,632,439 18.7% -43.3% -70.4%3801000 Aurelia Osborn Fox Meml. H. $1,582,895 -5.8% -41.1% -70.2%3824000 Mary Imogene Bassett Hospital $3,476,216 41.7% 12.0% -36.0%3950000 Putnam Community Hospital $2,054,930 10.6% 4.6% -39.6%4102002 Samaritan Hospital of Troy $2,057,903 8.3% -20.8% -55.5%4102003 Seton Health System $2,128,434 -9.2% -47.5% -83.3%4322000 Helen Hayes Hospital $1,467,256 -100.0% -100.0% -100.0%4324000 Nyack Hospital $2,439,854 -2.6% 2.8% -46.4%4329000 Good Samaritan H. / West Islip $4,416,633 -40.2% -46.4% -85.3%4353000 Summit Park H./Rockland Co. $3,735,844 -100.0% -100.0% -100.0%4401000 Claxton-Hepburn Medical Center $819,858 52.3% -6.7% -65.0%4402000 Massena Memorial Hospital $1,135,071 59.9% -15.9% -39.6%4423000 Edward John Noble / Gouverneur $552,394 -13.8% -58.1% -71.3%4429000 Canton-Potsdam Hospital $1,263,497 -99.9% -100.0% -100.0%4458700 Clifton-Fine Hospital $193,184 -60.7% -58.4% -81.8%4501000 Saratoga Hospital $2,001,529 37.4% 5.9% -38.4%4601001 Ellis Hospital $3,928,892 27.5% -0.4% -48.7%4601004 Sunnyview H. + Rehab Ctr $519,215 -100.0% -100.0% -100.0%4720001 Cobleskill Reg.-Bassett/Schoh $912,505 -60.9% -70.0% -85.4%4823700 Schuyler Hospital $746,823 -62.5% -71.6% -90.3%5001000 Corning Hospital $2,157,942 -48.8% -67.8% -87.2%5002001 St James Mercy Hospital $1,331,487 19.9% -36.2% -61.0%5022000 Ira Davenport Memorial H. $1,245,931 -20.5% -49.4% -15.3%5123000 Brookhaven Memorial H. $7,368,646 -9.0% -13.2% -24.3%5126000 Southampton Hospital $1,370,154 100.3% 70.7% 79.1%5127000 Eastern Long Island Hospital $860,545 -16.5% 32.1% 40.6%

137
Appendix Exhibit 7 – B (Continued)
Percentage Gain (Loss) for CARE, BASE, and BASE STEEP versus Actual, 2010— All 200 New York State Hospitals
Operating Cert. No.
Hospital Name
Total Actual
Allocation
(CARE minus
Actual) as % of
Actual
(BASE minus
Actual) as % of
Actual
(BASE STEEP
minus Actual) as
% of Actual
5149000 John T Mather Memorial H. $2,051,361 -27.2% -5.3% -66.0%5149001 St Charles Hospital $1,602,089 -23.7% -32.3% -84.3%5151001 University H. at Stony Brook $6,334,467 68.8% 129.5% 51.8%5153000 Huntington Hospital $3,767,766 -38.8% -51.5% -86.9%5154000 Southside Hospital $7,912,849 -34.5% -42.7% -60.3%5154001 Good Samaritan H. / Suffern $8,527,566 -66.2% -61.8% -89.5%5155000 Peconic Bay M.C. / Ctl. Suffolk $1,865,577 32.8% 9.8% -15.7%5157003 St Catherine of Siena $1,150,810 -55.0% -50.5% -94.9%5263000 Catskill Reg. M C - G Hermann $9,193,498 -61.3% -72.8% -67.4%5263700 Catskill Regional Medical Center $546,619 -84.4% -88.2% -94.4%5401001 Cayuga M C at Ithaca $1,840,419 -7.0% -40.9% -76.2%5501000 Benedictine Hospital $2,173,392 -35.6% -49.5% -76.5%5501001 Kingston H. $2,384,860 -25.0% -43.6% -67.5%5526700 Ellenville Regional Hospital $1,766,415 -82.4% -92.5% -96.7%5601000 Glens Falls Hospital $4,007,540 41.6% -6.9% -43.8%5820000 Wayne Health Care $2,518,376 -41.2% -67.7% -74.8%5901000 Hudson Valley Hospital $1,726,687 5.7% -6.2% -45.5%5902001 White Plains H. Med Ctr $2,128,645 79.9% 85.6% 3.4%5902002 Burke Rehabilitation Center $172,670 -98.7% -83.0% -99.7%5903000 Mount Vernon Hospital $10,480,597 -54.3% -52.1% -8.3%5904000 Sound Shore M C Westchester $10,764,435 -14.9% -33.0% 4.6%5907001 St Johns Riverside Hospital $3,958,386 36.2% 28.1% 29.6%5907002 St Josephs Hospital Yonkers $8,606,253 -25.4% -27.1% 47.0%5920000 Northern Westchester Hospital $1,333,518 -19.8% -32.5% -86.7%5922000 Lawrence Hospital $1,392,195 83.7% 59.0% -9.0%5925000 Community H. at Dobbs Ferry $259,481 25.3% -100.0% -100.0%5932000 Phelps Meml. H. Association $1,539,863 39.6% 2.0% -63.2%5957000 Blythedale Childrens Hospital $200,697 -9.9% -21.1% -90.8%5957001 Westchester Medical Center $8,154,949 -35.8% 18.4% -50.7%6027000 Wyoming County Community H. $688,734 19.8% -32.2% -62.3%6120700 Soldiers and Sailors Meml. H. $918,559 -95.1% -95.4% -99.6%7000001 Bronx-Lebanon H. Ctr. $44,658,196 -70.0% -67.6% -69.6%7000002 Jacobi Medical Center $8,791,419 162.5% 163.1% 225.5%7000006 Montefiore H. + M.C. $23,289,016 -33.2% -23.4% -73.9%7000008 Lincoln Medical + Mental Hlth Ctr $9,618,489 157.7% 155.9% 346.5%7000011 Calvary Hospital $686,321 -100.0% -100.0% -100.0%7000014 St Barnabas Hospital $22,559,706 -37.6% -39.0% -11.9%7000024 North Central Bronx Hospital $4,841,757 132.9% 99.0% 216.6%7000025 NY Westchester Square M C $1,028,580 72.7% 46.2% -14.4%
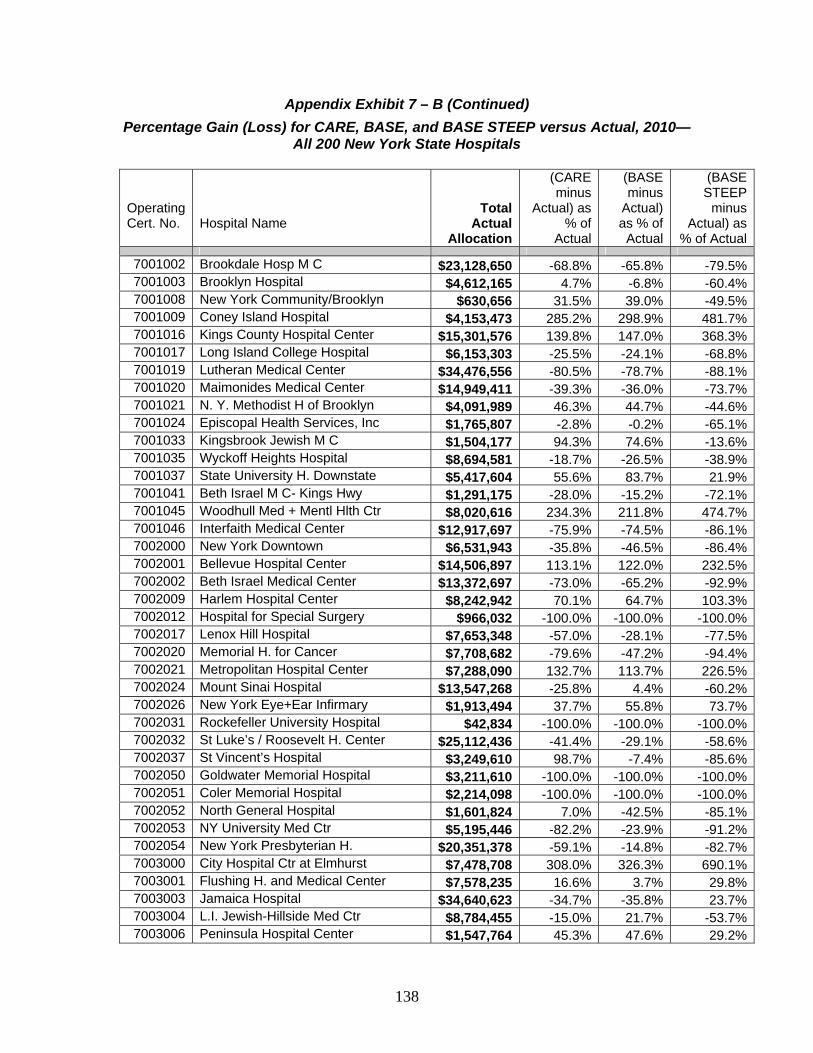
138
Appendix Exhibit 7 – B (Continued)
Percentage Gain (Loss) for CARE, BASE, and BASE STEEP versus Actual, 2010— All 200 New York State Hospitals
Operating Cert. No.
Hospital Name
Total Actual
Allocation
(CARE minus
Actual) as % of
Actual
(BASE minus
Actual) as % of
Actual
(BASE STEEP
minus Actual) as
% of Actual
7001002 Brookdale Hosp M C $23,128,650 -68.8% -65.8% -79.5%7001003 Brooklyn Hospital $4,612,165 4.7% -6.8% -60.4%7001008 New York Community/Brooklyn $630,656 31.5% 39.0% -49.5%7001009 Coney Island Hospital $4,153,473 285.2% 298.9% 481.7%7001016 Kings County Hospital Center $15,301,576 139.8% 147.0% 368.3%7001017 Long Island College Hospital $6,153,303 -25.5% -24.1% -68.8%7001019 Lutheran Medical Center $34,476,556 -80.5% -78.7% -88.1%7001020 Maimonides Medical Center $14,949,411 -39.3% -36.0% -73.7%7001021 N. Y. Methodist H of Brooklyn $4,091,989 46.3% 44.7% -44.6%7001024 Episcopal Health Services, Inc $1,765,807 -2.8% -0.2% -65.1%7001033 Kingsbrook Jewish M C $1,504,177 94.3% 74.6% -13.6%7001035 Wyckoff Heights Hospital $8,694,581 -18.7% -26.5% -38.9%7001037 State University H. Downstate $5,417,604 55.6% 83.7% 21.9%7001041 Beth Israel M C- Kings Hwy $1,291,175 -28.0% -15.2% -72.1%7001045 Woodhull Med + Mentl Hlth Ctr $8,020,616 234.3% 211.8% 474.7%7001046 Interfaith Medical Center $12,917,697 -75.9% -74.5% -86.1%7002000 New York Downtown $6,531,943 -35.8% -46.5% -86.4%7002001 Bellevue Hospital Center $14,506,897 113.1% 122.0% 232.5%7002002 Beth Israel Medical Center $13,372,697 -73.0% -65.2% -92.9%7002009 Harlem Hospital Center $8,242,942 70.1% 64.7% 103.3%7002012 Hospital for Special Surgery $966,032 -100.0% -100.0% -100.0%7002017 Lenox Hill Hospital $7,653,348 -57.0% -28.1% -77.5%7002020 Memorial H. for Cancer $7,708,682 -79.6% -47.2% -94.4%7002021 Metropolitan Hospital Center $7,288,090 132.7% 113.7% 226.5%7002024 Mount Sinai Hospital $13,547,268 -25.8% 4.4% -60.2%7002026 New York Eye+Ear Infirmary $1,913,494 37.7% 55.8% 73.7%7002031 Rockefeller University Hospital $42,834 -100.0% -100.0% -100.0%7002032 St Luke’s / Roosevelt H. Center $25,112,436 -41.4% -29.1% -58.6%7002037 St Vincent’s Hospital $3,249,610 98.7% -7.4% -85.6%7002050 Goldwater Memorial Hospital $3,211,610 -100.0% -100.0% -100.0%7002051 Coler Memorial Hospital $2,214,098 -100.0% -100.0% -100.0%7002052 North General Hospital $1,601,824 7.0% -42.5% -85.1%7002053 NY University Med Ctr $5,195,446 -82.2% -23.9% -91.2%7002054 New York Presbyterian H. $20,351,378 -59.1% -14.8% -82.7%7003000 City Hospital Ctr at Elmhurst $7,478,708 308.0% 326.3% 690.1%7003001 Flushing H. and Medical Center $7,578,235 16.6% 3.7% 29.8%7003003 Jamaica Hospital $34,640,623 -34.7% -35.8% 23.7%7003004 L.I. Jewish-Hillside Med Ctr $8,784,455 -15.0% 21.7% -53.7%7003006 Peninsula Hospital Center $1,547,764 45.3% 47.6% 29.2%

139
Appendix Exhibit 7 – B (Continued)
Percentage Gain (Loss) for CARE, BASE, and BASE STEEP versus Actual, 2010— All 200 New York State Hospitals
Operating Cert. No.
Hospital Name
Total Actual
Allocation
(CARE minus
Actual) as % of
Actual
(BASE minus
Actual) as % of
Actual
(BASE STEEP
minus Actual) as
% of Actual
7003007 Queens Hospital Center $6,535,095 258.0% 249.3% 617.5%7003010 New York M C of Queens $7,628,852 -9.4% -9.1% -62.0%7003013 Forest Hills - North Shore $1,848,759 30.0% 14.2% -49.5%7003015 Mount Sinai H. of Queens $4,909,036 -17.7% -3.2% 40.8%7004003 Staten Island University H. $8,230,807 35.0% 44.9% -5.2%7004010 Richmond University Medical $7,484,123 -27.7% -33.9% -61.5%

140
Notes 1 The 21 major publics provide fully 25 percent of all uncompensated care discharges, 31 percent of uncompensated care ER visits, 56 percent of uncompensated regular clinic visits, and 44 percent of uncompensated ambulatory surgery procedures. They provide 37 percent of the composite overall statewide volume all four uncompensated care services. This composite measure relies on the CARE method. 2 Patricia Boozang, Melinda Dutton, Alice Lam, and Deborah Bachrach, Implementing Federal Health Care Reform: A Roadmap for New York State, New York State Health Care Foundation, August 2010. 3 To conserve space, detailed analyses involving the three sliding scales of NPA and its two moderately steeper cousins are not reported here. Those analyses are available on request. 4 See New York State Department of Health, Office of Health Insurance Programs, Division of Health Care Financing, “Medicaid Rate Calculation—Medicaid Fee-for-service Acute Rate Exhibit,” Series # 0527, Effective Dates: 1 October to 31 December 2010. A copy is accessible in http://www.hfmametrony.org/Portals/0/B1-Rate-Sheet_10%201%202010_Webinar_Rev9%2017%202010.pdf. 5 Thanks to Marlene Zurack and Linda DeHart for suggesting this summary. 6 New York State Department of Health, “Hospital Indigent Care Pool Technical Advisory Committee Summary,” 13 June 2007, pp. 12-13. 7 New York State Department of Health, “Hospital Indigent Care Pool Technical Advisory Committee Summary,” 13 June 2007, pp. 12-13. 8 Commissioner Richard F. Daines, New York State Department of Health, A Report on the Hospital Indigent Care Pool, as Required by Chapter 58 of the Laws of 2007,” Albany: The Department, January 2008, pp. 3-5. 9 Daines, Report on Hospital Indigent Care Pool, 5. 10 Daines, Report on Hospital Indigent Care Pool, p. 4. 11 Daines, Report on Hospital Indigent Care Pool, p. 5. 12 Carol Pryor, Mark Rukavina, Alex Hoffman, and Aaron Lee, Best Kept Secrets: Are Non-profit Hospitals Information Patients about Charity Care Programs, Boston: Community Catalyst, May 2010, http://www.accessproject.org/adobe/Best_Kept_Secrets.pdf. 13 Daines, Report on Hospital Indigent Care Pool, pp. 5-6. 14 American Hospital Association, Hospital Statistics, 2001, 2005, and 2011 editions, Chicago: The Association, Tables 3 and 6.

141
15 See Alan Sager and Deborah Socolar, Closing Hospitals in New York State Won't Save Money but Will Harm Access to Health Care, Boston: Health Reform Program, 20 November 2006, 53 pages, http://dcc2.bumc.bu.edu/hs/ushealthreform.htm. 16 Alan Sager and Deborah Socolar, Closing Hospitals in New York State Won't Save Money but Will Harm Access to Health Care, Boston: Health Reform Program, 20 November 2006, 53 pages, http://dcc2.bumc.bu.edu/hs/ushealthreform.htm. 17 Alan Sager, “Urban Hospital Closings—Causes, Consequences, and Responses,” National Health Law Program annual meeting, Washington, D.C., 6 December 2004; “Changes in Hospital Configuration in Urban America between 1980 and 1995,” Summary of Findings Relevant to Policy, Robert Wood Johnson Foundation Grant No. 028054, 18 February 1999; "Why Urban Voluntary Hospitals Close," Health Service Research, Vol. 18, No. 3 (Fall 1983), pp. 45l-48l; "The Closure of Hospitals that Serve the Poor: Implications for Health Planning," testimony before the Subcommittee on Health and Environment, Committee on Energy and Commerce, House of Representatives, 30 April 1982, in Extension of Health Planning Program, Hearings Before the Subcommittee on Health and the Environment, Washington: USGPO, pp. 520-529. 18 American Hospital Association, Hospital Statistics, 2011 Edition, Chicago: The Association, 2010, Tables 3 and 6. 19 Council of Teaching Hospitals analysis of American Hospital Association data for hospital fiscal year 2004. 20 American Hospital Association, Hospital Statistics, 2011 Edition, Chicago: The Association, 2010, Tables 3 and 6. 21 The sliding scale is presented and employed in the calculation of sum to be distributed among hospitals according to the 90% Model now in effect—the model used to distribute 90 percent of the main pool of uncompensated care dollars among hospitals other than major public hospitals. 22 This exhibit is copied from New York State Department of Health, Hospital Indigent Care Pool Technical Advisory Committee Summary, 13 June 2007, p. 12. 23 A full description of the three phases of data acquisition now follows. a. Compiling data in-hand from various photocopy, scanned, and clean .pdf files, and converting these into Excel spreadsheets to permit analysis. Software to perform this (without keying in all of the data afresh) was identified and obtained. Although using this software still required a considerable amount of time to yield clean Excel files, this was much quicker and much more accurate than re-keying the data. b. We learned from various sources that DoH spreadsheets with complete data were available, and undertook to obtain them. This we did gradually and with some success. c. We then inquired whether DoH had and could share complete spreadsheets including the distribution methods, how values were actually calculated (spreadsheet formulas), and also the underlying data on volumes of inpatient and outpatient care and the Medicaid rates and other factors determining the actual distributions of uncompensated care pool dollars.

142
We learned that DoH had those spreadsheets. DOH staff indicated these spreadsheets would be available and advised us about the proper wording of the FOIL request we submitted. DOH has generously provided these spreadsheets, which have allowed us to build on the solid base prepared by DoH and modify elements of existing formulas to test the fairness of a number of different methods of improving the allocation of uncompensated care pool dollars. We took a similar approach to building a revised version of the price used to calculate the 10 percent formula. The current price, average Medicaid DRG payment, includes a number of factors that we consider inappropriate to use to pay for acute inpatient care. We have been able to build a modified price, step-by-step. d. A fourth issue concerned categorization of hospitals. Hospitals are often grouped differently to achieve different legitimate purposes, or are grouped differently at different times, or are named differently at different times. Therefore, a caution: The analyses reported here sometimes combine data from different New York State Department of Health sources for multiple years. Combining the same variables—such as uncompensated care dollars distributed to each hospital or volumes of total or uncompensated care discharges provided by each hospital—required some matching of hospitals without unique and consistent identifiers. We have done our best to match carefully but some inaccuracies—generally small, we believe—may have crept in to the work. 24 Hospitals are classified as non-teaching or teaching hospitals by the New York State Department of Health; we further divided the teaching hospitals into minor teaching and major (COTH) teaching in light of their membership in the Council of Teaching Hospitals of the American Association of Medical Colleges. For the list of COTH hospitals by state, please refer to http://services.aamc.org/memberlistings/index.cfm?fuseaction=home.search&search_type=TH&state_criteria=ALL. 25 2008 population estimates by New York State county were taken from U.S. Census Bureau, Population Division, “Annual Estimates of the Resident Population for Counties of New York: April 1, 2000 to July 1, 2008 (CO-EST2008-01-36),” Release Date: March 19, 2009, accessed via http://quickfacts.census.gov/qfd/states/36000lk.html. We grouped counties by NYPHRM region. 2008 discharges by county are provided by the NYS DOH SPARCS system; again, we grouped counties by NYPHRM region.
26 Data for 2005 through 2009 were presented in one spreadsheet prepared by the New York State Department of Health and the data for 2010 were presented in a different spreadsheet. Hospitals were categorized in slightly different ways in the two spreadsheets. This was appropriate, since each set of data was prepared at a different time and aimed to reflect hospitals open in various places at a particular time. While we have tried carefully to align hospitals, it is possible that data on hospitals from the two sources are not coordinated accurately in a few instances. 27 New York State Department of Health, Hospital Indigent Care Pool Technical Advisory Committee Summary (PowerPoint version), Albany: The Department, 13 June 2007, p. 6.

143
28 Commissioner Richard F. Daines, New York State Department of Health, A Report on the Hospital Indigent Care Pool, as Required by Chapter 58 of the Laws of 2007,” Albany: The Department, January 2008. 29 See New York State Department of Health, Office of Health Insurance Programs, Division of Health Care Financing, “Medicaid Rate Calculation—Medicaid Fee-for-service Acute Rate Exhibit,” Series # 0527, Effective Dates: 1 October to 31 December 2010. A copy is accessible in http://www.hfmametrony.org/Portals/0/B1-Rate-Sheet_10%201%202010_Webinar_Rev9%2017%202010.pdf. 30 Uncompensated care costs under 0.5 percent of total costs are not recognized by the state even though the state’s tables imply that they are recognized at 60 percent of costs. 31 This exhibit is copied from New York State Department of Health, Hospital Indigent Care Pool Technical Advisory Committee Summary, 13 June 2007, p. 12. 32 Commissioner Richard F. Daines, New York State Department of Health, A Report on the Hospital Indigent Care Pool, as Required by Chapter 58 of the Laws of 2007,” Albany: The Department, January 2008. 33 See, for example, Emily Friedman, “Medicaid, Reform, and the Future of the Safety Net,” Hospitals and Health Networks Daily, 27 June 2011, http://www.hhnmag.com/hhnmag/HHNDaily/HHNDailyDisplay.dhtml?id=7870007775.