patterns, trends and determinants of medical opioid
TRANSCRIPT

RESEARCH Open Access
Patterns, trends and determinants ofmedical opioid utilization in Canada 2005–2020: characterizing an era of intensive riseand fallWayne Jones1, Ridhwana Kaoser1 and Benedikt Fischer1,2,3,4*
Abstract
Background: Into the 21st century, the conflation of high rates of chronic pain, systemic gaps in treatmentavailability and access, and the arrival of potent new opioid medications (e.g., slow-release oxycodone) facilitatedstrong increases in medical opioid dispensing in Canada. These persisted until post-2010 alongside rising opioid-related adverse (e.g., morbidity/mortality) outcomes. We examine patterns, trends and determinants of opioiddispensing in Canada, and specifically its 10 provinces, for the years 2005–2020.
Methods: Raw data on prescription opioid dispensing were obtained from a large national community-basedpharmacy database (IQVIA/Compuscript), converted into Defined-Daily-Doses/1,000 population/day for ‘strong’ and‘weak’ opioid categories per standard methods. Dispensing by opioid category and formulations by province/yearwas assessed descriptively; regression analysis was applied to examine possible segmentation of over-time strongopioid dispensing.
Results: All provinces reported starkly increasing strong opioid dispensing peaking 2011–2016, and subsequentmarked declines. About half reported lower strong opioid dispensing in 2020 compared to 2005, with continuousinter-provincial differences of > 100 %; weak opioids also declined post-2011/12. Segmented regression suggestsbreakpoints for strong opioids in 2011/12 and 2015/16, coinciding with main interventions (e.g., selective opioiddelisting, new prescribing guidelines) towards more restrictive opioid utilization control.
Conclusions: We characterized an era of marked rise and fall, while featuring stark inter-provincial heterogeneity inopioid dispensing in Canada. While little evidence for improvements in pain care outcomes exists, the starklyinverting opioid utilization have been associated with extensive population-level harms (e.g., misuse, morbidity,mortality) over-time. This national case study raises fundamental questions for opioid-related health policy andpractice.
Keywords: Opioids, Pharmacoepidemiology, Canada, Pain, Utilization, Policy
© The Author(s). 2021 Open Access This article is licensed under a Creative Commons Attribution 4.0 International License,which permits use, sharing, adaptation, distribution and reproduction in any medium or format, as long as you giveappropriate credit to the original author(s) and the source, provide a link to the Creative Commons licence, and indicate ifchanges were made. The images or other third party material in this article are included in the article's Creative Commonslicence, unless indicated otherwise in a credit line to the material. If material is not included in the article's Creative Commonslicence and your intended use is not permitted by statutory regulation or exceeds the permitted use, you will need to obtainpermission directly from the copyright holder. To view a copy of this licence, visit http://creativecommons.org/licenses/by/4.0/.The Creative Commons Public Domain Dedication waiver (http://creativecommons.org/publicdomain/zero/1.0/) applies to thedata made available in this article, unless otherwise stated in a credit line to the data.
* Correspondence: [email protected] for Applied Research in Mental Health and Addiction (CARMHA),Faculty of Health Sciences, Simon Fraser University, Suite 2400, 515 W.Hastings Street, British Columbia, Vancouver, Canada2Faculty of Medical and Health Sciences, University of Auckland, 85 ParkRoad, Auckland 1023 Grafton, New ZealandFull list of author information is available at the end of the article
Jones et al. Substance Abuse Treatment, Prevention, and Policy (2021) 16:65 https://doi.org/10.1186/s13011-021-00396-5

IntroductionThe transition into the 21st century marked a turningpoint for chronic pain and related opioid pharmacother-apy in North America, and Canada specifically. There,20–29 % of the gcomes in the populationeneral popula-tion were estimated to experience chronic pain in theearly 2000s, however systemic gaps existed in access toand/or effectiveness of available care [1, 2]. Morebroadly, a vocal socio-medical movement had begun topropagate chronic pain as a neglected ‘fifth vital sign’,advocating for systematic expansions of improved treat-ment and care [3, 4], including more generous utilizationof opioid pharmacotherapy options then generally con-sidered “safe and efficacious” [1]. Among other barriers,pharmacotherapeutic approaches to chronic pain carewere viewed as hindered by many physicians’ lack ofknowledge and/or hesitation to prescribe available opi-oid medications for chronic pain [5, 6].A number of concrete developments facilitated a pro-
found expansion of opioid pharmacotherapy for chronicpain in the early 2000s in Canada. Sequential iterationsof national pain care guidelines (updated in 2002) rec-ommended a wider-scale and more generous (e.g.,higher doses/long-term) therapeutic utilization of opioidanalgesic medications for chronic pain [7]. In addition,new and potent opioid formulations – most notably in-cluding ‘slow-release’ oxycodone (e.g., Oxycontin) – hadbecome available and became widely utilized, alongsideother potent semi-/synthetic opioid medications (e.g.,fentanyl, hydromorphone) that were increasingly andmore generously prescribed in both specialist and gen-eral/community practice settings [8–10]. Particularly inthe case of Oxycontin, their rising utilization was dis-tinctly boosted by pharmaceutical companies’ targetedmarketing strategies involving ‘peer educators’ (i.e., phys-ician representatives) promoting expanded prescribing[11, 12].In these contexts, the population rate of controlled
total opioid dispensing in Canada - as reported by theInternational Narcotics Control Board (INCB) - morethan tripled within just one decade, from 8,713 Stan-dardized Defined Daily Doses [S-DDD] in 2000–2002 to29,743 S-DDD in 2010-12 [13]. During this period,Canada’s opioid dispensing rate climbed more steeplythan that of the United States (US), the nation featuringthe world’s highest opioid consumption rate; on thisbasis, Canada rose to record the world’s second-highestopioid consumption rate (after the US) [14]. By 2010,more than one-in-five (20 %) of Canadian adults re-ported annual use of pain-related opioid medications[15].While the benefits for therapeutic pain care quality
and outcomes from these extensive increases haveremained uncertain, they were associated with rising
adverse opioid-related (e.g., mortality and morbidity)outcomes in the population, including increases in non-medical opioid use and diversion, opioid-related hospi-talizations, treatment admissions and poisoning fatalities[15–17]. For example, in Ontario, 6 % of adults and 15 %of high-school students reported non-medical opioid useby 2010, opioid-related treatment admissions doubledand opioid-related fatalities rose from 366 (2003) to 571(2010), with approximately 40 % oxycodone-related [15,18, 19]. By 2010, it was evident that a sort of ‘opioid cri-sis’ involving extensive adverse health outcomes in thepopulation -- fuelled by the excessive availability and ad-verse consequences of prescription opioids -- wasunfolding in Canada [8, 20, 21].While government and other (e.g., medical/regulatory)
policy makers and stakeholders had undertaken little tohalt the growing opioid-related harms until then, a seriesof multi-level interventions aiming to restrict opioidavailability and harms were implemented post-2010 [22].Among them, slow-release oxycodone formulations weredelisted from most provincial formularies across Canadain 2012 [23, 24]. Several provinces introduced (e.g., On-tario in 2012) or ramped up their ‘prescription monitor-ing’ systems including opioids in their scope [25, 26]. Anational stakeholder coalition tabled a strategic actionplan of proposed measures [2013] to reduce opioid-related harms [27]. Select regulatory efforts aimed to in-crease the use of ‘safer’ (e.g., tamper-resistant/abuse-de-terrent) opioid formulations, and to limit high-doseprescribing [23, 28]. Meanwhile, emerging scientific evi-dence assumed an increasingly cautious and restrainedview on the effectiveness and safety of opioid pharmaco-therapy especially for chronic pain care [29, 30]. Corres-pondingly, new Canadian opioid prescribing guidelines(2017), similar to recent US (CDC) counterpartslaunched in 2016, presented a marked reversal from pre-vious guideline versions and provided direction for agenerally much more restrained and cautious (‘last re-sort’) approach to opioid pharmacotherapy utilizationand practice for pain care [31].Following these interventions, on overall decline in
medical opioid utilization began to unfold. Canada’stotal opioid utilization peaked at 34,444 S-DDD in2013-15, and substantively decreased to 19,629 S-DDD (-43 %) by 2017-19 [13]. While prescriptionopioid-related harms (e.g., poisoning fatalities)remained generally steady, expanding availability anduse of illicit/synthetic opioid (e.g., fentanyl) productsstarted to shift and accelerate patterns especially ofnon-medical opioid harms in the years since 2014/15across Canada [32–34]. In 2018, the federal govern-ment established of the Canadian Pain Task Force,with a mandate to assess the state of pain and relatedcare practices and systems in Canada [35].
Jones et al. Substance Abuse Treatment, Prevention, and Policy (2021) 16:65 Page 2 of 11

Within these wider contexts, and building on previousrelated examinations, the present study assesses overall(quantitative & qualitative) patterns, trends and determi-nants of medical opioid utilization in Canada and specif-ically its 10 provinces for the period 2005–2020.
MethodsThe primary data on prescription opioid dispensing inCanada for the period 2005–2020 were derived andcomputed based on information from the IQVIACanada Inc. (formerly QuintilesIMS/IMS Brogan) Com-puscript database. This database monitors prescription-based transactions for branded and generic medicationsvia a representative and stratified sample of about 6,500(representing about 60 % of the total) retail pharmaciesacross Canada [36, 37]. Monthly dispensing data is ag-gregated to provincial totals using a patented geospatialprojection methodology, with an estimated samplingerror of 5–10 %. The Compuscript data do not includenon-prescription (e.g., ‘over-the-counter’ codeine) prod-ucts, nor cover other (e.g., hospital-based) drug dispens-ing, yet comprise the far majority (estimated 80 %+) oftotal utilization. Similar dispensing data have been usedfor other population-level pharmacoepidemiologic ana-lyses [38, 39].Based on previously applied methods, raw prescription
opioid dispensing information was obtained by yearly to-tals for the 10 Canadian provinces (but not including thethree Canadian territories, which however only make up< 0.5 % of the Canadian total population) of both thenumbers of prescriptions and units dispensed, opioidmolecule (codeine, fentanyl, hydrocodone, hydromor-phone, meperidine, methadone, morphine, oxycodone,tramadol), and product name (494 unique names in-cluded), form and strength information. Data for the dif-ferent opioid products were matched to defined dailydose (DDD) estimates using the World Health Organiza-tion’s Anatomical Therapeutic Chemical classificationand DDD measurement methodology, defining DDDs asthe “… assumed average maintenance dose per day for adrug used for its main indication in adults” [40]. DDDare a standard metric commonly used for comparativedrug utilization analysis [41, 42]. Combined with yearlyprovincial population estimates (obtained from StatisticsCanada [43]) the total opioid dispensing data was con-verted to annual DDDs/per 1,000 population/per day(DDD/1,000/day) estimates for the 10 provinces andCanada total, and furthermore categorized into “strongopioids” (i.e., including fentanyl, hydrocodone, hydro-morphone, meperidine, morphine, and oxycodone) and“weak opioids” (i.e., codeine) generally following theWHO ‘analgesic ladder’ [44, 45]. Methadone, while de-fined as a strong opioid, was excluded from the analysessince it is primarily used for addiction (i.e., opioid
maintenance) treatment, and its dispensing practices areinconsistent and do not allow for comparable estimatesacross Canada [37].Database design and data manipulation was conducted
using the R software package, including data plotting forvisualization [46]. For descriptive analyses, first, we ex-amined the annual dispensing levels of “strong” (includ-ing main individual formulations) and “weak” (codeine)opioid products for Canada and the provinces, 2005–2020. Second, we computed the intra-provincial rangesof highest and lowest annual strong opioid dispensingvalues for the study period. Third, towards assessing sig-nificant over-time changes in strong opioid dispensingin Canada, we applied a segmented (or ‘broken stick’) re-gression analysis [47]. This regression-based methodpartitions the independent variable into intervals and fitscorresponding straight-lines to data interval-subsets(here the 16 annual datapoints of strong opioid dispens-ing), while identifying possible inter-segmental ‘break-points’ [48, 49]. Akaike information criterion (AIC)values were computed to assess the quality-of-fit foreach model. For these analyses, the R package ‘seg-mented’ was used.
ResultsStrong opioids (total) [see Fig. 1 for data visualization]In 2005, the lowest strong opioid dispensing rate was re-ported by Manitoba (MN;3.9 DDD/1,000/day), and thehighest by Ontario (ON;10.1 DDD/1,000/day), translat-ing into an inter-provincial range of difference of 159 %.Between 2005 and 2011, each of the provinces reported
substantive increases in their annual rates of strong opioiddispensing, with individual provinces’ respective opioiddispensing levels peaking sometime between 2011 and2016 as follows: British Columbia (BC), Alberta (AB), MN,ON (2011); Nova Scotia (NS), Prince Edward Island (PEI;2013); Saskatchewan (SK;2014); New Brunswick (NB),Newfoundland (NL;2015); and Quebec (QC;2016). Thehighest ‘peak’ value for opioid dispensing was reported byON (14.2 DDD/1,000/day), and the lowest ‘peak’ value byQC (6.6 DDD/1,000/day), indicating a total inter-provincial range of difference of 115 % for ‘peak’ levels.Following their respective ‘peak’ level years, each of
the provinces reported decreases in strong opioid dis-pensing, declining to - with the exception of two prov-inces (BC & PEI) – lowest post-peak level of strongopioid dispensing in 2020. ON reported the proportion-ally greatest decrease between its respective ‘peak’ levelyear in strong opioid dispensing (2011) and 2020(-54.9 %) whereas PEI (2016–2020) had the correspond-ingly smallest decrease (-17.8 %). In 2020, the lowest opi-oid dispensing rate was report by MN (4.6 DDD/1,000/day), and the highest rate by NB (9.0 DDD/1,000/day),translating into an inter-provincial range of difference of
Jones et al. Substance Abuse Treatment, Prevention, and Policy (2021) 16:65 Page 3 of 11

96 %. Four provinces reported same, or lower strong opi-oid dispensing levels in 2020 compared with 2005.For intra-provincial variation in annual strong opioid
dispensing, NB indicated the smallest range (49 %) andNL indicated the largest range (126 %) over the observa-tion period (2005–2020) (see Table 1).
Strong opioids (individual formulations) [see Fig. 2 fordata visualization]For main individual strong opioid formulations, vary-ing trends and patterns were observed by province.
For fentanyl, all provinces reported increases in dis-pensing until 2014/2015 which then inverted to vary-ing levels of decreases. In any given year, the inter-provincial levels of fentanyl dispensing varied by atleast 100 %; half the provinces reported lower fentanyldispensing rates in 2020 compared to 2005. Hydroco-done has been dispensed almost exclusively in ONand, at much lower levels, in QC; its utilization inON was stable until 2011, and then steeply dropped.Hydromorphone (similar to fentanyl) dispensing in-creased in all provinces to 2015/2016, and subse-quently inverted to decrease. While in any given year,hydromorphone dispensing levels inter-provinciallyvaried by at least 100 %, each province reportedhigher hydromorphone dispensing in 2020 as com-pared with 2005. While some provinces reported in-creases in morphine dispensing in the early years ofobservation, other reported mostly decreasing trends;half the provinces indicated lower morphine dispens-ing levels in 2020 compared with 2005. BC is a notedoutlier for both hydromorphone and morphine dis-pensing, in that it features marked recent increases indispensing for both recent opioid drugs; its morphineutilization in 2020 is the highest for the total studyperiod. For oxycodone, most provinces reported strongdispensing increases (most of them peaking in 2011)which subsequently inverted to substantive decreases.In each year, the inter-provincial dispensing range foroxycodone differed by at least 200 %, while the major-ity of provinces reported lower oxycodone dispensinglevels in 2020 compared with 2005.
Fig. 1 Annual ‘strong opioid’ utilization in DDD/1,000 population/day by province and Canada total, 2005–2020
Table 1 Intra-provincial ranges and percent differences in ‘strongopioid’ utilization, provinces and Canada total, 2005–2020
DDD/1000/Day: Years 2005–2020
Province Minimum Maximum Difference (%)
BC 5.1 10.1 98.3 %
AB 5.9 10.5 76.2 %
SK 5.5 11.5 108.8 %
MN 3.9 7.9 101.7 %
ON 6.4 14.2 123.2 %
QC 4.2 6.6 58.3 %
NB 7.6 11.3 49.2 %
NS 7.8 13.3 69.9 %
PEI 5.9 10.7 82.0 %
NL 5.4 12.2 126.1 %
CA 6.2 10.8 74.1 %
Abbreviations: BC British Columbia, AB Alberta, SK Saskatchewan, MNManitoba, ON Ontario, QC Quebec, NB New Brunswick, NS Nova Scotia, PEIPrince Edward Island, NL Newfoundland, CA Canada
Jones et al. Substance Abuse Treatment, Prevention, and Policy (2021) 16:65 Page 4 of 11
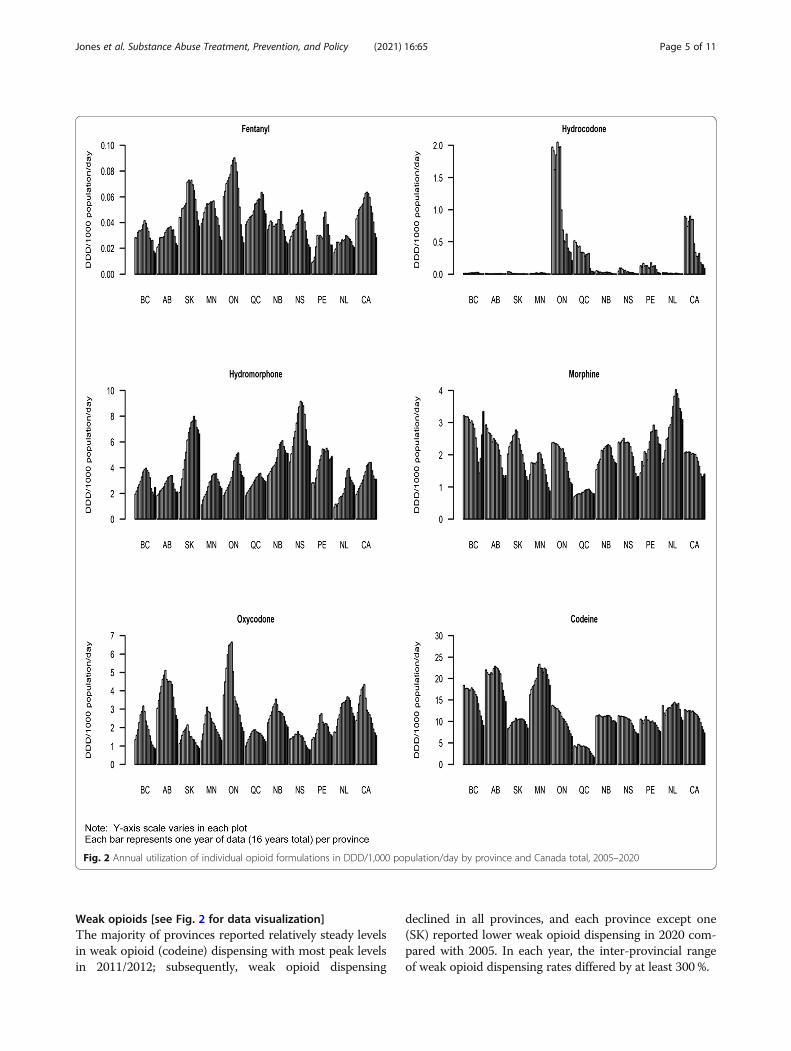
Weak opioids [see Fig. 2 for data visualization]The majority of provinces reported relatively steady levelsin weak opioid (codeine) dispensing with most peak levelsin 2011/2012; subsequently, weak opioid dispensing
declined in all provinces, and each province except one(SK) reported lower weak opioid dispensing in 2020 com-pared with 2005. In each year, the inter-provincial rangeof weak opioid dispensing rates differed by at least 300 %.
Fig. 2 Annual utilization of individual opioid formulations in DDD/1,000 population/day by province and Canada total, 2005–2020
Jones et al. Substance Abuse Treatment, Prevention, and Policy (2021) 16:65 Page 5 of 11

Multilinear (segmented regression) analysis [see Fig. 3 forresults visualization]Visual inspection of the over-time pattern for strongopioid dispensing (see above) for Canada total suggestsan overall non-linear inversion shape, yet it is unclearwhether this may involve additional segments. On thisbasis, the segmented regression analysis confirmed astrictly linear model to be not statistically significant (ad-justed R-square: -0.05). A four-segment model (usingpossible breakpoints at 2008, 2013, and 2017) failed toconverge. A three-segment model (breakpoints: 2010and 2016) was statistically significant (adjusted R-square:0.96), based on an increasing linear segment runningfrom 2005 to 2010/11, a decreasing linear segment from2010/11 to 2015/16, and then a steeper decreasing linearsegment from 2015/16 to 2020. A two-segment model(breakpoint: 2012) was also statistically significant (R-square: 0.94), based on an increasing linear segmentfrom 2005 to 2011, followed by a decreasing linear seg-ment from 2011 to 2020. Of the models examined, thethree-segment model fit the observed data best with anAIC value of 12.4, followed by the two-segment model(AIC: 17.0).
DiscussionWe characterized quantitative and qualitative patternsand trends in medical opioid dispensing in Canada, withfocus on its ten provinces, for the period 2005–2020.These analyses – extending previous Canada-based ex-aminations - are worthwhile towards assessing both theevolution and drivers of medical opioid utilization inCanada as appear to represent and complete a distinct‘era’, yet also more broadly given Canada’s status as aglobal high-consumer nation [13, 50, 51].The first, main observation is that over the study
period, Canada underwent a marked bi-partial evolution– concretely a stark increase-to-decrease reversal pattern
- of strong opioid utilization. In aggregate, its strong opi-oid utilization initially increased by almost 50 % (2005–2011/12), and subsequently decreased by a similar pro-portion (2011/12–2020) to an overall lower level com-pared to 2005. In other words, the overall Canada-widepopulation exposure for opioids first increased, and thendecreased by about half its total volume (in DDD),within just a few years. Such a pronounced rise-and-falldevelopment in the system-wide utilization of controlledpsychotropic medications, or any medical interventiongeared to a chronic disease (here mainly: pain) withoverall stable prevalence in the population ought to beconsidered highly unusual, if not exceptional. These de-velopments naturally seek for analytic understandingand contextualization of both the essential drivers be-hind this starkly bi-directional pattern as well as theirimpacts.Our analyses begin at a point-in-time (2005) following
both increasing national and international attention to‘chronic pain’ as a prevalent, but inadequately treatedhealth condition [1, 52–54]. These contexts, jointly withthe emergence of new medical practice guidelines advo-cating for more liberal and generous opioid pharmaco-therapy use especially in the context of pain care, andthe rapidly expanding availability of new and potent opi-oid medications (e.g., slow-release oxycodone) evidentlyfacilitated a substantive increase in medical opioid pre-scribing and expanding population exposure in Canadawithin just a few years [7, 8, 51]. Yet, by the overall‘peak’ in opioid utilization (2011/2012) it became bothincreasingly evident that the safety and efficacy of strongopioids widely used for pain-based pharmacotherapycare had been mis-assessed, and that the extensive in-creases in strong opioid prescribing were associated withextensive collateral harms in the population [8, 21, 55].Concretely, mounting evidence indicated substantive in-creases in opioid-related non-medical use, morbidity(e.g., hospitalizations) and mortality (e.g., poisoningdeaths) in Canada; for several of the main adverse out-come indicators, strong correlations with population-levels of prescription opioid dispensing were statisticallyconfirmed, meaning that these harm outcomes increasedin direct correlation with the changing volumes of opi-oids available in the population [15, 56, 57].As suggested by the results of our ‘segmented regres-
sion’ analyses, the timepoint of the pan-Canadian delist-ing of slow-release oxycodone (‘Oxycontin’) fromprovincial formularies (2012) as an initial, system-wideintervention to reduce strong opioid availability markedan initial major inversion point towards decreasingstrong opioid dispensing [23, 24]. This intervention re-sulted in some lateral shifts in specific types of strongopioids prescribed (e.g., from oxycodone to hydromor-phone, fentanyl) yet appears to have triggered an overall
Fig. 3 Two- and three-segment models of ‘strong opioid’ utilizationin Canada, 2005–2020
Jones et al. Substance Abuse Treatment, Prevention, and Policy (2021) 16:65 Page 6 of 11

system-wide change and reduction effect in opioidutilization. This particular intervention was further com-plemented - depending on provincial setting or opioiddrug type - by a range of additional (many provincially-based) restricting measures especially for high-risk opi-oid utilization in subsequent years (e.g., prescriptionmonitoring program expansion, limitations on high-doseformulations) as selectively assessed for their deceler-ation impact, creating an aggregately more restrictiveopioid prescribing environment in Canada [22, 26, 50,58–60].The second ‘breakpoint’ identified, around 2016/17,
may be identified to coincide with the lead-up to andthe introduction of new Canadian guidelines for chronicpain treatment tabled in 2017; these new guidelinesfollowed a corresponding set of new US-based guidelinespresented just somewhat earlier by the CDC [2016],which already had received substantial attention and se-lect regulatory uptake in Canadian jurisdictions (e.g.,BC) with demonstrated reduction effects on opioid pre-scribing [31, 61–63]. The new Canada-based guidelinesconveyed a paradigmatically different spirit and messagefrom their predecessors, advising towards a generally re-strained and cautious, largely ‘last resort’ approach forthe utilization of strong opioid pharmacotherapy in thecontext of pain care [64–67].The stark inversion developments in strong opioid
utilization observed in Canada, to a substantial extent,mirror developments in the US, where rising and excep-tionally high levels of strong opioid dispensing revertedto decrease following a combination intensified regula-tory, monitoring and enforcement interventions [68–70].Specifically, the implementation of the new CDC opioidprescribing guideline (2016) has been assessed to be as-sociated with significant decreases in opioid prescribingin the US [71, 72]. While Canada traditionally has alsobeen a high-consumer country for codeine (‘weak’) opi-oid products, the observed utilization patterns somewhatfollow those for strong opioids. Their utilization, some-what similarly, also begins to decline around 2010/11, al-beit without formal interventions but a ratherincreasingly restrictive awareness and climate in themedical-scientific community emphasizing their limitedefficacy and safety, and the subsequent need for reduc-tions in utilization or for banning use altogether [73–75].Overall, the observed reversing patterns especially in
levels of strong opioid dispensing within just a few yearsin Canada are remarkable, but also reflect the starklyevolving, or even contradictory evidence that have beeninforming and guiding related medical views and prac-tices during this time. While available scientific literatureconsidered strong opioids as generally ‘effective and safe’for pain therapy in the early 2000s, and their use was
systematically promoted by pharmaceutical producersand prescribers alike on this basis, subsequently evolvingevidence increasingly underlined limitations and risks[30, 76, 77]. Another influencing factor towards changeoutside formal policy or regulatory measures involveswider socio-cultural forces, for example, mass media orinvestigative reports that have focused on the emergingopioid crisis and its facets in Canada post-2012 [78].These likely also contributed to changing broader publicawareness and vigilance, and professional practices inregards to opioids and their use.Further noteworthy based on the pharmaco-
epidemiologic data presented is the degree of heterogen-eity specifically of province-based patterns and trends instrong opioid dispensing in Canada over time. In anygiven year, the range of inter-provincially highest andlowest strong opioid dispensing levels reaches a differ-ence of (nearly) 100 %. Of note, many - while not all - ofthe ‘lows’ in strong opioid dispensing are recorded byQuebec, Canada’s socio-culturally distinct francophoneprovince, whereas many ‘highs’ occurred in Ontario(Quebec’s directly adjacent neighbor, and Canada’s mostpopulous province). Moreover, the patterns of strongopioid dispensing in several – especially smaller Eastern– provinces inverted to decreasing trends only with afew years’ delay. While Canada is a confederation wherematters of health regulation and practice are predomin-antly controlled by the provinces, such stark contrastswithin the same nation providing for principles of uni-versal healthcare are worth underscoring [79]. Therefore,the determinants of these inter-provincial differencesmay include pronvincially-based regulatory system fac-tors and differences (e.g., as related to provincial drugformularies, medical practice regulations, prescriptiondrug monitoring etc.) but may also involve more ‘soft’factors like medical practice culture, norms or training[25, 80–82]. The drivers between these distinct intra-Canadian heterogeneities in opioid utilization should bemore systematically examined by appropriate methodsand data.The starkly contrasting patterns of opioid utilization in
Canada observed raise basic questions in regards to their– direct and indirect - impacts and effects on relevanthealth outcomes. While the initial increases in opioidutilization were driven by high rates of chronic pain andrelated care system deficiencies, there is discernably littleconcrete evidence that the substantive expansions inopioid utilization through the early 2000s has led to con-crete improvements in pain care quality or outcomes[17, 83–85]. The recently established (2018) ‘CanadianPain Task Force assesses a continuously unfavourableand inadequate picture of the state of pain and relatedcare – characterizing it as “a public health emergency inneed of action” as recently as 2021 - that appears little
Jones et al. Substance Abuse Treatment, Prevention, and Policy (2021) 16:65 Page 7 of 11

different from the situation observed in the early 2000s[35]. Conversely, various (mostly qualitative/local) stud-ies have documented how current chronic pain patientsreceiving opioid pharmacotherapy have been forced totaper off their opioid medications, or experienced in-creasing barriers towards opioid medications access incontexts of recent, increasingly restrictive opioid controlenvironments [86–88]. Thus, the overall benefits of theextensive expansions, and subsequent contraction ofstrong opioid availability as a distinct chapter in healthpolicy practice in Canada appear to be marked by funda-mental questions.Moreover, the substantive un-intended adverse conse-
quences from extensively high population-level opioidexposure, including high rates of non-medical opioiduse, opioid-related morbidity (hospitalizations, treatmentadmissions) and especially mortality (poisoning fatalities)including adverse impacts on population life expectancyhave entailed an exceptional burden of adverse outcomes[15, 34, 89–92]. Most recently, Canada’s opioid-relatedpoisoning death rate rapidly rose from 7.8/100,000(2016) to 17.0/100,000 (2020), translating to a total of6,214 opioid-related fatalities in 2020 and indicatingsimilar rates to those recorded in the US [34, 93]. Whilethe dramatic increases in fatalities have been attributedmostly to illicit/synthetic opioids, some analyses suggestthat these drugs proliferated partly in response to ‘supplyshocks/gaps’ following the rapid and substantive reduc-tions in prescription opioid supply available for non-medical use despite persistent demand [33, 94, 95]. Onthis basis, the policy ‘case study’ of the marked inversionof strong opioid utilization in Canada, as documented,have come with distinctly mixed, including considerableadverse impacts relevant for overall population health[96, 97].Further to the data presented, BC notably represents
an outlier province for recent developments in opioiddispensing, in that it features marked re-increases instrong opioid (i.e., morphine, hydromorphone)utilization in very recent (2018–2020) years. These in-creases appear mainly driven by a growing number of‘safer opioid supply’ programs recently initiated in BC(Vancouver) that provide individuals involved with high-risk opioid (e.g., illicit fentanyl or analogues) exposurewith less toxic, prescription-grade strong opioid supply(e.g., hydromorphone, sustained-release morphine pills)as a public health measure towards reducing the acuterisk for opioid overdose and death [98–100]. On thisbasis, somewhat ironically, strong opioid dispensing andavailability has been re-expanding mainly to remedy theadverse public health consequences – directly or indir-ectly - facilitated by previous over-exposure and subse-quent rapid restrictions in pharmaceutical opioid supply[94, 95, 97]. It also deserves mention that our data
extend to 2020, the first year of the COVID-19 pan-demic, which has distinctly influenced psychoactive sub-stance use and may have influenced prescription opioidutilization patterns in different while uncertain ways inthat particular year. Specifically, there may have been in-creased demand for or use of prescription opioids (e.g.,for pain or other adverse symptoms) due to COVID-19related circumstances, yet simultaneously increased ac-cess barriers and practice changes to health careprovision may have reduced medication use [101–103].The present study and analyses include several limita-
tions. The community-pharmacy sample-based dataused for opioid dispensing calculation does not captureother dispensing points (e.g., hospitals, internet pharma-cies), and so may involve underestimations. DDD as acomparative opioid measurement metric is limited in re-liability, but similar in its limitations to that of othermeasures (e.g., morphine equivalents) and superior tocrude indicators like numbers of prescriptions [42, 104].The segmented regression may be limited by the limitednumber of data years available for the analyses. More-over, segmented regression fits linear segments while itis possible that in some cases non-linear segments couldprovide a better fit for the data, a possibility not exam-ined here. In addition, results can be influenced by thechoice of initial values but this is often mitigated by bas-ing the selection on examination of initial scatter plots[48]. The population-level dispensing data do not in-clude the three Canadian territories, and so formally donot represent the Canada ‘total’; however, the territoriesonly include < 0.5 % of the total Canadian population.Analyses for Canada totals of opioid dispensing arepopulation-weighted, and so are dominated by trends inthe more populous (e.g., ON) provinces.
ConclusionsWe have characterized an era of intensive rise-and-fallin opioid dispensing, while featuring marked inter-provincial heterogeneity, in Canada over the (brief)period 2005–2020. This case study raises fundamentalquestions for health policy making, and specifically opi-oid medications utilization and control in contexts ofpain care, psychotropic medications use and publichealth for Canada, but beyond for other jurisdictionsaiming to develop appropriate and effective health policyapproaches in these realms. Essentially, Canada inregards to opioid utilization, after a pronounced periodof ‘up-and-down’, finds itself back where it was in theearly 2000s, yet without substantive evidence for markedimprovements in pain care quality or outcomes while re-cording extensive adverse effects for public health fromextensive population-level opioid exposure. The stark os-cillation developments observed, and related conse-quences experienced over the past 20 years naturally
Jones et al. Substance Abuse Treatment, Prevention, and Policy (2021) 16:65 Page 8 of 11

cannot be corrected or reversed now. Looking forward,it will be essential for Canada – within the complexitiesof its health care and policy systems - to find a morestable and evidence-informed state or equilibrium thatbetter balances evidence-based pain care and relatedclinical opioid utilization needs for those individualswho require them, while preventing undue opioid expos-ure and reducing related adverse consequences for thegeneral population and the benefit of public health. Tosome extent, other industrialized nations (e.g., selectEuropean countries or New Zealand) have taken morerestrained and cautious approaches to medical opioidutilization and – even in contexts of increases inutilization - have experienced overall lower levels of re-lated harms, and therefore may offer useful case studiesor guiding evidence to Canada or other jurisdictions inthese respects going forward [105–107].
AbbreviationsDDD: Defined Daily Doses; US: United States; DDD: Defined Daily Doses;BC: British Columbia; AB: Alberta; SK: Saskatchewan; MN: Manitoba;ON: Ontario; QC: Quebec; NB: New Brunswick; NS: Nova Scotia; PE: PrinceEdward Island; NL: Newfoundland and Labrador; CA: Canada; AIC: Akaikeinformation criterion; CDC: Center for Disease Control
AcknowledgementsThe authors thank Lenka Vojtila-Valenzuela for her assistance in the manu-script preparation and submission.
Authors’ contributionsBF conceptualized the study and led the initial and subsequent revisiondrafts of the paper. WJ lead the development of the analyses plan andconducted the statistical analyses. All authors (WJ, RK, BF) contributed tomethodological adjustments, review and interpretation of data and results,and provided substantial intellectual contributions to the content of thepaper. All authors approved the final manuscript submitted.
FundingThe authors acknowledge research support from the Canadian Institutes ofHealth Research (CIHR; grant #SAF-94814,) as well as from the Hugh GreenFoundation Chair in Addiction Research, held at the Faculty of Medical andHealth Sciences, University of Auckland, New Zealand. Neither funder entitiesnor providers of data mentioned had any involvement in or influence overthe study design, analyses, reporting or interpretation of the data.
Availability of data and materialsThe raw data on prescription opioid dispensing in Canada werecommercially obtained IQVIA Solutions Canada Inc., with all subsequent dataprocessing and analyses solely conducted by the authors. Population datastatistics used for the analyses were obtained from Statistics Canada. Theexternal data sources/providers had no involvement or influence in anysteps of the analysis development, results generation or data interpretation,or other aspects of the manuscript.
Declarations
Ethics approval and consent to participateNot applicable.
Consent for publicationNot applicable.
Competing interestsThe authors have no competing interests.
Author details1Centre for Applied Research in Mental Health and Addiction (CARMHA),Faculty of Health Sciences, Simon Fraser University, Suite 2400, 515 W.Hastings Street, British Columbia, Vancouver, Canada. 2Faculty of Medical andHealth Sciences, University of Auckland, 85 Park Road, Auckland 1023Grafton, New Zealand. 3Department of Psychiatry, University of Toronto, 250College Street, Toronto, Ontario, Canada. 4Department of Psychiatry, FederalUniversity of São Paulo (UNIFESP), R. Sena Madureira, 1500 - Vila Clementino,São Paulo, Brazil.
Accepted: 23 July 2021
References1. Moulin DE, Clark AJ, Speechley M, Morley-Forster PK. Chronic pain in
Canada-prevalence, treatment, impact and the role of opioid analgesia. PainRes Manag. 2002;7(4):179–84.
2. Schopflocher D, Taenzer P, Jovey R. The prevalence of chronic pain inCanada. Pain Res Manag. 2011;16(6):445–50.
3. Tompkins DA, Hobelmann JG, Compton P. Providing chronic painmanagement in the “Fifth Vital Sign” Era: Historical and treatmentperspectives on a modern-day medical dilemma. Drug Alcohol Depend.2017;173:11–21.
4. Lanser P, Gesell S. Pain management: the fifth vital sign. HealthcBenchmarks. 2001;8(6):68–70.
5. Morone NE, Weiner DK. Pain as the fifth vital sign: exposing the vital needfor pain education. Clin Ther. 2013;35(11):1728–32.
6. Morley-Forster PK, Clark AJ, Speechley M, Moulin DE. Attitudes towardopioid use for chronic pain: a Canadian physician survey. Pain Res Manag.2003;8(4):189–94.
7. Jovey RD, Ennis J, Gardner-Nix J, Goldman B, Hays H, Lynch M, et al. Use ofopioid analgesics for the treatment of chronic noncancer pain-a consensusstatement and guidelines from the Canadian Pain Society, 2002. Pain ResManag. 2003;8(Suppl A):3A–14A.
8. Dhalla IA, Mamdani MM, Sivilotti ML, Kopp A, Qureshi O, Juurlink DN.Prescribing of opioid analgesics and related mortality before and after theintroduction of long-acting oxycodone. CMAJ. 2009;181(12):891–6.
9. Furlan AD, Sandoval JA, Mailis-Gagnon A, Tunks E. Opioids for chronicnoncancer pain: a meta-analysis of effectiveness and side effects. CMAJ.2006;174(11):1589–94.
10. Martin TL, Woodall KL, McLellan BA. Fentanyl-related deaths in Ontario,Canada: toxicological findings and circumstances of death in 112 cases(2002–2004). J Anal Toxicol. 2006;30(8):603–10.
11. Lexchin J, Kohler JC. The danger of imperfect regulation: OxyContin use inthe United States and Canada. Int J Ris Saf in Med. 2011;23(4):233–40.
12. Van Zee A. The promotion and marketing of oxycontin: commercialtriumph, public health tragedy. Am J of Pub Health. 2009;99(2):221–7.
13. International Narcotics Control Board (2021) Narcotic Drugs - TechnicalReport Vienna. INCB, Austria Available: https://www.incb.org/incb/en/narcotic-drugs/Technical_Reports/narcotic_drugs_reports.html. Retrieved: June12, 2021
14. International Narcotics Control Board. Report of the International NarcoticsControl Board on the Availability of Internationally Controlled Drugs:Ensuring Adequate Access for Medical and Scientific Purposes. Vienna: INCB,United Nations; 2010.
15. Fischer B, Argento E. Prescription opioid related misuse, harms, diversionand interventions in Canada: a review. Pain Physician. 2012;15(3 Suppl):ES191–203.
16. Fischer B, Goldman B, Rehm J, Popova S. Non-medical use of prescriptionopioids and public health in Canada. Can J of Pub Health. 2008;99(3):182–4.
17. Boulanger A, Clark AJ, Squire P, Cui E, Horbay G. Chronic pain in Canada:have we improved our management of chronic noncancer pain? Pain ResManag. 2007;12(1):39–47.
18. Fischer B, Nakamura N, Rush B, Rehm J, Urbanoski K. Changes in andcharacteristics of admissions to treatment related to problematicprescription opioid use in Ontario, 2004–2009. Drug Al Depend. 2010;109(1–3):257–60.
19. Public Health Ontario. Interactive Opioid Tool. Ottawa: Public HealthOntario. Available: https://www.publichealthontario.ca/en/data-and-analysis/substance-use/interactive-opioid-tool. Retrieved: 12 June 2021.
Jones et al. Substance Abuse Treatment, Prevention, and Policy (2021) 16:65 Page 9 of 11

20. Dhalla IA, Mamdani MM, Gomes T, Juurlink DN. Clustering of opioidprescribing and opioid-related mortality among family physicians in Ontario.Can Fam Physician. 2011;57(3):e92-e6.
21. Fischer B, Gooch J, Goldman B, Kurdyak P, Rehm J. Non-medicalprescription opioid use, prescription opioid-related harms and public healthin Canada: an update 5 years later. Can J Public Health. 2014;105(2):146–9.
22. Fischer B, Rehm J, Tyndall M. Effective Canadian policy to reduce harms fromprescription opioids: learning from past failures. CMAJ. 2016;188(17–18):1240–4.
23. Gomes T, Mastorakos A, Paterson JM, Sketris I, Caetano P, Greaves S, et al.Changes in the dispensing of opioid medications in Canada following theintroduction of a tamper-deterrent formulation of long-acting oxycodone: atime series analysis. CMAJ Open. 2017;5(4):E800.
24. Fischer B, Vojtila L, Kurdyak P. ‘Delisting’OxyContin® to reduce prescriptionopioid-related harms in Ontario (Canada)—gauging effects 5 years later.Pharmacoepidemiol Drug Saf. 2017;26(9):1040–3.
25. Furlan AD, MacDougall P, Pellerin D, Shaw K, Spitzig D, Wilson G, et al.Overview of for prescription monitoring/review programs in Canada. PainRes Manag. 2014;19(2):102–6.
26. Gomes T, Juurlink D, Yao Z, Camacho X, Paterson JM, Singh S, et al. Impactof legislation and a prescription monitoring program on the prevalence ofpotentially inappropriate prescriptions for monitored drugs in Ontario: atime series analysis. CMAJ Open. 2014;2(4):E256.
27. Canadian Centre on Substance Use and Addiction. First Do No Harm:Responding to Canada’s Prescription Drug Crisis (Report) 2013. Available:https://www.ccsa.ca/first-do-no-harm-responding-canadas-prescription-drug-crisis-report. Retrieved: June 12, 2021.
28. Spooner L, Fernandes K, Martins D, Juurlink D, Mamdani M, Paterson JM,et al. High-dose opioid prescribing and opioid-related hospitalization: apopulation-based study. PloS one. 2016;11(12):e0167479.
29. Chou R, Turner JA, Devine EB, Hansen RN, Sullivan SD, Blazina I, et al. Theeffectiveness and risks of long-term opioid therapy for chronic pain: asystematic review for a National Institutes of Health Pathways to PreventionWorkshop. Ann Int Med. 2015;162(4):276–86.
30. Busse JW, Schandelmaier S, Kamaleldin M, Hsu S, Riva JJ, Vandvik PO, et al.Opioids for chronic non-cancer pain: a protocol for a systematic review ofrandomized controlled trials. Syst Rev. 2013;2(1):66.
31. Busse JW, Craigie S, Juurlink DN, Buckley DN, Wang L, Couban RJ, et al.Guideline for opioid therapy and chronic noncancer pain. CMAJ. 2017;189(18):E659-E66.
32. Fischer B, Vojtila L, Rehm J. The ‘fentanyl epidemic’in Canada–Somecautionary observations focusing on opioid-related mortality. Prev Med.2018;107:109–13.
33. Gomes T, Khuu W, Martins D, Tadrous M, Mamdani MM, Paterson JM, et al.Contributions of prescribed and non-prescribed opioids to opioid related deaths:population based cohort study in Ontario, Canada. BMJ. 2018;362:k3207.
34. Government of Canada. Opioid- and Stimulant-related Harms in Canada.2021.
35. Government of Canada. Canadian Pain Task Force. Ottawa: Government ofCanada; 2021. Available: https://www.canada.ca/en/health-canada/corporate/about-health-canada/public-engagement/external-advisory-bodies/canadian-pain-task-force.html. Retrieved: 12 June 2021.
36. IQVIA. Canadian Pharmaceutical T. 2021. Available: https://www.canada.ca/en/health-canada/corporate/about-health-canada/public-engagement/external-advisory-bodies/canadian-pain-task-force.html. Retrieved: 12 June2021.
37. Jones W, Vojtila L, Kurdyak P, Fischer B. Prescription opioid dispensing inCanada: an update on recent developments to 2018. J Pharm Policy Prac.2020;13(1):1–6.
38. Canadian Institute for Health Information. Pan-Canadian Trends in thePrescribing of Opioids and Benzodiazepines, 2012 to 2017. Ottawa: CIHI;2018.
39. Gomes T, Paterson JM, Juurlink DN, Dhalla IA, Mamdani MM. Reformulationof controlled-release oxycodone and pharmacy dispensing patterns nearthe US–Canada border. Open Med. 2012;6(4):e141.
40. WHO Collaborating Centre for Drug Statistics Methodology. Definition andgeneral considerations: World Health Organization; 2018. Available: https://www.whocc.no/ddd/definition_and_general_considera/. Retrieved: 12 June 2021.
41. Svendsen K, Borchgrevink P, Fredheim O, Hamunen K, Mellbye A, Dale O.Choosing the unit of measurement counts: the use of oral morphineequivalents in studies of opioid consumption is a useful addition to defineddaily doses. Pal Med. 2011;25(7):725–32.
42. Nielsen S, Gisev N, Bruno R, Hall W, Cohen M, Larance B, et al. Defined dailydoses (DDD) do not accurately reflect opioid doses used in contemporarychronic pain treatment. Pharmacoepidemiol Drug Saf. 2017;26(5):587–91.
43. Statistics Canada. Population estimates on July 1st, by age and sex: Table:17-10-0005-01; 2021. Available: https://www150.statcan.gc.ca/t1/tbl1/en/tv.action?pid=1710000501. Retrieved: 12 June 2021.
44. Anekar AA, Cascella M. WHO Analgesic ladder: StatPearls. 2020. Available:https://www.ncbi.nlm.nih.gov/books/NBK554435/. Retrieved: June 12, 2021.
45. Raffa R, Pergolizzi J Jr. A modern analgesics pain ‘pyramid’. J Clin PharmTher. 2014;39(1):4–6.
46. R Core Team. R: A language and environment for statistical computingVienna, Austria: R Foundation for Statistical Computing; 2021. Available:https://www.R-project.org/. Retrieved: June 12, 2021.
47. Muggeo VM. Segmented: an R package to fit regression models withbroken-line relationships. R News. 2008;8(1):20–5.
48. Muggeo VM. Estimating regression models with unknown break-points. StatMed. 2003;22(19):3055–71.
49. Wikipedia. Segmented Regression; 2021. Available: https://en.wikipedia.org/wiki/Segmented_regression#:~:text=Segmented%20regression%2C%20also%20known%20as,is%20fit%20to%20each%20interval.&text=The%20boundaries%20between%20the%20segments%20are%20breakpoints.Retrieved: 12 June 2021.
50. Fischer B, Jones W, Rehm J. Trends and changes in prescription opioidanalgesic dispensing in Canada 2005–2012: An update with a focus onrecent interventions. BMC Health Serv Res. 2014;14(1):90.
51. Fischer B, Jones W, Krahn M, Rehm J. Differences and over-time changes inlevels of prescription opioid analgesic dispensing from retail pharmacies inCanada, 2005–2010. Pharmacoepidemiol Drug Saf. 2011;20(12):1269–77.
52. Peng P, Choiniere M, Dion D, Intrater H, LeFort S, Lynch M, et al. Challengesin accessing multidisciplinary pain treatment facilities in Canada. Can JAnaes. 2007;54(12):977.
53. Goldberg DS, McGee SJ. Pain as a global public health priority. BMC PublicHealth. 2011;11(1):1–5.
54. Taylor AL, Gostin LO, Pagonis KA. Ensuring effective pain treatment: anational and global perspective. JAMA. 2008;299(1):89–91.
55. Dhalla IA, Persaud N, Juurlink DN. Facing up to the prescription opioid crisis.BMJ. 2011;343:23–36.
56. Fischer B, Jones W, Urbanoski K, Skinner R, Rehm J. Correlations betweenprescription opioid analgesic dispensing levels and related mortality andmorbidity in Ontario, Canada, 2005–2011. Drug Alc Rev. 2014;33(1):19–26.
57. Fischer B, Jones W, Rehm J. High correlations between levels of consumption andmortality related to strong prescription opioid analgesics in British Columbia andOntario, 2005–2009. Pharmacoepidemiol Drug Saf. 2013;22(4):438–42.
58. Martins D, Khuu W, Tadrous M, Juurlink DN, Mamdani MM, Paterson JM,et al. Impact of delisting high-strength opioid formulations from a publicdrug benefit formulary on opioid utilization in Ontario, Canada.Pharmacoepidemiol Drug Saf. 2019;28(5):726–33.
59. Schleihauf E, Crabtree K, Dohoo C, Fleming S, McPeake H, Bowes M. At-a-glance-Concurrent monitoring of opioid prescribing practices and opioid-related deaths: the context in Nova Scotia, Canada. Health Promot ChronicDis Prev Can. 2018;38(9):334.
60. Canadian Institute for Health Information. Opioid Prescribing in Canada:How are Practices Changing? Ottawa: CIHI; 2019.
61. Dowell D, Haegerich TM, Chou R. CDC guideline for prescribing opioids forchronic pain—United States, 2016. JAMA. 2016;315(15):1624–45.
62. Crabtree A, Rose C, Chong M, Smolina K. Effects of the new prescribingstandards in British Columbia on consumption of opioids andbenzodiazepines and z drugs. Can Fam Physician. 2019;65(5):e231-e7.
63. Morrow RL, Bassett K, Wright JM, Carney G, Dormuth CR. Influence of opioidprescribing standards on drug use among patients with long-term opioiduse: a longitudinal cohort study. CMAJ Open. 2019;7(3):E484.
64. Pergolizzi JV Jr, Raffa RB, Zampogna G, Breve F, Colucci R, Schmidt WK, et al.Comments and Suggestions from Pain Specialists Regarding the CDC’sProposed Opioid Guidelines. Pain Pract. 2016;16(7):794–808.
65. Renthal W. Seeking balance between pain relief and safety: CDC issues newopioid-prescribing guidelines. JAMA Neurol. 2016;73(5):513–4.
66. Ballantyne JC, Murinova N, Krashin DL. Opioid guidelines are a necessaryresponse to the opioid crisis. Clin Pharm Ther. 2018;103(6):946–9.
67. Clarke H, Bao J, Weinrib A, Dubin RE, Kahan M. Canada’s hidden opioidcrisis: the health care system’s inability to manage high-dose opioid
Jones et al. Substance Abuse Treatment, Prevention, and Policy (2021) 16:65 Page 10 of 11

patients: Fallout from the 2017 Canadian opioid guidelines. Can FamPhysician. 2019;65(9):612–4.
68. Schuchat A, Houry D, Guy GP. New data on opioid use and prescribing inthe United States. JAMA. 2017;318(5):425–6.
69. Guy GP Jr, Zhand K, Bohm MK, Losby J, Lewis B, Young R, et al. Vital signs:changes in opioid prescribing in the United States, 2006–2015. MMWR.2017;66(26):697.
70. Chang H-Y, Lyapustina T, Rutkow L, Daubresse M, Richey M, Faul M, et al.Impact of prescription drug monitoring programs and pill mill laws onhigh-risk opioid prescribers: a comparative interrupted time series analysis.Drug Alc Depend. 2016;165:1–8.
71. Bohnert AS, Guy GP Jr, Losby JL. Opioid prescribing in the United Statesbefore and after the Centers for Disease Control and Prevention’s 2016opioid guideline. Ann of Int Med. 2018;169(6):367–75.
72. Quan AML, Wilson LA, Mithani SS, Zhu DT, Bota AB, Wilson K. Reporting onthe opioid crisis (2000–2018): role of The Globe and Mail, a CanadianEnglish-language newspaper in influencing public opinion. Harm Red J.2020;17(1):1–11.
73. Tobias JD, Green TP, Coté CJ. Codeine: time to say “no”. Pediatrics. 2016;138(4):E1-7.
74. MacDonald N, MacLeod SM. Has the time come to phase out codeine?CMAJ. 2010;182(17):1825.
75. MacKinnon J. Tighter regulations needed for over-the-counter codeine inCanada. Can Pharm J. 2016;149(6):322–4.
76. Ballantyne JC. Opioids for the treatment of chronic pain: mistakes made,lessons learned, and future directions. Anasth Analg. 2017;125(5):1769–78.
77. Vowles E, McEntee M, Siyahhan Julnes P, Frohe T, Ney J, van der Goes D.Rates of opioid misuse, abuse, and addiction in chronic pain: a systematicreview and data synthesis. Pain. 2015;156(4):569–76.
78. Borwein A, Kephart G, Whelan E, Asbridge M. Prescribing practices amid theOxyContin crisis: examining the effect of print media coverage on opioidprescribing among physicians. J Pain. 2013;14(12):1686–93.
79. Allin S, Rudoler D. The Canadian health care system: 2017. Int Prof HealthCare Syst. 2015;21(3):36–51.
80. Demers V, Melo M, Jackevicius C, Cox J, Kalavrouziotis D, Rinfret S, et al.Comparison of provincial prescription drug plans and the impact onpatients’ annual drug expenditures. CMAJ. 2008;178(4):405–9.
81. Hirschkorn KA, Andersen R, Bourgeault IL. Canadian family physicians andcomplementary/alternative medicine: the role of practice setting, medicaltraining, and province of practice. Can Rev Sociol. 2009;46(2):143–59.
82. Roy É, Côté RJ, Hamel D, Dubé P-A, Langlois É, Labesse ME, et al. Opioidprescribing practices and training needs of Québec family physicians forchronic noncancer pain. Pain Res Manag. 2017;2017.
83. Lynch ME. The need for a Canadian pain strategy. Pain Res Manag. 2011;16(2):77–80.
84. Shupler MS, Kramer JK, Cragg JJ, Jutzeler CR, Whitehurst DG. Pan-Canadianestimates of chronic pain prevalence from 2000 to 2014: a repeated cross-sectional survey analysis. J Pain. 2019;20(5):557–65.
85. Saïdi H, Pagé MG, Boulanger A, Ware MA, Choinière M. Effectiveness oflong-term opioid therapy among chronic non-cancer pain patientsattending multidisciplinary pain treatment clinics: A Quebec Pain Registrystudy. Can J Pain. 2018;2(1):113–24.
86. Antoniou T, Ala-Leppilampi K, Shearer D, Parsons JA, Tadrous M, Gomes T.“Like being put on an ice floe and shoved away”: A qualitative study of theimpacts of opioid-related policy changes on people who take opioids. Int Jof Drug Policy. 2019;66:15–22.
87. Kaboré J-L, Dassieu L, Roy É, Jutras-Aswad D, Bruneau J, Pagé MG, et al. Prevalence,Characteristics, and Management of Chronic Noncancer Pain Among People WhoUse Drugs: A Cross-Sectional Study. Pain Med. 2020;21(11):3205–14.
88. Dassieu L, Kaboré J-L, Choinière M, Arruda N, Roy É. Chronic painmanagement among people who use drugs: A health policy challenge inthe context of the opioid crisis. Int J Drug Policy. 2019;71:150–6.
89. Fischer B. Prescription opioid use, harms and interventions in Canada: areview update of new developments and findings since 2010. PainPhysician. 2015;18:E605-E14.
90. Vojtila L, Pang M, Goldman B, Kurdyak P, Fischer B. Non-medical opioid use,harms and interventions in Canada – a 10-year update on anunprecedented and unabating substance use-related public health crisis.Drugs (Abingdon Engl). 2019;27(2):118–22.
91. Belzak L, Halverson J. Evidence synthesis-The opioid crisis in Canada: anational perspective. Health Promot Chronic Dis Prev Can. 2018;38(6):224.
92. Orpana Heather M, Lang Justin J, George Diana HJ. At-a-glance-The impactof poisoning-related mortality on life expectancy at birth in Canada, 2000 to2016. Health Promot Chronic Dis Prev Can. 2019;39(2):56.
93. Wilson N Drug and Opioid-Involved Overdose Deaths—United States,2017–2018. MMWR. 2020;69:290-7.
94. Fischer B, Pang M, Tyndall M. The opioid death crisis in Canada: cruciallessons for public health. Lancet Public Health. 2018;4(2):e81–e2.
95. Fischer B, Pang M, Jones W. The opioid mortality epidemic in NorthAmerica: do we understand the supply side dynamics of thisunprecedented crisis? J Sub Abuse Treat Prev Policy. 2020;15(1):1–8.
96. Babor TF, Caulkins J, Fischer B, Foxcroft D, Medina-Mora ME, Obot I, et al.Drug policy and the public good: a summary of the second edition.Addiction. 2019;114(11):1941–50.
97. Fischer B, Wood E. A decade of extreme oscillations in opioid control andavailability: implications for public health in a Canadian setting. J Pub HealthPolicy. 2020;41:214–20.
98. Ivsins A, Boyd J, Mayer S, Collins A, Sutherland C, Kerr T, et al. Barriers andfacilitators to a novel low-barrier hydromorphone distribution program inVancouver, Canada: a qualitative study. Drug Alc Depend. 2020;216:102–23.
99. Tyndall M. A safer drug supply: a pragmatic and ethical response to theoverdose crisis. CMAJ. 2020;192(34):E986-E7.
100. BC Centre for Disease Control. Overdose Response Indicator Report.Vancouver: BC Centre for Disease Control; 2020.
101. Kumar N, Janmohamed K, Nyhan K, Martins SS, Cerda M, Hasin D, et al.Substance use and substance use disorder, in relation to COVID-19: protocolfor a scoping review. Syst Rev. 2021;10(1):1–6.
102. Rogers AH, Shepherd JM, Garey L, Zvolensky MJ. Psychological factorsassociated with substance use initiation during the COVID-19 pandemic.Psych Res. 2020;293:113407.
103. Alexander GC, Stoller KB, Haffajee RL, Saloner B. An epidemic in the midst ofa pandemic: opioid use disorder and COVID-19. Am College Phys. 2020:173:57-8.
104. Nielsen S, Degenhardt L, Hoban B, Gisev N. A synthesis of oral morphineequivalents (OME) for opioid utilisation studies. Pharmacoepidemiol DrugSaf. 2016;25(6):733–7.
105. Fischer B, Daldegan-Bueno D, Jones W. Comparison of crude population-level indicators of opioid use and related harm in New Zealand and Ontario(Canada). Pain Therapy. 2021;10(1):15–23.
106. Verhamme KM, Bohnen AM. Are we facing an opioid crisis in Europe?Lancet Public Health. 2019;4(10):e483–e4.
107. Häuser W, Buchser E, Finn D, Dom G, Fors E, Heiskanen T, et al. Is Europealso facing an opioid crisis?—A survey of European Pain Federationchapters. Euro J Pain. 2021;25:1760-9.
Publisher’s NoteSpringer Nature remains neutral with regard to jurisdictional claims inpublished maps and institutional affiliations.
Jones et al. Substance Abuse Treatment, Prevention, and Policy (2021) 16:65 Page 11 of 11