patterns of speciation in drosophila - université...
TRANSCRIPT

Patterns of Speciation in DrosophilaAuthor(s): Jerry A. Coyne and H. Allen OrrSource: Evolution, Vol. 43, No. 2 (Mar., 1989), pp. 362-381Published by: Society for the Study of EvolutionStable URL: http://www.jstor.org/stable/2409213 .Accessed: 09/06/2011 13:25
Your use of the JSTOR archive indicates your acceptance of JSTOR's Terms and Conditions of Use, available at .http://www.jstor.org/page/info/about/policies/terms.jsp. JSTOR's Terms and Conditions of Use provides, in part, that unlessyou have obtained prior permission, you may not download an entire issue of a journal or multiple copies of articles, and youmay use content in the JSTOR archive only for your personal, non-commercial use.
Please contact the publisher regarding any further use of this work. Publisher contact information may be obtained at .http://www.jstor.org/action/showPublisher?publisherCode=ssevol. .
Each copy of any part of a JSTOR transmission must contain the same copyright notice that appears on the screen or printedpage of such transmission.
JSTOR is a not-for-profit service that helps scholars, researchers, and students discover, use, and build upon a wide range ofcontent in a trusted digital archive. We use information technology and tools to increase productivity and facilitate new formsof scholarship. For more information about JSTOR, please contact [email protected].
Society for the Study of Evolution is collaborating with JSTOR to digitize, preserve and extend access toEvolution.
http://www.jstor.org

Evolution, 43(2), 1989, pp. 362-381
PATTERNS OF SPECIATION IN DROSOPHILA1
JERRY A. COYNE AND H. ALLEN ORR Department of Ecology and Evolution, The University of Chicago,
1103 East 57th Street, Chicago, IL 60637
Abstract. - To investigate the time course of speciation, we gathered literature data on 119 pairs of closely related Drosophila species with known genetic distances, mating discrimination, strength of hybrid sterility and inviability, and geographic ranges. Because genetic distance is correlated with divergence time, these data provide a cross-section of taxa at different stages of speciation.
Mating discrimination and the sterility or inviability of hybrids increase gradually with time. Hybrid sterility and inviability evolve at similar rates. Among allopatric species, mating discrim- ination and postzygotic isolation evolve at comparable rates, but among sympatric species strong mating discrimination appears well before severe sterility or inviability. This suggests that pre- zygotic reproductive isolation may be reinforced when allopatric taxa become sympatric.
Analysis of the evolution of postzygotic isolation shows that recently diverged taxa usually produce sterile or inviable male but not female hybrids. Moreover, there is a large temporal gap between the evolution of male-limited and female hybrid sterility or inviability. This gap, which is predicted by recent theories about the genetics of speciation, explains the overwhelming pre- ponderance of hybridizations yielding male-limited hybrid sterility or inviability (Haldane's rule).
Received February 11, 1988. Accepted September 23, 1988
Any theory of evolution must explain ge- netic changes within species as well as those producing new species. We understand far more about the former than the latter pro- cess. This disparity has at least two causes. First, genetic change in populations can be observed and studied during a human life- time, but the evolution of reproductive iso- lation generally takes much longer. Second, genetic analysis of species differences is often precluded by their reproductive isolation.
As a result, genetic theories of speciation are often based more on biogeography than on genetical observation or experiment. For example, the founder-flush and transilience theories of speciation were largely inspired by the endemic nature of Hawaiian Dro- sophila species (Carson, 1975; Templeton, 1981). Yet biogeographic patterns may not imply a single evolutionary explanation. Enhanced prezygotic isolation in areas of species overlap, for instance, is often attrib- uted to the reinforcement of mating dis- crimination by natural selection against maladaptive hybridization (Dobzhansky, 1937). But the observation of stronger pre- mating isolation in sympatry could merely result from a process of differential fusion
I This paper is dedicated to our mentor, Dr. B. S. Grant, without whose help we would now be in lucra- tive professions.
or extinction: those populations separated by little mating discrimination may simply not persist in sympatry (Templeton, 1981; Butlin, 1987). Species that survive this pro- cess will exhibit high levels of mating dis- crimination, giving the false impression that such discrimination resulted from natural selection to prevent hybridization of sym- patric species.
Here we bring together information about reproductive isolation, electrophoretic dif- ferentiation, and biogeography in the genus Drosophila in a search for patterns to test and motivate theories of speciation. Our goal is to determine the rate at which reproduc- tive isolation evolves; our method is to compare the strength of isolation in species that have diverged for different amounts of time. Using the electrophoretic genetic dis- tance between taxa, which appears to change linearly with time (Nei, 1975, 1987; Ki- mura, 1983), we can order species pairs by their divergence times. For many of these pairs we also have information about mat- ing discrimination and sterility or inviabil- ity of their hybrids. Such data can help an- swer the following questions.
i) How rapidly does reproductive isolation evolve?-The divergence time of taxa must obviously be correlated with the amount of reproductive isolation between them, be- cause all species begin as populations that
362

SPECIATION IN DROSOPHILA 363
are not reproductively isolated. Neverthe- less, the pattern of this relationship can pro- vide useful information. Reproductive iso- lation could, for example, increase slowly and at a constant rate up to the limit of complete isolation. Such a "speciation clock" would imply that reproductive iso- lation results from a gradual process of uni- form rate, such as genetic drift or constant selection. On the other hand, reproductive isolation could evolve very quickly once populations are separated, with the rate sub- sequently slowing. This would imply a fast- er process, such as rapid adaptation to a new environment or genetic drift during founder events.
ii) Do pre- and postzygotic isolation evolve at the same rate?-We would like to know which type of isolation is most important in reducing gene flow between incipient species, for this factor would be the primary component of speciation. If most species evolve complete mating discrimination well before hybrid sterility or inviability, for ex- ample, the study of postmating isolation would be irrelevant to the origin of species.
iii) Do hybrid sterility and inviability evolve at the same rate?- If the evolution of post- zygotic isolation is an important cause of speciation, we would like to know which of the above two components evolves first. It is possible, for example, that the evolution of inviability requires far more genetic change than the evolution of sterility.
iv) How does postzygotic isolation increase with time?-There are two common pat- terns of postzygotic isolation in species hy- brids. 1) When only one sex is sterile or inviable, it is almost always the heteroga- metic sex (Haldane, 1922). This generali- zation, known as "Haldane's rule," applies in the vast majority of animal hybridiza- tions, regardless of which sex is heteroga- metic (e.g., Gray, 1954, 1958; Bock, 1984). 2) The sex chromosomes invariably play the largest role in hybrid sterility or inviability (Charlesworth et al., 1987). To explain these two observations, Charlesworth et al. (1987) suggested that sterility and inviability may be pleiotropic effects of recessive or partially recessive alleles that are advantageous in geographically isolated populations. These alleles would be largely hidden from selec- tion if they first arose on autosomes, but
would be immediately selected in the het- erogametic sex if they were X-linked. If most advantageous mutations with such pleiotro- pic effects are recessive or partially reces- sive, it can be further shown that postzy- gotic isolation will appear first in heterogametic and only later in homoga- metic hybrids, explaining both Haldane's rule and the large role of the X chromosome (Coyne and Orr, 1989). We can test the pre- diction that Haldane's rule represents an early stage of speciation by examining ge- netic distances between species whose crosses yield sterility or inviability in males only, in. females only, and in both sexes.
v) Is prezygotic reproductive isolation en- hanced by selection when populations be- come sympatric?-We can test this hypoth- esis by comparing the degree of mating discrimination between sympatric and al- lopatric species pairs separated by similar genetic distances. We can also examine whether such a pattern is an artifact of the fusion or extinction of less-reproductively- isolated populations upon secondary con- tact.
MATERIALS AND METHODS
We collected information from the liter- ature on electrophoretic genetic distance, degree of mating discrimination in the lab- oratory, amount of sterility or inviability of interspecific hybrids in reciprocal crosses, and geographic ranges of Drosophila species pairs. We included pairs of taxa in our sur- vey only if information was available on genetic distance and at least one form of reproductive isolation. Because we are in- terested in the initial stages of speciation, we included any pair of recognized taxa showing pre- or postzygotic isolation, how- ever slight (for convenience, we call all pairs of taxa "species pairs").
Genetic Distance. -We used Nei's elec- trophoretic genetic distance, D (Nei, 1972, 1987), as an index of divergence time. D measures average codon differences be- tween proteins and increases at a constant rate when substitutions occur at a constant rate. This index is 0 when species have iden- tical allozyme frequencies and oo when they share no alleles. Among crossable Drosoph- ila species, however, D ranges from 0 to 2 (Table 1). At genetic distances greater than
364 J. A. COYNE AND H. A. ORR
one, the index begins to lose its linearity with time owing to the occurrence of mul- tiple substitutions (the relationship, how- ever, remains monotonic).
The rough constancy of protein substi- tution over calendar time is, of course, the well-known "molecular clock," for which there is substantial empirical evidence (Nei, 1975, 1987; Wilson et al., 1977; Kimura, 1983). Although much of this evidence was gathered from other organisms, there are at least two reasons to believe that the elec- trophoretic clock ticks at a fairly constant rate in Drosophila. First, Drosophila phy- logenies constructed from genetic distances are almost completely congruent with those based on chromosome inversions, which probably best approximate true phylogenies (MacIntyre and Collier, 1986). This con- gruence would not occur if the electropho- retic clock were extremely erratic. Second, independent calibrations of divergence times among taxa are strikingly concordant with those estimated from genetic distances (Nei, 1975; Carson, 1976). While there is a con- troversy about whether the rough constancy of molecular evolution results from genetic drift or natural selection (Kimura, 1983; Gillespie, 1988), our results depend only on the constancy and not on its cause. Simi- larly, there is a controversy about whether the clock ticks at the same rate in all organ- isms, because it may depend upon genera- tion time, particularly at the DNA level (Li and Tanimura, 1987). This issue does not affect our analysis because we use only elec- trophoretic data and analyze species with similar generation times.
Because the clock is a stochastic one, cal- culations of D from one or a few loci are unreliable. Moreover, standard errors are large when D is larger than one (Nei, 1987). In virtually all of our species pairs, however, D is calculated from more than ten loci. Furthermore, most of our data analysis is confined to species pairs separated by low genetic distances (D < 1), where the clock is more accurate.
When D values were not given in an elec- trophoretic survey, we calculated them from the raw data. If several populations were surveyed for a single species, we used the unweighted mean of allele frequencies among populations. In one case we used a
transformation of Rogers' similarity coef- ficient (-In S; Rogers, 1972) as the measure of genetic divergence, because the authors presented this value without raw data (val- ues of -In S are, however, usually within 10% of D's calculated from the same data [Hedrick, 1975]). When several genetic dis- tances were available for the same species pairs, we chose those values from studies in which other species pairs were also sur- veyed, so that as many data as possible were obtained with identical electrophoretic methods.
Finally, we note that some of our results depend upon the assumption of an electro- phoretic clock. The value of these results will obviously rise or fall with the accuracy of the clock. Other of our results, however, depend only on a rough positive correlation between genetic distance and time and not on a strict linear relation between the two. Still other results are valid regardless of any correlation of genetic distance with time. We note in the Results and Discussion which conclusions are clock-dependent and which are not.
Postzygotic Isolation. -This category in- cludes two components: hybrid inviability and hybrid sterility. The strength of this iso- lation was calculated in the following way. We first counted the number of sexes in both reciprocal crosses that were either com- pletely sterile or completely inviable. This value, which ranges from 0 (both sexes vi- able and fertile in both reciprocal crosses) to 4 (both sexes sterile or inviable in both reciprocal crosses), was then divided by 4. This yields an index of postzygotic isolation ranging from 0 (no isolation) to 1 (complete isolation); cases of Haldane's rule are thus classified as 0.5. Zouros (1973) used an identical measure. We classified a cross yielding no offspring as "producing all in- viable hybrids" only if there was evidence that females were inseminated, so that we did not confound premating and postmat- ing isolation. (The "insemination reaction," in which sperm are destroyed or immobi- lized in species crosses, was counted as pre- zygotic isolation; see below.) A hybrid sex was considered to be viable if any adults of that sex appeared, even rarely. Similarly, it was considered to be fertile if any individ- uals of that sex were ever fertile. This pro-
SPECIATION IN DROSOPHILA 365
cedure is similar to that used by other in- vestigators classifying species hybridizations (e.g., Throckmorton, 1982). Our index is thus a minimum estimate of the true postzy- gotic isolation between species.
Prezygotic Isolation. -Mating isolation between a pair of species is commonly mea- sured in the laboratory by one of four tests: 1) no choice, in which females of one species are confined with males of another; 2) fe- male choice, in which females of one species are placed with males of their own as well as another species; 3) male choice, the re- verse of 2, and 4) multiple choice, in which males and females of both species are tested together. Mating discrimination is mea- sured by either counting the number of fe- males inseminated after a long treatment (methods 1 and 3) or observing the number of copulations during a shorter period (methods 2, 3, and 4).
In some species, insemination is not ac- companied by fertilization, because sperm are inactivated or expelled by the female's reproductive tract (Patterson, 1 947b). In such cases, females may be erroneously clas- sified as unmated, because the insemination is not detected. Sperm inactivation is, how- ever, equivalent to mating isolation because fertilization does not occur. We therefore call this category "prezygotic," and not "premating," isolation.
We constructed an index of prezygotic isolation that can be applied to all four types of mating tests:
frequency of heterospecific matings frequency of homospecific matings
This index ranges from - oo (complete disassortative mating) through 0 (no mating isolation) to 1 (complete isolation), and its computation from choice tests is straight- forward. In practice, there is very little dis- assortative mating among species, so the in- dex almost always ranges from 0 to 1. Five pairs of species showed some disassortative mating in one of the two reciprocal tests, though not in the other. In these instances we rounded the negative mating index to 0 before averaging it with the positive value from the reciprocal test. We used this pro- cedure because it is equivalent to that used to quantify postzygotic isolation and thus
allows a fairer comparison between the two (see below): in quantifying sterility or in- viability, we assumed that hybrids could not have higher fitness than parental species, which would yield negative postzygotic iso- lation values. However, none of our results change when we incorporate the negative mating values into our calculations or sim- ply eliminate these species from the anal- ysis.
In no-choice mating tests, we required in- traspecific controls as well as measurements of interspecific copulation in both reciprocal tests. The mating-isolation index in this case incorporates the frequency of interspecific insemination (the unweighted average from reciprocal tests) divided by the unweighted average frequency of insemination in the intraspecific controls (the latter is almost always close to 1.0).
When a study presented data from more than a single pair of strains, we averaged the isolation values from the different tests. For "sympatric" species with partially overlap- ping ranges, we averaged results from both sympatric and allopatric strains (see below).
The index of prezygotic isolation is equiv- alent to that of postmating isolation, for the latter can be thought of as 1 - (frequency of fertile and viable sexes in heterospecific tests/frequency of fertile and viable sexes in both homospecific controls [always 41). Thus, values of pre- and postzygotic isola- tion are comparable measures of how these isolating mechanisms reduce autosomal gene flow between species. When either is 0.5, for example, gene exchange between species is half that occurring within species.
The direct comparison of pre- and post- zygotic isolation indexes requires one ad- ditional adjustment. While our index of pre- zygotic isolation is a continuous variable, postzygotic isolation was recorded as a dis- crete variable that could assume the values of only 0, 0.25, 0.50, 0.75, or 1.0 (corre- sponding to zero, one, two, three, or four hybrid sexes that were inviable or sterile). Postzygotic isolation is therefore rounded down to a minimum value. We therefore adjust prezygotic isolation in a similar way when comparing the two indices. For such comparisons, we rounded the prezygotic- isolation index down to the next smaller value of 0, 0.25, 0.50, or 0.75. A prezygotic

366 J. A. COYNE AND H. A. ORR
value of 1.0 could only be attained if no interspecific matings occurred.
For the few species pairs in which mating isolation was studied using different exper- imental methods, we used those isolation values derived from experiments testing the largest number of related species. Thus as much of the data as possible was gathered by the same protocol.
We are aware of the problems of com- bining results from different types of mating tests into a single index of isolation and of assuming that laboratory studies indicate the extent of mating discrimination in nature. For example, species that hybridize appre- ciably in the laboratory may rarely do so when sympatric in nature (this appears to be true of Drosophila pseudoobscura and D. persimilis [Dobzhansky, 1973]). Such dif- ferences may be due to the artificiality of forced confinement in the laboratory, to en- vironmental cues differing between nature and the laboratory, or to microenviron- mental differences between the species in the field that lead to encounters less frequently than expected from their co-occurrence at a given site. Finally, the periods of obser- vation differ among the various studies, ranging from one hour in choice tests to a full week in some no-choice tests. We find, however, that the strength of prezygotic iso- lation (standardized by genetic distance) does not vary significantly with the type of mating test used (Kruskal-Wallis test, H2 = 2.194, N = 90, P > 0.20). Thus, species pairs of roughly the same age show roughly the same degree of prezygotic isolation, re- gardless of the type of mating test used.
Sympatry and Allopatry. -We classified species as "sympatric" if their described ranges overlapped in any area or if both appeared in collections from the same site. In 49 of the 53 "sympatric" species pairs, both species were actually collected from the same site. We could not find collection data for the remaining four pairs of species. Species were considered to be "allopatric" if they had no geographic overlap. We did not use geographic data from the cosmo- politan D. virilis in North America; even though its New World range overlaps with that of other species in the group, it is largely confined to human habitation and may be microallopatric (Throckmorton, 1982). We did include two other pairs of sympatric
cosmopolitan species in our survey: D. sim- ulansID. melanogaster and D. annanassae/ D. pallidosa. The former pair is broadly sympatric throughout the world, but also in parts of Africa, where the pair is thought to have evolved (Lachaise et al., 1988). The species of the latter pair occur together on the island of Tutuila in Samoa, and the karyotypic, morphological, and reproduc- tive differences among South Pacific pop- ulations of D. annanassae imply that the species is not a recent introduction (Futch, 1966).
For statistical purposes, we assigned in- teger values to this category, designating sympatry as "O" and allopatry as "1." We can thus calculate an average degree of sym- patry among several related species pairs. In the phylogenetically corrected data set described below, taxa with sympatry-allo- patry values greater than 0.5 were consid- ered to be "allopatric," and those with val- ues smaller than 0.5 were considered to be "sympatric." If a phylogenetically corrected taxa pair included an equal number of sym- patric and allopatric species pairs (i.e., sym- patry-allopatry = 0.5), we excluded these data from analyses involving geography.
Phylogenetic Correction. -Levels of re- productive isolation among all species pairs are not evolutionarily independent because of their phylogenetic relatedness (Felsen- stein, 1985b). Treating each species pair as an independent datum may hence incor- rectly inflate the number of degrees of free- dom in testing the correlation between ge- netic distance and reproductive isolation. To eliminate this problem, we made phy- logenetic corrections to produce a set of ev- olutionarily and statistically independent data points (see Results).
In making these corrections, we relied on published phylogenies derived from elec- trophoretic data. With the exception of one phylogeny (the virilis group [Throckmorton, 1982]), these were taken from the compi- lation of MacIntyre and Collier (1986), who showed that electrophoretically based phy- logenies are highly correlated with those de- rived from other criteria, such as morphol- ogy or chromosome banding. Although we treated these electrophoretic phylogenies as correct, they may actually be statistically indistinguishable from other phylogenies (Felsenstein, 1985a). This problem should

SPECIATION IN DROSOPHILA 367
not systematically bias our results, because slightly incorrect phylogenies should only obscure whatever true correlations exist among genetic distance, reproductive iso- lation, and geographic overlap.
Possible Biases in the Data. - It should be noted that the electrophoretic surveys used many different gel types, buffer systems, en- zymes, and laboratory protocols, and that several techniques were used to measure mating discrimination (postzygotic isola- tion is, however, always measured in the same way). Could the use of different meth- ods by different laboratories bias our data, creating artifactual correlations between ge- netic distance and the strength of reproduc- tive isolation? While such laboratory effects introduce random error into our data, we do not see how these effects could system- atically bias our results to yield spurious correlations. Laboratory effects could pro- duce artifactual correlations between D and the strength of isolation only if the same laboratories analyzed both D and repro- ductive isolation in the same taxonomic group and erred in the same direction when measuring each quantity. This scenario is improbable. First, the same laboratories rarely measured both genetic distance and strength of isolation within a group (for ex- ample, reproductive isolation and genetic distances in the virilis group were studied 40 years apart by different laboratories). Second, even if D and reproductive isola- tion were studied by the same workers, there is no obvious reason why laboratories that underestimate D would also underestimate the strength of reproductive isolation (and vice versa). Third, there cannot be much laboratory bias in the measurements of postzygotic isolation, for different labora- tories almost always obtain the same re- sults. In over 50 years, for example, there have been no reported exceptions to the rule of sterility in male hybrids of D. pseudoob- scura and D. persimilis. In light of these points, we consider laboratory effects a source of random error but not of system- atic bias.
RESULTS
Table 1 summarizes the data on genetic distance, sympatry-allopatry, prezygotic isolation, and postzygotic isolation for each species pair (arranged by species group). To
1.5- o: n D (ster. only)
* D (inv.+ster.)
1.0 I |
0.5
O ? 0) I C,
0 U
0.0' 0.00 0.25 0.50 0.75 1.00
Postzygotic Isolation
FIG. 1. Average genetic distance (?SE) at which a given amount of postzygotic isolation arises. Hybrid- izations producing only sterile offspring (open squares) are plotted separately from those producing any invi- able offspring (filled squares).
determine whether hybrid sterility and in- viability can be treated as a single phenom- enon, we compare the rates at which these two mechanisms arise. Figure 1 shows the average genetic distance separating the pairs falling into each of the four severity classes of postzygotic isolation. Crosses yielding hybrid sterility only are displayed separate- ly from those yielding hybrid inviability only or both hybrid inviability and sterility. Any difference between these plots would reflect a difference in the evolutionary rates of ste- rility and inviability. The plots are almost congruent, showing that sterility and invi- ability evolve at similar rates. We hence- forth treat the evolution of postzygotic iso- lation as a single process.
In Figure 2, pre- and postzygotic isolation are plotted versus genetic distance for the total data (prezygotic isolation values are rounded down as noted above). Here we must deal with a statistical difficulty: data points from individual species pairs may not be evolutionarily (and hence statisti- cally) independent because of the phyloge- netic relationships among the species (Fel- senstein, 1985b). Figure 3, for example, shows a phylogenetic tree in which an initial bifurcation, producing species A and B, is followed by a bifurcation of the latter species into C and D. Reproductive isolation be- tween the pairs A-C and A-D does not nec- essarily represent two independent evolu- tionary events, but may reflect a single event: the evolution of reproductive isolation be- tween species A and B, the common ances- tor of C and D.
We dealt with this problem by employing

TABLE 1. Literature data on genetic distance (D), biogeography, and reproductive isolation (defined in text) of Drosophila species pairs. The last 13 entries are w the semispecies of D. paulistorum. We omit sympatry-allopatry values for all comparisons in which D. virilis is a human commensal. Genetic distances for the 00 virilis group were provided by L. Throckmorton (pers. comm.).
Isolation index Sympatric (0) or__ _ _ _ _ _ _ _ _ _ _ _ _ _
Species I Species 2 allopatric (1) D Prezygotic Postzygotic Referencesa
gaucha pavani 0 0.460 0.312 0.75 7, 25, 35 mesophragmatica pavani 1 0.990 - 1.00 24, 35 aldrichi mulleri 0 0.123 0.928 - 36, 45 aldrichi mojavensis 1 0.326 0.817 - 36, 45 aldrichi arizonensis 0 0.289 1.000 - 13, 36, 45 arizonensis mojavensis baja 0 0.212 0.732 0.25 36, 46, 49 arizonensis mulleri 0 0.232 1.000 - 13, 45 mojavensis mulleri 1 0.324 0.972 - 13, 45 americana virilis - 0.540 0.748 0.00 38, 43 americana lummei 1 0.540 - 0.50 43 americana novamexicana 1 0.430 0.465 0.00 38, 43 americana lacicola 1 1.420 1.000 - 38, 43 americana montana 1 1.480 0.992 1.00 38, 43 0 americana texana 0 0.010 0.242 0.00 38, 43 Z borealis flavomontana 0 0.380 - 1.00 38, 43 m borealis montana 0 0.210 - 0.50 43 z borealis littoralis 1 0.680 1.000 - 37, 43 borealis lacicola 0 0.340 1.000 - 37, 43 borealis virilis - 1.060 - 1.00 43 flavomontana montana 0 0.290 - 0.50 43 flavomontana virilis - 1.280 - 0.75 43 ? flavomontana littoralis 1 0.710 - 0.75 43 flavomontana lacicola 1 0.180 - 0.50 43 lacicola novamexicana 1 1.200 1.000 - 38, 43 lacicola texana 1 1.450 0.992 0.75 38, 43 lacicola montana 0 0.210 0.954 0.00 36, 37, 43 lacicola littoralis 1 0.660 - 0.75 43 lacicola virilis - 1.170 0.717 0.75 38, 43 littoralis montana 0 0.660 - 0.75 43 littoralis virilis - 1.060 - 0.00 38, 43 lummei virilis 0 0.350 - 0.00 43 lummei texana 1 0.640 - 0.50 43 montana novamexicana 1 1.220 1.000 0.75 38, 43 montana virilis - 1.230 0.895 0.50 38, 43 montana texana 1 1.510 0.985 0.50 38, 43 novamexicana texana 1 0.440 0.444 0.00 38, 39, 43 novamexicana virilis - 0.500 0.493 0.00 38, 43, 46

TABLE 1. Continued.
Isolation index Sympatric (0) or
Species 1 Species 2 allopatric (1) D Prezygotic Postzygotic Referencesa
texana virilis - 0.580 0.749 0.00 38, 43 differens silvestris 1 0.249 0.774 - 23 differens heteroneura 1 0.246 0.434 - 23 differens planitibia 1 0.138 0.196 0.50 11, 12,23 heteroneura planitibia 1 0.134 0.553 0.50 23 heteroneura silvestris 0 0.026 0.829 0.00 12, 23 planitibia silvestris 1 0.191 0.519 0.50 12, 23 ananassae pallidosa 0 0.091 0.897 0.00 20 bipectinata pseudoananassae 0 0.271 0.843 0.50 6,48 bipectinata parabipectinata 0 0.145 0.546 0.50 6, 48 bipectinata malerkotliana 0 0.104 0.841 0.50 6, 48 malerkotliana pseudoananassae 0 0.282 0.956 0.50 6, 48 malerkotliana parabipectinata 0 0.226 0.854 0.50 6, 48 parabipectinata pseudoananassae 0 0.366 0.764 0.50 6, 48 > mauritiana melanogaster 1 0.500 0.883 1.00 10, 41, 46 -
0 mauritiana sechellia 1 0.320 - 0.50 10, 14 z mauritiana simulans 1 0.300 0.607 0.50 10,29,41,46 melanogaster sechellia 1 0.620 - 1.00 10, 14 z melanogaster simulans 0 0.550 0.914 1.00 10, 42, 46 sechellia simulans 1 0.280 - 0.50 10, 14 o athabasca EA athabasca EB 0 0.024 0.169 0.00 22, 33 athabasca WN athabasca EA/EB 0 0.124 0.994 0.00 22, 33 affinis tolteca 1 1.440 0.724 1.00 27, 28, 32 affinis athabasca 0 0.740 0.776 - 27, 28, 32 affinis azteca 0 0.850 1.000 - 27, 28, 32 affinis narragansett 0 0.970 0.985 - 27, 28, 32 affinis algonquin 0 0.740 1.000 - 27, 28, 31 algonquin athabasca 0 0.650 0.988 - 27, 28, 32 algonquin tolteca 1 1.250 0.932 1.00 27, 28, 32 algonquin azteca 0 1.250 1.000 - 27, 28, 32 athabasca tolteca 1 1.250 0.615 1.00 27, 28, 32 athabasca narragansett 0 1.100 0.960 1.00 27, 28, 32 athabasca azteca 0 1.250 0.507 1.00 17, 27, 28, 32 azteca narragansett 1 0.970 0.991 1.00 27, 28, 32 azteca tolteca 0 1.100 0.563 0.25 27, 28, 32 narragansett tolteca 1 0.970 0.913 1.00 27, 28, 32 ambigua persimilis 1 1.660 - 1.00 9, 27, 28 ambigua pseudoobscura 1 1.660 - 1.00 27, 28 w bifasciata miranda 1 1.810 0.980 - 16, 27, 28 0>

TABLE 1. Continued.
Sympatric (0) or Isolation index
Species 1 Species 2 allopatric (1) D Prezygotic Postzygotic Referencesa
bifasciata pseudoobscura 1 1.810 0.942 - 16, 27, 28 bifasciata imaii 0 0.560 0.969 0.50 16, 28, 34 bifasciata subobscura 1 1.180 0.936 - 6, 16, 48 bifasciata persimilis 1 1.810 0.980 - 16, 27, 28 imaii persimilis 1 1.950 0.980 - 16, 27, 28 imaii subobscura 1 1.100 0.980 - 16, 27, 28 imaii miranda 1 1.950 0.969 - 16, 27, 28 imaii pseudoobscura 1 1.950 0.726 - 16, 27, 28 loweii pseudoobscura 0 1.050 - 1.00 21, 27, 28 miranda pseudoobscura 0 0.560 0.990 1.00 16, 27, 28 miranda persimilis 0 0.560 1.000 1.00 16, 27, 28 miranda subobscura 1 1.950 0.947 - 16, 27, 28 persimilis subobscura 1 1.660 0.990 - 16, 27, 28 persimilis pseudoobscura 0 0.410 0.953 0.50 16, 27, 28 g pseudoobscura subobscura 1 1.660 0.958 - 16, 27, 28 < pseudoobscura Bogota pseudoobscura USA 1 0.194 0.222 0.25 1, 40 Z kikkawai leontia 0 0.419 - 0.50 5,44 equinoxialis paulistorum 0 0.621 0.938 - 4, 8 z equinoxialis insularis 1 1.090 0.924 - 4, 15 equinoxialis willistoni 0 0.656 0.997 - 4, 8 equinoxialis tropicalis 0 0.665 1.000 - 4, 8 > insularis tropicalis 1 0.883 0.930 1.00 4 O insularis willistoni 0 1.070 0.915 - 4, 15 insularis paulistorum 1 1.270 0.968 - 4, 15 paulistorum pavlovskiana 0 0.232 - 0.50 4 paulistorum willistoni 0 0.524 1.000 - 4, 8 paulistorum tropicalis 0 0.609 0.474 - 4, 8 tropicalis willistoni 0 0.413 0.979 - 4, 8 equinoxialis caribbensis equioxialis equinoxialis 1 0.246 0.205 0.50 3 willistoni quechua willistoni willistoni 1 0.214 0.299 0.25 2 paulistorum Amazonian paulistorum Andean-Brazilian 0 0.170 0.860 0.75 4, 18, 19 p. Amazonian p. Centroamerican 0 0.152 0.820 0.50 4, 18, 19 p. Amazonian p. Orinocan 0 0.189 0.807 - 4, 18, 19 p. Andean-Brazilian p. Orinocan 0 0.165 0.800 0.50 4, 18, 19, 30 p. Andean-Brazilian p. Transitional 0 0.067 0.707 0.00 4, 19, 30 p. Andean-Brazilian p. Interior 0 0.127 - 0.25 4, 19 p. Andean-Brazilian p. Centroamerican 1 0.071 0.646 0.50 4, 19, 30 p. Centroamerican p. Transitional 1 0.043 - 0.00 4, 19 p. Centroamerican p. Interior 1 0.127 - 0.50 4, 19
SPECIATION IN DROSOPHILA 371
0 r 0l ~- 0~ 0
0~~~~~~~~~~"
~o 0 00 r- o-
o ~~~~~~~'00W)o 00
o 0 N ~~~~~~~~0C'
0~~~~~~ 0~~~~~~~~~~~~~~~0 0
Q 0 a,-00r
co o 04 0 m~~cC a, l
0 0
000
~~~ 00 ~~~~~~~~C)0 o ~~~~~~~~~~') o q
LL~~~~ ..~~~~OCa, I.
CIS 'It C 0S0 0 1 0
O -0 ' 0 CI
0 4 - 0 Cl
0 r~~~~- r 0 co r
co 0 col'
0 ~o ( 7 -
00 -. c
Ho Cl 4 co 00 U 0a
- M
C 1.00 AAA AA AA A A 0 ._
0.75 -AM~ AA AAAMAA LA M AM A A A A
a)
Cn
o 0.50 AAA U AA A A.
0.
>~ 0.25 ̂ ax
0.00- 0.0 0.5 1.0 1.5 2.0
A Genetic Distance (D)
C 1.00 ..A AAA AALAA A LA A
o 0.75 A A AA AAA A
Cn .2 0.50 - M IAA A A A A
0
>1 0.25 -AAL A
0 0L 0.00
0.0 0.5 1.0 1.5 2.0 B Genetic Distance (D)
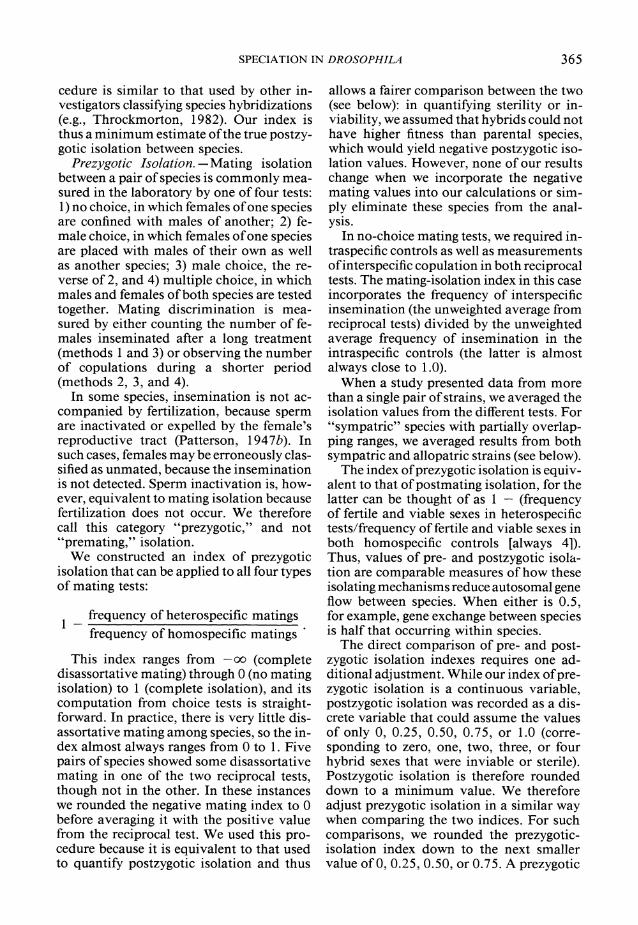
FIG. 2. Strength of isolation plotted versus the ge- netic distance (D) between taxa (uncorrected data). A) Prezygotic isolation (rounded down); B) postzygotic isolation.
a procedure recommended by Felsenstein (1985a). This method permits only one comparison between species on either side of a phylogenetic bifurcation. We averaged together all comparisons between pairs of species spanning a node to produce a single estimate of genetic distance, pre- and post- zygotic isolation, and degree of sympatry. For example, in Figure 3 there are three possible comparisons between species pairs: A versus C, A versus D, and C versus D. The first two comparisons, however, may not be independent. We therefore obtain one data point by calculating average genetic distances, pre- and postzygotic isolation in- dices, and sympatry-allopatry values of the A-C and A-D comparisons. The compari- son between C and D is, however, indepen- dent of the others, because it reflects iso- lation evolving after the divergence of A and B. We dealt with unresolved trichotomies by averaging values from all three species.
Data on pre- and postzygotic isolation

372 J. A. COYNE AND H. A. ORR
|B
FIG. 3. Sample phylogeny used to show method of phylogenetic correction. See text for explanation.
were pooled separately, because informa- tion about both forms of isolation was sometimes unavailable for a given species pair. These pooled data are termed "cor- rected," and they represent the fewest pos- sible evolutionarily independent data points. Phylogenetic pooling reduced our sample from 119 to 42 comparisons in both the corrected prezygotic and postzygotic data sets (these data sets do, however, include some different species pairs). We present statistical results from only the corrected data. Phylogenetic correction did not qual- itatively alter our results: the statistical sig- nificance of every test (P greater or less than 0.05), though not the exact level of signifi- cance, was consistent for the corrected and uncorrected data.
Prezygotic isolation and postzygotic iso- lation are plotted separately versus genetic distance from the corrected data in Figure 4. Both forms of isolation are significantly correlated with Nei's D (prezygotic: Ken- dall's T = 0.272, N = 42, P < 0.02; post- zygotic: T = 0.569, N= 42, P < 0.001).
The patterns of pre- and postzygotic iso- lation differ: in both the corrected and un- corrected data sets, prezygotic isolation in- creases more quickly at relatively low genetic distances. Both forms of isolation level off at higher genetic distances. Because we are most interested in the beginning of specia- tion and because reproductive isolation must reach an asymptote at higher genetic dis- tances, we limit our comparison of pre- and postzygotic isolation to those species pairs
o 1.00- A AA
A A A
O 0.75 A. AL A "M A AA A
A A
.2 0.50 AAAA
o A
N 0.25 A A a)
0.00' 0.0 0.5 1.0 1.5 2.0
A Genetic Distance (D)
o 1.00 A AAA A A
o 0.75 A A CO ~~~~~~~~A
A A
Z 0.50 .AA A A
0
0)
CO
0.00* 0.0 0.5 1.0 1.5 2.0
B Genetic Distance (D)
FIG. 4. Strength of isolation versus genetic distance (D) between taxa, plotted using corrected data. A) Pre- zygotic isolation (rounded down); B) postzygotic iso- lation.
separated by low genetic distances (D ? O. 5; this value was chosen before data were ana- lyzed, but lower threshholds produce qual- itatively similar results). This comparison shows significantly greater prezygotic iso- lation than postzygotic isolation (Mann- Whitney U test: Z = 2.541, N1 = 26, N2 = 29, P < 0.01; all probabilities two-tailed). This result is not an artifact of different av- erage genetic distances among the species pairs in the pre- and postzygotic data sets, for the average D's are nearly identical (Dprezygotic = 0.209 + 0.025, N = 26; Dpostzygotic = 0.201 ? 0.024, N = 29). Sim- ilarly, if one compares the strength of pre- and postzygotic isolation for each species pair at D < 0. 5, more pairs have greater pre- than postzygotic isolation than is ex- pected by chance (uncorrected data, Wil- coxon's sign rank test: Z = 2.189, N= 32, P < 0.05; this test cannot be performed on the corrected data, because the pre- and postzygotic data sets include some different

SPECIATION IN DROSOPHILA 373
species pairs). We note that this result does not depend upon the accuracy (or even the existence) of the molecular clock: within any pair of species, there has been exactly as much time for the evolution of pre- and postzygotic isolation.
The rates at which pre- and postzygotic isolation evolve can provide information about whether these forms of isolation re- sult from different genetic mechanisms. Charlesworth et al. (1987) have proposed that the initial stages of postzygotic isolation result from the rapid accumulation of re- cessive or partially recessive alleles (h [the dominance coefficient] < 0.5) at sex-link- ed loci causing sterility or inviability of the heterogametic sex in reciprocal hybrid- izations. Under this hypothesis, it can be shown that genes causing sterility or invi- ability in females will accumulate more slowly than those causing sterility or invi- ability in males (Coyne and Orr, 1989). These theories predict that: a) classes 0.25 and 0.50 of postzygotic isolation consist largely of species pairs obeying Haldane's rule; b) classes 0.25 and 0.50 evolve fairly rapidly; c) assuming an appreciable fre- quency of recessive or partially recessive mutations, the transition from class 0.50 to class 0.75 (the latter must include female effects) is slower than the transition from class 0 to class 0.25. There is no analogous genetic model predicting the course of pre- zygotic isolation with time.
Prediction a is fulfulled: classes 0.25 and 0.50 consist almost entirely of hybridiza- tions obeying Haldane's rule (in the cor- rected data, 19 of 21 pairs in these classes have sterility and inviability limited to male hybrids; in the uncorrected data, the cor- responding numbers are 37 of 43 pairs). This shows that male hybrids in both reciprocal crosses are almost always affected before fe- male hybrids in either cross. This result can- not be inferred from the simple observation of Haldane's rule, which could result from males and females from one reciprocal cross becoming sterile or inviable before males and females from the other (with male ef- fects preceding female effects in each cross).
In addition, there are very few species pairs separated by low genetic distances that fall into classes 0.75 or 1.00, which must include female effects. Of the 47 species pairs with D < 0.5, only four belong to these two
TABLE 2. Mean and standard error of genetic distance at which a given level of post- and prezygotic isolation occurs in Drosophila, using corrected data (isolation indices are rounded down to nearest 0.00, 0.25, 0.50, 0.75, or 1.00). Groups spanned by vertical lines are homogeneous by Scheffe's F test.
Mean genetic distance ? SE (N) Isolation index Postzygotic Prezygotic
0.00 0.138 ? 0.058 (8) 0.122 ? 0.046 (5) 0.25 0.251 ? 0.083 (5) 0.370 ? 0.078 (3) 0.50 0.249 ? 0.032 (16) 0.257 ? 0.080 (5) 0.75 - 0.722 ? 0.198 (5) 0.578 ? 0.098 (24) 1.00 1 0.991 ? 0.127 (8) 0.523 ? 0.089 (5)
postzygotic isolation classes. Thus, Hal- dane's rule does not result from a combi- nation of two evolutionary processes, one of which produces sterility and inviability in males only (followed by females) with the other producing sterility and inviability si- multaneously in both sexes in both recip- rocal crosses. Rather, male-limited sterility/ inviability in both reciprocal crosses ap- pears to be the ubiquitous first step in the evolution of postzygotic isolation.
To test predictions b and c above, we cal- culate the average genetic distance at which a given level of pre- or postzygotic isolation appears (Table 2). Note that for postzygotic isolation, classes 0.25 and 0.50 arise at low genetic distances, but the transition from class 0.50 to class 0.75 requires substan- tially more genetic distance. Post hoc anal- ysis shows that the only significant jump in genetic distance between adjacent classes occurs between classes 0.50 and 0.75, as predicted (in fact, all comparisons spanning the 0.50-0.75 boundary are significant ex- cept the class 0.25 versus 0.75 comparison, in which both samples are very small). In sum, hybridizations obeying Haldane's rule are on average much younger than those showing female sterility or inviability, con- firming the predictions of Charlesworth et al. (1987). We emphasize that this interpre- tation does not depend on a linear relation- ship between genetic distance and time but requires only a positive correlation between genetic distance and time.
There is no analogous stalling of prezy- gotic isolation at class 0.50 (see Table 2). In fact, Scheffe's F test (Sokal and Rohlf, 1 98 1 p. 253) reveals no significant jump in ge-

374 J. A. COYNE AND H. A. ORR
1.00 A o A ~~~~~~~A A
o 0.75
la A
o 0.50 A
O Allopatric Taxa > 0.25 - N AA a)
0.00
0.0 0.5 1.0 1.5 2.0
A Genetic Distance (D)
U 1.00 .. * tA
A0 AA
0.75- e
, 0.50 0. Sympatric Taxa
>% 0.25- . N -
X 0.00 0.0 0.5 1.0 1.5 2.0
B Genetic Distance (D)
FIG. 5. A) Prezygotic isolation plotted versus ge- netic distance (D) among allopatric taxa using corrected data; B) prezygotic isolation plotted versus D among sympatric taxa using corrected data.
netic distance between any prezygotic iso- lation classes, adjacent or not.
We can next compare the evolutionary rates of reproductive isolation in allopatric versus sympatric species pairs from the cor- rected data (Fig. 5; exact instead of rounded prezygotic isolation indices are shown, be- cause we do not compare them with the discrete postzygotic isolation values). All cases of strong prezygotic isolation at low genetic distances occur in species pairs that are sympatric. At D < 0.5, there are no cases of prezygotic isolation greater than 0.75 among the corrected allopatric species pairs, but there are 12 such cases among the 17 sympatric species pairs (in the uncorrected data, there are only four such cases among 15 allopatric species pairs, but 20 cases among the 26 sympatric pairs). The mean degree of premating isolation for sympatric pairs at D < 0.5 (0.768 ? 0.065, N = 17) is more than twice as large as that for al- lopatric pairs (0.365 ? 0.067, N = 7).
1.00 AAAA A-AAA AA .L j A M A l A AAA A A,,6 A AA
C AA AA A o AA A 0.75 A A AU
0 A A
- 0.50 *A A
0 F- 0.25 i
0.00 0.0 0.5 1.0 1.5 2.0
Genetic Distance (D)
FIG. 6. "Total" reproductive isolation (T) versus genetic distance.
The greater prezygotic isolation in sym- patry than in allopatry can be demonstrated in several other ways. a) There is a signifi- cant difference between the strength of pre- zygotic isolation in sympatric and allopatric species pairs at low genetic distances (D < 0.5) (Mann-Whitney U test: Z = 2.890, N, = 17, N2 = 7, P < 0.01). This result is not an artifact of differences in genetic distances between allopatric and sympatric species pairs, as they do not differ (Dallopatric = 0.241 ?0.038, N= 7; Dsympatrc = 0.199 ? 0.034, N = 17). b) Significantly more sympatric than allopatric species pairs have greater pre- than postzygotic isolation (G2 = 10.64, P < 0.01): in allopatry, two species pairs have greater pre- than postzygotic isolation, and four have greater post- than prezygotic iso- lation (five species pairs are tied). However, in sympatry, 15 species pairs have greater pre- than postzygotic isolation while only one has greater post- than prezygotic (four are tied). c) Similarly, the previously noted result that prezygotic isolation is greater than postzygotic isolation within species pairs at D < 0.5 is attributable entirely to sympatric taxa: there is no significant difference be- tween the strength of pre- and postzygotic isolation within allopatric species pairs (Wilcoxon's signed rank test Z = 1.19, N = 11, P > 0.2). In sympatry, however, many more species pairs have greater pre- than postzygotic isolation than is expected by chance (Wilcoxon's Z = 3.01 1, N = 20, P < 0.01). We note that tests b and c do not depend upon the accuracy or even the ex- istence of the molecular clock, because, as noted above, these are tests within pairs of species.

SPECIATION IN DROSOPHILA 375
It appears that premating isolation evolved faster among sympatric than among allopatric pairs of species. Similar analysis shows that geographic overlap has no effect on the strength of postzygotic isolation (Mann-Whitney U test on corrected data: Z = 0.052, N1 = 18, N2 = 10, P > 0.90). We consider processes that could produce these patterns in the Discussion.
Finally, we may combine indices of pre- and postzygotic isolation to measure the evolutionary rate of "total" reproductive isolation. Assuming that the two forms of isolation act sequentially (and hence mul- tiplicatively) within a species pair, the ap- propriate index is
T= Pre + (1 - Pre) x Post
where T is total isolation, Pre is prezygotic isolation, and Post is postzygotic isolation.
Total isolation is plotted versus genetic distance in Figure 6 (to improve accuracy, we used exact values of prezygotic isola- tion). This plot includes several data points from species pairs having prezygotic isola- tion greater than 0.90 but no information about postzygotic isolation. In such cases we set "total" isolation equal to the level of prezygotic isolation, because the maximum possible error in these cases is only 10%. Total isolation is strongly correlated with genetic distance (r = 0.350, N = 91; P < 0.00 1). High values of total isolation are frequent at low genetic distances; this is at- tributable largely to strong mating discrim- ination between closely related sympatric species. At higher genetic distances, almost all species pairs show strong reproductive isolation.
DIscusSION Our survey of the literature yields five
major observations. First, both pre- and postzygotic reproductive isolation increase with divergence time between taxa. Second, prezygotic isolation evolves faster than postzygotic isolation. This difference, how- ever, is completely attributable to higher prezygotic isolation between sympatric species. Third, hybrid sterility and invia- bility evolve at similar average rates. Fourth, the usual pathway for the evolution of postzygotic isolation is the early appearance of sterility or inviability in male hybrids
from both reciprocal crosses, followed by the appearance of these anomalies in female hybrids. Fifth, there is a large jump in ge- netic distance between hybridizations pro- ducing sterile or inviable males only (cases of Haldane's rule) and hybridizations yield- ing female effects as well. We discuss these conclusions in turn.
i) Prezygotic isolation and postzygotic iso- lation increase with time. -This is the con- ventional wisdom about speciation, pre- dicted by any theory that reproductive isolation results from gradual genetic change within populations. Indeed, the only theo- ries refuted by this observation are those of special creation and instantaneous specia- tion (e.g., by infectious agents). We also note that "total" reproductive isolation increases with time, so that at high genetic distances all taxa are strongly isolated.
Two previous studies used similar meth- ods to delineate the course of speciation. Zouros (1973) correlated genetic distance with hybrid inviability or sterility in 12 pairs of Drosophila species. He found that Nei's D was significantly correlated with invia- bility but not with sterility. Assuming that electrophoretic loci represent a random sample of genes altered by natural selection, Zouros concluded that inviability requires far more genetic change than sterility. His 12 data points, however, are not phyloge- netically independent, and Zouros' corre- lations become nonsignificant when we ap- ply Felsenstein's (1985a) correction.
In a study of the Drosophila willistoni group, Ayala (1975) showed that genetic distance was correlated with taxonomic rank (i.e., populations of a species are separated by lower D values than subspecies within a species, which in turn are less differentiated than sibling species, etc.). Like Zouros (1973), Ayala apparently assumed that elec- trophoretic divergence between taxa reflects genetic change caused by natural selection. Under this assumption, Nei's genetic dis- tance is an index of the amount of genomic change required to achieve a given taxo- nomic status.
Our work differs from that of Zouros and Ayala in several respects. First, we examine factors not considered by these workers, in- cluding geographic distribution, pre- versus postzygotic isolation, and sex differences in

376 J. A. COYNE AND H. A. ORR
Rllopatry SympaIry
0.63 (0.67)
Pre-
PaSt- 0.35 (0.42) 0 _ - _ _ _ _ _ 0.34 (1.38)
0.21 (0.40) I FIG. 7. Average strength of pre- and postzygotic
isolation in allopatric versus sympatric species pairs. Only species pairs with Nei's D c 0.5 are included. Prezygotic values are rounded down as described in text. The first mean is from the corrected data; the mean in parentheses is from uncorrected data. Values connected by solid lines are significantly different by the Mann-Whitney U test (P < 0.05), and those con- nected by broken lines are not significantly different (the statistical significance does not differ using cor- rected or uncorrected data).
hybrid sterility and inviability. Second, we consider electrophoretic differentiation be- tween taxa as a measure of their divergence time and not of the effects of selection. (Ayala [1975], for instance, observed that in the willistoni group, the average genetic dis- tance between subspecies was similar to the genetic distance between semispecies. As- suming that semispecies are older than sub- species [because the former show premating isolation while the latter do not], he con- cluded that the evolution of premating iso- lation does not require much additional ge- netic change. We conclude, on the other hand, that these subspecies and semispecies are equally old, and we propose that the higher prezygotic isolation among semispe- cies results more from reinforcement in sympatry than from age.) While electropho- retic genetic distance is surely correlated both with time of divergence and with ge- netic change caused by natural selection, Ki- mura (1983) argues convincingly that the former correlation exceeds the latter.
ii) Prezygotic isolation evolves more rap- idly than postzygotic isolation in sympatric species pairs, but not in allopatric pairs. - At low genetic distances we find strong pre- zygotic isolation far more often than strong postzygotic isolation. It is remarkable that in our corrected data, every case of strong
prezygotic isolation at low genetic distances occurs in a pair of species that is sympatric. In allopatric populations, however, there is no significant difference between the evo- lutionary rates of pre- and postzygotic iso- lation (Fig. 7). In geographically isolated populations, then, both forms of isolation are significant components of speciation.
There are three possible explanations of heightened reproductive isolation among sympatric species pairs. The first is that in- trogression of enzyme alleles among a sym- patric pair may artificially lower the genetic distance between them. Reproductive iso- lation may thus appear to be "enhanced" in sympatry merely because sympatric taxa are older than allopatric taxa of the same genetic distance. This hypothesis, however, fails to explain why prezygotic but not postzygotic isolation is greater among sym- patric than among allopatric taxa. Because both forms of isolation increase with genetic distance between allopatric taxa, both forms should appear to be enhanced in sympatry under the introgression hypothesis. They are not.
Second, as we noted in the Introduction, a pattern of enhanced prezygotic isolation could result from a process of fusion or ex- tinction in sympatry. If allopatric species pairs differ from each other in the strength of prezygotic isolation, less-isolated species are more likely to fuse or drive each other extinct if they become sympatric. As Tem- pleton (1981) notes, this mechanism could produce-without any reinforcement-a pattern of higher average prezygotic isola- tion among sympatric species.
However, several features of our data do not support the fusion/extinction hypothe- sis. Again, we find that only prezygotic iso- lation increases in sympatry although pre- and postzygotic isolation are equally strong in allopatric species (Fig. 7). This pattern is predicted by the reinforcement hypothesis. The fusion/extinction hypothesis, however, predicts that both pre- and postzygotic iso- lation will be stronger in sympatry, because any factor that reduces gene flow should inhibit fusion or extinction. Second, the fu- sion/extinction hypothesis predicts that de- grees of prezygotic isolation observed among sympatric species form a subset of degrees seen among allopatric species pairs (sym-
SPECIATION IN DROSOPHILA 377
patric species pairs were once strongly iso- lated allopatric pairs). We do not observe this pattern. Instead, sympatric species show a high degree of isolation not seen among allopatric pairs.
The pattern of elevated prezygotic (but not postzygotic) isolation between sympat- ric species is predicted only by the hypoth- esis that natural selection has reinforced mating discrimination among some sym- patric species. Selection against the disad- vantageous results of hybridization can se- lect for increased mating discrimination in sympatry (Dobzhansky, 1937), but such se- lection is very unlikely to affect the amount of postzygotic isolation in Drosophila (Coyne, 1974). Two previous studies sug- gest the possibility of reinforcement for pre- zygotic isolation: in Drosophila species with partially overlapping ranges, mating isola- tion is greater between individuals taken from sympatric than from allopatric pop- ulations (Wasserman and Koepfer, 1977; Ehrman and Powell, 1982).
There are several ways that such rein- forcement can evolve.
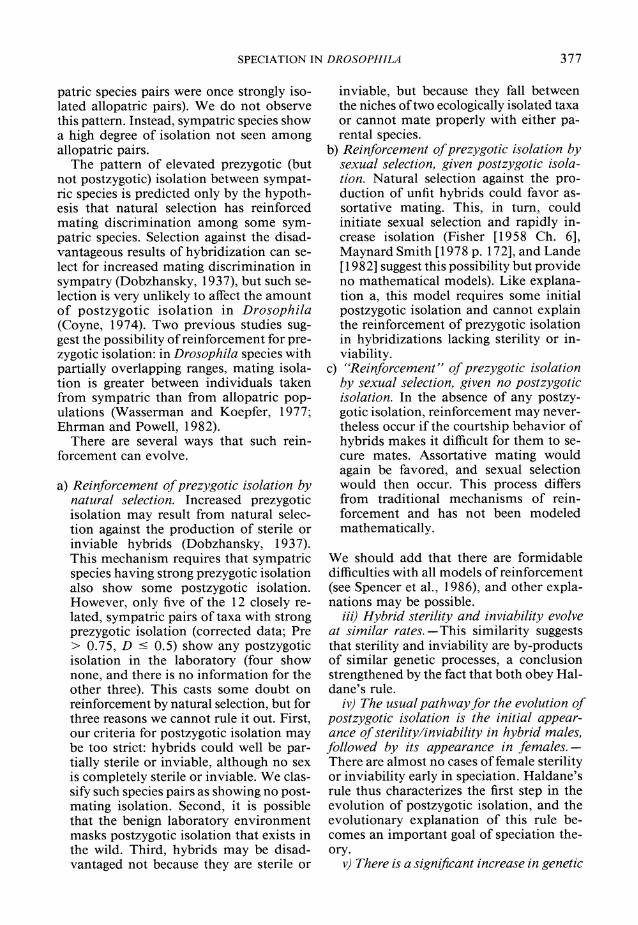
a) Reinforcement of prezygotic isolation by natural selection. Increased prezygotic isolation may result from natural selec- tion against the production of sterile or inviable hybrids (Dobzhansky, 1937). This mechanism requires that sympatric species having strong prezygotic isolation also show some postzygotic isolation. However, only five of the 12 closely re- lated, sympatric pairs of taxa with strong prezygotic isolation (corrected data; Pre > 0.75, D < 0.5) show any postzygotic isolation in the laboratory (four show none, and there is no information for the other three). This casts some doubt on reinforcement by natural selection, but for three reasons we cannot rule it out. First, our criteria for postzygotic isolation may be too strict: hybrids could well be par- tially sterile or inviable, although no sex is completely sterile or inviable. We clas- sify such species pairs as showing no post- mating isolation. Second, it is possible that the benign laboratory environment masks postzygotic isolation that exists in the wild. Third, hybrids may be disad- vantaged not because they are sterile or
inviable, but because they fall between the niches of two ecologically isolated taxa or cannot mate properly with either pa- rental species.
b) Reinforcement of prezygotic isolation by sexual selection, given postzygotic isola- tion. Natural selection against the pro- duction of unfit hybrids could favor as- sortative mating. This, in turn, could initiate sexual selection and rapidly in- crease isolation (Fisher [1958 Ch. 6], Maynard Smith [1978 p. 172], and Lande [1982] suggest this possibility but provide no mathematical models). Like explana- tion a, this model requires some initial postzygotic isolation and cannot explain the reinforcement of prezygotic isolation in hybridizations lacking sterility or in- viability.
c) "Reinforcement" of prezygotic isolation by sexual selection, given no postzygotic isolation. In the absence of any postzy- gotic isolation, reinforcement may never- theless occur if the courtship behavior of hybrids makes it difficult for them to se- cure mates. Assortative mating would again be favored, and sexual selection would then occur. This process differs from traditional mechanisms of rein- forcement and has not been modeled mathematically.
We should add that there are formidable difficulties with all models of reinforcement (see Spencer et al., 1986), and other expla- nations may be possible.
iii) Hybrid sterility and inviability evolve at similar rates. -This similarity suggests that sterility and inviability are by-products of similar genetic processes, a conclusion strengthened by the fact that both obey Hal- dane's rule.
iv) The usual pathway for the evolution of postzygotic isolation is the initial appear- ance of sterility/inviability in hybrid males, followed by its appearance in females. - There are almost no cases of female sterility or inviability early in speciation. Haldane's rule thus characterizes the first step in the evolution of postzygotic isolation, and the evolutionary explanation of this rule be- comes an important goal of speciation the- ory.
v) There is a significant increase in genetic

378 J. A. COYNE AND H. A. ORR
distance between those species pairs produc- ing sterile or inviable males only and those producing sterile or inviable hybrids of both sexes. -As noted above, almost all species pairs belonging to our postzygotic classes 0.25 and 0.50 show effects limited to hybrid males. Classes 0.75 and 1.00, on the other hand, include female effects. The large jump in genetic distance between class 0.50 and 0.75 is hence associated with the appear- ance of postzygotic isolation in females and represents a "stalling" between male-only and female effects. Prezygotic isolation, on the other hand, shows no significant jump between any two adjacent classes (or, in fact, between any classes). The "stalling" be- tween the appreance of male and female effects confirms several predictions of the Charlesworth et al. (1987) and Coyne and Orr (1989) theories, which we discuss in turn.
The observation that Haldane's rule is an early stage of speciation resolves a potential difficulty in interpreting genetic analyses of reproductive isolation. Such analyses al- most always reveal a disproportionately large effect of the X chromosome on hybrid sterility and inviability (Wu and Becken- bach, 1983; Charlesworth et al., 1987). As Charlesworth et al. (1987) note, it is possible that this large effect of the X chromosome is observed merely because autosomal al- leles causing hybrid sterility/inviability are more likely to affect both sexes, yielding species pairs that cannot be genetically ana- lyzed (some viable and fertile hybrids are required for genetic studies). There could thus be an empirical bias favoring detection of X-chromosome effects, and analyzable cases of postzygotic isolation (usually those obeying Haldane's rule) would not neces- sarily represent taxa undergoing the first steps of speciation.
We find, however, that hybridizations showing sterility or inviability of both sexes are much older than those obeying Hal- dane's rule. The ubiquity of Haldane's rule in recently diverged pairs of species suggests that the large effect of the X chromosome does not result from a biased sample of crossable species. It also implies that there are not two distinct evolutionary pathways in speciation, one causing effects in hybrid males only and the other in both sexes si- multaneously. Rather, there appears to be
a single evolutionary pathway that culmi- nates in the sterility and/or inviability of all hybrids.
This pathway, however, is characterized by two phases: an initial accumulation of alleles causing postzygotic isolation in male hybrids, followed by accumulation of alleles causing isolation in female hybrids. Such a pathway is predicted by the theories of Charlesworth et al. (1987) and Coyne and Orr (1989). However, these theories require the assumption that the genetic basis of postzygotic isolation differs fundamentally from that of other observable differences between species (the latter are usually caused by additive substitutions spread throughout the genome). There is no independent evi- dence for this assumption.
Our postzygotic-isolation data also ex- plain why cases of Haldane's rule are so numerous. Bock (1984), for example, shows that over half of all successful Drosophila hybridizations are cases of Haldane's rule (the other crosses yield hybrid effects in- volving both males and females). Haldane (1922) noted that cases of hybrid unisexual inviability or sterility almost invariably in- volve males, but he did not explain why such a large proportion of hybridizations show this pattern instead of sterility or in- viability of both sexes. The obvious expla- nation is that the delayed evolution of fe- male anomalies stalls many species pairs at the stage of Haldane's rule.
We note parenthetically that we observe no cases of sterility/inviability of both males and females in only one direction of hy- bridization at low genetic distances [D < 0.5]. One might expect such patterns if cy- toplasmic factors were frequently respon- sible for postzygotic isolation.
vi) The systematic status of allopatric taxa. -Our data provide us with a protocol for deciding when allopatric taxa are dis- tinct species. The strength of isolation be- tween sympatric species is obviously suffi- cient for them to remain distinct. A reasonable conclusion is that allopatric taxa with reproductive isolation as strong as that between sympatric species should also re- main distinct upon secondary contact. The mean level of total isolation among sym- patric species pairs is 0.907 ? 0.026 (un- corrected data, N = 44). The lower bound of the 95% confidence interval about this

SPECIATION IN DROSOPHILA 379
mean is 0.854. Thus, total isolation of 0.85 or greater is probably enough to prevent the fusion of allopatric taxa upon secondary contact.
This calculation can be applied to the dif- ficult problem of how to use the biological species concept (Mayr, 1963) with allopatric taxa. We suggest that any two allopatric taxa with values of total isolation below this cut- off be regarded as conspecific (there are sev- eral of these in our data). If, however, re- productive isolation is increased by selection upon secondary contact, our criterion is too conservative, and taxa below the cutoff may nevertheless remain distinct once sympat- ric. Conversely, any allopatric taxa with iso- lation above this level can be regarded as distinct species that would maintain their integrity upon secondary contact.
Finally, we estimate the genetic distance required to attain species status, i.e., to reach a "total isolation" value of 0.85. We cal- culated second-order least-squares regres- sions of "total isolation" on genetic dis- tance, forcing these regressions through the origin. This assumes that two species begin as populations that differ by very low D's (as is commonly observed). Regressions were performed on the uncorrected data, using data from all species pairs, allopatric pairs alone, and sympatric pairs alone. These equations were then solved for the value of genetic distance predicting a "total isola- tion" of 0.85. These D's were 0.53 for the total data, 0.66 for allopatric species, and 0.31 for sympatric species. Species status is therefore reached twice as quickly in sym- patric as in allopatric taxa. It is difficult to estimate the absolute time corresponding to these values, because the molecular clock is not well calibrated for Drosophila. Nei (1987), however, suggests that in many or- ganisms, a D value of 1 corresponds roughly to 5,000,000 years of divergence. This cal- ibration would place the time required for speciation between 1,500,000 and 3,500,000 years. This is, of course, a rule of thumb, and there are taxa that attain species status at D's well below the mean values given here. (In fact, over 15% of all sympatric taxa with total isolation exceeding 0.85 are sep- arated by genetic distances smaller than 0. 20, implying a divergence time of less than 1,000,000 years.)
In sum, we find that in allopatric taxa
both pre- and postzygotic isolation contrib- ute significantly to reproductive isolation, so that no single isolating mechanism is the "stuff of speciation." In sympatric taxa, however, prezygotic isolation predomi- nates, perhaps implying direct selection for mate discrimination. We note, however, that the evolution of enhanced prezygotic iso- lation may be triggered by postzygotic iso- lation. Even in sympatry, then, both types of isolation may play important roles in spe- ciation.
The recognition of patterns in nature is the source of most evolutionary theory. Theories of speciation, however, require historical information about the evolution of reproductive isolation, and are therefore slow to bear fruit. We hope that further syn- thesis of genetic analysis with estimates of divergence time will reveal patterns clari- fying Darwin's "mystery of mysteries," the origin of species.
ACKNOWLEDGMENTS
We thank M. L. Cariou, D. Lachaise, and L. Throckmorton for permission to cite their unpublished data, B. Hedges for calculating some genetic distances, and S. Arnold, B. Charlesworth, D. Futuyma, B. Grant, R. Lande, S. Orzack, D. Schemske, M. Turelli, P. Verrell, M. Wade, and P. Ward for crit- icism of the manuscript. This work was sup- ported by grants from the National Insti- tutes of Health (GM 32221 and 38462), National Science Foundation (BSR 18558), and the Louis Block Fund of The University of Chicago.
LITERATURE CITED
AYALA, F. J. 1975. Genetic differentiation during the speciation process. Evol. Biol. 8:1-78.
AYALA, F. J., AND TH. DOBZHANSKY. 1974. A new subspecies of Drosophila pseudoobscura (Diptera: Drosophilidae). Pan-Pac. Entomol. 50:211-219.
AYALA, F. J., AND M. L. TRACEY. 1973. Enzyme vari- ability in the Drosophila willistoni group. VIII. Ge- netic differentiation and reproductive isolation be- tween two subspecies. J. Hered. 64:120-124.
AYALA, F. J., M. L. TRACEY, L. G. BARR, AND J. G. EHRENFIELD. 1974a. Genetic and reproductive dif- ferentiation of subspecies, Drosophila equinoxialis caribbensis. Evolution 28:24-41.
AYALA, F. J., M. L. TRACEY, D. HEDGECOCK, AND R. C. RICHMOND. 1974b. Genetic differentiation during the speciation process in Drosophila. Evo- lution 28:576-592.

380 J. A. COYNE AND H. A. ORR
BAIMI, V., S. KITTHAWEE, AND C. CHUMCHONG. 1980. Cytogenetic relationships of three sibling species of the Drosophila kikkawai complex. Jap. J. Genet. 55:177-187.
BOCK, I. R. 1978. The bipectinata complex: A study in interspecific hybridization in the genus Drosoph- ila (Insecta: Diptera). Austr. J. Biol. Sci. 31:197- 208.
1984. Interspecific hybridization in the genus Drosophila. Evol. Biol. 18:41-70.
BRNCIC, D., AND S. KOREF SANTIBANEZ. 1957. The mesophragmatica group of species of Drosophila. Evolution 11:300-310.
BURLA, H., A. BRITO DA CUNHA, A. R. CORDEIRO, TH. DOBZHANSKY, C. MALOGOWKIN, AND C. PAVAN. 1949. The willistoni group of sibling species of Drosophila. Evolution 3:300-314.
BUTLIN,R. 1987. Speciationbyreinforcement.Trends Ecol. Evol. 2:8-13.
BuzzATTI-TAvERsO, A. A., AND R. E. SCOSSIROLI. 1955. The "obscura group" of the genus Drosophila. Adv. Genet. 7:47-92.
CARIOU, M. L. 1988. Biochemical phylogeny of the eight species in the Drosophila melanogaster subgroup, including D. sechellia and D. orena. Ge- net. Res. In press.
CARSON, H. L. 1975. The genetics of speciation at the diploid level. Amer. Natur. 109:83-92.
1976. Inference of the time of origin of some Drosophila species. Nature 259:395-396.
CHARLESWORTH, B., J. A. COYNE, AND N. H. BARTON. 1987. The relative rates of evolution of sex chro- mosomes and autosomes. Amer. Natur. 130:113- 146.
COYNE, J. A. 1974. The evolutionary origin of hybrid inviability. Evolution 28:505-506.
COYNE, J. A., AND H. A. ORR. 1989. Two rules of speciation. In J. A. Endler and D. Otte (eds.), Spe- ciation and Its Consequences. Sinauer, Sunderland, MA. In press.
CRADDOCK, E. M. 1974. Reproductive relationships between homosequential species of Hawaiian Dro- sophila. Evolution 28:593-606.
CRADDOCK, E. M., AND W. E. JOHNSON. 1979. Ge- netic variation in Hawaiian Drosophila. V. Chro- mosomal and allozymic diversity in Drosophila sil- vestris and its homosequential species. Evolution 33:137-155.
CROW, J. F. 1942. Cross fertility and isolating mech- anisms in the Drosophila mulleri group. Univ. Tex- as Publ. 4228:53-67.
DAVID, J., C. BOCQUET, F. LEMEUNIER, AND L. TSACAS. 1974. Hybridation d'une nouvelle espece Dro- sophila mauritiana avec D. melanogaster et D. sim- ulans. Ann. Genet. 17:235-241.
DOBZHANSKY, TH. 1937. Genetics and the Origin of Species. Columbia Univ. Press, N.Y.
1973. Is there gene exchange between Dro- sophila pseudoobscura and Drosophila persimilis in their natural habitat? Amer. Natur. 107:312-314.
DOBZHANSKY, TH., L. EHRMAN, AND P. A. KASTRITSIS. 1968. Ethological isolation between sympatric and allopatric species of the obscura group of Drosoph- ila. Anim. Behav. 16:79-87.
DOBZHANSKY, TH., L. EHRMAN, AND 0. PAVLOVSKY. 1957. Drosophila insularis, a new sibling species
of the willistoni group. Univ. Texas Publ. 5721:39- 47.
DOBZHANSKY, TH., AND P. C. KOLLER. 1938. An ex- perimental study of sexual isolation in Drosophila. Biol. Zentralblatt 58:589-607.
EHRMAN, L. 1965. Direct observation of sexual iso- lation between allopatric and between sympatric strains of the different Drosophila paulistorum races. Evolution 19:459-464.
EHRMAN, L., AND J. R. POWELL. 1982. The Drosophila willistoni species group, pp. 193-220. In M. Ash- burner, H. L. Carson, and J. N. Thompson, Jr. (eds.), The Genetics and Biology of Drosophila, Vol. 3b. Academic Press, London, U.K.
FELSENSTEIN, J. 1985a. Phylogenies and the compar- ative method. Amer. Natur. 125: 1-15.
1985b. Confidence limits on phylogenies: An approach using the bootstrap. Evolution 39:783- 791.
FISHER, R. A. 1958. The Genetical Theory of Natural Selection, 2nd Ed. Dover, N.Y.
FUTCH, D. G. 1966. A study of speciation in South Pacific populations of Drosophila ananassae. Univ. Texas Publ. 6615:79-120.
. 1973. On the ethological differentiation of Drosophila ananassae and Drosophila pallidosa in Samoa. Evolution 27:456-467.
GILLESPIE, J. H. 1988. Molecular evolution and the neutral allele theory. Oxford Surv. Evol. Biol. 4: 10-37.
GRAY, A. P. 1954. Mammalian Hybrids. Common- wealth Agricultural Bureaux, Famham Royal, U.K.
. 1958. Bird Hybrids. Commonwealth Agri- cultural Bureaux, Famham Royal, U.K.
HALDANE, J. B. S. 1922. Sex ratio and unisexual ste- rility in hybrid animals. J. Genet. 12:101-109.
HEDRICK, P. W. 1975. Genetic similarity and dis- tance: Comments and comparisons. Evolution 29: 362-366.
HEED, W. B., D. W. CRUMPACKER, AND L. EHRMAN. 1969. Drosophila lowei, a new member of the ob- scura species group. Ann. Entomol. Soc. Amer. 62: 388-393.
JOHNSON, D. L. E. 1985. Genetic differentiation in the Drosophila athabasca complex. Evolution 39: 467-472.
KANESHIRO, K. Y. 1976. Ethological isolation and phylogeny in the planitibia subgroup of Hawaiian Drosophila. Evolution 30:740-745.
KIMURA, M. 1983. The Neutral Theory of Molecular Evolution. Cambridge Univ. Press, Cambridge, U.K.
KOREF-SANTIBANEZ, S. A. 1963. Courtship and sexual isolation in five species of the mesophragmatica group of the genus Drosophila. Evolution 17:99- 106.
KOREF-SANTIBANEZ, S. A., AND E. O. DEL SOLAR. 1961. Courtship and sexual isolation in Drosophila pavani Bmcic and Drosophila gaucha Jaeger and Salzano. Evolution 15:401-406.
LACHAISE, D., M. L. CARIOU, J. R. DAVID, F. LEMEU- NIER, L. TSACAS, AND M. ASHBURNER. 1988. His- torical biogeography of the D. melanogaster species subgroup: A speculative paleobiogeographic essay. Evol. Biol. 22:159-225.
LAKOVAARA, S., AND A. SAURA. 1982. Evolution and

SPECIATION IN DROSOPHILA 381
speciation in the Drosophila obscura group, pp. 2- 49. In M. Ashbumer, H. L. Carson, and J. N. Thompson, Jr. (eds.), The Genetics and Biology of Drosophila, Vol. 3b. Academic Press, London, U.K.
LAKOVAARA, S., A. SAURA, P. LANKINEN, L. POHJOLA, AND J. LoKKo. 1976. The use of isoenzymes in tracing evolution and in classifying Drosophilidae. Zool. Scr. 5:173-179.
LANDE, R. 1982. Rapid origin of sexual selection and character divergence in a cline. Evolution 36:213- 223.
LEMEUNIER, F., AND M. ASHBURNER. 1976. Relation- ships within the melanogaster subgroup of the ge- nus Drosophila (Sophophora). II. Phylogenetic re- lationships between six species based upon polytene chromosome banding sequences. Proc. Roy. Soc. Lond. B 193:275-294.
Li, W.-H., AND TANIMURA, M. 1987. The molecular clock runs more slowly in man than in apes and monkeys. Nature 326:93-96.
MACINTYRE, R. J., AND G. E. COLLIER. 1986. Protein evolution in the genus Drosophila, pp. 39-146. In M. Ashbumer, H. L. Carson, and J. N. Thompson, Jr. (eds.), The Genetics and Biology of Drosophila, Vol. 3e. Academic Press, London, U.K.
MALOGOLOWKIN-COHEN, C. 1965. A study of sexual isolation between certain strains of Drosophila pau- listorum. Evolution 19:95-103.
MAYNARD SMITH, J. 1978. The Evolution of Sex. Cambridge Univ. Press, Cambridge, U.K.
MAYR, E. 1963. Animal Species and Evolution. Har- vard Univ. Press, Cambridge, MA.
MILLER, D. D. 1950. Mating behavior in Drosophila afjinis and D. algonquin. Evolution 4:123-134.
MILLER, D. D., AND A. J. KLEAGER. 1971. Some ad- ditional data and a summary on interspecific mat- ing in the D. affinis subgroup. Dros. Inf. Serv. 46: 98.
MILLER, D. D., AND N. J. WESTPHAL. 1967. Further evidence on sexual isolation within Drosophila athabasca. Evolution 21:479-492.
MORIWAKI, D., 0. KITAGAWA, AND T. OKADA. 1967. Drosophila imaii, a new sibling species related to Drosophila bifasciata. Evolution 21:109-116.
NAIR, P. S., D. BRNCIC, AND K. I. KOMIMA. 1971. Isozyme variations and evolutionary relationships in the mesophragmatica species group of Drosoph- ila. Univ. Texas Publ. 7103:17-28.
NEI, M. 1972. Genetic distance between populations. Amer. Natur. 106:282-292.
. 1975. Molecular Population Genetics and Evolution. North-Holland, Amsterdam, Neth.
1987. Molecular Evolutionary Genetics. Co- lumbia Univ. Press, N.Y.
PATTERSON, J. T. 1947a. Sexual isolation in the mul- leri subgroup. Univ. Texas Publ. 4720:32-40.
. 1947b. The insemination reaction and its bearing on the problem of speciation in the mulleri subgroup. Univ. Texas Publ. 4720:41-77.
1952. Revision of the montana complex of the virilis species group. Univ. Texas Publ. 5204: 20-34.
PATTERSON, J. T., L. W. McDONALD, AND W. S. STONE. 1947. Sexual isolation between members of the virilis group of species. Univ. Texas Publ. 4720:7- 31.
PATTERSON, J. T., AND W. S. STONE. 1949. The re- lationship of novamexicana to other members of the virilis group. Univ. Texas Publ. 4920:7-17.
PRAKASH, S. 1972. Origin of reproductive isolation in the absence of apparent genic differentiation in a geographic isolate of Drosophila pseudoobscura. Genetics 72:143-155.
ROBERTSON, H. M. 1983. Mating behavior and the evolution of Drosophila mauritiana. Evolution 37: 1283-1293.
ROGERS, J. S. 1972. Measures of genetic similarity and genetic distance. Univ. Texas Publ. 7213:145- 153.
SOKAL, R. R., AND F. J. ROHLF. 1981. Biometry, 2nd Ed. Freeman, San Francisco, CA.
SPENCER, H. G., B. H. McARDLE, AND D. M. LAMBERT. 1986. A theoretical investigation of speciation by reinforcement. Amer. Natur. 128:241-262.
STURTEVANT, A. H. 1929. The genetics of Drosophila simulans. Carnegie Inst. Wash. Publ. 399:1-62.
TEMPLETON, A. R. 1981. Mechanisms of speciation- A population genetic approach. Ann. Rev. Ecol. Syst. 12:23-48.
THROCKMORTON, L. H. 1982. The virilis species group, pp. 227-296. In M. Ashburner, H. L. Carson, and J. N. Thompson, Jr. (eds.), The Genetics and Bi- ology of Drosophila, Vol. 3b. Academic Press, Lon- don, U.K.
TSAKAS, S. C., AND L. TSAKAS. 1984. A phenetic tree of eighteen species of the melanogaster group of Drosophila using allozyme data as compared with classifications based on other criteria. Genetica 64: 139-144.
WASSERMAN, M. 1982. Evolution of the repleta group, pp. 61-139. In M. Ashburner, H. L. Carson, and J. N. Thompson, Jr. (eds.), The Genetics and Bi- ology of Drosophila, Vol. 3b. Academic Press, Lon- don, U.K.
WASSERMAN, M., AND H. R. KOEPFER. 1977. Char- acter displacement for sexual isolation between Drosophila mojavensis and Drosophila arizonene- sis. Evolution 31:812-823.
WATANABE, T. K., AND M. KAWANISHI. 1979. Mating preference and the direction of evolution in Dro- sophila. Science 205:906-907.
WILSON, A. C., S. S. CARLSON, AND T. J. WHITE. 1977. Biochemical evolution. Ann. Rev. Biochem. 46: 573- 639.
WOOD, D., AND J. M. RINGO. 1980. Male mating discrimination in Drosophila melanogaster, D. sim- ulans, and their hybrids. Evolution 34:320-329.
Wu, C.-I. AND A. T. BECKENBACH. 1983. Evidence for extensive genetic differentiation between Sex- ratio and the Standard arrangement of Drosophila pseudoobscura and D. persimilis and the identifi- cation of hybrid sterility factors. Genetics 105:71- 86.
YANG, S. Y., L. L. WHEELER, AND I. R. BOCK. 1972. Isozyme variations and phylogenetic relationships in the Drosophila bipectinanta species complex. Univ. Texas Publ. 7213:213-227.
ZOUROS, E. 1973. Genic differentiation associated with the early stages of speciation in the mulleri subgroup of Drosophila. Evolution 27:601-621.
Corresponding Editor: M. G. Kidwell