patterns of international capital flows and their ... · patterns of international capital flows...
TRANSCRIPT

Patterns of International CapitalFlows and Their Implications for
Economic Development
Introduction
Economic theory posits that capital should, on net, flow fromricher to poorer countries. Specifically, in the benchmark neoclassicalmodel, capital should flow from countries that have relatively highcapital-to-labor ratios to countries that have relatively low ratios. Inan influential paper, Lucas (1990) notes that flows of capital from thenorth to the south are nowhere near the levels predicted by theory.Financial globalization has taken off in the decade and a half sinceLucas wrote his paper, with a substantial increase in cross-bordercapital flows. Nonindustrial countries, especially the group of emerg-ing market economies, have become much more integrated intointernational financial markets. What has become of the empiricalparadox that Lucas identified? Has increasing financial integrationresolved it?
We show that the paradox has, if anything, intensified over time,with capital, in fact, flowing from poor to rich countries. This perversepattern of flows has been particularly striking since the beginning ofthis decade. Foreign direct investment (FDI) flows have, in general,behaved more in line with theory, flowing from richer to poorer coun-tries. But the pattern of overall flows is ultimately what is relevant interms of financing of investment in a country.
119
Eswar Prasad, Raghuram G. Rajan, and Arvind Subramanian

120 Eswar Prasad, Raghuram G. Rajan, and Arvind Subramanian
The apparent perversity of overall foreign financing is even moredramatic when one examines the allocation of capital across developingcountries. As Gourinchas and Jeanne (2006) argue, within this group,capital should flow in greater amounts to countries that have grown thefastest, that is, countries that are likely to have the best investmentopportunities.1 We show that, over the last three decades, the netamount of foreign capital flowing to relatively high-growth developingcountries has been smaller than that flowing to the medium- and low-growth groups. During 2000-2004, the pattern is truly perverse, withhigh-growth and medium-growth countries exporting significantamounts of capital, while low-growth countries receive significantamounts. That capital does not follow growth has been dubbed the“allocation puzzle” by Gourinchas and Jeanne (2006).
These seemingly perverse patterns of global financial flows areclosely related to the important question about whether foreigncapital plays a helpful, benign, or malign role in the process ofeconomic growth. To get at the possible answers, we first show thatfor nonindustrial countries, traditional measures of financial integra-tion (such as stocks of foreign liabilities, sum of stocks of assets andliabilities, private capital inflows, FDI inflows, or measures of theextent to which capital flows are constrained by regulations) are notcorrelated with growth. This is consistent with a growing body ofevidence that it is difficult to detect any direct growth benefits offinancial integration in macroeconomic data (see Kose, Prasad,Rogoff, and Wei, 2006, for a survey).
We then examine the relationship between current accounts—ameasure of total external capital financing available for investment in acountry—and growth. We report an interesting new result—contrary tothe predictions of standard theoretical models, there isn’t a negative cross-sectional correlation between current account balances and growthamong nonindustrial countries. Indeed, for the sample of nonindustrialcountries and most subsamples, the correlation is significantly positive. Inother words, developing countries that have relied more on foreignfinance have not grown faster in the long run and have typically grownmore slowly. By contrast, we find that among industrial countries, thosethat rely more on foreign finance appear to grow faster.

Patterns of International Capital Flows and Their Implications for Economic Development 121
None of this is to say that there are no episodes where nonindustrialcountries grow fast and run large current account deficits—East Asiabefore the crisis is a clear counterexample. Our attempt is to lookbeyond short-run, foreign-funded booms (and possibly busts) towhether, on average and in the long run, nonindustrial countries thatgrow the fastest have depended most on foreign finance. They have not.
Indeed, even controlling for the standard determinants of growth ina regression framework, we find a positive association between averagecurrent account balances and average growth rates in our sample ofnonindustrial countries over the period 1970-2000. The correlationappears to be largely driven by the savings component of the currentaccount, not by the investment component—that is, nonindustrialcountries that have higher savings for a given level of investment expe-rience higher growth.2
These findings build upon existing work. Houthakker (1961),Modigliani (1970), and Carroll and Weil (1994) have shown there isa large positive correlation between savings and growth in the cross-section of countries. Of course, investment in high-saving countriesalso could be higher, so high domestic savings does not imply lowreliance on foreign savings—indeed, Aghion, Comin, and Howitt(2006) see high domestic savings as a prerequisite for attractingforeign savings. Gourinchas and Jeanne (2006b) conclude thatpoorer countries have lower per capita income because they havelower productivity or more distortions than richer countries, notbecause they are capital-scarce—the implication being that access toforeign capital by itself would not generate much additional growthin these countries.
In addition to Gourinchas and Jeanne (2006a), our paper is closelyrelated to that of Aizenman, Pinto, and Radziwill (2004), whoconstructed a “self-financing” ratio for countries and found that coun-tries with higher self-financing ratios grew faster in the 1990s thancountries with lower ratios. Thus, the connection of capital flows togrowth seems to be more than just through financing. If that were allthat were important (for example, foreign financing is good for growth

122 Eswar Prasad, Raghuram G. Rajan, and Arvind Subramanian
because it expands the resource envelope or is bad because it is exces-sively volatile), then only inflows or net foreign liability positionsshould matter. We find that neither of these measures of financialintegration seems to matter much for growth.
We discuss a few possible explanations for the observed relationships.First, the positive correlation between current account balances andgrowth is stronger among less financially developed countries. In thesecountries, the range of profitable investment opportunities, as well asprivate consumption, for those that experience growth episodes, maybe constrained by financial sector impediments. So, investment can befinanced largely through domestically generated savings. Second, adeveloping country may actively choose not to absorb too muchforeign capital in order to avoid exchange rate overvaluation. In turn,this ensures that the country’s manufacturing/tradable goods sector iscompetitive, thus allowing it to play its customary important role infostering growth.
A logical implication of our analysis is that once one accounts forthe financial and other structural impediments that limit a poorcountry’s ability to absorb foreign capital, the seemingly perverse flowof capital from poor to rich countries today is not necessarily an arti-fact of a distorted international financial system. Indeed, it maymerely be an accentuation of a historical pattern, whereby fast-growing poor countries have now turned to financing others,including the rich, as opposed to simply relying little on foreignfinance as in the past.
Note that the critics of capital account openness (including Bhag-wati, 1998; Rodrik, 1998; and Stiglitz, 2000) point to yet anotherreason countries may actively avoid foreign capital—the broader risksassociated with opening up, including the risks of inducing greatereconomic volatility. We have little to say on this issue, except to notethat there is little evidence that capital mobility by itself can precipi-tate crises (see Kose and others, 2006).
The paper is structured as follows. In the second section, weprovide some stylized facts on the patterns of international capitalflows to motivate our analysis. In the third section, we examine thecorrelation between foreign capital inflows and growth; in the fourth

Patterns of International Capital Flows and Their Implications for Economic Development 123
section, we examine possible explanations for our findings. In thefifth section, we discuss what our paper might add to the debateabout the current global imbalances, and then we conclude in thesixth section.
The direction of flows
We begin by presenting some stylized facts to motivate our analy-sis.3 Chart 1 shows that the quantum of net global cross-borderfinancial flows, as measured by the sum of current account surplusesover all countries, has been steadily increasing over the last threedecades. But even as cross-border capital flows have grown, suggest-ing a more financially integrated world, the distribution of flows hasseemingly become more perverse relative to what standard economictheory would predict. Specifically, in the benchmark neoclassicalmodel, capital should flow from rich countries that have relativelyhigh capital-to-labor ratios to poor countries that have relatively lowratios. Yet, as Chart 2 suggests, the average relative per capita incomeof surplus countries (weighted by their surpluses, with per capitaincome measured relative to the richest country in that year) has been
Chart 1
World Current Account Surpluses as a Ratio to World GDP
0
.005
.01
.015
.02
1970 1975 1980 1985 1990 1995 2000 2005
Year
.02
.015
.01
.005
0
Note: This plot shows the sum of current account surpluses for countries in our sample that report a surplus in agiven period as a ratio of the sum of world nominal gross domestic product (GDP) in that period.

.4
.6
.8
1
.4
.6
.8
1
Relative Per Capita GDP Weighted by Current Accounts
1970 1975 1980 1985 1990 1995 2000 2005
Year
Surplus Countries Deficit Countries
124 Eswar Prasad, Raghuram G. Rajan, and Arvind Subramanian
trending downward. By contrast, there has been an upward trend inthe relative income level of deficit countries.
Indeed, in this century, the relative income of surplus countries hasfallen below that of deficit countries. Not only is capital not flowingfrom rich to poor countries in quantities the neoclassical modelwould predict—a paradox pointed out by Lucas (1990)—but, in thelast few years, it has been flowing from poor to rich countries.However, this is not a new phenomenon. Even in the late 1980s, theweighted average relative income of surplus countries was below thatof deficit countries.
Is the pattern in Chart 2 entirely driven by the United States? InChart 3, we exclude the United States from the calculations. Evenwithout the United States, there is a narrowing in weighted average
Notes: For each year, we separate our sample of countries into two groups—those with current accountsurpluses and those with deficits in that year. For the first group, we then take each country’s share ofthe total current account surplus accounted for by all countries in that group. We then multiply thatshare by the relative purchasing power parity (PPP)-adjusted per capita income of that country (meas-ured relative to the per capita income of the richest country in the sample in that year). This gives us acurrent account-weighted measure of the relative incomes of surplus countries. We do the same forcurrent account deficit countries. This enables us to compare the relative incomes of surplus versusdeficit countries in each year.
Chart 2Relative Incomes of Capital-Exporting and
Capital-Importing Countries

Patterns of International Capital Flows and Their Implications for Economic Development 125
Chart 3Relative Incomes of Capital-Exporting
and Capital-Importing Countries(Calculations Excluding the United States)
.4
.6
.8
1
Relative Per Capita GDP Weighted by Current Accounts
1970 1975 1980 1985 1990 1995 2000 2005Year
Surplus Countries Deficit Countries
.4
.6
.8
1
Notes: For each year, we separate our sample of countries into two groups—those with current accountsurpluses and those with deficits in that year. For the first group, we then take each country’s share ofthe total current account surplus accounted for by all countries in that group. We then multiply thatshare by the relative PPP-adjusted per capita income of that country (measured relative to the per capitaincome of the richest country in the sample in that year). This gives us a current account-weightedmeasure of the relative incomes of surplus countries. We do the same for current account deficit coun-tries. This enables us to compare the relative incomes of surplus versus deficit countries in each year. Thecalculations are the same as in Chart 2, except that we exclude the United States from the sample.
income levels between surplus and deficit countries by 2005, incontrast to the widening that would be predicted in an increasinglyfinancially integrated world under a strict interpretation of the neoclas-sical benchmark model.4
Capital flows between developed and developing economies mayincreasingly be dominated by official flows (aid flows, accumulationof international reserves), which may be driven by factors other thanthe basic rate-of-return equalization motive considered in benchmarkneoclassical models. FDI flows by themselves (Chart 4) do behavemore in accordance with the models—the weighted average relativeincome of countries experiencing net FDI inflows is generally lowerthan that of FDI-exporting countries, though the relative income of

126 Eswar Prasad, Raghuram G. Rajan, and Arvind Subramanian
senders has been trending down, while the relative income of recipi-ents has been moving up since the mid-1990s.5
Next, we examine the allocation of capital across nonindustrialcountries. Gourinchas and Jeanne (2006) argue that, within thisgroup, capital should flow in greater amounts to countries that havegrown the fastest, that is, countries that are likely to have the bestinvestment opportunities. Does it? We divide nonindustrial countriesinto three equally sized (by aggregate population) groups, with Chinaand India handled separately, and compute cumulative currentaccount deficits for each group, deflating the computed flows indollars by the U.S. Consumer Price Index (CPI).
Chart 5 shows that, over the period 1970-2004, as well as oversubperiods, the net amount of foreign capital flowing to relativelyhigh-growth developing countries has been smaller than that flowing
Chart 4Relative Incomes of Countries that are Net Exporters
and Importers of FDI
.2
.4
.6
.8
1
.2
.4
.6
.8
1
Relative Per Capita GDP Weighted by FDI Flows
1970 1975 1980 1985 1990 1995 2000 2005Year
FDI Flows Surplus FDI Flows Deficit
Notes: For each year, we separate our sample of countries into two groups—those with FDI flowssurpluses and those with deficits in that year. For the first group, we then take each country’s share ofthe total FDI flows surplus accounted for by all countries in that group. We then multiply that share bythe relative PPP-adjusted per capita income of that country (measured relative to the per capita incomeof the richest country in the sample in that year). This gives us an FDI flows-weighted measure of therelative incomes of surplus countries. We do the same for FDI flows deficit countries. This enables us tocompare the relative incomes of surplus versus deficit countries in each year.

Patterns of International Capital Flows and Their Implications for Economic Development 127
to the medium- and low-growth groups. In fact, China, the fastest-growing country, runs a surplus in every period. During 2000-2004,the pattern is truly perverse, with China, India, high-growth countries,and medium-growth countries all exporting significant amounts ofcapital, while low-growth countries receive significant amounts. Thatcapital does not follow growth has been dubbed the “allocation puzzle”by Gourinchas and Jeanne (2006).
The puzzle deepens when we examine net FDI flows (Chart 6).Even though during the most recent period (2000-2004) net FDIflows do not follow growth, by and large they do, with the fastest-growing group of nonindustrial countries receiving the most FDIover the period 1970-2004, and China receiving substantial amounts.This suggests that fast-growing countries do have better investmentopportunities, which is why they attract more FDI. Yet they do notutilize more foreign capital overall, and, in the case of China, exportcapital on net.
Chart 5The Allocation of Capital Flows to Nonindustrial Countries
-500
0
500
1,000Billions of U.S. Dollars
Low-Growth Medium-Growth High-Growth China India
High: 4.1%
India: 2.9%
Medium: 1.6%
Low: 0.3%
China: 7.6%
China: 8.9%
Low: 0.2%
India: 3.7%
Medium: 1.7%
High: 3.6%
China: 8.5%
High: 3.7%
Medium: 2.4%India: 4.1%
Low: 0.3%
1970-2000 1985-1997
2000-2004
-500
0
500
1,000
Notes: The nonindustrial countries in our sample are split into three groups with roughly equal totalpopulations in each group. China and India are treated separately. Each panel shows the cumulativecurrent accounts (in billions of U.S. dollars, deflated by U.S. CPI indexed to 1 in 2004) summed upwithin each group over the relevant period. A negative number indicates a surplus. Median real GDPgrowth rates for the countries in each group (after averaging over the relevant period for each country)also are shown.

128 Eswar Prasad, Raghuram G. Rajan, and Arvind Subramanian
Explanations of the Lucas paradox have relied on the notion thatthe risk-adjusted returns to capital investment may not be as high inpoor countries as suggested by their low capital-labor ratios becausethey have weak institutions (Alfaro and others, 2005) because physi-cal capital is costly in poor countries (Hsieh and Klenow, 2003;Caselli and Feyrer, 2005) or because poor governments defaultrepeatedly on debt finance (Gertler and Rogoff, 1990; Reinhart andRogoff, 2004). Yet the charts here suggest a deeper paradox. Whydoes more foreign capital not flow to poor countries that are growingmore rapidly and where, by extension, the revealed marginal produc-tivity of capital (and probably creditworthiness) is indeed high? Moreimportantly, do these perverse flows of capital adversely affect growthin nonindustrial countries? To address these issues, in the nextsection, we investigate in more detail the relationship between foreigncapital and growth.
Chart 6The Allocation of FDI Flows (Net) to Nonindustrial Countries
0
100
200
300
400
500
600
0
100
200
300
400
500
600Billions of U.S. Dollars
Low:0.3%
Low:0.2%
Low:0.3%
Medium:1.7%
High: 3.6%
China: 8.9%
China: 8.5%
High: 3.7%
Medium:2.4%
India:3.7%
India:4.1%
India:2.9%
Medium:1.6%
High: 4.1%
1970-2004
1985-1997 2000-2004
China: 7.6%
Low-Growth Medium-Growth High-Growth China India
Notes: The nonindustrial countries in our sample are split into three groups with roughly equal total populations ineach group. China and India are treated separately. Each panel shows the cumulative net FDI inflows (in billions ofU.S. dollars, deflated by U.S. CPI indexed to 1 in 2004) summed up within each group over the relevant period.Median real GDP growth rates for the countries in each group (after averaging over the relevant period for eachcountry) are also shown.

Patterns of International Capital Flows and Their Implications for Economic Development 129
The relationship between foreign capital and growth
In this section, we examine the correlations between measures offinancial integration and growth. In theory, integration with interna-tional financial markets should provide more capital to relativelycapital-scarce countries and also could increase the efficiency of thatcapital by allowing for greater specialization of production amongcountries. We then look at the relationship between current accountbalances, which can be regarded as the total amount of financeflowing in or out of a country, and growth.
Measures of financial integration
The first task is determining how to measure financial integration.The most common method is to create an index of openness basedon compilations of the restrictions a country imposes on capitalaccount transactions—these are typically drawn from the Interna-tional Monetary Fund’s (IMF’s) Annual Reports on ExchangeArrangements and Exchange Restrictions. But, as argued by Kose,Prasad, Rogoff, and Wei (2006), these de jure measures—no matterhow sophisticated—cannot capture the enforcement and effective-ness of capital controls, and may, therefore, not be indicative of thetrue extent of financial integration. Indeed, actual capital flows maybe more relevant for examining the role of foreign capital in thegrowth process. This is why, in addition to de jure measures of capitalaccount openness, we also use measures of gross and net inflows offoreign capital, and its components. Because we are interested inlong-term growth, we also use measures of stocks of foreign assets andliabilities—as measures of long-term outflows and inflows—constructed by Lane and Milesi-Ferretti (2006). These flow and stockmeasures can be scaled by gross domestic product (GDP) or the levelof the population/workforce, depending on the theory being tested.
Clearly, we face a combinatorial explosion in terms of the appropri-ate measures. Our strategy will be to present results from a corespecification, which we consider to be representative of the large

130 Eswar Prasad, Raghuram G. Rajan, and Arvind Subramanian
volume of results that we have obtained. Wherever there are departuresfrom the core specification or when other combinations of the datashowed markedly different results, we will mention them.
Financial integration and growth
The starting point in our analysis is that, consistent with Kose andothers (2006), there is no relationship, in a broad sample of countries,between GDP growth and the levels of financial openness as measuredby stock or flow measures, or between GDP growth and changes inthese measures. In Chart 7, we plot the average growth of nonindustrial
Chart 7
Financial Integration and Growth, 1970-2000
TUR
ZAF ARGBOL
BRACHLCOL
CRI
DOM
ECU
SLVGTM
HTI
HND
MEXPRY
PER
URY
VEN
JAM
TTO
CYP
IRNISRJOR
EGYBGD
LKAINDIDN
KOR
MYS
PAK
PHL
THA
DZACMR
ETHGHA KEN
MDG
MWIMLI
MUS
MAR
MOZNGA
ZWERWA
SENTZA
TUN
UGA
ZMB
CHN
-2 -1 0 1 2
Chinn-Ito Index
DZAARG
BGD
BOL
BRA
CMR
CHL
CHN
COLCRI
CYP
CIV
DOM
ECUEGY
SLVETHGHAGTM
HTI
HND
IND
IDN
IRNISR
JAM
JORKEN
KOR
MDG
MWI
MYS
MLI
MUS
MEX MAR
MOZ
NGA
PAKPRY
PERPHL
RWASENZAF
LKA
TZA
THA
TTO
TUN
TURUGA URY
VENZMB
ZWE
0 .5 1 1.5 2
Average Assets + Liabilities as Percent of GDP
DZAARG
BGD
BOL
BRA
CMR
CHL
CHN
COLCRI
CYP
CIV
DOM
ECU
EGY
SLVETHGHAGTM
GUY
HTI
HND
IND
IDN
IRNISR
JAM
JORKEN
KOR
MDG
MWI
MYS
MLI
MUS
MEXMAR
MOZNGA
PAKPRY
PERPHLRWA
SEN
SLE
ZAF
LKA
TZA
THA
TTO
TUN
TURUGAURY
VEN ZMB
ZWE
0 .01 .02 .03 .04
Average Net FDI as Percent of GDP
GUYMARCMRCRIZWE
COL
RWA
NGA
EGY
MDG
ECU
SLE
SEN
BRA
BOL
IDN
JOR
PAKUGAPRYURY
DOM
TTOMEX
MUS
ETH
BGDISR
PHLKENHND
VEN
KOR
CHL
ARGSLV
CHN
MLIGTM
CIVPERJAM
DZA
ZMB
IRN
MYSCYPHTI
THA
ZAF
INDTUR
MWI
MOZ
GHA
LKA
TUN
TZA
-1 0 1 2
Feldstein-Horioka Coefficient
GDP Growth (%) GDP Growth (%)
GDP Growth (%) GDP Growth (%)
6
4
2
0
-2
6
4
2
0
-2
6
4
2
0
-2
6
4
2
0
-2
6
4
2
0
-2
6
4
2
0
-2
6
4
2
0
-2
6
4
2
0
-2
Notes: The Chinn-Ito Index is taken from Chinn and Ito (2006). Data for the second and third panelsare from Lane and Milesi-Ferretti (2006). The Feldstein-Horioka coefficients are based on ordinary leastsquares regressions of Investment/GDP on Savings/GDP, run separately for each country using nonover-lapping five-year averaged data. These coefficients are plotted against average annual real per capita GDPgrowth over the full sample.

Patterns of International Capital Flows and Their Implications for Economic Development 131
countries in the Bosworth-Collins (2003) sample over the period 1970-2000 against the de jure Chinn-Ito (2006) measure of capital accountrestrictiveness, the average stock of gross foreign assets and liabilities toGDP, average net FDI inflows, and the Feldstein-Horioka (1980)correlation coefficient.6 In all cases, the slope is essentially flat and neversignificantly different from zero.
A more formal regression analysis of the cross-country relationshipbetween growth and foreign capital, building on the work of Bosworthand Collins (2003), reveals a similar picture. The dependent variable inTable 1 is the annual average growth rate of per capita (purchasingpower parity-adjusted) GDP, taken from the Penn World Tables. Weinclude the following controls in the standard specification: log ofinitial (1970) per capita GDP, initial period life expectancy, initialperiod trade openness (the Sachs-Warner measure), the fiscal balance, ameasure of institutional quality, and dummies for sub-Saharan Africancountries and oil exporters. In columns 1 to 5 of Table 1, we succes-sively include different measures of stocks and flows of foreign capitaland de jure measures of capital account openness in this specification.
With one exception, in column 3 of the table, when we use the sumof inflows and outflows of FDI and portfolio equity as a measure ofcapital openness, we do not find a positive and significant relation-ship. But even this result is fragile; dropping one outlier (Singapore)renders the coefficient statistically insignificant.
In interpreting these results, it is important to note that at least oneform of reverse causation is not a serious issue. If anything, highergrowth should lead to more capital account openness and highercapital inflows, which should generate a positive correlation betweenthese measures and growth. The fact that the estimated coefficientsare all insignificant, despite the positive bias that should result fromreverse causation, is noteworthy.
One concern is that our results may be dominated by recent crises.We reestimated the regressions for the period 1985-1997, a periodwhich could be considered the heyday of recent financial globalization

132 Eswar Prasad, Raghuram G. Rajan, and Arvind Subramanian
Table 1
Financial Integration and Growth(Dependent Variable: Average Real
Per Capita GDP Growth, 1970-2000)
Initial income -1.517 *** -1.484 *** -1.521 *** -1.442 *** -1.469 *** -1.273 *** -1.259 *** -1.242 ***(0.296) (0.281) (0.282) (0.283) (0.278) (0.213) (0.208) (0.220)
Initial life expectancy 0.044 * 0.059 ** 0.053 ** 0.050 ** 0.055 ** 0.016 0.026 0.026(0.029) (0.027) (0.026) (0.028) (0.029) (0.024) (0.025) (0.025)
Sachs-Warner 1.840 *** 1.947 *** 1.753 *** 2.012 *** 1.912 *** 1.585 ** 1.701 ** 1.713 **(0.615) (0.676) (0.664) (0.736) (0.619) (0.631) (0.582) (0.617)
Fiscal balance/GDP 0.160 *** 0.096 * 0.112 *** 0.166 *** 0.154 *** 0.047 0.062 0.064(0.061) (0.061) (0.047) (0.061) (0.058) (0.052) (0.051) (0.056)
Institutional quality 5.017 *** 4.452 *** 4.293 *** 4.499 *** 4.648 *** 4.816 ** 4.505 ** 4.470 **(1.614) (1.603) (1.531) (1.835) (1.724) (1.504) (1.590) (1.595)
Stock of FDI liabilities 0.742/GDP (0.873)
Net FDI flows/GDP -3.892(11.304)
Gross FDI+equity 8.895 **flows/GDP (4.293)
Chinn-Ito capital account -0.137openness measure (0.177)
Stock of total foreign assets -0.152and liabilities/GDP (0.228)
Stock of total foreign 0.019 ***assets/GDP (0.005)
Stock of total foreign -0.015 ***liabilities/GDP (0.003)
Net foreign assets/GDP 0.014 ***(0.004)
Net foreign assets/GDP if 0.011 *net foreign assets/GDP >0 (0.006)
Net foreign assets/GDP if 0.025 *net foreign assets/GDP <0 (0.014)
Adjusted Rsquared 0.697 0.686 0.700 0.697 0.699 0.775 0.770 0.754
Number of observations 59 61 61 59 59 59 59 59
Notes: Financial integration measures are taken from Lane and Milesi-Ferretti (2006) and Chinn andIto (2006). Regressions, including stock measures of financial integration, exclude two countries forwhich we did not have those data. In the last column, we interact dummies for countries with averagenet-foreign-assets-to-GDP ratios above and below zero, respectively, with the average net-foreign-assets-to-GDP ratio. Dummies for oil-exporting countries and sub-Saharan African countries are included inall regressions. One, two, and three asterisks indicate statistical significance at the 10 percent, 5 percent,and 1 percent levels, respectively.
(1) (2) (3) (4) (5) (6) (7) (8)

Patterns of International Capital Flows and Their Implications for Economic Development 133
because there was a sharp increase in capital flows toward developingcountries during this period. The period was also largely a tranquil onein financial markets (barring the Tequila Crisis in late 1994). Ourresults for this period (not shown here), however, were not qualitativelydifferent from those for the period 1970-2000 that we have justreported. Finally, we checked that the slope on the financial integrationvariable is not different for emerging markets.
Admittedly, our approach here is a crude one, and we do notformally examine nonlinearities in the relationship between financialintegration and growth, or the possibility of threshold effects—whereby the beneficial effects of financial integration may show uponly when the right initial conditions are in place. Our main pointhere is that detecting the potential beneficial effects is hardly asstraightforward as theory would suggest.7
Current account balances and growth
We now will look at the correlation between current accounts andgrowth. Not only is the current account a summary of the net flowsout of a country, but it is also the right measure when we considerissues like aggregate savings and investment, as well as exchange rateovervaluation, all of which will be important in what follows.8
There is a well-developed theory of the life cycle model applied tocountries that has implications for the evolution of current accountbalances (see the discussion in Chinn and Prasad, 2003). Poor coun-tries that open up to foreign capital early in the development processwould be expected to run current account deficits as they importcapital to finance their investment opportunities. Eventually, thesecountries would become relatively capital rich and begin to run tradesurpluses, in part to pay off the obligations built up through theiraccumulated current account deficits. Thus, the relationship betweenthe level of the current account and relative income across countriesis likely to be U-shaped, with the very poor not being open or able toborrow, the moderately poor running large current account deficits,and the rich running surpluses.

134 Eswar Prasad, Raghuram G. Rajan, and Arvind Subramanian
Notes: Country-year observations were stacked together over the period 1970-2000 and sorted by rela-tive PPP-adjusted per capita income levels, with relative income measured against the richest country inthe sample in that year (the United States or, in some years, Switzerland). The smoothed plot wasobtained using the Lowess routine in Stata. The savings-investment plot for developing countries doesnot fully match the current account plot because (1) the curves were fitted independently for the threevariables and (2) because of measurement problems, the current account to GDP ratio does not exactlymatch the difference between the ratios of savings and investment to GDP for the developing countries,especially in the early years of the sample.
Chart 8
Nonparametric Regressions of Saving-Investment Balances onRelative Income (Percent)
-2
0
2
4
-2
0
2
4
0.00 20.00 40.00 60.00 80.00 100.00
Relative Income
20
25
30
35
25
20
30
35
Savi
ngs/
GD
P, I
nves
tmen
t/G
DP
0.00 20.00 40.00 60.00 80.00 100.00
Relative Income
Savings/GDP, Investment/GDP vs. Relative Income (%)Nonindustrial Countries
-4
-2
0
2
4
-4
-2
0
2
4
0.00 20.00 40.00 60.00 80.00 100.00
Relative Income
Current Account/GDP vs. Relative Income (%)Industrial Countries
20
25
30
20
25
30
Savi
ngs/
GD
P, I
nves
tmen
t/G
DP
0.00 20.00 40.00 60.00 80.00 100.00
Relative Income
Savings/GDP, Investment/GDP vs. Relative Income (%)Industrial Countries
Current Account/GDP vs. Relative Income (%)Nonindustrial Countries
Cur
rent
Acc
ount
/GD
PC
urre
nt A
ccou
nt/G
DP
What does the evidence show? Chart 8 contains smoothed plots ofthe relationship between relative income and the level of the currentaccount balance for nonindustrial countries and industrial countriesin the Bosworth-Collins sample.9 The lowest current account balancefor developing countries is reached at fairly low levels of relativeincome, with a strong positive relationship between the currentaccount balance and a country’s level of relative income thereafter(top left panel). Note that, for this group of countries, the currentaccount balance increases because the savings-to-GDP ratio rises evenfaster than investment with rising relative income (top right panel).

Patterns of International Capital Flows and Their Implications for Economic Development 135
For industrial countries, though, the investment-to-GDP ratio fallswith rising relative income, even while savings increases. So, there isthe expected positive relationship between the current accountbalance and relative income. Indeed, these plots are consistent withthe results of Lane and Milesi-Ferretti (2001), who show a positivecorrelation between countries’ net foreign asset positions and theirrelative incomes.
While Chart 8 is about the relationship between the currentaccount and relative income levels of countries, the next two chartsoffer a different way of characterizing the role of foreign capital ingrowth. In Chart 9A, we plot the simple correlation between growthand the current account balance for the sample of nonindustrialcountries. Note that these are unconditional correlations that do notcontrol for the typical variables that are associated with growth. We will include these variables shortly. But it is clear that even uncon-ditionally, there is a strong positive correlation, suggesting thatcountries that rely less on foreign capital grow more. There may be aconcern that the correlation is driven by underperforming countriesthat receive lots of aid, so in Chart 9B we drop countries that receivedaverage annual aid of more than 10 percent of GDP. The magnitudeof the correlation is now larger.
In Chart 10, we examine growth rates, splitting the sample of nonin-dustrial countries into four groups, depending on whether they areabove or below the median levels of the ratios of investment to GDPand current account to GDP, respectively. The chart shows that coun-tries with higher levels of investment fare better than those with lowerlevels, which is not surprising. What is noteworthy is that countriesthat had high investment ratios and lower reliance on foreign savings(lower current account deficits) grew faster—on average, by about 1percent a year—compared with countries that had high investmentbut also a greater degree of reliance on foreign capital.
A similar picture from a different perspective is in Chart 11, wherewe plot the relationship between growth and the current account forcountries that experienced growth spurts (as identified by Hausmann,Rodrik, and Pritchett, 2005), differentiating their performance before

136 Eswar Prasad, Raghuram G. Rajan, and Arvind Subramanian
Notes: Sample excludes Nicaragua. Including Nicaragua yields larger positive coefficient.
B: Sample Excluding Countries with Aid/GDP >0.10
A: Full Sample
Chart 9
Current Account Balance and Growth in Developing Countries1970-2000: Unconditional Relationship
Coefficient = 0 .198, Standard Error = 0.062
DZA
ARG
BGD
BOL
BRA
CMR
CHL
CHN
COL
CRI
CYP
CIV
DOM
ECU
EGY
SLVETHGHAGTM
HTI
HND
IND
IDN
IRN
ISR
JAM
KEN
KOR
MDG
MYSMUS
MEXMAR
NGA
PAK
PANPRY
PER
PHL
SLE
SGP
ZAF
LKA
THA
TTO
TUN
TURUGA URY
VEN
ZWE
-2
0
2
4
6
-2
0
2
4
6
Average Per Capita GDP Growth
-8 -6 -4 -2 0 2
Average Current Account as Percent of GDP
DZA
ARG
BGD
BOL
BRA
CMR
CHL
CHN
COL
CRI
CYP
CIV
DOM
ECU
EGY
SLVETHGHAGTM
GUY
HTI
HND
IND
IDN
IRN
ISR
JAM
JORKEN
KOR
MDG
MWI
MYS
MLI
MUS
MEXMAR
MOZ
NGA
PAK
PANPRY
PER
PHLRWA
SEN
SLE
SGP
ZAF
LKA
TZA
THA
TTO
TUN
TURUGA URY
VENZMB
ZWE
-2
0
2
4
6
-2
0
2
4
6
Average Per Capita GDP Growth
-15 -10 -5 0 5
Average Current Account as Percent of GDPCoefficient = 0.198, Standard Error = 0.062

Patterns of International Capital Flows and Their Implications for Economic Development 137
Chart 10
Current Accounts, Investment, and Growth in Developing Countries
Above Median
Below Median
Below Median
Above Median
0.00
1.00
2.00
3.00
0.00
1.00
2.00
3.00Average Per Capita GDP Growth
Investment/GDP
Current Account/GDP
and during the growth spurt. On average, current account balancesincrease around the beginning of growth spurts (or, put differently,current account deficits narrow), with the lower panel showingsavings growing faster than investment. In other words, while goingfrom slow to faster growth, countries also reduce foreign financing ofdomestic investment.
This is not to say that all forms of foreign finance fall during growthspurts. Indeed, in the five years following the initiation of a growthspurt, the average FDI-to-GDP ratio rises from an annual average of0.2 percent in the five years before to 0.7 percent. Similarly, using theJones and Olken (2005) episodes of growth decelerations, we findthat the average FDI-to-GDP ratio falls from an average of 1.7percent in the five years before the deceleration to 1 percent in thefive years after. But even these increases and decreases are smallcompared to the changes in domestic savings following a growthspurt or deceleration.

138 Eswar Prasad, Raghuram G. Rajan, and Arvind Subramanian
Chart 11
Savings-Investment Balances Around Growth Spurts: Developing Countries, 1970-2000
-15.00
-10.00
-5.00
0.00
-15.00
-10.00
-5.00
0.00
-5 0 5Time
Current Account/GDP
10.00
15.00
20.00
25.00
10.00
15.00
20.00
25.00
-5 0 5
Time
Savings/GDP Investments/GDP
Savings and Investment
Notes: Timings of growth spurts are based on Hausmann, Pritchett, and Rodrik (2005).

Patterns of International Capital Flows and Their Implications for Economic Development 139
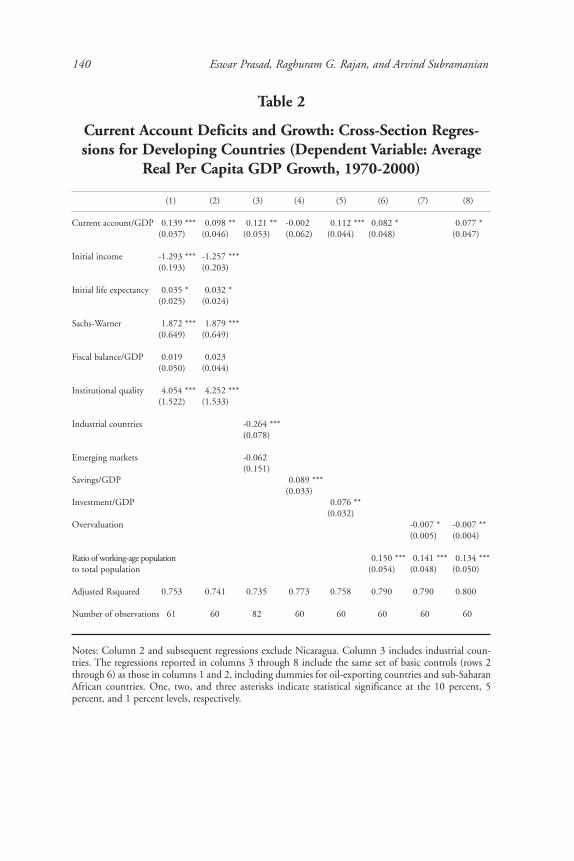
Having identified what appears to be a clear association betweencurrent account balances and growth, we now turn to a more formalanalysis of this relationship in a regression framework similar to theone used in the previous section to examine the effects of financialintegration on growth. The regression results are presented in Table 2.The dependent variable is the average per capita GDP growth rateover the period 1970-2000, and the covariates are the standard onesas in the previous section. When we include the full nonindustrialcountry sample, the coefficient on the current account balance ispositive and tightly estimated (column 1).
Nicaragua appears to be a significant outlier in such regressions.Dropping Nicaragua from the sample yields our core specification(column 2), in which the coefficient on the current account remainspositive and significant at the 5 percent level. The coefficient estimatesuggests that a 1 percent increase in the growth rate is associated witha 1 percentage point improvement in the current account. The regres-sion estimates are robust to dropping different outliers or dummyingout groups like oil exporters.
Importantly, the correlation between growth and the currentaccount balance is strongest and positive for poor countries, moderateand positive for emerging markets, and negative and significant forindustrial countries (Table 2, column 3). The marginal relationshipbetween growth and the current account suggested by the regression isas follows: For industrial countries, it is negative, -0.15 (0.12 minus0.26), and both significantly different from that of nonindustrialcountries and significantly different from zero. For emerging markets,it is positive, 0.06 (0.12 minus 0.06), but not statistically significantlydifferent from the coefficient on other developing countries of 0.12.Thus, it turns out that while developing countries grow faster byrelying less on foreign savings, it is just the opposite for industrialcountries. Put another way, neither China nor the United States, bothfast-growing countries for their stage of development, are runningperverse current account balances relative to the norm. They are justextreme examples of their respective class of country.
140 Eswar Prasad, Raghuram G. Rajan, and Arvind Subramanian
Table 2
Current Account Deficits and Growth: Cross-Section Regres-sions for Developing Countries (Dependent Variable: Average
Real Per Capita GDP Growth, 1970-2000)
(1) (2) (3) (4) (5) (6) (7) (8)
Current account/GDP 0.139 *** 0.098 ** 0.121 ** -0.002 0.112 *** 0.082 * 0.077 *(0.037) (0.046) (0.053) (0.062) (0.044) (0.048) (0.047)
Initial income -1.293 *** -1.257 ***(0.193) (0.203)
Initial life expectancy 0.035 * 0.032 *(0.025) (0.024)
Sachs-Warner 1.872 *** 1.879 *** (0.649) (0.649)
Fiscal balance/GDP 0.019 0.023 (0.050) (0.044)
Institutional quality 4.054 *** 4.252 *** (1.522) (1.533)
Industrial countries -0.264 ***(0.078)
Emerging markets -0.062(0.151)
Savings/GDP 0.089 ***(0.033)
Investment/GDP 0.076 **(0.032)
Overvaluation -0.007 * -0.007 **(0.005) (0.004)
Ratio of working-age population 0.150 *** 0.141 *** 0.134 ***to total population (0.054) (0.048) (0.050)
Adjusted Rsquared 0.753 0.741 0.735 0.773 0.758 0.790 0.790 0.800
Number of observations 61 60 82 60 60 60 60 60
Notes: Column 2 and subsequent regressions exclude Nicaragua. Column 3 includes industrial coun-tries. The regressions reported in columns 3 through 8 include the same set of basic controls (rows 2through 6) as those in columns 1 and 2, including dummies for oil-exporting countries and sub-SaharanAfrican countries. One, two, and three asterisks indicate statistical significance at the 10 percent, 5percent, and 1 percent levels, respectively.

Patterns of International Capital Flows and Their Implications for Economic Development 141
Robustness
We conducted a number of sensitivity experiments to ensure thatthe positive correlation between current account balances and growthis robust (detailed results are available from the authors). We firstchecked if the result is driven by failed states—countries that have verylow growth and receive lots of foreign aid. Dropping countries thatobtain an annual average aid of more than 10 percent of GDP shrankthe sample size by 10 countries, but the coefficient estimate on thecurrent account was larger than in the baseline and significant. We alsoconfirmed that no single country or group drives the estimate. Whenwe estimated slopes separately for each region, the coefficients werestatistically significant both for Asia and sub-Saharan Africa, but notfor Latin America.
A second concern could be that we are not picking up a cross-sectional result, but a time series result; the successful, rich countriesmay have started by running large deficits, but eventually becomerich enough to run surpluses. When we restricted the sample to (expost) middle-income countries—neither rich enough to be runninglarge surpluses, nor poor enough to be drawing aid—the coefficientestimate on the current account was again higher than in the baselineand significant. We also restricted our analysis to the period 1985-1997, the heyday of recent global integration and before a number ofemerging markets started building massive reserves. Again, we dropthe high-aid countries. The coefficient estimate on the currentaccount was once more higher than in the baseline.
It is worth emphasizing at this stage that we have identified a posi-tive association between current account balances and long-rungrowth in nonindustrial countries that holds in many subsamples. Atno point do we find a negative correlation, as might be suggested bystandard theoretical models. Particularly puzzling is that we havesome evidence that private capital inflows, such as FDI, do seem tobe positively associated with growth—more in line with the theory(see, for instance, Borensztein, De Gregorio, and Lee, 1998). Whilecorrelation is not causation, a number of questions do arise. Why dofast-growing nonindustrial countries not rely much overall on foreign

142 Eswar Prasad, Raghuram G. Rajan, and Arvind Subramanian
finance, even though they do seem to rely on some forms of privatefinance?10 Put differently, fast-growing countries that get a lot of netFDI must be using proportionately less of other forms of capital, oreven exporting these forms, so that their overall reliance on foreignfinance is low. Why is this so?
Some conjectures about explanations
There are a few, not mutually exclusive, possible explanations. Thefirst is that the factors that drive the investment opportunities that inturn lead to growth, such as exogenous increases in productivity ordemographic changes, also produce the domestic savings needed tofinance those opportunities—at least the fraction that is accessiblegiven institutional constraints. For example, in industrial countries,unexpected but sustained increases in productivity will producehigher current and future incomes, as well as higher investment ascorporations borrow to finance investment. In anticipation of higherfuture incomes, consumers will not just spend out of income but alsoborrow to consume more, and thus reduce savings. Therefore, highergrowth should be correlated with larger current account deficits, apattern we do see for industrial countries.
But what if the financial sector in a country is underdeveloped anddomestic and foreign finance cannot be easily intermediated to firmsor consumers? Then, corporate investment could be limited to thefunds firms generate internally from past investment, whileconsumers save much of the increased income stemming from theincrease in productivity. It is possible that an increase in productivitycould be accompanied by some increase in investment but an evengreater increase in savings, thus resulting in a positive correlationbetween growth and current accounts, as well as growth and savings.Savings, in this view, carries substantial information about a develop-ing country’s productivity, perhaps more than investment.
If foreign inflows responded largely to investment opportunities,there should be an unambiguously negative relationship betweengrowth and the current account. The fact that the relationship is posi-tive provides a hint that domestic savings is a driving force. Indeed,recall that Chart 8, which shows the smoothed plots of savings- and

Patterns of International Capital Flows and Their Implications for Economic Development 143
investment-to-GDP ratios against relative income levels, providessuggestive evidence that savings and the current account track eachother closely. The simple cross-sectional correlation between savingsand the current account is positive and strong (0.72) while thatbetween investment and the current account is much weaker (0.26).
When we included the savings-to-GDP ratio in our core specifica-tion, the coefficient on the current account is driven down to zero(results available from the authors). By contrast, when we includedthe investment-to-GDP ratio, the estimated coefficient on thecurrent account is virtually unchanged relative to the baseline. Thissuggests that the behavior of savings, not investment, is key to under-standing the relationship between the current account and growth.This is at odds with standard theoretical models. Given similar tech-nologies for a pair of developing countries, the one that can investmore—presumably by borrowing foreign capital to supplementdomestic savings—should grow faster during its transition or devel-opment phase, as its income level converges to that of advancedindustrial countries. Yet, the level of investment seems not to matterin explaining growth, when the level of domestic savings is included.
As suggested above, the relative underdevelopment of the financialsector might explain the strength of the link between productivityand savings in a poor economy (as well as the correlation betweengrowth and the current account). If the financial sector were strong,a sustained increase in productivity would not only result in moreinvestment (as firms borrow to take advantage of investment oppor-tunities), but also more consumption as consumers borrow inanticipation of their higher income. Conversely, a weak financialsector could translate a sustained increase in the productivity ofcertain sectors into weaker investment growth (Wurgler, 2000) andgreater savings growth.11 Note that this explanation requires that thesources of productivity growth for developing countries lie largelyoutside the financial system, or alternatively, that limited develop-ment of the financial system does not hold back productivity growth.This is not implausible, given that these countries are only catchingup in technology, and the role of the financial system in fosteringfrontier innovation is relatively limited.12

144 Eswar Prasad, Raghuram G. Rajan, and Arvind Subramanian
The data suggest that the quality of the financial system doesmatter. When we estimated the core specification separately fornonindustrial countries that have below-median financial develop-ment and for those that have above-median financial development,the coefficient is almost twice as large for the former and statisticallysignificant only in that case.
The explanations thus far constitute a relatively benign view of thepattern of global current account imbalances. The fastest-growingdeveloping countries generate more savings than they can use, inpart because their financial system may be underdeveloped. Thesurpluses (or the lower deficits) they run are both good news becausethey reflect the fact that investment is very productive and bad newsbecause they reflect the need to develop the financial system (so as topermit more resources to be productively invested, as well as topermit more borrowing for consumption). Foreign capital could bebeneficial in this view, but development of the domestic financialsystem is a necessary precondition.
A less-benign explanation is that excessive reliance on foreigncapital (that is, large current account deficits) can result in currencyovervaluation, especially if the quality of investment in a country isnot particularly good (so that the supply of nontraded goods doesnot grow commensurately with the increasing demand for them asforeign capital flows in, leading to what is traditionally called“Dutch disease”—an increasing relative price of nontraded goodsand exchange rate overvaluation). Such overvaluation can hurt thedomestic manufacturing sector, which is important for growth innonindustrial countries.
We find that overvaluation is negatively correlated with growth innonindustrial countries.13 Interestingly, we do not find any significantcorrelation between overvaluation and growth for industrial countries.One possible explanation is that the imperative to avoid overvaluationis greater for developing countries because of their greater need todevelop the low-value-added trade/manufacturing sector, an impera-tive that their industrial country counterparts have moved past as theyhave specialized to a much greater extent in high-value-added services.

Patterns of International Capital Flows and Their Implications for Economic Development 145
Another possibility is that industrial countries are institutionally moreadvanced, open, and flexible, and this helps them avoid the deleteri-ous effects of capital inflows on competitiveness.
But a country’s ability to avoid overvaluation also is affected byopenness to capital inflows. Preliminary evidence suggests that capitalinflows (but not policy measures of capital account openness) do seemto be related to proneness to overvaluation.
Again, we do not find a similar relationship between foreign capitalflows and the exchange rate for industrial countries. There could bemany (deeper) causes for a tendency for foreign capital flows to induceovervaluation in developing countries but not in industrial ones. Forexample, in Africa and Latin America, openness to capital possiblyreflects the power of political elites in imparting an urban/consump-tion bias to policies: In this view, openness to capital is part of acomplex of policies that tends to support consumption and overvalu-ation. This differential correlation is nevertheless interesting for ourpurposes and sheds some light on the impact of foreign capital.
Thoughts on global imbalances
Before we conclude, let us speculate about the recent emergence ofglobal imbalances in light of the findings of this paper. The now-standard view is that there were three distinct phases in the evolutionof global current account imbalances. In the first stage, in the late1990s, a variety of crises in the emerging markets and Japan led to acollapse in investment opportunities there, freeing up savings, whilestrong productivity growth made the United States an attractiveplace to invest in (Bernanke, 2005; World Economic Outlook, WEO,2005). In the second stage, in the early 2000s, the bursting of the ITbubble was met with very accommodative policies in developedcountries, particularly the United States. Consumption increasedand savings fell, especially in countries with robust mortgagemarkets, where rising house prices and the associated wealth effectsprovided good support. In the third stage, strong growth and theassociated oil and commodity price shock widened but also shiftedthe current account imbalances.

146 Eswar Prasad, Raghuram G. Rajan, and Arvind Subramanian
While the collapse in investment in Asian emerging markets duringthe first phase is well-documented and understood, the significantincrease in private savings in a number of emerging markets since thelate 1990s (WEO, 2005), including those that did not experiencecrisis, has not been commented upon. Indeed, in models of the firstphase, like Caballero, Farhi, and Gourinchas (2006), people in emerg-ing markets would not increase savings when faced with a loss of localinvestment opportunities and falling worldwide interest rates. Onecould invoke an enormous increase in the precautionary demand forsavings by citizens who have experienced crisis to explain the rise insavings, but it is hard to explain why private savings also increased somuch in noncrisis countries and why they continue to be high.
Our paper offers an alternative view. Perhaps it was not just theUnited States that experienced a surge in productivity (in partbecause of the information and communication technology revolu-tion). Partly because of the reorganization of global production andpartly because the surge was transmitted through global supply chainsand trade, so did emerging markets, including China.
It is not surprising that the United States, a flexible economy witha strong financial sector, was well-poised to take advantage of theproductivity shock. It increased its current account deficit, in themanner predicted by the standard intertemporal open economymodel (Glick and Rogoff, 1995). In the emerging markets that expe-rienced strong productivity growth, the rise in productivity may havegenerated an initial boom in investment in some, as weak financialsystems lent indiscriminately, followed by a bust, after which thefinancial systems, imbued with caution that comes from crisis, under-stood their limited ability to intermediate savings into domesticinvestment.14 Thus, the postcrisis increase in savings and reduction ininvestment in a number of emerging markets may have been themore normal response of countries with weak financial systems inresponse to productivity shocks. In sum, the asymmetric responses toa productivity shock that may have originated in the United States,but that got transmitted to its poorer trading partners, may well havecreated savings and investment patterns that led to the observedpattern of current account imbalances.

Patterns of International Capital Flows and Their Implications for Economic Development 147
Our paper, thus, suggests why despite both experiencing significantincreases in productivity over the last 10 years, the current accounts ofthe United States and China have moved very differently. Over thistime, China has averaged a current account surplus of 2.8 percent ofGDP, significant amounts of it invested in the United States, while theUnited States has averaged a current account deficit of 3.7 percent ofGDP. This pattern appears perverse and clearly runs counter to thebenchmark model of growth theory. Our results, by contrast, suggestthat, while China and the United States may be extreme observations inthe groups of developing and industrial countries, respectively, theyreflect a more general and historic pattern within their respective groups.
Finally, let us end on a note of caution. Even if imbalances are equi-librium responses to a particular set of circumstances, this does notmean that they can be sustained at this level into the medium term.When a large country runs a trade deficit of 6 percent of GDP for along time, it will eventually find financing harder to come by. Oneshould not confuse the words “equilibrium” and “stability.”
Discussion
What is clear from our analysis is that nonindustrial countries thathave relied on foreign capital have not grown faster than those thathave not. Indeed, taken at face value, there is a growth premium asso-ciated with these countries not relying on foreign finance—thoughwe do not have strong evidence to suggest this association is causal.Equally clearly, though, the reliance of these countries on domesticsavings to finance investment comes at a cost—there is less invest-ment and consumption than there would be if these countries coulddraw in foreign capital on the same terms as industrial countries.
It does not seem to us that these nonindustrial countries are buildingforeign assets just to serve as collateral, which can then draw in beneficialforms of foreign financing such as FDI (see, for example, Dooley, Folk-erts-Landau, and Garber, 2004).15 Rather, it seems to us that successfuldeveloping countries have limited absorptive capacity for foreignresources, whether it is because their financial markets are underdevelopedor because their economies are prone to overvaluation caused by rapidcapital inflows.

148 Eswar Prasad, Raghuram G. Rajan, and Arvind Subramanian
As countries develop, absorptive capacity grows. The strong recentgrowth of emerging Europe, accompanied by growing current accountdeficits, probably has a lot to do with the strengthening of their finan-cial sectors, in part through the entry of foreign banks. Only time willtell whether there are any effects on the exchange rate and on compet-itiveness, as well as whether this phenomenon is sustainable. So, allconclusions we draw from this episode have to be tentative.
What does all this mean for policies toward capital account open-ness? Any discussion of the merits of capital account openness is likelyto be very specific to a country.16 Our results suggest, however, thatinsofar as the need to avoid overvaluation is important and thedomestic financial sector is underdeveloped, greater caution towardcertain forms of foreign capital inflows might be warranted. At thesame time, financial openness may itself be needed to spur domesticfinancial development (see, for example, Rajan and Zingales, 2003,and Kose and others, 2006).
This suggests that, even though reformers in developing countriesmight want to wait to achieve a certain level of financial developmentbefore pushing for financial integration, the prospect of financialintegration and ensuing competition may be needed to spur domes-tic financial development. One approach worth considering might bea firm commitment to integrate financial markets at a definite futuredate, thus, giving time for the domestic financial system to developwithout possible adverse effects from capital inflows, even whilegiving participants the incentive to press for it by suspending thesword of future foreign competition over their heads.17
In conclusion, a pessimistic read of this paper would suggest thatbecause development itself may be the antidote to any of the delete-rious effects of foreign capital, or to the ability of poor countries toabsorb more capital, only some forms of foreign capital may play adirect role in the development process. Certainly, the role of foreigncapital in expanding a country’s resource constraints may be limited.A more optimistic read would qualify this with two importantcaveats. First, a better understanding of how to increase a country’sabsorptive capacity would allow developing countries to benefit from

Patterns of International Capital Flows and Their Implications for Economic Development 149
foreign finance, even during the process of development. Second, itmay be that some attributes of foreign capital, such as its volatility,contribute to the limited absorptive capacity of the recipients (see, forexample, Aizenman and others, 2004). There may be ways for coun-tries that send capital to nonindustrial countries to reduce thevolatility of the capital they send out. More research would clearlyelevate the level of optimism.
Authors’ note: The authors are grateful to Menzie Chinn, Josh Felman, Olivier Jeanne, andGian Maria Milesi-Ferretti for helpful comments and discussions and to Manzoor Gill,Ioannis Tokatlidis, and Junko Sekine for excellent research assistance. We also thank ourdiscussant, Susan Collins, and other participants at the Jackson Hole Symposium for usefulsuggestions. The views expressed in this paper are those of the authors, and do not necessar-ily represent those of the IMF, its management, or its board.

150 Eswar Prasad, Raghuram G. Rajan, and Arvind Subramanian
Appendix
Our baseline sample, which is similar to that of Bosworth andCollins (2003), includes 22 industrial and 61 nonindustrial coun-tries. (We are one short of the Bosworth-Collins sample as we do nothave some of the requisite data for Taiwan.)
Industrial countries
Australia (AUS), Austria (AUT), Belgium (BEL), Canada (CAN),Denmark (DNK), Finland (FIN), France (FRA), Germany (DFA),Greece (GRC), Iceland (ISL), Ireland (IRL), Italy (ITA), Japan(JPN), Netherlands (NLD), New Zealand (NZL), Norway (NOR),Portugal (PRT), Spain (ESP), Sweden (SWE), Switzerland (CHE),United Kingdom (GBR), and United States (USA).
Nonindustrial countries
Algeria (DZA), Argentina (ARG), Bangladesh (BGD), Bolivia(BOL), Brazil (BRA), Cameroon (CMR), Chile (CHL), China(CHN), Colombia (COL), Costa Rica (CRI), Cyprus (CYP), IvoryCoast (CIV), Dominican Republic (DOM), Ecuador (ECU), Egypt(EGY), El Salvador (SLV), Ethiopia (ETH), Ghana (GHA),Guatemala (GTM), Guyana (GUY), Haiti (HTI), Honduras (HND),India (IND), Indonesia (IDN), Islamic Republic of Iran (IRN), Israel(ISR), Jamaica (JAM), Jordan (JOR), Kenya (KEN), Korea (KOR),Madagascar (MDG), Malawi (MWI), Malaysia (MYS), Mali (MLI),Mauritius (MUS), Mexico (MEX), Morocco (MAR), Mozambique(MOZ), Nicaragua (NIC), Nigeria (NGA), Pakistan (PAK), Panama(PAN), Paraguay (PRY), Peru (PER), Philippines (PHL), Rwanda(RWA), Senegal (SEN), Sierra Leone (SLE), Singapore (SGP), SouthAfrica (ZAF), Sri Lanka (LKA), Tanzania (TZA), Thailand (THA),Trinidad and Tobago (TTO), Tunisia (TUN), Turkey (TUR), Uganda(UGA), Uruguay (URY), Venezuela (VEN), Zambia (ZMB), andZimbabwe (ZWE).

Patterns of International Capital Flows and Their Implications for Economic Development 151
Endnotes1Gourinchas and Jeanne (2006) provide evidence of a negative correlation
between capital inflows and investment rates.
2The simple explanation that in poor countries investment is constrained by theavailability of domestic savings is not enough, for growth would then be stronglycorrelated with domestic investment.
3The Appendix lists the countries in our sample. The sample does not include thetransition countries of Eastern Europe and the former Soviet Union, as data avail-ability for these countries is limited.
4Excluding the oil-exporting countries did not alter the basic patterns in Chart 2.We also constructed these plots using initial (1970) relative income, rather thanrelative income in each period, in order to take out the effects of income conver-gence. This also did not make much of a difference to the shapes of the plots.
5Indeed, there was a sharp surge in FDI flows to poorer countries between themid-1980s and the mid-1990s, reflecting a spate of privatizations, including intelecom and other utilities.
6We chose 1970 as the starting point mainly for data reasons: Both stock and flowdata become available after about 1970. We exclude Singapore, which is an outlier,from this chart. The sum of the stock of foreign assets and liabilities to GDP is themeasure of de facto integration recommended by Kose and others (2006). Feldsteinand Horioka interpret a strong positive correlation between domestic saving anddomestic investment (both measured relative to GDP) as an indicator of limitedintegration with international financial markets. Nonindustrial countries with alow correlation, which are presumed to be well-integrated with international finan-cial markets according to this measure, should grow faster according to the theory.We estimate country-specific Feldstein-Horioka correlations using nonoverlappingfive-year averaged data on savings and investment over the period 1970-2000.
7Kose and others (2006) note that studies using macroeconomic data have notbeen able to find strong evidence of the presumed benefits of financial integrationon growth. There is growing evidence that these benefits are contingent on levels ofhuman capital, financial development, and trade openness. Certain types of spillovereffects from financial integration have been detected more clearly in microeconomic(firm- and industry-level) data. It also may be that the positive growth effects will beevident only over longer periods. While three decades is presumably a long enoughperiod to detect the “short-run pain, long-run gain” view (see, for example,Krugman, 2002), it is also true that the integration of developing countries intointernational financial markets really took off only in the mid-1980s.

152 Eswar Prasad, Raghuram G. Rajan, and Arvind Subramanian
8A current account surplus has to equal the sum of (1) net private and officialoutflows of financial capital (this includes debt and nongrant aid, but not remit-tances—the latter should properly be reflected in the current account itself ); (2) neterrors and omissions (a positive number could, for instance, represent capital flightthrough unofficial channels); and (3) net accumulation of international reserves bythe government (typically, the central bank). Thus, the current account surplussummarizes the net amount of capital flowing out of the country, the excess ofdomestic savings over domestic investment (or, in the case of a current accountdeficit, the net amount of capital flowing in, or, equivalently, the excess of domes-tic investment over domestic savings).
9To generate this plot, country-year observations were stacked together over theperiod 1970-2000 and sorted by relative PPP-adjusted per capita income levels, withrelative income measured against the richest country in the sample in that year (theUnited States or, in some years, Switzerland). The smoothed plot was obtained usingthe Lowess routine in Stata. There are two reasons why the savings-investment plotfor developing countries does not fully match the current account plot. First, thecurves were fitted independently for the three variables. Second, because of measure-ment problems, the current-account-to-GDP ratio does not exactly match thedifference between the ratios of savings and investment to GDP for the developingcountries, especially in the early years of the sample.
10Clearly, one explanation must be that certain forms of private finance, like FDI,bring benefits, such as technology transfer, that go beyond financing.
11Jappelli and Pagano (1994) build a model showing how financial market imper-fections that limit the ability to borrow against future income could generate acorrelation between savings and growth in a fast-growing economy with a low levelof financial development.
12Bosworth and Collins (1999) find that FDI inflows have a large positive corre-lation with both investment and saving, implying no net change in the currentaccount. Perhaps one explanation is that savings increases as a result of productiv-ity growth, which also draws in FDI. Aghion, Comin, and Howitt (2006) alsoreport a positive correlation between FDI and lagged domestic savings but have adifferent explanation than ours.
13We use a measure of exchange rate overvaluation because of Johnson, Ostry, andSubramanian (2006). These authors estimate the following cross-section equationfor every year since 1970 for the sample of all countries:
log ρ i = α + β log y i + εi
where ρ is the log of the price level for country i in terms of the United States, andy is the level of per capita PPP GDP. The measure of overvaluation is then:
overvali = log ρ i – (α + β log y i).
Similar measures are used by Frankel (2003) and Rajan and Subramanian (2005).

Patterns of International Capital Flows and Their Implications for Economic Development 153
14Clearly, investment in China is not low, despite a less-than-effective financialsystem. A variety of agency problems at the provincial government level, in state-owned enterprises, and in state-owned banks have led to excessive investment insome areas. Nevertheless, Chinese savings are even higher than its high level ofinvestment. More generally, moderately developed financial systems may be morecautious about investing because they understand and operate within their limita-tions than either underdeveloped financial systems, which neither understand noroperate within their limitations, or developed financial systems that have overcomelimitations. Indeed, in addition to naturally being more cautious after experiencinga crisis, much of emerging Asia may have moved from underdeveloped to moder-ately developed after the crisis, which may explain the investment restraint.
15Why, for example, would Korea or Taiwan find comfort when they make directinvestments in China if it holds enormous amounts of U.S. government securities?
16For instance, capital account openness is more than just opening up to inwardflows; it also means allowing outward flows. Outward flows could relieve incipientappreciation pressures on the exchange rate, but also could be a source of fragility,especially if the financial sector is underdeveloped. The fragility associated with theexit of capital could be attenuated if an economy is more open to trade (Calvo,Izquierdo, and Mejia, 2004, and Frankel and Cavallo, 2004); trade openness couldalso mitigate the adverse effects of crises.
17The Chinese approach of trying to spur banking reform by committing toopening up their banking sector to foreign competition in early 2007 as part oftheir World Trade Organization commitments can be seen in this light. Prasad andRajan (2005) suggest an alternative strategy for dealing with the adverse effects ofinflows through controlled liberalization of outflows (essentially by securitizinginflows), which would allow countries experiencing large capital inflows to developtheir domestic financial markets and simultaneously mitigate appreciation pressuresassociated with the inflows.

154 Eswar Prasad, Raghuram G. Rajan, and Arvind Subramanian
References
Aghion, Philippe, Diego Comin, and Peter Howitt. 2006. “When Does DomesticSaving Matter for Economic Growth?” NBER Working Paper no. 12275(Cambridge, Mass.: National Bureau of Economic Research).
Aizenman, Joshua, Brian Pinto, and Artur Radziwill. 2004. “Sources for FinancingDomestic Capital—Is Foreign Saving a Viable Option for Developing Coun-tries?” NBER Working Paper no. 10624 (Cambridge, Mass.: National Bureau ofEconomic Research).
Alfaro, Laura, Sebnem Kalemli-Ozcan, and Vadym Volosovych. 2005. “Why Doesn’tCapital Flow from Rich to Poor Countries: An Empirical Investigation,” NBERPaper no. 11901 (Cambridge, Mass.: National Bureau of Economic Research).
Banerjee, Abhijit V., and Esther Duflo. 2005. “Growth Theory Through the Lensof Development Economics,” in Handbook of Economic Growth, ed. by PhilippeAghion and Steven N. Durlauf, vol. 1, part 1, pp. 473–552 (New York: Elsevier).
Bernanke, Ben S. “The Global Saving Glut and the U.S. Current Account Deficit,”http://www.federalreserve.gov/boarddocs/speeches/2005/200503102/default.htm.
Bernanke, Ben S., and Refet S. Gürkaynak. 2001. “Is Growth Exogenous? TakingMankiw, Romer, and Weil Seriously,” NBER Macroeconomics Annual 2001, pp. 11–57 (Cambridge, Mass.: National Bureau of Economic Research).
Bhagwati, Jagdish. 1998. “The Capital Myth: The Difference between Trade inWidgets and Dollars,” Foreign Affairs, vol. 7, no. 3, pp.7-12.
Borensztein, Eduardo, Jose De Gregorio, and Jong-Wha Lee. 1998. “How DoesForeign Direct Investment Affect Growth,” Journal of Development Economics,vol. 45 (June), pp. 115-35.
Bosworth, Barry P., and Susan M. Collins. 2003. “The Empirics of Growth: AnUpdate,” Brookings Papers on Economic Activity, no. 2, pp. 113–79.
___________. 1999. “Capital Flows to Developing Countries: Implications forSaving and Investment,” Brookings Papers on Economic Activity, no. 1, pp. 143–69.
Bulow, Jeremy, and Kenneth Rogoff. 1990. “Cleaning Up Third World DebtWithout Getting Taken to the Cleaners,” Journal of Economic Perspectives, vol. 4,no. 1 (Winter), pp. 31-42.
___________. 1989. “A Constant Recontracting Model of Sovereign Debt,”Journal of Political Economy, vol. 97, no. 1 (February), pp. 155–78.
Caballero, Ricardo J., Emmanuel Farhi, and Pierre-Olivier Gourinchas. 2006. “AnEquilibrium Model of ‘Global Imbalances’ and Low Interest Rates,” NBER WorkingPaper no. 11996 (Cambridge, Mass.: National Bureau of Economic Research).

Patterns of International Capital Flows and Their Implications for Economic Development 155
Calvo, Guillermo, Alejandro Izquierdo, and Luis-Fernando Mejía. 2004. “On theEmpirics of Sudden Stops: The Relevance of Balance-Sheet Effects,” proceedings,Federal Reserve Bank of San Francisco (June).
Carroll, Christopher D., and Lawrence H. Summers. 1989. “Consumption GrowthParallels Income Growth: Some New Evidence,” NBER Working Paper no. 3090(Cambridge, Mass.: National Bureau of Economic Research).
Carroll, Christopher D., and David N. Weil. 1994. “Saving and Growth: A Reinter-pretation,” Carnegie-Rochester Conference Series on Public Policy, vol. 40, pp. 133–92.
Caselli, Francesco. 2005. “Accounting for Cross-Country Income Differences,” inHandbook of Economic Growth, ed. by Philippe Aghion and Steven N. Durlauf,vol. 1A, pp. 679–741 (New York: Elsevier).
Caselli, Francesco, and James Feyrer. 2005. “The Marginal Product of Capital,”NBER Working Paper no. 11551 (Cambridge, Mass.: National Bureau ofEconomic Research).
Chinn, Menzie D., and Eswar Prasad. 2003. “Medium-Term Determinants ofCurrent Accounts in Industrial and Developing Countries,” Journal of Interna-tional Economics, vol. 59, pp. 47-76.
Chinn, Menzie D., and Hiro Ito. 2006. “What Matters for Financial Development? CapitalControls, Institutions, and Interactions,” Journal of Development Economics, forthcoming.
De Nicolo, Gianni, Luc Laeven, and Kenichi Ueda. 2006. “Corporate GovernanceQuality in Asia: Comparative Trends and Impact,” IMF manuscript.
Detragiache, Enrica, Thierry Tressel, and Poonam Gupta. 2006. “Foreign Banks inPoor Countries: Theory and Evidence,” IMF Working Paper no. 06/18 (Wash-ington, D.C.: International Monetary Fund).
Dooley, Michael P., David Folkerts-Landau, and Peter M. Garber. 2004b. “TheU.S. Current Account Deficit and Economic Development: Collateral for a TotalReturn Swap,” NBER Working Paper no. 10727 (Cambridge, Mass.: NationalBureau of Economic Research).
___________. 2004a. “The Revived Bretton Woods System: The Effects of Periph-ery Intervention and Reserve Management on Interest Rates and Exchange Ratesin Center Countries,” NBER Working Paper no. 10332 (Cambridge, Mass.:National Bureau of Economic Research).
Eaton, Jonathan, and Mark Gersovitz. 1981. “Debt with Potential Repudiation:Theoretical and Empirical Analysis,” Review of Economic Studies, vol. 48, no. 2(April), pp. 289–309.
Edwards, Sebastian. 2005. “Capital Controls, Sudden Stops, and Current AccountReversals,” NBER Working Paper no. 11170 (Cambridge, Mass.: NationalBureau of Economic Research).

156 Eswar Prasad, Raghuram G. Rajan, and Arvind Subramanian
Feldstein, Martin, and Charles Horioka. 1980. “Domestic Saving and InternationalCapital Flows,” The Economic Journal, vol. 90, no. 358 (June), pp. 314–29.
Frankel, Jeffrey, and Eduardo A. Cavallo. 2004. “Does Openness to Trade MakeCountries More Vulnerable to Sudden Stops or Less? Using Gravity to EstablishCausality,” NBER Working Paper no. 10957 (Cambridge, Mass.: National Bureauof Economic Research).
Gertler, Mark, and Kenneth Rogoff. 1990. “North-South Lending and Endoge-nous Domestic Capital Market Inefficiencies,” Journal of Monetary Economics,vol. 26, pp. 245–66.
Glick, Reuven, and Kenneth Rogoff. 1995. “Global Versus Country-SpecificProductivity Shocks and the Current Account,” Journal of Monetary Economics,vol. 35, issue 1 (February), pp. 159–92.
Gourinchas, Pierre-Olivier, and Olivier Jeanne. 2006a. “Capital Flows to Develop-ing Countries: The Allocation Puzzle,” IMF Working Paper, forthcoming.
___________. 2006b. “The Elusive Gains from International Financial Integra-tion,” Review of Economic Studies, forthcoming.
Guiso, Luigi, Tullio Jappelli, Mario Padula, and Marco Pagano. 2004. “FinancialMarket Integration and Economic Growth in the EU,” Economic Policy(October) pp. 523–77.
Hall, Robert E., and Charles Jones. 1999. “Why Do Some Countries Produce SoMuch More Output per Worker than Others?” The Quarterly Journal of Econom-ics, vol. 114, no. 1, pp. 83-116.
Hausmann, Ricardo, Lant Pritchett, and Dani Rodrik. 2005. “Growth Accelera-tions,” Journal of Economic Growth, vol. 10, pp. 303–29.
Houthakker, Hendrik. “An International Comparison of Personal Savings,”Bulletin of the International Statistical Institute, 38 (1961): 55-70.
Hsieh, Chang-Tai, and Peter J. Klenow. 2003. “Relative Prices and Relative Pros-perity,” NBER Working Paper no. 9701 (Cambridge, Mass.: National Bureau ofEconomic Research).
International Monetary Fund. 2005. World Economic Outlook, April and September issues.
Jappelli, Tullio, and Marco Pagano. 1994. “Savings, Growth, and LiquidityConstraints,” Quarterly Journal of Economics, vol. 109, no. 1 (February), pp. 83–109.
Johnson, Simon, Jonathan Ostry, and Arvind Subramanian. 2006. “Africa’s GrowthProspects: Benchmarking the Constraints,” IMF Working Paper, forthcoming(Washington, D.C.: International Monetary Fund).
Jones, Benjamin F., and Benjamin A. Olken. 2005. “The Anatomy of Start-StopGrowth,” NBER Working Paper no. 11528 (Cambridge, Mass.: National Bureauof Economic Research).

Patterns of International Capital Flows and Their Implications for Economic Development 157
Ju, Jiandong, and Shang-Jin Wei. 2006. “A Solution to Two Paradoxes of Interna-tional Capital Flows,” IMF Working Paper no. 06/178 (Washington, D.C.:International Monetary Fund).
Kose, M. Ayhan, Eswar Prasad, Kenneth Rogoff, and Shang-Jin Wei. 2006.“Financial Globalization: A Reappraisal,” IMF Working Paper, forthcoming.
Krugman, Paul. 2002. “Crises: The Price of Globalization?” Paper presented at2000 Symposium on Global Economic Integration (Kansas City: Federal ReserveBank of Kansas City).
Lane, Philip, and Gian Maria Milesi-Ferretti. 2001. “Long-Term Capital Move-ments,” NBER Macroeconomics Annual, vol. 16 (Cambridge, Mass.: MIT Press).
___________. 2006. “The External Wealth of Nations Mark II: Revised andExtended Estimates of Foreign Assets and Liabilities, 1970–2004,” IMFWorking Paper no. 06/69 (Washington, D.C.: International Monetary Fund).
Lucas, Robert. 1990. “Why Doesn’t Capital Flow from Rich to Poor Countries?”American Economic Review, vol. 80, no. 2 (May), pp. 92–6.
Obstfeld, Maurice, and Kenneth Rogoff. 2000. “The Six Major Puzzles in Interna-tional Macroeconomics: Is There a Common Cause?” NBER MacroeconomicsAnnual 2000 (Cambridge, Mass.: National Bureau of Economic Research).
Obstfeld, Maurice, and Alan M. Taylor. 2004. Global Capital Markets: Integration,Crisis, and Growth (Cambridge, U.K.: Cambridge University Press).
Prasad, Eswar, and Raghuram Rajan. 2005. “Controlled Capital Account Liberal-ization: A Proposal,” IMF Policy Discussion Paper, no. 05/7 (Washington, D.C.:International Monetary Fund)
Rajan, Raghuram G., and Arvind Subramanian. 2005. “What Undermines Aid’sImpact on Growth?” NBER Working Paper no. 11657 (Cambridge, Mass.:National Bureau of Economic Research).
Rajan, Raghuram G., and Luigi Zingales. 1998. “Financial Dependence andGrowth,” American Economic Review, vol. 88, no. 3 (June), pp. 559–86.
Razin, Ofair, and Susan Collins. 1999. “Real Exchange Rate Misalignments andGrowth,” in The Economics of Globalization: Policy Perspectives from PublicEconomics, Assaf Razin and Efraim Sadka, eds. (Cambridge, U.K.: CambridgeUniversity Press).
Reinhart, Carmen M., and Kenneth S. Rogoff. 2004. “Serial Default and the‘Paradox’ of Rich-to-Poor Capital Flows,” American Economic Review, vol. 94,no. 2 (May), pp. 53–8.
Rodrik, Dani. 1998. “Who Needs Capital-Account Convertibility?” Essays in Inter-national Finance, no. 207 (Princeton, N.J.: Princeton University).

Stiglitz, Joseph. 2000. “Capital Market Liberalization, Economic Growth, andInstability,” World Development, vol. 28, no. 6, pp.1075-86.
Wurgler, Jeffrey. 2002. “Financial Markets and the Allocation of Capital,” Journalof Financial Economics, vol. 58, no. 1–2 (October), pp. 187–214.
158 Eswar Prasad, Raghuram G. Rajan, and Arvind Subramanian