patterns of interhemispheric correlation during human
TRANSCRIPT

I~rrerrr. 1. N ~ w m x I C I I C L l C X 7 . Vol. 36. pp. 41-53 Photocopying permitted tsy licenw only
0 I Y X 7 Gordon and Breach. Science Puhlisherp. Inc. Printed in the United Kingdom
PATTERNS OF INTERHEMISPHERIC CORRELATION DURING HUMAN
COMMUNICATION
JACOB0 GRINBERG-ZYLBERBAUM Facultad de f’sicologia. Universidqd Nacional A utonoma de Mexico, Mexico City
iind Instituto Nacional para el Estudio de la Conciencia and
JULIETA RAMOS
Facultad de Psicologia. Universidad Nacional Autdnoma de Mexico
(Received November 21, 1986)
Correlation patterns between the electroencephalographic activity of both hemispheres in adult subjects were obtained. The morphology of these patterns for one subject was compared with another subject’s patterns during control situations without communication, and during sessions in which direct communication WAS stimulated. Neither verbalization nor visual or physical contact are necessary for direct communication to occur. The interhemispheric correlation patterns for each subject were observed to become similar during the communication sessions as compared to the control situations. These effects are not due to nonspecific factors such as habituation or fatigue. The results support the syntergk theory proposed by one of the authors (Grinberg-Zylberbaum).
Keywords: EEG piitterm, inrerhemispheric correla/ion
Every recording of electrophysiological activity in the brain is the result of a group of correlations of the activity of its neuronal elements; for example, the evoked potentials resulting from the complex sum of the activation of large neuronal populations. The same can be said of electroencephalographic activity which is also the result of a group of correlations of the elemental activity of neuronal units (John, 1972).
Furthermore, all electrophysiological activity is associated with psychological variables the subtlety and complexity of which increase in step with the increase in neuronal population and the number of correlations among the neuronal elements which give r ise to it. In this way, the late components of the evoked potentials, which are the result of a great number of neuronal elements correlated in time, are associated with psychological processes that are more complex than the first components of those evoked potentials (John et al., 1973; Johnston & Chesney, 1974; Grinberg-Zylberbaum & John, 198 1 ).
The complexity and subtlety of psychological activity, directly related to the correlation of the neuronal elements in physiological activity, can be clearly observed in studies of cerebral coherence. A measure of coherence is a measure of the similitude between the electrophysiological patterns recorded in different parts
This project was partly financed by the National Council for Science and Technology (CONACYT),
We wish to thank Jenny Lewis for the translation of the article, Miguel Angel Guevara and Daniel Mexico, through Poject Number PCCSCNA-030756.
Zarabozo for their technical assistance and Iztaccihuatl Carrasco for the illustrations.
41
Int J
Neu
rosc
i Dow
nloa
ded
from
info
rmah
ealth
care
.com
by
Uni
vers
ity o
f M
elbo
urne
on
09/1
2/14
For
pers
onal
use
onl
y.

42 J. GRINBERG-ZYLBERBAUM AND J. RAMOS
of the nervous system. High coherence implies a high similitude in pattern morphology while low coherence implies the opposite. Since coherence studies are studies of the correlations between the cerebral activity obtained in large neuronal populations, it is possible to suppose that their psychological correlates are fundamentally very subtle processes. Several studies indicate that this is true; for example, we know that there is a relationship between interhemispheric coherence levels in adult subjcts and the field dependence and field independence measurements in Witkin’s tests (O’Connor & Shaw, 1978). Furthermore, in research carried out in our laboratory (Grinberg-Zylberbaum, 19821, we found that there is a direct relationship between states of oneness, or contact with the self, and high levels of interhemispheric coherence; again in adult subjects. The literature (Orme-Johnson & Haynes, 198 1 ) has also reported relationships between levels of coherence and meditative states.
Some years ago, we began a series of experiments in an attempt to relate coherence levels and human communication processes. The studies so far have shown that there is a certain relationship between intersubject communication levels and individual interhemispheric coherences (Grinberg-Zylberbaum, 198 1 ). These findings show that it is the correlation between individual interhemispheric coherences which is associated with communication levels, that is, when the individual coherences of two subjects fluctuate in a correlative way, these subjects are in a process of empathic communication. On the other hand, when the variations in individual interhemispheric coherences are low, the subjects are not communicating. These studies were performed using electrophysiological activity and manual analysis techniques as the researchers only had access to rudimentary means to quantify activity. With the introduction and use of computing methods in the laboratory, we have been able to automate the measurement of interhemispheric coherences and have repeated the studies we carried out several years ago. This article is an attempt to share the results we have obtained by means of an automated analysis of the electrophysiological activity of human subjects during communication.
METHOD
Adult subjects were asked to sit comfortably inside a sound-proof Faraday cage. The subjects were instructed to remain still, in a state of almost total darkness, in silence, with their eyes closed and separated from one another by a distance of approximately 50 centimeters. The electroencephalographic activity of the right and left hemispheres of each subject was then recorded at bipolar frontal-occipital derivations. In some subjects, monopolar recordings were also made. The electroencephalographic activity was amplified using a Beckman polygraph with open filters of between 3 and 45 Hz. The subjects’ electroencephalographic activity was picked up by an instrumental FM recorder and then, after being transformed to digits by means of an analog-digital convertor, was subjected to analysis using a PDP 11-40 computer. Most of the experiments were carried out with pairs of subjects; a total of 13 pairs have been studied to date. Studies have also been carried out with four groups of three.
The electroencephalographic activity of each hemisphere in each subject was digitalized with a data sample every four ms. Every 256 ms (64 data) a correlation analysis was made using Pearson’s moment product algorithm. Approximately 320 correlations were made for ever 82 s of electroencephalographic activity. These
Int J
Neu
rosc
i Dow
nloa
ded
from
info
rmah
ealth
care
.com
by
Uni
vers
ity o
f M
elbo
urne
on
09/1
2/14
For
pers
onal
use
onl
y.

INTERHEMISPHERIC EEG PATTERNS 43
correlations were presented graphically in such a way that it was possible to obtain interhemispheric correlation patterns for each of the subjects during every session which lasted for an average of 15 min. The subjects were asked about the subjective experiences they had had during the communication session. Ten samples were taken for each experimental condition.
An A-B-A scheme was used to carry out some of the experiments. In period A, the activity of each of the subjects was recorded independently. The interhemispheric correlation graphs thus obtained were called graphs corresponding to an initial control situation. After the initial control period A, the subjects were instructed to communicate with one another inside the Faraday cage by becoming aware of each other's presence and signalling when they felt this had occurred. Some of the subjects reported that these feelings of presence involved physical sensations and others stated that they activated images and thoughts of the other person. For 15 min, in the conditions described above, recordings were made of their electrloencephalographic activity. This period was called period B or experimental communication period in pairs. This 15 min period was immediately followed by another period A' for the final control in which electroencephalographic activity was again recorded, but with the subjects in isolation and not communicating. Jn some cases, during the communication sessions, subjects were instructed to press a switch to indicate when they felt they were in direct (communication. On occasions, recordings were made of more than two subjects. Tlhese recordings were called group communication recordings.
In addition to individual interhemispheric correlation studies, studies were carried out which we called intersubject electroencephalographic concordance. In these studies the same A-B-A' methodology was used as in the interhemispheric correlation studies, but the activity of one subject's right hemisphere was correlated with the right hemisphere activity of another subject. Similarly, one subject's left hemisphere activity was correlated with that of another subject. In this way, correlations between electroencephalographic activity of pairs of subjects were obtained. These correlations had a density similar to the individual interhemispheric correlations that is, approximately 320 correlations every 82 s.
RESULTS
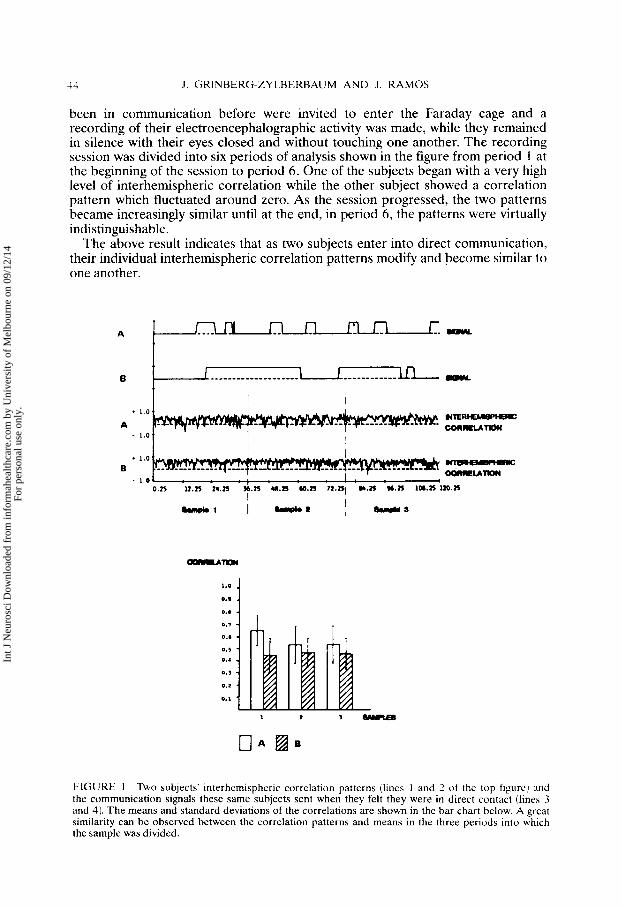
In Figure 1, two examples can be observed of the interhemispheric correlation patterns of two subjects during a session in which communication was said to be intense and deeply empathic. As well as the individual interhemispheric correlation patterns, this figure also shows the signal codes each of the subjects used, by pressing a swilch, to indicate the periods in which they felt they were in direct communication with their partners. It can be observed that during the 82 s recorded on th,e figure, a great number of signals were sent by the subjects. This indicates that communication was direct, while, at the same time, a great similitude can be observed in the morphology of the individual interhemispheric correlation patterns.
This shows rhat during direct communication, the interhemispheric correlation patterns of each subject are very alike. In the lower part of the figure, bars show the values of the means and standard deviations of the correlations at the beginning, middle and end of the session.
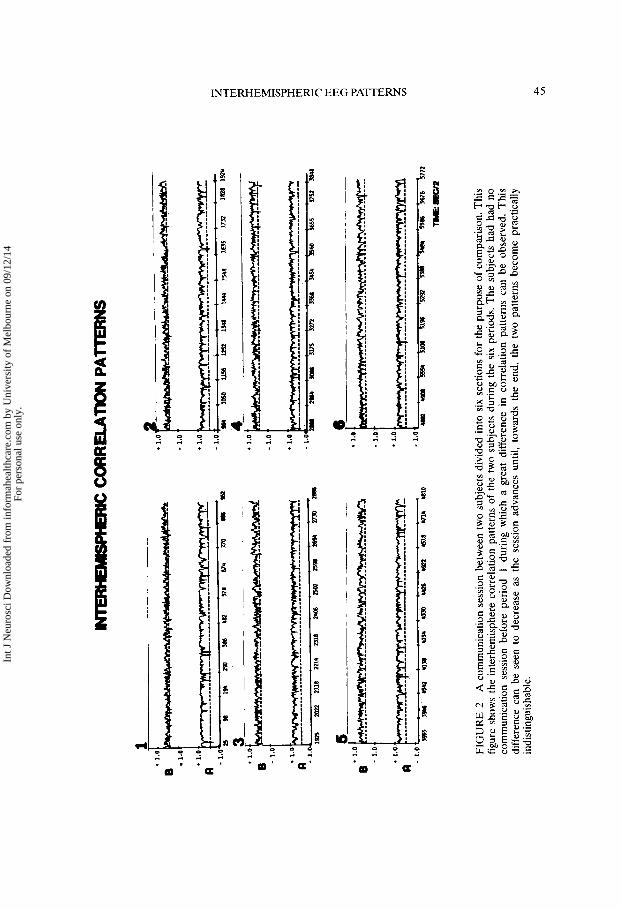
In order to analyze the dynamics and evolution of this similitude, we carried out the experiment shown in Figure 2. In this experiment, two subjects who had never
Int J
Neu
rosc
i Dow
nloa
ded
from
info
rmah
ealth
care
.com
by
Uni
vers
ity o
f M
elbo
urne
on
09/1
2/14
For
pers
onal
use
onl
y.
44 J . GRINBERG-ZYLBERBAUM AND J. RAMOS
been in communication before were invited to enter the Faraday cage and a recording of their electroencephalographic activity was made, while they remained in silence with their eyes closed and without touching one another. The recording session was divided into six periods of analysis shown in the figure from period 1 at the beginning of the session to period 6 . One of the subjects began with a very high level of interhemispheric correlation while the other subject showed a correlation pattern which fluctuated around zero. As the session progressed, the two patterns became increasingly similar until at the end, in period 6 , the patterns were virtually indistinguishable.
The above result indicates that as two subjects enter into direct communication, their individual interhemispheric correlation patterns modify and become similar to one another.
NlER- . 1.0
A CORRELAmN - 1.0
I I . 1.0 B
I - 1 I I
I -s
::: 1 0..
1 0.7
0.6
0.5
0.4
0. )
0.1
0.1
1
FIGURE 1 Two subjects' interhemispheric correlation patterns (lines 1 and 2 of the top figUreJ and the communication signals these same subjects sent when they felt they were in direct contact (lines 3 and 4). The means and standard deviations of the correlations are shown in the bar chart below. A great similarity can be observed between the correlation patterns and means in the three periods into which the sample was divided.
Int J
Neu
rosc
i Dow
nloa
ded
from
info
rmah
ealth
care
.com
by
Uni
vers
ity o
f M
elbo
urne
on
09/1
2/14
For
pers
onal
use
onl
y.
10
.1 -
0'1
- 0
'1. U
Int J
Neu
rosc
i Dow
nloa
ded
from
info
rmah
ealth
care
.com
by
Uni
vers
ity o
f M
elbo
urne
on
09/1
2/14
For
pers
onal
use
onl
y.

46 J. GRINBERG-ZYLBERBAUM AND J. RAMOS
A statistical analysis of the subjects' correlation averages can be seen in Figure 3 . The bars show the correlation averages during the six periods of analysis and their respective standard deviations. It can clearly be seen that as the session progresses, the individual interhemispheric correlation patterns become increasingly similar and in the last period there is even a superimposition of the standard deviations which indicates that by the end of the session no significant statistical differences exist between the individual interhemispheric correlations.
tD
0.0
O b
0.7
la8 a= 0.3
0.2
0.1
1 2 3 4
FIGURE 3 This is a figure of a bar chart showing interhemispheric correlation means and their corresponding standard deviations during the six communication periods shown in Figure 2. I t can be seen that as the session progresses the similarity in the correlation means increases until, in section 6 , there is even a superimposition of standard deviations.
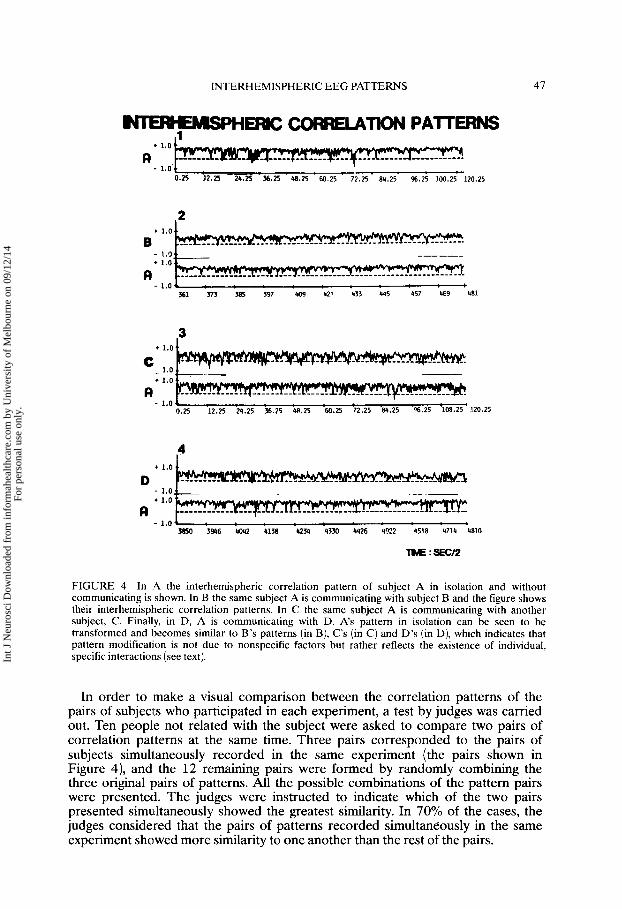
In order to discover whether the similarity between the interhemispheric correlation patterns observed during the direct communication sessions were specific or due to inspecific variables such as habituation, stereotype or fatigue, the following analysis was carried out. Figure 4 shows the individual interhemispheric correlation pattern of a subject in isolation. This pattern was compared with patterns obtained from the same subject when he established direct communication with three other subjects. In the figure it can be observed that the morphology of the individual pattern, shown in the first line, changes when the subject recorded enters into direct communication with another subject. This is shown in the next two lines of the figure. The patterns of the other pairs of subjects, of which this subject was one, also change and become similar to one another. These results indicate that the similitude between the individual interhemispheric correlation patterns is specific for each pair of subjects and is not due to inspecific variables such as fatigue, tiredness or habituation.
Int J
Neu
rosc
i Dow
nloa
ded
from
info
rmah
ealth
care
.com
by
Uni
vers
ity o
f M
elbo
urne
on
09/1
2/14
For
pers
onal
use
onl
y.
INTERHEMISPHERIC EEG PATTERNS 47
1.0 + I - .
0.23 12.25 29.25 36.25 48.25 60.25 72.25 84.25 96.25 1W.25 120.25
2 I
--__
361 373 385 397 1109 421 433 445 457 469 481
3 + 1.0
- 1.0 + 1.0
C
A - 1.0
0.25 12.25 29.25 36.25 120.25
4 I
+ 1.0
- 1.0 + 1.0
D
A - 1.0
3850 39M 4042 4138 9234 43M 4426 4922 4518 4714 9810
TME : sEc12
FIGURE 4 In 4 the interhemispheric correlation pattern of subject A in isolation and without communicating is shown. In B the same subject A is communicating with subject B and the figure shows their interhemispheric correlation patterns. In C the same subject A is communicating with another subject, C. Finally, in D, A is communicating with D. A’s pattern in isolation can be seen to be transformed and becomes similar to B’s patterns (in B), C’s (in C) and D’s (in D), which indicates that pattern modification is not due to nonspecific factors but rather reflects the existence of individual, specific interactions (see text).
In order to make a visual comparison between the correlation patterns of the pairs of subjec1:s who participated in each experiment, a test by judges was carried out. Ten people not related with the subject were asked to compare two pairs of correlation patterns at the same time. Three pairs corresponded to the pairs of subjects simullaneously recorded in the same experiment (the pairs shown in Figure 4), and the 12 remaining pairs were formed by randomly combining the three original pairs of patterns. All the possible combinations of the pattern pairs were presented. The judges were instructed to indicate which of the two pairs presented simu.ltaneously showed the greatest similarity. In 70% of the cases, the judges considered that the pairs of patterns recorded simultaneously in the same experiment showed more similarity to one another than the rest of the pairs.
Int J
Neu
rosc
i Dow
nloa
ded
from
info
rmah
ealth
care
.com
by
Uni
vers
ity o
f M
elbo
urne
on
09/1
2/14
For
pers
onal
use
onl
y.
48 J. GRINBERG-ZYLBERBAUM A N D J. RAMOS
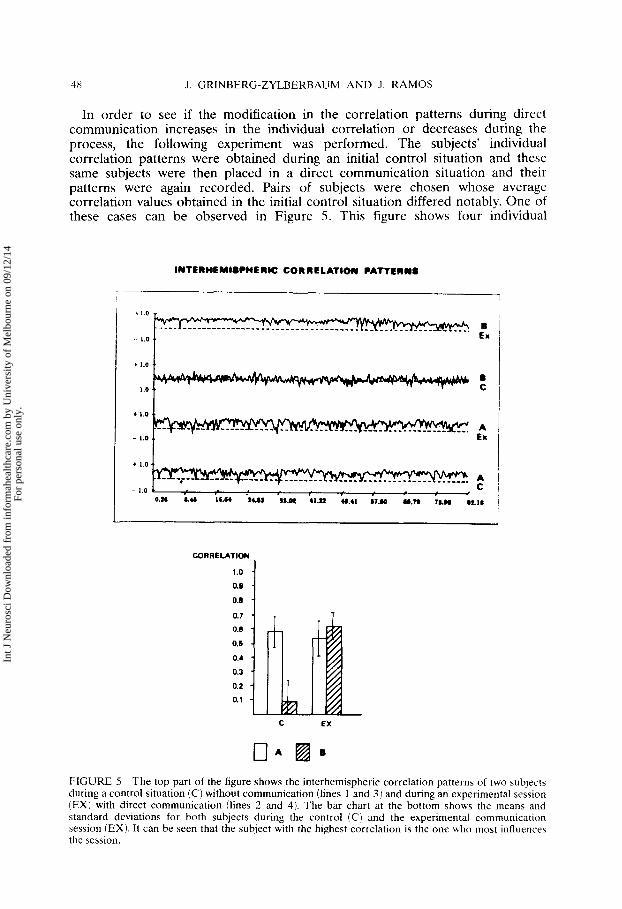
In order to see if the modification in the correlation patterns during direct communication increases in the individual correlation or decreases during the process, the following experiment was performed. The subjects’ individual correlation patterns were obtained during an initial control situation and these same subjects were then placed in a direct communication situation and their patterns were again recorded. Pairs of subjects were chosen whose average correlation values obtained in the initial control situation differed notably. One of these cases can be observed in Figure 5. This figure shows four individual
INTERHEMI8CUERtC CORRELATION PATTERN8
I
*l.O - B La - 1.0 (.
B C
CORRELATIOU j 0.1
0.4
0.3
0.2
0.1
C EX
FIGURE 5 The top part of the figure shows the interhemispheric correlation patterns of two subjects during a control situation (C) without communication (lines 1 and 3) and during an experimental session ( E X ) with direct communication (lines 2 and 4). The bar chart at the bottom shows the means and standard deviations for both subjects during the control (C) and the experimental communication session (EX). I t can be seen that the subject with the highest correlation is the one who most influence\ the session.
Int J
Neu
rosc
i Dow
nloa
ded
from
info
rmah
ealth
care
.com
by
Uni
vers
ity o
f M
elbo
urne
on
09/1
2/14
For
pers
onal
use
onl
y.
INTERHEMISPHERIC E E G PATTERNS 49
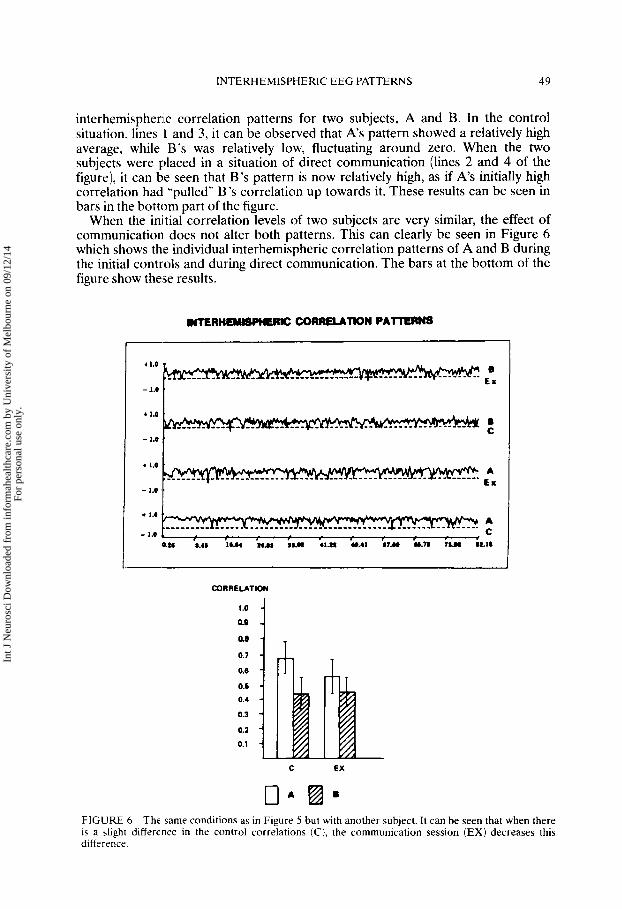
interhemispheric correlation patterns for two subjects, A and B. In the control situation, lines 1 and 3, it can be observed that A s pattern showed a relatively high average, while B 's was relatively low, fluctuating around zero. When the two subjects were placed in a situation of direct communication (lines 2 and 4 of the figure), it can be seen that B's pattern is now relatively high, as if A s initially high correlation had "pulled" B's correlation up towards it. These results can be seen in bars in the bottom part of the figure.
When the initial correlation levels of two subjects are very similar, the effect of communication does not alter both patterns. This can clearly be seen in Figure 6 which shows the individual interhemispheric correlation patterns of A and B during the initial controls and during direct communication. The bars at the bottom of the figure show these results.
a EX
4 1.0
- 1.0 '
a C - 1.0 '
A E x
- I . 1.0 A c
CORRELATION
1 ae 0.7
0.6
0.6
0.4
0.3
0.2
0.1
C EX
FIGURE 6 The same conditions as in Figure 5 but with another subject. It can be seen that when there is a slight difference in the control correlations (C), the communication session (EX) decreases this difference.
Int J
Neu
rosc
i Dow
nloa
ded
from
info
rmah
ealth
care
.com
by
Uni
vers
ity o
f M
elbo
urne
on
09/1
2/14
For
pers
onal
use
onl
y.
J. GRINBERG-ZYLBERBAUM AND J. RAMOS
INTERSUBJECT CORRELRTION P R T T E R N S
Am . I . #
i -1.8 .,.8
-1.8 .D A1 0.. ‘-1 C O I I L L A T I O *
-1.1
0
-1.1 8 . 1 I.Y 18.u ~ 6 . m nm 6 1 . 2 a . 4 1 n.u y.n )LII p
FINAL CONTROL .1.8
I -1.1 r1.0 I
ID -1.0 . .1.1 .
- 12 sec.
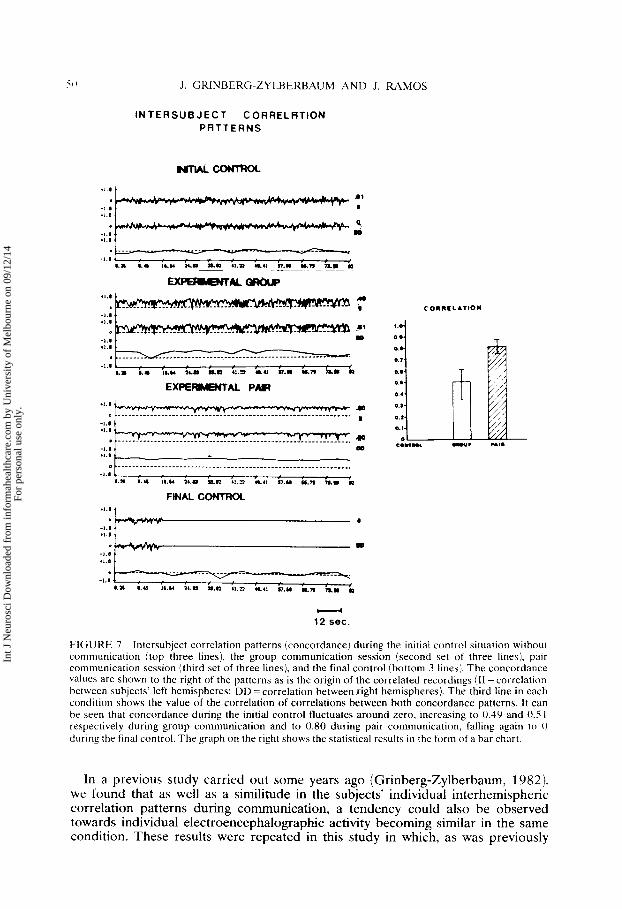
FIGURE 7 Intersubject correlation patterns (concordance) during the initial control situation without communication (top three lines), the group communication session (second set of three lines), pair communication session (third set of three lines), and the final control (bottom 3 lines). The concordance values are shown to the right of the patterns as is the origin of the correlated recordings ( I 1 =correlation between subjects’ left hemispheres; DD = correlation between right hemispheres). The third line in each condition shows the value of the correlation of correlations between both concordance patterns. It can be seen that concordance during the initial control fluctuates around zero. increasing to 0.49 and 0.5 1 respectively during group communication and to 0.80 during pair communication, falling again t o 0 during the final control. The graph on the right shows the statistical results in the form o f a bar chart.
In a previous study carried out some years ago (Grinberg-Zylberbaum, 1982). we found that as well as a similitude in the subjects’ individual interhemispheric correlation patterns during communication, a tendency could also be observed towards individual electroencephalographic activity becoming similar in the same condition. These results were repeated in this study in which, as was previously
Int J
Neu
rosc
i Dow
nloa
ded
from
info
rmah
ealth
care
.com
by
Uni
vers
ity o
f M
elbo
urne
on
09/1
2/14
For
pers
onal
use
onl
y.

51 INTERHEMISPHERIC EEG PATTERNS
mentioned, automated analyses of electroencephalographic activity correlations between subjects were carried out, thus obtaining what we call “intersubject concordance pa.tterns”.
E E G
A Initial
i a m s ~ a ~ u m m m.-
ldLU Group
communication
lILt1
Pair communication
FIGURE 8 Randomly taken EEG samples of two subjects during the initial control, group communication (with a distracting subject; see text), pair communication and the final control are presented. The similarity in recordings during the communication sessions as compared with the controls is noteworthy. Two subjects were chosen for this figure who showed the best and deepest empathetic relationship of all the pairs of subjects studied. They stated that during the communication sessions they felt {.hemselves “blend into” one another. This sensation decreased with the distracting subject during the group session.
Int J
Neu
rosc
i Dow
nloa
ded
from
info
rmah
ealth
care
.com
by
Uni
vers
ity o
f M
elbo
urne
on
09/1
2/14
For
pers
onal
use
onl
y.
57 J. GRINBERG-ZYLBERBAUM AND J . RAMOS
One example of a concordance study is shown in Figure 7. This figure shows the concordance patterns obtained from two subjects during a pair communication situation, an initial control situation, a group communication situation and a final control situation without communication. During the initial control, concordance values fluctuated around zero and increased extraordinarily during direct pair communication, to reach an average level of around 0.80. During the group communication, concordance decreased to a value of just over 0.40 and lastly, in the final control, it began to fluctuate around zero.
These results suggest that during direct communication, the electro- encephalographic activity of two human brains becomes very similar. The bars at the bottom of the figure show the results of this analysis.
Finally. Figure 8 presents random samples ot the electroencephalographic activity of two subjects during an initial situation without communication, during pair communication and during a final control without communication. The great similarity in direct electroencephalographic activity during the period of pair communication as compared to the initial and final control situations is noteworthy.
CONCLUSIONS AND DISCUSSION
The results obtained in this study clearly show that during direct communication a similitude exists between subjects’ individual interhemispheric correlation patterns. This similarity in patterns is not due to inspecific variables such as fatigue or habituation to the stereotype, but rather reflects the interaction between two o r more human beings during a communication process. Similarly, our results show that during direct communication the brains’ electroencephalographic activity becomes similar.
A theory exists which postulates that the brain is capable of creating a macroscopic alteration in the space-time lattice organization due to the energy interaction of all its neuronal elements. This alteration in space-time has been called the neuronal field (Grinberg-Zylberbaum, 198 1 ). The neuronal field results from the interaction of the activity of all the neuronal elements contained in one brain, and in accordance with this theory, called “the Syntergic Theory of the Creation of Experience,” the neuronal field is capable of abandoning its structure of origin and penetrating the space-time lattice changing its characteristics.
According to the syntergic theory, interactions take place between neuronal fields which could affect the cerebral activity of interacting brains. Our experimental results would indicate that this is the case. Two subjects are separated by a space of about 50 centimeters, they do not touch, do not communicate verbally, do not see or hear one another and yet they mutually affect one another by altering their individual interhemispheric correlation patterns and each one’s electroencephalographic activity.
The experiments in which changes are observed in the morphology of a subject‘s individual interhemispheric correlation patterns when he is in direct communication with another subject and in the variation of a pair’s correlation patterns when the same subject now interacts with a different subject, show that this alteration depends on specific factors.
It is important to note that the initial and final controls indicate that when a sample of EEG activity of one subject is compared with that of another subject no significant correlation value is obtained, indicating that the results obtained during communication cannot be abscribed to noise in the system. The fact that during
Int J
Neu
rosc
i Dow
nloa
ded
from
info
rmah
ealth
care
.com
by
Uni
vers
ity o
f M
elbo
urne
on
09/1
2/14
For
pers
onal
use
onl
y.
INTERHEMISPHERIC EEG PATTERNS 53
direct communication the high correlation values reflect specific interaction variables is shown by the decrease in these values during group communication. During group communication, a third subject apparently acts as a distracting stimulus in sudh a way that it is logical to have obtained a decrease in correlation and concordance values in this situation compared with the pair communication situation in which this presumed distraction did not exist.
Finally, our results cannot be explained by some inspecific electromagnetic induction from the cables we used because all of them were strictly isolated.
REFERENCES
Grinberg-Zylberbaum, J. ( 198 1 ). El Espacio y la Consciencia. Mexico City: Trillas. Grinberg-Zylberbaum, J. ( 1982). Psychophysiological correlates of communication, gravitation and
Grinberg-Zylberbaum, J., Cueli, J., Riefkohl, A,, & Szydlo, D. ( 198 1). Correlativos electrofisiologicos de
Grinberg-Zylberbaum, J. & John, E. R. (1981). Evoked potentials and concept formation in man.
John, E. R. (197:!). Switchboard versus statistical theories of learning and memory. Science, 177,
John, E. R., Bartlei t, F., Shimokochi, M., & Kleinman, D. (1973). Neural readout from memory. Journal
Johnston, U. S. & Chesney, G. L. (1974). Electrophysiological correlates of meaning. Science, Z86,
Orme Johnson, D. W. & Haynes, C. T. (198 1). EEG phase coherence, pure consciousness, creativity and
OConnor, K. P. & Shaw, J. C. (1978). Field dependence, laterality and the EEG. Biological fsychologv,
unity. The synlergic theory. Journal ofPsychophysicalSystems, 4, 227-256.
la comunicacion humana. Enserianza e Investigacidn en Psicologia. VII: 2 (1 4), 27 1.
Physiology anti Behavior, 27, 749-751.
850-864.
of Neurophysiology, 36,893-924.
944-946,
TM-Siddhi experiences. Neuroscience, Z3, 2 1 1-2 17.
6.93-109.
Int J
Neu
rosc
i Dow
nloa
ded
from
info
rmah
ealth
care
.com
by
Uni
vers
ity o
f M
elbo
urne
on
09/1
2/14
For
pers
onal
use
onl
y.