patterns of bat fatalities at wind energy facilities...
TRANSCRIPT

Invited Paper
Patterns of Bat Fatalities at Wind Energy Facilitiesin North America
EDWARD B. ARNETT,1 Bat Conservation International, Austin, TX 78746, USA
W. KENT BROWN, Terrestrial and Aquatic Environmental Managers Ltd., Calgary, AB T3C 3G9, Canada
WALLACE P. ERICKSON, Western EcoSystems Technology, Inc., Cheyenne, WY 82070, USA
JENNY K. FIEDLER, Tennessee Valley Authority, Regional Natural Heritage Program, Knoxville, TN 37902, USA
BRENDA L. HAMILTON, BLH Environmental Services, Pincher Creek, AB T0K 1W0, Canada
TRAVIS H. HENRY, Tennessee Valley Authority, Regional Natural Heritage Program, Knoxville, TN 37902, USA
AAFTAB JAIN,2 Iowa Cooperative Fish and Wildlife Research Unit, Iowa State University, Ames, IA 50011, USA
GREGORY D. JOHNSON, Western EcoSystems Technology, Inc., Cheyenne, WY 82070, USA
JESSICA KERNS,3 Appalachian Laboratory, University of Maryland, Frostburg, MD 21532, USA
ROLF R. KOFORD, United States Geological Survey, Iowa Cooperative Fish and Wildlife Research Unit, Iowa State University, Ames, IA 50011, USA
CHARLES P. NICHOLSON, Tennessee Valley Authority, Environmental Stewardship and Policy, Knoxville, TN 37902, USA
TIMOTHY J. O’CONNELL, Department of Natural Resource Ecology and Management, Oklahoma State University, Stillwater, OK 74078, USA
MARTIN D. PIORKOWSKI,4 Department of Zoology, Oklahoma State University, Stillwater, OK 74078, USA
ROGER D. TANKERSLEY, JR., Tennessee Valley Authority, Regional Natural Heritage Program, Knoxville, TN 37902, USA
ABSTRACT Wind has become one of the fastest growing sources of renewable energy worldwide, but widespread and often extensive
fatalities of bats have increased concern regarding the impacts of wind energy development on bats and other wildlife. We synthesized available
information on patterns of bat fatalities from a review of 21 postconstruction fatality studies conducted at 19 facilities in 5 United States regions
and one Canadian province. Dominance of migratory, foliage- and tree-roosting lasiurine species (e.g., hoary bat [Lasiurus cinereus]) killed by
turbines was consistent among studies. Bat fatalities, although highly variable and periodic, consistently peaked in late summer and fall,
coinciding with migration of lasiurines and other species. A notable exception was documented fatalities of pregnant female Brazilian free-
tailed bats (Tadarida brasiliensis) in May and June at a facility in Oklahoma, USA, and female silver-haired bats (Lasionycteris noctivagans)
during spring in Tennessee, USA, and Alberta, Canada. Most studies reported that fatalities were distributed randomly across turbines at a site,
although the highest number of fatalities was often found near the end of turbine strings. Two studies conducted simultaneously in the same
region documented similar timing of fatalities between sites, which suggests broader patterns of collisions dictated by weather, prey abundance,
or other factors. None of the studies found differences in bat fatalities between turbines equipped with lighting required by the Federal Aviation
Administration and turbines that were unlit. All studies that addressed relationships between bat fatalities and weather patterns found that most
bats were killed on nights with low wind speed (,6 m/sec) and that fatalities increased immediately before and after passage of storm fronts.
Weather patterns may be predictors of bat activity and fatality; thus, mitigation efforts that focus on these high-risk periods could reduce bat
fatality substantially. We caution that estimates of bat fatality are conditioned by length of study and search interval and that they are biased in
relation to how searcher efficiency, scavenger removal, and habitat differences were or were not accounted for. Our review will assist managers,
biologists, and decision-makers with understanding unifying and unique patterns of bat fatality, biases, and limitations of existing efforts, and it
will aid in designing future research needed to develop mitigation strategies for minimizing or eliminating bat fatality at wind facilities.
( JOURNAL OF WILDLIFE MANAGEMENT 72(1):61–78; 2008)
DOI: 10.2193/2007-221
KEY WORDS bat fatality, fatality searches, North America, wind energy facilities, wind turbines.
As concerns about climate change (see review in Inkley et al.2004) and increasing costs and long-term environmentalimpacts from the use of fossil fuels have heightened(McLeish 2002), wind has become an increasingly impor-tant sector of the energy industry and one of the fastestgrowing sources of renewable energy (Pasqualetti et al.2004). Wind-generated electricity is renewable and gen-erally considered environmentally clean, and recent techno-logical advances and tax subsidies have allowed commercialwind generation to compete with energy produced from
fossil fuels and nuclear power (Gipe 1995, Redlinger et al.2002). Unfortunately, fatalities of bats have been recorded atwind facilities worldwide, including Australia (Hall andRichards 1972), North America (Johnson et al. 2003a, b,2004; Fiedler 2004; Arnett 2005), and Europe (Ahlen 2002,Bach and Rahmel 2004, Durr and Bach 2004, Brinkman2006). Small numbers of bats were first recorded in theUnited States at wind energy projects in California, USA,during avian fatality searches (Orloff and Flannery 1992,Thelander and Rugge 2000). However, bat fatalities at windenergy facilities generally received little attention in NorthAmerica until 2003 when an estimated 1,400–4,000 batswere killed at the Mountaineer Wind Energy Center inWest Virginia, USA (Kerns and Kerlinger 2004). High batfatalities continued at the Mountaineer facility in 2004, andlarge kills also have been reported at facilities in Pennsylva-
1 E-mail: [email protected] Present address: Curry and Kerlinger, Syracuse, NY 13224, USA3 Present address: Western EcoSystems Technology, Inc., Ithaca, NY14850, USA4 Present address: Cornell Lab of Ornithology, Ithaca, NY 14850,USA
Arnett et al. � Bat Fatalities at Wind Energy Facilities 61

nia, USA, and Tennessee, USA (Fiedler 2004, Arnett2005). Although bats collide with other tall anthropogenicstructures, the frequency and magnitude of fatalities is muchlower than those observed at wind turbines (Arnett 2005,Cryan and Veilleux 2007). These fatalities raise concernsabout potential impacts on bat populations at a time whenmany species of bats are known or suspected to be in declineand extensive planning and development of wind energy isincreasing worldwide (Pierson 1998, Racey and Entwistle2003, Winhold and Kurta 2006, Energy InformationAdministration 2007, Kunz et al. 2007).
Postconstruction fatality searches at wind facilities origi-nally were designed to monitor annual or seasonal avianfatality rates, primarily for large raptors (Erickson et al.2002). Since the recent discovery of high bat fatalities atwind facilities in the eastern United States, however,postconstruction monitoring has intensified, and mostpermitting agencies now require estimates of bat fatalities.Sampling designs and methods for conducting fatalitysearches are well established (Anderson et al. 1999,Morrison et al. 2001). Important sources of field samplingbiases must be accounted for to correct estimates of fatalityand include 1) fatalities that occur on a highly periodic basis,2) carcass removal by scavengers, 3) searcher efficiency, 4)failure to account for the influence of site (e.g., vegetation)conditions in relation to carcass removal and searcherefficiency (Wobeser and Wobeser 1992, Philibert et al.1993, Anderson et al. 1999, Morrison 2002), and 5)fatalities or injured bats that may land or move outsidesearch plots.
Most estimators assume fatalities occur at uniformlydistributed, independent random times between search days.However, if the distribution of fatalities is highly clustered,then estimates may be biased, especially if carcass removalrates are high. Searches, especially those conducted at theleast frequent intervals (e.g., 14 days and 28 days), mayresult in highly biased estimates of fatalities if scavengingrates are high and poorly accounted for (Morrison 2002,Kerns et al. 2005). It also is well known that searcherefficiency or observer detection (i.e., the rate at whichsearchers detect carcasses) varies among individuals (Morri-son et al. 2001). Searcher efficiency and carcass scavengingshould be expected to vary considerably within and amongdifferent vegetation cover conditions (Wobeser and Wo-beser 1992, Philibert et al. 1993, Anderson et al. 1999,Morrison 2002). Additional factors affecting the precisionand accuracy of fatality estimates include search effort,including the number of turbines searched, intensity ofsearches within search plots, and the experience of observers(Anderson et al. 1999).
Documenting patterns of bat fatality is fundamental tounderstanding bat interactions with turbines, the timing andpredictability of fatality, and in developing solutions toreduce or eliminate fatalities. Few postconstruction studieson bat fatalities had been conducted in North Americabefore 2004 ( Johnson 2005), and, unfortunately, themajority of empirical data from wind facilities around the
world reside in unpublished reports. Synthesizing what littleinformation exists on bat fatalities would be useful foridentifying patterns and information gaps and for develop-ing hypotheses for field testing. Durr and Bach (2004) andBach and Rahmel (2004) reviewed data from studies inGermany, and they concluded that knowledge of factorsinfluencing bat fatality is unsatisfactory. Johnson (2005)reviewed 11 studies on bat fatalities at wind energy facilitiesin the United States and discussed patterns of speciescomposition and seasonal timing of fatalities. Here, wesynthesize available information on bat fatalities from 21studies conducted at 19 wind energy facilities in 5 regions ofthe United States and one province in Canada. Ourobjective was to present unifying and unique patterns fromthese studies; discuss the scope, biases, and limitations ofexisting efforts; identify information gaps; and offersuggestions for future research needed to develop mitigationstrategies for minimizing or eliminating bat fatality at windfacilities.
A REVIEW OF EXISTING LITERATURE
We synthesized information from existing wind facilities inNorth America with regard to characteristics of surroundinghabitat; turbines used; duration of studies; methods used;how field sampling biases were accounted for; and patternsof fatality in relation to species, gender, temporal and spatialrelationships, and weather (Appendix A). We only used datafrom studies published in scientific journals or unpublishedreports that were publicly available through an agency ororganization. We categorized studies by geographic regionfollowing Johnson (2005) and Kunz et al. (2007).
We present analytical results from individual studies, andwe did not attempt to develop our own estimates of fatalitiesusing data from these studies or perform statistical analysesof observed patterns using, for example, meta-analyticapproaches. We only report estimates of fatalities wherebias corrections (e.g., searcher efficiency and carcassremoval) were quantified and used to adjust estimates(Erickson et al. 2001, Morrison 2002). However, we cautionthat studies had varying levels of effort, used differentmethods to quantify bias, sometimes had low sample sizesfor both the numbers of trials and carcasses used, engagedbirds as surrogates for bats, and rarely accounted forvariation in searcher efficiency and carcass removal amonghabitat and visibility conditions (Appendices B, C). Wereported estimated fatalities per turbine from each study andcalculated estimates per megawatt (MW) by dividing thenumber of fatalities per turbine by the MW capacity of eachtype of turbine. Additionally, as another means of stand-ardizing results among studies and turbine sizes, we reportfatalities per 2,000 m2 of rotor-swept area, which wecalculated by multiplying the number of fatalities per turbineby 2,000 and dividing by the total rotor-swept area for eachtype of turbine. The last 2 metrics standardize results amongdifferent size and numbers of turbines, providing a moreappropriate metric for comparison among facilities. Wepresent patterns of fatalities in relation to species and sex
62 The Journal of Wildlife Management � 72(1)
composition, temporal and spatial relationships, influence oflighting, and weather for all studies reporting these data.
KEY FINDINGS FROM STUDIES INNORTH AMERICA
Our review of 21 studies from 19 different wind energyfacilities in 5 regions in the United States and one provincein Canada (Appendix A) indicates that number, type andsize of wind turbines, and habitats sampled varied consid-erably among facilities (Appendix B). The majority offacilities had one size and type of turbine, but 2 sites(Buffalo Mountain, TN, and Buffalo Ridge, MN, USA) had2 types of turbines operating. Most (16 of 21; 76%) facilitieswere located within agricultural cropland or landscapes withmixed habitats that included cropland, grazed and ungrazedgrasslands, pasture, woodlots, or habitats set aside byConservation Reserve Program, and 2 facilities (10%)occurred exclusively in short grass prairie (Appendix B).Only 3 facilities (15%) were located in completely forestedhabitats on ridges, all of which were in the eastern UnitedStates in deciduous forest.
Characteristics of Studies and Factors InfluencingEstimates of Bat FatalityTwelve (57%) studies were conducted for ,12 months andincluded either one spring or fall season or one of each,whereas 9 studies were conducted for �2 spring or fallseasons during �2 years (Appendix B). The 2 efforts of thelongest duration occurred at Buffalo Mountain in Tennessee(36 months; Nicholson 2003, Fiedler 2004, Fielder et al.2007) and Buffalo Ridge in Minnesota (48 months; Osbornet al. 1996; Johnson et al. 2003a, 2004). Ten (50%) studiesused 14–28-day intervals between searches at each turbine,and 5 studies used �2 different intervals during the study(Appendix C). Daily searches were performed at half theturbines at each of 2 facilities, one each in Pennsylvania andWest Virginia, but only covered a 6-week period from 31July to 13 September (Kerns et al. 2005; Appendix C). Dailysearches also were conducted at 10 of 120 turbines at onefacility in New York, USA (10 of 120 turbines weresearched on 3-day intervals, and 30 of 120 turbines weresearched at 7-day intervals; Jain et al. 2007).
Only 8 studies used bat carcasses to quantify searcher biasand scavenger removal, and most other studies usedpreviously frozen birds as surrogates for bats when perform-ing the bias correction trials (Appendix C). Searcherefficiency ranged from 25% to 75%, and it was lowest inforested sites in the eastern United States (25–42%) andgenerally was highest in more open habitats in the westernUnited States and Canada (42–75%). Bat carcasses lasted1.9–12 days, on average, during removal trials; birds lastedas long as 23 days, on average (Appendix C).
Most studies calculated an overall bias correction factor forthe entire study period and across different habitatconditions. Kerns et al. (2005) estimated searcher efficiencyand carcass removal for each of 3 strata that corresponded tohigh-, moderate-, and low-visibility habitats and estimated
the overall mean number of fatalities per turbine, summingindividual estimates calculated for each stratum.
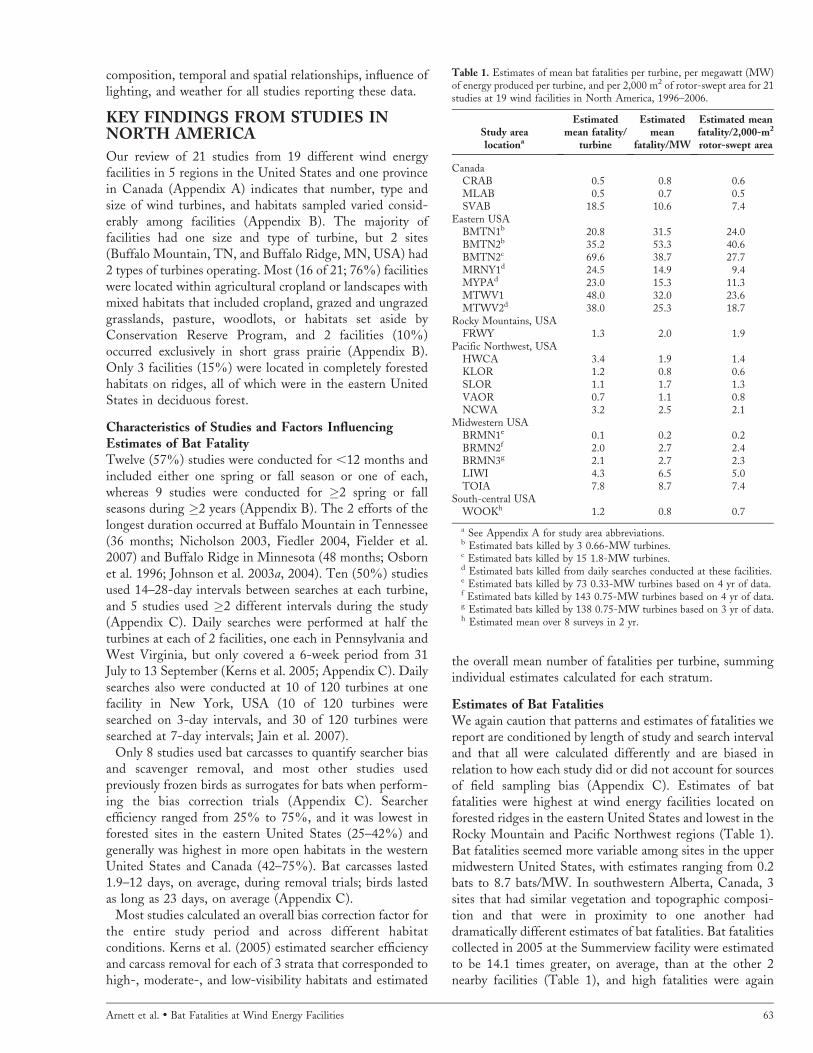
Estimates of Bat FatalitiesWe again caution that patterns and estimates of fatalities wereport are conditioned by length of study and search intervaland that all were calculated differently and are biased inrelation to how each study did or did not account for sourcesof field sampling bias (Appendix C). Estimates of batfatalities were highest at wind energy facilities located onforested ridges in the eastern United States and lowest in theRocky Mountain and Pacific Northwest regions (Table 1).Bat fatalities seemed more variable among sites in the uppermidwestern United States, with estimates ranging from 0.2bats to 8.7 bats/MW. In southwestern Alberta, Canada, 3sites that had similar vegetation and topographic composi-tion and that were in proximity to one another haddramatically different estimates of bat fatalities. Bat fatalitiescollected in 2005 at the Summerview facility were estimatedto be 14.1 times greater, on average, than at the other 2nearby facilities (Table 1), and high fatalities were again
Table 1. Estimates of mean bat fatalities per turbine, per megawatt (MW)of energy produced per turbine, and per 2,000 m2 of rotor-swept area for 21studies at 19 wind facilities in North America, 1996–2006.
Study arealocationa
Estimatedmean fatality/
turbine
Estimatedmean
fatality/MW
Estimated meanfatality/2,000-m2
rotor-swept area
CanadaCRAB 0.5 0.8 0.6MLAB 0.5 0.7 0.5SVAB 18.5 10.6 7.4
Eastern USABMTN1b 20.8 31.5 24.0BMTN2b 35.2 53.3 40.6BMTN2c 69.6 38.7 27.7MRNY1d 24.5 14.9 9.4MYPAd 23.0 15.3 11.3MTWV1 48.0 32.0 23.6MTWV2d 38.0 25.3 18.7
Rocky Mountains, USAFRWY 1.3 2.0 1.9
Pacific Northwest, USAHWCA 3.4 1.9 1.4KLOR 1.2 0.8 0.6SLOR 1.1 1.7 1.3VAOR 0.7 1.1 0.8NCWA 3.2 2.5 2.1
Midwestern USABRMN1e 0.1 0.2 0.2BRMN2f 2.0 2.7 2.4BRMN3g 2.1 2.7 2.3LIWI 4.3 6.5 5.0TOIA 7.8 8.7 7.4
South-central USAWOOKh 1.2 0.8 0.7
a See Appendix A for study area abbreviations.b Estimated bats killed by 3 0.66-MW turbines.c Estimated bats killed by 15 1.8-MW turbines.d Estimated bats killed from daily searches conducted at these facilities.e Estimated bats killed by 73 0.33-MW turbines based on 4 yr of data.f Estimated bats killed by 143 0.75-MW turbines based on 4 yr of data.g Estimated bats killed by 138 0.75-MW turbines based on 3 yr of data.h Estimated mean over 8 surveys in 2 yr.
Arnett et al. � Bat Fatalities at Wind Energy Facilities 63

recorded at Summerview in 2006 (E. Baerwald and R. M.R. Barclay, University of Calgary, unpublished data).Estimates from the only study conducted in the south-central United States were ,1 bat/MW, but only 2 searcheswere performed at each turbine in May and June for each of2 years of study (Piorkowski 2006).
Composition of Bat FatalitiesSpecies composition.—Of the 45 species of bats that
occur north of Mexico, 11 were reported killed at windenergy facilities (Johnson 2005, Kunz et al. 2007). On astate-by-state or provincial basis, the proportion of thenumber of species found killed at wind facilities ranged from11% to 86% of the number of species known to occur in thestate or province (Table 2). In most regions and individualstudies, bat fatalities seemed heavily skewed to migratoryfoliage-roosting species that included the hoary bat (Lasiuruscinereus), eastern red bat (Lasiurus borealis), and migratorytree and cavity-roosting silver-haired bat (Lasionycterisnoctivagans; Table 2). Hoary bats constituted high propor-tions of fatalities at most facilities (range¼ 9–88.1%; Table2). Silver-haired bats were found more frequently inCanada, Iowa, USA, and the Pacific Northwest relative tothe eastern United States, whereas eastern red bats werecommonly found in eastern forested sites and in themidwestern United States. Eastern pipistrelles (Pipistrellessubflavus) constituted as much as 25.4% of fatalities at
facilities in the eastern United States (Table 2). Fatalities ofsummer resident species, including little brown bats (Myotis
lucifugus) and big brown bats (Eptesicus fuscus), usually werelow (0–13.5%), except at one site each in Canada and Iowa,where little brown bats made up nearly 25% of the fatalities.The only 2 investigations at wind facilities within the rangeof the Brazilian free-tailed bat (Tadarida brasiliensis)reported high proportions of fatalities of that species(41.3% and 85.6% in CA and OK, respectively). TheBrazilian free-tailed bat is a long-distant migrant that roostscolonially in caves. No studies were reported in Texas, USA,or New Mexico, USA, where large colonies of Mexican free-tailed bats (Tadarida brasiliensis) were known to reside, andseveral wind energy facilities were in operation (Kunz et al.2007).
No study reported a species of bat listed as threatened orendangered under the Endangered Species Act killed at awind facility. However, there were few facilities operatingwithin the range of threatened and endangered species suchas the Indiana bat (Myotis sodalis). In Canada, 3 of thespecies (hoary, silver-haired, and eastern red bats) foundkilled at wind facilities were considered to be of specialmanagement concern provincially.
Age and sex.—Few studies reported age and sexcomposition of bat carcasses found at wind facilities, andmany carcasses could not be identified to age or sex due to
Table 2. Percentage of speciesa composition of bat fatalities at wind facilities in North America, 1996–2006 (modified from Johnson 2005).
Study locationb EPFU LABL LABO LACI LANO MYLU MYSE PISU TABR OtherTotal no.
bats found% of total no.
of speciesc
CanadaCRAB 57.7 13.4 23.1 5.8 52 33MLAB 1.9 87.0 1.9 9.2 54 44SVAB 0.8 0.2 45.9 51.1 1.1 0.9 532 56
Eastern United StatesBMTN1 0.9 60.5 9.6 1.8 25.4 1.8d 114 40BMTN2 0.4 60.9 13.0 7.6 17.2 0.8d 238 40MRNY1 5.4 13.0 45.9 14.6 13.5 7.6 384 56MYPA 6.9 27.5 45.4 5.7 2.7 0.7 8.0 0.5 262 78MTWV1 0.4 42.1 18.5 5.9 12.6 1.3 18.3 0.8 475 54MTWV2 2.5 24.1 33.7 4.8 9.8 24.6 0.5 398 54
Rocky Mountains, USAFRWY 1.5 88.1 3.7 4.4 2.2e 135 25
Pacific Northwest, USAHWCA 4.3 64.3 41.3 70 14KLOR 50.0 16.7 33.3e 6 13SLOR 1.6 46.1 50.0 0.8 1.6e 128 33VAOR 50.0 30.0 10.0 10.0e 10 20NCWA 44.0 56.0 27 13
Midwestern United StatesBRMN 1–3 3.6 17.4 65.0 4.8 1.9 1.7 5.7e 420 86LIWI 1.4 38.9 34.7 16.7 8.3 72 57TOIA 10.7 24.0 28.0 12.0 24.0 1.3 75 66
South-central United StatesWOOK 0.9 2.7 9.0 0.9 0.9 85.6 0.9 111 34
a EPFU¼ big brown bat; LABL¼ western red bat; LABO¼ eastern red bat; LACI¼ hoary bat; LANO¼ silver-haired bat; MYLU¼ little brown bat;MYSE ¼ northern long-eared bat; PISU¼ eastern pipistrelle; TABR ¼ Brazilian free-tailed bat.
b See Appendix A for study area abbreviations.c % of the total no. of species known to occur in each state or province known to have been killed by wind turbines.d At BMTN, 3 Seminole bats were killed (2 in Sep 2003 and 1 in Oct 2005).e Unidentified species.
64 The Journal of Wildlife Management � 72(1)

decomposition and scavenging by insects. Fatalities were
skewed toward males of the 4 most commonly killed species
at most facilities (Fig. 1). However, preliminary data suggest
the converse may be true in Oklahoma with Mexican free-
tailed bats (Piorkowski 2006). In Canada, female silver-
haired bats were killed more frequently than males, whereas
the opposite was true for hoary bats. Although it is intuitive
that inexperienced juveniles could be more susceptible to
collisions with wind turbines, data generally do not support
this hypothesis. Theoretically, there should at least be an
equal number of young versus adult males in lasiurine
populations, assuming sex ratios at birth are equal in hoary
bats, silver-haired bats, and eastern pipistrelles that have litter
sizes of 2 bats (Kunz 1982, Shump and Shump 1982b,
Barclay and Harder 2003). Because red bats produce an
average litter of 4 bats (Kunz 1982, Shump and Shump
1982a, Ford et al. 2001), there should be twice as many young
red bats as adult red bats. Thus, it seems more likely that there
could be differential probability of attraction to or collision
with turbines between adults and juveniles, especially male
lasiurines. An exception was Buffalo Mountain in Tennessee
in 2005 where juveniles often were killed at equal or higher
rates than adults for red bats, silver-haired bats, and easternpipistrelles (Fig. 1; Fiedler et al. 2007).
Temporal Patterns of Bat FatalitiesSeasonal timing of fatality.—The highest bat fatalities at
wind energy facilities were consistently reported during latesummer and early fall ( Johnson 2005, Kunz et al. 2007),although few studies spanned the entire season when batsare active (generally Apr–Nov). In Iowa, the temporaldistribution of fatalities peaked in August, with substantialnumbers in July and September. At all 3 facilities in Alberta,numbers of bat fatalities increased in early August, peaked inlate August, and ended in early October. At BuffaloMountain in Tennessee, 75% of bat fatalities occurredbetween 1 August and 15 September. In 2005, the peak wasvery pronounced, with 61% of fatalities occurring between15 and 30 August, whereas fatalities were more dispersedduring 2000–2003, with 96% occurring during an 88-dayperiod centered on 22–23 August (Fiedler et al. 2007).Trends in bat activity during 2002 and 2003 in Tennessee,as measured by acoustic detectors, supported seasonalpatterns of fatality; bat activity levels quadrupled by mid-August, after beginning to increase in mid-July to earlyAugust, and then decreased to previous levels by early to
Figure 1. Percentage of adult male (AM), juvenile male (JM), adult female (AF), and juvenile female (JF) bat fatalities for hoary bats, eastern red bats, silver-haired bats, and eastern pipistrelle found at wind energy facilities (see Appendix A) in North America, 1996–2006.
Arnett et al. � Bat Fatalities at Wind Energy Facilities 65
mid-September (Fiedler 2004). In New York, Jain et al.
(2007) found that bat fatalities were low in the mid-June,
peaked from mid-July to mid-August, and then declined
precipitously through mid-November. Studies from Ger-
many also supported this pattern of seasonal fatality during
the fall migration period (Durr and Bach 2004, Brinkmann
2006).
Of 272 silver-haired bat fatalities at Summerview in
Alberta, 16 (6%) occurred in May and June, suggesting
spring migratory fatalities occurred, at least in this region. In
Tennessee, 16 of 19 (84%) silver-haired bats killed were
found between mid-April and early June, supporting similar
findings in Alberta and the contention that fatalities at wind
facilities can be anticipated during spring migration, at least
for silver-haired bats.
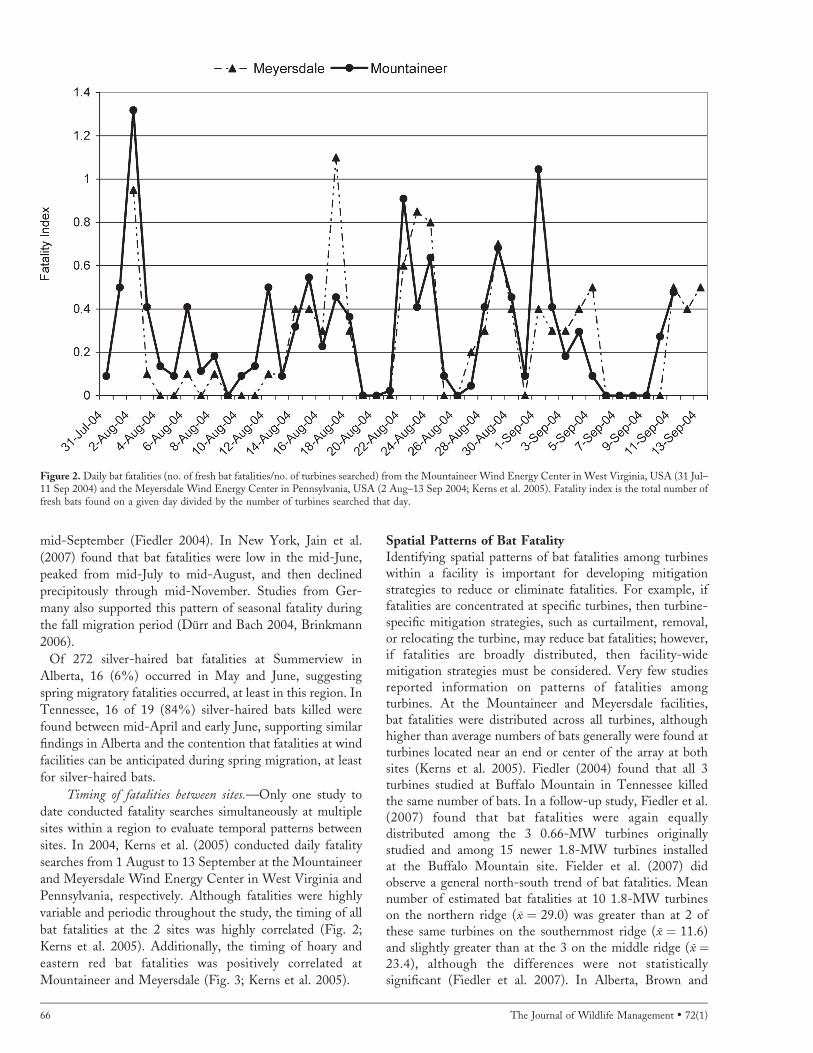
Timing of fatalities between sites.—Only one study to
date conducted fatality searches simultaneously at multiple
sites within a region to evaluate temporal patterns between
sites. In 2004, Kerns et al. (2005) conducted daily fatality
searches from 1 August to 13 September at the Mountaineer
and Meyersdale Wind Energy Center in West Virginia and
Pennsylvania, respectively. Although fatalities were highly
variable and periodic throughout the study, the timing of all
bat fatalities at the 2 sites was highly correlated (Fig. 2;
Kerns et al. 2005). Additionally, the timing of hoary and
eastern red bat fatalities was positively correlated at
Mountaineer and Meyersdale (Fig. 3; Kerns et al. 2005).
Spatial Patterns of Bat FatalityIdentifying spatial patterns of bat fatalities among turbineswithin a facility is important for developing mitigationstrategies to reduce or eliminate fatalities. For example, iffatalities are concentrated at specific turbines, then turbine-specific mitigation strategies, such as curtailment, removal,or relocating the turbine, may reduce bat fatalities; however,if fatalities are broadly distributed, then facility-widemitigation strategies must be considered. Very few studiesreported information on patterns of fatalities amongturbines. At the Mountaineer and Meyersdale facilities,bat fatalities were distributed across all turbines, althoughhigher than average numbers of bats generally were found atturbines located near an end or center of the array at bothsites (Kerns et al. 2005). Fiedler (2004) found that all 3turbines studied at Buffalo Mountain in Tennessee killedthe same number of bats. In a follow-up study, Fiedler et al.(2007) found that bat fatalities were again equallydistributed among the 3 0.66-MW turbines originallystudied and among 15 newer 1.8-MW turbines installedat the Buffalo Mountain site. Fielder et al. (2007) didobserve a general north-south trend of bat fatalities. Meannumber of estimated bat fatalities at 10 1.8-MW turbineson the northern ridge (x ¼ 29.0) was greater than at 2 ofthese same turbines on the southernmost ridge (x ¼ 11.6)and slightly greater than at the 3 on the middle ridge (x ¼23.4), although the differences were not statisticallysignificant (Fiedler et al. 2007). In Alberta, Brown and
Figure 2. Daily bat fatalities (no. of fresh bat fatalities/no. of turbines searched) from the Mountaineer Wind Energy Center in West Virginia, USA (31 Jul–11 Sep 2004) and the Meyersdale Wind Energy Center in Pennsylvania, USA (2 Aug–13 Sep 2004; Kerns et al. 2005). Fatality index is the total number offresh bats found on a given day divided by the number of turbines searched that day.
66 The Journal of Wildlife Management � 72(1)

Hamilton (2002, 2006a, b) found no discernible patterns ofcollisions at any of the wind facilities studied, and fatalitieswere not significantly greater at end-row or mid-rowturbines, although preliminary findings from a new studyat Summerview suggest a possible north-south trend infatalities (R. M. R. Barclay and E. Baerwald, personalcommunication).
If fatalities are related to habitat or topographic character-istics, then understanding these relationships may help indeveloping mitigation strategies (e.g., avoiding placement ofturbines near open water sources or a known cave roost).Many wind energy facilities occur in settings with too littlehabitat or topographic variation among turbines to allow anevaluation of landscape relationships with bat fatalities, but
Figure 3. Daily bat fatalities (no. of fresh bat fatalities/no. of turbines searched) of hoary and eastern red bats from the Mountaineer Wind Energy Center inWest Virginia, USA (31 Jul–11 Sep 2004) and the Meyersdale Wind Energy Center in Pennsylvania, USA (2 Aug–13 Sep 2004; Kerns et al. 2005). Fatalityindex is the total number of fresh bats found on a given day divided by the number of turbines searched that day.
Arnett et al. � Bat Fatalities at Wind Energy Facilities 67
some facilities did allow such examination. In Minnesota,Johnson et al. (2004) did not find a significant relationshipbetween the number of bat fatalities and any of the 10 covertypes within 100 m of turbines. Moreover, Johnson et al.(2004) found no relationship between fatalities and distanceto nearest wetland or woodlot. In Oklahoma, USA,Piorkowski (2006) found that fatalities of Brazilian free-tail bats were closely associated with wooded ravines in Mayand June 2004, but he did not observe this pattern in 2005.Jain et al. (2007) examined the relationship between thenumber of bat fatalities and distance to wetlands, and theyfound no significant relationship from daily and 3-daycarcass searches, but they did find a significant negativerelationship between number of fatalities and distance towetlands for 7-day searches, thus offering some support forthe suggestion that turbines located closer to wetlands maykill more bats. No other studies we reviewed reportedassociations with landscape or topographic features. InGermany, Brinkmann (2006) did not find relationshipsbetween bat fatalities and location of turbines in differenthabitats or altitudes.
Relationships Between Turbine Size and Bat FatalityThe height and dimensions of the rotor-swept area ofturbines seemed to have some influence on bat fatality.During the second phase of study at Buffalo Mountain inTennessee, 0.66-MW turbines that had 65-m-tall towersand 1,735-m2 rotor-swept area killed fewer bats per turbinebut more bats per MW than adjacent 1.8-MW turbineswith 78-m towers and nearly 3 times the total rotor-sweptarea (Table 1). At the Buffalo Ridge site in Minnesota, tallerturbines with greater rotor-swept areas killed more bats perturbine and per MW compared with smaller turbines. InAlberta, estimated fatalities were 14.1 times fewer, onaverage, at 2 facilities with 0.66-MW turbines with 50-m-tall towers and 1,735-m2 rotor-swept area, compared withone facility with 1.8-MW turbines with 65-m towers and5,027-m2 rotor-swept area (Table 1). However, these siteswere not sampled simultaneously during the same years, andthis difference could have resulted from annual variation orsome other factor. Interestingly, the 0.66-MW turbinesused in Canada were mounted on 50-m monopoles,compared with 65-m-tall turbines used on the same typeof turbine at Buffalo Mountain, Tennessee, where consid-erably higher numbers of fatalities were observed, whichoffers some support for the hypothesis that taller turbinesmay kill more bats (Barclay et al. 2007).
Relationships Among Turbine Operation, Weather, andBat FatalityOf the 64 turbines studied at the Mountaineer andMeyersdale facilities, one (turbine 11 at Mountaineer) wasnonoperational throughout the study period, and it was theonly turbine where no fatalities were observed in 2004(Kerns et al. 2005). Searches at this same turbine withLabrador retrievers trained to find dead bats also found nobat fatalities (Arnett 2005, 2006). Additionally, none of thestudies we reviewed reported bat fatalities associated with
meteorological towers. These findings support the con-tention that bats collide with spinning turbine blades andthat they do not strike stationary blades or towers (Arnett2005).
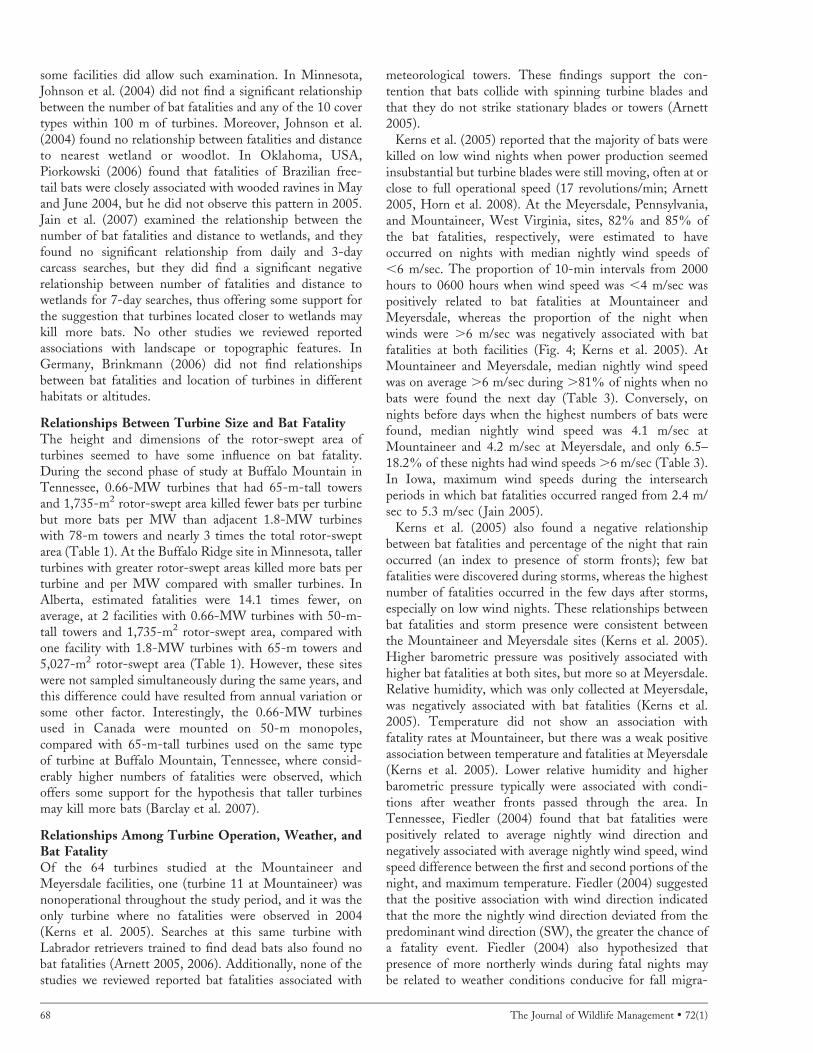
Kerns et al. (2005) reported that the majority of bats werekilled on low wind nights when power production seemedinsubstantial but turbine blades were still moving, often at orclose to full operational speed (17 revolutions/min; Arnett2005, Horn et al. 2008). At the Meyersdale, Pennsylvania,and Mountaineer, West Virginia, sites, 82% and 85% ofthe bat fatalities, respectively, were estimated to haveoccurred on nights with median nightly wind speeds of,6 m/sec. The proportion of 10-min intervals from 2000hours to 0600 hours when wind speed was ,4 m/sec waspositively related to bat fatalities at Mountaineer andMeyersdale, whereas the proportion of the night whenwinds were .6 m/sec was negatively associated with batfatalities at both facilities (Fig. 4; Kerns et al. 2005). AtMountaineer and Meyersdale, median nightly wind speedwas on average .6 m/sec during .81% of nights when nobats were found the next day (Table 3). Conversely, onnights before days when the highest numbers of bats werefound, median nightly wind speed was 4.1 m/sec atMountaineer and 4.2 m/sec at Meyersdale, and only 6.5–18.2% of these nights had wind speeds .6 m/sec (Table 3).In Iowa, maximum wind speeds during the intersearchperiods in which bat fatalities occurred ranged from 2.4 m/sec to 5.3 m/sec (Jain 2005).
Kerns et al. (2005) also found a negative relationshipbetween bat fatalities and percentage of the night that rainoccurred (an index to presence of storm fronts); few batfatalities were discovered during storms, whereas the highestnumber of fatalities occurred in the few days after storms,especially on low wind nights. These relationships betweenbat fatalities and storm presence were consistent betweenthe Mountaineer and Meyersdale sites (Kerns et al. 2005).Higher barometric pressure was positively associated withhigher bat fatalities at both sites, but more so at Meyersdale.Relative humidity, which was only collected at Meyersdale,was negatively associated with bat fatalities (Kerns et al.2005). Temperature did not show an association withfatality rates at Mountaineer, but there was a weak positiveassociation between temperature and fatalities at Meyersdale(Kerns et al. 2005). Lower relative humidity and higherbarometric pressure typically were associated with condi-tions after weather fronts passed through the area. InTennessee, Fiedler (2004) found that bat fatalities werepositively related to average nightly wind direction andnegatively associated with average nightly wind speed, windspeed difference between the first and second portions of thenight, and maximum temperature. Fiedler (2004) suggestedthat the positive association with wind direction indicatedthat the more the nightly wind direction deviated from thepredominant wind direction (SW), the greater the chance ofa fatality event. Fiedler (2004) also hypothesized thatpresence of more northerly winds during fatal nights maybe related to weather conditions conducive for fall migra-
68 The Journal of Wildlife Management � 72(1)

tion, and negative associations with the other 3 variablesindicated that fatality occurrence was more likely duringcooler nights with calmer, less variable winds.
Aviation Lighting and Bat FatalitySeveral species of bats are known to congregate and feed atdifferent types of lights, and it has been hypothesized thattowers lit with Federal Aviation Administration (FAA)lights may attract bats and increase the probability ofcollision with turbine blades, either because of or inde-pendently of a possible attraction to insect prey (Fenton1997, Kunz et al. 2007). Federal Aviation Administrationlights typically are installed on the turbine nacelle, close tothe height of the rotor hub. However, none of the studieswe reviewed demonstrated statistically significant differencesin fatality between turbines equipped with FAA lights andthose that were unlit. For example, at McBride Lake and
Summerview, Alberta, the number of observed collisions didnot differ from expected collisions for lit and unlit turbinesat both sites (Brown and Hamilton 2006a). Kerns et al.(2005) found an average of 9.3 (þ 0.5 SE) bat fatalities perturbine at lit turbines and 9.7 (þ 0.3 SE) at unlit turbines atthe Mountaineer, West Virginia, facility, and 11.9 (þ 1.7SE) bat fatalities per turbine at lit turbines and 13.2 (þ 1.2SE) at unlit turbines at the Meyersdale, Pennsylvania,facility. Jain et al. (2007) similarly found no significantdeviation from expected number of bat fatalities within 40 mof turbines that were lit compared with unlit turbines at theMaple Ridge facility in New York. In Iowa, all towers werelit with some type of FAA lighting; 46 towers were lit withnonpulsating red beacons, 37 towers situated on theperiphery of the wind facility had pulsating red beacons,and, due to proximity to the Lake Mills Municipal Airport,6 towers northwest of the wind facility had a combination offlashing white beacons and nonflashing red beacons (Jain2005). There was no significant difference in bat fatalitydetected among these towers with 3 types of FAA lighting(flashing red beacons, dual red beacons and flashing whitebeacons, and steady glowing red beacons). Controlledstudies comparing bat fatalities at turbines with red andwhite FAA lights have not been conducted, and theresponse of bats to white lights on wind turbines remainsunknown. Pulsing FAA lights that are red and white doproduce strong ultrasonic pulses (W. Evans, Old Bird Inc.,personal communication), and they may attract bats whenthey are in proximity to turbines.
DISCUSSION
We identified 5 key unifying patterns associated with batfatalities at wind facilities among studies we reviewed: 1)fatalities were heavily skewed toward migratory bats andwere dominated by lasiurine species in most studies, 2)studies consistently reported peak of turbine collision fatalityin midsummer through fall from all studies in NorthAmerica, 3) fatalities were not concentrated at individualturbines (i.e., fatalities were distributed among turbines atfacilities), and current studies have not identified consistentrelationships with habitat variables (e.g., distance to water),4) red-strobe lights recommended by the FAA did notinfluence bat fatality, and 5) bat fatalities were highestduring periods of low wind speed, and they were related toweather variables associated with the passage of weatherfronts. These patterns generally were consistent withfindings reported from wind facilities in Europe (Durr andBach 2004, Brinkmann 2006).
The most consistent theme is that fatality was heavilyskewed toward migratory bats and a dominance of lasiurinespecies killed during midsummer through fall in NorthAmerica, coinciding with bats’ southward migration pat-terns (Cryan 2003). Of 15 species of bats that were reportedas fatalities at wind facilities in Europe (10 sites in Germanyalone), most were migratory species such as 2 species ofNyctalus and Pipistrellus nathussi, and most were killed inmidsummer and fall (Durr and Back 2004, Brinkmann
Figure 4. Relationship between daily fatalities (no. of fresh bat fatalities/no.of turbines searched) and average percentage of the night where wind speedat turbines was .6 m/sec at the Mountaineer Wind Energy Center in WestVirginia, USA (31 Jul–11 Sep 2004) and the Meyersdale Wind EnergyCenter in Pennsylvania, USA (2 Aug–13 Sep 2004; Kerns et al. 2005).Fatality index is the total number of fresh bats found on a given day dividedby the number of turbines searched that day.
Arnett et al. � Bat Fatalities at Wind Energy Facilities 69
2006), a pattern that coincides with records of migratingbats striking other anthropogenic structures and their arrivalat migration stopovers (Cryan and Brown 2007). Movementof migratory bats into new areas during late summer andearly fall may be partially the result of exploratory activity(Cryan 2003), and the temporal pattern of bat fatality couldsimply be related to increased bat activity before and duringmigration. Some migratory species may summer in areaswhere they are colliding with turbines as well. Higherfatalities during migration also could be related to reducedecholocation and flight capabilities of juvenile bats (at leastfor red bats). However, little is known about use ofecholocation during migration, and evidence suggests thatbats are somehow attracted to turbines and that fatality isnot a random event (Horn et al. 2008). We found that inmost studies fatalities were dominated by adults, thusrefuting the hypothesis that inexperienced juveniles may bemore susceptible to turbines.
Kunz et al. (2007) discussed several hypotheses as to whybats may be attracted to and killed by turbines. It is possiblethat migrating tree-roosting species perceive turbines aspossible roost trees and investigate them upon encounter(Arnett 2005, Kunz et al. 2007, Horn et al. 2008). Thermalimages of bats attempting to land or actually landing onstationary blades and the turbine mast generally support theroost attraction hypothesis (Kunz et al. 2007), but theultimate attraction to ridge top sites where turbines arelocated might be the availability of insect prey (Horn et al.2008). Cryan and Brown (2007) presented evidence thatmigrating hoary bats rely on vision to navigate acrosslandscapes and are drawn to visual stimuli during migration,although it is unknown as to how far bats may visuallyperceive such stimuli. Once in proximity, bats maymisconstrue turbines as suitable day or night roosts or asperches to facilitate feeding, although lasiurine species donot exhibit such feeding behavior, and the perch treeattraction hypothesis conforms only to those species that usesuch a strategy. Alternatively, the initial attraction formigrating bats moving across a landscape might be theprominence of turbines and the possibility of a suitable roostworth investigating. Video images of bats chasing turbineblades rotating at slow speeds offer further insight topossible attraction, and bats may investigate moving bladessimply out of curiosity, because movement is mistaken asevidence of prey, or because of attractive sounds (Horn et al.
2008). Also, audible sounds emitted from turbines mayattract bats from considerable distances (Kunz et al. 2007).
Cryan and Brown (2007) hypothesize that dominance ofmigratory tree bats killed during summer and fall at turbinesand other anthropogenic structures is related to flocking andmating behaviors exhibited by tree bats. Fleming and Eby(2003) proposed that flocking behavior in migratory batsduring migration increases the chance of finding mates. Themating hypotheses (Cryan and Brown 2007) center on ageneral attraction to the tallest prominent features in alandscape where bats can meet along their migratory routesand breed. Evidence supports the hypothesis that migratorybats congregate in the fall during migration. Adult male andfemale hoary bats tend to be geographically separated duringspring and summer (Findley and Jones 1964, Barclay 1993,Cryan 2003), but these disparate distributions begin tooverlap during fall migration to wintering grounds (Cryan2003). Hypothesized fall aggregation and mating behaviorscould explain why migratory tree-roosting species are killedmost frequently by turbines, and they may also explain whyfatalities are skewed toward adults rather than juveniles.
Johnson (2005) reported that, in open prairie and farm-land, bat fatalities seemed to be low during the maternityseason; only 66 of the 1,628 reported fatalities (4.1%)occurred between 15 May and 15 July. At several windenergy facilities studied to date, low fatalities weredocumented during the maternity season, even thoughrelatively large numbers of bats were present in the area(Gruver 2002, Howe et al. 2002, Johnson et al. 2003a,Fiedler 2004). Most of these wind energy facilities were inopen areas such as crop fields, grasslands, and shrub steppe,and mating bats may be more prone to collision at windfarms constructed in bat foraging habitats, such as thoseconstructed in forested areas. Johnson et al. (2004)contended that it was unlikely resident bats would spendsignificant amounts of time foraging near turbines in cropfields or pastures, but that may not be the case for speciessuch as Brazilian free-tail bats that are well known to useagricultural areas for foraging (Cleveland et al. 2006).Roughly equal numbers of Mexican free-tail carcasses werediscovered beneath turbines in forest, crop, and mixed grassprairie habitats at one facility in Oklahoma (Piorkowski2006). Little brown bats and eastern pipistrelles are knownto migrate several hundred kilometers to hibernate (Davisand Hitchcock 1965, Griffin 1970, Humphrey and Cope
Table 3. Median nightly wind speed at turbines, proportion of 10-min intervals from 2000 hours to 0600 hours when wind speed was ,4 m/sec, 4–6 m/sec,and .6 m/sec for nights when no bats were found the next day and nights with the highest bat fatalities at the Mountaineer, West Virginia, USA, and theMeyersdale, Pennsylvania, USA, wind energy facilities, 31 July–13 September 2004 (Kern et al. 2005).
Mountaineer Meyersdale
No bats (n ¼ 8) Highest fatalities (n ¼ 5) No bats (n ¼ 17) Highest fatalities (n ¼ 5)
Variable x SE x SE x SE x SE
Wind speed (median nightly; m/sec) 8.6 0.88 4.1 0.22 8.0 0.34 4.2 0.58% intervals wind speed at ,4 m/sec 10.1 9.16 49.4 9.48 3.5 0.58 54.6 13.01% intervals wind speed at 4–6 m/sec 8.1 3.04 44.1 7.65 15.9 3.15 27.2 4.96% intervals wind speed at .6 m/sec 81.7 11.90 6.5 5.46 81.6 4.12 18.2 10.06
70 The Journal of Wildlife Management � 72(1)
1976), thereby being exposed to wind energy facilities alongtheir migratory routes. Fall transient colonies form as earlyas August, peaking in September or October (Barbour andDavis 1969, Johnson et al. 2005), a period that correspondswith high fatalities documented at some wind energyfacilities that we reviewed. Factors such as potential roostattraction, movement or sound attraction, or available preymay explain wind turbine-caused fatalities in species such asbig brown bats and little brown myotis. Some species of batsare known to night-roost, and many species hawk for insectprey (Kunz 1982; J. Szewczak, Humboldt State University,personal communication), possibly supporting the roostattraction hypothesis for explaining deaths of species otherthan lasiurines.
Bat fatalities were related to periods of low wind speed andweather conditions typical of the passage of storm fronts atfacilities on forested ridges in the eastern United States(Fiedler 2004, Kerns et al. 2005). Cryan and Brown (2007)reported that fall arrivals of hoary bats on Southeast FarallonIsland were related to periods of low wind speed, darkphases of the moon, and low barometric pressure, support-ing the view that migration events may be predictable. Lowbarometric pressure can coincide with passage of cold frontsthat may be exploited by migrating birds and bats (Cryanand Brown 2007). The positive correlation in timing offatalities between the Meyersdale, Pennsylvania, andMountaineer, West Virginia, facilities supports the hypoth-esis that fatalities may be related to broad landscape, andperhaps regional patterns, movements that are influenced byweather and insect abundance (Kerns et al. 2005). Ericksonand West (2002) reported that regional climate patterns aswell as local weather conditions can predict activity of bats.On a local scale, strong winds can influence abundance andactivity of insects, which in turn influences bat activity. Batsare known to suppress their activity during periods of rain,low temperatures, and strong winds (Erkert 1982, Ericksonet al. 2002). Episodic hatches of insects that are likelyassociated with favorable weather and flight conditions mayperiodically increase local bat activity (Erickson and West2002). More studies incorporating daily fatality searches areneeded so that patterns such as those described above can bedetermined at multiple sites across regions. These datawould be critical for developing robust predictive models ofenvironmental conditions preceding fatality events, and,thus, prescribing possible mitigation (e.g., curtailment ofoperations to reduce or eliminate fatality; Arnett 2005,Cryan and Brown 2007, Kunz et al. 2007).
Limitations and Assumptions of Bat Fatality StudiesThere are several limitations to the studies we reviewed thatwarrant discussion to provide the appropriate context forinterpreting results and for developing future research needs.We refer readers to tables in the appendices to appreciatehow each study was conducted and how estimates of fatalityare potentially biased. With few exceptions, most workconducted to date has been short term (e.g., only one fieldseason), and the frequency of study (e.g., season length andtime into the night at which research is conducted) may also
be inadequate to assess seasonal and annual variability. Forexample, the study of Kerns et al. (2005) only encompasseda 6-week period, which typically might be expected toinclude the peak period of bat fatality; however, unseason-ably low temperatures and record hurricane events in 2004may have reduced or delayed bat activity on ridges and thusinfluenced findings. Longer-term, full-season (Apr–Nov)studies are needed to elucidate patterns, better estimatewind–turbine-related fatalities, and develop predictivemodels to estimate fatalities and evaluate their relationshipwith weather and habitat variables.
Fatality estimates cannot be directly compared amongstudies because of different sampling protocols (e.g., differ-ent search intervals and approach and level of intensity usedwhen quantifying searcher efficiency and carcass removal foradjusting estimates). Use of standardized protocols toaddress specific questions would improve comparability ofstudies and credibility of efforts. Consistency in how studiesare conducted also would greatly assist regulatory agenciesduring decision making in regard to statutory trustresponsibilities.
Sizes of search plot sizes varied among studies. Manyrecent studies used rectangular plots with edges of plots aminimum distance from the turbine equal to the maximumblade tip height of the turbine. Distribution of fatalities as afunction of distance from turbines suggests that most, butnot all, fatalities occur in this area. However, topography,maturity of vegetation, size of carcass, wind direction, andother factors likely affect the distribution of bats killed bywind turbines. The distribution of observed bat fatalities canbe used to approximate the number of fatalities missed(Kerns et al. 2005). Most studies have shown a tighterdistribution of bat fatalities, compared with bird fatalities,around the base of the turbine tower (Kerns et al. 2005).Additional factors affecting the precision and accuracy offatality estimates include search effort, including the numberof turbines searched, intensity of searches within searchplots, and the experience of observers (Anderson et al.1999).
Vegetation cover and associated visibility can have aprofound influence on searcher efficiency, and they canchange over a growing season (e.g., Johnson et al. 2003a,2004). Most studies have failed to adequately account forhabitat variability when measuring field biases, and findingsfrom studies should be evaluated carefully in this context. Itis critical that future studies account for habitat variationduring searcher efficiency and scavenging trials to achievereliable estimates of fatality.
Past experiments that assessed carcass removal using smallbirds as surrogates for bats may not provide a reliableassessment of scavenging. Using bat carcasses estimated tohave been killed the night before discovery, Erickson et al.(2003a) and Johnson et al. (2003a) found similar or lowerscavenging rates on bat carcasses compared with small birdcarcasses. However, small sample sizes may have biasedestimates and limited the scope of inference of these 2studies. Fiedler (2004) conducted 6 bias trials during the
Arnett et al. � Bat Fatalities at Wind Energy Facilities 71

first phase of development at the Buffalo Mountain EnergyCenter in Tennessee and found no difference between batand bird carcasses for searcher efficiency or scavenging time.Brown and Hamilton (2006b) also found similar searcherefficiency and carcass disappearance rates for bats and smallbirds at Summerview Wind Farm in Alberta. Kerns et al.(2005), however, reported significantly lower scavengingrates on birds compared with both fresh and frozen batcarcasses at the Mountaineer Wind Energy Center in WestVirginia. Differences in scavenging rates between the 2 sitesstudied by Kerns et al. (2005) suggest that scavenging mustbe determined on a site-specific basis, and it should not beassumed similar between sites even in proximity and insimilar habitat conditions between years. One year of data isinadequate to reliably predict the search interval or to assessbias corrections appropriately; thus, future surveys shouldaccount for temporal patterns of scavenging amongvegetation types. Also, scavenging should be expected tochange over time as scavengers become aware of and developsearch images for novel sources of food beneath turbines(Arnett 2005).
Future ResearchWe concur with Durr and Bach (2004) and Kunz et al.(2007) that the state of our knowledge of factors associatedwith bat fatality at wind facilities is unsatisfactory.Investigations of wind turbine and wildlife interactionsand impacts are relatively recent, and there is a dearth ofreliable information upon which to base decisions. Althoughpostconstruction monitoring has been conducted at windfacilities in North America for more than a decade, relativelyfew studies have focused on bats, and some states andregions have very poor or no data on bat fatalities. Forexample, Texas, which has the largest installed capacity ofwind energy in the continental United States, has no data onwildlife fatalities from any of its facilities. Only one studyfrom California, the state with the second highest installedcapacity of wind energy, reported bat fatality estimates thatwere corrected for field bias, although the corrections werebased on one trial in December with only 8 bat carcasses(Kerlinger et al. 2006). We excluded several studies from ourreview, in part because they did not systematically collectbats during fatality searches. Although past studies havehelped elucidate unifying patterns that translate to testablehypotheses (Kunz et al. 2007), more extensive research isneeded immediately to develop solutions to reduce oreliminate bat fatality.
Extensive postconstruction fatality searches for a fullseason of bat movement and activity (generally Apr–Nov inmost regions, but this will vary in more southern regionssuch as the southwestern United States) are needed to fullyelucidate temporal patterns of fatality, especially in areaswhere there is little or no information. Multiple years ofpostconstruction monitoring must be conducted at futurewind facilities to address questions that center on 1)comparing fatality rates among facilities with varyingtopographic and habitat conditions within and amongregions in North America and 2) elucidating patterns of
fatality associated with weather conditions (e.g., wind speed,barometric pressure) and technical parameters (e.g., turbinesize and ht, linear array of turbines vs. scattered individualturbine locations) of different facilities. Standard protocolsand methods and a centralized data repository will beimportant for comparing results from multiple studies(Kunz et al. 2007).
It is clear that a large proportion of bat fatalities occurduring fall migration, particularly on nights with low windsand relatively low levels of power production. Should thispattern prove to be persistent, curtailment of operationsduring predictable nights or periods of high bat kills couldreduce fatalities considerably, potentially with modestreduction in power production (Kunz et al. 2007). Wepropose that manipulative experiments be implemented atwind facilities across different regions to test variouscurtailment treatments with regard to the effect on reducingbat fatalities and economic costs of treatments. Turbines canbe programmed to feather (blades are pitched parallel to thewind but allowed to spin freely, although blades in thisposition move very slowly even in strong winds) at differentwind speeds (e.g., 4 m/sec, 5 m/sec, or 6 m/sec), thusproviding a viable way to test operational practices that maylead to reductions in fatality. Options to consider forexperimental treatments include but are not limited to 1) fullcurtailment from sunset to sunrise (i.e., turbines featheredall night and not allowed to rotate at any wind speed), 2)partial curtailment from sunset to midnight (i.e., turbinesfeathered at all wind speeds just during this period whenbats and insects may be most active; Arnett 2005, Arnett etal. 2006, Reynolds 2006, Horn et al. 2008), and 3)feathering turbines at different wind speeds for an entirenight. Curtailment experiments should be a high priority forimmediate research.
Limited knowledge of migratory behaviors seriously limitsour understanding of how and why migratory bats are beingkilled by wind turbines (Larkin 2006); moreover, the lack ofinformation available on numbers of bats moving throughthe air space when fatalities occur hinders interpretation ofbat fatalities and limits regional comparisons of fatality rates.For example, although bat fatalities are estimated to berelatively low (,2 bats/MW) at many sites in the westernUnited States, we do not know what proportion of the batsthat moved through the airspace this represents; thus, 2bats/MW could be proportionally the same as higher killsreported from forested ridges in the eastern United States.Future studies need to evaluate different methods and tools(e.g., radar, thermal imaging, and acoustic detectors)simultaneously to better quantify bat activity, migration,exposure risk of bats, and their interactions with turbines todevelop the context within which fatalities can be compared.
Potential population effects of wind–turbine-related batfatality remain unknown from available studies (Kunz et al.2007). For many species, especially foliage and tree-roostinglasiurines that are most frequently killed, no quantitativeinformation regarding long-term population trends can bedrawn from existing data, in part because detection
72 The Journal of Wildlife Management � 72(1)
probabilities cannot be determined from current samplingmethods (Carter et al. 2003). Although daunting, develop-ing methods to assess populations and ways of investigatingrelationships between bat abundance and fatality risks atlocal and regional scales should be a priority.
MANAGEMENT IMPLICATIONS
Results from studies we reviewed did not reveal consistentpatterns to assist with macro- (facility-scale) or micro(turbine-scale)-siting decisions to avoid bat fatalities.Studies that addressed relationships between bat fatalitiesand weather patterns found that most bats were killed onnights with low wind speed (,6 m/sec). Curtailingoperations during low wind periods, particularly in latesummer and fall, could reduce bat fatality substantially. Forexample, at the Meyersdale and Mountaineer facilities batfatality would have been reduced by 82% and 85%,respectively, had turbines not been operating on nightswhen mean wind speed was ,6 m/sec from 1 August to 13September 2004 (E. B. Arnett, Bat Conservation Interna-tional, unpublished data). Different curtailment strategiesmust be tested to determine efficacy and costs associatedwith reductions in bat fatalities. Given our current state ofknowledge and the projected future development of windenergy facilities in the United States, the potential forsignificant cumulative population impacts to bats is animportant concern (Kunz et al. 2007). Based on estimates ofinstalled capacity and the limitations and assumptions withrespect to fatality rates, projected annual fatalities of bats inthe Mid-Atlantic Highlands in the eastern United Statescould range from 33,017 to 61,935 (2,158-MW installedcapacity) or from 58,997 to 110,667 (3,856-MW installedcapacity) bats per year by 2020 in just this one region(National Research Council 2007). These projections,although hypothetical, should be of particular concern forspecies of migratory tree bats that experience the highestfatalities at wind energy facilities in North America.
ACKNOWLEDGMENTS
We thank Bat Conservation International, the AmericanWind Energy Association, National Renewable EnergyLaboratory, and the United States Fish and Wildlife Servicefor support through the Bats and Wind Energy Coopera-tive. We are grateful to the numerous field techniciansresponsible for gathering data presented in this review. Wealso thank each of the numerous agencies, companies, andorganizations that funded this work. We are especiallygrateful to S. Enfield (PPM-Atlantic Renewable), J.Lindsay (Florida Power and Light Energy), G. Zennerand A. Hancock (Iowa Department of Natural Resources),J. Edworthy (Vision Quest Windelectric), and J. Smits(Department of Veterinary Pathology, Western College ofVeterinary Medicine) for contributions to these studies. L.Bach, G. Jones, and R. Brinkmann shared informationgathered in Europe that aided our discussion. P. Cryan, T.Kunz, M. Morrison, and M. Tuttle provided helpful reviewsof this manuscript.
LITERATURE CITED
Ahlen, I. 2002. Fladdermoss och faglar dodade av windkraftverk. Fauna andFlora 97:14–22. [In Swedish.]
Anderson, R. L., M. Morrison, K. Sinclair, and M. D. Strickland. 1999.Studying wind energy/bird interactions: a guidance document. Preparedfor avian subcommittee and National Wind Coordinating Committee.December 1999. ,http://www.nationalwind.org/publications/wildlife/avian99/Avian_booklet.pdf.. Accessed 1 May 2007.
Arnett, E. B., editor. 2005. Relationships between bats and wind turbines inPennsylvania and West Virginia: an assessment of bat fatality searchprotocols, patterns of fatality, and behavioral interactions with windturbines. A final report submitted to the Bats and Wind EnergyCooperative. Bat Conservation International, Austin, Texas, USA.,http://www.batcon.org/windliterature.. Accessed 1 Sep 2007.
Arnett, E. B. 2006. A preliminary evaluation on the use of dogs to recoverbat fatalities at wind energy facilities. Wildlife Society Bulletin 34:1440–1445.
Arnett, E. B., J. P. Hayes, and M. M. P. Huso. 2006. Patterns of pre-construction bat activity at a proposed wind facility in south-centralPennsylvania. An annual report submitted to the Bats and Wind EnergyCooperative. Bat Conservation International, Austin, Texas, USA.,http://www.batcon.org/windliterature.. Accessed 1 Sep 2007.
Bach, L., and U. Rahmel. 2004. Summary of wind turbine impacts on bats–assessment of a conflict. Bremer Beitrage fur Naturkunde undNaturschutz 7:245–252. [In German.]
Barbour, R. W., and W. H. Davis. 1969. Bats of America. University Pressof Kentucky, Lexington, USA.
Barclay, R. M. R. 1993. The biology of prairie bats. Pages 353–357 inProceedings of the Third Prairie Conservation and Endangered SpeciesWorkshop. G. L. Holroyd, H. L. Dickson, M. Regnier, and H. C.Smith, editors. Natural History Occasional Paper No. 19, ProvincialMuseum of Alberta, Edmonton, Alberta, Canada.
Barclay, R. M. R., E. F. Baerwald, and J. C. Gruver. 2007. Variation in batand bird fatalities at wind energy facilities: assessing the effects of rotorsize and tower height. Canadian Journal of Zoology 85:381–387.
Barclay, R. M. R., and L. M. Harder. 2003. Life histories of bats: life in theslow lane. Pages 209–253 in T. H. Kunz and M. B. Fenton, editors. Batecology. University of Chicago Press, Chicago, Illinois, USA.
Brinkman, R. 2006. Survey of possible operational impacts on bats by windfacilities in southern Germany. Report for Administrative District ofFreiburg–Department 56, Conservation and Landscape Management.Ecological Consultancy, Gundelfingen, Germany. ,http://www.batcon.org/windliterature.. Accessed 1 Sep 2007.
Brown, W. K., and B. L. Hamilton. 2002. Draft report: bird and batinteractions with wind turbines Castle River Wind Farm, Alberta. Reportfor VisionQuest Windelectric, Inc., Calgary, Alberta, Canada. ,http://www.batcon.org/windliterature.. Accessed 1 Sep 2007.
Brown, W. K., and B. L. Hamilton. 2006a. Bird and bat monitoring at theMcBride Lake Wind Farm, Alberta, 2003–2004. Report for Vision QuestWindelectric, Inc., Calgary, Alberta, Canada. ,http://www.batcon.org/windliterature.. Accessed 1 Sep 2007.
Brown, W. K., and B. L. Hamilton. 2006b. Monitoring of bird and batcollisions with wind turbines at the Summerview Wind Power Project,Alberta, 2005–2006. Report for Vision Quest Windelectric, Inc.,Calgary, Alberta, Canada. ,http://www.batcon.org/windliterature..Accessed 1 Sep 2007.
Carter, T. C., M. A. Menzel, and D. A. Saugey. 2003. Population trends ofsolitary foliage-roosting bats. Pages 41–47 in T. J. O’Shea and M. A.Bogan, editors. Monitoring trends in bat populations of the United Statesand Territories: problems and prospects. U.S. Geological Survey,Biological Resources Discipline, Information and Technology ReportUSGS/BRD/ITR-2003-0003, Washington, D.C., USA.
Cleveland, C. J., M. Betke, P. Federico, J. D. Frank, T. G. Hallman, J.Horn, J. D. Lopez, Jr., G. F. McCracken, R. A. Medellin, A. Moreno-Valdez, C. G. Sansone, J. K. Westbrook, and T. H. Kunz. 2006. Theeconomic value of pest control services provided by the Brazilian free-tailed bats in south-central Texas. Frontiers in Ecology and theEnvironment 4:238–243.
Cryan, P. M. 2003. Seasonal distribution of migratory tree bats (Lasiurusand Lasionycteris) in North America. Journal of Mammalogy 84:579–593.
Cryan, P. M., and A. C. Brown. 2007. Migration of bats past a remote
Arnett et al. � Bat Fatalities at Wind Energy Facilities 73
island offers clues toward the problem of bat fatalities at wind turbines.Biological Conservation 139:1–11.
Cryan, P. M., and J. P. Veilleux. 2007. Migration and use of autumn,winter, and spring roosts by tree bats. Pages 153–175 in M. J. Lacki, A.Kurta, and J. P. Hayes, editors. Conservation and management of bats inforests. John Hopkins University Press, Baltimore, Maryland, USA.
Davis, W. H., and H. B. Hitchcock. 1965. Biology and migration of thebat, Myotis lucifugus, in New England. Journal of Mammalogy 46:296–313.
Durr, T., and L. Bach. 2004. Bat deaths and wind turbines–a review ofcurrent knowledge, and of the information available in the database forGermany. Bremer Beitrage fur Naturkunde und Naturschutz 7:253–264.[In German.]
Energy Information Administration. 2007. Annual energy outlook 2007with projections to 2030. U.S. Department of Energy, EnergyInformation Administration, Washington, D.C., USA. ,http://www.eia.doe.gov/oiaf/aeo/pdf/0383(2007).pdf.. Accessed 1 May 2007.
Erckert, H. G. 1982. Ecological aspects of bat activity rhythms. Pages 201–242 in T. H. Kunz, editor. Ecology of bats. Plenum Press, New York,New York, USA.
Erickson, J. L., and S. D. West. 2002. The influence of regional climate andnightly weather conditions on activity patterns of insectivorous bats. ActaChiropterologica 4:17–24.
Erickson, W. P., P. B. Gritski, and K. Kronner. 2003a. Nine Canyon WindPower Project avian and bat monitoring annual report. Technical reportsubmitted to Energy Northwest and the Nine Canyon TechnicalAdvisory Committee. Western Ecosystems Technology, Inc., Cheyenne,Wyoming, USA. ,http://www.batcon.org/windliterature.. Accessed 1Sep 2007.
Erickson, W. P., J. Jeffrey, K. Kronner, and K. Bay. 2003b. Stateline WindProject Wildlife Monitoring Annual Report, Results for the Period July2001–December 2002. Technical report submitted to FPL Energy, theOregon Office of Energy, and the Stateline Technical AdvisoryCommittee. Western Ecosystems Technology, Inc., Cheyenne, Wyo-ming, USA. ,http://www.batcon.org/windliterature.. Accessed 1 Sep2007.
Erickson, W. P., G. D. Johnson, M. D. Strickland, and K. Kronner. 2000.Final Report: avian and bat mortality associated with the Vansycle windproject, Umatilla County, Oregon 1999 study year. Report for UmatillaCounty Department of Resource Services and Development. WesternEcosystems Technology, Inc., Cheyenne, Wyoming, USA. ,http://www.batcon.org/windliterature.. Accessed 1 Sep 2007.
Erickson, W. P., G. D. Johnson, M. D. Stickland, D. P. Young, Jr., K. J.Sernka, and R. E. Good. 2001. Avian collisions with wind turbines: asummary of existing studies and comparisons to other sources of aviancollision mortality in the United States. National Wind CoordinatingCommittee, Washington, D.C., USA. ,http://www.west-inc.com/wind_reports.php.. Accessed 1 Sep 2007.
Erickson, W. P., G. D. Johnson, M. D. Strickland, D. P. Young, Jr., K. J.Sernka, R. E. Good, M. Bourassa, K. Bay, and K. Sernka. 2002.Synthesis and comparison of baseline avian and bat use, raptor nestingand mortality information from proposed and existing wind develop-ments. Bonneville Power Administration, Portland, Oregon, USA.
Fenton, M. B. 1997. Science and the conservation of bats. Journal ofMammalogy 78:1–14.
Fiedler, J. K. 2004. Assessment of bat mortality and activity at BuffaloMountain Windfarm, eastern Tennessee. Thesis, University of Tennes-see, Knoxville, USA.
Fiedler, J. K., T. H. Henry, C. P. Nicholson, and R. D. Tankersley. 2007.Results of bat and bird mortality monitoring at the expanded BuffaloMountain windfarm, 2005. Tennessee Valley Authority, Knoxville, USA.,http://www.batcon.org/windliterature.. Accessed 1 Sep 2007.
Findley, J. S., and C. Jones. 1964. Seasonal distribution of the hoary bat.Journal of Mammalogy 45:461–470.
Fleming, T. H., and P. Eby. 2003. Ecology of bat migration. Pages 156–208 in T. H. Kunz and M. B. Fenton, editors. Bat ecology. University ofChicago Press, Chicago, Illinois, USA.
Ford, M. W., M. A. Menzel, J. M. Menzel, and D. J. Welch. 2001.Influence of summer temperature on sex ratios in eastern red bats(Lasiurus borealis). American Midland Naturalist 147:179–184.
Gipe, P. 1995. Wind energy comes of age. John Wiley and Sons, Hoboken,New Jersey, USA.
Griffin, D. R. 1970. Migrations and homing of bats. Pages 233–264 in W.A. Wimsatt, editor. Biology of bats. Volume 1. Academic Press, NewYork, New York, USA.
Gruver, J. C. 2002. Assessment of bat community structure and roostinghabitat preferences for the hoary bat (Lasiurus cinereus) near Foote CreekRim, Wyoming. Thesis, University of Wyoming, Laramie, USA.
Hall, L. S., and G. C. Richards. 1972. Notes on Tadarida australis(Chiroptera: Molossidae). Australian Mammalogy 1:46.
Horn, J., E. B. Arnett, and T. H. Kunz. 2008. Interactions of bats withwind turbines based on thermal infrared imaging. Journal of WildlifeManagement 72:123–132.
Howe, R. W., W. Evans, and A. T. Wolf. 2002. Effects of wind turbines onbirds and bats in northeastern Wisconsin. Wisconsin Public ServiceCorporation, Green Bay, USA.
Humphrey, S. R., and J. B. Cope. 1976. Population ecology of the littlebrown bat, Myotis lucifugus, in Indiana and north-central Kentucky.American Society of Mammalogists Special Publication No. 4.
Inkley, D. B., M. G. Anderson, A. R. Blaustein, V. R. Burkett, B. Felzer,B. Griffith, J. Price, and T. L. Root. 2004. Global climate change andwildlife in North America. Wildlife Society Technical Review 04-1. TheWildlife Society, Bethesda, Maryland, USA.
Jain, A. A. 2005. Bird and bat behavior and mortality at a northern Iowawind farm. Thesis. Iowa State University, Ames, USA.
Jain, A., P. Kerlinger, R. Curry, and L. Slobodnik. 2007. Annual report forthe Maple Ridge wind power project post-construction bird and batfatality study–2006. Annual report prepared for PPM Energy andHorizon Energy, Curry and Kerlinger LLC, Cape May Point, NewJersey, USA. ,http://www.batcon.org/windliterature.. Accessed 1 Sep2007.
Johnson, G. D. 2005. A review of bat mortality at wind-energydevelopments in the United States. Bat Research News 46:45–49.
Johnson, G. D., W. P. Erickson, M. D. Strickland, M. F. Shepherd, and S.A. Sarappo. 2003a. Mortality of bats at a large-scale wind powerdevelopment at Buffalo Ridge, Minnesota. American Midland Naturalist150:332–342.
Johnson, G. D., W. P. Erickson, and J. White. 2003b. Avian and batmortality at the Klondike, Oregon Phase I Wind Plant, Sherman County,Oregon. Technical Report prepared for Northwestern Wind Power.Western Ecosystems Technology, Inc., Cheyenne, Wyoming, USA.,http://www.batcon.org/windliterature.. Accessed 1 Sep 2007.
Johnson, G. D., M. K. Perlik, W. P. Erickson, and M. D. Strickland. 2004.Bat activity, composition and collision mortality at a large wind plant inMinnesota. Wildlife Society Bulletin 32:1278–1288.
Kerlinger, P., R. Curry, L. Culp, A. Jain, C. Wilkerson, B. Fischer, and A.Hasch. 2006. Post-construction avian and bat fatality monitoring studyfor the High Winds Wind Power Project, Solano County, California:two year report. Curry and Kerlinger, LLC, Cape May Point, New Jersey,USA. ,http://www.batcon.org/windliterature.. Accessed 1 Sep 2007.
Kerns, J, W. P. Erickson, and E. B. Arnett. 2005. Bat and bird fatality atwind energy facilities in Pennsylvania and West Virginia. Pages 24–95 inE. B. Arnett, editor. Relationships between bats and wind turbines inPennsylvania and West Virginia: an assessment of bat fatality searchprotocols, patterns of fatality, and behavioral interactions with windturbines. A final report submitted to the Bats and Wind EnergyCooperative. Bat Conservation International, Austin, Texas, USA.,http://www.batcon.org/windliterature.. Accessed 1 Sep 2007.
Kerns, J, and P. Kerlinger. 2004. A study of bird and bat collision fatalitiesat the Mountaineer Wind Energy Center, Tucker County, WestVirginia. Annual report for 2003. Curry and Kerlinger, LLC, McLean,Virginia, USA. ,http://www.batcon.org/windliterature.. Accessed 1Sep 2007.
Kunz, T. H., editor. 1982. Ecology of bats. Plenum Press, New York, NewYork, USA.
Kunz, T. H., E. B. Arnett, W. P. Erickson, A. R. Hoar, G. D. Johnson, R.P. Larkin, M. D. Strickland, R. W. Thresher, and M. D. Tuttle. 2007.Ecological impacts of wind energy development on bats: questions,research needs, and hypotheses. Frontiers in Ecology and the Environ-ment 5:315–324.
Larkin, R. P. 2006. Migrating bats interacting with wind turbines: whatbirds can tell us. Bat Research News 47:23–32.
McLeish, T. 2002. Wind power. Natural New England 11:60–65.Morrison, M. L. 2002. Searcher bias and scavenging rates in bird/wind
74 The Journal of Wildlife Management � 72(1)

energy studies. National Renewable Laboratory Report, NREL/SR-500-30876. ,http://www.osti.gov/bridge.. Accessed 1 May 2007.
Morrison, M. L., W. M. Block, M. D. Strickland, and W. L. Kendell.2001. Wildlife study design. Springer-Verlag, New York, New York,USA.
National Research Council. 2007. Ecological impacts of wind-energyprojects. National Academies Press, Washington, D.C., USA.
Nicholson, C. P. 2003. Buffalo Mountain Wind farm bird and bat mortalitymonitoring report: October 2001–September 2002. Tennessee ValleyAuthority, Knoxville, USA.
Orloff, S., and A. Flannery. 1992. Wind turbine effects on avian activity,habitat use, and mortality in Altamont Pass and Solano County WindResource Areas, 1989–1991. California Energy Commission, Sacramen-to, California, USA.
Osborn, R. G., K. F. Higgins, C. D. Dieter, and R. E. Usgaard. 1996. Batcollisions with wind turbines in southwestern Minnesota. Bat ResearchNews 37:105–108.
Pasqualetti, M., R. Richter, and P. Gipe. 2004. History of wind energy.Pages 419–433 in C. J. Cleveland, editor. Encyclopedia of energy.Volume 6. Academic Press, San Diego, California, USA.
Philibert, H., G. Wobeser, and R. G. Clark. 1993. Counting dead birds:examination of methods. Journal of Wildlife Diseases 29:284–289.
Pierson, E. D. 1998. Tall trees, deep holes, and scarred landscapes:conservation biology of North American bats. Pages 309–325 in T. H.Kunz and P. A. Racey, editors. Bat biology and conservation.Smithsonian Institution Press, Washington, D.C., USA.
Piorkowski, M. D. 2006. Breeding bird habitat use and turbine collisions ofbirds and bats located at a wind farm in Oklahoma mixed-grass prairie.Thesis, Oklahoma State University, Stillwater, USA.
Racey, P. A., and A. C. Entwistle. 2003. Conservation ecology of bats.Pages 680–743 in T. H. Kunz and M. B. Fenton, editors. Bat Ecology.University of Chicago Press, Chicago, Illinois, USA.
Redlinger, R. Y., P. Dannemand, and P. E. Morthorst. 2002. Wind energy
in the 21st century. Palgrave Macmillan, New York, New York, USA.
Reynolds, D. S. 2006. Monitoring the potential impact of a wind
development site on bats in the northeast. Journal of Wildlife Manage-
ment 70:1219–1227.
Shump, K. A., Jr., and A. U. Shump. 1982a. Lasiurus borealis. Mammalian
Species 183:1–6.
Shump, K. A., Jr., and A. U. Shump. 1982b. Lasiurus cinereus. Mammalian
Species 185:1–5.
Thelander, C. G., and L. Rugge. 2000. Bird risk behaviors and fatalities at
the Altamont Wind Resource Area. Pages 5–14 in Proceedings of the
National Avian-Wind Power Planning Meeting III. National Wind
Coordinating Committee/RESOLVE. Washington, D.C., USA.
,http://www.nationalwind.org/publications/wildlife/avian98/
02-Thelander-Rugge-Altamont.pdf.. Accessed 1 Sep 2007.
Winhold, L., and A. Kurta. 2006. Are red bats (Lasiurus borealis) declining
in southern Michigan? Bat Research News 46:229.
Wobeser, G., and A. G. Wobeser. 1992. Carcass disappearance and
estimation of mortality in a simulated die-off of small birds. Journal of
Wildlife Diseases 28:548–554.
Young, D. P., Jr., W. P. Erickson, R. E. Good, M. D. Strickland, and G.
D. Johnson. 2003. Avian and bat mortality associated with the initial
phase of the Food Creek Rim Windpower Project, Carbon County,
Wyoming: November 1998–June 2003. Technical Report prepared for
Pacificorp, Inc., SeaWest Windpower, Inc., and Bureau of Land
Management. Western Ecosystems Technology, Inc., Cheyenne, Wyom-
ing, USA. ,http://www.batcon.org/home/index.asp?idPage¼55&idSubPage¼31.. Accessed 1 Sept 2007.
Associate Editor: Morrison.
Arnett et al. � Bat Fatalities at Wind Energy Facilities 75

Appendix A. Study area location, acronyms, and citations for bat fatality studies conducted at wind facilities in North America, 1996–2006.
Study area location Acronym References
CanadaCastle River, AB CRAB Brown and Hamilton 2002McBride Lake, AB MLAB Brown and Hamilton 2006aSummerview, AB SVAB Brown and Hamilton 2006b
Eastern United StatesBuffalo Mountain, TN (phase 1) BMTN1 Nicholson 2003, Fiedler 2004Buffalo Mountain, TN (phase 2) BMTN2 Fiedler et al. 2007Maple Ridge, NY (phase 1) MRNY1 Jain et al. 2007Meyersdale, PA MYPA Kerns et al. 2005Mountaineer, WV (2003) MTWV1 Kerns and Kerlinger 2004Mountaineer, WV (2004) MTWV2 Kerns et al. 2005
Rocky Mountains, USAFoote Creek Rim, WY FRWY Young et al. 2003
Pacific Northwest, USAHigh Winds, CA HWCA Kerlinger et al. 2006Klondike, OR KLOR Johnson et al. 2003bNine Canyon, WA NCWA Erickson et al. 2003aStateline, OR/WA SLOR Erickson et al. 2003bVansycle, OR VAOR Erickson et al. 2000
Midwestern United StatesBuffalo Ridge, MN (phase 1) BRMN1 Johnson et al. 2003aBuffalo Ridge, MN (phase 2) BRMN2 Johnson et al. 2003a, 2004Buffalo Ridge, MN (phase 3) BRMN3 Johnson et al. 2003a, 2004Lincoln, WI LIWI Howe et al. 2002Top of Iowa, IA TOIA Jain 2005
South-central United StatesWoodward, OK WOOK Piorkowski 2006
76 The Journal of Wildlife Management � 72(1)
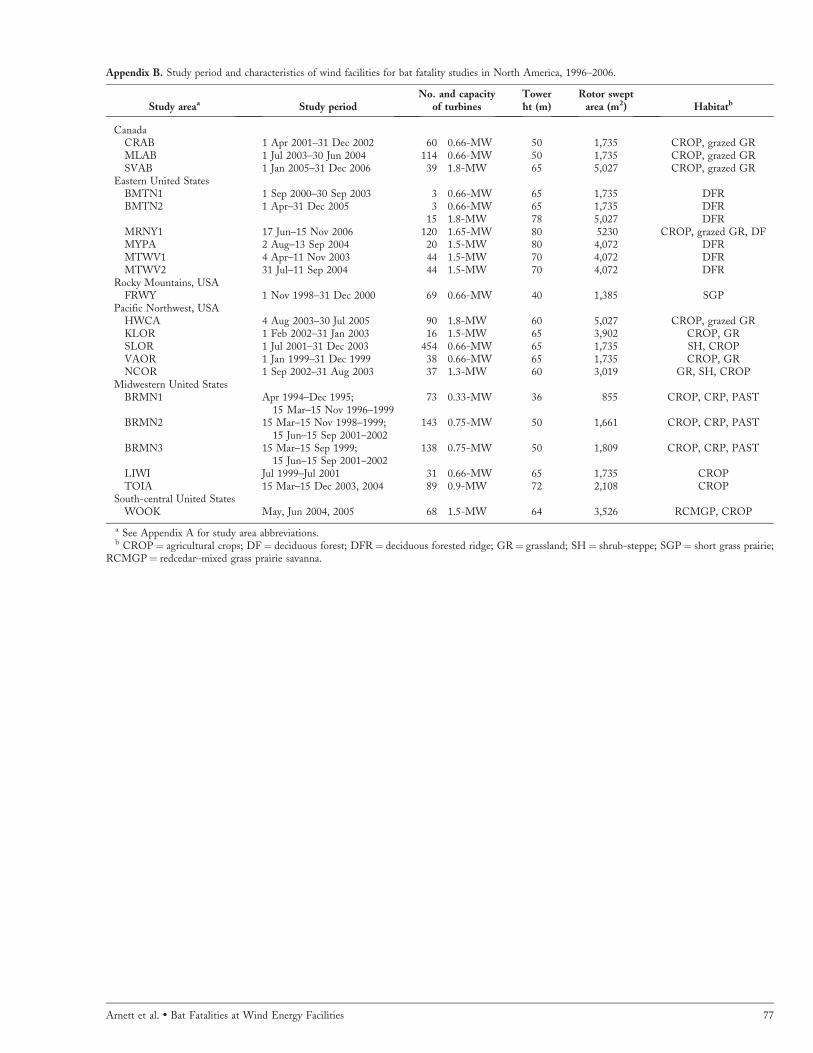
Appendix B. Study period and characteristics of wind facilities for bat fatality studies in North America, 1996–2006.
Study areaa Study periodNo. and capacity
of turbinesTowerht (m)
Rotor sweptarea (m2) Habitatb
CanadaCRAB 1 Apr 2001–31 Dec 2002 60 0.66-MW 50 1,735 CROP, grazed GRMLAB 1 Jul 2003–30 Jun 2004 114 0.66-MW 50 1,735 CROP, grazed GRSVAB 1 Jan 2005–31 Dec 2006 39 1.8-MW 65 5,027 CROP, grazed GR
Eastern United StatesBMTN1 1 Sep 2000–30 Sep 2003 3 0.66-MW 65 1,735 DFRBMTN2 1 Apr–31 Dec 2005 3 0.66-MW 65 1,735 DFR
15 1.8-MW 78 5,027 DFRMRNY1 17 Jun–15 Nov 2006 120 1.65-MW 80 5230 CROP, grazed GR, DFMYPA 2 Aug–13 Sep 2004 20 1.5-MW 80 4,072 DFRMTWV1 4 Apr–11 Nov 2003 44 1.5-MW 70 4,072 DFRMTWV2 31 Jul–11 Sep 2004 44 1.5-MW 70 4,072 DFR
Rocky Mountains, USAFRWY 1 Nov 1998–31 Dec 2000 69 0.66-MW 40 1,385 SGP
Pacific Northwest, USAHWCA 4 Aug 2003–30 Jul 2005 90 1.8-MW 60 5,027 CROP, grazed GRKLOR 1 Feb 2002–31 Jan 2003 16 1.5-MW 65 3,902 CROP, GRSLOR 1 Jul 2001–31 Dec 2003 454 0.66-MW 65 1,735 SH, CROPVAOR 1 Jan 1999–31 Dec 1999 38 0.66-MW 65 1,735 CROP, GRNCOR 1 Sep 2002–31 Aug 2003 37 1.3-MW 60 3,019 GR, SH, CROP
Midwestern United StatesBRMN1 Apr 1994–Dec 1995;
15 Mar–15 Nov 1996–199973 0.33-MW 36 855 CROP, CRP, PAST
BRMN2 15 Mar–15 Nov 1998–1999;15 Jun–15 Sep 2001–2002
143 0.75-MW 50 1,661 CROP, CRP, PAST
BRMN3 15 Mar–15 Sep 1999;15 Jun–15 Sep 2001–2002
138 0.75-MW 50 1,809 CROP, CRP, PAST
LIWI Jul 1999–Jul 2001 31 0.66-MW 65 1,735 CROPTOIA 15 Mar–15 Dec 2003, 2004 89 0.9-MW 72 2,108 CROP
South-central United StatesWOOK May, Jun 2004, 2005 68 1.5-MW 64 3,526 RCMGP, CROP
a See Appendix A for study area abbreviations.b CROP¼ agricultural crops; DF¼ deciduous forest; DFR ¼ deciduous forested ridge; GR¼ grassland; SH¼ shrub-steppe; SGP¼ short grass prairie;
RCMGP¼ redcedar–mixed grass prairie savanna.
Arnett et al. � Bat Fatalities at Wind Energy Facilities 77
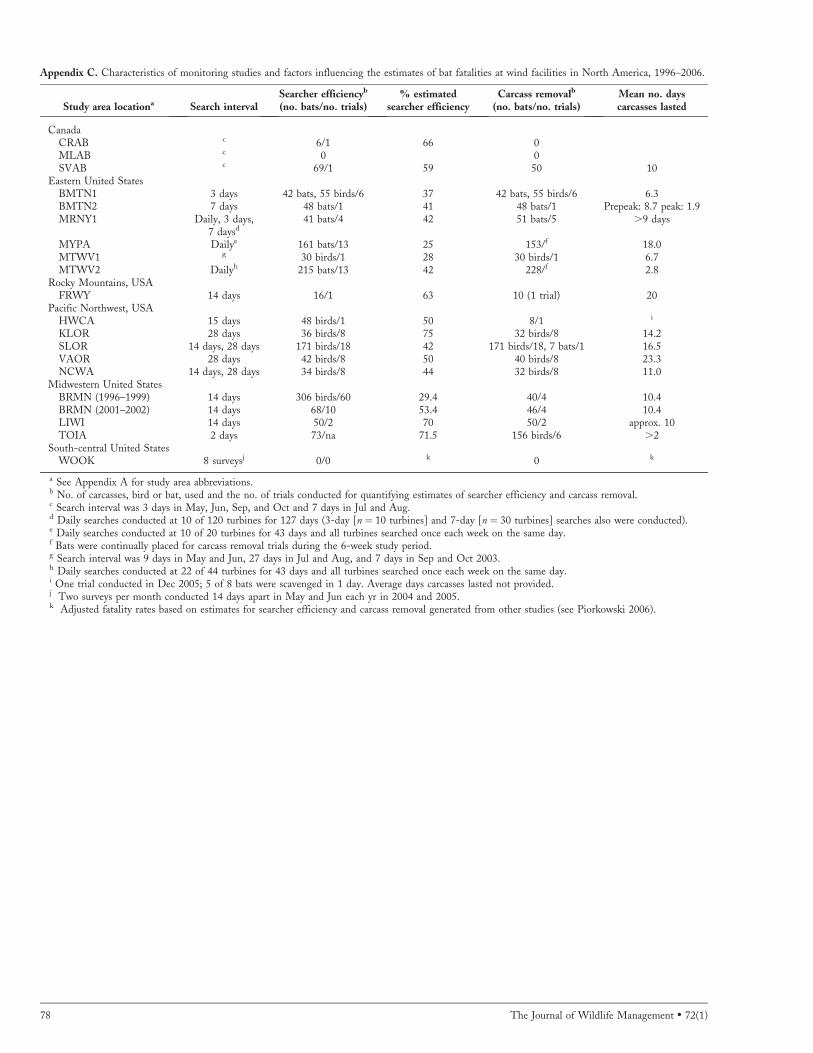
Appendix C. Characteristics of monitoring studies and factors influencing the estimates of bat fatalities at wind facilities in North America, 1996–2006.
Study area locationa Search intervalSearcher efficiencyb
(no. bats/no. trials)% estimated
searcher efficiencyCarcass removalb
(no. bats/no. trials)Mean no. dayscarcasses lasted
CanadaCRAB c 6/1 66 0MLAB c 0 0SVAB c 69/1 59 50 10
Eastern United StatesBMTN1 3 days 42 bats, 55 birds/6 37 42 bats, 55 birds/6 6.3BMTN2 7 days 48 bats/1 41 48 bats/1 Prepeak: 8.7 peak: 1.9MRNY1 Daily, 3 days, 41 bats/4 42 51 bats/5 .9 days
7 daysd
MYPA Dailye 161 bats/13 25 153/f 18.0MTWV1 g 30 birds/1 28 30 birds/1 6.7MTWV2 Dailyh 215 bats/13 42 228/f 2.8
Rocky Mountains, USAFRWY 14 days 16/1 63 10 (1 trial) 20
Pacific Northwest, USAHWCA 15 days 48 birds/1 50 8/1 i
KLOR 28 days 36 birds/8 75 32 birds/8 14.2SLOR 14 days, 28 days 171 birds/18 42 171 birds/18, 7 bats/1 16.5VAOR 28 days 42 birds/8 50 40 birds/8 23.3NCWA 14 days, 28 days 34 birds/8 44 32 birds/8 11.0
Midwestern United StatesBRMN (1996–1999) 14 days 306 birds/60 29.4 40/4 10.4BRMN (2001–2002) 14 days 68/10 53.4 46/4 10.4LIWI 14 days 50/2 70 50/2 approx. 10TOIA 2 days 73/na 71.5 156 birds/6 .2
South-central United StatesWOOK 8 surveysj 0/0 k 0 k
a See Appendix A for study area abbreviations.b No. of carcasses, bird or bat, used and the no. of trials conducted for quantifying estimates of searcher efficiency and carcass removal.c Search interval was 3 days in May, Jun, Sep, and Oct and 7 days in Jul and Aug.d Daily searches conducted at 10 of 120 turbines for 127 days (3-day [n ¼ 10 turbines] and 7-day [n ¼ 30 turbines] searches also were conducted).e Daily searches conducted at 10 of 20 turbines for 43 days and all turbines searched once each week on the same day.f Bats were continually placed for carcass removal trials during the 6-week study period.g Search interval was 9 days in May and Jun, 27 days in Jul and Aug, and 7 days in Sep and Oct 2003.h Daily searches conducted at 22 of 44 turbines for 43 days and all turbines searched once each week on the same day.i One trial conducted in Dec 2005; 5 of 8 bats were scavenged in 1 day. Average days carcasses lasted not provided.j Two surveys per month conducted 14 days apart in May and Jun each yr in 2004 and 2005.k Adjusted fatality rates based on estimates for searcher efficiency and carcass removal generated from other studies (see Piorkowski 2006).
78 The Journal of Wildlife Management � 72(1)