patterns of attitudes and behavior in fragmented markets · pdf file ·...
TRANSCRIPT

Journal of Empirical Generalisations in Marketing Science, Volume Four, 1999 Page 62
Patterns of Attitudes and Behavior inFragmented Markets
Francesca Dall’Olmo Riley1
Lucy RinkPatricia Harris
Kingston Business School
Abstract
The strong correlation between consumer attitudes towards brands and the brands’
market shares or usage levels is well known. This attitudinal evidence, however, mainly
relates to sectors where there are large, well established brands. This raises the question
of what happens in fragmented markets where there is a proliferation of small, mostly
not very well known brands. This paper investigates possible sub-patterns in a
fragmented market such as wine. Neither the peculiarities of fragmented markets nor the
type of measures employed seem to affect the occurrence of the known patterns. The
interpretation of the findings and the managerial implications are discussed. Specifically,
we suggest that knowledge of these patterns can be useful to managers for the
interpretation of attitudinal statements concerning their brands compared with the
competition. The results also imply that strategies aimed at raising attitudinal scores
may be pointless, unless trial and usage are increased first.
1. Introduction
There is extensive evidence that attitudinal responses to a brand generally relate to the
use of the brand (e.g. Bird et al. 1970, Barwise & Ehrenberg 1985, Castleberry &
Ehrenberg 1990, Dall’Olmo Riley 1995). The likely interpretation is that the level of
such attitudinal measures is mostly determined by and predictable from the size of the
brand (in terms of its market share or usage), rather than by any more specific properties
of the brand itself. This corresponds to the pattern found in buyer behavior, where a
1 Kingston Business School, Kingston Hill, Kingston upon Thames, KT2 7LB, UK. Tel. +44 181 547 2000 ext. 5624; Fax + 44 181 547 7026; e-mail: [email protected]

Journal of Empirical Generalisations in Marketing Science, Volume Four, 1999 Page 63
larger ratio between the frequency of buying the brand and the frequency of purchasing
the category occurs because of the large size of the brand, rather than because of anything
specific about the brand itself (Goddard 1978). An additional known factor is a “Double
Jeopardy” effect, whereby even among regular buyers of each brand, fewer give a
favorable response for a small than for a large brand (Castleberry & Ehrenberg 1990,
Ehrenberg et al. 1990).
This attitudinal evidence, however, mainly relates to highly branded and advertised
sectors such as breakfast cereals and laundry detergents, where there are a number of
large and well known brands, as well as many smaller brands. Furthermore, many
brands in these sectors receive substantial above-the-line advertising support, which
may be a contributing factor to the correlation between usage and attitudes. There is
some evidence that, for instance, more current than past users of a brand remember
seeing it advertised (Brown et al. 1992, Dall’Olmo Riley 1995), although the effect is
not large. A plausible interpretation is that advertising has a supportive and reinforcing
role, keeping the brand salient for its users (see Barnard & Ehrenberg 1997, Ehrenberg et
al. 1997).
This raises the question of what happens in those sectors where there are no large
brands, but there is a proliferation of small, mostly not very well known brands with
minimal advertising support. One such market is wine, where no single brand in the UK
has a market share greater than 2% (Mintel 1999) and where main media (or above-the-
line) advertising expenditure is traditionally low, not usually more than 0.2% of sales
value (Mintel 1999). Furthermore, most advertising expenditure in the UK market has
tended to come from marketing bodies, promoting the wines of different countries or
regions, rather than specific brands. Brand advertising in the UK market (which is the
focus of this study) has historically been undertaken mainly at the two opposite ends of
the spectrum, i.e. either by Champagne houses or by volume-based, low-priced brands.
Some commentators actually believe mass advertising to be counterproductive for wine
brands, making them appear less exclusive (Rachman 1999). However, wine in the UK
market has been receiving a lot of indirect support from retailers, with intense

Journal of Empirical Generalisations in Marketing Science, Volume Four, 1999 Page 64
promotional activity at the point-of-sale in the form of in-store displays and tasting
events. Nonetheless, these activities are spread over the myriad of existing brands,
hence may amount to very little for each individual brand.
An additional characteristic of the wine market is that ‘social image’ pressures may
influence consumers’ attitudes, since wine is generally consumed in the company of
others (white wine in particular tends to be associated with drinking in pubs and at
parties - Mintel 1999). Indeed, Quester et al. (1996) remark that wine has been used in
previous studies with an emphasis on product involvement, as it is able to satisfy the
criterion of having both high and low involvement consumers. This is in contrast with
previous attitudinal studies by Ehrenberg and colleagues which focused on markets
where purchase involvement is generally low. Where purchase involvement is low,
consumers’ brand choices may be driven mainly by habit. As a consequence, brand
attitudes may not be very strongly held and may be a post-hoc rationalization of one’s
behavior (e.g. Bem 1967). In contrast, where consumers’ involvement is high (e.g. for
the heavier, more enthusiastic wine drinkers), pre-formed attitudes about different
brands may be strongly held.
The main aim of this paper is to apply previous knowledge concerning the relationship
between usage and attitudes to a context where the peculiarities of the market structure
may make a difference in the extent to which mentioning a belief towards a brand is
related to its past usage. The large number of very small brands with no clear leader in
“popularity” also raises some questions regarding the occurrence of the Double
Jeopardy phenomenon (see Section 2).
In addition, and in contrast to most previous studies which employed free-choice
attribute-by-attribute type of questions, a forced-choice Likert scale measuring the
strength of the attitude was used for this study. This was done to satisfy a further aim,
namely to replicate and generalize the findings by Barnard & Ehrenberg (1990) who had
directly compared free-choice and forced-choice techniques of attitude measurement. We
also wanted to check on possible sub-patterns related to the attitude strength and the

Journal of Empirical Generalisations in Marketing Science, Volume Four, 1999 Page 65
degree of purchase involvement. For example, whether the known correlation between
attitudes and usage occurred only beyond a given attitude strength, which could have
been associated with higher consumer involvement. The type of questioning used in this
study is also relevant to testing the occurrence of the Double Jeopardy phenomenon, as
we discuss in the next section.
The contribution of this paper is therefore to expand on the scope of the existing research
about the relationship between consumer attitudes and purchase behavior, in terms of the
measures employed, the variables examined, and the product fields surveyed. This will
help us to better understand such patterns. Furthermore, replication and generalization
studies of this kind do help establish a consistent body of knowledge that can be drawn
upon for modeling and normative purposes.
In this perspective, the key finding of this research was that the known patterns did
generalise to the UK wine market (in spite of its differences) and to the forced-choice
measurement technique.
In the next section we review past evidence on the relationship between attitudinal
responses and brand usage. After describing our methodology for this study (Section 3),
we report on our results concerning the wine market in Section 4. We draw conclusions
and we discuss the implications of our findings in Section 5.
2. Previous Knowledge of Usage/Attitude Relationship
2.1. The Attitude - Behavior Relationship
Marketing researchers have approached the study of the attitude - behavior relationship
by borrowing heavily from theories developed within other disciplines, and especially
from those which have evolved within a social psychology framework. These mostly
postulate a complex evaluation process, leading to attitude formation and to subsequent
behavior. The development of Multi-Attribute Attitude Models has been pivotal to the

Journal of Empirical Generalisations in Marketing Science, Volume Four, 1999 Page 66
development of this stream of research (e.g. Rosenberg 1956, Fishbein 1963, Wilkie &
Pessemier 1973, Ajzen & Fishbein 1977).
However, while the study of attitudes in psychology has usually dealt with rather
involving issues (e.g. donating blood, or smoking), marketing researchers have often
analyzed attitudes in the context of much less involving activities, such as routine brand
choice. The complex choice processes borrowed from psychology have often revealed
themselves to be inadequate in explaining the relationship between consumers' attitudes
and their brand purchase behavior, although they have found some application to choices
concerning product categories (East 1997).
For routine brand choice, consumers appear to rely upon habit and past experience,
rather than on the collection and evaluation of all available information, in order to
reduce their “cost of thinking” (Ehrenberg 1974, Olshavsky & Granbois 1979,
Rothschild & Gaidis 1981). And even for so-called high-involvement purchases,
consumers appear to make use of their existing value systems and often display quite
limited information search (Wasson 1979, Olshavsky & Granbois 1979, Markin 1979).
Furthermore, extensive empirical evidence in the context of brand choice has supported
the correlation between attitudes and behavior in terms of mutual reinforcement and
consistency (Attitudes ⇔ Behavior), rather than causality (Attitudes ⇒ Behavior). This
stream of research is reviewed in the next Section.
2.2. Variations in Attitudinal Responses with Brand Usage
As already mentioned, the strong correlation between current and past usage of a brand
and consumers attitudes towards it is well documented. (An exception occurs when an
attribute reflects a strong functional differentiation for a particular brand, as will be
discussed below). Lower positive attitudinal responses (e.g. “washes white”) for brand
B than for brand A are mainly due to the fact that B has a lower market share and fewer
frequent buyers and users. This has been found for many different low-involvement,
Journal of Empirical Generalisations in Marketing Science, Volume Four, 1999 Page 67
highly branded product categories over the past thirty years, both in the UK and the US
(e.g. Bird & Ehrenberg 1966, Bird et al. 1970, Barwise & Ehrenberg 1985, Castleberry &
Ehrenberg 1990, Dall’Olmo Riley 1995).
As extensively documented in the references, the explanation is that very frequent or
recent buyers or “users” of a brand nearly all say that the brand “tastes nice”, or that
more generally they “intend to buy it”. In contrast, fewer of the less frequent or less
recent users of the brand give such positive attitudinal endorsement, fewer still do so
among infrequent users, let alone among those who claim never or virtually never to have
used the brand. Since a small brand B has relatively fewer frequent users compared with
a big brand A, fewer people overall tend to give B a positive attribute response. But
this is not because the users of brand B feel differently about B than users of A feel
about A, but rather because B has fewer users (i.e. a market share effect).
Attribute beliefs which vary in this way with brand usage are called “evaluative”,
because they reflect that users of a brand value the brand on each of the main features
expected from the product category as a whole (e.g. “tastes nice” for Breakfast Cereals
or “washes white” for Laundry Detergents).
The question here is whether such patterns replicate in a product category (wine) where
not only there are no large brands with a high number of current and past users, but also
where “social image”, usage occasion and involvement may dilute the structural market
share effect just described.
2.2.1. “Descriptive” Attributes
In contrast with the above, attribute beliefs which reflect a strong functional
characteristic or heavily promoted property of a specific brand and hence appear
“descriptive” (e.g. “Washes well in cold water” for the Laundry Detergent Cold Power)
were found not to be related to how many users the brand has. Indeed, "descriptive"
attribute belief mentions differ little between a brand’s users and its non-users. This is
Journal of Empirical Generalisations in Marketing Science, Volume Four, 1999 Page 68
because not only the users but also quite a lot of the infrequent users and non-users of the
brand will be aware of an obvious or heavily promoted characteristic (e.g. that Cold Power
allegedly “Washes well in cold water”). In this respect, “descriptive” attributes do not
reflect an ‘attitude’ towards the brand.
A more detailed discussion of the difference between "descriptive" and "evaluative"
attributes and their characterization can be found in Dall’Olmo Riley et al. (1997).
2.2.2. Double Jeopardy
A further known pattern in this kind of attitude - behavior relationship is that there is some
variation in attitudinal response levels even among the "users" of each brand - however
usership may have been defined (Castleberry & Ehrenberg 1990, Dall’Olmo Riley 1995).
This is again a market share variation, rather than being specific to the particular brands:
the fewer the number of brand users (i.e. for the smaller brand B), the fewer of these fewer
users also mention an “evaluative” attribute belief. This is a classic instance of Double
Jeopardy (e.g. McPhee 1963, Ehrenberg et al. 1990).
The theoretical explanation of Double Jeopardy (due to McPhee 1963) is as a statistical
selection effect that has to happen every time two or more items (for example brands) only
differ in their popularity (or their "sizes"), but are otherwise of "equal merit". In practice,
the "equal merit" assumption is less restrictive than it might sound, and refers to the
condition that an alternative must be compared with an appropriate "par".
McPhee's typical example to illustrate the phenomenon of Double Jeopardy is of two
restaurants (the only two in town) which hardly differ in anything else but their
popularity: one is known by many more people than the other. The people who know the
less popular restaurant almost certainly will know also the well known one, since almost
everybody does: when asked to indicate which restaurant they prefer some will say the
lesser known, but many will say the popular one (since it is the most popular!). However,
Journal of Empirical Generalisations in Marketing Science, Volume Four, 1999 Page 69
the less-informed people, who know only of the well-known restaurant, can name only
that one.
Similarly, in unpartitioned product categories, the few users of a small brand B are likely to
be users also of a large brand A, which has many users overall. Thus, especially in free-
choice questioning (e.g. “Which of these brands ‘tastes nice’?"), the users of the small
brand B will have the opportunity to say ‘tastes nice’ for either brand, and may "split their
vote" between the two. On the other hand, the users of the large brand A may not know,
let alone have ever used, smaller brands such as B, since few people do so anyway. When
asked to indicate "Which of these brands ‘tastes nice’?", they will only have A (or little
else) to choose from. Hence the statistical selection and the Double Jeopardy for the
smaller brand: few users, and fewer of whom say they like it, compared with the many
users of a large brand, many of whom say they do.
As we have just remarked, the statistical selection procedure at the basis of the Double
Jeopardy phenomenon is intensified by free-choice questioning, because of inherent
under reporting for the smaller brands in this type of work. This was noted by Barnard
& Ehrenberg (1990) in their comparison of free-choice and forced-choice techniques.
They found that with forced-choice questioning the Double Jeopardy phenomenon was
still noticeable, but was much less strong. The reason was that by forcing respondents
to give an answer to both large and small brands, no under-reporting could occur. We
test this finding here, whilst also testing the applicability of the Double Jeopardy
pattern to a sector lacking obvious ‘popular’ versus ‘unpopular’ brands.
3. Method of Analysis
Procedure
A sample of 110 consumers were interviewed in the London area by means of a
personally administered questionnaire about their usage and attitudes concerning wine.
The sample selected was kept approximately within the proportions of the demographic

Journal of Empirical Generalisations in Marketing Science, Volume Four, 1999 Page 70
profile of wine drinkers given by The 1998 Drink Pocket Book. However, as later
discussed, the proportion of medium and heavy wine drinkers may have been over-
represented, accounting for 85% of our sample, versus the combined total of 74%
reported by Mintel (1999). In particular, the proportion of respondents claiming to buy
wine once a fortnight or more often was substantial, at 68% of the sample. This was
used as a proxy for the degree of involvement of respondents, which was considered
high.
After a filter question to ascertain whether the respondent was indeed a wine drinker,
respondents were asked a wide range of questions regarding their buying habits,
intentions to buy and attribute beliefs concerning each of six brands of wine. The
questionnaire was modeled on a format frequently used by market researchers.
Wine Brands Selection
As remarked by Mintel (1999), brands in the wine market are difficult to define. A wine
“brand” may equally refer to a particular vintage, or to a ch!teau, or to a name applied
to a very wide range of different wines, red or white, sourced from many different
countries. As a consequence, the name of the variety of grape, or the country or region
of origin may fulfill the role of a “brand” for many consumers, giving an indication of the
characteristics and quality to be expected. Furthermore, as already noted in the
Introduction, the UK wine market is very fragmented, with no single brand having a
market share of more than 2%. Apart from some celebrated and usually expensive wines
that are available in most countries in the world, there is no popular, consistent wine
that can be found on supermarket shelves around the world (Rachman 1999).
Nonetheless, in pilot testing, it was possible to identify some names of wine producers
which most people were familiar with and would recognize as “brands”. On these
grounds, six brands were selected for the study: E&J Gallo, Jacob’s Creek, Stowells of
Chelsea, Le Piat d’Or and Hardy’s. These are given as the top 5 wine brands in the
1998 Drink Pocket Book, but their combined market share is only 6.9%. Their volume
Journal of Empirical Generalisations in Marketing Science, Volume Four, 1999 Page 71
sales are very similar, and the actual leadership may vary from month to month (Mintel
1999). The sixth brand, namely Blue Nun, was added to these five as it has a
significantly different price and image, and is also a well-known brand in the UK. The
brands tested were therefore all ‘large’ (relatively to the high degree of fragmentation in
the market), as also shown by the ‘penetrations’ figures among the sample reported in
the Results section. This was inevitable, given the necessity to identify recognizable
brands and avoid small sample biases. The underlying fragmentation of the wine market
and its potential consequences on the known usage and attitudinal patterns however still
remain. Thus the replication with extension nature of the study is unaffected.
Measures
The format of all questions was forced-choice. The two main measures we report in this
paper2 are:
(i) consumers’ claimed frequency of purchasing each brand in the past (referred as
‘brand usage’)
(ii) their beliefs about seven attributes of each brand.
Brand Usage
For the buying frequency of each brand, respondents were asked to choose one out of
seven possible frequencies ranging from “Once a week or more often” to “Less than
once or twice a year” and “Never” (plus Don’t know). Given the relatively small size of
the sample and in order to avoid biases especially for the lesser brands, the respondents
were collated into two main usage groups for tabulation and analysis purposes: i) the
individuals who claimed to drink a brand once a month or more often were grouped as
‘Users’ of that brand; ii) those who claimed to drink a brand ‘less than once or twice a
year’ or ‘never’ were considered to be ‘Non-users’. This classification is consistent
with previous studies (e.g. Barwise and Ehrenberg 1985; Castleberry and Ehrenberg
2 For the analysis of the other measures, see Rink (1998).

Journal of Empirical Generalisations in Marketing Science, Volume Four, 1999 Page 72
1990) that we are seeking to generalize and also reflects the composition of the sample
in terms of the buying frequency of the category.
Attribute Beliefs
Selecting attitudinal beliefs is often done by means of focus groups or in-depth
interviews to discover general ideas about the attributes that are valued by consumers.
For this study, and in order to get both descriptive and evaluative attributes for the
questionnaire, a variety of sources were used. These included past attitudinal studies
completed by Spawton (1991), Morgan & Sarris (1992) and Mintel (1997).
Additionally, various wine experts and suppliers were consulted.
This led to the selection of seven attributes: ‘Popular Nowadays’; ‘Good Value for
Money’; ‘Attractive Bottle Design’; ‘High Quality’; ‘Refreshing Drink’; ‘Good Flavor’;
‘The Region the Brand Comes From is Important to Me’. Of these, it was expected
that the attributes concerning the bottle design and the region of origin would behave
descriptively. This is due to the fact that the wine does not need to be drunk for the
respondent to have an attitude towards these factors. Furthermore, Mintel (1997 and
1999) remark that Australian and Californian wines have become increasingly popular.
As the leading Californian and Australian brand respectively, E&J Gallo and Jacob’s
Creek may have shown some deviations. Negative attributes were not included, since
past research (Barwise 1985) indicated that the responses for these attributes tend to be
lower and are therefore not very helpful discriminative attributes.

Journal of Empirical Generalisations in Marketing Science, Volume Four, 1999 Page 73
Attitudinal Belief Strength
We also wanted to measure the “strength” of the attitude held by consumers.
Consumers’ beliefs for each brand were therefore measured by means of a five point
Likert scale, ranging from “Strongly Agree” or “Agree” to “Disagree” or “Strongly
Disagree”, with a “Neither Agree or Disagree” option in the middle. The order of the
brands was alternated to avoid any response bias.
In this paper we were concerned with variations in attitudinal belief strength amongst
brands and between attribute beliefs. The conceptual questions were: (i) whether the
known association between brand usage and attitudinal beliefs would generalize to a
sector characterized by low branding and media advertising activity; and (ii) whether the
pattern would be stronger for more strongly held beliefs. We also wanted to test the
applicability of the Double Jeopardy pattern to a sector lacking obvious ‘popular’
versus ‘unpopular’ brands and the effect of forced-choice questions on the manifestation
of DJ itself. The results are detailed in the next Section.
4. Results
In this Section we analyze the relationship between attribute beliefs and claimed usage
behavior for each brand. In Section 4.1. we discuss the general relationship between
attitudes and usage. The issue of the strength of the attribute is also mentioned. Section
4.2. goes on to examine evaluative and descriptive attributes. Finally, in Section 4.3. the
Double Jeopardy phenomenon is discussed in the light of this research.
4.1. Current Brand Usage and Attribute Beliefs
Table 1 shows the results concerning the relationship between claimed brand usage and
the strength of attribute beliefs. The brands in Table 1 have been ordered by claimed
‘usage’ i.e. relative size. The column headed “Users” reports the percentages of
respondents claiming to drink each brand once a month or more often. The percentage
Journal of Empirical Generalisations in Marketing Science, Volume Four, 1999 Page 74
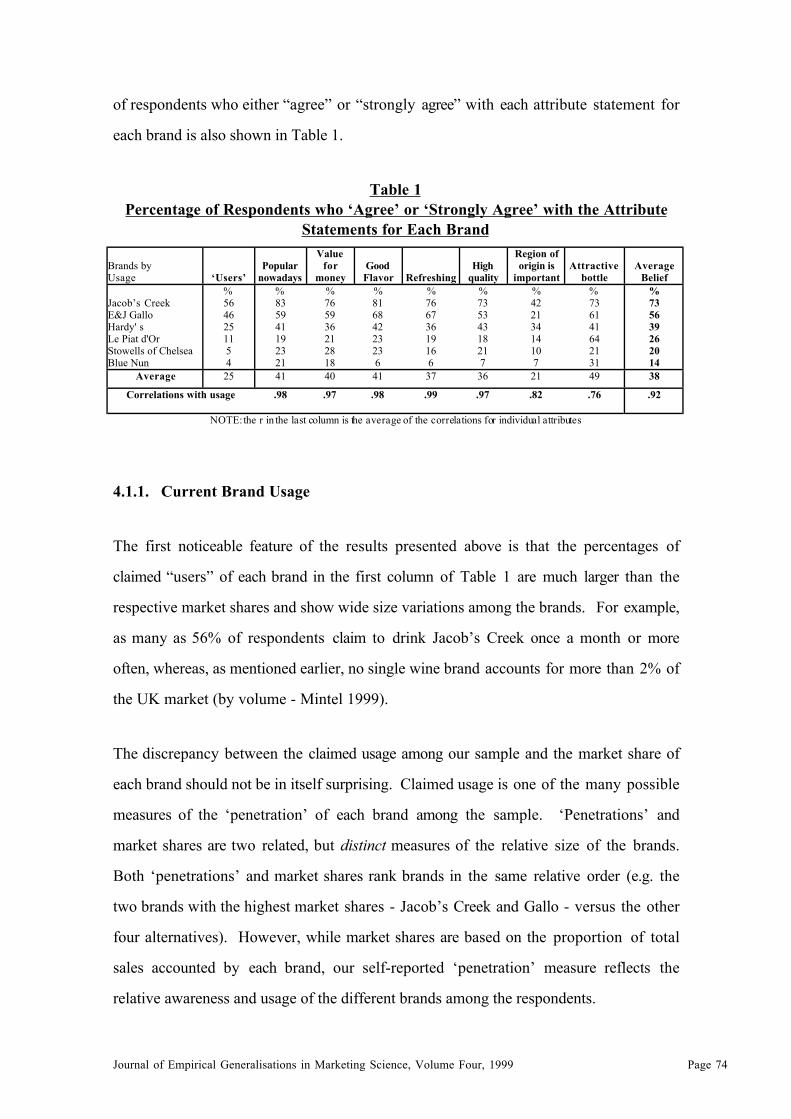
of respondents who either “agree” or “strongly agree” with each attribute statement for
each brand is also shown in Table 1.
Table 1Percentage of Respondents who ‘Agree’ or ‘Strongly Agree’ with the Attribute
Statements for Each Brand
Brands byUsage ‘Users’
Popularnowadays
Valuefor
moneyGoodFlavor Refreshing
Highquality
Region oforigin is
importantAttractive
bottleAverage
Belief
Jacob’s CreekE&J GalloHardy' sLe Piat d'OrStowells of ChelseaBlue Nun
%5646251154
%835941192321
%765936212818
%81684223236
%76673619166
%73534318217
%42213414107
%736141642131
%735639262014
Average 25 41 40 41 37 36 21 49 38
Correlations with usage .98 .97 .98 .99 .97 .82 .76 .92
NOTE: the r in the last column is the average of the correlations for individual attributes
4.1.1. Current Brand Usage
The first noticeable feature of the results presented above is that the percentages of
claimed “users” of each brand in the first column of Table 1 are much larger than the
respective market shares and show wide size variations among the brands. For example,
as many as 56% of respondents claim to drink Jacob’s Creek once a month or more
often, whereas, as mentioned earlier, no single wine brand accounts for more than 2% of
the UK market (by volume - Mintel 1999).
The discrepancy between the claimed usage among our sample and the market share of
each brand should not be in itself surprising. Claimed usage is one of the many possible
measures of the ‘penetration’ of each brand among the sample. ‘Penetrations’ and
market shares are two related, but distinct measures of the relative size of the brands.
Both ‘penetrations’ and market shares rank brands in the same relative order (e.g. the
two brands with the highest market shares - Jacob’s Creek and Gallo - versus the other
four alternatives). However, while market shares are based on the proportion of total
sales accounted by each brand, our self-reported ‘penetration’ measure reflects the
relative awareness and usage of the different brands among the respondents.
Journal of Empirical Generalisations in Marketing Science, Volume Four, 1999 Page 75
The fragmentation of the wine market in terms of the brands’ market shares and the
relatively high claimed usage of each of the brands are not in contradiction. In any
variety-choice category, where consumers purchase a portfolio of brands and the average
purchase frequency is high, ‘penetrations’ (however defined) will be considerably larger
than market shares. As already mentioned, a substantial percentage of our sample were
heavy and medium wine buyers. According to Mintel (1999) medium and heavy buyers
account for over 95% of wine consumed, are likely to be the more involved wine users,
and hence the “more confident” and willing to experiment with different wines on a
regular basis. The high degree of switching among a large number of wines and the large
portfolio sizes characteristic of the wine sector explain the fragmentation of the market
and the low market shares of individual brands. It also helps to explain the relatively
high ‘penetrations’, or exposure to a large number of brands, over a month period.
4.1.2. The Relationship between Current Brand Usage and Attribute Beliefs
The main pattern in Table 1 is that the higher the claimed usage of the brand, the larger
the proportion of respondents who either “strongly agree” or “agree” with each attribute
statement. For instance, whilst 73% of respondents “strongly agree” or “agree” with
the average attribute belief for Jacob’s Creek, only 14% do so for Blue Nun.
The pattern is reflected by the correlations between each attitude statement and the
claimed usage of the brands reported in the bottom row of Table 1 above. The
correlations between attitudes and usage are all very high, at .76 or above. The results in
Tables 1 do therefore confirm the previously known pattern of a strong correlation
between positive attribute beliefs and brand usage, with higher “strongly agree” and
“agree” responses to the attitudinal statements for the more heavily bought brands.
This is in spite of the peculiarities of the wine market noted at the beginning of the
paper and of the forced-choice questioning employed in the questionnaire. Different
usage splits do not affect the general pattern of results, apart from small sample biases
especially for the lesser brands.
Journal of Empirical Generalisations in Marketing Science, Volume Four, 1999 Page 76
4.1.3. Attitude Strength
We also checked whether the strength of the attitude affected the general results just
discussed. The reasoning behind this was that the patterns may be stronger and
possibly even show up only beyond a certain level of agreement, i.e. for the more
“committed” and strongest “supporters” of each brand. This would have been
manifested, for example, by higher correlation between the “strongly agree” responses
and usage, than between the “agree” statements and usage. However, as documented in
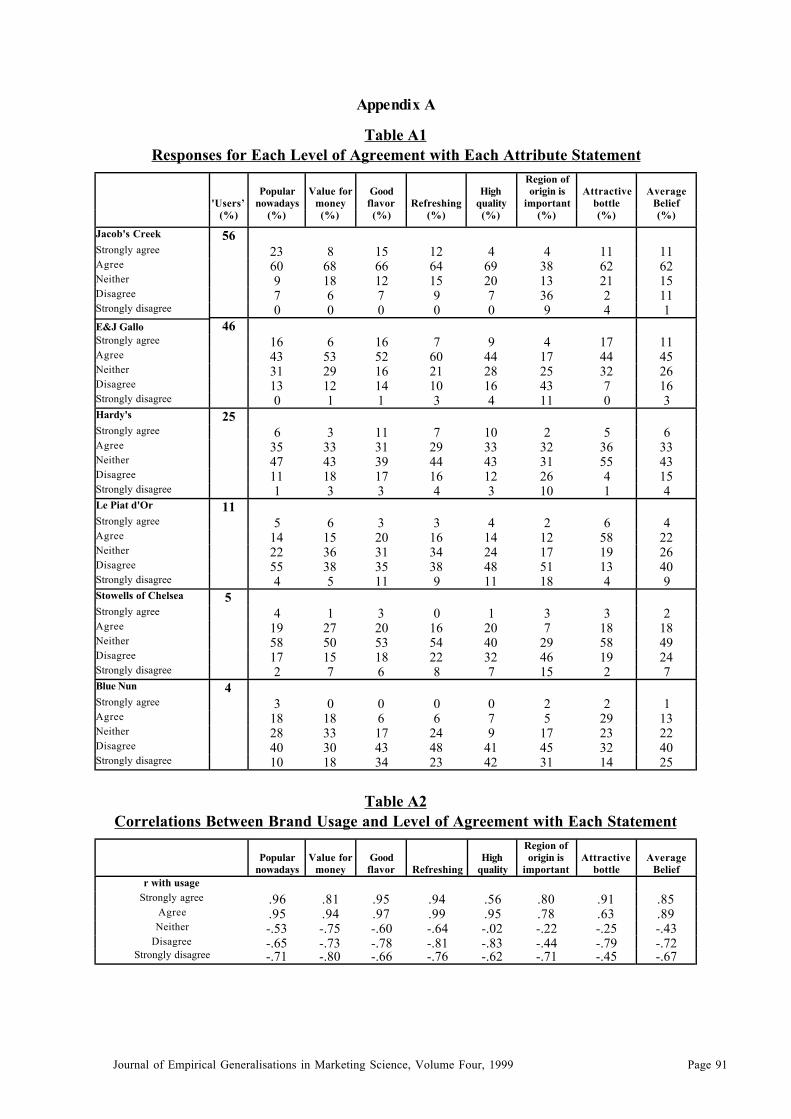
Appendix A (see Tables A1 and A2), this was not supported by the data. The
correlations between usage and the “strongly agree” and “agree” responses not only
were remarkably similar - showing no attitude strength effect -, but when they did differ,
they tended to be higher for the “agree” than for the “strongly agree” statements (see
Table A2 - Appendix A)3.
Additionally, even for the largest brands, the proportion of respondents “strongly
agreeing” with the attribute beliefs were considerably lower than the percentages
“agreeing” (see Table A1 - Appendix A). This may have been an “end-of-scale effect”,
causing respondents to avoid the selection of extreme points on the scale (Oppenheim
1992) (indeed, a similar “end of scale effect” occurred for the “strongly disagree”
responses). Such results did not justify discussing the issue of attitude strength in more
detail. Hence the decision to aggregate the “strongly agree” and “agree” responses as
done in Table 1 above.
4.2. “Evaluative” versus “descriptive” attributes
As mentioned in Section 2, attribute beliefs which vary with brand usage are called
“evaluative” because they reflect that users of a brand say, in effect, that they value the
brand they use on each of the criteria. Most attributes are of this kind (i.e. attitudinal)
and do not therefore reflect any idiosyncratic differences among brands, but merely
reflect that users of each brand generally endorse it on any of the attributes. The
Journal of Empirical Generalisations in Marketing Science, Volume Four, 1999 Page 77
correlations between brand usage and response levels for individual “evaluative”
attributes are usually found to be above .8 (Barwise & Ehrenberg 1985, Castleberry &
Ehrenberg 1990, Dall’Olmo Riley 1995).
This appears to be the case for all attributes in Table 1, in spite of occasional blips up or
down for individual brands, such as the relatively high score of Stowells of Chelsea for
the attribute “value for money” compared with the more used brand Le Piat d’Or.
Therefore, while “evaluative” attributes generally reflect the usage and presumably the
liking of each brand, they still capture such idiosyncratic differences among brands for
some attributes, such as Stowells of Chelsea’s characteristic box packaging, leading to a
“cheaper” image (see also the comparatively low score for the same brand on the
attribute “attractive bottle”). However, for the average attribute in Table 1 there is no
blip for Stowells of Chelsea. Individual differences should therefore not be interpreted
in isolation, but with reference to the general patterns in the data.
All the attributes in Table 1 have high correlations with usage levels (r = .92 on average).
This is so even for the attributes “region of origin is important” and “attractive bottle”
which had been predicted to be “descriptive” of idiosyncratic differences among brands
or sub-groups, and therefore were expected not to correlate with usage. In spite of
several blips up and down for individual brands on these two attributes, their
correlations with usage are still about .8.
It must be noted, however, that whilst useful in bringing out the main pattern in the data,
the relative size of the correlation coefficients may not be a sufficient criterion for
discriminating between "descriptive" and "evaluative" attributes. Not only can high
correlations be obtained as an effect of the large spread of the values, but also the cut-off
point between the two kinds of attributes can be subjective. Additional criteria should
therefore be used to bring out the "evaluative"/"descriptive" pattern. One of these criteria
3 In contrast, for the “disagree” and “strongly disagree” responses, the correlations withusage are negative.
Journal of Empirical Generalisations in Marketing Science, Volume Four, 1999 Page 78
is to compare the agreement scores of "Users" with those of "Non-Users". This is
discussed below.
4.2.1. Beliefs Among “Users” and “Non-users”
As discussed in Section 2.2., belief responses of "Users" should be considerably higher
than those of "Non-Users" for "evaluative" attributes, since these attributes are strongly
correlated with Usage. In contrast, since "descriptive" attributes are brand specific
factors, derived either from advertising or from a prominent and distinctive characteristic
of the brand, both "Users" and "Non-Users" should be able to recognize the features that
have become closely associated with individual brands (e.g. that Stowells of Chelsea is a
boxed wine).
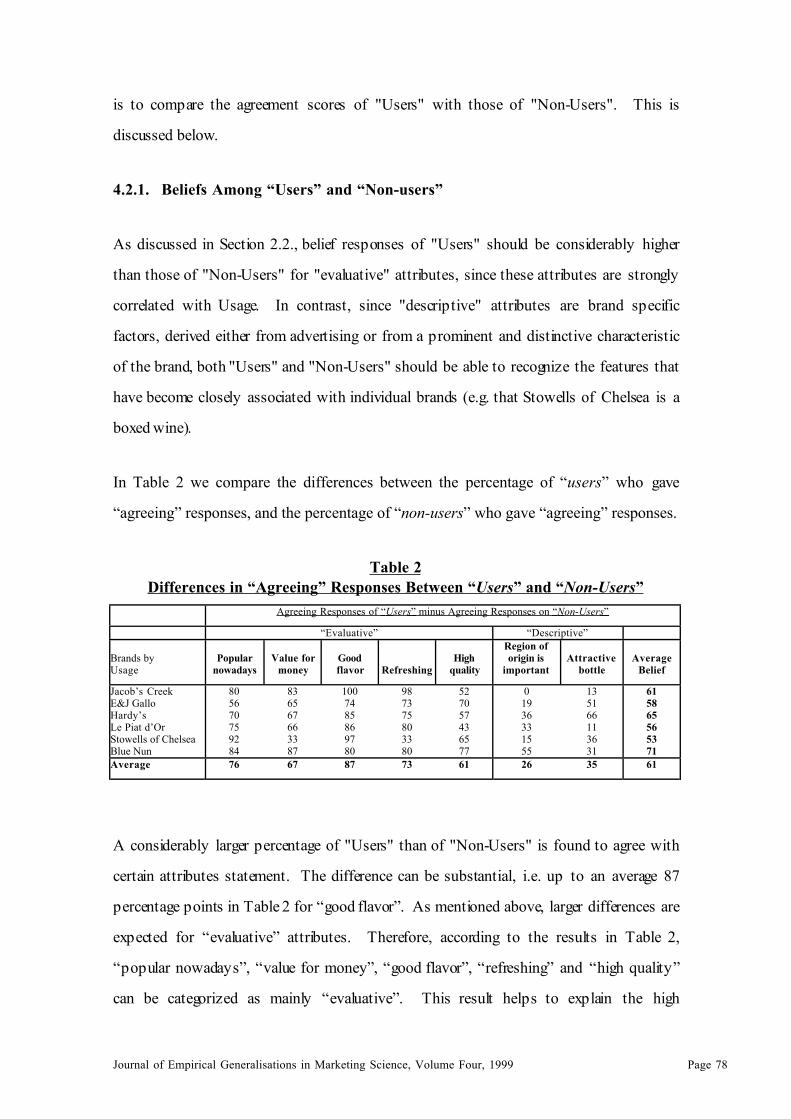
In Table 2 we compare the differences between the percentage of “users” who gave
“agreeing” responses, and the percentage of “non-users” who gave “agreeing” responses.
Table 2Differences in “Agreeing” Responses Between “Users” and “Non-Users”
Agreeing Responses of “ Users ” minus Agreeing Responses on “ Non-Users ”
“Evaluative” “Descriptive”
Brands byUsage
Popularnowadays
Value formoney
Goodflavor Refreshing
Highquality
Region oforigin is
importantAttractive
bottleAverage
Belief
Jacob’s CreekE&J GalloHardy’sLe Piat d’OrStowells of ChelseaBlue Nun
805670759284
836567663387
1007485869780
987375803380
527057436577
01936331555
135166113631
615865565371
Average 76 67 87 73 61 26 35 61
A considerably larger percentage of "Users" than of "Non-Users" is found to agree with
certain attributes statement. The difference can be substantial, i.e. up to an average 87
percentage points in Table 2 for “good flavor”. As mentioned above, larger differences are
expected for “evaluative” attributes. Therefore, according to the results in Table 2,
“popular nowadays”, “value for money”, “good flavor”, “refreshing” and “high quality”
can be categorized as mainly “evaluative”. This result helps to explain the high

Journal of Empirical Generalisations in Marketing Science, Volume Four, 1999 Page 79
correlations between these attributes and the Usage of the brand, since large brands have
more current "Users" than smaller brands.
In contrast, the differences between “users” and “non-users” agreement scores for the
attributes “region of origin is important” and “attractive bottle” are much lower than for
the rest of the attributes (at 26 and 35 respectively, on average). This indicates that
respondents do not need to be “users” of the brand to agree about these attributes,
which therefore show “descriptive” characteristics. This occurs in spite of the fact that
these two attributes had not been found to have significantly lower correlations with
usage than the other attributes in Table 1. The results in Table 2 do therefore support
the expectation that these two attributes should be considered as “descriptive” of brand
specific attributes which may be obvious to both “users” and “non-users” alike.
A further pattern, namely the occurrence of the Double Jeopardy phenomenon in our
data is discussed below. This is also relevant to the distinction between “evaluative”
and “descriptive” attributes.
4.3. Double Jeopardy
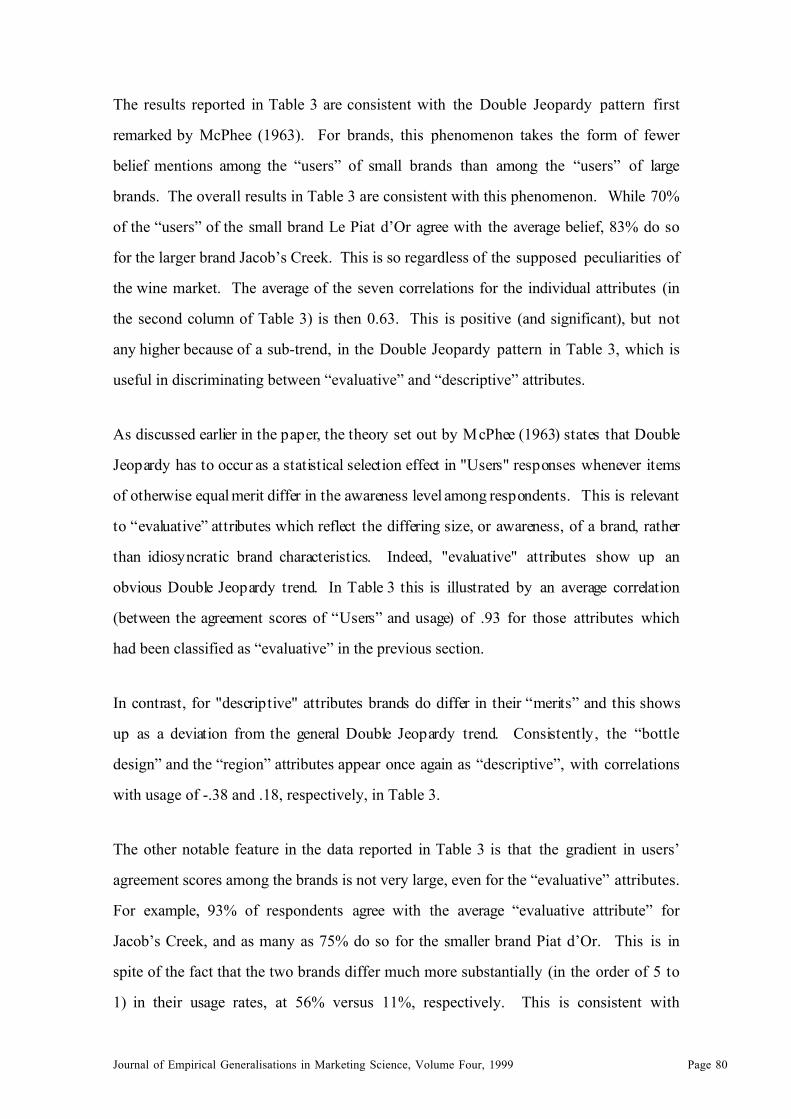
The relationship between attribute evaluations and usage is analyzed further in Table 3,
where we report the “agreeing” responses among the “users” of each brand (Stowells of
Chelsea and Blue Nun were not included in Table 3, due to the small number of “users”
for these two brands giving potentially misleading results).
Table 3Double Jeopardy for “Agreeing” Responses Among “Users”
“Evaluative” Beliefs “Descriptive” Beliefs
Brands byUsage
%Users
OverallAverage
BeliefPopular
nowadays
Valuefor
moneyGoodflavor
Refreshing
Highqual.
AverageEvalua.Beliefs
Region oforigin is
importantAttractive
bottle
AverageDescrip.Beliefs
Jacob’s CreekE&J GalloHardy’sLe Piat d’Or
%56462511
%83818070
%94888275
%90868575
%1001009692
%98968283
%81867850
%93918575
%43305242
%77808275
%60556759
Average 35 79 85 84 97 90 74 86 42 79 60Correlationwith usage
.63 .99 .91 .97 .93 .83 .93 -.38 .18 -.10
Journal of Empirical Generalisations in Marketing Science, Volume Four, 1999 Page 80
The results reported in Table 3 are consistent with the Double Jeopardy pattern first
remarked by McPhee (1963). For brands, this phenomenon takes the form of fewer
belief mentions among the “users” of small brands than among the “users” of large
brands. The overall results in Table 3 are consistent with this phenomenon. While 70%
of the “users” of the small brand Le Piat d’Or agree with the average belief, 83% do so
for the larger brand Jacob’s Creek. This is so regardless of the supposed peculiarities of
the wine market. The average of the seven correlations for the individual attributes (in
the second column of Table 3) is then 0.63. This is positive (and significant), but not
any higher because of a sub-trend, in the Double Jeopardy pattern in Table 3, which is
useful in discriminating between “evaluative” and “descriptive” attributes.
As discussed earlier in the paper, the theory set out by McPhee (1963) states that Double
Jeopardy has to occur as a statistical selection effect in "Users" responses whenever items
of otherwise equal merit differ in the awareness level among respondents. This is relevant
to “evaluative” attributes which reflect the differing size, or awareness, of a brand, rather
than idiosyncratic brand characteristics. Indeed, "evaluative" attributes show up an
obvious Double Jeopardy trend. In Table 3 this is illustrated by an average correlation
(between the agreement scores of “Users” and usage) of .93 for those attributes which
had been classified as “evaluative” in the previous section.
In contrast, for "descriptive" attributes brands do differ in their “merits” and this shows
up as a deviation from the general Double Jeopardy trend. Consistently, the “bottle
design” and the “region” attributes appear once again as “descriptive”, with correlations
with usage of -.38 and .18, respectively, in Table 3.
The other notable feature in the data reported in Table 3 is that the gradient in users’
agreement scores among the brands is not very large, even for the “evaluative” attributes.
For example, 93% of respondents agree with the average “evaluative attribute” for
Jacob’s Creek, and as many as 75% do so for the smaller brand Piat d’Or. This is in
spite of the fact that the two brands differ much more substantially (in the order of 5 to
1) in their usage rates, at 56% versus 11%, respectively. This is consistent with

Journal of Empirical Generalisations in Marketing Science, Volume Four, 1999 Page 81
previous findings (Barnard & Ehrenberg 1998) that whilst “penetrations” (or brand
usage) vary considerably from brand to brand, the percentage of users stating an
attribute belief tends to vary little amongst brands, except for a small Double Jeopardy
trend such as the one illustrated in Table 3. Similarly, in buying behavior, brands are
found to vary little in their respective loyalty rates, in spite of large variations in market
shares (Ehrenberg & Scriven 1996).
The gradient in attitudinal agreement scores among the four brands in Table 3 is small
also due to the effect of the forced-choice questioning used in this study. This may be
because the statistical selection procedure which is the basis of Double Jeopardy is
dampened by forcing respondents to give an answer for all brands, large and small. The
results in Table 3 therefore validate Barnard & Ehrenberg’s (1990) finding of a weak
Double Jeopardy pattern resulting from forced-choice questioning. The effect, however,
is not strong enough to eliminate the Double Jeopardy phenomenon altogether.
5. Discussion
This study set out to examine the strength of the theory about attitude-behavior
relationships as proposed by Ehrenberg and colleagues, and found support for their
previous work. The purpose of testing whether the theory could be extended to a
market whose characteristics are different from any market previously examined was
achieved, and it was found that the theory is indeed generalisable to the wine market, in
spite of its peculiarities. The same aggregate patterns were also found for a different
questioning method (forced-choice) and for different attitudinal strengths.
A number of limitations of the study should however be recognized. The first limitation
is the small sample size. This had a number of consequences, including the small
number of responses for the lesser brands and the necessity to exclude such brands from
the Double Jeopardy results. As earlier mentioned, the proportion of medium or heavy
wine drinkers in the sample was over represented (at 85% versus the 74% proportion
reported by Mintel 1999). Medium and heavy consumers may be more involved with
Journal of Empirical Generalisations in Marketing Science, Volume Four, 1999 Page 82
wine purchasing and be more aware of the different brands, possibly inflating their
claimed usage. However, it should be noted that medium and heavy users do account for
over 95% of wine consumed anyway (Mintel 1999). Hence our results should not be
greatly affected by this over representation. The other limitation is that the brands
tested were all ‘large’, relatively to the overall number in the market. However, as
already mentioned, this was unavoidable, given the necessity to identify recognizable
brands and avoid further small sample biases.
The main findings and interpretation are now summarized below.
5.1. Summary of Results
Attribute Beliefs and Brand Usage
Consistent with past studies by Ehrenberg and colleagues, our results showed that
agreement with brand attribute evaluations increased with higher claimed usage (i.e.
relative brand size or ‘penetration’). The correlations between such attribute evaluation
agreement scores and usage were positive and greater than 0.76 for all seven attributes.
In contrast, disagreement with brand attribute evaluations decreased with higher claimed
usage, resulting in negative correlations with usage (see Table A1 in Appendix A).
Our results confirm previous patterns, in spite of the peculiarities of the wine market,
such as its great fragmentation, the lack of substantial brand specific advertising support
and the reputedly higher purchase involvement.
The internal consistency of the attitude and usage measures has been established in spite
of the danger, stressed by several authors (e.g. Heeler & Ray 1972), that close
relationships between variables would originate mostly from the effort of respondents to
be seen as consistent in their answers. However, in the context of the number of studies
reporting such patterns (e.g. Bird & Ehrenberg 1966, Bird et al. 1970, Barwise &
Ehrenberg 1985, Castleberry & Ehrenberg 1990, Dall’Olmo Riley 1995; and our
evidence here), the consistency of the correlation between usage and attribute scores is

Journal of Empirical Generalisations in Marketing Science, Volume Four, 1999 Page 83
staggering, given for instance differences in the degree of purchase involvement across
products (i.e. reputedly higher for wine and lower for laundry detergents). Furthermore,
the number of products, brands and attributes used in some of these studies would make
it extremely difficult for respondents to purposely achieve such high degree of
consistency in their answers.
Moreover, although some consistency bias is conceivable, the pattern for "descriptive"
attributes and the occurrence of Double Jeopardy would seem to suggest that such bias
does not affect large and small brands in the same way, and other factors should be
considered. For instance, there is evidence that the exposure to a stimulus (in our case to a
brand) influences its perception and its degree of liking (Zajonc 1968), and has the effects
described by Double Jeopardy theory (McPhee 1963). Moreover Bem (1967) has
suggested that attitudes are expression of people's self-perceptions of their behavior (e.g.
"I must like brown bread, because I am always eating it").
However, future research should resolve this issue of internal consistency further, first by
means of wide replication, and then by testing if changing the order of the questions across
respondents in a randomized manner affects the relationship between attitudinal
responses and usage in any way. This procedure is suggested by many authors (e.g.
Oppenheim 1992) as a way of testing for any bias arising from the order of the questions.
Scaling and the Strength of the Attitude
The extension to a scaling technique for measurement revealed the expected pattern of
results, i.e. the positive relationship between attitudes and usage. No sub-patterns were
found relating to different attitude strengths. The positive relationship between
attitudes and usage occurred to the same extent for the “strongly agree” and the “agree”
responses in a forced-choice situation. This result indicates that no great commitment or
attitude strength is necessary for the known patterns to occur.
Journal of Empirical Generalisations in Marketing Science, Volume Four, 1999 Page 84
The conclusion of this extension is therefore that “free choice” and scaling reveal similar
relationships; yet “free choice” produces less data and is therefore easier and clearer to
analyze, and may be preferred in this kind of work.
“Evaluative” versus “Descriptive” Attributes
The distinction between “evaluative” attributes - which vary with brand usage - and
“descriptive” attributes - which do not - was also tackled in the context of the wine
market. First we compared the relative sizes of the correlations between usage and
attribute statements. The correlations with usage of the two attributes which we had ‘a
priori’ classified as “descriptive” were indeed lower (at about .8) than the correlations
with usage of all other statements (.97 or higher), but not in a significant way. This may
indicate that “evaluative” and “descriptive” attribute statements operate in a continuum,
rather than being two discrete types of judgments. Perhaps it would be more
appropriate to talk about “mainly evaluative” versus “mainly descriptive” attributes.
However, when we compared the agreement scores of the “Users” and “Non-Users” of
each brand, we did find evidence for the differentiation of two attributes as
“descriptive”, as the differences in “agreeing” responses between “Users” and “Non-
Users” were substantially smaller than for the other five attributes. This indicated that
the respondents did not need to be users of the brand to have positive attitudes about
these two attributes. In contrast, all other attributes behaved as “evaluative”, with large
differences between the agreement scores of “users” and of “non-users”. Our results
confirmed that “descriptive” attributes only account for a small percentage of all
attributes, as discussed in more detail elsewhere (Dall’Olmo Riley et al. 1997). They
also confirmed no apparent causation between brand specific “descriptive” attributes
and brand choice.

Journal of Empirical Generalisations in Marketing Science, Volume Four, 1999 Page 85
Double Jeopardy
We also investigated the occurrence of the Double Jeopardy phenomenon. Specifically,
since the brands chosen did not differ markedly in market share, with no consistent
brand leader from month to month (Mintel 1999), it might have been conceivable for the
Double Jeopardy effect not to occur. Yet, in spite of the brands’ similarly low market
shares, they varied a lot in terms of their ‘penetrations’ (or degree of awareness) among
respondents. As discussed in the Results section, ‘penetrations’ and market shares are
two distinct, but related measures of the relative size of the brands. The wide variations
in the brands’ ‘penetrations’ was enough for the Double Jeopardy phenomenon to be
manifest in the data. The result is, however, “real” and not an artifact of the
measurement technique, as demonstrated by the fact that the use of force-choice
questioning was not enough to overcome the statistical selection procedure upon which
the Double Jeopardy theory is based. (As expected, an exception did arise for the two
“descriptive” attributes concerning bottle design and region of origin, for which the
correlations with usage were low or even negative.)
Once again, therefore, neither the peculiarities of the wine market nor the type of
measures employed affected the occurrence of the known patterns.
5.2. Managerial Implications
In contrast with many failed attempts in previous literature to predict the buying
behavior of individual consumers from measures of their attitudes, the results presented
in our paper show strong support for the generalisability of Ehrenberg’s theory of the
usage-attitudes consistency.
Such results are useful to management and marketers conducting attitudinal research not
only within the wine, but also within other industries. First of all, our results have
stressed the necessity to shift the emphasis of attitudinal research from a deterministic
and predictive Attitudes → Behavior causality to a diagnostic Behavior/Experience →
Journal of Empirical Generalisations in Marketing Science, Volume Four, 1999 Page 86
Post hoc Evaluation approach. This is strongly supported by the found correlations
between the relative size of the brands and consumers’ attitudinal evaluations. These
showed no idiosyncratic differences among brands that would justify (or cause) brand
choice. This was also so for those attributes which reflect peculiar characteristics of
individual brands, such as their country of origin or their packaging. Neither appeared to
be determinant of brand choice.
This study provides managers with an understanding of “normal” market behavior with
respect to:
• The relationship between attribute beliefs and brand usage (or relative size).
Awareness of these different patterns can be useful to managers for the interpretation of
attitudinal statements. For example, managers should question to what extent are
attributes "determinant" (e.g. Myers & Alpert 1968, Alpert 1971, Armacost & Hosseini
1994) in influencing consumers' choices and to what extent do they merely reflect the
relative size of the brands.
• The Double Jeopardy phenomenon for brand attitudes. The effect of Double
Jeopardy can also be seen as a valuable point for managers and marketers to consider.
They must acknowledge that it is often unrealistic to expect a small brand to achieve
more positive attitude scores than a large brand.
An overriding implication for all managers and marketers from the results of this study
is that in order to spread positive attitudes towards their brands, they must encourage
actual ‘trial’ and usage of the brands, as this is what leads to the attitudes concerning the
brands. Managers should therefore take this as an indication that distribution is very
important and brands must be very widely available and promoted in store, in order to
obtain and reach a large number of consumers, especially in increasingly cluttered
markets (such as wine). The rise in supermarket wine sales (accounting now for 60% of
the wine market in the UK) favors branded wines supplied by big producers. Not only
Journal of Empirical Generalisations in Marketing Science, Volume Four, 1999 Page 87
shoppers are likely to be attracted by a wine they have heard of, but the supermarkets
themselves like branded wines which make up for high-volume sales (Rachman 1999).
Increasing distribution and usage poses a challenge especially for the smaller producers
whose resources are limited. While achieving distribution by the big grocers and off-
license chains might be infeasible, smaller brands may profitably compete in
independent retailers and may also aim at building relationships with distributors serving
restaurants and caterers. Promotional activities at the point of sale seem to be an
effective method of increasing awareness of wine brands, resulting in over a third of wine
buyers deciding what to buy when in the shop (Mintel 1999). These below-the-line
activities should not be a major drain on the resources of wine producers, and can be
undertaken on behalf of both large and small brands.
This research can direct marketers towards a more market oriented approach, as it gives
a clearer picture of how consumers behave in the market, the attributes that are most
closely associated with usage, and the importance of obtaining wide distribution and a
large brand share. Specifically for brand managers of the six brands in this study, it also
gives a clearer picture of where these brands are in relation to their competition, and
within the mind of the consumers. However, through this and previous research, the
same general patterns are becoming established whatever the peculiarities of individual
markets.
Finally, the finding that the use of a scaling technique provides no new or more detailed
results than the use of the method of ‘free choice’ is valuable information for market
researchers, as it prevents time wasted over more time consuming measurement
methods.

Journal of Empirical Generalisations in Marketing Science, Volume Four, 1999 Page 88
6. References
Ajzen, I.; Fishbein, M. (1977) “Attitude-behavior relations: a theoretical analysis and
review of empirical research”, Psychological Bulletin, Vol. 84, p. 888-918.
Alpert, M.I. (1971) “Identification of Determinant Attributes: A Comparison of
Methods”, Journal of Marketing Research, Vol. 8, p. 184-191.
Armacost, R.L.; Hosseini J.C. (1994) “Identification of Determinant Attributes Using the
Analytic Hierarchy Process”, “Journal of the Academy of Marketing Science”, Vol. 22, p.
383-392.
Barnard, N.R.; Ehrenberg, A.S.C. (1990) “Robust Measures of Consumer Brand
Beliefs”, Journal of Marketing Research, Vol. 27, p. 477-84.
Barnard, N.R.; Ehrenberg, A.S.C. (1997) “Advertising: Strongly Persuasive or
Nudging?”, Journal of Advertising Research, Vol. 37, p. 21-31
Barnard, N.R.; Ehrenberg, A.S.C. (1998) “Advertising and Brand Attitudes”, JOAB
Report No. 7. South Bank University Business School.
Barwise, T.P. (1985) Mass Attitudes and Routine Choice Behaviour, University of
London PhD Thesis.
Barwise, T.P.; Ehrenberg, A.S.C. (1985) “Consumer beliefs and brand usage”, Journal of
Market Research Society, Vol. 27, p. 81-93.
Bem, D.J. (1967) “An Experimental Analysis of Self-Persuasion”. In: Fishbein M. (ed)
"Readings in Attitude Theory and Measurement", N.Y., Wiley and Sons.
Bird, M.; Ehrenberg, A.S.C. (1966) “Intention to Buy and Claimed Brand Usage”,
Operations Research Quarterly, Vol. 17, p. 27-46.
Bird, M; Channon, C.; Ehrenberg, A.S.C. (1970) “Brand Image and Brand Usage”,
Journal of Market Research, Vol. 7, p.307-314.
Brown, G.H.; Farr A.; Allan G.; Green J.; Baldinger A.; Pincott G. (1992) People, Brands
& Advertising. Millward Brown International, Warwick, UK.
Castleberry, S.B.; Ehrenberg, A.S.C. (1990) “Brand Usage: A Factor in Consumer
Beliefs”, Marketing Research, p. 14-19.
Journal of Empirical Generalisations in Marketing Science, Volume Four, 1999 Page 89
Dall’Olmo Riley (1995) Changing Consumer Attitudes in Steady Markets, University of
London. PhD Thesis.
Dall’Olmo Riley, F.; Ehrenberg, A.S.C.; Castleberry, S.B.; Barwise, T.P.; Barnard, N.R.
(1997), “The Variability of Attitudinal Repeat-Rates”, International Journal of Research
in Marketing, Vol. 14, p. 437-450.
Drinks Pocket Book, (1998).
East, R. (1997). Consumer Bevaviour. Advances and Applications in Marketing,
Prentice Hall: London
Ehrenberg, A.S.C. (1959) “The Patterns of Consumer Purchases”, Applied Statistics, Vol.
8, p. 26-41.
Ehrenberg, A.S.C. (1972, 1988) Repeat-Buying. Facts, Theory and Applications, Oxford
University Press: New York.
Ehrenberg, A.S.C. (1974) “Repetitive Advertising and the Consumer”, Journal of
Advertising Research, Vol. 14, p. 25-34.
Ehrenberg, A.S.C.; Goodhardt G.J. (1979) Understanding Buyer Behaviour, Vol. 1-14, J.
Walter Thompson Company and Market Research Corporation of America.
Ehrenberg, A.S.C.: Goodhardt, G.J.: Barwise, T.P. (1990) “Double Jeopardy Revisited”,
Journal of Marketing, Vol. 54, p. 82-91.
Ehrenberg, A.S.C.; Scriven J.A. (1996) “Brand Loyalty under the Microscope”,
Economics and Business Education, Vol. 4, p. 155-160.
Ehrenberg, A.S.C.; Barnard, N.R.; Scriven J.A. (1997) “Differentiation or Salience”,
Journal of Advertising Research, Vol. 37.
Fishbein, M. (1963) “An investigation of the relationships between beliefs about an object
and attitudes to that object”, Human Relations, Vol. 16, p. 233-240.
Goddard, J.O. (1978) Components of Brand Popularity, University of London PhD
Thesis.
Heeler, R.M.; Ray M.L. (1972) “Measure Validation in Marketing”, Journal of Marketing
Research, Vol. 9, p. 361-370.
Markin, R.J. (1979) “The Role of Rationalization in Consumer Decision Processes: A
Revisionist Approach to Consumer Behaviour”, Journal of the Academy of Marketing
Journal of Empirical Generalisations in Marketing Science, Volume Four, 1999 Page 90
Mintel (1997 and 1999) UK Wine Reports.
Morgan, R.E.; Sarris, G. (1991) “The International Marketing of Cyprus Wines: A Case
Example - The UK Market”, The International Journal of Wine Marketing, Vol. 1, p.
44-56.
Myers, J.; Alpert M.I. (1968) “Determinant Buying Attitudes: Meaning and
Measurement”, Journal of Marketing, Vol. 32, p. 13-20.
McPhee, W.N. (1963) Formal Theories of Mass Behavior, Free Press: New York.
Olshavsky, R.W.; Granbois D.H. (1979) “Consumer Decision Making - Fact or Fiction?”,
Journal of Consumer Research, Vol. 6, Issue 2, p. 93-100.
Oppenheim, A.N. (1992) Questionnaire Design, Interviewing and Attitude
Measurement, Printer Publishers: London.
Quester, P.G.; Marr, N.E.; Yeoh, P.S. (1996) “Country of origin effects: an Australian
experiment in shelf labeling”, The International Review of Retail, Distribution and
Consumer Research, Vol. 6, p. 85-104.
Rachman G. (1999) “Survey: Wine”, The Economist, Vol. 353, No. 8150, December
18th, p. 107-123.
Rink L. (1998) The Attitude -Behaviour Relationship and Usage Effect in the White Wine
Market, Kingston University MA Dissertation.
Rosenberg, M.J. (1956) “Cognitive structure and attitudinal affect”, Journal of Abnormal
and Social Psychology, Vol. 53, p. 367-372.
Rothschild, M.L; Gaidis W.C. (1981) “Behavioral Learning Theory: Its Relevance to
Marketing and Promotions”, Journal of Marketing, Vol. 45, p. 70-78.
Spawton, T. (1991) “Marketing Planning for Wine”, European Journal of Marketing,
Vol. 25.
Wasson, C.R. (1979) “Consumer Choice Processes: Search or Automatic Response?”,
Journal of the Academy of Marketing Science, Vol. 7, No. 4.
Wilkie, W. L.; Pessemier, E.E. (1973) “Issues in marketing use of multi-attribute models”,
Journal of Marketing Research, Vol. 10, p. 428-441.
Zajonc, R.B. (1968) “Attitudinal Effects of Mere Exposure. Journal of Personality and
Social Psychology”, Vol. 9 (Monograph Supplement), No. 2, Part 2, p. 1-27.
Journal of Empirical Generalisations in Marketing Science, Volume Four, 1999 Page 91
Appendix A
Table A1Responses for Each Level of Agreement with Each Attribute Statement
'Users’Popular
nowadaysValue for
moneyGoodflavor Refreshing
Highquality
Region oforigin is
importantAttractive
bottleAverage
Belief(%) (%) (%) (%) (%) (%) (%) (%) (%)
Jacob's Creek 56Strongly agree 23 8 15 12 4 4 11 11Agree 60 68 66 64 69 38 62 62Neither 9 18 12 15 20 13 21 15Disagree 7 6 7 9 7 36 2 11Strongly disagree 0 0 0 0 0 9 4 1E&J Gallo 46Strongly agree 16 6 16 7 9 4 17 11Agree 43 53 52 60 44 17 44 45Neither 31 29 16 21 28 25 32 26Disagree 13 12 14 10 16 43 7 16Strongly disagree 0 1 1 3 4 11 0 3Hardy's 25Strongly agree 6 3 11 7 10 2 5 6Agree 35 33 31 29 33 32 36 33Neither 47 43 39 44 43 31 55 43Disagree 11 18 17 16 12 26 4 15Strongly disagree 1 3 3 4 3 10 1 4Le Piat d'Or 11Strongly agree 5 6 3 3 4 2 6 4Agree 14 15 20 16 14 12 58 22Neither 22 36 31 34 24 17 19 26Disagree 55 38 35 38 48 51 13 40Strongly disagree 4 5 11 9 11 18 4 9Stowells of Chelsea 5Strongly agree 4 1 3 0 1 3 3 2Agree 19 27 20 16 20 7 18 18Neither 58 50 53 54 40 29 58 49Disagree 17 15 18 22 32 46 19 24Strongly disagree 2 7 6 8 7 15 2 7Blue Nun 4Strongly agree 3 0 0 0 0 2 2 1Agree 18 18 6 6 7 5 29 13Neither 28 33 17 24 9 17 23 22Disagree 40 30 43 48 41 45 32 40Strongly disagree 10 18 34 23 42 31 14 25
Table A2Correlations Between Brand Usage and Level of Agreement with Each Statement
Popularnowadays
Value formoney
Goodflavor Refreshing
Highquality
Region oforigin is
importantAttractive
bottleAverage
Beliefr with usage
Strongly agree .96 .81 .95 .94 .56 .80 .91 .85Agree .95 .94 .97 .99 .95 .78 .63 .89Neither -.53 -.75 -.60 -.64 -.02 -.22 -.25 -.43
Disagree -.65 -.73 -.78 -.81 -.83 -.44 -.79 -.72Strongly disagree -.71 -.80 -.66 -.76 -.62 -.71 -.45 -.67