patterns of antibiotic use in european hospitals · patterns of antibiotic use in european...
TRANSCRIPT

Patterns ofPatterns of Antibiotic UseAntibiotic Use
In European HospitalsIn European Hospitals
Fiona M. MacKenzieFiona M. MacKenzie
Aberdeen Royal Infirmary, Aberdeen Royal Infirmary, ScotlandScotland

““Development of Strategies Development of Strategies for Control and Prevention for Control and Prevention of Antibiotic Resistance in of Antibiotic Resistance in
European HospitalsEuropean Hospitals””

Policies associated with Policies associated with low antibiotic use low antibiotic use
low antibiotic resistance rates low antibiotic resistance rates low rates of transmissible pathogenslow rates of transmissible pathogens
ARPAC
ARPAC: Antibiotic Use dataARPAC: Antibiotic Use data
Annual, aggregated hospital data (2001)Annual, aggregated hospital data (2001)
Unit = Defined Daily Dose /100 bedUnit = Defined Daily Dose /100 bed--daysdays
DDD = assumed average maintenance dose per day for a drug for its main indication in a 70kg adult
DDDs assigned by WHO collaborative Centre for Drug Statistics
Methodology (Norway)
Anatomical Therapeutic Chemical (ATC) classification
J01 subclass; “antibacterials for systemic use”

Monnet DL. ABC Calc - Antibiotic consumption calculator[Microsoft® Excel application]. Version 3.0
Copenhagen (Denmark): Statens Serum Institut 2005ABC Calc
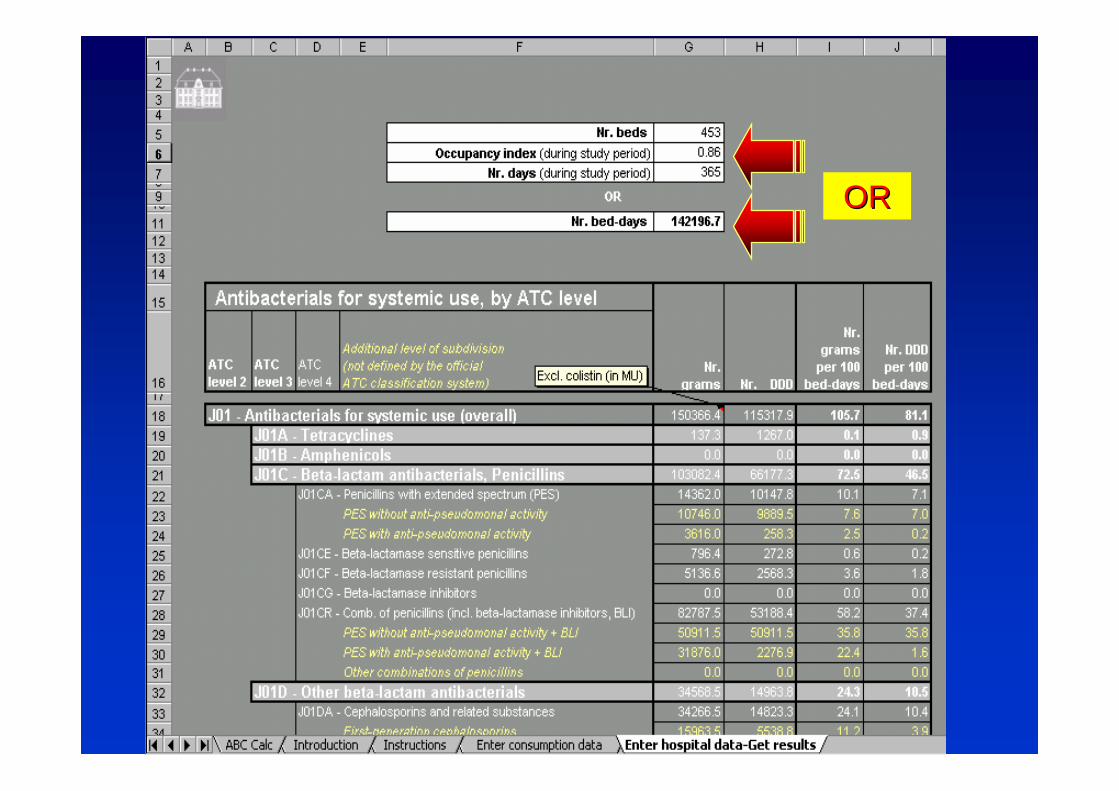
OROR

Number of hospitals Number of hospitals supplying antibiotic use datasupplying antibiotic use data
North North n = 19n = 19
South South + Israel + Israel
+ Turkey + Turkey n = 27n = 27
West West n = 52n = 52 Central Central
/Eastern + /Eastern + Baltic States Baltic States
n = 34n = 34
SouthSouth--East East n = 8n = 8
TotalTotalAntibiotic ConsumptionAntibiotic Consumption

Antibiotic use data: Distribution (n = 140) Antibiotic use data: Distribution (n = 140) 20012001Fr
eque
ncy
Antibiotic use (DDDs / 100 bed-days)
Median = 50 (37,67) Minimum = 5 Maximum = 121
West
54 France
61
26
13
18
32
23
15
10 117
1 1 10
5
10
15
20
25
30
35
10 20 30 40 50 60 70 80 90 100 110 120 130

Antibiotic UseAntibiotic UseJ01 Median values (J01 Median values (DDDsDDDs/100 BD)/100 BD)
North North n = 19n = 19
South South + Israel + Israel
+ Turkey + Turkey n = 27n = 27
West West n = 52n = 52 Central Central
/Eastern + /Eastern + Baltic States Baltic States
n = 34n = 34
SouthSouth--East East n = 8n = 8
3131
4242
4848
5454
7575

NorthNorth
n=19
WestWest
n=52
SouthSouth
n=28
SouthSouth--EastEast
n=8
Central/ EastCentral/ East
n=33
DD
D/1
00 b
edD
DD
/100
bed
-- day
sda
ysMedian total antibiotic use: 2001
By Geographical Region, n = 140
3131 4242 4848 5454 7575MediansMedians
p < 0.001p < 0.001
0
20
40
60
80
100
120
140
Central-East South-East North West South

Antibiotic Consumption:Antibiotic Consumption:
The major classesThe major classes

0 5 10 15 20
J01A Tetracyclines
J01B Amphenicols
J01C β-lactams, Penicillins
J01D Other β-lactams
J01E Sulfonamides & Trimethoprim
J01F Macrolides, Lincosamides, Streptogramins
J01G Aminoglycosides
J01M Quinolones
J01X Other antibacterials
DDDs /100 bed-days, Median values (n = 140)
n = 140

Median use of penicillin class (J01 C)
p < 0.001p < 0.001By Geographical Region, n = 140
99 1313 2323 2222 2121Median Median valuesvalues
DD
D/1
00 b
edD
DD
/100
bed
-- day
sda
ys
NorthNorth
n=19
WestWest
n=52
SouthSouth
n=28
SouthSouth--EastEast
n=8
Central/ EastCentral/ East
n=33
0
10
20
30
40
50
60
Central-East South-East North West South

Comb. of pen + BLI
BL inhibitors
BL-resistant
BL-susceptible
Extended spectrum
J01C subJ01C sub--classes classes –– as proportion of total J01 C useas proportion of total J01 C use
Median use of Median use of J01 C J01 C
DDD/100 BDDDD/100 BD
PenicillinsPenicillins
North West SouthSouth-EastCentral/ East
99 1313 2222 2222 2222
0
5
10
15
20
25
c-east s-east north west south

Median use of non-penicillin beta lactams (J01 D)D
DD
/100
bed
DD
D/1
00 b
ed-- d
ays
days
p < 0.001p < 0.001By Geographical Region, n = 140
88 1010 88 1212 1616
Median valuesMedian values
NorthNorth
n=19
WestWest
n=52
SouthSouth
n=28
SouthSouth--EastEast
n=8
Central/ EastCentral/ East
n=33
0
5
10
15
20
25
30
35
Central-East South-East North West South

Carbapenems
Monobactams
4GC
3GC
2GC
1GC
Carbapenems
Monobactams
4GC
3GC
2GC
1GC
J01 D subJ01 D sub--classes classes –– as proportion of total J01 D useas proportion of total J01 D useMedian use of Median use of
J01 D J01 D DDD/100 BDDDD/100 BD
NonNon--penicillin Bpenicillin B--lactamslactams
North West SouthSouth-EastCentral/ East
88 1010 88 1212 1616
0
2
4
6
8
10
12
c/east s-east north west south

Antibiotic Consumption:Antibiotic Consumption:
Individual antibioticsIndividual antibiotics

Spearman Rank Correlation Coefficients
r = 0.431
P<0.01
Relationship between number of individual antibiotics used and total antibiotic use
DD
D/1
00 b
edD
DD
/100
bed
-- day
sda
ys
Number of antibiotics on Number of antibiotics on ““formularyformulary””
0
20
40
60
80
100
120
140
0 20 40 60 80 100

Top - 5 antibiotics used
All hospitals, n = 140All hospitals, n = 140
Amox + BLI O
Amox + BLI P
Ciprofloxacin O
Cefuroxime P
Amoxicillin O
1
2
3
4
5
WEST, n = 52WEST, n = 52
Amox + BLI P
Amox + BLI O
Ciprofloxacin O
Cefuroxime P
Amoxicillin O
1
2
3
4
5

Sulfa - Trim O 1%
Ciprofloxacin P 2%
Ciprofloxacin O 2%
Top - 10 antibiotics used (Median values. % of total use)(Median values. % of total use)
Amox + BLI O 27%
Amoxicillin O 16%
Ofloxacin O 5%
Amoxicillin P 5%
Amox + BLI P 4%
Ceftriaxone P 3%
Pristinamycin O 2%
1
2
3
4
5
6
7
8
9
10
FranceFrance
67 agents used
Top-10 = 67% of total use

RecommendationsHospitals
Agree universal unit
Local surveillance of antibiotic use
Feedback to prescribers
Investigate fluctuations & relationship with resistance
Clinical pharmacy services to support prescribing

RecommendationsNational / European Health Authorities
National programmes to monitoring antibiotic use.
Implementation of a national surveillance system for collation, feedback and benchmarking of antibiotic consumption data in hospitals.
Integrate with National programmes co-ordinatingantibiotic resistance, antibiotic stewardship, policy and practice.
Education.

Acknowledgements Acknowledgements
ARPAC participating hospitalsARPAC participating hospitals
ARPAC Steering GroupARPAC Steering Group
BenjaminBenjamin PellePelle
European CommissionEuropean Commission
ESCMID (ESGAP)ESCMID (ESGAP)
www.www.abdnabdn.ac..ac.ukuk//arpacarpac

Antibiotic ConsumptionAntibiotic Consumption
andand
Antibiotic resistanceAntibiotic resistance

Antibiotic Use versus MRSA PrevalenceOverviewOverview
All antibiotics (J01)All antibiotics (J01)J01 less glycopeptidesJ01 less glycopeptidesCephalosporinsCephalosporins33rdrd GCGC
FluoroquinolonesFluoroquinolonesMacrolidesMacrolidesAminoglycosidesAminoglycosides
MRSAMRSA
Correlations
Scatterplots (antibiotic use versus Alert organism prevalence)
Correlation coefficients
Regression Modelling
Linear regression modelling
Adjustment for case mix and geographical variation

Total antibiotic user = 0.262p = 0.003
Relationship between MRSA prevalence and antibiotic use Spearman Rank Correlation Coefficients
Antibiotic use (DDDs / 100 occupied bed days
% M
RS
A A
ll pa
tien t
s
Total antibiotic use less glycopeptides
r = 0.258p = 0.003
3rd generation cephalosporinsr = 0.387p < 0.001
01020304050607080
0 20 40 60 80 100 120 140
01020304050607080
0 20 40 60 80 100 120 140
01020304050607080
0 2 4 6 8 10 12 14 16

ARPAC European hospitals (n=263)ARPAC European hospitals (n=263)
140140 ARPAC hospitals submitted useable ARPAC hospitals submitted useable antibiotic consumption dataantibiotic consumption data
Project ICARE Project ICARE n=45n=45(Intensive Care Antimicrobial Resistance Epidemiology)(Intensive Care Antimicrobial Resistance Epidemiology)
CDC / NNIS system CDC / NNIS system n=68n=68(National(National NosocomialNosocomial Infections Surveillance)Infections Surveillance)
SCOPE SCOPE n=37n=37(Surveillance and Control of Pathogens of (Surveillance and Control of Pathogens of Epidemiological Importance)Epidemiological Importance)

Exploration of variation in Antibiotic UseExploration of variation in Antibiotic Use
Geographical regionExpenditure on health as % of GDPEU status
Hospital sizeTeaching status
ICU sizeICU beds as proportion of total
Number of paediatric bedsPaediatric beds as proportion of total
Number of long stay bedsLong stay beds as proportion of totalC
ase
mix
indi
cato
rs
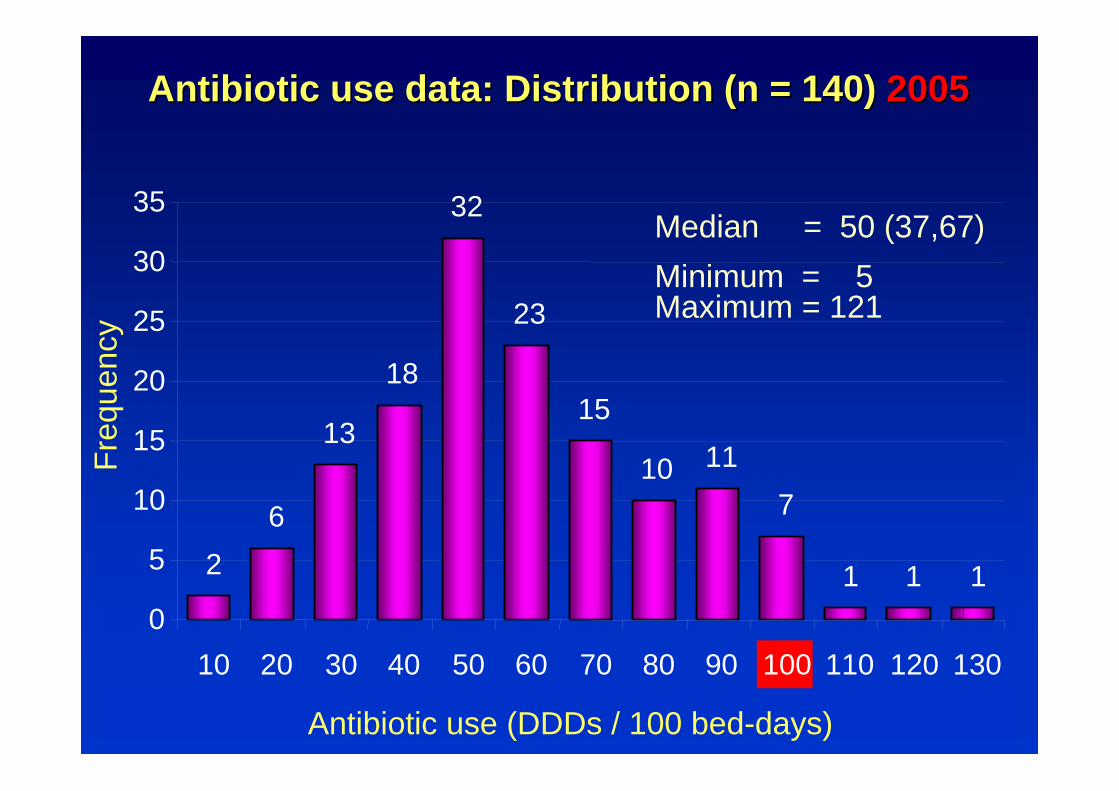
Antibiotic use data: Distribution (n = 140) Antibiotic use data: Distribution (n = 140) 20052005Fr
eque
ncy
Antibiotic use (DDDs / 100 bed-days)
Median = 50 (37,67) Minimum = 5 Maximum = 121
26
13
18
32
23
15
10 117
1 1 10
5
10
15
20
25
30
35
10 20 30 40 50 60 70 80 90 100 110 120 130

Usage of antibiotics ranked 1Usage of antibiotics ranked 1--10, 10, expressed as % of total usageexpressed as % of total usage
(n = 140)(n = 140)
%MedianMedian 20%20% 32%32% 41%41% 49%49% 55%55% 75%75%
0102030405060708090
100
Top 1 Top 2 Top 3 Top 4 Top 5 Top 10

Top - 5 antibiotics used
Gentamicin P
Amox + BLI O
Ciprofloxacin O
Amox + BLI P
Ampicillin P
1
2
3
4
5
Central / Eastern Europe, Central / Eastern Europe, n = 34n = 34
Gentamicin P
Ciprofloxacin O
Amox + BLI O
Ampicillin P
Sulfa + Trim O
1
2
3
4
5
South East Europe, South East Europe, n = 8n = 8

Top - 5 antibiotics used
Penicillin V O
Cefuroxime P
Penicillin G P
Ciprofloxacin O
Amoxicillin O
1
2
3
4
5
Northern Europe, Northern Europe, n = 19n = 19
Amox + BLI O
Amox + BLI P
Ciprofloxacin O
Ceftriaxone P
Cefuroxime O
1
2
3
4
5
Southern Europe, Southern Europe, n = 26n = 26

North West SouthSouth-EastCentral/ East
Kruskal Wallis Test, p = 0.001
MedianMedian 52524444 484836364646
European differences in numbers of European differences in numbers of antibiotics prescribed (formulary)antibiotics prescribed (formulary)
0
10
20
30
40
50
60
70
80
90
C-East S_East North West South