patterns in payout policy and payout channel choice of...
TRANSCRIPT
Patterns in Payout Policy and Payout Channel Choice
of UK Firms in the 1990s
Grzegorz Trojanowski* Luc Renneboog
University of Exeter Tilburg University and ECGI
This version: April 2005
ABSTRACT
The paper examines the payout policy of UK firms listed on the London Stock Exchange during the 1990s. We
complement the existing payout literature studies by analyzing jointly the trends in dividends and share
repurchases. Unlike in the US, we find that, in the UK, firms do not demonstrate a decreasing propensity to
distribute funds to shareholders. The role of share repurchases is increasing, but dividends still constitute a vast
proportion of the total payout. Firms repurchasing shares usually pay dividends as well. We also document that
there is a strong relationship between the presence of blockholders and the choice of the payout channel: firms
with concentrated ownership tend to opt for dividends rather than share repurchases, irrespectively of the identity
of the controlling shareholder. We argue that the differential taxation of dividends and capital gains as well as the
insider trading regulation affect the relative attractiveness of dividends and share repurchases to large shareholders.
JEL classification: G35, G32, G30.
Keywords: Payout policy, dividends, share repurchases, taxes, power indices, Banzhaf index, ownership structure,
corporate governance
* Corresponding author: Xfi Centre for Finance and Investment, University of Exeter, Xfi Buliding, Rennes Drive,
Exeter EX4 4ST, UK. Tel.: +44 1392 263441, Fax: + 44 1392 262525, E-mail: [email protected]. We
would like to thank the anonymous referee, Alan Gregory, Mark Freeman, Uli Hege, Rezaul Kabir, Anna
Nadolska, Steven Ongena, Frederic Palomino, Dorota Piaskowska, Frans de Roon, Ian Tonks, Jon Tucker, and the
participants of the seminars at Tilburg University, University of Exeter, and Warwick Business School for valuable
comments on earlier drafts. All the remaining errors are ours.
Payout patterns of the UK firms in the 1990s
1
Patterns in Payout Policy and Payout Channel Choice
of UK Firms in the 1990s
ABSTRACT
The paper examines the payout policy of UK firms listed on the London Stock Exchange during the 1990s. We
complement the existing payout literature studies by analyzing jointly the trends in dividends and share
repurchases. Unlike in the US, we find that, in the UK, firms do not demonstrate a decreasing propensity to
distribute funds to shareholders. The role of share repurchases is increasing, but dividends still constitute a vast
proportion of the total payout. Firms repurchasing shares usually pay dividends as well. We also document that
there is a strong relationship between the presence of blockholders and the choice of the payout channel: firms
with concentrated ownership tend to opt for dividends rather than share repurchases, irrespectively of the identity
of the controlling shareholder. We argue that the differential taxation of dividends and capital gains as well as the
insider trading regulation affect the relative attractiveness of dividends and share repurchases to large shareholders.
JEL classification: G35, G32, G30.
Keywords: Payout policy, dividends, share repurchases, taxes, power indices, Banzhaf index, ownership structure,
corporate governance
Payout patterns of the UK firms in the 1990s
2
1. Introduction
Fama and French (2001) argue that over the last quarter of a century, US firms have become
considerably less prone to distribute (excess) funds to shareholders. This decreasing propensity to pay
goes hand in hand with the increasing role of repurchase plans as US firms tend to substitute dividends
with share buybacks (Grullon and Michaely, 2002). As both the US and the UK belong to the same
market-based corporate governance system (with a large number of listed companies, an active market
of corporate control, diffuse ownership, a common law system and strong shareholder protection; La
Porta et al., 2000), we investigate whether the phenomena of ‘decreasing propensity to pay’ and
‘dividend substitution’ are confined to the US.1 Hence, we analyze the payout evolution for a large panel
of UK companies and focus on two key aspects of their payout policies. First, we examine the firms’
decision to distribute funds. This propensity to pay is studied by analyzing time-series and cross-
sectional patterns of payout. Second, we investigate the choice of the payout channel (i.e. dividends,
repurchases, or both). Consequently, we also verify whether UK firms substitute dividends with share
repurchases (as their US peers do).
This paper complements the existing literature by providing an extensive description of payout
policies followed by UK firms in the 1990s. Although some empirical studies of the UK firms’ payout
behavior exist, they usually focus on one particular payout mechanism in isolation.2 To our best
knowledge, we are the first to address the earnings distribution channel choice. This paper contributes to
the literature on the methodological side as well. We advocate the use of Banzhaf indices as a relevant
measure of voting power in the analysis of corporate policy choices. Our paper is also the first to employ
those voting control measures in the context of corporate payout policies.
1 Needless to say, we acknowledge the existence of many institutional differences between the two countries, in
particular, as far as the taxation of payout is concerned (Bell and Jenkinson, 2002; Rau and Vermaelen, 2002;
Lasfer and Zenonos, 2003; Bank, 2004).
2 Bond et al. (1996), Lasfer (1996), Bell and Jenkinson (2002), Short et al. (2002), Farinha (2003), Lasfer and
Zenonos (2003), Correia da Silva et al. (2004) analyze dividend policy only, while Rau and Vermaelen (2002) and
Oswald and Young (2004) focus exclusively on factors determining repurchase decisions.
Payout patterns of the UK firms in the 1990s
3
An overwhelming majority of UK firms pays dividends. Contrary to the recent evidence for the
US (Fama and French, 2001), UK firms do not demonstrate a decreasing propensity to distribute funds
to shareholders over the 1990s. We acknowledge that this discrepancy could be partly attributed to the
differences in tax systems between the two countries. However, the existence of tax clienteles cannot
fully explain the difference in patterns. We also show that companies paying out funds to shareholders
are usually larger, more profitable, less levered, and are growing more slowly. Additionally, they have
fewer investment opportunities than their counterparts who do not distribute (excess) funds.
Whereas the role of share repurchases is gradually increasing, dividends still constitute a vast
proportion of the total payout. Moreover, the repurchasing firms usually pay dividends as well. Our
results document a very strong relationship between the presence of block holders and the choice of the
payout channel: firms with concentrated ownership tend to opt for dividends rather than share
repurchases. This effect holds irrespectively of the identity of the controlling shareholder (financial
institutions, directors, other individuals, industrial firms). We argue that the presence of stringent insider
trading regulation may affect the attractiveness of repurchases (as opposed to dividends) for large
shareholders.
The remainder of the paper is organized as follows. Section 2 surveys the background literature.
The subsequent part describes the institutional background. Section 4 develops the research questions,
while data and methodology are discussed in Section 5. Section 6 details the results of the analysis of the
payout policy in the UK. Section 7 summarizes additional analyses and robustness checks, while
Section 8 concludes.
2. Review of literature
2.1. Background literature: The determinants of payout
Miller and Modigliani (1961) were the first to challenge the popular belief that a higher
dividend payout translates into higher firm value. Under the restrictive conditions of perfect capital
markets, any mix of retained earnings and payout will not affect firm value (Allen and Michaely, 2003).
In the light of this theory, it may seem surprising that firms do actually care about their payout policy
(the dividend puzzle; Black, 1976). The existing literature advances several explanations for this puzzle.
Payout patterns of the UK firms in the 1990s
4
Various theories stipulate that factors such as taxes, information asymmetries, and contract
incompleteness determine a firm’s payout decision.
First, various types of investors are taxed differently and, consequently, can constitute tax
clienteles. In equilibrium, firms supply stocks that minimize taxes for each of those clienteles (Miller
and Modigliani, 1961). The empirical support for such a static tax clientele model is mixed.
Surprisingly, high tax-bracket individuals in the US hold a large percentage of dividend-paying stocks in
their portfolios (Allen and Michaely, 2003). Moreover, Richardson et al. (1986) and Michaely et al.
(1995) argue that the changes in payout policies do not necessarily lead to adjustments of ownership
concentration and structures. They find that a firm that initiates or omits a dividend experiences only a
minor increase in the trading volume, which cannot be attributed to a clientele shift. Brav and Heaton
(1998) and Dhaliwal et al. (1999) challenge this conclusion by documenting that significant changes in
institutional and corporate ownership arise after dividend initiations and omissions. Finally, Perez-
Gonzalez (2002) documents that tax reforms in the US are followed by the changes of firms’ payout
policy that are consistent with tax-induced preferences of the largest shareholders. Thus, it seems that
firms do adjust their payout policy as a result of changes in the tax law while shareholders do not seem
to rebalance their portfolios significantly by changing the proportions invested in paying and in non-
paying firms.
Miller and Scholes (1978) pioneer the second generation of clientele models explaining payout
policy and argue that investors can trade dynamically to reduce the tax burden associated with
dividends. Kalay (1982) and Stiglitz (1983) suggest some additional dynamic tax-avoidance strategies
and, consequently, claim that the possibility of dividend ‘laundering’ leads firms to the situation
analyzed by Miller and Modigliani (1961), in which dividend policy is irrelevant. The empirical tests of
dynamic clientele models usually follow Kalay’s (1982) approach and focus on trading around ex-
dividend days. The support for the dynamic clientele theories appears stronger than for the static ones
(Allen and Michaely, 2003). The abnormal trading activity around the around ex-dividend day is
documented for countries such as the US (Lakonishok and Vermaelen, 1986; Michaely and Vila, 1995),
Payout patterns of the UK firms in the 1990s
5
Italy (Michaely and Murgia, 1995), Japan (Kato and Lowenstein, 1995), Sweden (Green and Rydqvist,
1999), and Germany (McDonald, 2001).3
Second, information asymmetries and contract incompleteness inspires another stream of the
payout literature. Insiders possessing superior information about the company’s prospects may want to
employ the payout policy to convey this information to shareholders (Miller and Modigliani, 1961).
Bhattacharya (1979), Miller and Rock (1985), John and Williams (1985) develop models that formalize
the signaling theory of payout. While in the former two models, dividends and share repurchases are
perfect substitutes (i.e. a given amount of payout conveys the same information to shareholders,
irrespectively of the payout channel choice), the model by John and Williams (1985) predicts that only
dividends can convey information on a firm’s prospects to shareholders. The reason is that a signal – to
be credible – needs to be costly; the signaling cost stems from the taxes paid on dividends (which are
higher than those paid on capital gains). Zeckhauser and Pound (1990) develop a model where payout
policy and ownership concentration constitute alternative signaling devices.
Consistently with the signaling theories, changes in dividend policy (in particular, extreme
changes, such as dividends omissions or (re)initiations) are accompanied by stock price announcement
effects: negative for omissions and positive for (re)initiations.4 Likewise, the announcements effects for
share repurchase initiations are positive (Ikenberry et al., 1995). Despite this indirect support for
signaling explanations of payout, Benartzi et al. (1997) argue that dividend changes are related to past
rather than future earnings.5 Nissim and Ziv (2001) show, however, that dividend changes are positively
related to earnings changes over a two-year period subsequent to the dividend change.
3 Usually, this trading volume is positively related to the size of the dividend and negatively related to the level of
transaction costs and risk.
4 See e.g. Aharony and Swary, 1980; Asquith and Mullins, 1983; Healy and Palepu, 1988; Michaely et al., 1995;
Grullon et al., 2002.
5 Moreover, Grullon and Michaely (2004) document that the announcements of open-market share repurchase are
not followed by an increase in operating performance.
Payout patterns of the UK firms in the 1990s
6
Third, agency models stipulate that payout policy can mitigate potential agency conflicts
between managers and shareholders (Rozeff, 1982).6 Regular distributions of funds to shareholders force
firms with value-enhancing investment projects to raise capital externally (Easterbrook, 1984).
Consequently, firms are regularly forced to undergo the scrutiny of the market (the providers of external
funds). The commitment to pay out excessive funds to shareholders reduces the amount of free cash
flows that managers could otherwise spend on value-reducing projects (Jensen, 1986). However, the
credibility of such a commitment may be questioned, as it is relatively easy for management to renege
on payout promises. Some agency models are criticized as they assume that managers can be forced to
pay out funds, while they cannot be prevented from pursuing a suboptimal investment policy (Allen and
Michaely, 2003).7 Fluck (1999) addresses this issue and develops a model, in which the dividend
payments depend on the shareholders’ effectiveness in disciplining the management. Allen et al. (2000)
also highlight the role of monitoring by large shareholders. Their model stipulates that the firms pay
high dividends in order to attract lower-taxed investors (i.e. financial institutions) who have superior
skills in detecting firm quality. Empirically, Lang and Litzenberger (1989) document that the firms that
are likely to be overinvesting (i.e. the firms with Tobin’s Q lower than one) experience larger
appreciation/depreciation on the announcement of substantial dividend increases/decreases (as compared
with other companies).8 Likewise, Grullon and Michaely (2004) document that the market reaction to
share repurchase announcements is more positive for firms that are more likely to overinvest. Both these
studies support the agency explanation of payout. Lie (2000) illustrates that firms announcing increases
of regular dividends, special dividends, or self-tender offers generally have excess funds (compared to
their industry peers). Moreover, the reaction to the announcement is positively correlated to the firm’s
excess cash and negatively related to the firm’s investment opportunities, which is again consistent with 6 High payout may alleviate agency problems emerging between managers and shareholders, but could induce
agency problems between debt and equity holders (Jensen and Meckling, 1976; Myers, 1977). By enforcing
excessive payout, shareholders may expropriate debt holders.
7 Another point of criticism is that those models are not able to distinguish between share repurchases and
dividends.
8 However, Yoon and Starks (1995) challenge this result. Controlling for dividend yield and firm size, they find
that the reactions to dividend changes do not differ between high-Q and low-Q firms.
Payout patterns of the UK firms in the 1990s
7
the free cash flow theory. Finally, La Porta et al. (2000) argue that only an effective legal system
provides shareholders with the opportunity to reduce agency costs by forcing management to pay out
excess funds. They document that dividend payout is indeed higher in countries with stronger
investment protection.
2.2. Background literature: The choice of payout channel
The theoretical literature attempts to answer not only the question whether or not firms should
pay out funds and – if answered affirmatively – how much should be reimbursed, but also which channel
(dividends, repurchases, or both) should be used to distribute earnings to shareholders. The theories
relying on differential taxation of dividends and repurchases (e.g. John and Williams, 1985; Bernheim,
1991; Allen et al., 2000) imply that those two modes of payout are distinctly different and, consequently,
they cannot be considered perfect substitutes.
Many signaling models acknowledge the differences between dividends and share repurchases,
and, consequently, model the choice of the optimal payout channel (Ambarish et al., 1987; Ofer and
Thakor, 1987; Williams, 1988; Bernheim, 1991). For instance, in Ofer and Thakor (1987), firms use
both dividends and repurchases to signal their quality as neither dominates the other in all
circumstances. While both dividends and repurchases force firms to incur some signaling cost (i.e. the
depletion of internal capital), share repurchases constitute a stronger signal because they involve an
additional cost for managers. This cost stems from the increase in risk of their portfolios, as managers
usually do not tender their shares during repurchase programs.
Barclay and Smith (1988) and Brennan and Thakor (1990) use adverse selection arguments to
explain firms’ reliance on dividends rather than on share repurchases. When a company repurchases
shares, the insiders (legally defined in the US as managers, directors and large block holders) can exploit
their informational advantage and expropriate uninformed shareholders.9 Consequently, shareholders
with low stakes prefer dividends, while those with large stakes opt for repurchases. Moreover, the
optimal choice of the payout channel is a function of the amount that is to be distributed: small payouts
9 Brennan and Thakor (1990) assume a fixed cost of collecting information. Consequently, large shareholders have
a greater incentive to become informed than small investors.
Payout patterns of the UK firms in the 1990s
8
should be made through dividends, intermediate payouts through open-market repurchases, and large
payouts through self-tender offers (Brennan and Thakor, 1990).10 Chowdhry and Nanda (1994) consider
the model where there is a tax disadvantage to dividends and an adverse selection cost to repurchases.
The model demonstrates that the optimal payout policy involves distributing some funds in the form of
dividends and retaining the rest until future periods. However, if the management believes that the firm
is sufficiently undervalued, all the accumulated cash should be disbursed through a stock repurchase.
The existence of institutional constraints (such as the so-called ‘prudent man’ regulations) leads
to situations where portfolios of particular investors (e.g. pension funds) are tilted towards a particular
group of securities, for instance dividend-paying stocks, equity index constituencies, A-rated stocks, etc.
(Del Guercio, 1996). Brav and Heaton (1998) illustrate that after the introduction of the prudent man
laws in 1974, US institutional investors tend to sell the stock following a dividend omission. Some UK
financial institutions demand that the companies they invest in maintain the dividends even in the wake
of shrinking profits (Correia da Silva et al., 2004).
Shefrin and Statman (1984) propose a behavioral explanation of (individual) investors’
preference for dividend-paying stocks. Their model is based on the psychological theory of self-control
(rather than on neoclassical assumptions of value-maximizing behavior of the agents) and stipulates that
by receiving money in form of dividends (rather than capital gains), people avoid having to make
decisions about how much to consume. This benefit could be large enough to offset disadvantages of
dividends such as e.g. unfavorable taxation. Graham and Kumar (2004) document that the preference for
dividends is strongest among older and less wealthy individuals. The survey by Brav et al. (2003)
illustrates the managers’ belief that the policy of paying out funds attracts both institutional and
individual investors in the US. Baker and Wurgler (2004a, 2004b) argue that if investors’ demand for
stocks is affected by sentiment, the possibility of a nontrivial dividend premium exists, and thus
dividend policy can be a relevant for the firm value. The authors claim that companies cater to the
10 In the adverse selection model proposed by Lucas and McDonald (1998), small payouts are made via dividends,
while large payouts are divided between dividends and repurchases. The percentage of shares repurchased
increases with the size of the payout.
Payout patterns of the UK firms in the 1990s
9
preferences of investors and pay dividends in periods when the valuation of dividend-paying firms
exceeds that of non-paying ones.
The existing literature also advances some additional explanations for the presence of share
repurchases. Managers may have incentives to switch from dividends to share repurchases if their stock
option plans are not ‘dividend protected’ (Lambert et al., 1989).11 Jagannathan et al. (2000) claim that
dividends are paid by companies with higher ‘permanent’ operating cash flows, while repurchases are
used by firms with higher ‘temporary’, non-operating cash flows. Since repurchases offer more financial
flexibility, they are used by firms with more volatile cash flows.
3. Regulation, taxes, and payout in the UK
3.1. Dividends and taxes
Some aspects of the tax code affect the choice of the payout channel (dividends vs. repurchases)
and, consequently, may account at least partly for the discrepancies in the observed patterns of payout
between UK and US firms (Bank, 2004). In the context of the payout policy, the most important
difference between these countries pertains to the tax treatment of various sources of income. The US
has a classical company tax system whereby companies are taxed separately from their shareholders
(Short et al., 2002). In that system, dividends are essentially taxed twice: a first time on the level of the
corporation (via corporate tax on a firm’s profits) and a second time on the level of the shareholder (via
income tax on shareholders’ dividend income). Consequently, both basic and high rate income tax
payers would prefer profits to be retained by the firm rather than to be paid out in dividends. Tax-
exempt individuals are expected to be indifferent between dividends and retained earnings.
In contrast, the UK has used a partial imputation system since 1973.12 In that system, part of the
firm’s payment of corporation tax is taken into account when calculating shareholder’s liability to
income tax on company dividends. Hence, the tax treatment of dividends is more favorable than in a
11 In the UK this argument may not be very relevant, since the repurchased shares have to be cancelled and (unlike
in the US) they cannot be held as treasury stock and reissued to executives later (Rau and Vermaelen, 2002).
12 A clear overview of the different tax systems in the UK since 1949 is given in Bank, Cheffins and Goergen
(2004).
Payout patterns of the UK firms in the 1990s
10
classical tax system (Bond et al., 1996; Bank, 2004). Consequently, tax-exempt shareholders prefer
dividends to retained earnings; corporations and basic rate taxpayers are neutral with respect to
dividends and retentions, whilst only the highest tax-bracket investors prefer retentions to dividends
(Bell and Jenkinson, 2002; Short et al., 2002).13
Under the UK’s imputation tax system, the company pays a shareholder a cash dividend net of
the imputed amount. When the dividend is paid out, the company also pays the Advance Corporation
Tax (ACT) to the Inland Revenue Service. The amount of ACT paid is equal to the gross dividend times
the imputation rate.14 It represents an advance payment against the firm’s total corporation tax for a
given year. The shareholder receiving the net cash dividend also receives a tax credit (equivalent to the
basic rate of income tax on dividends), which can be used to offset his or her income tax liability (Short
et al., 2002). A particular feature of the UK imputation system was that until July 1997, tax-exempt
investors (mainly pension funds, but also charities) could claim a full cash refund of tax credits from the
tax authorities.15 This created a strong preference for earnings to be paid as dividends rather than to be
retained in the company (Bond et al., 1996). The 1997 tax reform, while preserving the general
imputation principle, withdrew the ability of tax-exempt investors to reclaim dividend tax credits.
Consequently, the valuation of the dividend income for tax-exempt investors was sharply reduced (by
20%), leaving them indifferent between dividends and retained earnings (Bell and Jenkinson, 2002).
13 Bell and Jenkinson (2002) argue that the effective capital gain tax rates are much lower than the statutory ones
(because of deferral, general allowances, and inflation indexation). This implies that most categories of investors
were actually indifferent between different sources of income (dividends vs. capital gains) both before and after the
1997 tax reform.
14 Prior to March 1993, the imputation rate was equal to the basic rate of income tax. From March 1993, the rate of
imputation has been 20% (Short et al., 2002).
15 However, the tax code limited the possibilities of tax-exempt investors’ engagement in dividend capture
strategies (such as those prescribed by dynamic clientele models of payout). Tax-exempt investors could claim the
full amount of the tax credit associated with dividends only if they held the shares for at least 30 days before
dividend was paid.
Payout patterns of the UK firms in the 1990s
11
3.2. Tax treatment of share repurchases
In the UK, the imputation principle does not only have consequences for dividends, but it also
affects some repurchase plans. The distinction between an off-market repurchase (such as a repurchase
tender offer or a private repurchase) and an open-market repurchase has a substantial bearing on the tax
treatment of buyback programs (Rau and Vermaelen, 2002; Oswald and Young, 2004). In the first case,
a shareholder selling shares is aware that he is selling to the corporation, while in the second case he is
not. In an open-market repurchase, no tax credit can be claimed and the profit made on the share sale is
taxed as capital gains. Consequently, the relative attractiveness of dividends (as opposed to open-market
repurchases) depends on the investor’s capital gains tax liability. It can be shown that all the investors
but the highest tax-bracket individuals would prefer dividends to open-market repurchases.
The tax treatment of off-market share repurchases is particularly attractive for individual
investors. In case of this type of repurchases, the imputation rule applies and shareholders receive a tax
credit on the ‘distribution element’ of share buybacks. The distribution element is defined as the
difference between the market value of the repurchased shares and the book value of the corresponding
paid-in-capital. Moreover, the difference between the original subscription price and the investor cost
base (i.e. the price at which he purchased the share plus an inflation allowance) is considered a capital
loss (Rau and Vermaelen, 2002).16 Such a loss is subject to the ordinary income tax and can only be
offset against capital gains. As a result, in the analyzed period, individuals would prefer off-market share
buybacks to dividend payment as long as they are not liable for capital gains taxes. This preference is
the strongest for the low tax-bracket individual shareholders.
The tax treatment of repurchases in the UK changed several times in the 1990s, affecting the
relative attractiveness of off-market share repurchases for tax-exempt shareholders (Oswald and Young,
2002). While until July 1, 1997, tax-exempt investors preferred dividend payments to any form of share
16 In a typical case, the paid-in-capital (i.e. the original subscription price) is lower than the investors cost base.
Consequently, the difference between the original subscription price and the investor cost base is likely to be
negative.
Payout patterns of the UK firms in the 1990s
12
repurchases,17 the elimination of the right to reclaim dividend tax credits after this date has made those
investors indifferent between dividends and share repurchases, as it is the case in the US (Rau and
Vermaelen, 2002).
3.3. Other legal aspects of share repurchases
Regulatory aspects other than taxation can also influence the choice of the payout channel. In
order to prevent companies from manipulating their stock prices, the Listing Rules of the London Stock
Exchange stipulate that larger buybacks (i.e. those where 15% or more of the equity capital is to be
repurchased within 12 months) must be made via a tender offer to all shareholders. Such a tender offer
should have a fixed or a maximum price and should be publicly announced. Smaller repurchases can be
made through the stock market, provided that the price is not more than 5% above the average market
price of the shares for the 10 business days preceding the repurchase (Goergen and Renneboog, 2001).18
Some other restrictions apply to repurchases, which further constrains the choice of payout
channel. Only the ‘distributable profits’ or proceeds of a fresh issue of shares (made for the purpose of
17 Until October 7, 1996, tax-exempt investors who sold the shares in an off-market repurchase could recover tax
credits from the Inland Revenue. However, after the Reuters large-scale repurchase of 1993, such credits were no
longer guaranteed and became subject to tax anti-avoidance rules. As a response, in September 1994, investment
bankers invented an agency buyback, in which investors were selling their shares to a broker acting as an agent for
the company. Agency buybacks resemble off-market repurchases, since the agents usually contacted key investors
(e.g. pension funds) in advance and gave them priority over other shareholders groups. The off-market nature of
the agency buyback provided the tax-exempt investors with the opportunity to claim a tax credit on distribution.
Since all the investors appeared able to participate in an agency buyback, it was easier to convince the Inland
Revenue that the anti-avoidance rules should not apply. This explains the relative attractiveness of the agency
buybacks (as opposed to off-market tender repurchases). However, the agency buyback tax loophole was abolished
on October 8, 1996. Additionally, following this change in the tax code, tax-exempt investors could no longer
recover tax credits associated with the distribution element of the off-market repurchase. Consequently, on- and
off- market repurchases became equally unattractive (as compared with dividends) for those investors.
18 Still, despite those restrictions and less favorable tax treatment of on-market repurchases (as opposed to off-
market buybacks), most of the repurchases effectuated in 1990s were made via the on-market channel (Rau and
Vermaelen, 2002).
Payout patterns of the UK firms in the 1990s
13
the repurchase) can be used to finance a buyback. Moreover, companies are not allowed to repurchase
shares during periods when officers and directors are not allowed to trade in their company’s shares.19
This restriction substantially reduces the role that repurchases may have in signalling firm prospects
(Rau and Vermaelen, 2002).
4. Research questions
Fama and French (2001) conclude that in the late 1990s in the US, there were fewer dividend-
paying firms than in the 1970s. They acknowledge that although changing characteristics of the
population of listed firms explain part of the decline in the number of dividend-paying firms, this
explanation cannot account for the overall magnitude of the effect. Moreover, the increasing popularity
of share repurchases is unlikely to compensate the decline in dividend payout, as buybacks are more
prevalent among dividend-paying firms. Baker and Wurgler (2004a) argue that the decrease in the firms’
propensity to pay can be explained by the catering theory of dividends (Baker and Wurgler, 2004b). For
several reasons (e.g. clientele effects, transaction costs, sentiment) investors prefer dividend-paying
stocks in some periods, and are ready to pay a premium for these stocks.20 De Angelo et al. (2004) point
out that the firms that cease to pay dividends are usually those which used to pay very small dividends
anyway, while the real payout from the top payers increases considerably. The latter effect is shown to
be sufficiently strong to offset the former one: the aggregate real dividends paid by US industrial firms
increased between 1978 and 2000.
It is worthwhile to examine whether the phenomenon of the decreasing propensity to pay is
confined solely to the US corporate setting. While both the US and the UK belong to the same market-
19 As a result, repurchases are not allowed in the 2-month period preceding the publication of annual earnings or
semiannual earnings and in the month before the publication of quarterly results. Moreover, the company cannot
purchase shares when the directors are in possession of unpublished, price-sensitive information (Fidrmuc et al.,
2004).
20 Baker and Wurgler (2004a) show that, as of 1978, the dividend premium (as measured by the difference in the
average market-to-book ratios between dividend-paying and non-paying firms) is negative in all years but one.
Thus, in order to cater to this shareholders’ preference for non-paying stocks, firms tend to abandon dividend
payments.
Payout patterns of the UK firms in the 1990s
14
based corporate governance system (with a large number of listed companies, an active market of
corporate control, diffuse ownership, a common law system and strong shareholder protection; La Porta
et al., 2000), many institutional differences exist between these two countries (see Section 3). It may
affect investors’ preferences and, consequently, account for some cross-country discrepancies in
companies’ payout behavior.
As share repurchases may substitute for dividends (Grullon and Michaely, 2002), we attempt to
disentangle the effects of the changing propensity to pay dividends and the changing propensity to pay
out funds at all (either via dividends or share repurchases).
Question 1a (Changing propensity to pay dividends): Does the proportion of dividend-paying firms
decrease over time?
Question 1b (Changing propensity to distribute funds): Does the proportion of firms reimbursing funds
(either via dividends or via repurchases) decrease over time?
Bearing in mind that the trends in the number of paying firms and the changes in the amounts
paid out may diverge (as pointed out by De Angelo et al. 2004), we also examine how the amounts
distributed to the shareholders change over time.
Question 2a (Changing amount of dividends): How does the amount of dividends paid change over
time?
Question 2b (Changing amount of total payout): How does the total amount distributed to
shareholders change over time?
We also investigate the choice of the payout channel (dividends, repurchases, or a combination).
Grullon and Michaely (2002) document a gradual tendency of US firms to substitute dividends with
share repurchase plans. Recently, the popularity of share repurchases in the US has increased
considerably (Fama and French, 2001). In the late 1990s, the amount spent by American companies on
repurchasing their shares had risen to nearly half of the total payout (Dittmar and Dittmar, 2002). We
explore whether UK firms also tend to switch from dividend payout to share repurchases.
Payout patterns of the UK firms in the 1990s
15
Question 3a (Substitution – frequencies): Is the ratio of repurchasing to dividend-paying firms
increasing?
Question 3b (Substitution – amounts paid): Do share repurchases constitute a growing proportion of
the total payout?
Theoretically, one of the main determinants of the payout channel choice is ownership structure.
A first reason why ownership may be important is that some features of the UK tax code may influence
investors’ preferences for dividends over share repurchases (and capital gains) and vice versa (for a
detailed discussion of the tax issues related to payout policy, see Section 3). In this paper, we focus on
static tax clienteles, as a model with dynamic tax clienteles is unlikely to be relevant in the UK
context.21 Bell and Jenkinson (2002) argue that the class of the tax-exempt investors (mainly pension
funds) is the largest category of shareholders in the UK, which basically precludes them from pursuing
dividend capture strategies. Moreover, the tax code limits the possibilities to engage in such activities
(see Section 3.1).
Second, clientele effects may also result from factors other than tax regulations. Asset-liability
management considerations and the existence of ‘prudent man’ rules may lead to situations where
institutional investors strongly prefer a particular form of payout (Del Guercio, 1996). For instance,
Michael McLintock, the CEO of M&G (which is part of Prudential, one of the most important
institutional investors in the UK) wrote a letter to the major UK companies in 2002 arguing that ‘the
investment case for dividends in the majority of circumstances is a strong and well supported one, has
stood the test of time, and is likely to be increasingly appreciated in the economic and stock market
conditions which we seem likely to face for the foreseeable future’ (Correia da Silva et al., 2004).
Additionally, various behavioral arguments can also be invoked to explain individual investors’
preferences for dividend-paying stocks (Shefrin and Statman, 1984; Graham and Kumar, 2004). For
instance, such shares allow investors to adopt a simple heuristic “consume from dividend and keep
principal intact” – the rule that is consistent with regret avoidance.
21 Lasfer and Zenonos (2003) support this claim and provide indirect evidence of little short-term trading activity
around the ex-dividend day in the UK.
Payout patterns of the UK firms in the 1990s
16
If the type of shareholder matters, we expect that financial institutions prefer dividends for
reasons of asset and liability management of their portfolios. Of the institutions, we expect that pension
funds exhibit an even stronger preference for dividends for tax reasons (see Section 3). Directors prefer
share repurchases for tax reasons.22 Still, if wealth diversification is important to them, they may prefer
dividends as share repurchases may trigger an unwanted negative signal to the market as a result of the
disclosure regulation of directors’ dealings.23 Moreover, directors may be reluctant to liquidate (part of)
their equity stake during a repurchase because such liquidation would involve giving up some voting
rights (corresponding to the shares tendered). It may weaken directors’ voting power vis-à-vis other
shareholders of the company.
We expect outside block holders like industrial companies, individuals, and families to prefer
share repurchases for tax reasons. Contrarily, if block holders wish to avoid the negative market signal
of selling through a share repurchase plan, they may prefer dividends over share buybacks.24
Question 4a (Shareholder identity effect): Does the identity of the largest shareholders affect the firm’s
choice of the payout channel?
22 Directors are assumed to be in the highest bracket of income tax.
23 In order to actively participate in an open-market share repurchase program, managers would have to liquidate
part of their equity stake. In the UK, such a transaction, like all the directors’ dealings (irrespective of their size), is
subject to a mandatory disclosure (Goergen and Renneboog, 2001). The equity sale by managers may be
interpreted by the market as an adverse signal about the firm’s prospects (Gregory et al., 1997; Fidrmuc et al.,
2004), and could negatively affect the value of the remaining managerial holdings. Obviously, a pro-rata dividend
does not suffer from such a disadvantage.
24 If dispersed shareholders believe that a large block holder has superior information about the firm’s value, they
may consider an equity sale by such a block holder as bad news about the firm’s value (Brennan and Thakor,
1990). If such a sale is large enough, it has be disclosed: in the UK, a shareholder who is not a director and whose
stake exceeds 3% of the equity outstanding has to disclose increases or decreases of his stake, if the change
exceeds 1%. Moreover, when the investor’s stake drops below the 3% threshold, he must notify the company.
Subsequent decreases do not require a notification (Goergen and Renneboog, 2001).

Payout patterns of the UK firms in the 1990s
17
If block holders have a major impact on the firm’s payout policy, the question arises whether it
is the largest block holder or a coalition of block holders (with similar preferences) who influence the
choice of the payout channel.25
Question 4b (Shareholder power effect): Does the voting power of the leading shareholders affect the
firm’s choice of the payout channel?
Finally, Fama and French (2001) document systematic differences between the samples of
paying and non-paying companies with respect to characteristics such as firm size, growth, investment
opportunities, leverage and profitability. As those variables are likely to influence both the firms’
propensity to pay and the choice of the payout channel, we incorporate them in our models.
5. Data and methodology
5.1. Sample selection
Our sample covers British firms listed on the London Stock Exchange. We exclude banks,
insurance companies, and other financial firms (SIC codes 6000-6900) because their financial reporting
standards are different from those of the rest of the sample. We also exclude utilities (SIC codes 4900-
4949), because their payout policies and the access to external financing are regulated. Finally, we only
retain those firms that are present in the Worldscope Disclosure dataset for at least three years in the
period 1992-1998. As a result, we are left with the sample of 985 firms that covers more than two thirds
of the UK listed non-financial firms and represents a broad range of industries.26 We use the Worldscope
database to gather ownership and control data as well as accounting data.
[ Insert Table 1 about here ]
25 Moreover, some adverse selection models (e.g. Brennan and Thakor, 1990) stipulate that ownership
concentration per se affects the optimal choice of the payout channel.
26 The sample includes 206 agricultural, mining, forestry, fishing and construction firms (SIC codes 1-1999), 407
manufacturing firms (SIC codes 2000-3999), 204 retail and wholesale firms (SIC codes 5000-5999) and 168
service firms (SIC codes 7000-8999).
Payout patterns of the UK firms in the 1990s
18
Table 1 summarizes the key characteristics of the sample firms. As shown in Panel A, the
average (median) market value of the sample firm equals £ 503m (£ 73m),27 while the average (median)
book value of the firm’s total assets amounts to £ 301m (£ 44m). The return on assets (ROA) in the
average (median) firm equals 8.15% (9.92%). As illustrated by Panels B and C, ROA improves slightly
towards the end of the sample. The average (median) value of the Tobin’s Q proxy equals 1.872 (1.451),
while the average (median) rate of asset growth amounts to 14.47% (3.72%). Finally, average leverage
in book-value terms equals 59.1%, amounts to 39.8% in market-value terms and remains relatively
stable over the sample period.
We classify shareholders controlling the equity blocks into 6 mutually exclusive categories: (i)
executive directors and their families, (ii) non-executive directors and their families, (iii) individuals and
families not related to directors, (iv) the government,28 (v) financial institutions (i.e. banks, insurance
companies, unit trusts, investment and pension funds), and (vi) other industrial and commercial
companies. To distinguish between the more than 5000 insider and outsider individual shareholders, we
consult the London Stock Exchange Monitor and the Who’s Who-guides. To identify institutional
shareholders, we consult Datastream and Institutional Investors Annual Guides.
Table 2 reports that domestic financial institutions own over a half of the equity issued by UK
firms. In particular, tax-exempt domestic pension funds are the largest category of shareholders in the
UK throughout the 1990s. Moreover, in addition to the direct contributions to pension funds, more than
half of the premium income of insurance companies represents contributions to pension schemes (Bell
and Jenkinson, 2002). Finally, albeit a minor class of shareholders in terms of ownership concentration,
charities also enjoy tax exemption. Consequently, tax-driven preferences of investors can be expected to
have a non-trivial impact on the choice of payout policy in the UK.
[ Insert Tables 2 and 3 about here ]
27 All the values are expressed in constant 1992 prices. Inflation-adjustment is based on Datastream CPI data.
28 State ownership is negligible in the analyzed sample. Across all the sample firm-years, we encountered only 22
observations (in 14 firms) where the government was a block holder. The largest stake held by the State was 13.1%
of equity only. Given the marginal nature of governmental ownership, we do not report this category of
shareholders in subsequent sections.
Payout patterns of the UK firms in the 1990s
19
As only the large shareholders are expected to be able to influence the payout decision29, we
focus on block holdings of 5% or more to examine the relationship between ownership structure and
payout variables. Table 3 illustrates that the concentration and structure of block holdings is relatively
stable over time. The data on block holdings closely follow the patterns illustrated for all the share
holdings (see Table 2). Financial institutions are by far the most important category of block holders. In
a median company, institutional block holders control about one sixth of the equity outstanding.
Different groups of individuals (directors and outside individuals) own a substantial proportion of share
blocks, while the size of block holdings controlled by industrial firms is considerably smaller.
5.2. Measurement of voting power
The analysis of the relationship between payout policies and ownership structures necessitates
the construction of variables measuring voting power for different types of shareholders. We follow the
Crespi and Renneboog (2003) approach and analyze a two-stage voting game. We assume that in the
first stage, all the shareholders of a particular type (e.g. all financial institutions) form a coalition. Only
in the second stage, such coalitions participate in a voting game with the intention to influence (or even
to determine) the payout policy. The two-stage approach advocated here is relevant in the context of
payout decisions due to the existence of different clienteles. For instance, financial institutions may
prefer a particular pattern of payouts (e.g. regular dividends every year due to tax asset-liability
management considerations), while other groups of owners may care less about it. The same argument
can be invoked to motivate the two-stage approach in explaining the firms’ choice between the two
distribution channels: dividends and share repurchases. Some groups of investors may strongly prefer
one method of payout to the other because of the tax considerations, insider trading regulations, etc.30
The measurement of voting power is a topic of an ongoing methodological debate in game
theory and corporate finance (Felsenthal and Machover, 1998; Leech, 2002). Examples of measures
used in the literature include Banzhaf indices (Banzhaf, 1965; Dubey and Shapley, 1979) and different
29 An additional reason is that the Worldscope archives of ownership only include stakes of 5% and more. 30 In the extensions of our models (in Section 7), we consider also one-stage voting games, i.e. games where type-
based coalitions are not formed and where each shareholder is assumed to be a separate player in the voting game.
Payout patterns of the UK firms in the 1990s
20
versions of Shapley values (Shapley and Shubik, 1954; Milnor and Shapley, 1978). Despite the recent
popularity of Shapley values in empirical corporate finance research (e.g. Eckbo and Verma, 1994;
Crespi and Renneboog, 2003), Leech (2002) argues that the underlying notion of power (i.e. P-power, or
power as the prize in a voting game) appears inappropriate in the analysis of shareholder voting
behavior. Instead, he argues that shareholder voting games can be better described by policy-seeking
motives (rather than office-seeking motive implicit in Shapley values) and I-power31 measures are more
relevant in such a context. This is particularly important in an analysis of payout choices, which, by their
very nature, have the character of a policy decision.
The most frequently used measures of voting power for such games are Banzhaf (1965) values.
Following Felsenthal and Machover (1998), we compute two types of measures – absolute and relative
Banzhaf indices.32 The analyzed game can be considered as oceanic33 and, therefore, we employ the
generalization of the Banzhaf value proposed by Dubey and Shapley (1979). Under some regularity
conditions, Banzhaf indices in an oceanic game can be obtained as the Banzhaf indices for a modified,
finite game consisting only of the major players with an appropriate adjustment of the required majority
threshold.
5.3. Probit and tobit regression techniques
We conduct a three-stage multivariate analysis of the relationship between payout patterns,
ownership structures, and other firm characteristics. First, we explain the likelihood that a firm pays out
some funds to shareholders (irrespectively of the payout channel chosen). In order to do so, we estimate
random-effect panel probit regressions, where the dependent variable for an observation equals 1 if a
31 According to this notion, power is defined as the ability to influence the decision (i.e. the outcome of the vote),
but it is not interpreted as the prize in a voting game (Felsenthal and Machover, 1998).
32 Relative indices are obtained by normalizing the absolute ones. As a result of this normalization, relative
Banzhaf indices for a game sum up to 1.
33 In game theory, oceanic games involve a few relatively large players and a continuum of infinitesimal players
(Milnor and Shapley, 1978). As documented above, most of the UK companies have a few block holders, while the
remaining shareholdings are widely dispersed. Hence, we consider an oceanic representation to approximate the
actual distribution of votes reasonably well.
Payout patterns of the UK firms in the 1990s
21
firm paid a dividend and/or repurchased its shares in a particular year and 0 otherwise.34 As regressors,
we employ various firm characteristics (firm size, profitability, investment opportunities, leverage) as
well as the ownership variables defined above. We also control for industry-specific and year-specific
effects.
In the second stage, we model the likelihood that a firm opts for a particular earnings
distribution channel. We employ random-effect panel data probit models with the same set of regressors
as in the first stage. The advantage of this approach is that we are able to examine separately the
determinants of dividend and repurchase decisions in the full sample. However, such an analysis
provides only indirect evidence on the factors affecting the choice between these two payout
mechanisms, since it does not take into account the potential relationship between dividend and
repurchase decisions. Our third type of models explicitly addresses this issue. We estimate double-
censored random-effect tobit models, where the ratio of dividends to the total amount paid (i.e. the sum
of dividends and share repurchases) plays the role of the dependent variable.
Many payout theories predict that a particular payout policy may attract a specific shareholder
clientele. Therefore, the ownership variables in our models explaining payout decisions could be
endogenous. In order to eliminate a potential simultaneity bias, we employ lagged ownership variables.
6. Results
6.1. The propensity to pay in the UK
In this section, we exhibit the general patterns and trends in dividend payments and share
repurchases pursued by UK firms. The overwhelming majority of UK firms (85%) does pay dividends
over the 1990s (see Table 4). Moreover, the proportion of dividend payers in the UK does not decrease
34 An alternative estimation method is the fixed-effect logit model. However, this method restricts the parameters
to be defined through the within-group dimension of the data. The estimates depend only on the values of the
explanatory variables within the subsample of firms that were changing their payout policies during the sample
period (i.e. firms which had years with positive as well as zero payout). This criterion effectively excludes a large
fraction of the original sample (more than three quarters) from the estimation procedure. For instance, 71.00% of
the firms distribute funds in any observed year, while 6.97% neither pays dividends nor repurchases shares over
the whole sample period.
Payout patterns of the UK firms in the 1990s
22
over 1992-1998 (if anything, a modestly increasing trend can be observed). In any of the sample years,
approximately five out of every six firms pay cash dividends. This result contrasts with the existing US
evidence for the same period: only less than 24% of the American firms paid dividends (Fama and
French, 2001).
Relatively few UK firms carry out an active buyback policy, which is consistent with the tax
explanation of the payout channel choice, because the largest class of shareholders (i.e. tax-exempt
investors) prefer dividends to any form of repurchases (Rau and Vermaelen, 2002). Companies appear to
cater to these shareholders and to distribute funds using the dividend channel. On average, slightly less
than 6% of the analyzed firms repurchase shares. Again, this number can be contrasted with the
corresponding US figure for the same period: Grullon and Michaely (2002) report that the proportion of
repurchasing US firms increases from about 70% to over 90% over the 1990s. Table 4 illustrates that the
number of UK repurchasing firms tends to increase towards the end of the sample period. Since the
preference of tax-exempt investors for dividends (as compared with share repurchases) weakens over the
1990s (see Section 3),35 this increase is not surprising. Finally, approximately 85% of firms disburse
funds to shareholders either as dividends or repurchases.36
[ Insert Table 4 about here ]
Table 5 presents the average amounts spent on dividends, share repurchases, and total payout to
shareholders by firms pursuing a particular form of payout. Apparently, not only are repurchase plans
less popular than dividends, they are also smaller as far as the amounts transferred to shareholders are
concerned. The median amount spent yearly by the repurchasing firms on buying back their shares
equals approximately ₤ 0.8 million, which is much lower than the median dividend (₤ 1.4 million)
distributed by dividend-paying firms. This result is at odds with the implications of the adverse selection
35 Tax-driven preferences of other types of shareholders remain unchanged over the sample period.
36 Notably, the proportion of payers remains substantial even if we control for seasoned equity issues (results not
reported in Table 4). For 73% of observations, the value of total payout exceeds the value of new on the equity
issues. The corresponding number rises from 67% in 1993 to 83% in 1998, which again suggests an increasing
(rather than decreasing) propensity to pay.
Payout patterns of the UK firms in the 1990s
23
models that predict that larger distributions should be made via the repurchase channel (Brennan and
Thakor, 1990; Lucas and McDonald, 1998). However, while in the respective subsamples, median
dividend is larger than median value of the repurchased equity in every single sample year, there are no
substantial differences in average sizes of dividends (among dividend-paying firms) and repurchases
(among repurchasing firms).37
[ Insert Tables 5 and 6 about here ]
The first row of Table 6 indicates that in five out of seven years analyzed, dividends constituted
more than 92% of the aggregate payout to shareholders. In the last two years, this quantity was lower,
but even in 1997, the ratio of the aggregate amount of dividends to the aggregate amount spent on share
repurchases still exceeds 3:1. This confirms the relatively minor role of share repurchase plans in the
UK.
The second row of Table 6 illustrates the relative frequency of repurchases (as opposed to
dividends) from a different perspective. In the first half of the 1990s, the number of firms repurchasing
equity remained fairly stable and equaled approximately 5% of the number of the dividend-paying firms.
In the second half of the 1990s, a steady upward trend in the relative popularity of repurchases can be
observed. Still, even in the last sample year, the number of dividend-paying firms is more than eight
times larger than the number of firms that repurchase their shares. Although buybacks become
increasingly popular, the evidence of substitution of dividends by share buybacks in the analyzed period
is still quite weak.
Table 7 investigates the relation between the likelihood of dividend payments and share
repurchases. If these two channels are (possibly imperfect) substitutes (Jagannathan et al., 2000; Grullon
and Michaely, 2002), the probabilities of their usage should be negatively related. Consequently, the
proportion of repurchasing firms among dividend-payers should be lower than among firms that do not
37 For instance, in 1997 the average repurchase was approximately three times larger than the average dividend.
Relatively few larger-scale buy-back plans seem to account for most of the funds distributed to shareholders by
means of repurchasing the equity. The two largest buybacks in the sample (made by EMI Group and Gallaher
Group), both exceeding £ 400 million, were observed in 1997.
Payout patterns of the UK firms in the 1990s
24
pay dividends. Our results indicate the opposite. In every single year, repurchasing firms are more
prevalent among dividend-paying firms (the differences are statistically insignificant in most years,
however). In the pooled sample, 6.35% of dividend-paying companies and 3.10% of non-paying firms
repurchase shares (the difference is significant at 1% level).38
[ Insert Table 7 about here ]
6.2. The dynamics of payout
Table 8 examines the dynamics of dividends. Panel A indicates that the median dividend-paying
firm increases the amount of dividends by almost 11% a year. Panel B shows that in every single year
between 1993 and 1998, more than a half of the sample companies increase their dividends. During the
average sample year 4% of the population of companies initiate or resume the dividends.39 Only every
seventh company cuts dividends (every sixth if omissions are classified in the same category).40
Relatively few firms kept aggregate dividends at a constant positive level. Almost one out of every eight
firms continues not to pay dividends over two consecutive years.
Notably, large cuts (i.e. larger than 25% of last-year dividend) constitute from 36% (in 1995) to
65% (in 1993) of all the dividend cuts, while large increases amount to 27-45% of dividend increases
(depending on the year).41
[ Insert Tables 8 and 9 about here ]
38 Fama and French (2001) report a similar finding for the US: the proportion of repurchasing firms among
dividend-payers is higher than among firms that do not pay dividends.
39 This translates into a considerable number of migrations from the group of non-payers. Recall that in every
sample year dividend-payers constitute more than 81% of the population.
40 The corresponding numbers are slightly higher for the year 1993, when more than a quarter of sample companies
cut or omitted dividend payments.
41 Still, large dividend increases are more frequent than, for instance, in Germany. While in our UK sample over
37.2% of dividend increases can be considered large ones, the corresponding number for Germany is just 25.0%
(Goergen et al., 2004). The proportion of substantial cuts is comparable across the two countries: the
corresponding numbers equal 50.1% for a pooled UK sample and 47.5% for Germany.
Payout patterns of the UK firms in the 1990s
25
Table 9 shows similar results for the total earnings payout. The median company increases its
payout by 11% a year. In an average sample year, approximately two thirds of the analyzed companies
increase their payout, while only one sixth of the firms cuts or omits its distribution of earnings. The
asymmetry between large increases and large cuts in total payment appears even more remarkable than
of the dividend distribution: three quarters of the payout cuts versus only one third of the payout
increases can be considered substantial payout changes (of 25% or more). Companies are also reluctant
to cut the dividends (Kalay, 1980), and, if they have to do so, they seem to pursue considerable cuts at
once rather than to decrease payments over longer period.
6.3. Payout ratios
Table 10 exhibits the patterns in payout ratios for listed UK firms in the 1990s; Table 11 is
similar but shows the payout ratios conditional on whether a firm respectively, pays dividends,
repurchases shares or does both. The payout ratios based on repurchases are more volatile than those for
dividend payments (or the total payout). Panel A of Table 10 shows that the average dividend yield
equals 3.13% (3.69% for the subsample of dividend-paying firms, as shown in Table 11). When share
repurchases are also taken into account, the average paying firm distributes to shareholders slightly more
than 4% of its market value. On average, the total payout amounts to 2.30% of sales revenues in the
population of firms (2.72% for payers; as shown in Table 11). These ratios as well as dividend yields
remain considerably more stable than payout ratios computed with respect to earnings. Panels B of
Tables 10 and 11 show that total payout as a fraction of earnings oscillates around 20-25% (around 40%
if only firms with positive earnings are considered).
[ Insert Tables 10 and 11 about here ]
Panel A of Table 11 shows that in every single year share repurchases constitute a larger
fraction of market capitalization of repurchasing firms than the dividends for dividend-paying firms. The
same holds for payout ratios based on sales for 5 out of 7 sample years.42 42 Thus, in relative terms, repurchases appear to be more important for repurchasing firms than dividends for
dividend-paying firms. Still, the median amount paid via the repurchase channel is smaller than the median size of
a dividend (see Table 5).
Payout patterns of the UK firms in the 1990s
26
6.4. Firm characteristics, ownership structure, and the choice of the payout policy
So far, we have documented that the vast majority of the companies reimburse funds to
shareholders either via dividends or by repurchasing shares. Below, we investigate (i) which firms are
more likely to pay dividends and/or reimburse the funds and (ii) what determines the choice of payout
channel.
[ Insert Table 12 about here ]
Table 12 presents the models explaining the likelihood that a firm opts to pay out funds. Models
1-4 indicate that shareholders are more likely to receive a payout from larger firms (cf. Grullon et al.,
2002). In line with our expectations, we find that high leverage decreases the likelihood of payout. There
are several explanations of this significant relation. First, in highly levered firms, debt holders may
perform a monitoring task such that there is not much need for a disciplining role of the payout policy
(in the spirit of Easterbrook, 1984). Second, the payout constraints embedded in the debt covenants may
become binding. Expectedly, there is a strong positive relationship between the firm’s return on assets
and the likelihood of payout, as the generation of a sufficient stream of earnings is a necessary condition
to reimburse funds to shareholders. Finally, consistent with Fama and French (2001), we find that strong
investment opportunities discourage firms from distributing funds to shareholders. Still, this effect falls
short of statistical significance in any of the models reported in Table 12.
Ownership concentration appears to be an important determinant of the payout decision as well.
Models 2-4 indicate that the likelihood that a firm distributes funds (either via dividends or share
repurchases) increases with the voting power of executive directors. This result appears inconsistent
with the agency theory of payout (Easterbrook, 1984; Jensen, 1986), predicting that in a firm where
managers enjoy high degree of discretion, they may pursue wasteful ‘empire-building’ activities rather
than distribute funds to the shareholders. Our findings suggest that, given that the directors’ equity
stakes constitute a large fraction of their personal wealth, they seem to prefer a positive payout allowing
them to diversify their personal portfolio or helping them to meet personal liquidity needs. Other classes
of block holders seem to have a preference for a non-zero payout as well. For instance, Models 3 and 4
Payout patterns of the UK firms in the 1990s
27
suggest that the control power of financial institutions translates into a higher probability of earnings
payout. This preference may stem from tax or asset-liability management considerations (see Section 4).
[ Insert Tables 13 and 14 about here ]
Tables 13 and 14 explain firms’ decisions regarding dividend distribution and share repurchase,
respectively. The results document a strong relationship between firm characteristics and the probability
that a particular firm pays a dividend (see Models 5-8 in Table 13). Companies that are larger, more
profitable, and less levered are significantly more likely to pay dividends. A firm with lesser investment
opportunities is more likely to be a dividend-payer as well. These results are in line with those reported
in Table 12 for the likelihood of the total payout. As reported in Table 14, profitability positively affects
the likelihood of share repurchases. Model 9 suggests also that larger firms are more likely to buy shares
back (but this effect falls short of statistical significance in Models 10-12). Leverage and investment
opportunities do not appear to be significant determinants of the repurchase decision in Models 9-12.
Table 13 illustrates that powerful managers prefer a positive dividend payout, which is
consistent with the results reported earlier for the total payout variable. Interestingly, however, Models 7
and 8 indicate that a similar preference for dividends seems to be shared by other types of block holders
(financial institutions, industrial firms, non-executive directors, and outside individuals) as well. This
finding should be contrasted with block holders’ dislike of share repurchase programs: a significantly
negative relationship between the power of a particular block holder category and the likelihood of share
repurchases holds almost uniformly for any of the five classes of shareholders considered. There are two
possible explanations for this effect. First, due to the partial imputation feature of the UK tax system in
the analyzed period, most shareholders are (weakly) better off if the payments are made in the form of
dividends rather than by means of share repurchases. Second, the preference of dividends over share
buybacks can also be attributed to the existence of stringent insider trading rules (see Section 4). This
argument seems the most plausible for company directors, but is also likely to hold for large block
holders, who may be subject to detailed transaction disclosure requirements and whose actions are likely
to be followed by the financial press, analysts, and investors (Fidrmuc et al., 2004). Therefore, directors
(or other block holders) may prefer obtaining a dividend payment to having to liquidate a part of their
Payout patterns of the UK firms in the 1990s
28
stake in a company (which would be the case, if they were to obtain the funds via a share repurchase
plan). A partial liquidation of the stake by a director (or a leading shareholder) may negatively affect the
price of the stock, and, consequently, reduce the value of the remaining equity holdings of such a
shareholder.
[ Insert Table 15 about here ]
Table 15 analyzes the choice of the mode of payment from a different point of view. Instead of
investigating the determinants of the likelihood of dividend payments and share repurchases separately,
the tobit regressions here explicitly model the relative preference with respect to those two distribution
channels. Model 13 shows that big firms tend to distribute a relatively larger fraction of the total payout
via the repurchase channel than small firms. The corresponding coefficients are not significant in the
remaining specifications reported in Table 15. There seems to be also some weak evidence of the
preference of more profitable firms for the repurchases channel (see Models 13-14).
7. Additional analyses and robustness checks
7.1. One-stage voting game
As mentioned above, some payout theories state that different types of block holders may prefer
different payout policies. Still, our findings do not support these claims. Therefore, we also examine
whether it is a coalition of block holders (with similar preferences) or merely the largest block holder
who influence the choice of the payout channel. We consider a one-stage oceanic voting game in which
each shareholder is treated as a separate player, and compute the corresponding Banzhaf indices to
measure the block holders’ voting power. We employ those measures and re-estimate the probit and
tobit models discussed in the previous section.43 This approach stipulates that instead of forming type-
based coalitions ex ante and allowing these ex ante coalitions to participate in the voting game only
afterwards, block holders may attempt to achieve their payout policy goals on their own.
43 In all the models reported in Tables 16-19, we employ the measures of voting power for the two largest block
holders as regressors. We also estimate the models including the relative voting power of the third largest
shareholder, but the corresponding coefficient proves insignificant in most specifications.
Payout patterns of the UK firms in the 1990s
29
Tables 16-19 summarize the findings for one-stage voting games. The results reported in Table
16 show a pattern similar to those obtained earlier for block holder coalitions. The presence of powerful
block holders translates into higher likelihood of corporate payout (see Models 18 and 19).44 Other
determinants of the likelihood of a payout have the same signs as those in models from Table 12 and
remain highly statistically significant: firms that are larger, more profitable, and less levered tend to be
more likely to distribute funds to shareholders via dividends or share repurchases.
[ Insert Tables 16-19 about here ]
Tables 17 and 18 report the estimates of models explaining the likelihood of dividend payments
and share repurchases, respectively. Likewise, the results are in line with those obtained earlier for block
holder coalitions. Ceteris paribus, concentrated ownership increases the likelihood of dividend
payments and decreases the probability of share repurchases. Table 19 provides further evidence on
block holders’ preference for dividends (vs. share buyback programs). These results strengthen the
validity of the insider trading explanation for the observed pattern (see Section 6.4). Moreover, they are
inconsistent with the implications of the Brennan and Thakor (1990) model, which predicts that
repurchases are more likely in firms with concentrated ownership.
All in all, two major conclusions stem from the analysis of one-stage voting games. First, the
relative voting power of large shareholders matters for firms’ payout choices. Second, it is not just the
most powerful shareholder who tries to impose a specific payout policy. In a typical company, it is a
coalition of at least two leading shareholders that influences the choice of the payout channel.
7.2. Robustness checks
We also performed a number of additional analyses to assure the robustness of our results.45
First, we tested for the impact of the 1997 change of the tax code, which has affected the way dividends
are taxed and, consequently, may have altered investors’ preferences for dividends vis-à-vis share
44 The corresponding coefficients in Model 17 have the same positive signs, but they are not statistically
significant.
45 The results of the models discussed in this section are not reported. All the estimates are available upon request.
Payout patterns of the UK firms in the 1990s
30
repurchases. In order to investigate the effect of this structural change, we allowed the coefficients
corresponding to the ownership variables to differ in the periods before and after the change (i.e. until
1996 and as of 1997, respectively). The results are in line with predictions of tax-based clientele
theories: following the change in taxation, financial institutions’ preference for dividends (as opposed to
share repurchases) has become less pronounced (although this effect is not statistically significant at the
usual confidence levels). Other conclusions of the models reported in Section 6.4 remain unchallenged.
Second, we control for the possibility that new equity issues may affect the choice of firm’s
payout policy in a particular year (e.g. firms that have just raised new equity capital can hardly be
expected to repurchase their shares immediately after a seasoned equity offering). We extend model
specifications reported in Tables 12-19 and include as a regressor a dummy variable that equals one,
when a firm issued new equity in a particular year, and zero otherwise. This new variable is not
significant in any specification, while all our earlier conclusions are upheld.
Third, some of the signaling theories of payout (see Sections 2.1 and 2.2) stipulate that
dividends and/or share repurchases should be perceived signals of firms’ quality. The aim of such a
signal could be to help companies to raise new equity capital in the period following the payout.
Consequently, it can be expected that firms that pay dividends and/or repurchase shares are more likely
to issue new equity in a subsequent year.46 We verified such a supposition and estimated the models
explaining the likelihood of new equity issues as a function of past payout behavior and a set of control
variables (firm size, profitability, leverage, investment opportunities, industry, and year effects). The
results do not confirm such a signaling theory: payout (in particular, in the form of share repurchases)
decreases rather than increases the likelihood of a new equity issue.
Fourth, it may be the case that the Tobin’s Q proxy employed in the earlier analyses does not
capture the growth potential of the analyzed firms well. Moreover, Baker and Wurgler (2004a, 2004b)
argue that the difference in Tobin’s Q between dividend payers and non-payers can be interpreted as the
premium the investors are willing to pay for firms catering to investors’ preferences. Consequently, the
catering theory of dividends would render the Tobin’s Q proxy endogenous. In order to mitigate both
46 The agency model proposed by Easterbrook (1984) also relates new equity issues and payout: the firms that pay
out funds are forced to raise capital externally.
Payout patterns of the UK firms in the 1990s
31
problems, we re-estimated our probit and tobit models with the rate of asset growth replacing the
Tobin’s Q proxy. The results are virtually identical to those reported in Sections 6.4 and 7.1.
We also attempted to addressed the (potential) endogeneity issue in another way. Rather than
employing the Tobin’s Q proxy from the year, in which the analyzed dividend decision is taken, we
employ a value lagged by one year instead. Again, the results are in line with those reported in Sections
6.4 and 7.1. Notably, our analyses provide some additional evidence against the catering theory of
dividends (Baker and Wurgler, 2004a and 2004b). It is puzzling why so many companies actually do
pay dividends (see Table 4), since the proxy for the stock market dividend premium (i.e. difference in
Tobin’s Q between dividend payers and non-payers) is negative in most of the sample years.
Finally, all the results are robust to different definitions of firm size (log of market capitalization
and log of total assets) and of leverage (expressed in book value and market value).
8. Conclusions
We use a large panel of UK companies over the 1990s to study two key aspects of firms’ payout
policies: the decision whether to distribute funds at all and the choice of the payout channel (i.e.
dividends, repurchases, or both). The analysis of time-series and cross-sectional patterns in payout
behavior reveals several interesting results. In the 1990s, almost 85% of the UK companies pay
dividends and the payout policy remains relatively stable. Contrary to the recent evidence for the US, we
find that UK firms do not exhibit a decreasing propensity to distribute funds to shareholders. We
acknowledge that this discrepancy could be partly attributed to the differences in tax systems between
the two countries. Still, the existence of tax clienteles cannot fully explain all documented patterns.
Moreover, we show that the companies distributing funds to shareholders are usually larger, more
profitable, and less levered. In addition, they grow more slowly, and have fewer investment
opportunities than their counterparts who do not distribute (excess) funds to shareholders.
Whereas the importance of share repurchases is increasing, dividends still constitute a vast
fraction of the total payout. Moreover, repurchasing firms usually pay dividends as well. Therefore, we
find only weak support for the claim that UK firms substitute dividends with share repurchases (as their
US peers do). Our results document also a very strong relationship between the presence of block
holders and the choice of the payout channel: firms with concentrated ownership tend to opt for

Payout patterns of the UK firms in the 1990s
32
dividends rather than share repurchases. This effect is robust to the way in which the voting power of the
block holders is measured and holds irrespectively of the identity of the controlling shareholder
(financial institutions, directors, other individuals, industrial firms). We argue that the presence of
stringent insider trading regulation may affect the attractiveness of share repurchases (as opposed to
dividends) for large shareholders. Developing a theoretical model that would formalize the insider-
trading explanation for the observed relationship between ownership concentration and the choice of the
payout channel seems an attractive area for the future research.
Finally, our paper contributes to the ongoing debate on the method of measuring voting power.
We advocate the use of Banzhaf indices as a relevant measure of voting power in the analysis of
corporate policy choices. According to our best knowledge, it is the first study employing those game-
theoretical concepts in the context of corporate payout decisions.
Payout patterns of the UK firms in the 1990s
33
References
Aharony, J. and I. Swary (1980), ‘Quarterly Dividend and Earnings Announcements and Stockholders’ Returns:
An Empirical Analysis’, Journal of Finance, Vol. 48, pp. 1147-1160.
Allen, F., A. E. Bernardo and I. Welch (2000), ‘Theory of Dividends Based on Tax Clienteles’, Journal of
Finance, Vol. 55, pp. 2499-2536.
Allen, F. and R. Michaely (2003), ‘Payout Policy’, in G. Constantinides, M. Harris and R. Stulz (eds.), Handbook
of Economics of Finance (North-Holland, Amsterdam).
Ambarish, R., John, K. and J. Williams (1987), ‘Efficient Signaling with Dividends and Investments’, Journal of
Finance, Vol. 42, pp. 321-343.
Asquith, P. and D. W. Mullins (1983), ‘The Impact of Initiating Dividend Payments on Shareholders’ Wealth’,
Journal of Business, Vol. 56, pp. 77-96.
Baker, M. and J. Wurgler (2004a), ‘Appearing and Disappearing Dividends: The Link to Catering Incentives’,
Journal of Financial Economics, forthcoming.
Baker, M. and J. Wurgler (2004b), ‘A Catering Theory of Dividends’, Journal of Finance, forthcoming.
Bank, S. A. (2004), ‘The Dividend Divide in Anglo-American Corporate Taxation’, Working paper (UCLA School
of Law), http://ssrn.com/abstract=516143.
Bank, S. A., B. Cheffins and M. Goergen (2004), ‘Dividends and Politics’, Working paper (School of
Management, UMIST).
Banzhaf, J. F. (1965), ‘Weighted Voting Doesn’t Work: A Mathematical Analysis’, Rutgers Law Review, Vol. 19,
pp. 317-343.
Barclay, M. J. and C. W. Smith (1988), ‘Corporate Payout Policy: Cash Dividends versus Open Market
Repurchases’, Journal of Financial Economics, Vol. 22, pp. 61-82.
Bell, L. and T. Jenkinson (2002), ‘New Evidence of the Impact of Dividend Taxation and on the Identity of the
Marginal Investor’, Journal of Finance, Vol. 57, pp. 1321-1346.
Benartzi, S., R. Michaely and R. Thaler (1997), ‘Do Changes in Dividends Signal the Future or the Past?’, Journal
of Finance, Vol. 52, pp. 1007-1043.
Bernheim, B. D. (1991), ‘Tax Policy and the Dividend Puzzle’, RAND Journal of Economics, Vol. 22,
pp. 455-476.
Bhattacharya, S. (1979), ‘Imperfect Information, Dividend Policy, and ‘the Bird in the Hand’ Fallacy’, Bell
Journal of Economics, Vol. 10, pp. 259-270.
Black F. (1976), ‘The Dividend Puzzle’, Journal of Portfolio Management, Vol. 2, pp. 5-8.
Payout patterns of the UK firms in the 1990s
34
Bond, S. R., L. Chennells and M. P. Devereux (1996), ‘Taxes and Company Dividends: A Microeconometric
Investigation Exploiting Cross-Section Variation in Taxes’, Economic Journal, Vol. 106, pp. 320-333.
Brav, A., J. R. Graham, C. R. Harvey and R. Michaely (2003), ‘Payout Policy in the 21st Century’, NBER Working
Paper No. W9657, http://ssrn.com/abstract=398560.
Brav, A. and J. B. Heaton (1998), ‘Did ERISA’s Prudent Man Rule Change the Pricing of Dividend Omitting
Firms?’, Working paper (Duke University), http://ssrn.com/abstract=98568.
Brennan, M. J. and A. V. Thakor (1990), ‘Shareholder Preferences and Dividend Policy’, Journal of Finance,
Vol. 45, pp. 993-1019.
Chowdhry, B. and V. Nanda (1994), ‘Repurchase Premia as a Reason for Dividends: A Dynamic Model of
Corporate Payout Policies’, Review of Financial Studies, Vol. 7, pp. 321-350.
Crespi, R. and L. Renneboog (2003), ‘Corporate Monitoring by Shareholder Coalitions in the UK’, ECGI
Discussion Paper no. 12/2003, ECGI, Brussels, http://ssrn.com/abstract=379124.
Correia da Silva, L., M. Goergen and L. Renneboog (2004), Dividend Policy and Corporate Governance (Oxford:
Oxford University Press).
De Angelo, H., L. De Angelo and D. J. Skinner (2004). ’Are Dividends Disappearing? Dividend Concentration and
the Consolidation of Earnings’, Journal of Financial Economics, Vol. 72, pp. 425-456.
Del Guercio, D. (1996), ‘The Distorting Effect of the Prudent-Man Laws on Institutional Equity Investments’,
Journal of Financial Economics, Vol. 40, pp. 31-62.
Dhaliwal, D., D. M. Erickson and R. Trezevant (1999), ‘A Test of the Theory of Tax Clienteles for Dividend
Policies’, National Tax Journal, Vol. 52, pp. 179-194.
Dittmar, A. K. and R. F. Dittmar (2002), ‘Stock Repurchase Waves: An Explanation of the Trends in Aggregate
Corporate Payout Policy, Working paper (Indiana University), http://ssrn.com/abstract=346548.
Dubey, P. and L. S. Shapley (1979), ‘Mathematical Properties of the Banzhaf Value’, Mathematics of Operational
Research, Vol. 4, pp. 99-131.
Easterbrook, F. H. (1984), ‘Two Agency-Cost Explanations of Dividends’, American Economic Review, Vol. 74,
pp. 650-659.
Eckbo, B. E. and S. Verma (1994), ‘Managerial Share Ownership, Voting Power, and Cash Dividend policy’,
Journal of Corporate Finance, Vol. 1, pp. 33-62.
Fama, E. F. and K. R. French (2001), ‘Disappearing Dividends: Changing Firm Characteristics or Lower
Propensity to Pay?’, Journal of Financial Economics, Vol. 60, pp. 3-43.
Payout patterns of the UK firms in the 1990s
35
Farinha, J. (2003), ‘Dividend Policy, Corporate Governance and the Managerial Entrenchment Hypothesis: An
Empirical Analysis’, Journal of Business Finance and Accounting, Vol. 30, pp. 1173-1209.
Felsenthal, D. S. and M. Machover (1998), The Measurement of Voting Power: Theory and Practice, Problems
and Paradoxes (Cheltenham: Edward Edgar).
Fidrmuc, J., M. Goergen and L. Renneboog (2004), ‘Directors’ Share Dealings and Corporate Control’,
Unpublished working paper (Tilburg University).
Fluck, Z. (1999), ‘The Dynamics of the Manager-Shareholder Conflict’, Review of Financial Studies, Vol. 12,
pp. 379-404.
Goergen, M. and L. Renneboog (2001), ‘Strong Managers and Passive Institutional Investors in the UK’, in
F. Barca and M. Becht (eds.), The Control of Corporate Europe (Oxford: Oxford University Press).
Goergen, M., L. Renneboog and L. Correia da Silva (2004), ‘When do German Firms Change Their Dividends?’,
Journal of Corporate Finance, forthcoming.
Green, R. and K. Rydqvist (1999), ‘Ex-Day Behavior with Dividend Preference and Limitation to Short-Term
Arbitrage: The Case of Swedish Lottery Bonds’, Journal of Financial Economics, Vol. 53, pp. 145-187.
Gregory, A., J. Matatko and I. Tonks (1997), ‘Detecting Information from Directors’ Trades: Signal Detection and
Variable Size Effects’, Journal of Business Finance and Accounting, Vol. 24, pp. 309-342.
Grullon, G. and R. Michaely (2002), ‘Dividends Share Repurchases, and the Substitution Hypothesis’, Journal of
Finance, Vol. 57, pp. 1649-1684.
Grullon, G. and R. Michaely (2004), ‘The Information Content of Share Repurchase Programs’, Journal of
Finance, Vol. 59, pp. 651-680.
Grullon, G., R. Michaely and B. Swaminathan (2002), ‘Are Dividend Changes a Sign of Firm Maturity?’, Journal
of Business, Vol. 75, pp. 387-424.
Healy, P. M. and K. G. Palepu (1988), ‘Earnings Information Conveyed by Dividend Initiations and Omissions’,
Journal of Financial Economics, Vol. 21, pp. 149-176.
Ikenberry, D., J. Lakonishok and T. Vermaelen (1995), ‘Market Underreaction to Open Market Share
Repurchases’, Journal of Financial Economics, Vol. 39, pp. 181-208.
Jagannathan, M., C. P. Stephens and M. S. Weisbach (2000), ‘Financial Flexibility and the Choice between
Dividends and Stock Repurchases’, Journal of Financial Economics, Vol. 57, pp. 355-384.
Jensen, M. C. (1986), ‘Agency Costs of Free Cash Flow, Corporate Finance, and Takeovers’, American Economic
Review, Vol. 76, pp. 323-329.
Payout patterns of the UK firms in the 1990s
36
Jensen, M. C. and W. H. Meckling (1976), ‘Theory of the Firm: Managerial Behavior, Agency Costs, and
Ownership Structure’, Journal of Financial Economics, Vol. 3, pp. 305-360.
John, K. and J. Williams (1985), ‘Dividends, Dilution, and Taxes: A Signaling Equilibrium’, Journal of Finance,
Vol. 40, pp. 1053-1070.
Kalay, A. (1980), ‘Signaling, Information Content, and the Reluctance to Cut Dividends’, Journal of Financial and
Quantitative Analysis, Vol. 15, pp. 855-869.
Kalay, A. (1982), ‘The Ex-Dividend Day Behavior of Stock Prices: A Re-Examination of the Clientele Effect’,
Journal of Finance, Vol. 37, pp. 1059-1070.
Kato, K. and U. Loewenstein (1995), ‘The Ex-Dividend-Day Behavior of Stock Prices: The Case of Japan’,
Review of Financial Studies, Vol. 8, pp. 817-847.
La Porta R., F. Lopez-de-Silanez, A. Shleifer and R. W. Vishny (2000), ‘Agency Problems and Dividend Policies
Around the World’, Journal of Finance, Vol. 55, pp. 1-33.
Lakonishok, J. and T. Vermaelen (1986), ‘Tax Induced Trading Around Ex-Dividend Dates’, Journal of Financial
Economics, Vol. 16, pp. 287-319.
Lambert, R. A., W. N. Lanen and D. F. Larcker (1989), ‘Executive Stock Option Plans and Corporate Dividend
Policy’, Journal of Financial and Quantitative Analysis, Vol. 24, pp. 409-425.
Lang, L. H. P. and R. H. Litzenberger (1989), ‘Dividend Announcements: Cash Flow Signaling vs. Free Cash
Flow Hypothesis’, Journal of Financial Economics, Vol. 24, pp. 181-192.
Lasfer, M. A. (1995), ‘Ex-Day Behavior: Tax or Short-Term Trading Effects’, Journal of Finance, Vol. 50,
pp. 875-897.
Lasfer, M. A. (1996), ‘Taxes and Dividends: The UK Evidence’, Journal of Banking and Finance, Vol. 20,
pp. 455-472.
Lasfer, M. A. and M. Zenonos (2003), ‘The Tax Impact of the Ex-Dividend Dates: Evidence from European
Firms’, Working paper (City University, London), http://ssrn.com/abstract=423880.
Leech, D. (2002), ‘Shareholder Voting Power and Ownership Control of the Companies’, Homo Oeconomicus,
Vol. 19, pp. 345-373.
Lie, E. (2000), ‘Excess Funds and Agency Problems: An Empirical study of Incremental Cash Disbursements’,
Review of Financial Studies, Vol. 13, pp. 219-248.
Lucas, D. J. and R. L. McDonald (1998), ‘Shareholder Heterogeneity, Adverse Selection, and Payout Policy’,
Journal of Financial and Quantitative Analysis, Vol. 33, pp. 233-253.
Payout patterns of the UK firms in the 1990s
37
McDonald, R. L. (2001), ‘Cross-Border Investing with Tax Arbitrage: The Case of German Dividend Tax Credits’,
Review of Financial Studies, Vol. 14, pp. 617-657.
Michaely, R. and M. Murgia (1995), ‘The Effect of Tax Heterogeneity on Prices and Volume Around the
Ex-Dividend Day: Evidence from the Milan Stock Exchange’, Review of Financial Studies, Vol. 8,
pp. 369-399.
Michaely, R., R. H. Thaler and K. Womack (1995), ‘Price Reactions to Dividend Initiations and Omissions:
Overreaction or Drift?’, Journal of Finance, Vol. 50, pp. 573-608.
Michaely, R. and J.-L. Vila (1996), ‘Investors’ Heterogeneity, Prices and Volume Around the Ex-Dividend Day’,
Journal of Financial and Quantitative Analysis, Vol. 30, pp. 171-198.
Miller, M. and F. Modigliani (1961), ‘Dividend Policy, Growth, and the Valuation of Shares’, Journal of Business,
Vol. 34, pp. 411-433.
Miller, M. and M. Scholes (1978), ‘Dividends and Taxes’, Journal of Financial Economics, Vol. 6, pp. 333-364.
Miller, M. and K. Rock (1985), ’Dividend Policy under Asymmetric Information’, Journal of Finance, Vol. 30,
pp. 1031-1051.
Milnor, J. W. and L. S. Shapley (1978), ‘Value of Large Games II: Oceanic Games’, Mathematics of Operations
Research, Vol. 3, pp. 290-307.
Myers, S. C. (1977), ‘Determinants of Corporate Borrowing’, Journal of Financial Economics, Vol. 5,
pp. 147-175.
Nissim, D. and A. Ziv (2001), ‘Dividend Changes and Future Profitability’, Journal of Finance, Vol. 56,
pp. 2111-2133.
Ofer, A. R. and A. V. Thakor (1987), ‘A Theory of Stock Price Responses to Alternative Corporate Cash
Disbursement Methods: Stock Repurchases and Dividends’, Journal of Finance, Vol. 42, pp. 365-394.
Oswald, D. and S. Young (2004), ‘What Role Taxes and Regulation? A Second Look at Open Market Share
Buyback Activity in the UK’, Journal of Business Finance and Accounting, Vol. 31, pp. 257-292.
Perez-Gonzalez, F. (2002), ‘Large Shareholders and Dividends: Evidence from U. S. Tax Reforms’, Working
paper (Columbia University), http://ssrn.com/abstract=337640.
Rau, P. R. and T. Vermaelen (2002). ‘Regulation, Taxes, and Share Repurchases in the United Kingdom’, Journal
of Business, Vol. 75, pp. 245-282.
Richardson, G., S. Sefcik and R. Thompson (1986). ‘A Test of Dividend Irrelevance Using Volume Reactions to a
Change in Dividend Policy’, Journal of Financial Economics, Vol. 17, pp. 313-333.
Payout patterns of the UK firms in the 1990s
38
Rozeff, M. S. (1982), ‘Growth, Beta, and Agency Costs as Determinants of Dividend Payout Ratios’, Journal of
Financial Research, Vol. 5, pp. 249-259.
Shapley, L. S. and M. Shubik (1954), ‘A Method for Evaluating the Distribution of Power in a Committee
System’, American Political Science Review, Vol. 48, 787-792.
Short, H., H. Zhang and K. Keasey (2002), ‘The Link between Dividend Policy and Institutional Ownership’,
Journal of Corporate Finance, Vol. 8, pp. 105-122.
Stiglitz, J. E. (1983), ‘Some Aspects of the Taxation of Capital Gains’, Journal of Public Economics, Vol. 21,
pp. 257-296.
Williams, J. (1988), ‘Efficient Signaling with Dividends, Investment, and Stock Repurchases’, Journal of Finance,
Vol. 43, pp. 737-747.
Yoon, P. S. and L. Starks (1995). ‘Signaling, Investment Opportunities, and Dividend Announcements’, Review of
Financial Studies, Vol. 8, pp. 995-1018.
Zeckhauser, R. J. and J. Pound (1990). ‘Are Large Shareholders Effective Monitors? An Investigation of Share
Ownership and Corporate Performance’, in R. G. Hubbard (ed.), Asymmetric Information, Corporate Finance,
and Investment (Chicago: University of Chicago Press).
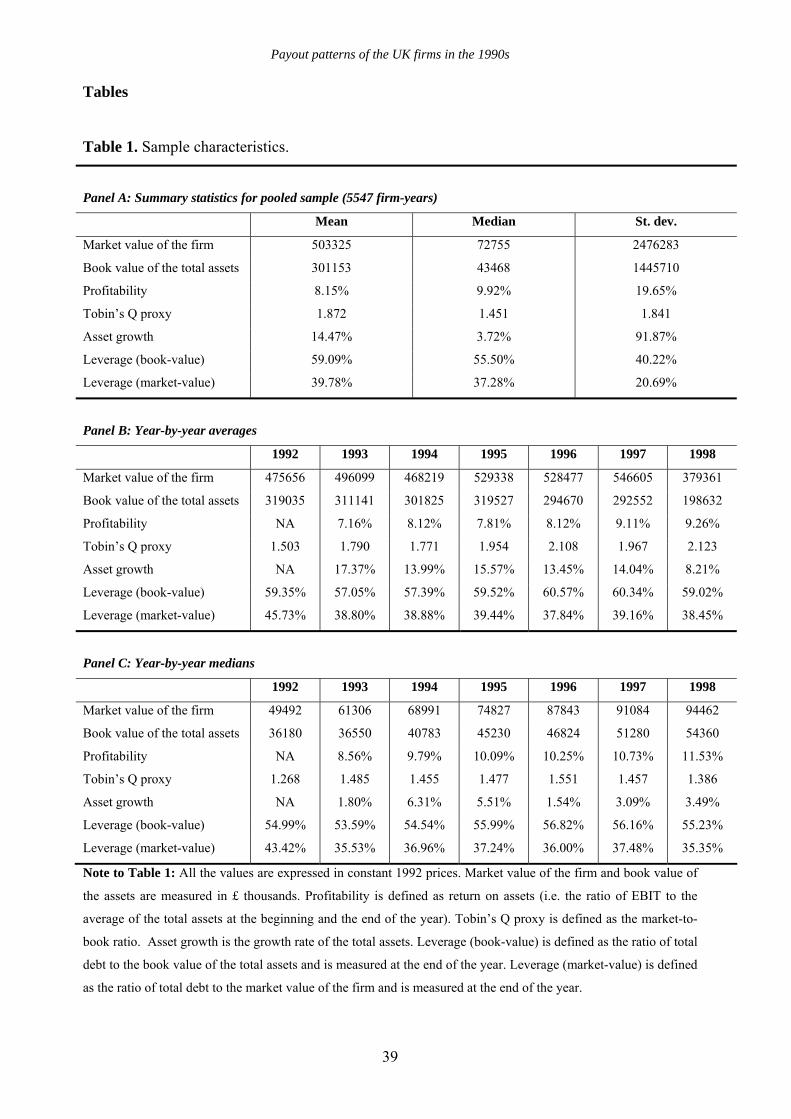
Payout patterns of the UK firms in the 1990s
39
Tables
Table 1. Sample characteristics.
Panel A: Summary statistics for pooled sample (5547 firm-years)
Mean Median St. dev.
Market value of the firm 503325 72755 2476283
Book value of the total assets 301153 43468 1445710
Profitability 8.15% 9.92% 19.65%
Tobin’s Q proxy 1.872 1.451 1.841
Asset growth 14.47% 3.72% 91.87%
Leverage (book-value) 59.09% 55.50% 40.22%
Leverage (market-value) 39.78% 37.28% 20.69%
Panel B: Year-by-year averages
1992 1993 1994 1995 1996 1997 1998
Market value of the firm 475656 496099 468219 529338 528477 546605 379361
Book value of the total assets 319035 311141 301825 319527 294670 292552 198632
Profitability NA 7.16% 8.12% 7.81% 8.12% 9.11% 9.26%
Tobin’s Q proxy 1.503 1.790 1.771 1.954 2.108 1.967 2.123
Asset growth NA 17.37% 13.99% 15.57% 13.45% 14.04% 8.21%
Leverage (book-value) 59.35% 57.05% 57.39% 59.52% 60.57% 60.34% 59.02%
Leverage (market-value) 45.73% 38.80% 38.88% 39.44% 37.84% 39.16% 38.45%
Panel C: Year-by-year medians
1992 1993 1994 1995 1996 1997 1998
Market value of the firm 49492 61306 68991 74827 87843 91084 94462
Book value of the total assets 36180 36550 40783 45230 46824 51280 54360
Profitability NA 8.56% 9.79% 10.09% 10.25% 10.73% 11.53%
Tobin’s Q proxy 1.268 1.485 1.455 1.477 1.551 1.457 1.386
Asset growth NA 1.80% 6.31% 5.51% 1.54% 3.09% 3.49%
Leverage (book-value) 54.99% 53.59% 54.54% 55.99% 56.82% 56.16% 55.23%
Leverage (market-value) 43.42% 35.53% 36.96% 37.24% 36.00% 37.48% 35.35%
Note to Table 1: All the values are expressed in constant 1992 prices. Market value of the firm and book value of
the assets are measured in £ thousands. Profitability is defined as return on assets (i.e. the ratio of EBIT to the
average of the total assets at the beginning and the end of the year). Tobin’s Q proxy is defined as the market-to-
book ratio. Asset growth is the growth rate of the total assets. Leverage (book-value) is defined as the ratio of total
debt to the book value of the total assets and is measured at the end of the year. Leverage (market-value) is defined
as the ratio of total debt to the market value of the firm and is measured at the end of the year.
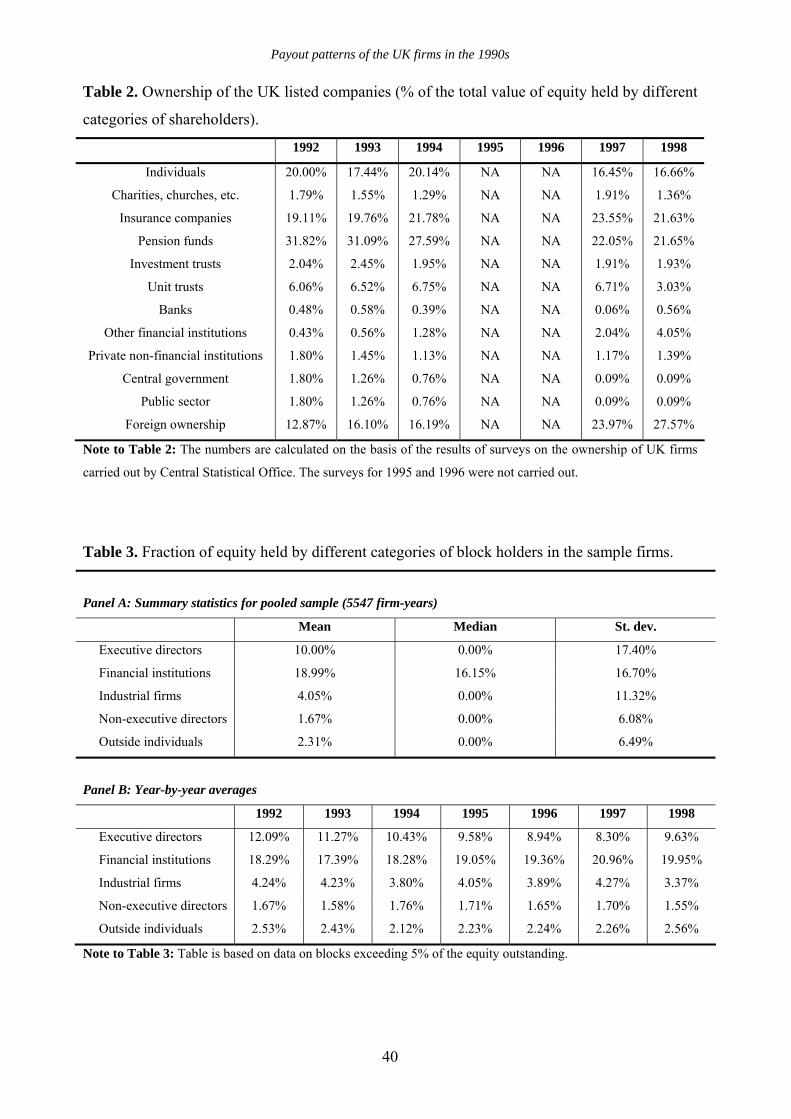
Payout patterns of the UK firms in the 1990s
40
Table 2. Ownership of the UK listed companies (% of the total value of equity held by different
categories of shareholders).
1992 1993 1994 1995 1996 1997 1998
Individuals 20.00% 17.44% 20.14% NA NA 16.45% 16.66%
Charities, churches, etc. 1.79% 1.55% 1.29% NA NA 1.91% 1.36%
Insurance companies 19.11% 19.76% 21.78% NA NA 23.55% 21.63%
Pension funds 31.82% 31.09% 27.59% NA NA 22.05% 21.65%
Investment trusts 2.04% 2.45% 1.95% NA NA 1.91% 1.93%
Unit trusts 6.06% 6.52% 6.75% NA NA 6.71% 3.03%
Banks 0.48% 0.58% 0.39% NA NA 0.06% 0.56%
Other financial institutions 0.43% 0.56% 1.28% NA NA 2.04% 4.05%
Private non-financial institutions 1.80% 1.45% 1.13% NA NA 1.17% 1.39%
Central government 1.80% 1.26% 0.76% NA NA 0.09% 0.09%
Public sector 1.80% 1.26% 0.76% NA NA 0.09% 0.09%
Foreign ownership 12.87% 16.10% 16.19% NA NA 23.97% 27.57%
Note to Table 2: The numbers are calculated on the basis of the results of surveys on the ownership of UK firms
carried out by Central Statistical Office. The surveys for 1995 and 1996 were not carried out.
Table 3. Fraction of equity held by different categories of block holders in the sample firms.
Panel A: Summary statistics for pooled sample (5547 firm-years)
Mean Median St. dev.
Executive directors 10.00% 0.00% 17.40%
Financial institutions 18.99% 16.15% 16.70%
Industrial firms 4.05% 0.00% 11.32%
Non-executive directors 1.67% 0.00% 6.08%
Outside individuals 2.31% 0.00% 6.49%
Panel B: Year-by-year averages
1992 1993 1994 1995 1996 1997 1998
Executive directors 12.09% 11.27% 10.43% 9.58% 8.94% 8.30% 9.63%
Financial institutions 18.29% 17.39% 18.28% 19.05% 19.36% 20.96% 19.95%
Industrial firms 4.24% 4.23% 3.80% 4.05% 3.89% 4.27% 3.37%
Non-executive directors 1.67% 1.58% 1.76% 1.71% 1.65% 1.70% 1.55%
Outside individuals 2.53% 2.43% 2.12% 2.23% 2.24% 2.26% 2.56%
Note to Table 3: Table is based on data on blocks exceeding 5% of the equity outstanding.
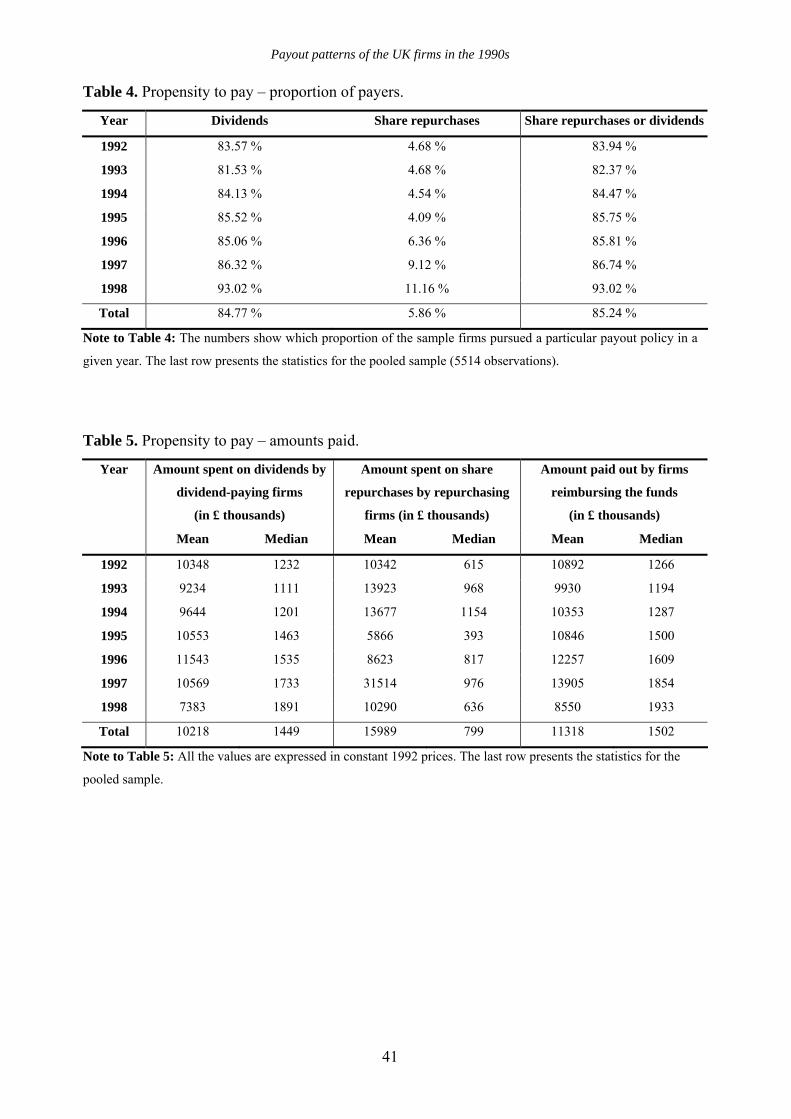
Payout patterns of the UK firms in the 1990s
41
Table 4. Propensity to pay – proportion of payers.
Year Dividends Share repurchases Share repurchases or dividends
1992 83.57 % 4.68 % 83.94 %
1993 81.53 % 4.68 % 82.37 %
1994 84.13 % 4.54 % 84.47 %
1995 85.52 % 4.09 % 85.75 %
1996 85.06 % 6.36 % 85.81 %
1997 86.32 % 9.12 % 86.74 %
1998 93.02 % 11.16 % 93.02 %
Total 84.77 % 5.86 % 85.24 %
Note to Table 4: The numbers show which proportion of the sample firms pursued a particular payout policy in a
given year. The last row presents the statistics for the pooled sample (5514 observations).
Table 5. Propensity to pay – amounts paid.
Year Amount spent on dividends by
dividend-paying firms
(in £ thousands)
Amount spent on share
repurchases by repurchasing
firms (in £ thousands)
Amount paid out by firms
reimbursing the funds
(in £ thousands)
Mean Median Mean Median Mean Median
1992 10348 1232 10342 615 10892 1266
1993 9234 1111 13923 968 9930 1194
1994 9644 1201 13677 1154 10353 1287
1995 10553 1463 5866 393 10846 1500
1996 11543 1535 8623 817 12257 1609
1997 10569 1733 31514 976 13905 1854
1998 7383 1891 10290 636 8550 1933
Total 10218 1449 15989 799 11318 1502
Note to Table 5: All the values are expressed in constant 1992 prices. The last row presents the statistics for the
pooled sample.
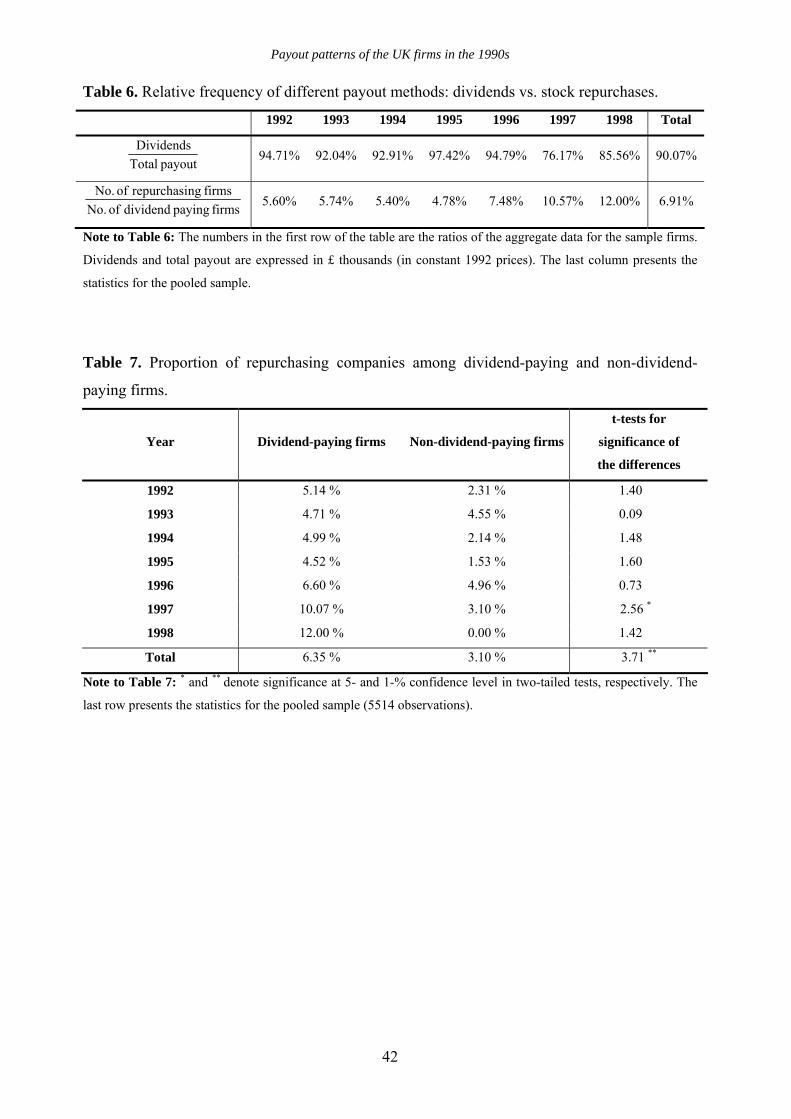
Payout patterns of the UK firms in the 1990s
42
Table 6. Relative frequency of different payout methods: dividends vs. stock repurchases.
1992 1993 1994 1995 1996 1997 1998 Total
payout TotalDividends 94.71% 92.04% 92.91% 97.42% 94.79% 76.17% 85.56% 90.07%
firms paying dividend of No.firms ngrepurchasi of No. 5.60% 5.74% 5.40% 4.78% 7.48% 10.57% 12.00% 6.91%
Note to Table 6: The numbers in the first row of the table are the ratios of the aggregate data for the sample firms.
Dividends and total payout are expressed in £ thousands (in constant 1992 prices). The last column presents the
statistics for the pooled sample.
Table 7. Proportion of repurchasing companies among dividend-paying and non-dividend-
paying firms.
Year Dividend-paying firms Non-dividend-paying firms
t-tests for
significance of
the differences
1992 5.14 % 2.31 % 1.40
1993 4.71 % 4.55 % 0.09
1994 4.99 % 2.14 % 1.48
1995 4.52 % 1.53 % 1.60
1996 6.60 % 4.96 % 0.73
1997 10.07 % 3.10 % 2.56 *
1998 12.00 % 0.00 % 1.42
Total 6.35 % 3.10 % 3.71 **
Note to Table 7: * and ** denote significance at 5- and 1-% confidence level in two-tailed tests, respectively. The
last row presents the statistics for the pooled sample (5514 observations).
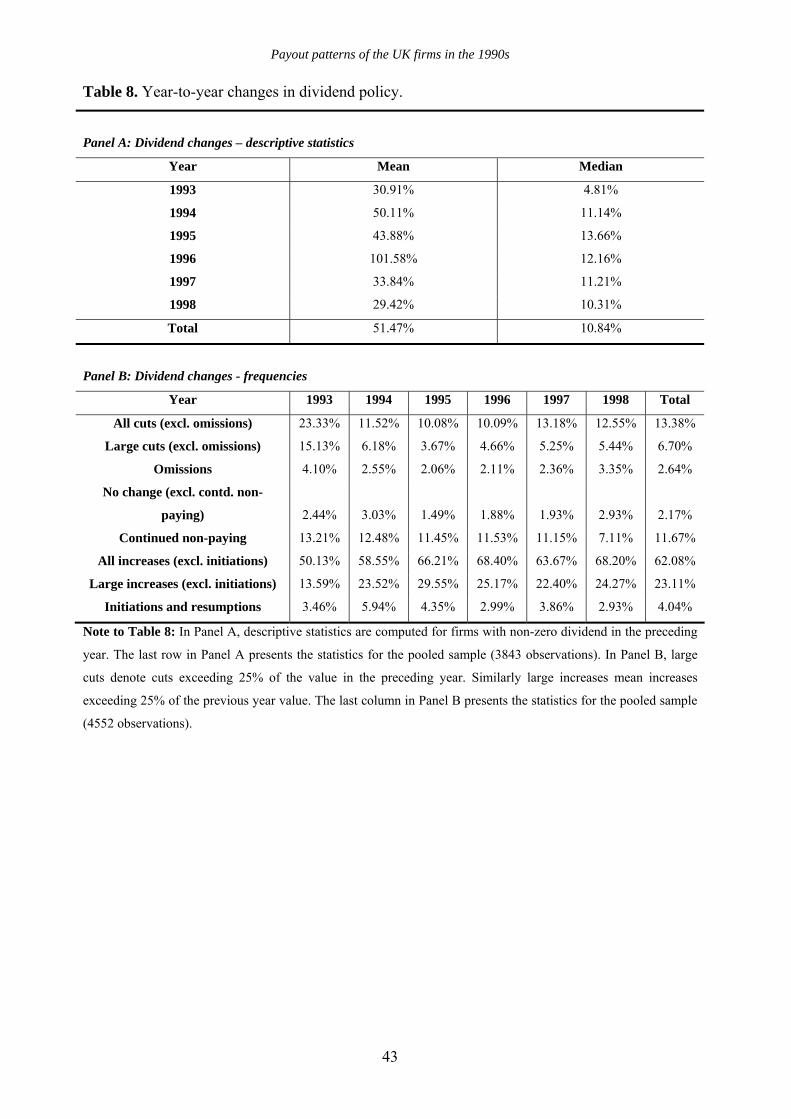
Payout patterns of the UK firms in the 1990s
43
Table 8. Year-to-year changes in dividend policy.
Panel A: Dividend changes – descriptive statistics
Year Mean Median
1993 30.91% 4.81%
1994 50.11% 11.14%
1995 43.88% 13.66%
1996 101.58% 12.16%
1997 33.84% 11.21%
1998 29.42% 10.31%
Total 51.47% 10.84%
Panel B: Dividend changes - frequencies
Year 1993 1994 1995 1996 1997 1998 Total
All cuts (excl. omissions) 23.33% 11.52% 10.08% 10.09% 13.18% 12.55% 13.38%
Large cuts (excl. omissions) 15.13% 6.18% 3.67% 4.66% 5.25% 5.44% 6.70%
Omissions 4.10% 2.55% 2.06% 2.11% 2.36% 3.35% 2.64%
No change (excl. contd. non-
paying) 2.44% 3.03% 1.49% 1.88% 1.93% 2.93% 2.17%
Continued non-paying 13.21% 12.48% 11.45% 11.53% 11.15% 7.11% 11.67%
All increases (excl. initiations) 50.13% 58.55% 66.21% 68.40% 63.67% 68.20% 62.08%
Large increases (excl. initiations) 13.59% 23.52% 29.55% 25.17% 22.40% 24.27% 23.11%
Initiations and resumptions 3.46% 5.94% 4.35% 2.99% 3.86% 2.93% 4.04%
Note to Table 8: In Panel A, descriptive statistics are computed for firms with non-zero dividend in the preceding
year. The last row in Panel A presents the statistics for the pooled sample (3843 observations). In Panel B, large
cuts denote cuts exceeding 25% of the value in the preceding year. Similarly large increases mean increases
exceeding 25% of the previous year value. The last column in Panel B presents the statistics for the pooled sample
(4552 observations).
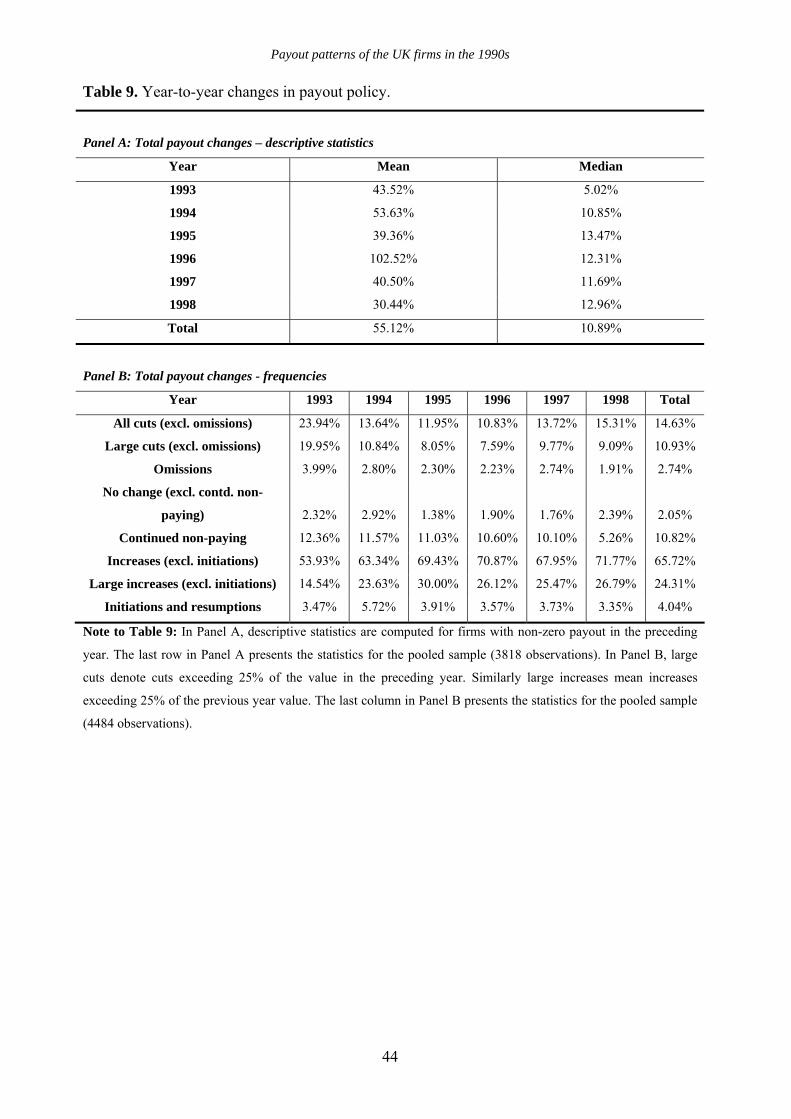
Payout patterns of the UK firms in the 1990s
44
Table 9. Year-to-year changes in payout policy.
Panel A: Total payout changes – descriptive statistics
Year Mean Median
1993 43.52% 5.02%
1994 53.63% 10.85%
1995 39.36% 13.47%
1996 102.52% 12.31%
1997 40.50% 11.69%
1998 30.44% 12.96%
Total 55.12% 10.89%
Panel B: Total payout changes - frequencies
Year 1993 1994 1995 1996 1997 1998 Total
All cuts (excl. omissions) 23.94% 13.64% 11.95% 10.83% 13.72% 15.31% 14.63%
Large cuts (excl. omissions) 19.95% 10.84% 8.05% 7.59% 9.77% 9.09% 10.93%
Omissions 3.99% 2.80% 2.30% 2.23% 2.74% 1.91% 2.74%
No change (excl. contd. non-
paying) 2.32% 2.92% 1.38% 1.90% 1.76% 2.39% 2.05%
Continued non-paying 12.36% 11.57% 11.03% 10.60% 10.10% 5.26% 10.82%
Increases (excl. initiations) 53.93% 63.34% 69.43% 70.87% 67.95% 71.77% 65.72%
Large increases (excl. initiations) 14.54% 23.63% 30.00% 26.12% 25.47% 26.79% 24.31%
Initiations and resumptions 3.47% 5.72% 3.91% 3.57% 3.73% 3.35% 4.04%
Note to Table 9: In Panel A, descriptive statistics are computed for firms with non-zero payout in the preceding
year. The last row in Panel A presents the statistics for the pooled sample (3818 observations). In Panel B, large
cuts denote cuts exceeding 25% of the value in the preceding year. Similarly large increases mean increases
exceeding 25% of the previous year value. The last column in Panel B presents the statistics for the pooled sample
(4484 observations).
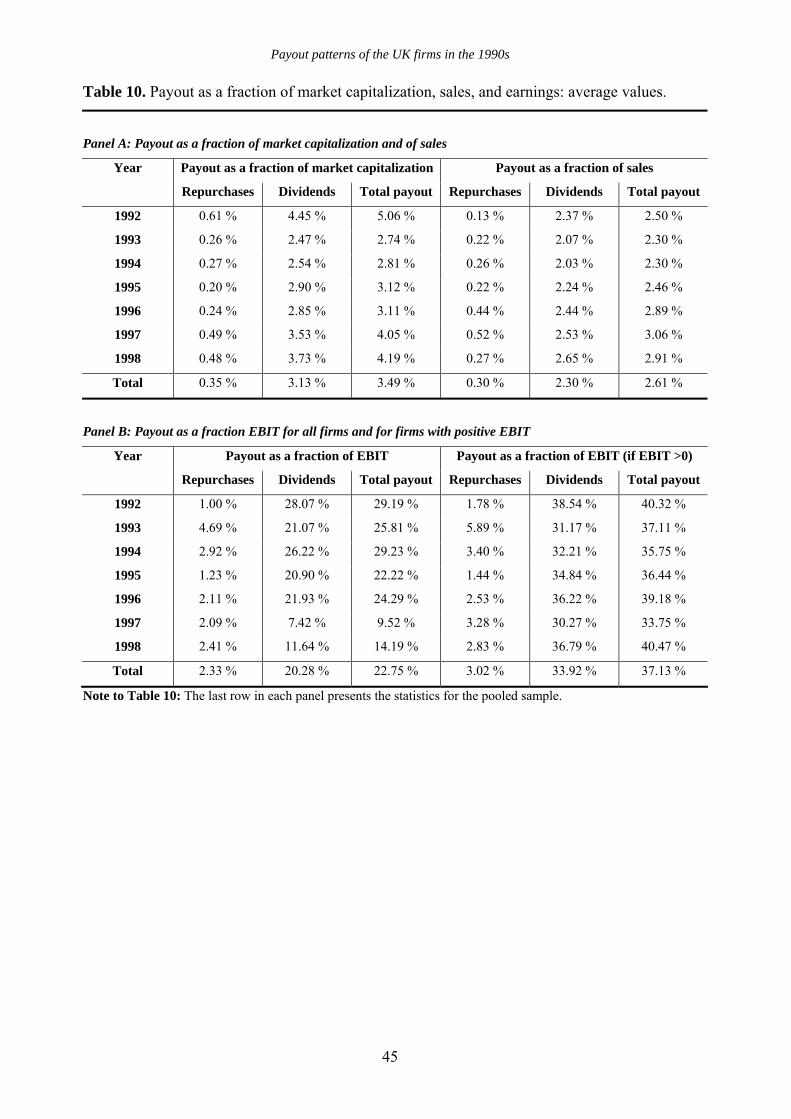
Payout patterns of the UK firms in the 1990s
45
Table 10. Payout as a fraction of market capitalization, sales, and earnings: average values.
Panel A: Payout as a fraction of market capitalization and of sales
Year Payout as a fraction of market capitalization Payout as a fraction of sales
Repurchases Dividends Total payout Repurchases Dividends Total payout
1992 0.61 % 4.45 % 5.06 % 0.13 % 2.37 % 2.50 %
1993 0.26 % 2.47 % 2.74 % 0.22 % 2.07 % 2.30 %
1994 0.27 % 2.54 % 2.81 % 0.26 % 2.03 % 2.30 %
1995 0.20 % 2.90 % 3.12 % 0.22 % 2.24 % 2.46 %
1996 0.24 % 2.85 % 3.11 % 0.44 % 2.44 % 2.89 %
1997 0.49 % 3.53 % 4.05 % 0.52 % 2.53 % 3.06 %
1998 0.48 % 3.73 % 4.19 % 0.27 % 2.65 % 2.91 %
Total 0.35 % 3.13 % 3.49 % 0.30 % 2.30 % 2.61 %
Panel B: Payout as a fraction EBIT for all firms and for firms with positive EBIT
Year Payout as a fraction of EBIT Payout as a fraction of EBIT (if EBIT >0)
Repurchases Dividends Total payout Repurchases Dividends Total payout
1992 1.00 % 28.07 % 29.19 % 1.78 % 38.54 % 40.32 %
1993 4.69 % 21.07 % 25.81 % 5.89 % 31.17 % 37.11 %
1994 2.92 % 26.22 % 29.23 % 3.40 % 32.21 % 35.75 %
1995 1.23 % 20.90 % 22.22 % 1.44 % 34.84 % 36.44 %
1996 2.11 % 21.93 % 24.29 % 2.53 % 36.22 % 39.18 %
1997 2.09 % 7.42 % 9.52 % 3.28 % 30.27 % 33.75 %
1998 2.41 % 11.64 % 14.19 % 2.83 % 36.79 % 40.47 %
Total 2.33 % 20.28 % 22.75 % 3.02 % 33.92 % 37.13 %
Note to Table 10: The last row in each panel presents the statistics for the pooled sample.
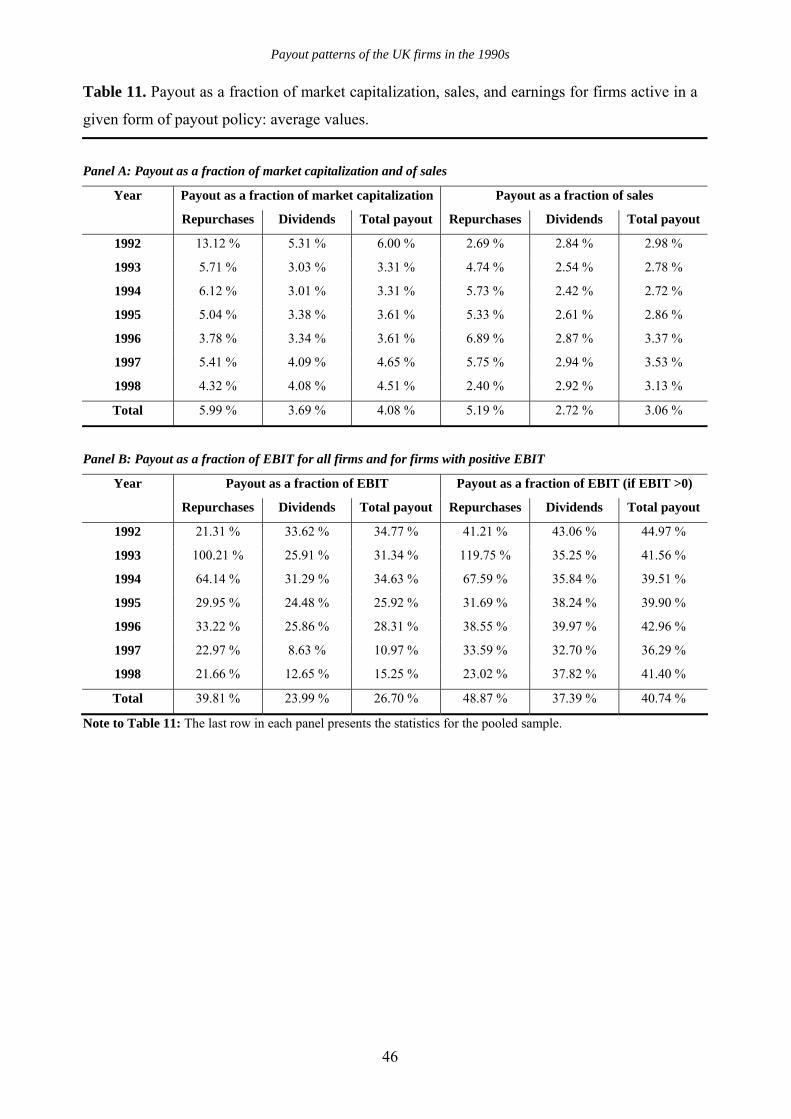
Payout patterns of the UK firms in the 1990s
46
Table 11. Payout as a fraction of market capitalization, sales, and earnings for firms active in a
given form of payout policy: average values.
Panel A: Payout as a fraction of market capitalization and of sales
Year Payout as a fraction of market capitalization Payout as a fraction of sales
Repurchases Dividends Total payout Repurchases Dividends Total payout
1992 13.12 % 5.31 % 6.00 % 2.69 % 2.84 % 2.98 %
1993 5.71 % 3.03 % 3.31 % 4.74 % 2.54 % 2.78 %
1994 6.12 % 3.01 % 3.31 % 5.73 % 2.42 % 2.72 %
1995 5.04 % 3.38 % 3.61 % 5.33 % 2.61 % 2.86 %
1996 3.78 % 3.34 % 3.61 % 6.89 % 2.87 % 3.37 %
1997 5.41 % 4.09 % 4.65 % 5.75 % 2.94 % 3.53 %
1998 4.32 % 4.08 % 4.51 % 2.40 % 2.92 % 3.13 %
Total 5.99 % 3.69 % 4.08 % 5.19 % 2.72 % 3.06 %
Panel B: Payout as a fraction of EBIT for all firms and for firms with positive EBIT
Year Payout as a fraction of EBIT Payout as a fraction of EBIT (if EBIT >0)
Repurchases Dividends Total payout Repurchases Dividends Total payout
1992 21.31 % 33.62 % 34.77 % 41.21 % 43.06 % 44.97 %
1993 100.21 % 25.91 % 31.34 % 119.75 % 35.25 % 41.56 %
1994 64.14 % 31.29 % 34.63 % 67.59 % 35.84 % 39.51 %
1995 29.95 % 24.48 % 25.92 % 31.69 % 38.24 % 39.90 %
1996 33.22 % 25.86 % 28.31 % 38.55 % 39.97 % 42.96 %
1997 22.97 % 8.63 % 10.97 % 33.59 % 32.70 % 36.29 %
1998 21.66 % 12.65 % 15.25 % 23.02 % 37.82 % 41.40 %
Total 39.81 % 23.99 % 26.70 % 48.87 % 37.39 % 40.74 %
Note to Table 11: The last row in each panel presents the statistics for the pooled sample.
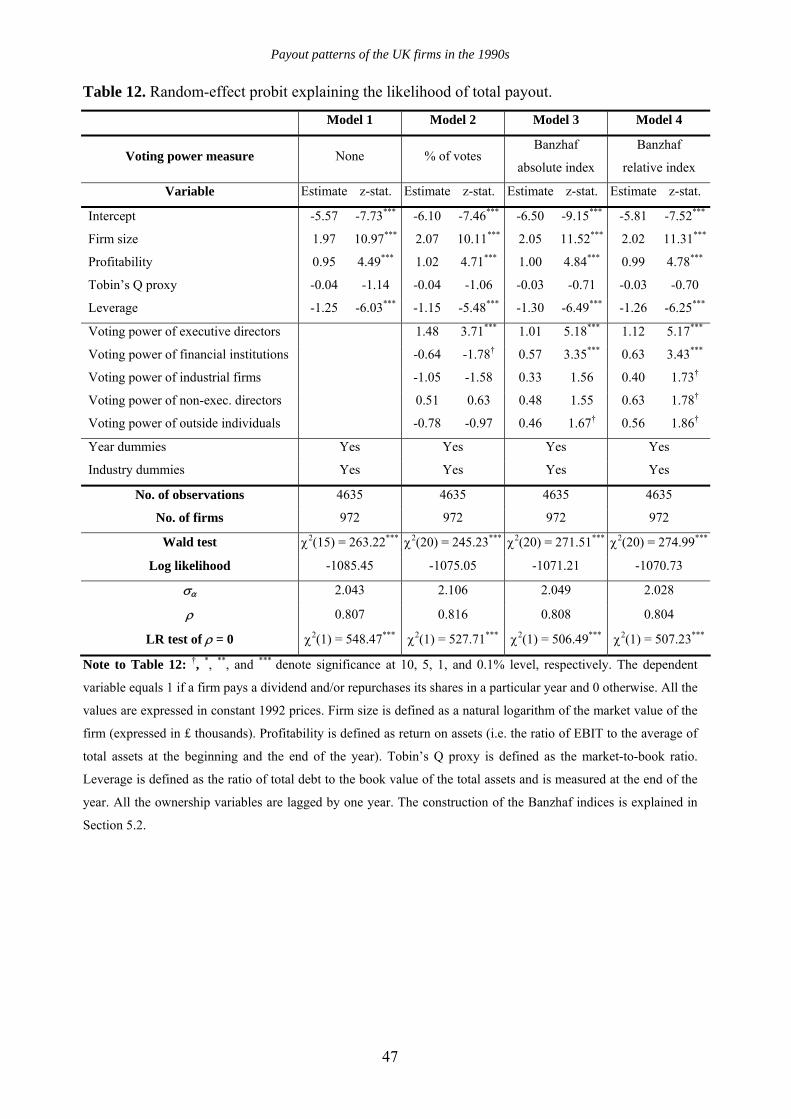
Payout patterns of the UK firms in the 1990s
47
Table 12. Random-effect probit explaining the likelihood of total payout.
Model 1 Model 2 Model 3 Model 4
Voting power measure None % of votes Banzhaf
absolute index
Banzhaf
relative index
Variable Estimate z-stat. Estimate z-stat. Estimate z-stat. Estimate z-stat.
Intercept -5.57 -7.73*** -6.10 -7.46*** -6.50 -9.15*** -5.81 -7.52***
Firm size 1.97 10.97*** 2.07 10.11*** 2.05 11.52*** 2.02 11.31***
Profitability 0.95 4.49*** 1.02 4.71*** 1.00 4.84*** 0.99 4.78***
Tobin’s Q proxy -0.04 -1.14 -0.04 -1.06 -0.03 -0.71 -0.03 -0.70
Leverage -1.25 -6.03*** -1.15 -5.48*** -1.30 -6.49*** -1.26 -6.25***
Voting power of executive directors 1.48 3.71*** 1.01 5.18*** 1.12 5.17***
Voting power of financial institutions -0.64 -1.78† 0.57 3.35*** 0.63 3.43***
Voting power of industrial firms -1.05 -1.58 0.33 1.56 0.40 1.73†
Voting power of non-exec. directors 0.51 0.63 0.48 1.55 0.63 1.78†
Voting power of outside individuals -0.78 -0.97 0.46 1.67† 0.56 1.86†
Year dummies Yes Yes Yes Yes
Industry dummies Yes Yes Yes Yes
No. of observations 4635 4635 4635 4635
No. of firms 972 972 972 972
Wald test χ2(15) = 263.22*** χ2(20) = 245.23*** χ2(20) = 271.51*** χ2(20) = 274.99***
Log likelihood -1085.45 -1075.05 -1071.21 -1070.73
σα 2.043 2.106 2.049 2.028
ρ 0.807 0.816 0.808 0.804
LR test of ρ = 0 χ2(1) = 548.47*** χ2(1) = 527.71*** χ2(1) = 506.49*** χ2(1) = 507.23***
Note to Table 12: †, *, **, and *** denote significance at 10, 5, 1, and 0.1% level, respectively. The dependent
variable equals 1 if a firm pays a dividend and/or repurchases its shares in a particular year and 0 otherwise. All the
values are expressed in constant 1992 prices. Firm size is defined as a natural logarithm of the market value of the
firm (expressed in £ thousands). Profitability is defined as return on assets (i.e. the ratio of EBIT to the average of
total assets at the beginning and the end of the year). Tobin’s Q proxy is defined as the market-to-book ratio.
Leverage is defined as the ratio of total debt to the book value of the total assets and is measured at the end of the
year. All the ownership variables are lagged by one year. The construction of the Banzhaf indices is explained in
Section 5.2.

Payout patterns of the UK firms in the 1990s
48
Table 13. Random-effect probit models explaining the likelihood of dividend payout.
Model 5 Model 6 Model 7 Model 8
Voting power measure None % of votes Banzhaf
absolute index
Banzhaf
relative index
Variable Estimate z-stat. Estimate z-stat. Estimate z-stat. Estimate z-stat.
Intercept -5.17 -6.47*** 5.59 -7.34*** -7.34 -9.65*** -7.31 -9.37***
Firm size 2.21 11.53*** 2.26 13.26*** 2.22 12.28*** 2.19 11.89***
Profitability 0.91 4.40*** 1.00 4.94*** 1.15 4.38*** 1.15 4.80***
Tobin’s Q proxy -0.12 -2.87** -0.10 -2.43* -0.08 -1.94† -0.08 -1.91†
Leverage -1.50 -7.36*** -1.63 -7.40*** -1.46 -6.42*** -1.42 -6.65***
Voting power of executive directors 1.85 4.69*** 1.21 6.02*** 1.33 5.91***
Voting power of financial institutions -0.53 -1.55 0.78 4.59*** 0.84 4.64***
Voting power of industrial firms 0.14 0.29 0.50 2.32* 0.58 2.52*
Voting power of non-exec. directors 0.93 1.19 0.72 2.29* 0.88 2.46*
Voting power of outside individuals -1.05 -1.27 0.61 2.22* 0.71 2.38*
Year dummies Yes Yes Yes Yes
Industry dummies Yes Yes Yes Yes
No. of observations 4679 4679 4679 4679
No. of firms 982 982 982 982
Wald test χ2(15) = 281.85*** χ2(20) = 281.38*** χ2(20) = 294.34*** χ2(20) = 293.44***
Log likelihood -1091.59 -1080.28 -1071.89 -1071.72
σα 2.309 2.412 2.190 2.159
ρ 0.842 0.853 0.828 0.823
LR test of ρ = 0 χ2(1) = 622.82*** χ2(1) = 593.72*** χ2(1) = 565.93*** χ2(1) = 565.67***
Note to Table 13: †, *, **, and *** denote significance at 10, 5, 1, and 0.1% level, respectively. The dependent
variable equals 1 if a firm pays a dividend in a particular year and 0 otherwise. All the values are expressed in
constant 1992 prices. Firm size is defined as a natural logarithm of the market value of the firm (expressed in £
thousands). Profitability is defined as return on assets (i.e. the ratio of EBIT to the average of total assets at the
beginning and the end of the year). Tobin’s Q proxy is defined as the market-to-book ratio. Leverage is defined as
the ratio of total debt to the book value of the total assets and is measured at the end of the year. All the ownership
variables are lagged by one year. The construction of the Banzhaf indices is explained in Section 5.2.
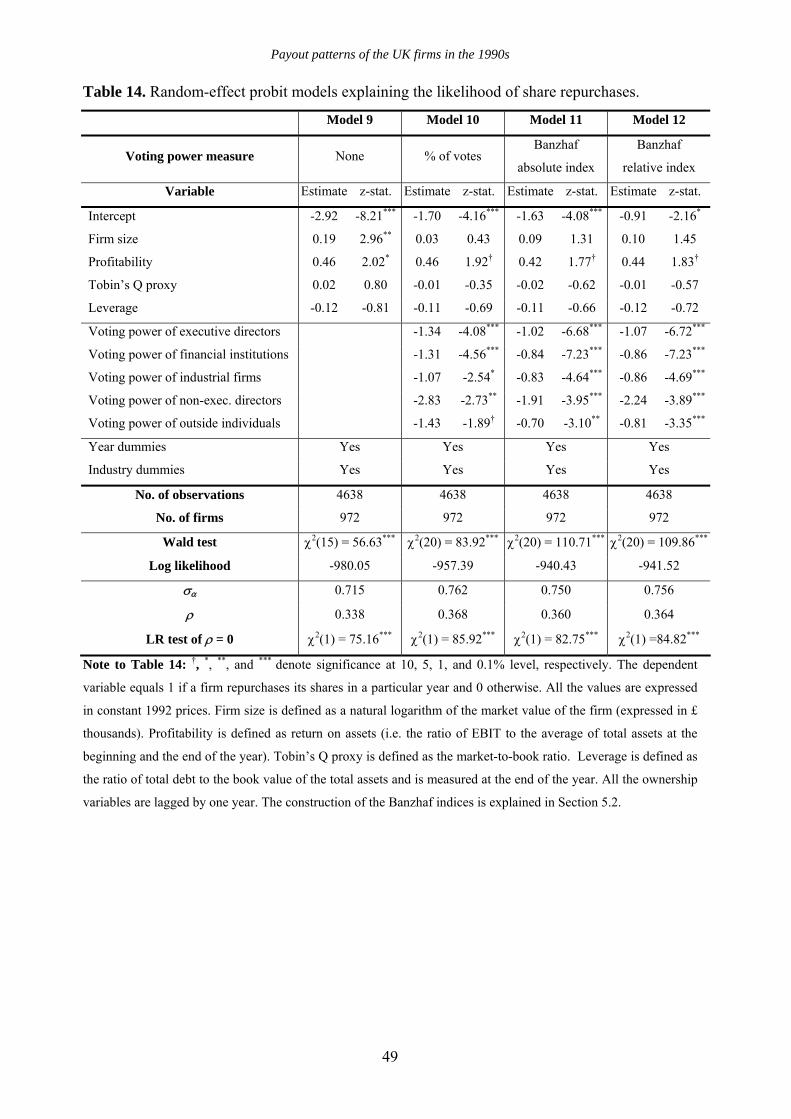
Payout patterns of the UK firms in the 1990s
49
Table 14. Random-effect probit models explaining the likelihood of share repurchases.
Model 9 Model 10 Model 11 Model 12
Voting power measure None % of votes Banzhaf
absolute index
Banzhaf
relative index
Variable Estimate z-stat. Estimate z-stat. Estimate z-stat. Estimate z-stat.
Intercept -2.92 -8.21*** -1.70 -4.16*** -1.63 -4.08*** -0.91 -2.16*
Firm size 0.19 2.96** 0.03 0.43 0.09 1.31 0.10 1.45
Profitability 0.46 2.02* 0.46 1.92† 0.42 1.77† 0.44 1.83†
Tobin’s Q proxy 0.02 0.80 -0.01 -0.35 -0.02 -0.62 -0.01 -0.57
Leverage -0.12 -0.81 -0.11 -0.69 -0.11 -0.66 -0.12 -0.72
Voting power of executive directors -1.34 -4.08*** -1.02 -6.68*** -1.07 -6.72***
Voting power of financial institutions -1.31 -4.56*** -0.84 -7.23*** -0.86 -7.23***
Voting power of industrial firms -1.07 -2.54* -0.83 -4.64*** -0.86 -4.69***
Voting power of non-exec. directors -2.83 -2.73** -1.91 -3.95*** -2.24 -3.89***
Voting power of outside individuals -1.43 -1.89† -0.70 -3.10** -0.81 -3.35***
Year dummies Yes Yes Yes Yes
Industry dummies Yes Yes Yes Yes
No. of observations 4638 4638 4638 4638
No. of firms 972 972 972 972
Wald test χ2(15) = 56.63*** χ2(20) = 83.92*** χ2(20) = 110.71*** χ2(20) = 109.86***
Log likelihood -980.05 -957.39 -940.43 -941.52
σα 0.715 0.762 0.750 0.756
ρ 0.338 0.368 0.360 0.364
LR test of ρ = 0 χ2(1) = 75.16*** χ2(1) = 85.92*** χ2(1) = 82.75*** χ2(1) =84.82***
Note to Table 14: †, *, **, and *** denote significance at 10, 5, 1, and 0.1% level, respectively. The dependent
variable equals 1 if a firm repurchases its shares in a particular year and 0 otherwise. All the values are expressed
in constant 1992 prices. Firm size is defined as a natural logarithm of the market value of the firm (expressed in £
thousands). Profitability is defined as return on assets (i.e. the ratio of EBIT to the average of total assets at the
beginning and the end of the year). Tobin’s Q proxy is defined as the market-to-book ratio. Leverage is defined as
the ratio of total debt to the book value of the total assets and is measured at the end of the year. All the ownership
variables are lagged by one year. The construction of the Banzhaf indices is explained in Section 5.2.
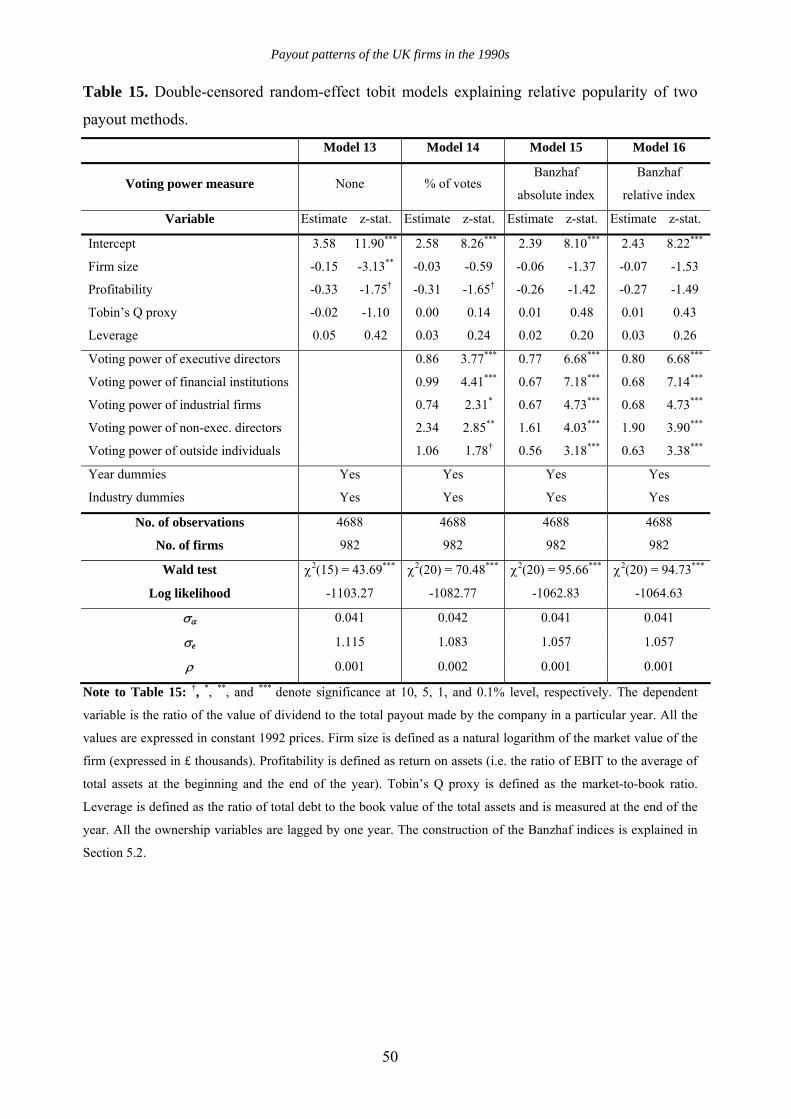
Payout patterns of the UK firms in the 1990s
50
Table 15. Double-censored random-effect tobit models explaining relative popularity of two
payout methods.
Model 13 Model 14 Model 15 Model 16
Voting power measure None % of votes Banzhaf
absolute index
Banzhaf
relative index
Variable Estimate z-stat. Estimate z-stat. Estimate z-stat. Estimate z-stat.
Intercept 3.58 11.90*** 2.58 8.26*** 2.39 8.10*** 2.43 8.22***
Firm size -0.15 -3.13** -0.03 -0.59 -0.06 -1.37 -0.07 -1.53
Profitability -0.33 -1.75† -0.31 -1.65† -0.26 -1.42 -0.27 -1.49
Tobin’s Q proxy -0.02 -1.10 0.00 0.14 0.01 0.48 0.01 0.43
Leverage 0.05 0.42 0.03 0.24 0.02 0.20 0.03 0.26
Voting power of executive directors 0.86 3.77*** 0.77 6.68*** 0.80 6.68***
Voting power of financial institutions 0.99 4.41*** 0.67 7.18*** 0.68 7.14***
Voting power of industrial firms 0.74 2.31* 0.67 4.73*** 0.68 4.73***
Voting power of non-exec. directors 2.34 2.85** 1.61 4.03*** 1.90 3.90***
Voting power of outside individuals 1.06 1.78† 0.56 3.18*** 0.63 3.38***
Year dummies Yes Yes Yes Yes
Industry dummies Yes Yes Yes Yes
No. of observations 4688 4688 4688 4688
No. of firms 982 982 982 982
Wald test χ2(15) = 43.69*** χ2(20) = 70.48*** χ2(20) = 95.66*** χ2(20) = 94.73***
Log likelihood -1103.27 -1082.77 -1062.83 -1064.63
σα 0.041 0.042 0.041 0.041
σe 1.115 1.083 1.057 1.057
ρ 0.001 0.002 0.001 0.001
Note to Table 15: †, *, **, and *** denote significance at 10, 5, 1, and 0.1% level, respectively. The dependent
variable is the ratio of the value of dividend to the total payout made by the company in a particular year. All the
values are expressed in constant 1992 prices. Firm size is defined as a natural logarithm of the market value of the
firm (expressed in £ thousands). Profitability is defined as return on assets (i.e. the ratio of EBIT to the average of
total assets at the beginning and the end of the year). Tobin’s Q proxy is defined as the market-to-book ratio.
Leverage is defined as the ratio of total debt to the book value of the total assets and is measured at the end of the
year. All the ownership variables are lagged by one year. The construction of the Banzhaf indices is explained in
Section 5.2.
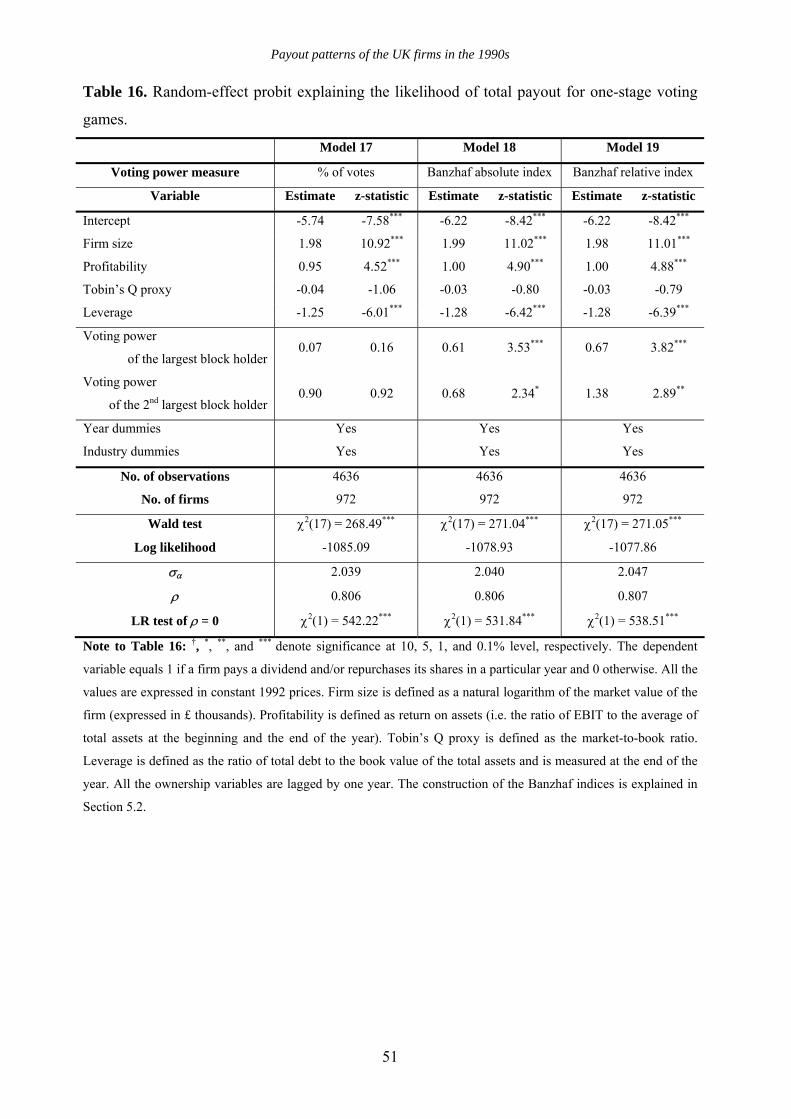
Payout patterns of the UK firms in the 1990s
51
Table 16. Random-effect probit explaining the likelihood of total payout for one-stage voting
games.
Model 17 Model 18 Model 19
Voting power measure % of votes Banzhaf absolute index Banzhaf relative index
Variable Estimate z-statistic Estimate z-statistic Estimate z-statistic
Intercept -5.74 -7.58*** -6.22 -8.42*** -6.22 -8.42***
Firm size 1.98 10.92*** 1.99 11.02*** 1.98 11.01***
Profitability 0.95 4.52*** 1.00 4.90*** 1.00 4.88***
Tobin’s Q proxy -0.04 -1.06 -0.03 -0.80 -0.03 -0.79
Leverage -1.25 -6.01*** -1.28 -6.42*** -1.28 -6.39***
Voting power
of the largest block holder 0.07 0.16 0.61 3.53*** 0.67 3.82***
Voting power
of the 2nd largest block holder 0.90 0.92 0.68 2.34* 1.38 2.89**
Year dummies Yes Yes Yes
Industry dummies Yes Yes Yes
No. of observations 4636 4636 4636
No. of firms 972 972 972
Wald test χ2(17) = 268.49*** χ2(17) = 271.04*** χ2(17) = 271.05***
Log likelihood -1085.09 -1078.93 -1077.86
σα 2.039 2.040 2.047
ρ 0.806 0.806 0.807
LR test of ρ = 0 χ2(1) = 542.22*** χ2(1) = 531.84*** χ2(1) = 538.51***
Note to Table 16: †, *, **, and *** denote significance at 10, 5, 1, and 0.1% level, respectively. The dependent
variable equals 1 if a firm pays a dividend and/or repurchases its shares in a particular year and 0 otherwise. All the
values are expressed in constant 1992 prices. Firm size is defined as a natural logarithm of the market value of the
firm (expressed in £ thousands). Profitability is defined as return on assets (i.e. the ratio of EBIT to the average of
total assets at the beginning and the end of the year). Tobin’s Q proxy is defined as the market-to-book ratio.
Leverage is defined as the ratio of total debt to the book value of the total assets and is measured at the end of the
year. All the ownership variables are lagged by one year. The construction of the Banzhaf indices is explained in
Section 5.2.
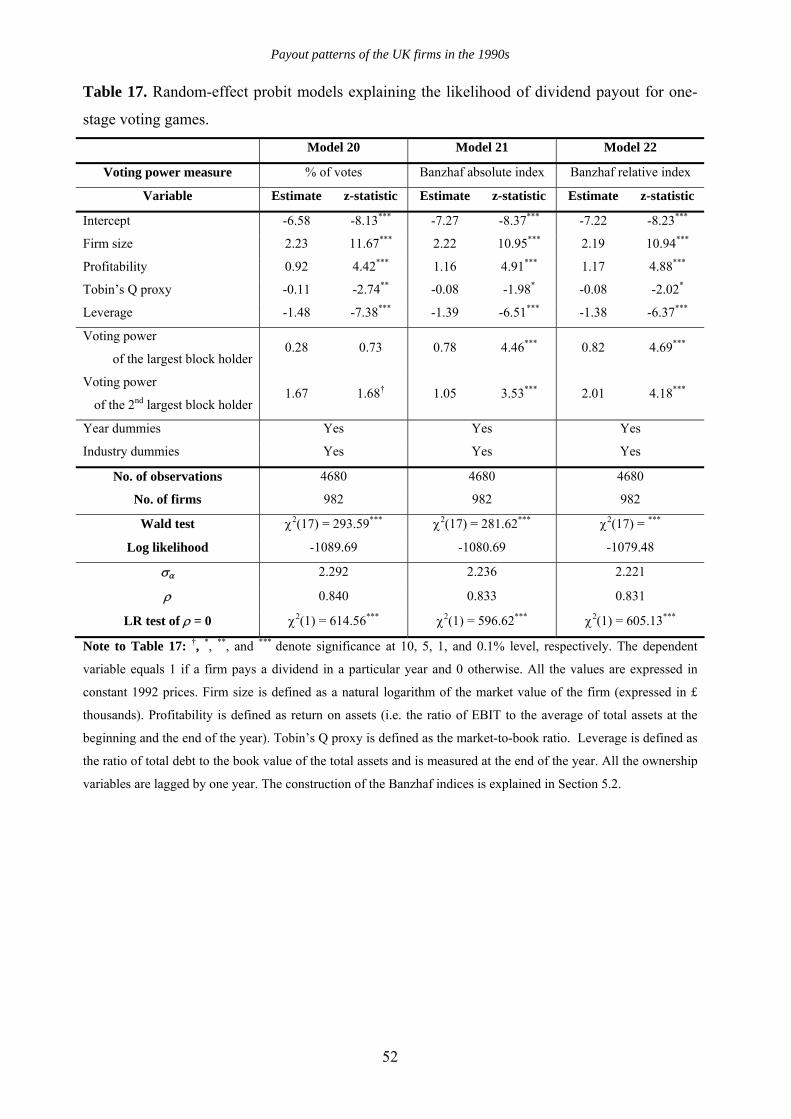
Payout patterns of the UK firms in the 1990s
52
Table 17. Random-effect probit models explaining the likelihood of dividend payout for one-
stage voting games.
Model 20 Model 21 Model 22
Voting power measure % of votes Banzhaf absolute index Banzhaf relative index
Variable Estimate z-statistic Estimate z-statistic Estimate z-statistic
Intercept -6.58 -8.13*** -7.27 -8.37*** -7.22 -8.23***
Firm size 2.23 11.67*** 2.22 10.95*** 2.19 10.94***
Profitability 0.92 4.42*** 1.16 4.91*** 1.17 4.88***
Tobin’s Q proxy -0.11 -2.74** -0.08 -1.98* -0.08 -2.02*
Leverage -1.48 -7.38*** -1.39 -6.51*** -1.38 -6.37***
Voting power
of the largest block holder 0.28 0.73 0.78 4.46*** 0.82 4.69***
Voting power
of the 2nd largest block holder 1.67 1.68† 1.05 3.53*** 2.01 4.18***
Year dummies Yes Yes Yes
Industry dummies Yes Yes Yes
No. of observations 4680 4680 4680
No. of firms 982 982 982
Wald test χ2(17) = 293.59*** χ2(17) = 281.62*** χ2(17) = ***
Log likelihood -1089.69 -1080.69 -1079.48
σα 2.292 2.236 2.221
ρ 0.840 0.833 0.831
LR test of ρ = 0 χ2(1) = 614.56*** χ2(1) = 596.62*** χ2(1) = 605.13***
Note to Table 17: †, *, **, and *** denote significance at 10, 5, 1, and 0.1% level, respectively. The dependent
variable equals 1 if a firm pays a dividend in a particular year and 0 otherwise. All the values are expressed in
constant 1992 prices. Firm size is defined as a natural logarithm of the market value of the firm (expressed in £
thousands). Profitability is defined as return on assets (i.e. the ratio of EBIT to the average of total assets at the
beginning and the end of the year). Tobin’s Q proxy is defined as the market-to-book ratio. Leverage is defined as
the ratio of total debt to the book value of the total assets and is measured at the end of the year. All the ownership
variables are lagged by one year. The construction of the Banzhaf indices is explained in Section 5.2.
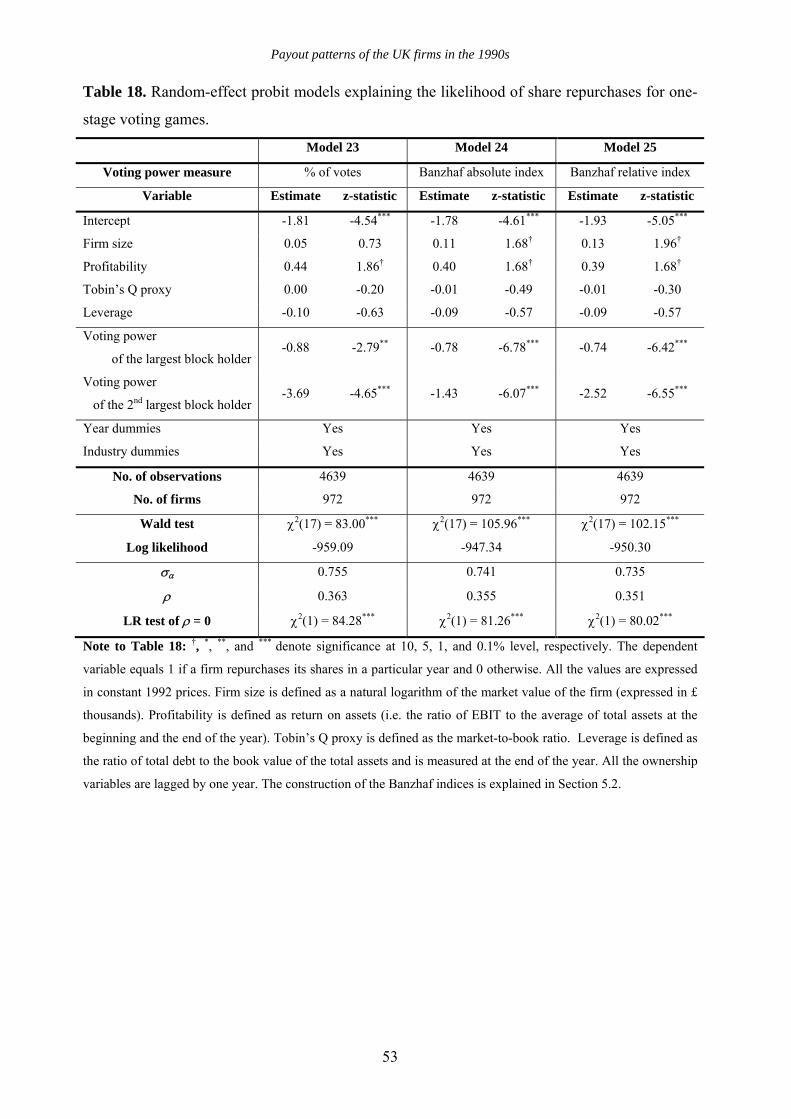
Payout patterns of the UK firms in the 1990s
53
Table 18. Random-effect probit models explaining the likelihood of share repurchases for one-
stage voting games.
Model 23 Model 24 Model 25
Voting power measure % of votes Banzhaf absolute index Banzhaf relative index
Variable Estimate z-statistic Estimate z-statistic Estimate z-statistic
Intercept -1.81 -4.54*** -1.78 -4.61*** -1.93 -5.05***
Firm size 0.05 0.73 0.11 1.68† 0.13 1.96†
Profitability 0.44 1.86† 0.40 1.68† 0.39 1.68†
Tobin’s Q proxy 0.00 -0.20 -0.01 -0.49 -0.01 -0.30
Leverage -0.10 -0.63 -0.09 -0.57 -0.09 -0.57
Voting power
of the largest block holder -0.88 -2.79** -0.78 -6.78*** -0.74 -6.42***
Voting power
of the 2nd largest block holder -3.69 -4.65*** -1.43 -6.07*** -2.52 -6.55***
Year dummies Yes Yes Yes
Industry dummies Yes Yes Yes
No. of observations 4639 4639 4639
No. of firms 972 972 972
Wald test χ2(17) = 83.00*** χ2(17) = 105.96*** χ2(17) = 102.15***
Log likelihood -959.09 -947.34 -950.30
σα 0.755 0.741 0.735
ρ 0.363 0.355 0.351
LR test of ρ = 0 χ2(1) = 84.28*** χ2(1) = 81.26*** χ2(1) = 80.02***
Note to Table 18: †, *, **, and *** denote significance at 10, 5, 1, and 0.1% level, respectively. The dependent
variable equals 1 if a firm repurchases its shares in a particular year and 0 otherwise. All the values are expressed
in constant 1992 prices. Firm size is defined as a natural logarithm of the market value of the firm (expressed in £
thousands). Profitability is defined as return on assets (i.e. the ratio of EBIT to the average of total assets at the
beginning and the end of the year). Tobin’s Q proxy is defined as the market-to-book ratio. Leverage is defined as
the ratio of total debt to the book value of the total assets and is measured at the end of the year. All the ownership
variables are lagged by one year. The construction of the Banzhaf indices is explained in Section 5.2.
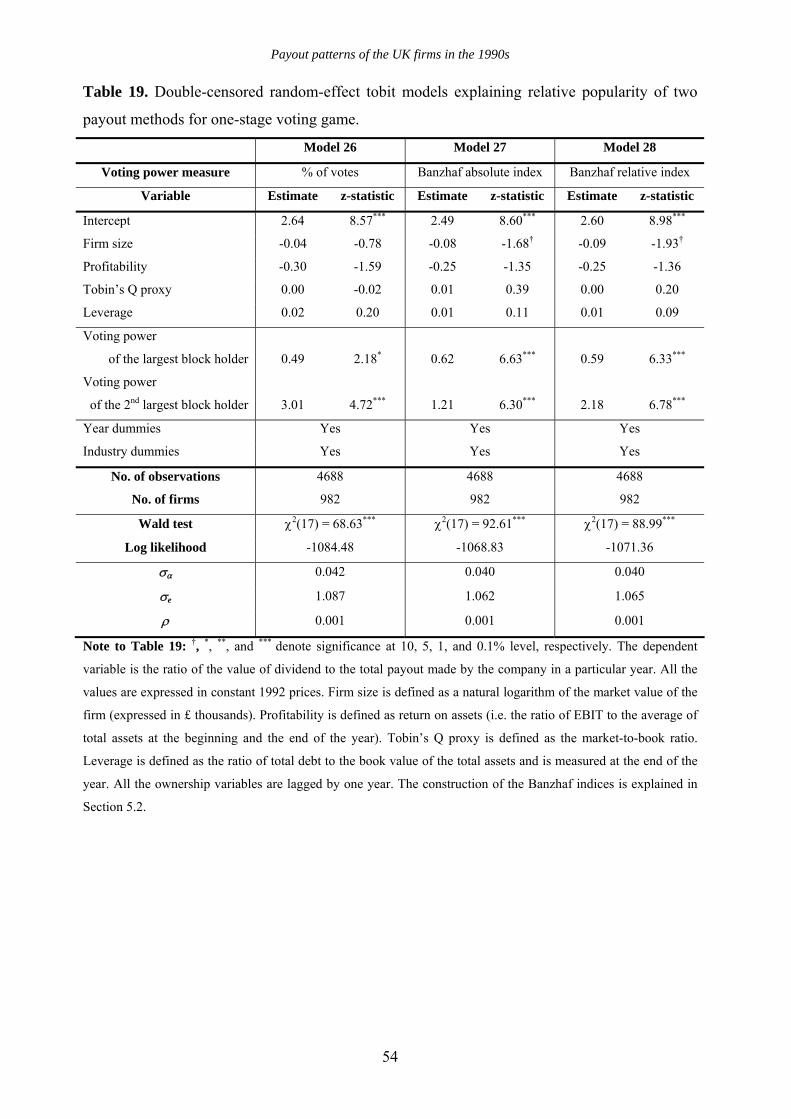
Payout patterns of the UK firms in the 1990s
54
Table 19. Double-censored random-effect tobit models explaining relative popularity of two
payout methods for one-stage voting game.
Model 26 Model 27 Model 28
Voting power measure % of votes Banzhaf absolute index Banzhaf relative index
Variable Estimate z-statistic Estimate z-statistic Estimate z-statistic
Intercept 2.64 8.57*** 2.49 8.60*** 2.60 8.98***
Firm size -0.04 -0.78 -0.08 -1.68† -0.09 -1.93†
Profitability -0.30 -1.59 -0.25 -1.35 -0.25 -1.36
Tobin’s Q proxy 0.00 -0.02 0.01 0.39 0.00 0.20
Leverage 0.02 0.20 0.01 0.11 0.01 0.09
Voting power
of the largest block holder 0.49 2.18* 0.62 6.63*** 0.59 6.33***
Voting power
of the 2nd largest block holder 3.01 4.72*** 1.21 6.30*** 2.18 6.78***
Year dummies Yes Yes Yes
Industry dummies Yes Yes Yes
No. of observations 4688 4688 4688
No. of firms 982 982 982
Wald test χ2(17) = 68.63*** χ2(17) = 92.61*** χ2(17) = 88.99***
Log likelihood -1084.48 -1068.83 -1071.36
σα 0.042 0.040 0.040
σe 1.087 1.062 1.065
ρ 0.001 0.001 0.001
Note to Table 19: †, *, **, and *** denote significance at 10, 5, 1, and 0.1% level, respectively. The dependent
variable is the ratio of the value of dividend to the total payout made by the company in a particular year. All the
values are expressed in constant 1992 prices. Firm size is defined as a natural logarithm of the market value of the
firm (expressed in £ thousands). Profitability is defined as return on assets (i.e. the ratio of EBIT to the average of
total assets at the beginning and the end of the year). Tobin’s Q proxy is defined as the market-to-book ratio.
Leverage is defined as the ratio of total debt to the book value of the total assets and is measured at the end of the
year. All the ownership variables are lagged by one year. The construction of the Banzhaf indices is explained in
Section 5.2.