patterns and distribution of delma impar in remnant
TRANSCRIPT

The Use of Artificial Refuges to Census Populations of the ‘Threatened’ Striped Legless Lizard, Delma impar in Western
Victoria
MELINDA J. THOMPSON
A thesis submitted in partial fulfillment of requirements for the degree of B.Sc (Hons) to the Department of Zoology, La Trobe University, April 2006
Words: 11,945

Declaration
I hereby declare that the work involved in this investigation was performed by the author and that no material presented herein has been submitted for any previous degree, diploma or publication, except where due reference has been made. I understand that the work submitted may be reproduced and/or communicated for the purpose of detecting plagiarism. Ethics Approval. The research undertaken in connection with this thesis was approved by La Trobe University Animal Ethics Committee (Approval No: AEC05/14(L)) and Zoos Victoria Animal Ethics Committee (Approval No: ZV05008). Wildlife Research The use of wildlife in connection with this thesis was authorized by the Department of Sustainability and Environment under the Wildlife Act 1975 (Research Permit No: 10003423). Signature: Date:
9

Acknowledgements.
I would like to thank and acknowledge the following people: My supervisor, Dr. Brian Malone, for his advice, support and patience throughout my study. Also for his expert knowledge and excitement in my project and helping me to maintain the captive Delma. I am indebted to Mr. Garry Peterson (D.S.E Warrnambool) for allowing me to undertake this project, for his advice and knowledge of D. impar, for reading various drafts and for his continual support throughout this study. Miss Cath Grant (D.S.E Ballarat) for her support and for the use of her monitoring grids throughout this study. This project would also not have been possible without funding provided by the Department of Sustainability and Environment. I am also indebted to all those who laid out roof tiles across Western Victoria 12 months prior to my study. To Geoff Heard and Greg Woodward for their advice on statistics and talking through sections of my project. To Paul McDonald for his assistance with logistic regression analyses. To Mike Swan and Chris Banks (Melbourne Zoo) for the use of their whole captive breeding colony of D. impar. Also to the Victorian Striped Legless Lizard Working Group for allowing me to obtain these from the zoo. To Mike Swan for his advice and knowledge on captive maintenance/husbandry and to Chris Banks for providing access to additional journal papers. Special thanks to Len Matthews, and the Department of Ecology and Evolutionary Biology, Monash University for the use of the Alvie Field Station, Colac. To Dave and Dorothy from the Skipton Hotel, and Ian and Ginni Waller from Mooramong Homestead for their hospitality. To Peter and David Oddie, for the access and use of “Challicum Park” and Blacks Creek sites- much appreciated. Finally, to my mum and dad for their continual support, encouragement and patience. To Glenda and Chris Pearce for their support. And also to Evan Pearce for his patience, support, encouragement and continual belief in me.
10

TABLE OF CONTENTS Page DECLARATION ii ACKNOWLEDGEMENTS iii TABLE OF CONTENTS iv TABLE OF TABLES vii TABLE OF FIGURES viii SUMMARY ix
Chapter 1: INTRODUCTION 1 1.1 Delma impar 2 1.2 Census techniques for D. impar 4
1.2.1 Ecological factors influencing presence/absence and abundances
using artificial refuges
7
1.3 Aims 8
Chapter 2: MATERIALS AND METHODS 9 2.1 Study Sites 9 2.2 Artificial refuge (roof tile) census 13
2.2.1 Tile grid arrangement 13
2.2.2 Sampling programme 14
2.2.3 Time, weather condition, temperature and relative humidity under and outside tiles
15
2.2.4 Capture and measurement 15
2.2.5 Mark - recapture 16
2.3 Habitat characteristics 17 2.4 Microhabitat characteristics under and around tiles 18 2.5 Refuge preference of D. impar 19
2.5.1 Captive maintenance 19
2.5.2 Experimental design 20 2.6 Statistical analysis 21
11

Page
Chapter 3: RESULTS 24 3.1 Census data 24
3.1.1 All small terrestrial vertebrates 24
3.1.2 D. impar across sites 24 3.2 Morphometrics of Delma impar 26
3.2.1 Sex ratios of D. impar 27 3.3 Habitat characteristics of sites and occupancy rates 28
3.3.1 Tile occupancy rates for D. impar 28
3.3.2 Seasonal occupancy rates 29
3.3.3 Structural habitat characteristics 31
3.3.4 Floristic habitat characteristics 33 3.4 General tile use 33
3.4.1 Weather conditions and time of day 33 3.5 Individual tile use 38
3.5.1 Influence of other animal taxa 38
3.5.2 Microhabitat characteristics under tiles 40
3.5.3 Microhabitat characteristics around tiles 41 3.6 Refuge preference in a laboratory experiment 42
Chapter 4: DISCUSSION 43 4.1 Census data 43 4.2 Morphometrics of D. impar 43
4.2.1 Sex ratios of D. impar 45 4.3 Habitat characteristics of sites and occupancy rates 45
4.3.1 Tile occupancy rates for D. impar 45
4.3.2 Seasonal tile occupancy 48
4.3.3 Habitat characteristics 48
12

Page 4.4 General tile use 50
4.4.1 The influence of time of day and environmental conditions 50
4.5 Individual tile use 53
4.5.1 Influences of other animal taxa 53
4.5.2 Microhabitat characteristics under and outside tiles 55 4.6 Refuge preference in a laboratory experiment 56
CONCLUSIONS 57 REFERENCES 60 APENDICES 70
13

Table of Tables Page Table 2.1 Descriptions of study sites used in the surveys for D. impar 11 Table 2.2 Soils and geomorphology of the study sites used in the
surveys for D. impar 12
Table 3.1 Fauna recorded under artificial refuges from late September
2005 to late January 2006 in Western Victoria 25
Table 3.2 Tile occupancy rates of D. impar at survey sites for each
sampling period 30
Table 3.3 Results of multiple regression analysis testing for the
influence of structural vegetation characteristics on tile occupation rate of D. impar at sites
32
Table 3.4 Relationship between floristic variables and occupancy rate of
tiles by D. impar 33
Table 3.5 Results of logistic regression analysis testing for the influence
of presence/absence of other taxa and the presence/absence of D. impar under a tile
40
Table 3.6 Results of logistic regression analysis testing for the influence
of microhabitat characteristics underneath tiles and the presence/absence of D. impar
41
Table 3.7 Results of logistic regression analysis testing for the influence
of microhabitat 1m around tiles and the presence/absence of D. impar underneath tiles.
42
Table 3.8 Refuge preference by D. impar in laboratory trials. 42
14

Table of Figures Page Figure 2.1 Location of study sites in Western Victoria 10 Figure 2.2 Arrangement of roof tiles in a sampling grid for D. impar at
study sites. Each rectangle represents one tile 15
Figure 3.1 Box-plot of snout-vent lengths (SVL) for adult male and
female D. impar captured throughout survey 27
Figure 3.2 Sex ratios of D. impar captured during surveys for all sites 28 Figure 3.3 Seasonal variation in tile occupancy rate by D. impar at all
survey sites 31
Figure 3.4 Relationship between maximum vegetation height and tile
occupancy rate of D. impar at sites 32
Figure 3.5 Proportion of individuals occupying tiles at different times of
the day 34
Figure 3.6 Temperature and relative humidity outside and under tiles
occupied by D. impar 35
Figure 3.7 Relationship between temperature outside tile and
temperature under tile when D. impar is found occupying a tile
36
Figure 3.8 Relationship between relative humidity outside tile and
relative humidity under tile when D. impar is found occupying a tile
37
Figure 3.9 Proportion of individuals occupying tiles under different
cloud covers 38
15

SUMMARY The Striped Legless Lizard (Delma impar) is considered to be a flagship
species for the conservation of native lowland grasslands. It is ‘endangered’ in
Victoria and is listed as ‘threatened’ under several additional legislations. The factors
influencing the presence and detectability of Delma impar in remnant grasslands in
Western Victoria, surveyed using a passive survey technique (artificial refuges: roof
tiles), were investigated. Habitat and microhabitat characteristics, environmental
conditions, time of day, and other taxa influencing tile occupation by D. impar, were
examined for twenty roof tile grid sites. Morphometrics of D. impar were investigated
and the relationship of tile occupancy rate to abundance was considered. Refuge
preference of D. impar was determined in a laboratory experiment.
Cloud cover, temperature and relative humidity (both under and outside a tile)
appeared to influence tile occupation by D. impar. Occupation rates of tiles by D.
impar were also associated with the percentage cover of kangaroo grass (Themeda
triandra) and agricultural grass underneath tiles. A shorter maximum height of
vegetation and an increased cover of agricultural grasses around tiles increased tile
occupancy by D. impar. The degree of soil cracking under tiles negatively influenced
the presence of D. impar, as did the current or past occupancy of tiles by snakes. D.
impar showed a strong avoidance of terracotta tiles under the conditions of the
laboratory experiment, but had a strong preference for grass tussocks.
D. impar was found to be sexually dimorphic, with females the larger of the
two sexes. Sex ratios did not significantly differ from 1:1 over time or for each month
surveyed. Further investigation is warranted to determine if a relationship exists
between occupancy rates and abundance, in order to assess the effectiveness of roof
tiles as an alternative census technique.
16

Chapter 1. INTRODUCTION
Lowland remnant grasslands have significantly declined in area since
European settlement (Stuwe and Parsons 1977; Kutt 1993; Osborne et al. 1993; Smith
and Robertson 1999; Lunt 2003). As a result, they are among the most threatened
ecosystems in southern Australia (Osborne et al. 1993; Lunt 2003). Accordingly,
fauna associated with grasslands have also rapidly declined (e.g. Eulamprus
tympanum marnieae (Corangamite Water Skink), Perameles gunnii (Eastern Barred
Bandicoot), Burhinus frallarius (bush stone-curlew), which are all listed as
‘threatened’ in Victoria) (Dufty 1994; Peterson 1997; Michael et al. 2004). Among
such species is the Striped Legless Lizard (Delma impar), which is listed as
‘endangered’ in both Victoria (Flora and Fauna Guarantee Act 1988) and South
Australia (National Parks and Wildlife Act 1972) and ‘vulnerable’ in New South
Wales (Threatened Species Conservation Act 1995) and Canberra (Nature
Conservation Act 1980) (Osborne et al. 1993; Dorrough 1995; Hadden 1995; Wilson
and Swan 2003; O’Shea 2004). It is listed as ‘vulnerable’ internationally by the
ANZECC and the IUCN and by the Australian Commonwealth under the
Environment Protection and Biodiversity Conservation Act 1999 (Hadden 1995;
Wilson and Swan 2003).
The main threatening process for endangerment of D. impar in Victoria is
habitat destruction and degradation. Ploughing, pasture improvement and cropping,
extended and intense grazing, inappropriate fire regimes (applied at inappropriate
intensity, season and frequency), urban development and other heavy disturbances
significantly contribute to the decline of this species (Kutt 1993; Hadden 1995;
O’Shea 1996, 2004; Dorrough and Ash 1999; Rauhala and Andrew 1998; Smith and
Robertson 1999; Koehler 2004).
17

D. impar is currently used as a flagship species for the conservation of
grasslands (Smith and Robertson 1999). It has been acknowledged that considerable
attention is attracted towards D. impar due to the species’ ‘novelty’ (snake-like
appearance) and public appeal (Smith and Robertson 1999). Hence, research into
what may become a well-known and well-liked flagship species may be invaluable for
conservation of its native grassland habitat and the species itself (Smith and
Robertson 1999).
1.1. Delma impar
The Striped Legless Lizard (Delma impar Fischer 1882) is the most southerly
distributed member of the Pygopodidae family, which are endemic to Australia and
Papua New Guinea (Coulson 1990; Wilson and Swan 2003). D. impar is
distinguished by broad olive to brown vertebral stripes that run from the tympanum to
just beyond the vent, with dark and narrow lateral lines from the tympanum extending
towards the end of the tail (Coulson 1990; Wilson and Swan 2003). Hatchlings have
dark brown or black heads and lack the vertebral and lateral lines (Coulson 1990).
Individuals may have yellow infralabial and adjacent gular scales that extend towards
the tympanum (Coulson 1990). However, the extent of this yellow colouration varies,
and can be absent in some individuals. Tail length is generally twice the length of the
body, with total length not exceeding 306mm (Coulson 1990).
The pygopodids including D. impar are oviparous, laying a clutch size of two
eggs in late spring-summer (usually December/January), with hatching occurring in
January/February (Patchell and Shine 1986a; Smith and Robertson 1999). It has been
estimated that age at first reproduction is at 3-4 years in females and 2-3 years in
males, with adult females capable of breeding every year (Smith and Robertson 1999
18

from ARAZPA 1996). However, at present, this is only speculative and is based on
growth rates and expected life-history patterns (Smith and Robertson 1999).
Accordingly, additional aspects of the life-history (e.g. mortality, animal movement,
egg oviposition sites) of D. impar remain largely unknown (Smith and Robertson
1999).
D. impar is semi-fossorial, retreating into the soil layer or grass tussocks
during the night and active at surface level during the day (Coulson 1990; Hadden
1995; O’Shea 2004). They are thigmotherms (non-basking reptiles, maintaining body
temperature by heat exchange with the substrate) (Rawlinson 1971; Heatwole and
Taylor 1987; Coulson 1990), but have also been found to show some heliothermic
behaviours (using radiant energy for body heat by basking (Heatwole and Taylor
1987)) (Hadden 1995). D. impar also predominantly inhabits cracking clay soils
(Coulson 1990; Dorrough 1995), with cracks providing refuges during the summer
months (G. Peterson pers. comm.) and torpor sites in winter (Smith and Robertson
1999). Rocks and grass-tussock bases are also used as over-wintering sites in this
species (Smith and Roberstson 1999). Smith and Robertson (1999) suggested that the
availability of these shelter/refuges may be a key to survival in rural areas during
disturbance events (e.g. grazing, ploughing and perhaps prescribed burns).
Historically, D. impar was found only in primary grasslands. However, with
the formation of secondary grasslands (due to the removal of trees and canopy cover
in woodlands) since European settlement, D. impar has been recorded in these
recently formed vegetation communities (Coulson 1990; Dorrough 1995; Dorrough
and Ash 1999). Dorrough (1995), Hadden (1995), O’Shea (1996, 2004) and Koehler
(2004) have focused on these broad habitat relationships with D. impar, but only
Koehler (2004) looked at the habitat structure provided by the vegetation types. It has
19

been suggested that a dense and continuous structure may be more important than the
floristic composition of grassland in influencing the presence of D. impar (Smith and
Robertson 1999). Smith and Robertson (1999) indicated that further research is
required on the relationships between the structure and floristics of grasslands and the
abundance of D. impar. It was recommended that existing known populations of D.
impar be the focus of such a study.
Insufficient knowledge of the micro-habitat use of this species has also been
documented (Smith and Robertson 1999). Kerr et al. (2003) maintain that, for lizards
living in heterogeneous environments, the choice of microhabitat is dependent on
many ecological processes (e.g. exposure to predators, conspecific or interspecific
competition and temperature differences). For D. impar such predators may include
elapid snakes and dunnarts, with competitors consisting of other lizard species.
Therefore, D. impar may have quite specific microhabitat requirements (Warwick et
al. 1998; Kerr et al. 2003) that are yet to be acknowledged. Within the microhabitat,
they may even make finer choices regarding thermal properties (Schlesinger and
Shine 1994).
1.2. Census Techniques for D. impar
To estimate abundances or the presence of reptiles, passive census techniques
involving capture of individuals are generally employed (Brown and Nicholls 1993;
Blomberg and Shine 1996). In the case of D. impar, previous census techniques have
focused on pitfall trapping with drift fences (Coulson 1990; Dorrough 1995; O’Shea
1996, 2004) and rock-rolling (Beggs 1997). More recently, however, census
techniques for D. impar have began to focus on the use of artificial refuges (roof tiles)
(Koehler 2004; O’Shea 2004) as an alternative monitoring and survey method. It is
20

suggested that cover items (artificial refuges) such as wood and tin increase the ease
of capture of some elusive species (Houze and Chandler 2002; Michael et al. (2004;
Ford and Hampton 2005). However, Kunz et al. (2005) found coverboards to be poor
indicators of both population size and density for California Legless Lizards. Hence,
the effectiveness of artificial refuges (roof tiles) to determine population size and
density is currently enigmatic.
Use of various census techniques for monitoring D. impar requires careful
consideration. Trapping techniques such as pitfall traps have been acknowledged as
potentially affecting the behaviour of individuals (Sutherland 1996). Individuals such
as D. impar have been found to become trap-shy with decreased capture rates over
time (Coulson 1990; O’Shea 2004). They have also been seen to avoid drift-fences,
by springing over them (Coulson 1990). Therefore, the trap-shyness of individuals to
pitfall traps will provide underestimates of population size (Sutherland 1996).
Alternatively, survival of D. impar may be compromised within such traps by
predation and extreme weather conditions (Sutherland 1996; Houze and Chandler
2002). Conversely, roof tiles do not constrain individuals and survival is
uncompromised (Koehler 2004; O’Shea 2004). Roof tiles therefore, do not need to be
monitored as frequently as do pit-fall traps (O’Shea 2004).
Consideration must also be given to the time and labour required for
installation of the census technique and also the costs involved (Ryan et al. 2001;
Houze and Chandler 2002; O’Shea 2004). For rocky areas, such as the basalt plains or
areas with clay soils, installation of pitfall buckets can be both difficult and time
consuming (if they can be installed at all). Therefore, census techniques must be
optimal for the habitat of study sites (Ford and Hampton 2005). It is also costly for the
equipment needed, as apposed to artificial refuges, which can be brought for as little
21

as $1 each (Ryan et al. 2001; O’Shea 2004). Furthermore, artificial refuges can be
easily dispersed for broad geographic coverage (Rodda et al. 2001; G. Peterson pers.
comm.).
Additionally, the impact that the given census technique has on the habitat
must be considered. Pit-fall traps have been found to be destructive to native
grasslands, removing vegetation and disturbing the soil (O’Shea 1996; Koehler 2004).
Roof tiles on the other hand can be installed with minimal effort, and easily moved
and hence have a substantially reduced impact on threatened grassland communities
(O’Shea 1996, 2004; Koehler 2004). O’Shea (2004) commented that vegetation
disturbance by tiles only occurred in the area directly under a tile.
Different census techniques have been found to vary in their effectiveness at
detecting species (Brown and Nicholls 1993; Bailey et al. 2004; Ryan et al. 2002).
Pit-fall traps have been found to have low capture and recapture rates of D. impar
(Coulson 1990; O’Shea 2004). Koehler’s study in 2004 also achieved limited success
in capturing D. impar via the use of artificial refuges (roof tiles). This could have
been attributed to time constraints, unseasonal weather prior to and during surveying
and insufficient lag time within her study. Similarly, O’Shea (2004) only undertook
brief studies on their effectiveness, but found slightly higher captures using roof tiles
as apposed to pitfall traps with drift fences. However, both Koehler (2004) and
O’Shea (2004) maintain that artificial refuges (roof tiles) may be a successful
alternative census technique for D. impar. Additionally, other grassland species (small
vertebrates) have been found using the artificial refuges (roof tiles) (Koehler 2004).
An extensive monitoring study is therefore needed to provide insight and identify the
factors influencing the use of roof tiles by D. impar. Further research may also
confirm the validity of using roofing tiles as an alternative passive survey method.
22

1.2.1. Ecological factors influencing presence/absence and
abundances using artificial refuges
The ability of artificial refuges (roof tiles) to detect the presence/absence or
abundance of a species will depend upon several factors. These may include the
activity of the species (which can be influenced by home range or weather conditions)
and the size or habit of the species being censused (Blomberg and Shine 1996;
Howard et al. 2003; Shah et al. 2004). Additionally, the use of artificial refuges (roof
tiles) will be influenced by whether they are used as basking sites or as refuges during
inactivity periods.
The abundance of a species using an artificial refuge may also be influenced
by the quality of a refuge (e.g. vegetation cover under or around the artificial refuge
and occurrence of other animals). Furthermore, it may be attributed to the refuge
availability and refuge preference of individuals. If particular resources (refuges) are
in limited supply, then an addition of these should increase the abundance of the
species. Thus, the ability of artificial refuges to be able to determine abundances of D.
impar and covariates affecting their use requires investigation.
Alternatively, if the artificial refuges used for censusing are not the preferred
refuge of the species, an underestimation of abundance will occur. Shah et al. (2004)
have suggested that laboratory experiments be used to gain further insight into the
selection of refuges, which may remain ambiguous from field studies alone.
23

1.3. Aims The general aim of this study was to determine the factors influencing the
presence and detectability of Delma impar in remnant grasslands in Western Victoria
when surveyed using a passive survey technique.
The specific aims were to:
1. Assess the effectiveness of roof tile grids as a census technique (i.e.
determine presence/ absence and relative abundances) for D. impar
2. Describe sexual dimorphism and sex ratios of D. impar
3. Determine if occupancy rates of roof tiles by D. impar reflect their
abundances at sites
4. Determine the habitat characteristics of sites that influence occupancy
rates/abundances of D. impar
5. Determine optimal sampling conditions for monitoring of D. impar using
roof tile grids
6. Determine some of the factors that influence individual tile use by D.
impar
7. Determine microhabitat use by D. impar
8. Determine the refuge preferences of D. impar using a laboratory
experiment
24
25
Chapter 2. MATERIALS AND METHODS
2.1. Study sites Twenty sites located in Western Victoria (Figure 2.1) were selected on the
basis that they all supported extant populations of Delma impar (G. Peterson, pers.
comm.). The sites were generally long and narrow remnant grasslands, mainly
occurring on roadsides or rail reserves. A few sites also occurred on agricultural land,
which included sheep paddocks or conservation reserves (Table 2.1). In the case of
the roadsides or rail reserves, the grassland management typically involved prescribed
burns, whereas private paddocks were grazed by livestock (G. Peterson, pers. comm.)
(Table 2.1).
Physiographically, the study sites were situated in the West Victorian
Volcanic Plains division (basalt plains) (Kenley 1971) and were located within the
warm temperate bassian zoogeographic sub-region (Hadden 1995). Average annual
rainfall for the area is between 500-750mm (Hadden 1995), and elevation ranges
between 0-300m above sea level. The majority of study sites were on level to gently
undulating plains (Table 2.2) (Maher and Martin 1987). Soils were either hard pedal
duplex or shallow friable loams, with basalt or sedimentary rock origins (Table 2.2)
(Maher and Martin 1987).
The sites were characterized by either Plains Grassland, Plains Grassy
Woodland or Plains Grassland/ Plains Grassy Woodland mosaic Ecological
Vegetation Communities (EVC) (pre-1750s) (Table 2.1) (DSE 2003).

Figure 2.1: Location of study sites in Western Victoria. indicates location of study sites. (Map taken from Church 1998).
26

Table 2.1: Descriptions of study sites used in the surveys for D. impar.
Site Latitude & Longitude Ecological Vegetation Class (EVC)* Land Use Management
Activities Blacks Creek 37°36'S 143°19'W Plains Grassland/ Plains Grassy Woodland Mosaic Sheep Paddock Grazing Bochara Station 37°42'S 141°56'W Plains Grassy Woodland Rail Reserve Grazing Boonderoo Nature Reserve 37°58'S 138°02'W Plains Grassland Conservation Reserve Grazing Camperdown-Foxhow Rd #1 38°05'S 143°22'W Plains Grassland/ Plains Grassy Woodland Mosaic Roadside Prescribed Burns Camperdown-Foxhow Rd #2 38°08'S 143°16'W Plains Grassland/ Plains Grassy Woodland Mosaic Roadside Prescribed Burns Caramut-Chatsworth Rd 37°54'S 142°35'W Plains Grassland Roadside Prescribed Burns Cavendish-Dunkeld Rd 37°36'S 142°12'W Plains Grassland Roadside Prescribed Burns “Challicum Park” 37°26'S 143°09'W Plains Grassland/ Plains Grassy Woodland Mosaic Sheep Paddock Grazing Chatsworth Rd 37°55'S 143°06'W Plains Grassy Woodland Roadside Prescribed Burns Cressy Trotting Track 38°01'S 143°37'W Plains Grassy Woodland Conservation Reserve Prescribed Burns Cressy-Shelford Rd 38°01'S 143°52'W Plains Grassland/ Plains Grassy Woodland Mosaic Roadside Prescribed Burns Forest Lane 37°43'S 142°15'W Plains Grassland/ Plains Grassy Woodland Mosaic Roadside Prescribed Burns Geggies Rd 38°00'S 143°44'W Plains Grassland/ Plains Grassy Woodland Mosaic Roadside Prescribed Burns Hamilton HWY-Tea-tree Creek 37°58'S 142°34'W Plains Grassland/ Plains Grassy Woodland Mosaic Roadside Prescribed Burns Lubra Creek 37°56'S 142°30'W Plains Grassland/ Plains Grassy Woodland Mosaic Roadside Prescribed Burns Old Ararat Rd 37°37'S 127°27'W Plains Grassy Woodland Roadside Prescribed Burns Rokewood Common 37°54'S 143°43'W Plains Grassland/ Plains Grassy Woodland Mosaic Conservation Reserve Grazing Rokewood-Shelford Rd 37°54'S 143°46'W Plains Grassland/ Plains Grassy Woodland Mosaic Roadside Prescribed Burns Rossbridge Flora Reserve 37°29'S 142°52'W Plains Grassland/ Plains Grassy Woodland Mosaic State Reserve Grazing Vite Vite Rail Reserve 37°52'S 143°10'W Plains Grassy Woodland Rail Reserve Prescribed Burns
* Ecological Vegetation Class (EVC) as mapped in DSE (2003).
27

28
Table 2.2: Soils and geomorphology of the study sites used in the surveys for D. impar.
*Geomorphology and soil type as mapped and described in Maher and Martin (1987).
Site Geomorphology* Soil Type* Blacks Creek Undulating rises (basalt) Shallow friable loams with rough-ped fabric Bochara Station Undulating low hills (basalt) Hard pedal mottled-brown duplex & red smooth-ped earths Boonderoo Nature Reserve Level plains (basalt) Hard pedal mottled-black duplex Camperdown-Foxhow Rd #1 Steep high cones Shallow friable loams with rough-ped fabric Camperdown-Foxhow Rd #2 Level plains (sedimentary) Hard pedal mottled-yellow duplex Caramut-Chatsworth Rd Gently undulating plain (basalt) Hard pedal mottled-yellow duplex Cavendish-Dunkeld Rd Gently undulating plain (basalt) Hard pedal mottled-yellow duplex “Challicum Park” Gently undulating rises (basalt) Hard pedal mottled-yellow duplex Chatsworth Rd Gently undulating plain (basalt) Hard pedal mottled-yellow duplex Cressy Trotting Track Gently undulating plain (sedimentary) Hard pedal mottled-black duplex Cressy-Shelford Rd Level plains (basalt) Hard pedal mottled-black duplex Forest Lane Gently undulating plain (basalt) Hard pedal mottled-yellow duplex Geggies Rd Undulating rises (basalt) Shallow friable loams with rough-ped fabric Hamilton HWY-Tea-tree Creek Gently undulating rises (basalt) Hard pedal mottled-yellow duplex Lubra Creek Gently undulating rises (basalt) Hard pedal mottled-yellow duplex Old Ararat Rd Gently undulating plain (basalt) Hard pedal mottled-yellow duplex Rokewood Common Gently undulating rises (basalt) Hard pedal mottled-brown duplex & red smooth-ped earths Rokewood-Shelford Rd Undulating rises (basalt) Shallow friable loams with rough-ped fabric Rossbridge Flora Reserve Gently undulating rises (basalt) Hard pedal mottled-yellow duplex Vite Vite Gently undulating plain (basalt) Hard pedal mottled-yellow duplex

The sites used in this study were originally selected by the Department of
Sustainability and Environment from South-west Biodiversity Maps (Koehler 2004) on
the basis of their EVC. Coulson (1990) and Hadden (1995) previously identified plains
grasslands and grassy woodlands as habitat for D. impar.
The dominant vegetation species at many of these sites was Themeda triandra
(Kangaroo grass) or other short to medium tussock-forming grasses (e.g. Poa spp., Stipa
spp.). However, agricultural grasses had become more wide-spread at some of the sites
(e.g. Rossbridge Flora Reserve and Old Ararat Rd.) and only small patches of T. triandra
remained.
2.2. Artificial refuge (roof tile) census
2.2.1. Tile grid arrangement A grid consisting of fifty artificial refuges (roof tiles), which were either concrete
(450 x 275mm) or terracotta (430 x 340mm) were used to survey D. impar at the sites.
Tiles were arranged in five rows, which consisted of ten tiles in each row (Fig 2.2). Grids
were established in July 2003 sixteen months prior to the study by the Department of
Sustainability and Environment (DSE) and Koehler (2004) as part of a large scale survey
for D. impar across South Western Victoria (G. Peterson pers. comm..). Some tiles were
replaced during the survey period due to damage sustained from either cattle, vehicles or
machinery. Tiles were spaced 5m apart and covered an area of 900m2 (refer to Koehler
2004). Individual tiles were also given reference numbers using the Cartesian system,
with (0,1) being located at the bottom left-hand corner of a grid and (4,10) in the top
24

right-hand corner (Koehler 2004). These reference numbers were then used to identify
individual tile occupation by animals during the sampling period.
Figure 2.2: Arrangement of roof tiles in a sampling grid for D. impar at study sites. Each rectangle represents one tile. Total number of tiles in a grid =50.
2.2.2. Sampling Programme
Between nine and eighteen surveys of each site were conducted from 28
September 2005- 22 January 2006 to establish the occupation of tiles by small vertebrates
on a monthly basis. Sites were surveyed for small vertebrates by lifting roofing tiles at
least once per month. This occurred over a three-five day period (Appendix I), generally
between 0800hrs and 1800hrs. The only exceptions were in January, where, due to
extreme temperatures, surveys were restricted from sunrise until early afternoon. Ten
sites in close proximity to each other were surveyed during the first week of each
sampling period, followed by the other ten sites in the following week.
25

The order in which sites were checked was randomized (some constraints were
imposed on the degree of randomization due to large travel distances between sites). It
was intended that ten sites would be sampled per day, however, due to D. impar captures
and travel distances, this was not always possible.
2.2.3. Time, weather condition, temperature and relative humidity under and outside tiles For each day of sampling, all fifty roof tiles at a grid site were checked. Standard
site variables were taken at the commencement and finish of each grid survey at tile (0,1).
These variables included ambient air and substrate temperatures (°C) and ambient air and
substrate relative humidities (%).Cloud cover (none, patchy-light, patchy-heavy or
overcast), solar radiation (direct sun, breaks or filtered sun), wind speed and direction,
and time of day were also recorded within each grid. Wind speed, air temperature and
relative humidity were measured using a pocket weather meter (Kestrel® 3000), while
substrate temperature and substrate relative humidity were measured using a thermo-
hygrometer (AEMC Instruments® CA846) underneath tiles. The tiles were then
systematically checked by lifting the tiles to observe if any small vertebrates were
occupying the cavity beneath the tile. The tile was then placed back in its original
position.
2.2.4. Capture and measurements Small vertebrates (excluding elapid snakes), when discovered under a tile were
caught by hand. Each individual was then identified by reference to standard field guides
(Cogger 2000), sexed when possible (presence or absence of hemipenes for lizards and
teste for small mammals) and classified as either adult or juvenile. The grid reference
number of the tile under which they were found was also recorded. Once checked, each
26

tile was placed back in its original position and the small animal was released
immediately at the point of capture.
Each of the previously described weather and temperature measurements (refer to
section 2.2.3) were taken on each occasion a D. impar was found under a tile. The
temperature and humidity under the tile were also taken from the exact location the D.
impar was found.
After capture, D. impar were measured. Measurements included snout-vent length
(SVL), tail length (measured from cloaca to the undamaged tip of the tail), tail
regeneration length, head length (measured from snout to anterior edge of ear opening),
head width (across temporal jaw bulge) and head depth (measured at deepest point
anterior to the posterior edge of the parietal scales) (Thorpe 1975; Peterson 1997). The
last three were measured using digital calipers (Mitutoyo®) to the nearest 0.1mm, while
all other measurements were taken using a metal ruler to the nearest 1mm. All individuals
were weighed using electronic scales (A.N.D® HL-400) to the nearest 0.1g and sexed
using a dissecting microscope. D. impar were sexed according to the presence or absence
of cloacal spurs under the vestigial limb flaps (with cloacal spurs occurring only in
males) (Rauhala and Andrew 1998). Digital photographs of dorsal and lateral colours and
marking patterns were taken to describe individuals and to assist in the identification
process. Individuals were then marked for recapture studies (refer to section 2.2.5).
2.2.5. Mark- recapture Pyro-branding and freeze-branding have been the most commonly used methods
for marking D. impar (Kutt 1992; Nunan 1995; O’Shea 1996, 2004; Hadden, 1995;
Dorrough 1995). However, O’Shea 2004 found that pyro-brands were becoming less
27

visible after eight months. For an endangered species such as D. impar, long-term
monitoring is important, especially for the development of a recovery plan. For this
reason, head scale pattern mapping was used to assess the recapture of individuals, as it
has been found to be an adequate and effective method for identifying individuals
(Coulson 1990; O’Shea 2004) and will also allow long-term monitoring of survival and
estimations of population size.
Head scale pattern maps of D. impar consisted of a photograph taken in the field
by a digital camera (Ricoh® Caplio R1v), which was optically zoomed in on the dorsal
head scales of the individual. Photos were checked immediately for clarity and repeated if
necessary. Images were later filed into directories corresponding to the dates on which
they were taken and saved digitally. Records were kept to maintain the relationship
between the images and individual animals.
Nail polish was used to identify recaptures within each five day sampling period
to avoid repeating measurements on the same individual (Coulson 1990). A small dot was
painted on the posterior lateral tip of the tail, which appeared to disappear by the end of
the five day sampling period.
2.3. Habitat characteristics
In order to relate the abundances of D. impar to vegetation characteristics, a
transect line was placed diagonally through the grid from one corner (at tile (0,1)) to the
opposite corner (at tile (4,10)). A series of 1m2 quadrats were then placed at 5m intervals
starting at 3.5m. Overall, a total of twenty quadrats were used at each site for every
month of habitat monitoring (October, December and January). At each 5m mark, a
28

quadrat was placed either side of the transect line. Subsequent measurements of
maximum vegetation height (including seed heads), minimum vegetation height and the
mean height of the dominant species were made using a 1m ruler. The dominant species
within each quadrat was also recorded. Samples were sometimes collected for later
identification. Additionally a photo-plot was taken of each quadrat using a digital camera
(Ricoh® Caplio R1v) to estimate percentage cover of vegetation, bare ground and basalt
rock. Microsoft Windows® Picture and Fax Viewer was used to view photos during
recording of these data. The photo-plots are useful in time-constrained circumstances and
enable long-term monitoring of sites (Koehler 2004).
The mean value of the variables of all twenty quadrats for a site, were taken for
each of the five habitat variables to be used in the analysis. This was done for each of the
three habitat survey months. This provided a representation of the habitat over the whole
tile grid, rather than a single patch within the grid.
2.4. Microhabitat characteristics under and around tiles To assess microhabitat use by D. impar, twenty tiles were photographed at each
site for three sampling periods (November, December and January) using a digital
camera (Ricoh® Caplio R1v). These tiles were selected using randomly generated
numbers from Microsoft Excel®, regardless of whether D. impar had utilized them or not,
with a different random number set used for each month. Two photos were taken at each
tile. The first provided an image of the microhabitat directly under the tile, while the
second provided an image of the microhabitat approximately 1m2 around the tile. These
were always taken from the same height (approx 140cm) and angle (approx. 45°). Photos
29

were also taken at any tile under which a D. impar was found throughout the study
period. These photos were used to record microhabitat characteristics influencing
presence/absence (or presence/ non-detection) of D. impar. This was performed using
Microsoft Windows® Picture and Fax Viewer. These variables included the number of
soil cracks, basalt rock cover, tussock-forming grass cover and non-tussock-forming
grass cover. A grid composed of 2cm squares (on overhead projector transparency) was
used to score the degree of soil cracks present under and around tiles. All photos were
enlarged to full screen size (15” @ 1024x768).
Other taxa present under the randomly selected tiles (namely spiders (redback and
wolf), snakes, frogs, other lizard species, mammals, centipedes and ants) were also
recorded.
2.5. Refuge preference of Delma impar A laboratory experiment was undertaken in order to determine refuge preference
by D. impar. Twenty-five D. impar were obtained from Melbourne Zoo, Parkville for use
in the refuge preference experiment. The majority of adult animals came from building
salvage sites in Victoria. Juveniles were bred from the captive colonies at the Zoo.
2.5.1. Captive maintenance
Animals were housed in individual plastic containers (29 x 21.5 x 9.5cm) with a
hole cut out in the lid (approximately 8 x 15cm) which was covered with fly-wire mesh.
These containers were kept on the shelves of a wooden rack. A thermal gradient (23°C-
28°C) was created in the containers using heating strips placed under the containers at
one end, from 0900hrs until 1700hrs. The heating strips were turned off during the night
30

and containers were allowed to cool to room temperature (22°C). A natural day/night
cycle was produced using light from two large nearby windows. Moist palm peat was
used to line the bottom 3cm of the containers, with coconut fibre filling half of the
remaining volume of the container. Water was available ad libitum and was changed on a
daily basis. Approximately four small crickets (1cm long) were supplied every 2-3 days.
The palm peat was also moistened every 2 days using a spray bottle.
2.5.2. Experimental design
Refuge preference experiments were conducted from 15 March- 22 March 2006.
Four refuge types (2 natural and 2 artificial) were used in the choice experiments. Each
refuge was placed into an arena (119 x 60 x 21cm) made from MDF wood. A total of
four arenas (which were joined together) were used to test four individuals
simultaneously. The artificial refuges provided in each arena consisted of a terracotta roof
tile (430 x 340cm) and a concrete roof tile (450 x 275cm). Natural refuges consisted of a
basalt rock which occurred at some sites (similar in size but ranging from (28 x 22 x
9cm) to (37 x 24x 12cm)) and a grass tussock (Themeda triandra, 8cm diameter, 15cm
high). The positions of these were randomized in each successive trial. A small layer
(approx 1cm in depth) of palm peat was used to line the base of each arena and mixed
prior to each trial to destroy any chemical trails. The experiment was carried out at a
constant temperature of 24°C, with an approximately natural photoperiod (daylight:
0700hrs- 2000hrs).
Single animals were placed in the centre of an arena at approximately 1000hrs
and were checked for refuge use at approximately 0900hrs the following morning.
31

Substrate temperature (°C) and relative humidity (%) under tiles/rocks and at the base of
the tussock was recorded using a thermo-hygrometer (AEMC Instruments® CA846).
Following each trial, all tiles and basalt rocks were soaked in hot water
(containing hospital grade disinfectant) for at least 30 minutes in order to remove any
chemical scents. These were then scrubbed, soaked again for about 10 minutes, rinsed
and then air dried.
2.6. Statistical analysis
All data were analyzed using the statistical program SPSS for Windows® (Version
12). Normality and homoscedasticity tests were performed on all data sets (Dytham 1999;
Quinn and Keough 2002; Pallant 2005) except for the presence/absence data. Normality
was assessed using the Kolmogorov-Smirnov test, while homoscedasticity was assessed
using Levene’s Test (Pallant 2005). In regression analyses, residual plots were used to
test the model assumptions of normality and homoscedasiticity.
Because most of the data sets were not homogeneous or normally distributed and
transformations were unsuccessful, nonparametric statistical tests were used (Dytham
1999). An alpha level of significance was set at 5%, except for where Bonferonni
adjustments were made to eliminate type 1 errors (Zar 1999; Quinn and Keough 2002).
A Friedman Test was used to determine if the occupancy rate differed seasonally.
Wilcoxon signed pairs tests were then used as non-parametric post-hoc tests. Bonferroni
corrections were made to the significance level according to the number of Wilcoxon
tests performed.
32
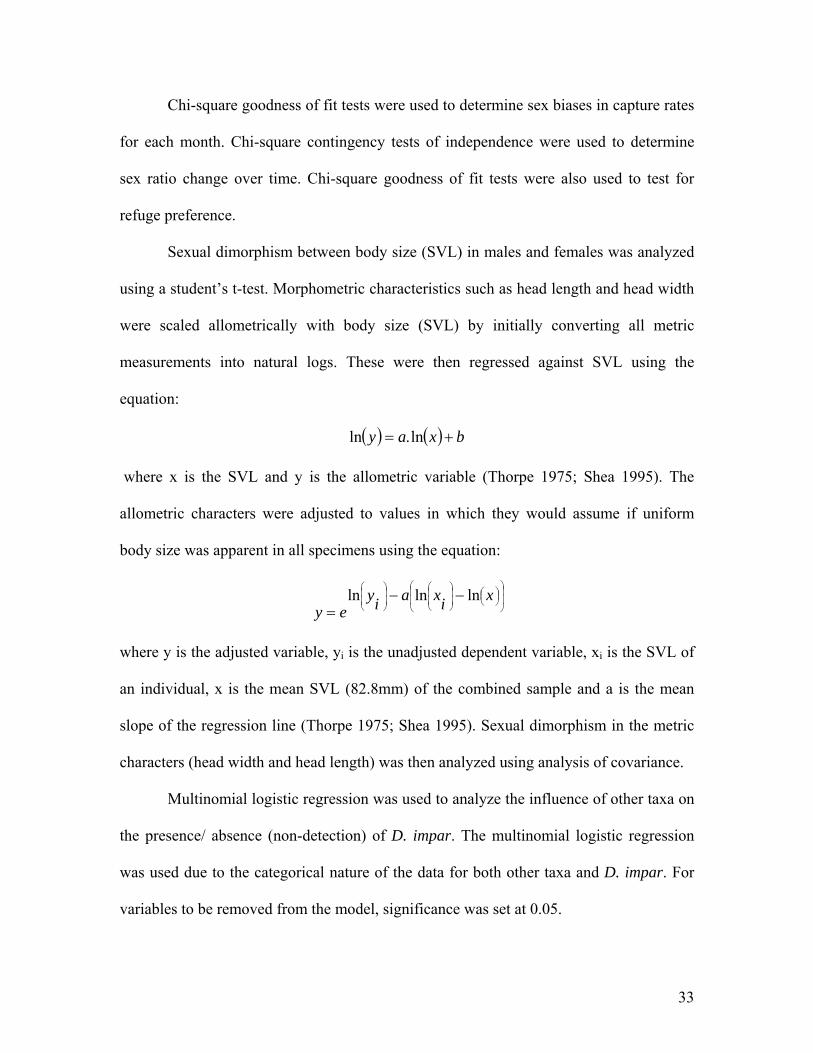
Chi-square goodness of fit tests were used to determine sex biases in capture rates
for each month. Chi-square contingency tests of independence were used to determine
sex ratio change over time. Chi-square goodness of fit tests were also used to test for
refuge preference.
Sexual dimorphism between body size (SVL) in males and females was analyzed
using a student’s t-test. Morphometric characteristics such as head length and head width
were scaled allometrically with body size (SVL) by initially converting all metric
measurements into natural logs. These were then regressed against SVL using the
equation:
( ) ( ) bxay += ln.ln
where x is the SVL and y is the allometric variable (Thorpe 1975; Shea 1995). The
allometric characters were adjusted to values in which they would assume if uniform
body size was apparent in all specimens using the equation:
⎟⎟
⎠
⎞
⎜⎜
⎝
⎛⎟⎠⎞⎜
⎝⎛
⎟⎟⎠
⎞⎜⎜⎝
⎛⎟⎟⎠
⎞⎜⎜⎝
⎛−−
=xixaiy
eylnlnln
where y is the adjusted variable, yi is the unadjusted dependent variable, xi is the SVL of
an individual, x is the mean SVL (82.8mm) of the combined sample and a is the mean
slope of the regression line (Thorpe 1975; Shea 1995). Sexual dimorphism in the metric
characters (head width and head length) was then analyzed using analysis of covariance.
Multinomial logistic regression was used to analyze the influence of other taxa on
the presence/ absence (non-detection) of D. impar. The multinomial logistic regression
was used due to the categorical nature of the data for both other taxa and D. impar. For
variables to be removed from the model, significance was set at 0.05.
33

Binary logistic regression was used to analyze microhabitat characteristics under
tiles. It was also used to analyze microhabitat characteristics around (outside) tiles to
determine the influence of microhabitat choice within the habitat on tile use by D. impar.
Multiple linear regression (backward stepwise) was used to determine the
influence of habitat variables on the occupation rate of tiles by D. impar. This was
undertaken for structural components (vegetation height and cover, basalt rock cover and
bare ground). Scatterplots were used for floristic characteristics (vegetation cover of
species).
34

35
Chapter 3. RESULTS
3.1. Census data 3.1.1. All Small terrestrial vertebrates A total of 278 grid surveys (between nine and eighteen per site) were undertaken
from 28 September 2005 - 22 January 2006. This resulted in a total of 13,900 roof tiles
being checked over the survey period. A total of 964 animals were encountered under
tiles over the entire survey period, with 14 different species recorded (Table 3.1). These
comprised of 9 reptilian, 3 amphibian and 2 mammalian species (Table 3.1). The
occupancy rate per grid site (or per 50 tiles) for all taxa was 3.04 individuals, with 2.71
reptiles, 0.18 amphibians and 0.15 mammals encountered for every 50 tiles surveyed.
Egernia whitii (White’s skink) and Pseudemoia pagenstecheri (Tussock Skink)
were the most commonly encountered species. These were followed by Delma impar
(Table 3.1).
3.1.2. Delma impar across sites
Overall, a total of 156 D. impar were encountered under roof tiles, which resulted
in an occupancy rate of 0.56 individuals per grid site (= 50 tiles) (Table 3.1). Twenty-six
sloughed skins of D. impar were also recorded under tiles. Of the 156 individuals
encountered, 92 were captured and measured. At least seventeen of these were recaptured
over the three-five day period of each survey. The remainder either escaped down
burrows located underneath tiles, down soil cracks or into the surrounding vegetation.
Due to time constraints, no mark-recapture analysis was undertaken. This may
have allowed more individuals being recognized as recaptures.

36
Table 3.1: Fauna recorded under artificial refuges (roof tiles) from late September 2005 to late January 2006 in Western Victoria. Occupancy rate is the number of individuals (known recaptures included) per grid site (= 50 tiles). (Total number of tiles turned = 13,900)
Species Common Name Total Number of Individuals Occupancy Rate
Pygopodidae Delma impar Striped Legless Lizard 156 0.56
Scincidae Egernia whitii White's Skink 236 0.85 Pseudemoia pagenstecheri Tussock Skink 187 0.67 Bassiana duperreyi Eastern Three-lined Skink 24 0.09 Pseudemoia entrecasteauxii Southern Grass Skink 3 0.01 Tiliqua nigrolutea Blotched Blue-tongue 3 0.01 Tiliqua rugosa Shingleback 2 0.01 Unidentified skinks 143 0.51 Elapidae Austrelaps superbus Lowland Copperhead 67 0.24 Suta flagellum Little Whip Snake 52 0.19 Myobatrachidae Limnodynastes tasmaniensis Spotted Marsh Frog 34 0.12 Crinia signifera Common Froglet 14 0.05 Hylidae Litoria ewingii Southern Brown Tree Frog 1 0.004 Dasyuridae Sminthopsis crassicaudata Fat-tailed Dunnart 4 0.01 Muridae Mus musculus House Mouse 35 0.13 Unidentified small mammals 3 0.01
Total
964
3.47

3.2. Morphometrics of Delma impar
Of the 92 D. impar captured, 84 individuals were adults, comprising 40 males and
44 females. Juveniles (SVL < 70mm) were comprised of 7 males and 1 female. One male
was assumed to be a first year juvenile (SVL 58mm), while the rest were assumed to be
second year juveniles (SVL 60-69mm). Ninety-one percent of individuals captured
underneath artificial refuges (roof tiles) were mature.
Snout-vent lengths of captured individuals ranged from 58mm to 100mm. When
juveniles were excluded (SVL < 70mm), adult female SVL ranged from 72mm to 100mm
and adult male SVL ranged from 70mm to 91mm (Figure 3.1).
SVL in females ( X = 87.1mm) was found to be significantly longer than in males
( X = 78.1mm) (t-test (equal variances not assumed) t=6.072, df=77.394, p<0.001).
Therefore, because the SVL was found to be different between males and females, further
tests were conducted on head width and head length of the two sexes. Sexual dimorphism
was found in only one adjusted metric character. Head length was found to be
significantly larger in females (ANCOVA; F1,84=8.028, p=0.006), but head width was not
significantly different (ANCOVA; F1,84=0.271, p=0.604).
37

Female Male
Sex
70.0
75.0
80.0
85.0
90.0
95.0
100.0
SVL
(mm
)
Figure 3.1: Box-plots of snout-vent lengths (SVL) for adult male and female D. impar captured throughout the survey (females n=44; males n=40). Horizontal bar = median; box = first quartile (lower edge) to third quartile (upper edge) and whiskers = range.
3.2.1 Sex Ratios of adult D. impar
An overall sex ratio of 1:1 was found over the survey period. The sex ratio of D.
impar did not change significantly over time (χ2=5.192, df=3, p=0.158) and was not
significantly different from a 1:1 ratio in early October (χ2=0.474, df=1, p=0.491), late
October (χ2=0.231, df=1, p=0.631) and November (χ2=2.667, df=1, p=0.102) (Figure
3.2). December was excluded from this analysis due to the small sample size of D. impar
caught within this period.
38

39
The occupancy rate of D. impar was found to be significantly different between
sites (Kruskal-Wallis Chi-square χ2=104.743, df=19, p<0.001), with occupancy rates
ranging between 0.06-2.9 individuals (Table 3.2). Large differences in occupancy rates
were also found between some sampling periods, within a single site (e.g. “Challicum
Park”: 0.50-5.50) (Table 3.2). “Challicum Park” and Caramut-Chatsworth Rd. sites had
the highest occupancy rate of D. impar throughout the study with mean occupancy rates
of 2.90 and 2.08 individuals respectively (Table 3.2). These sites had relatively large
numbers of D. impar recorded across all sampling periods (except December and
January) (Table 3.2). Other sites (e.g. Lubra Creek, Blacks Creek and Rokewood-
3.3.1 Tile Occupancy Rates for D. impar
3.3. Habitat characteristics of sites and occupancy rates
Figure 3.2: Sex ratios (%) of adult D. impar captured during surveys for all sites. Total number of individuals (n) are shown.
0
20
40
60
80
100
120
Early Oct. Late Oct. Nov. Dec.
nth
Perc
enta
ge
Mo
MaleFemale
(n=19) (n=39) (n=24) (n=2)

40
Table 3.2: Tile occupancy rates of D. impar at survey sites for each sampling period. Occupancy rate is the mean number (±SD) of D. impar for every 50 tiles checked (=grid site). Occupancy rate includes recaptured individuals.
Occupancy rate for each sampling period
Site Total no. of tiles checked
Site occupancy rate Early Oct. Late Oct. Nov. Dec. Jan.
Blacks Creek 450 0.22 ± 0.44 1.00 ± 0.00 0.50 ± 0.71 0 0 0 Bochara Station 550 1.27 ± 1.01 1.00 ± 0.00 1.50 ± 0.71 2.00 ± 1.41 1.67 ± 1.16 0 Boonderoo Nature Reserve 750 0 0 0 0 0 0 Camperdown-Foxhow Rd #1 750 0.60 ± 0.91 1.25 ± 1.50 0.67 ± 0.58 0.50 ± 0.71 0.33 ± 0.58 0 Camperdown-Foxhow Rd #2 750 0 0 0 0 0 0 Caramut-Chatsworth Rd 650 2.08 ± 2.53 1.00 ± 0.00 5.50 ± 3.54 4.00 ± 1.73 0.67 ± 1.16 0 Cavendish-Dunkeld Rd 550 1.27 ± 1.19 1.50 ± 0.71 2.00 ± 1.41 2.50 ± 0.71 0.67 ± 1.16 0 “Challicum Park” 500 2.90 ± 3.67 5.50 ± 4.95 5.50 ± 6.36 3.00 ± 0.00 0 0.50 ± 0.71 Chatsworth Rd 850 0 0 0 0 0 0 Cressy Trotting Track 900 1.17 ± 1.34 0.25 ± 0.50 1.40 ± 0.89 2.33 ± 2.31 1.33 ± 1.53 0.67 ± 1.16 Cressy-Shelford Rd 800 0 0 0 0 0 0 Forest Lane 550 0.36 ± 0.50 0 1.00 ± 0.00 1.00 ± 0.00 0 0 Geggies Rd 900 0.22 ± 0.55 0.50 ± 1.00 0.20 ± 0.45 0.33 ± 0.58 0 0 Hamilton Hwy- Tea-tree Creek 600 0 0 0 0 0 0 Lubra Creek 650 0.23 ± 0.44 0 0.50 ± 0.71 0.67 ± 0.58 0 0 Old Ararat Rd 600 0.67 ± 0.78 0.50 ± 0.71 1.00 ± 0.00 1.50 ± 0.71 0.67 ± 1.16 0 Rokewood Common 900 0.22 ± 0.65 0 0.40 ± 0.89 0.67 ± 1.16 0 0 Rokewood-Shelford Rd 900 0.11 ± 0.32 0 0 0.33 ± 0.58 0 0.33 ± 0.58 Rossbridge Flora Reserve 500 1.30 ± 1.34 2.00 ± 0.00 3.00 ± 1.41 2.00 ± 0.00 0 0.33 ± 0.58 Vite Vite Rail Reserve 800 0.06 ± 0.25 0 0.25 ± 0.50 0 0 0
Total 13900 0.56 ± 1.28 0.56 ± 1.38 0.87 ± 1.76 1.02 ± 1.41 0.28 ± 0.73 0.09 ± 0.35

Shelford Rd.) had relatively small numbers recorded across all sampling periods (Table
3.2). At some sites (e.g. Rokewood-Shelford Rd, Blacks Creek and Vite Vite Rail
Reserve), individuals were also recorded only during some sampling periods and not
others (Table 3.2). Alternatively, D. impar was not recorded at five sites (25%) over the
entire sampling period (Table 3.2). D. impar had been recorded at these sites but in low
numbers only twelve months prior to the current study (G. Peterson pers. comm.). Sites in
which D. impar were not recorded included Boonderoo Nature Conservation Reserve,
Cressy-Shelford Rd. #3, Camperdown-Foxhow Rd. #2 and Hamilton Hwy-Tea-tree
Creek. D. impar was also not encountered at Chatsworth Rd. in this study; however, a
single sloughed skin was found underneath a tile.
3.3.2 Seasonal Occupancy rates
The occupancy rate of tiles by D. impar was found to increase during spring
(October and November), but decline substantially in summer (December and January)
(Figure 3.3). It was also significantly different among sampling periods (Friedman’s test
χ2=32.7, df=4, p<0.001) (Figure 3.3). Significantly more individuals were recorded in
November than in early October (Wilcoxon signed rank test Z=-2.894, p=0.004) and
December (Z=-3.068, p<0.002). Therefore, in order to minimize the number of pairwise
comparisons, the occupancy rate of tiles in January would also be significantly different
to November. There was also no significant difference in occupancy rates between early
October and late October (Wilcoxon signed rank test Z=-1.077, p=0.281) or early
October and December (Z=-0.440, p=0.660).
41

Early October Late October November December January
Sampling Period
0
0.25
0.5
0.75
1
1.25
Occu
panc
y Rate
of D
. impa
r
Figure 3.3: Seasonal variation in tile occupancy rate by D. impar at all survey sites. Occupancy rate is the mean number of individuals per grid site (= 50 tiles) (±SE).
3.3.3 Structural habitat characteristics
A total of 1200 quadrats were analyzed to assess the influence of structural
attributes of the vegetation on occupation rates at sites.
Multiple regression analysis using the structural characteristics of the vegetation
on site occupancy rate indicated that only the maximum vegetation height was significant
(Table 3.3). The maximum vegetation height (cm) was negatively associated with D.
impar occupancy rate (Figure 3.4). With increasing vegetation height at sites, the number
of D. impar recorded under tiles declined (y=2.463-0.031x; r2=0.155, F1,55=10.073,
42

p=0.002, Figure 3.4). However, maximum vegetation height explained only 14.1% of the
variation in the occupancy rate of D. impar at a site.
Table 3.3: Results of multiple regression analysis testing for the influence of structural vegetation characteristics on tile occupation rate of D. impar at sites. t statistics indicate the contribution that the variable would make to the overall model (if included); bold values indicate p<0.05.
Independent Variable B t statistic P Maximum vegetation height (cm) -0.031 -3.174 0.002 % Cover of bare ground -0.078 -0.596 0.553 Dominant vegetation height (cm) -0.068 0.435 0.665 Minimum vegetation height (cm) -0.059 -0.417 0.678 % Cover of basalt rocks 0.030 0.240 0.811 Constant 2.463 3.844 <0.001
30.00 40.00 50.00 60.00 70.00 80.00 90.00 100.00
Maximum Vegetation height (cm)
0.00
1.00
2.00
3.00
4.00
5.00
6.00
Occ
upan
cy ra
te
R Sq Linear = 0.141
Figure 3.4: Relationship between maximum vegetation height (cm) and tile occupancy rate of D. impar at sites.
43

3.3.4. Floristic habitat characteristics
Scatterplots were initially used to explore relationships between the different
species and the occupancy rate of tiles by D. impar (Appendix II). However, less than a
3% relationship was found between occupancy rates and each of the variables (Table
3.4). Subsequently, multiple regression analysis was not undertaken.
Table 3.4: Relationship between floristic variables and occupancy rate of tiles by D. impar. Variables represent percent cover of species.
Independent variable R2 Value
Agricultural grasses 0.021
Austrodanthonia spp. 0.003
Daisy species 0.004
0.001 Eryngium ovinum
0.019 Phalaris aquatica
Plantago spp. 0.014
0.002 Poa spp.
Stipa spp. 0.032
0.016 Taraxicum officinale
0.008 Themeda triandra
3.4. General tile use
3.4.1 Weather conditions and time of day
Fifty-seven percent of individuals were found to be occupying tiles between
1100hrs and 1500hrs (Figure 3.5). The number of individuals was found to increase
during the morning, peak at midday (between 1100hrs and 1300hrs) and then decline
again in the afternoon (first at 1300hrs, then further at 1500hrs) (Figure 3.5).
44

Figure 3.6 illustrates the environmental conditions under and outside tiles when
tiles were occupied. When the temperature under tiles exceeded 15°C, the number of
individuals increased substantially (Figure 3.6c). This was also the case for temperature
outside of tiles (ambient air) (Figure 3.6a). A considerable increase was also recorded
when temperature under tiles was between 20-24.9°C (Figure 3.6c), and a decline in the
number of individuals was found to occur when temperature outside tiles exceeded 30°C
(Figure 3.6a). However, temperatures over 30°C were only recorded in summer and
observations within these temperatures were limited to only a few. The majority (71.6%)
of tile occupations occurred when temperature outside tiles was between 15°C and
24.9°C (Figure 3.6a). Tile occupation also increased markedly when relative humidity
outside tiles was between 40-49.9% (Figure 3.6b). Relative humidity under tiles appeared
to have little influence on tile occupancy (Figure 3.6d).
45
0
5
10
15
20
0700
-0759
0800
-0859
0900
-0959
1000
-1059
1100
-1159
1200
-1259
1300
-1359
1400
-1459
1500
-1559
1600
-1659
1700
-1759
Time (hrs)
Perc
enta
ge
n=1
n=11 n=10 n=11
n=24
n=29
n=16n=20
n=12 n=12n=9
Figure 3.5: Proportion of individuals occupying tiles at different times of the day. Percentage and total number (n) of individuals are shown for each interval. Time is Australian Eastern Standard Time.

46
a) b)
05
101520253035404550
10-14.9 15-19.9 20-24.9 25-29.9 30-34.9 35-39.9
Temperature outside tiles (oC)
Perc
enta
ge
n=11
n=50
n=61
n=32
n=1 n=0
05
101520253035404550
20-29.9 30-39.9 40-49.9 50-59.9 60-69.9 70-79.9 80-89.9 90-100
Relative humidity outside tiles (%)
Perc
enta
ge
n=3
n=15
n=70
n=38
n=20
n=7n=2 n=0
c) d)
05
101520253035404550
10-14.9 15-19.9 20-24.9 25-29.9 30-34.9 35-39.9
Temperature under tiles (oC)
Perc
enta
ge
n=27
n=3
n=39
n=25
n=4
n=58
05
101520253035404550
30-39.9 40-49.9 50-59.9 60-69.9 70-79.9 80-89.9 90-100
Relative humidity under tiles (%)
Perc
enta
gen=5
n=10n=17
n=37n=29 n=29 n=28
Figure 3.6: Temperature and relative humidity outside (a & b) and under (c & d) tiles occupied by D. impar. Percentage and total number (n) of individuals are shown for each interval.

Figures 3.7 and 3.8 show the regression analyses used to determine differences
between temperatures (°C) and relative humidities (%) under and outside tiles. The
temperature under a tile (°C) was significantly warmer than that of the temperature
outside a tile (°C) by about 2-3°C (y=1.938+1.055x; r2=0.717, F1,154=384.517, p<0.001,
Figure 3.7). However, when ambient air temperatures are below 16°C, substrate
temperatures appear to be very similar to that of the ambient air (Figure 3.7). The relative
humidity under a tile (%) was also significantly higher than the relative humidity outside
of a tile (%) by about 25-26% (y=26.527+0.916x; r2=0.373, F1,154 =90.543, p<0.001,
Figure 3.8).
10.00 15.00 20.00 25.00 30.00 35.00
Temperature outside tile (°C)
10.00
15.00
20.00
25.00
30.00
35.00
40.00
Tem
pera
ture
und
er ti
le (°
C)
R Sq Linear = 0.717
Figure 3.7: Relationship between temperature outside tile (°C) and temperature under tile (°C) when D. impar is found occupying a tile.
70

20.00 30.00 40.00 50.00 60.00 70.00 80.00 90.00
Relative humidity outside tile (%)
20.00
40.00
60.00
80.00
100.00
Rel
ativ
e hu
mid
ity u
nder
tile
(%)
R Sq Linear = 0.373
Figure 3.8: Relationship between relative humidity outside tile (%) and relative humidity under tile (%) when D. impar is found occupying a tile.
The amount of cloud cover appeared to influence observations of D. impar
underneath tiles (Figure 3.9). Occupancy of tiles was approximately 53% higher on
overcast days than when no cloud cover was present, with 54% of individuals recorded at
this cloud cover (Figure 3.9). A further 29% of all D. impar were observed underneath
tiles when cloud cover was patchy-heavy. These results indicate that D. impar are more
likely to utilize tiles when more cloud cover is present and are seemingly avoiding tiles
when there is no cloud cover (Figure 3.9).
71

0
10
20
30
40
50
60
None Patchy-light Patchy-heavy Overcast
Cloud Cover
Perc
enta
ge
n=5
n=21
n=45
n=83
Figure 3.9: Proportion of individuals occupying tiles under different cloud covers. Percentage and total number (n) of individuals are shown for each interval.
3.5. Individual tile use
3.5.1. Influence of other animal taxa
In total, 1353 tiles were used to determine the influence of the presence or
absence of other taxa on the presence or absence of D. impar under a tile. D. impar
occurred under 290 or 21.4% of these tiles.
A stepwise backward Wald logistic regression was used and all taxa entered
originally as both main effect and as two-way interactions. Because the two-way
interactions produced no significant difference to the model, producing high p values,
they were subsequently removed from the model.
Initially all potential predators or competitors that might influence utilization of
tiles by D. impar were included in the analysis. However, after closer inspection, the fat-
tailed dunnarts (Sminthopsis crassicaudata) were removed due to the extremely small
numbers recorded.
72

The presence or absence of D. impar under an individual tile was found to be
influenced by the utilization of the tile by snakes (Austrelaps superbus and Suta
flagellum) and redback spiders (Latrodectus hasselti) (Table 3.5). Positive B values
(Table 3.5) indicate that the taxa have a positive relationship with the presence of D.
impar. The inverse of this applies to a negative B value (Table 3.5). Where the Exp(B)
value is less than one, increasing numbers of that taxa will result in a decreased
probability of D. impar being present. When the Exp(B) value is greater than one,
increasing numbers of that taxa will result in an increased probability of D. impar being
present. Therefore, snakes showed a negative relationship with D. impar (Table 3.5).
Tiles which a snake currently or previously occupied were less likely to be used by D.
impar. Additionally, if the number of snakes at a site increased, the probability of D.
impar being present under tiles would decrease (Table 3.5).
D. impar and redback spiders were found to have a positive relationship, resulting
in an increased likelihood of finding D. impar underneath a tile when redback spiders
were present (Table 3.5). Other taxa that were found underneath tiles, did not
significantly influence whether D. impar was present or absent from that tile (Table 3.5).
Ants were expected to have a negative influence on the presence of D. impar.
However, the results showed no significant influence (Table 3.5). This result may be
speculative, because all ant species were pooled in order to limit the number of variables.
Thus, individual ant species and their numbers (i.e. colonies or individuals) were not
distinguished due to the pooling process.
73
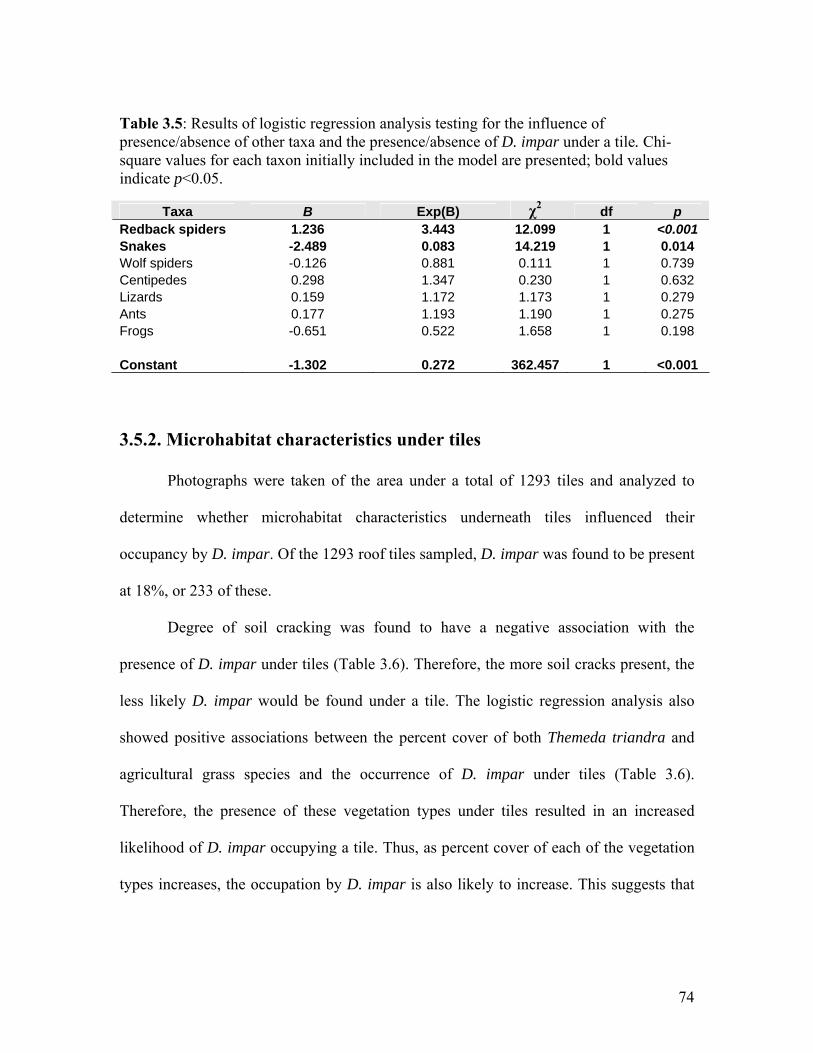
Table 3.5: Results of logistic regression analysis testing for the influence of presence/absence of other taxa and the presence/absence of D. impar under a tile. Chi-square values for each taxon initially included in the model are presented; bold values indicate p<0.05.
Taxa B Exp(B) χ2 df p Redback spiders 1.236 3.443 12.099 1 <0.001 Snakes -2.489 0.083 14.219 1 0.014 Wolf spiders -0.126 0.881 0.111 1 0.739 Centipedes 0.298 1.347 0.230 1 0.632 Lizards 0.159 1.172 1.173 1 0.279 Ants 0.177 1.193 1.190 1 0.275 Frogs -0.651 0.522 1.658 1 0.198
Constant -1.302 0.272 362.457 1 <0.001
3.5.2. Microhabitat characteristics under tiles
Photographs were taken of the area under a total of 1293 tiles and analyzed to
determine whether microhabitat characteristics underneath tiles influenced their
occupancy by D. impar. Of the 1293 roof tiles sampled, D. impar was found to be present
at 18%, or 233 of these.
Degree of soil cracking was found to have a negative association with the
presence of D. impar under tiles (Table 3.6). Therefore, the more soil cracks present, the
less likely D. impar would be found under a tile. The logistic regression analysis also
showed positive associations between the percent cover of both Themeda triandra and
agricultural grass species and the occurrence of D. impar under tiles (Table 3.6).
Therefore, the presence of these vegetation types under tiles resulted in an increased
likelihood of D. impar occupying a tile. Thus, as percent cover of each of the vegetation
types increases, the occupation by D. impar is also likely to increase. This suggests that
74

tile choice is selective rather than random in regards to microhabitat characteristics under
tiles.
Table 3.6: Results of logistic regression analysis testing for the influence of microhabitat characteristics underneath tiles and the presence/absence of D. impar. Chi-square values for each independent variable initially included in the model are presented; bold values indicate p<0.05.
Independent Variable B Exp (B) Wald value (χ2) df p
Degree of soil cracking -0.716 0.839 12.402 1 <0.001 % Cover of Themeda triandra 0.012 1.012 22.460 1 <0.001 % Cover of agricultural grasses 0.030 1.031 13.193 1 <0.001 % Cover of Poa spp. 0.015 1.015 2.312 1 0.128 % Cover of Austrodanthonia spp. 0.006 1.006 0.214 1 0.624 Constant -1.515 438.410 1 <0.001
3.5.3. Microhabitat characteristics around tiles
A total of 1293 tiles were sampled using photographs and analyzed to determine
microhabitat characteristics 1m around tiles which may influence the presence or absence
of D. impar under roof tiles. They were also used to determine whether microhabitat
selection within the habitat influenced tile occupancy.
Logistic regression analysis of the microhabitat 1m around tiles showed that the
percentage cover of agricultural grass species around a tile had a positive association with
the presence of D. impar (Table 3.7). Increasing cover of agricultural grass species
outside of a tile was found to increase the probability of tile occupation by individuals.
All other variables entered into the model had no influence on the presence or absence of
D. impar (Table 3.7).
75

Table 3.7: Results of logistic regression analysis testing for the influence of microhabitat 1m around tiles and the presence/absence of D. impar underneath tiles. Chi-square values for each independent variable initially included in the model are presented; bold values indicate p<0.05.
Independent Variable B Exp (B) Wald value (χ2) df p
% Cover of agricultural grasses 0.011 1.011 32.828 1 <0.001 %Cover of Phalaris aquatica -0.072 0.931 3.087 1 0.079 % Cover of Themeda triandra 0.003 1.003 1.868 1 0.172 Degree of soil cracking -0.157 0.855 0.654 1 0.419 % Cover of Austrodanthonia spp. -0.001 0.999 0.156 1 0.693 % Cover of Poa spp. 0.000 0.997 0.000 1 0.997 Constant -1.519 439.35 1 <0.001
3.6. Refuge preference in a laboratory experiment
Results of the laboratory experiment showed that individual D. impar were
selective in their use of refuges, with a highly significant preference under the
experimental conditions (air temperature 24.1°C, relative humidity of 82.7%, wind speed
of 1.7mph and no heat source) towards certain refuge types (χ2= 14.520, df=3, p=0.002).
Fifty-six percent of the individuals showed a preference towards using grass tussocks,
with this refuge being the most used type (Table 3.8). Concrete tiles and basalt rocks
were preferred equally and were not that different from the expected value (Table 3.8).
However, terracotta tiles were avoided by D. impar, with only 1 individual using this
refuge (Table 3.8).
Table 3.8: Refuge preference by D. impar in laboratory trials. The observed and expected number of individuals for each refuge type are shown. The contribution of each refuge type to the χ2 value is also presented.
Refuge Type Observed Expected Percentage of χ2
Terracotta Tile 1 6.3 30.71
Concrete Tile 5 6.3 1.85
Basalt Rock 5 6.3 1.85
Grass tussock 14 6.3 64.8
76

Chapter 4: DISCUSSION
4.1. Census data
Artificial refuges (roof tiles), were an effective method for censusing vertebrate
fauna, with 14 different species recorded. Roof tile grids recorded D. impar in relatively
large numbers (156) and nearly as often as two common grassland reptile species,
White’s Skink (Egernia whitii) and the Tussock Skink (Pseudemoia pagenstecheri). This
is promising, considering D. impar is extremely cryptic and found in low numbers
(Coulson 1990; O’Shea 2004). Nine times more D. impar were caught in this study
compared to a study by Koehler (2004). This may however, be attributed to the use of
sites where D. impar had been previously recorded, and to drier weather conditions.
Additionally, more D. impar may have been found due to the effort of this study, which
surveyed 2.3 times more tiles than Koehler (2004) (13,900 tiles compared to 6100 tiles).
The present study was also undertaken over two seasons, Spring and Summer, whereas
Koehler (2004) only surveyed for D. impar in Spring and over a shorter time frame (14
September- 4 October).
4.2. Morphometrics of D. impar
A number of pygopodids have been found to show sexual dimorphism in body
size, with females growing larger than males (Kluge 1974; Patchell and Shine 1986).
The results found in this study confirm that, like other pygopodids, D. impar is sexually
dimorphic in regards to snout-vent length and head-length. Females were found to be
larger, with longer heads than males. Sexual dimorphism in only ventral scale counts in
D. impar has been reported by Kluge (1974) and Coulson (1990). Females were found to
77

have a higher mean number of paired enlarged ventral scales than males, in their studies.
Coulson (1990) also found no significant difference in snout-vent length (SVL) as a
percentage of the total length. However, why Coulson (1990) analyzed the ratio is
unknown. His result may have simply implied that males and females have different tail
lengths in relation to SVL.
Several hypotheses have been proposed to explain larger body size in females.
The most common of these focuses on fecundity advantages of attaining a larger size.
Larger females often have increased clutch sizes and/or larger eggs due to increased
abdominal space (Shine 1988a, 1992, 1994; Bonnet et al. 2000). Shine (1988a) noted that
pygopodids usually have a defined clutch size of two eggs, although occasionally females
produced one. Therefore, smaller females may consistently produce only one or no eggs,
with larger females being able to produce two. Advantages obtained from a larger SVL
may also include increased survival of individuals (Shine 1988a). Differential mortality
may exist between males and females, with females needing to grow larger to survive.
This may also explain the delayed age of reproductive maturity in females.
The increased head-length found in females may reflect the size or range of prey
items consumed. This is however gape limited. It has been suggested that larger mouths
are needed to overcome constraints imposed by larger body size (Patchell and Shine
1986b). Thus, longer head-lengths in females may occur to increase mouth size for prey
items. Females may have different diets compared to males, especially during egg
development periods when additional resources are required. Research is therefore
needed on the individual diets of male and females, instead of only the general diet of this
species (see Kutt et al. 1998).
78

4.2.1. Sex ratios of D. impar
Sex ratios throughout this study did not differ from 1:1. This is consistent with
previous studies by Rauhala and Andrew (1998) and O’Shea (2004), who also found an
overall 1:1 sex ratio of D. impar. Results also showed no significant change from a 1:1
ratio occurring over time in this study. O’Shea (2004) however, found that a swap over
between the proportion of sexes occurred over time under artificial refuges (roof tiles).
She found that males were more commonly observed between September and October
following their emergence from brummation. Conversely, females were more commonly
observed during the late breeding season (November and December) due to
thermoregulatory needs for egg development and deposition (O’Shea 2004).
Additionally, increased tile occupancy by females during this period may indicate that
tiles are used as protective shelters, reducing predation (G. Peterson pers. comm.). As
females would be gravid during this period, there would be a fitness cost associated with
reproducing. Because all sites were pooled in the present study (due to small sample sizes
at some sites), this was not observed. It is suggested that the different sites may have had
differential sex ratios.
4.3 Habitat characteristics of sites and occupancy rates
4.3.1. Tile Occupancy rates for D. impar
D. impar were recorded at all sites the previous year, although in low numbers at
some of the sites (G. Peterson pers. comm.). In this study, D. impar were recorded at
fifteen of the twenty sites sampled, with evidence of occupation at an additional site
(Chatsworth Rd.) by way of a single sloughed skin. The absence of D. impar at the
79

remaining four sites throughout the duration of the study raises concern. This is
concerning for two reasons: 1) roof tiles as a census technique for D. impar may not
always detect their presence or 2) a local extinction may have occurred.
MacKenzie (2005a) commented that it is generally impossible to confirm that a
species is absent in an area. Absence may be due to the failure of the survey method in
detecting the species (Mackenzie et al. 2003; MacKenzie and Nichols 2004; MacKenzie
2005a, 2005b). Koehler (2004) also suggested that roof tiles may have created false-
negative errors in her study, but attributed this to her short time frame (14 September- 4
October 2004), the weather conditions (unusually high rainfall) and single season (spring)
of her census. The failure to detect the presence of D. impar at four of the sites where
they had been recorded the previous year is unlikely to be due to small sampling effort or
influences of weather. These sites were sampled over a five month period and at a wide
range of weather conditions. At least fifteen grid surveys were undertaken at these sites.
If a local extinction has occurred, it may indicate that the habitat has changed
(Brown and Lomolino 1998). It may also indicate that, by chance, a local extinction at
that site has occurred due to an originally small population size. However, if local
extinction has occurred, management and research of this species must be increased and
must occur at a more rapid pace than at present.
The observed occupancy rates of tiles by D. impar may be related to the local
abundances at sites. MacKenzie et al. (2004), McDonald (2004) and Pollock et al. (2004)
commented that to be able to draw inferences about abundance, an estimation of the
detection probability of D. impar is required (i.e. the probability that D. impar appears in
a count for the survey area, if present). It has been suggested that a higher detection
80

probability (presence/absence) will occur at sites where there is greater local abundance
(MacKenzie 2005a). When there is a lower abundance of D. impar at a site, the presence
of this species may be harder to detect (MacKenzie 2005a). Therefore, the sites in which
D. impar was not recorded could be due to low abundance and a low detection
probability. However, at present it cannot be confidently said that occupancy of tiles is
related to relative abundances of D. impar.
Differences in occupancy rates may also be due to the heterogeneous landscapes
in Western Victoria. It may also be due to the quality of the site (McDonald 2004). Thus,
within a species geographic range, patchy or aggregated distributions of individuals may
occur (Brown and Lomolino 1998). Consequently, D. impar populations may have few
individuals in some areas and many more in other areas according to the extent of niche
requirements being met at particular sites (Brown and Lomolino 1998). Sites such as
“Challicum Park” and Caramut-Chatsworth Rd. may be seen as sites in which the
majority of niche requirements of D. impar are being met. As a result, many more
individuals will be occupying these sites compared to others. The reasons for low
occupancy rates at sites such as Blacks Creek, however, are less straight forward and
remain enigmatic. Additionally, the aggregation of individuals may have severe
consequences for D. impar populations, especially if habitat modification and
fragmentation continues. With the aggregation of populations, most individuals of this
species will therefore only occur in a small area within its known range (Brown and
Lomolino 1998). If the grassland habitat sustaining these aggregated populations is
removed or poorly managed, then extinction for these populations may be inevitable.
81

4.3.2. Seasonal tile occupancy
Results showed that tile occupancy rates increased in spring but declined in
summer, with a significant difference in occupancy rates among sampling periods. This is
supported by O’Shea (2004), who also found occupancy rates of tiles to increase in spring
(October). Increased occupancy rates in spring may coincide with the breeding season,
with increased activity in November (Smith and Robertson 1999). This also supports
results found within the present study. O’Shea (2004) suggested that more individuals
may be surface active during spring because of thermoregulation requirements. This
would additionally support tile use if they are used for thermoregulation. It was also
suggested that during summer, D. impar is able to maintain a semi-fossorial habit due to
high surface temperatures and thus will be less surface active (O’Shea 2004). This also
coincides with soil cracks forming and therefore an increased availability of alternative
refuges. Additionally, decreased tile occupancy rates may be due to tiles reaching
temperatures of 70°C during summer (G. Peterson pers. comm.).
4.3.3. Habitat characteristics
If occupancy rate reflects abundance, then the habitat characteristics may be
determining the abundance of D. impar at a site. However, site habitat characteristics
may also determine occupancy rates independent of abundance. If so, then D. impar will
be more likely to occupy tiles in some habitats, because of the structural features.
However, it is unknown whether or not there is a relationship between occupancy rates
and abundance and the strength of that relationship.
The height and structure of vegetation at a site often reflects management
practices (Hadden 1995). These may include grazing by livestock (predominantly sheep
82

in Western Victoria) and prescribed burning. Shorter maximum vegetation heights are
expected at sites which have prescribed burns either annually or every few years, as well
as sites that are grazed at regular intervals (Koehler 2004). Results showed that a shorter
maximum height of vegetation increased tile occupancy by D. impar. Koehler (2004) also
found that presence of D. impar was determined by a reduced height of the dominant
vegetation and when the tallest vegetation height was lower. These results suggest that
processes that have these effects, such as prescribed burns and grazing have a positive
influence on the occupancy rates of this species. However, this may only apply if these
management types are applied at an intensity and frequency that is non-detrimental to this
species (Russell et al. 1999). They should also not lie outside ecological or physiological
tolerances of D. impar and should allow sufficient refuges (grass-tussocks in particular)
to remain (Irvin et al. 2003; D.S.E 2005). Thus, because D. impar is threatened,
management such as prescribed burning should be undertaken during seasons where
suitable soil cracks are available (refuges to escape fires) and when D. impar may be less
active on the surface (Koehler 2004; O’Shea 2004).
Koehler (2004) indicated that the height of Phalaris aquatica influenced whether
D. impar was present at a site. She also indicated that the presence of P. aquatica could
control the distribution of D. impar. The present study did not find that the height of P.
aquatica significantly influenced the use of tiles by D. impar. This may correspond to
only small patchy areas of P. aquatica at some sites and the fact that these sites were
selected because of the presence of D. impar.
4.4 General tile use
4.4.1. The influence of time of day and environmental conditions
83

Results of this study indicated that higher occupation of tiles occurred in the
middle of the day (1100hrs-1500hrs), when the incidence of solar radiation striking tiles
was at its maximum. This suggests that tiles may be primarily used as concealed sites for
thermoregulation. The decrease in tile use between 1300-1359hrs indicates that tiles may
have become too hot for D. impar and individuals have moved away. It may also indicate
that individuals are undertaking alternative activities to thermoregulation during this
period. Tiles also appear to be used to some extent as overnight refuges. This is supported
by observations of tile use both early in the morning (0700-1059hrs) and late afternoon
(1500-1759hrs).
Results showed that tile occupation by D. impar occurred more often when cloud
cover was overcast or patchy-heavy. When cloud cover is high, tiles would not heat up as
much, as less solar radiation would be striking the tiles. Therefore, tiles will not be
reaching temperatures that are uncomfortable or reaching the critical thermal maximum
of D. impar. However, cloud cover may not be acting independently in determining tile
use by individuals. Air temperature will also influence tile use under these cloud
conditions.
D. impar might also be using grass tussocks for thermoregulation using direct
sunlight (covert basking), when there is little or no cloud cover present. Therefore, fewer
individuals will be using tiles under these conditions. This supports previous studies that
maintain D. impar may also be heliothermic (refer to Hadden 1995). However, it remains
unknown as to whether D. impar is strictly thigmothermic or is also heliothermic. It has
been suggested that many lizards are not strictly heliothermic, but may also be
thigmothermic in some sense (Heatwole and Taylor 1987). This may be dependent on the
84

environmental conditions and may result in a species alternating between the two
(Heatwole and Taylor 1987). D. impar was never observed basking in the open (pers.
obs.), which is a condition of being heliothermic (i.e. rely on radiant energy for body
heat) (Heatwole and Taylor 1987).
Thermal constraints exist for ectotherms in the natural environment, and as such
D. impar may occupy certain thermal microclimates within its habitat (Grant and
Dunham 1988). It has also been suggested that thigmotherms will exhibit behavioural
selection of the thermal environment in which they are found, changing locations to
maintain preferred body temperatures (Heatwole and Taylor 1987). Individuals will
therefore move from under an artificial refuge (roof tile) when temperatures become too
hot, so that body temperature does not exceed the critical thermal maximum (Grant and
Dunham 1988; Huey et al. 1989). The ability to select microclimatic conditions within
the habitat is particularly important for D. impar which has a low thermal inertia caused
by its small size and shape (Grant and Dunham 1988). It is also important where
exceeding the critical thermal maximum could result in death or temperature impairment
for the individual (Grant and Dunham 1988; Huey et al. 1989). The avoidance by D.
impar of roof tiles at both high air and substrate temperatures in this study, exemplifies
its ability to select appropriate microclimatic conditions within its preferred body
temperature (Adolph 1990). It may also explain the decreased occupancy rates of tiles in
late summer when air temperatures exceed 30°C.
Temperature both under and outside a tile appear to play an important role in the
use of tiles by D. impar. Decreased occupancy rates of roof tiles by D. impar during the
afternoon may correspond with increased levels of solar radiation heating tiles to
85

uninhabitable levels. Huey et al. (1989) found that temperatures exceeding lethal levels
occurred underneath thin rocks in full sun during the afternoon. In their study, garter
snakes (Thamnophis elegans) were found to retreat into burrows at depths greater than
2.5cm or retreat under rocks that were thicker than 20cm at such temperatures. Because
tiles used in the present study are significantly thinner than 20cm (approx. 5cm), it is
assumed that many D. impar retreated from underneath tiles in the afternoon when
substrate temperatures exceeded 35°C and sought alternative refuges that provided cooler
microclimates (Heatwole and Taylor 1987). The apparent disappearance of D. impar
from under tiles may additionally support the apparent use of soil cracks as refuges in the
summer months (December and January) (pers. obs. and T. Rohr and G. Peterson pers.
comm.).
The warmest part of the thermal environment of a reptile has often been found to
be the soil surface (Heatwole and Taylor 1987), with substrate temperatures higher than
that of the ambient air. Substrate temperatures were generally 2-3°C higher in this study.
When the sun’s rays strike the ground, the air directly above the soil surface is heated
(Heatwole and Taylor 1987). Consequently, warmer substrate temperatures underneath
tiles will correspond to hot air becoming trapped between the soil surface and the roof tile
above it. This is extremely beneficial to thigmothermic reptiles such as D. impar that rely
upon heat exchange with the substrate to maintain body temperatures (Heatwole and
Taylor 1987).
Relative humidity both under and outside a tile also appear to influence the
utilization of tiles by D. impar. Results indicated that a high relative humidity underneath
tiles and a low relative humidity outside tiles increased tile occupation by D. impar.
86

Koehler (2004) also found that tile use by this species occurred at lower ambient
humdities. A higher humidity underneath tiles may be beneficial to D. impar, as it
reduces evaporation rates which cool body temperatures (Heatwole and Taylor 1987).
This is particularly important for D. impar because of their small size. In small animals,
higher evaporation rates are known to occur due to larger surface area to volume ratios
(i.e. size and shape of D. impar) (Heatwole and Taylor 1987). The evaporation rate is also
related to the substrate temperature, with evaporation rate rising with increasing
temperatures. This may explain the decreased occupancy rate of artificial refuges (roof
tiles) by D. impar above substrate temperatures of 25°C. Water evaporation rate
underneath tiles will also be greatly reduced because there is less air movement under
tiles as apposed to exposed substrates (Heatwole and Taylor 1987).
4.5 Individual tile use 4.5.1. Influences of other animal taxa Small lizards have been observed to reduce the risks of potential predation by
avoiding tiles where snakes were or are by the detection of their scent (e.g. Downes and
Shine 1998a, 1998b; Amo et al. 2004). The results of this study showed that the current
or past occurrence of a snake under a specific tile had a negative influence on the
subsequent occupancy of that tile by D. impar. Elapids such as Austrelaps superbus
(Lowland Copperhead) and Suta flagellum (Little Whip snake) are known predators of
small lizards (Shine 1977, 1987, 1988b) and were observed to often occupy tiles at some
sites. This would have influenced the overall occupancy rates of tiles by D. impar at some
sites. This suggests that at sites, in which snake abundance was high, fewer D. impar
were detected than their real abundances would have otherwise allowed. It has also been
87

suggested that individuals will immigrate into less favourable habitat or refuges to avoid
these predators (Martin and Lopez 1998; Sabo 2003).
Positive associations between D. impar and redback spiders (Latrodectus hasselti)
found in this study were unexpected. Redback spiders have not been recorded as a
component of D. impars’ diet (Kutt et al. 1998). Although, the diet of D. impar does
contain some spiders, they are mainly of the families Salticidae (jumping spiders) and
Miturgidae (wolf spiders) (Coulson 1990; Kutt et al. 1998). Redback spider venom could
easily kill a small lizard such as D. impar and it is possible that small lizards become prey
of this species. Explanations for the positive association of D. impar with redback
spiders therefore tend towards similar microhabitat use and/or microhabitat structure.
This may include factors such as relative humidity and temperature underneath tiles
(Goldsbrough et al. 2004). It may also involve potential prey of both species being
located underneath these tiles (Webb and Shine 1998; Goldsbrough et al. 2004).
However, the present study did not determine the abundance of prey species under the
tiles, but merely the presence or absence of selected invertebrates and arachnids. It is
suggested that future studies are needed to determine whether potential prey species are
influencing the presence or absence of D. impar under tiles and thus whether tiles are also
acting as foraging sites.
4.5.2. Microhabitat characteristics under and outside tiles
Results showed that occupation of individual tiles by D. impar was associated
with kangaroo grass (Themeda triandra) and agricultural grass cover underneath tiles.
This vegetation cover may be beneficial to D. impar, by creating a more complex
microhabitat underneath the tile. It is suggested that vegetative cover underneath a tile
88

may raise the position of D. impar from the substrate, allowing a thermal gradient to exist
(Hadden 1995). Individuals would, therefore, be able to move closer to the tile to warm
up and away from the tile in order to cool down. Additionally, the grass cover may act as
insulation at cooler temperatures, or provide more suitable microhabitat for prey species.
An increased percent cover of agricultural grasses 1m around tiles was also found
to be associated with the occupation of an individual tile by D. impar. Therefore,
agricultural grass cover may be influencing microhabitat use of this species within the
habitat. These results suggest that D. impar may be still able to persist in agricultural
grasslands that were historically composed of native tussock-forming grasses. It may also
be inferred that, as long as some tussock-forming grasses remain within agricultural land,
then D. impar may still be present.
Tile use by D. impar also appears to be influenced by the placement of tiles
within the habitat, with tiles occupied more often when they were surrounded by
agricultural grasses. This may also imply that the vegetation underneath a tile will be
correlated with the vegetation around a tile. It is suspected that the significance of
agricultural grass cover in determining the presence of D. impar under a tile may be due
to the pooling of all sites. For sites such as “Challicum Park” and Chatsworth-Caramut
Rd., tiles were surrounded by native T. triandra. These sites had the largest tile
occupancy rates of all sites. Therefore, the percent cover of agricultural grasses around
tiles in influencing the presence of D. impar at these sites is not applicable and the results
should be treated with caution. However, it may indicate that in degraded habitats where
there is little available cover and/or refuges, an increased usage of tiles will be observed.
89

Results also indicated that the degree of soil cracking under tiles negatively
influenced the presence of D. impar. This may be explained in several ways: 1) D. impar
were seeking refuge in soil cracks when they formed and were not found under tiles; 2)
the larger the soil cracks the more exposed D. impar may have been to predators and
therefore, these tiles were avoided or 3) the more soil cracks that were present, the drier
the conditions underneath the tile were (causing increased evaporative loss in D. impar)
and hence these tiles were not utilized.
4.6. Refuge Preference in a laboratory experiment
D. impar showed a strong preference for grass-tussocks under the conditions of
the experiment (air temperature 24°C, wind speed 1.7mph, relative humidity 82.7% and
no radiant heat). Hadden (1995) suggested that the tussocks provide important
microhabitat for D. impar, providing both shelter and basking sites. Concrete tiles and
basalt rocks were also used equally and were chosen close to the expected frequency.
This suggests that concrete tiles are used on the basis that they are encountered by D.
impar. It also suggests that the physical and thermal properties of concrete tiles are
similar to that of the natural basalt rocks. This was also found by Webb and Shine (2000)
in velvet geckoes (Oedura lesueurii) using concrete pavers as artificial refuges.
Conversely, D. impar showed a strong avoidance of terracotta tiles under the conditions
of the experiment. Therefore, if conditions are similar in the field to the laboratory
experiment, D. impar will be expected to occupy terracotta tiles less often. Alternatively,
it has been found that D. impar exhibited no preference for any refuge type, when refuges
90

were heated (B. Malone pers. comm.). These results suggest that thermoregulation is a
major factor influencing tile utilization by D. impar.
Bias may also be caused from an insufficient lag time provided for individuals to
get used to the artificial refuges (concrete and terracotta roof tiles). This has previously
been found to influence the use of tiles by D. impar (Koehler 2004; O’Shea 2004). These
issues should be investigated for future studies. It is suggested that laboratory
experiments be undertaken on the influence of conspecific scent on refuge utilization by
this species.
There were some limitations imposed on the laboratory experiment in testing for
the refuge preference of D. impar. These included refuges being essentially only
monitored and used as overnight refuges. Thermoregulatory use of refuges was thus not
investigated due to the time of day in which tiles were checked. It is suggested that for
future studies, refuge preference should be recorded on more than one occasion, with
individuals left in arenas for longer periods of time.
Conclusions Roof tile grids as a census technique are effective at providing information for a
wide range of fauna. However, their effectiveness at detecting the presence of D. impar
remains enigmatic as 25% of sites recorded no individuals using this census technique.
The effectiveness of roof tiles as a population monitoring technique is also uncertain.
Mark-recapture studies may indicate ‘trap-shyness’ of individuals, with a decline in the
number of individuals recaptured with continued monitoring.
91

D. impar was found to be sexually dimorphic, with females the larger of the two
sexes. Females had both a longer snout-vent length and longer head-length than males.
The advantage of an increased snout-vent-length appeared to support increased egg size.
It still remains elusive as to whether occupancy rates of roof tiles by D. impar
reflect their abundance at a site. There may be a relationship between abundances and
occupancy rates, but the strength of this relationship is undetermined. However,
occupancy rates have been found to be highly seasonal and vary over time of day and
with environmental conditions. Until further analysis is undertaken, tile occupancy rate
instead of relative abundance should continue to be used.
Tile occupation is influenced by many factors and is non-random. These include,
but may not be limited to, microhabitat characteristics (percent cover of Themeda
triandra and agricultural grasses underneath tiles), the degree of soil cracking, and
occupation by snakes (Austrelaps superbus and Suta flagellum) and redback spiders. Tile
occupation also appears to be related to the thermal environment (temperature and
humidity), cloud cover, time of day and season. Percent cover of agricultural grasses
around tiles also appears to influence microhabitat use of D. impar within the habitat.
Variation in occupancy rates among sites was determined by the maximum height
of vegetation, with a reduction in height resulting in increased occupancy rates of tiles.
Structural characteristics of the habitat were more important than floristic characteristics
in influencing the occupancy rate of D. impar. However, at this stage, it is unknown
whether or not vegetation characteristics reflect local abundances.
92

Under some environmental conditions, D. impar will show a preference for grass
tussock refuges and avoid terracotta tiles for over night refuge. Concrete tiles also appear
to be occupied at rates in which they are encountered by this species.
Results of this study indicate that roof tile grid monitoring will be optimal in late
October and November (when increased tile occupation by D. impar occurs). Optimal
sampling conditions for D. impar were also found to be between 1100-1500hrs,
particularly during overcast or heavily clouded days, and when air temperature is below
25°C and air relative humidity is less than 50%.
93

REFERENCES
Adolph, S.C. (1990). Influence of behavioural thermoregulation on microhabitat use by
two Sceloporus lizards. Ecology 71(1), 315-327.
Amo, L., Lopez, P. and Martin, J. (2004). Wall lizards combine chemical and visual cues
of ambush snake predators to avoid overestimating risk inside refuges. Animal
Behaviour. 67(4), 647-653.
Bailey, L.L., Simons, T.R. and Pollock, K.H. (2004). Estimating site occupancy and
species detection probability parameters for terrestrial salamanders. Ecological
Applications 14(3), 692-702.
Beggs, B. (1997). Habitat selection and use by grassland herpetofauna, including Delma
impar, on a grazing property in Western Victoria. Unpublished honours thesis.
University of Ballarat.
Blomberg, S. and Shine, R. (1996). Reptiles. In ‘Ecological Census Techniques: a
handbook’. (Eds. W.J Sutherland.) pp. 218-226. (Cambridge University Press:
New York).
Bonnet, X., Naulleau, G., Shine, R. and Lourdais, O. (2000). Reproductive versus
ecological advantages to larger body size in female snakes, Vipera aspis. OIKOS
89, 509-518.
Brown J.H. and Lomolino M.V. (1998). ‘Biogeography’ (2nd Edn. Sinauer Associates:
Sunderland, MA)
Brown, G.W. and Nicholls, A.O. (1993). Comparative census techniques and modeling
of habitat utilization by reptiles in northern Victoria. In ‘Herpetology in Australia:
A Diverse Discipline’. (Eds. D. Lunney and D. Ayers.) pp. 283-290.
(Transactions of the Royal Zoological Society of New South Wales: New South
Wales).
94

Church, F. (1998). ‘Explore Victoria’. (Eds. F. Church) pp 92-93. (Penguin Books:
Ringwood).
Cogger, H.G. (2000). ‘Reptiles and Amphibians of Australia’. (6th edn. Reed New
Holland: Sydney).
Coulson, G. (1990). Conservation biology of the Striped Legless Lizard (Delma impar):
An initial investigation. Arthur Rylah Institute for Environmental Research
technical report series No. 106. A report to the National Parks and Wildlife
Division, Department of Conservation and Environment, Victoria.
Dorrough, J. (1995). Past and present habitat of the Striped Legless Lizard, Delma impar
(Pygopodidae), in the Australian Capital Territory. Unpublished report to the
Australian Capital Territory Parks and Conservation Service, Australian Capital
Territory.
Dorrough, J. and Ash, J.E. (1999). Using past and present habitat to predict the current
distribution and abundance of a rare cryptic lizard, Delma impar (Pygopodidae).
Australian Journal of Ecology 24, 614-624.
Downes, S. and Shine, R. (1998a). Heat, safety or solitude? Using habitat selection
experiments to identify a lizard’s priorities. Animal Behaviour 55, 1387-1396.
Downes, S. and Shine, R. (1998b). Sedentary snakes and gullible geckos: predator–prey
coevolution in nocturnal rock-dwelling reptiles. Animal Behaviour 55, 1373-1385.
DSE (2003). Victoria's native vegetation management: A framework for action. In
‘Technical support maps for local government authorities’. (Parks, Flora and
fauna Division DSE: Melbourne).
DSE (2005). Code of Practice for Fire Management on Public Land. (Draft Revision 1,
Victorian Government Department of Sustainability and Environment:
Melbourne) pp. 5-21
95

Dufty, A.C. (1994). Habitat and spatial requirements of the Eastern Barred Bandicoot
(Perameles gunnii) at Hamilton, Victoria. Wildlife Research 21, 459-472.
Dytham C. (1999). ‘Choosing and Using Statistics: A Biologists Guide’. (Blackwell
Science Ltd.: Oxford, Malden).
Ford, N.B. and Hampton, P.M. (2005). The amphibians and reptiles of Camp Maxey,
Lamar County, Texas with comments on census methods. Texas Journal of
Science 57(4), 359-370.
Goldsbrough, C.L., Hochuli, D.F. and Shine, R. (2004). Fitness benefits of retreat-site
selection: spiders, rocks, and thermal cues. Ecology 85(6), 1635-1641.
Grant, B.W. and Dunham, A.E. (1988). Thermally imposed time constraints on the
activity of the desert lizard Sceloporus merriami. Ecology 69(1), 167-176.
Hadden, S. (1995). Distribution, status and habitat requirements of the Striped Legless
Lizard Delma impar (Fischer). Unpublished final report to the Australian Nature
Conservation Agency. Department of Conservation and Natural Resources,
Victoria.
Heatwole, H. and Taylor, J. (1987). ‘Ecology of reptiles’. (Surrey Beatty and Sons:
Chipping Norton).
Houze, C.M. and Chandler, C.R. (2002). Evaluation of Coverboards for Samplilng
Terrestrial Salamanders in South Georgia. Journal of Herpetology 36(1) 75-81.
Howard, R., Williamson, I. and Mather, P. (2003). Structural Aspects of Microhabitat
Selection by the Skink Lampropholis delicata. Journal of Herpetology 37(3), 613-
617.
Huey, R.B., Peterson, C.R., Arnold, S.J. and Porter, W.P. (1989). Hot rocks and not-so-
hot rocks: retreat-site selection by garter snakes and its thermal consequences.
Ecology 70(4), 931-944.
96

Irvin, M., Westbrooke, M. and Gibson, M. (2003). Effects of repeated low-intensity fire
on reptile populations of a mixed eucalypt foothill forest in south-eastern
Australia. Research Report No. 65. Victorian Government Department of
Sustainability and Environment: Victoria.
Kenley, P.R (1971). Geology and geomorphology of Western Victoria. In ‘The natural
history of Western Victoria: proceedings of the symposium’. (Eds. M.H. Douglas
and L. O’Brien.) pp. 2-13. (Western Victorian Sub-branch, Australian Institute of
Agricultural Science: Horsham).
Kerr, G.D., Bull, C.M. and Burzacott, D. (2003). Refuge sites used by the scincid lizard
Tiliqua rugosa. Austral Ecology 28, 152-160.
Kluge, A.G. (1974). A taxonomic revision of the lizard family Pygopodidae.
Miscellaneous Publications, Museum of Zoology, University of Michigan 147,1-
221.
Koehler, L.E. (2004). The current distribution, status and habitat preferences of the
Striped Legless Lizard (Delma impar) in far Southwestern Victoria. Unpublished
honours thesis, RMIT University, Victoria.
Kuhnz, L.A., Burton, R.K., Slattery, P.N. and Oakden, J.M. (2005). Microhabitats and
Population Densities of California Legless Lizards, with Comments on
Effectiveness of Various Techniques for Estimating Numbers of Fossorial
Reptiles. Journal of Herpetology 39(3), 395-402.
Kutt, A., (1993). A preliminary evaluation of the use of fluorescent pigments to track the
movements of the Striped Legless Lizard Delma impar (Reptilia: Pygopodidae).
In ‘Herpetology in Australia: A Diverse Discipline’. (Eds. D. Lunney and D.
Ayers.) pp. 179-183. (Transactions of the Royal Zoological Society of New South
Wales: New South Wales).
97
Kutt, A.S., Coulson, G., & Wainer, J. (1998). Diet of the striped legless lizard Delma
impar (Squamata: pygopodidae) in a Western (basalt) Plains Grassland, Victoria.
Australian Zoologist 30, 412-418.
Lunt, I.D. (2003). A Protocol for integrated management, monitoring and enhancement of
degraded Themeda triandra grasslands based on plantings of indicator species.
Restoration Ecology, 11, 223-230.
MacKenzie, D.I. (2005a). What are the issues with presence-absence data for wildlife
managers? Journal of Wildlife Management 69(3), 849-860.
MacKenzie, D.I. (2005b). Was it there? Dealing with imperfect detection for species
presence/absence data. Australian and New Zealand Journal of Statistics 47(1),
65-74.
MacKenzie, D.I. and Nichols, J.D. (2004). Occupancy as a surrogate for abundance
estimation. Animal Biodiversity and Conservation 27(1), 461-467.
MacKenzie, D.I., Nichols, J.D., Hines, J.E., Knuston, M.G. and Franklin, A.B. (2003).
Estimating site occupancy, colonization, and local extinction when a species is
detected imperfectly. Ecology 84(8), 2200-2207.
MacKenzie, D.I., Royle, J.A., Brown, J.A. and Nichols, J.D. (2004). Occupancy
Estimation and Modeling for Rare and Elusive Populations. In ‘Sampling Rare or
Elusive Species: concepts, designs, and techniques for estimating population
parameters’. (Eds. W.L. Thompson.) pp. 149-172. (Island Press: Washington).
Maher, J.M. and Martin, J.J. (1987). Soil and landforms of south-western Victoria. Part
1. Inventory of soils and their associated landscapes. Research report series. No.
40 Victorian Department of Agriculture and Rural Affairs: Victoria.
98

Martin, J. and Lopez, P. (1998). Shifts in Microhabitat Use by the Lizard
Psammodromus algirus: Responses to Seasonal Changes in Vegetation Structure.
Copeia 3, 780-786.
McDonald, L.L. (2004). Sampling Rare Populations. In ‘Sampling Rare or Elusive
Species: concepts, designs, and techniques for estimating population parameters’.
(Eds. W.L. Thompson.) pp. 11-42. (Island Press: Washington).
Michael, D.R., Lunt, I.D., & Robinson, W.A. (2004). Enhancing fauna habitat in grazed
native grasslands and woodlands: use of artificially place log refuges by fauna.
Wildlife Research 31, 65-71.
Nunan, D. (1995). Diet and feeding ecology of the Striped Legless Lizard Delma impar
(Fischer, 1882) within the Australian Capital Territory. Unpublished report to the
ACT Parks and Conservation Service, Canberra.
Osborne, W.S., Kukolic, K. and Williams, K.D. (1993). Conservation of reptiles in
lowland native grasslands in the Southern Tablelands of New South Wales and
the Australian Capital Territory. In ‘Herpetology in Australia: A Diverse
Discipline’. (Eds. D. Lunney and D. Ayers.) pp. 151-158. (Transactions of the
Royal Zoological Society of New South Wales: New South Wales).
O’Shea, M. (1996). An ecological study of the population of Striped Legless Lizards
Delma impar (Fischer 1882) inhabiting native and exotic grasslands in the north-
east corner of the Albion Explosives Factory Site (St. Albans, Victoria).
Unpublished honours thesis, Victoria University of Technology, Victoria.
O'Shea, M. (2004). Methods for assessment and techniques for management of striped
legless lizard Delma impar populations in South-eastern Australian. Unpublished
PhD thesis, Victoria University of Technology, Victoria.
Pallant, J. (2005). ‘SPSS survival manual: a step by step guide to data analysis using
SPSS’. (2nd Edn. Allen and Unwin: Sydney).
99

Patchell, F.C. and Shine, R. (1986a). Food habits and reproductive biology of the
Australian Legless Lizards (Pygopodidae). Copeia 1, 30-39.
Patchell, F.C. and Shine, R. (1986b). Feeding Mechanisms in Pygopodid Lizards: How
Can Lialis Swallow Such Large Prey? Journal of Herpetology 20(1), 59-64
Peterson, C.R. (1987). Daily variation in the body temperatures of free-ranging garter
snakes. Ecology 68, 160-169.
Peterson, G.N.L. (1997). Ecology, evolution and conservation of the Eulamprus Quoyii
complex in central southwestern Victoria. Unpublished honours thesis, La Trobe
University, Bundoora.
Pollock, K.H., Marsh, H., Bailey, L.L., Farnsworth, G.L., Simons, T.R. and Allredge,
M.W. (2004). Separating Components of Detection Probability in Abundance
Estimation: An Overview with Diverse Examples. In ‘Sampling Rare or Elusive
Species: concepts, designs, and techniques for estimating population parameters’.
(Eds. W.L. Thompson.) pp. 43-58. (Island Press: Washington).
Quinn G.P. and Keough M.J. (2002). ‘Experimental Design and Data Analysis for
Biologists’. (Cambridge University Press, Cambridge).
Rauhala, M.A. and Andrew, W. (1998). External sexing of the Striped Legless Lizard
Delma impar using cloacal spurs. Internal Report 98/4, Environment ACT,
Australian Capital Territory.
Rawlinson, P. A. (1971). ‘Amphibians and Reptiles of Victoria’, (Reprinted from the
Victorian Yearbook, no. 85, 1971), (Eds. G. H. Rixon.) pp. 1-40. (Government
Printer: Melbourne).
Read, J.L. and Moseby, K.E. (2001). Factors affecting pitfall capture rates of small
ground vertebrates in arid South Australia. I. The influence of weather and moon
phase on capture rates of reptiles. Wildlife Research 28, 53-60.
100

Rodda, G.H., Campbell, E.W., Fritts, T.H. (2001). A High Validity Census Technique
for Herpetofaunal Assemblages. Herpetological Review 32(1), 24-30.
Russell, K.R., Van Lear, D.H., and Guynn, D.C. (1999). Prescribed fire effects on
herpetofauna: a review and management implications. Wildlife Society Bulletin
27(2), 374-384.
Ryan, T.J., Philippi, T., Leiden, Y.A., Dorcas, M.E., Wigley, T.B. and Gibbons, J.W.
(2001). Monitoring herpetofauna in a managed forest landscape: effects of habitat
types and census techniques. Forest Ecology and Management 5739, 1-8.
Sabo, J.L. (2003). Hot rocks or no hot rocks: overnight retreat availability and selection
by a diurnal lizard. Oecologia 136, 329-335.
Schlesinger, C.A. and Shine, R. (1994). Selection of diurnal retreat sites by the nocturnal
gekkonid lizard Oedura lesueurii. Herpetologica 50(2), 156-163.
Shah, B., Shine, R., Hudson, S. and Kearney, M. (2004). Experimental analysis of
retreat-site selection by thick-tailed geckos Nephrurus milii. Austral Ecology 29,
547-552.
Shea, G.M., (1995). A taxonomic revision of the Cyclodomorphus casuarinae complex
(Squamata: Scincidae). Records of the Australian Museum 47, 83-115.
Shine, R. (1977). Habitats, diets, and sympatry in snakes: a study from Australia.
Canadian Journal of Zoology 25, 647-653.
Shine, R. (1987). Ecological ramifications of prey size: food habits and reproductive
biology of Australian copperhead snakes (Austrelaps, Elapidae). Journal of
Herpetology 21, 21-28.
Shine, R. (1988a). The evolution of large body size in females: A critique of Darwin’s
“Fecundity Advantage” model. The American Naturalist 131(1), 124-131.
101

Shine, R. (1988b). Food habits and reproductive biology of small Australian snakes of
the genera Unechis and Suta (Elapidae). Journal of Herpetology 22(3), 307-315.
Shine, R. (1992). Relative clutch mass and body shape in lizards and snakes: is
reproductive investment constrained or optimized? Evolution 46, 828-833.
Shine, R. (1994). Allometric patterns in the ecology of Australian snakes. Copeia 4, 851-
867
Shine, R., Webb, J.K., Fitzgerald, M. and Sumner, J. (1998). The impact of bush-rock
removal on an endangered snake species, Hoplocephalus bungaroides (Serpentes:
Elapidae). Wildlife Research 25, 285-295.
Smith, W.J.S. & Robertson, P. (1999). National recovery plan for the striped legless
lizard (Delma impar): 1999-2003. Environment Australia, Canberra.
Stuwe, J. and Parsons, R.F. (1977). Themeda australis grasslands on the Basalt Plains,
Victoria: floristics and management effects. Australian Journal of Ecology 2, 467-
476.
Sutherland, W.J. (1996). Why census? In ‘Ecological Census Techniques: A handbook’.
(Eds. W.J Sutherland) pp. 1-9. (Cambridge University Press: New York).
Thorpe, R.S. (1975). Quantitative handling of characters useful in snake systematics with
particular reference of intraspecific variation in the Ringed snake Natrix natrix.
(L.) Biological Journal of the Linnean Society 7(1), 27-43.
Warwick, G.D., Kato, T.T. and Rose, B.R. (1998). Microhabitat use and home range
characteristics of blunt nosed leopard lizards. Journal of Herpetology 32, 183-
191.
Webb, J.K. and Shine, R. (1998). Using thermal ecology to predict retreat-site selection
by an endangered snake species. Biological Conservation 86, 233-242.
102

103
Webb, J.K. and Shine, R. (2000). Paving the way for habitat restoration: can artificial
rocks restore degraded habitats of endangered reptiles? Biological Conservation
92, 93-99.
Wilson, S. and Swan, G. (2003). A complete guide to reptiles of Australia. (Reed New
Holland: Sydney).
Zar J.H. (1999). ‘Biostatistical Analysis’ (4th Edn. Prentice-Hall: New Jersey).

70
Appendix I: Survey dates of all sites from late September 2005- late January 2006.
Survey period Sites Early Oct. 2005 Late Oct. 2005 Nov. 2005 Dec. 2005 Jan. 2006
Blacks Creek 4/10 - 7/10 26/10 - 30/10 9/11 - 13/11 10/12 - 13/12 18/01 - 22/01 Bochara Station 4/10 - 7/10 26/10 - 30/10 9/11 - 13/11 10/12 - 13/12 18/01 - 22/01 Boonderoo Nature Reserve 28/09 - 02/10 19/10 - 23/10 18/11 - 20/11 07/12 - 10/12 14/01 - 16/01 Camperdown-Foxhow Rd #1 28/09 - 02/10 19/10 - 23/10 18/11 - 20/11 07/12 - 10/12 14/01 - 16/01 Camperdown-Foxhow Rd #2 28/09 - 02/10 19/10 - 23/10 18/11 - 20/11 07/12 - 10/12 14/01 - 16/01 Caramut-Chatsworth Rd 4/10 - 7/10 26/10 - 30/10 9/11 - 13/11 10/12 - 13/12 18/01 - 22/01 Cavendish-Dunkeld Rd 4/10 - 7/10 26/10 - 30/10 9/11 - 13/11 10/12 - 13/12 18/01 - 22/01 “Challicum Park” 4/10 - 7/10 26/10 - 30/10 9/11 - 13/11 10/12 - 13/12 18/01 - 22/01 Chatsworth Rd 28/09 - 02/10 19/10 - 23/10 18/11 - 20/11 07/12 - 10/12 14/01 - 16/01 Cressy Trotting Track 28/09 - 02/10 19/10 - 23/10 18/11 - 20/11 07/12 - 10/12 14/01 - 16/01 Cressy-Shelford Rd 28/09 - 02/10 19/10 - 23/10 18/11 - 20/11 07/12 - 10/12 14/01 - 16/01 Forest Lane 4/10 - 7/10 26/10 - 30/10 9/11 - 13/11 10/12 - 13/12 18/01 - 22/01 Geggies Rd 28/09 - 02/10 19/10 - 23/10 18/11 - 20/11 07/12 - 10/12 14/01 - 16/01 Hamilton HWY-Tea-tree Creek 4/10 - 7/10 26/10 - 30/10 9/11 - 13/11 10/12 - 13/12 18/01 - 22/01 Lubra Creek 4/10 - 7/10 26/10 - 30/10 9/11 - 13/11 10/12 - 13/12 18/01 - 22/01 Old Ararat Rd 4/10 - 7/10 26/10 - 30/10 9/11 - 13/11 10/12 - 13/12 18/01 - 22/01 Rokewood Common 28/09 - 02/10 19/10 - 23/10 18/11 - 20/11 07/12 - 10/12 14/01 - 16/01 Rokewood-Shelford Rd 28/09 - 02/10 19/10 - 23/10 18/11 - 20/11 07/12 - 10/12 14/01 - 16/01
18/01 - 22/01 Rossbridge Flora Reserve 4/10 - 7/10 26/10 - 30/10 9/11 - 13/11 10/12 - 13/12 Vite Vite Rail Reserve 28/09 - 02/10 19/10 - 23/10 18/11 - 20/11 07/12 - 10/12 14/01 - 16/01

Appendix II: The relationships between mean percentage cover of vegetative species and occupancy rate of D. impar at sites.
0.00 1.00 2.00 3.00 4.00 5.00 6.00
D. impar occupancy rate
0.00
5.00
10.00
15.00
20.00
% C
over
of P
lant
ago
spp.
R Sq Linear = 0.014
0.00 1.00 2.00 3.00 4.00 5.00 6.00
D. impar occupancy rate
0.00
20.00
40.00
60.00
80.00
100.00
% C
over
of A
gric
ultu
ral s
pp.
R Sq Linear = 0.021
ii

0.00 1.00 2.00 3.00 4.00 5.00 6.00
D. impar occupancy rate
0.00
5.00
10.00
15.00
20.00
% C
over
of D
aisy
spp
.
R Sq Linear = 0.004
0.00 1.00 2.00 3.00 4.00 5.00 6.00
D. impar occupancy rate
0.00
2.00
4.00
6.00
8.00
10.00
% C
over
of E
ryng
ium
ovi
num
R Sq Linear = 0.001
iii

0.00 1.00 2.00 3.00 4.00 5.00 6.00
D. impar occupancy rate
0.00
0.50
1.00
1.50
2.00
% C
over
of S
tipa
spp.
R Sq Linear = 0.032
0.00 1.00 2.00 3.00 4.00 5.00 6.00
D. impar occupancy rate
0.00
20.00
40.00
60.00
80.00
% C
over
of P
oa s
pp.
R Sq Linear = 0.002
iv

0.00 1.00 2.00 3.00 4.00 5.00 6.00
D. impar occupancy rate
0.00
3.00
6.00
9.00
12.00
15.00
% C
over
of P
hala
ris a
quat
ica
R Sq Linear = 0.019
0.00 1.00 2.00 3.00 4.00 5.00 6.00
D. impar occupancy rate
0.00
20.00
40.00
60.00
80.00
% C
over
of A
ustr
odan
thon
ia s
pp.
R Sq Linear = 0.003
v

0.00 1.00 2.00 3.00 4.00 5.00 6.00
D. impar occupancy rate
0.00
20.00
40.00
60.00
80.00
100.00
% C
over
of T
hem
eda
Tria
ndra
R Sq Linear = 0.008
0.00 1.00 2.00 3.00 4.00 5.00 6.00
D. impar occupancy rate
0.00
2.00
4.00
6.00
8.00
10.00
12.00
% C
over
of T
arax
icum
offi
cina
le
R Sq Linear = 0.016
vi

vii