patronage in the allocation of public sector jobs · pdf filepatronage in the allocation of...
TRANSCRIPT
PATRONAGE IN THE ALLOCATION OF PUBLIC SECTOR JOBS
EMANUELE COLONNELLI‹, EDOARDO TESO:, AND MOUNU PREM;
January 11, 2018JOB MARKET PAPER
Latest version available here
Abstract. This paper studies patronage – the use of public sector jobs to reward politicalsupporters of the party in power – in Brazilian local governments. We use longitudinal dataon the universe of Brazilian public sector employees over the 1997-2014 period, matched withinformation on more than 2,000,000 political supporters of Brazilian local parties. Using aregression discontinuity design that generates exogenous variation in individuals’ connectionto the party in power, we first document the presence of significant political favoritism in theallocation of jobs throughout the entire Brazilian public sector hierarchy. Being a politicalsupporter of the party in power increases the probability of having a public sector job by10.5 percentage points (a 47% increase). Leveraging detailed information on supporters’and jobs’ characteristics, we then show that patronage is the leading explanation behindthis favoritism, with jobs in the public sector being used as reward for political supporters.We find that patronage has significant real consequences for selection to public employment,as the amount of support provided to the party in power substitutes qualifications as de-terminant of hiring decisions. Finally, consistent with this negative impact on the qualityof the selected public workers, we present evidence suggesting that patronage practices areassociated with a worse provision of public services.
We thank Alberto Alesina, Horacio Larreguy, Nathan Nunn and Andrei Shleifer for extensive advice andguidance throughout this project. We also thank Edoardo Acabbi, Mitra Akhtari, Barbara Biasi, Nick Bloom,Emily Breza, Katherine Casey, Arun Chandrasekhar, Erika Desserranno, Livio Di Lonardo, Pascaline Dupas,Marcel Fafchamps, Claudio Ferraz, Sid George, Xavier Jaravel, Asim Khwaja, Michael Kremer, Elisa Maffioli,Luca Maini, Davide Malacrino, Eduardo Montero, Diana Moreira, Rohini Pande, Matteo Paradisi, TommasoPorzio, Gautam Rao, Mark Rosenzweig, Raul Sanchez de la Sierra, Jeff Weaver, seminar participants atHarvard and Stanford University, and conference participants at EMCON (Northwestern 2016), LACEA-LAMES (Medellin 2016), PACDEV (UC Riverside 2017), DEVPEC 2017, and Ridge Lacea (Rio de Janeiro2017) for helpful comments and suggestions. We are grateful to Mitra Akhtary, Diana Moreira and LauraTrucco for sharing data on students’ test scores in municipal schools. Tairis Machado and Naoko Yatabeprovided excellent research assistance. Teso and Colonnelli are grateful to The Pershing Square Fund forResearch on the Foundations of Human Behavior for generous support. Teso gratefully acknowledges financialsupport from an IQSS Graduate Student Seed Grant. Colonnelli gratefully acknowledges financial supportfrom the Stanford Institute for Innovation in Developing Economies (SEED), and from the Private EnterpriseDevelopment in Low-Income Countries Initiative by the Centre for Economic Policy Research (CEPR) andthe Department For International Development (DFID). All remaining errors are our sole responsibility.‹PhD candidate, Department of Economics, Stanford University. [email protected].:PhD candidate, Department of Economics, Harvard University. [email protected].;Adjunct Professor, Department of Economics, Universidad del Rosario. [email protected].
1
PATRONAGE IN THE ALLOCATION OF PUBLIC SECTOR JOBS 2
1. Introduction
The quality of individuals employed in the public sector is a crucial determinant of gov-ernment performance. While studies in this area have analyzed how various incentives shapethe pool of individuals who decide to apply for public jobs, we know little about the pro-cess through which governments select public employees (Finan et al., 2015). Despite theintroduction of rigid civil service systems, in virtually all countries politicians retain somediscretion in this selection process (Evans and Rauch, 1999).1 While this flexibility can allowpoliticians to select individuals deemed able and motivated to perform the job, it can also besusceptible to patronage: public sector jobs could be used to reward political supporters ofthe party in power.2 As political support substitutes quality as a hiring criterion, patronagerepresents a potentially key impediment to the efficient recruitment of public sector workers.
Although accounts of this phenomenon are common,3 we have little systematic evidenceon the role of patronage in selection to public employment. Does patronage affect hiringin a modern bureaucracy? And if so, what is the impact of patronage on the quality ofthe public workforce and, ultimately, on public service delivery? The lack of data andsuitable empirical settings has made it challenging to convincingly document the presenceof patronage in public employment, let alone to study its consequences.
In this paper, we aim to fill this gap by testing for the presence and consequences ofpatronage in Brazilian local governments. First, we causally identify the effect of supportingthe party in power on the probability of obtaining a public sector job. We identify thepresence of significant political favoritism in the allocation of jobs throughout the entireBrazilian public sector hierarchy. We then show that patronage is the leading explanationbehind this result, ruling out alternative mechanisms that could explain the presence of thisfavoritism. In line with political support substituting individual quality as determinant ofhiring decisions, we find that supporters of the party in power are screened less on the basisof education and of skills valued by the private sector. Consistent with this negative effecton the quality of the public workforce, we then show that patronage practices are associatedwith a worse provision of public services.1As described by Grindle (2012), despite the establishment of civil service systems throughout the world,political actors often manage to retain discretion in the allocation of jobs through the use of temporarycontracts and the reliance on job categories exempted from the formal selection rules.2The term patronage indicates a quid pro quo relationship between the party in power and its politicalsupporters, in which public jobs are used as a reward and exchanged for political support (Weingrod, 1968).3Patronage was at the core of local political machines in the early twentieth century United States (Riordon(1905), Wilson (1961)). Chubb (1982) (p. 91) writes that in Southern Italy “a substantial part of politicsrevolves around the posto (‘job or position’) [...] a job signifies a vote and vice versa”. “[The use of patronage]in the governance of Latin America has a long tradition [...] easily dating to the conquest” (Grindle, 2010).
PATRONAGE IN THE ALLOCATION OF PUBLIC SECTOR JOBS 3
Brazilian local governments represent a very interesting setting to study patronage in pub-lic employment.4 Among Latin American countries, Brazil is considered a primary exampleof a de jure professionalized and meritocratic civil service (Iacoviello, 2006); yet, de factopoliticians can use temporary contracts and other exempt job categories to exert significantinfluence in the selection of public sector workers (Grindle, 2012). In this sense, Brazil isa paradigmatic example of the way in which political elites of developing countries manageto retain discretion in the allocation of public jobs after the introduction of a civil servicesystem, potentially leaving the door open to patronage practices.
The main challenge in the empirical investigation of patronage is the lack of comprehensiveinformation on both the careers of public sector workers and their connections with thepolitical power. We build a new dataset that allows us to overcome this challenge. Todo so, we combine data from two sources. First, we use a matched employer-employeedataset covering the entire Brazilian public sector for the 1997-2014 period. Second, weuse administrative data on about 2,000,000 political supporters of Brazilian local parties.These supporters are either i) local candidates, namely party members running for a seatin a Brazilian municipal council, or ii) campaign donors to a local party.5 Based on acandidate’s party affiliation or on the recipient of a donor’s contribution, we can clearly linkthese individuals to the local party that they support. The data allow us to track the labormarket careers of supporters of different parties, investigating whether those supporting theparty in power are favored in accessing public jobs. Crucially, the availability of data on theuniverse of public jobs allows us to analyze favoritism at all layers of the public hierarchy,from high level bureaucratic positions, to the middle-tiers of the bureaucracy and to jobs asfront service providers. Moreover, we have rich information on the characteristics of politicalsupporters, such as their education, private sector careers, and amount of support providedto a party, and of the public jobs that they obtain, such as the specific occupation andlength of the employment spell. This allows us to conduct several empirical tests to showthat patronage is the key driver of political favoritism in public employment, and to studyits effects.
To isolate the causal link between the provision of political support and an individual’spublic sector career, we exploit quasi-experimental variation in connection to the party inpower generated by very competitive municipal electoral races. Our regression discontinuitydesign compares supporters of the winning party in a municipal election (i.e. the party of4Brazil is a highly decentralized country, with municipalities responsible for hiring the majority of publicsector employees.5Most of the candidates running for a seat in a municipal council are not ultimately elected. Given the part-time nature of the job, even those elected to the council are allowed by law to have jobs outside of politics.This makes both elected and non-elected local candidates well suited to study how political supporters’careers in the public sector are affected by the power of the party to which they are connected. Importantly,throughout the whole paper, being a member of a local council is not considered a “public sector job”.
PATRONAGE IN THE ALLOCATION OF PUBLIC SECTOR JOBS 4
the elected mayor) to supporters of the losing party in the same election (i.e. the party ofthe runner-up mayoral candidate). We focus on elections where the margin of victory of thewinning party over the runner-up is small, and we show that supporters of the two sides inthese elections are not different along a wide set of pre-treatment characteristics.6
In the first step of our analysis, we show that supporters of the party in power are sig-nificantly favored in accessing public sector jobs. We find that providing political supportto the party in power increases the probability of being employed in the public sector by10.5 percentage points. Relative to a 22.5% employment probability for supporters of therunner-up party, this represents a 47% increase.7 This effect is large and statistically signifi-cant for both groups of supporters we analyze, implying that the provision of both electoraland financial support matters. Importantly, this political favoritism is not limited to a spe-cific layer of the public sector hierarchy, but it is present across all categories of jobs, frommanagerial positions at the top of the bureaucracy, to lower levels of the bureaucracy, andto professional and blue collar jobs. In other words, political favoritism in public hiring doesnot merely affect the careers of high level bureaucrats, but it is a widespread phenomenonacross the whole Brazilian public sector hierarchy.8
In the second step of the analysis, we show that patronage is the leading explanationbehind this favoritism in public employment: public sector jobs are exchanged for politicalsupport, in a quid pro quo relationship in which the amount of support provided substitutesqualifications as hiring criterion. We first document that a supporter’s public sector returnis proportional to the amount of support provided to the party. For a candidate running fora seat in a local council, we use the number of votes she brought to the party as a measure ofthe amount of support. For a donor, we use the amount of money donated to the campaignof the party. We show that, while all supporters of the party in power enjoy a certain degreeof favoritism, the extent of preferential access to public jobs and the associated monetaryreturns are monotonically increasing in the amount of support provided.6In our baseline specification, we focus on elections where the margin of victory is lower than 5%, but weshow robustness of our estimates to restricting this bandwidth to 3% or 1%.7Our regression discontinuity design uses supporters of the losing mayoral candidate as a control group forsupporters of the elected mayor. While this ensures that we are comparing individuals with similar pre-treatment unobservable characteristics, it also raises the potential concern that our estimate of politicalfavoritism not only captures a “reward” for the supporters of the mayor but also a “punishment” for thesupporters of the runner-up (Labonne and Fafchamps, 2017). To evaluate the magnitude of this “punishment”component, we use data on the careers of all individuals who were employed in a municipality in the yearsleading up to the election and did not support any party. Using these individuals as a control group, ina difference-in-differences design, we find estimates that are very similar to the ones obtained from theregression discontinuity design, suggesting that the “punishment” component of our estimates of favoritismis limited.8This political favoritism in accessing public sector jobs translates into a net increase in supporters’ labormarket earnings: on average, supporters of the mayor increase their earnings in the formal economy by 25%.
PATRONAGE IN THE ALLOCATION OF PUBLIC SECTOR JOBS 5
We then establish that providing political support to the party in power acts as a substitutefor individual quality. First, we collect information on the educational requirements toadequately perform each occupation in the Brazilian public sector. Coupled with informationon supporters’ educational attainment, this allows us to analyze whether supporters of theparty in power are more likely to be hired in a public job for which they do not have therequired educational level. We find that supporters of the party in power are screened less oneducation than supporters of the runner-up party. Among public sector workers, individualsin the former group are 17% more likely to be unqualified in terms of education than those inthe latter. Second, we use supporters’ private sector wages before the election as a measureof skills and productivity. We find that supporters of the party in power are screened lessalso along this dimension of quality. Political favoritism is particularly concentrated amongsupporters with lower private sector earnings.
We also evaluate whether two alternative interpretations of the political favoritism that wedocumented are consistent with the empirical evidence. In the first alternative interpretation,mayors are using their discretion to hire individuals who have higher ability, despite beingless qualified on observable dimensions. In other words, political favoritism is the result ofmayors having better “soft” information about members of their network, and thus being ableto screen them on dimensions of talent that we cannot observe. We evaluate the plausibilityof this interpretation in two ways. First, we calculate a measure of pre-election personalability conditional on observables, as in Besley et al. (2017) and Dal Bo et al. (2017). Thatis, we calculate private sector earnings residuals from a Mincer regression controlling foran individual’s demographic and job characteristics.9 Using this measure, we find thatsupporters of the party in power are screened less on this metric of residual personal ability.Second, we analyze political supporters’ long-run careers. Ex-ante unobservable dimensionsof “talent” should be revealed and become common knowledge after several years on apublic job.10 Hence, if mayors are using hiring discretion to select talented individuals intheir political network, these talented workers, once hired, should keep their job even if theparty in power changes. However, we find that this is not the case. The career of theseindividuals is strictly linked to the fortune of the party they support, as they lose their jobas soon as their own party loses power.
In the second alternative interpretation, political favoritism is the result of the mayor’sdesire to hire individuals with similar ideological views, as the matching between the ideology9Specifically, we estimate earnings residuals from a fully saturated Mincer regression using information onprivate sector earnings for all Brazilian workers and controlling for a full-set of interactions between age,education, gender, and sector and location of employment.10An important dimension of “talent” to perform a public job is an individual’s public service motivation,which could be not captured by our measure based on private sector earnings, and which mayors could betterobserve among members of their political network.
PATRONAGE IN THE ALLOCATION OF PUBLIC SECTOR JOBS 6
of the mayor and that of her bureaucrats increases organizational efficiency.11 However,contrary to this interpretation, we do not find that, among the mayor’s supporters, thosewho have a stronger ideological link to the party enjoy a higher degree of favoritism inaccessing public jobs. Supporters who recently switched political alliances are as likely tobe allocated a public sector job as individuals who have been loyal to the party for a longperiod of time.12
Taken together, these results indicate that patronage negatively affects selection to publicemployment, as the supporters who benefit most from patronage are less qualified on observ-able dimensions, are not characterized by better unobservable characteristics, and are notmore ideologically aligned to the party in power. However, there may still be positive effectsof patronage which we are unable to investigate. For instance, loyalty between supportersand parties could limit agency problems and increase supporters’ effort on the job.13 In otherwords, whether patronage is associated with a net negative effect on the quality of publicservices is an empirical question.
In the final part of the paper, we move a first step towards understanding the ultimateeffect of patronage on the quality of public goods provision. To do so, we use our datato build an estimate of patronage that is specific to each municipality and election in the2004-2012 period. We then exploit differential changes in within-municipality variation inthe extent of patronage over time to test whether patronage is associated with the qualityof public goods provision. We focus on one of the main responsibilities of Brazilian localgovernments: primary education. We use data on students’ standardized test scores asan objective measure of students’ achievements. We show that an increase in patronagein a municipality is associated with lower students’ test scores in the local public schools.This result provides suggestive evidence that patronage has significantly negative welfareconsequences.14
Our paper contributes to a recent body of research on the personnel economics of thebureaucracy. Papers in this growing literature have analyzed the role of incentives in the11Pursuing this goal can be especially valuable at high level of the public sector hierarchy, as having high-level bureaucrats who are ideologically aligned with the political power can facilitate policy implementation.However, this ideological alignment can be beneficial also at lower levels of the hierarchy, if workers exertmore effort when they care about the mission of the organization (Ashraf et al., 2014). However, see Rasuland Rogger (2015) for evidence that ethnic heterogeneity within bureaucracies leads to better organizationalperformance.12This is true for both the groups of supporters analyzed. Candidates who in the previous election wereaffiliated with a different party are as likely to benefit from favoritism as candidates who have remained loyalto the same party. Donors who were contributing to a different party are as likely to benefit from favoritismas donors who were loyal to the same party in their contributions.13A likely additional effect of patronage is to lead to an inefficiently large public sector workforce (Shleiferand Vishny, 1994).14Consistent with politicians increasing the size of the bureaucracy in presence of incentives to engage inpatronage practices, we also show that a higher extent of patronage is associated with higher growth in themunicipality personnel.

PATRONAGE IN THE ALLOCATION OF PUBLIC SECTOR JOBS 7
selection and performance of public sector workers (Dal Bo et al. (2013), Ashraf et al.(2014), Ashraf et al. (2016), Bertrand et al. (2016), Deserranno (2017)), the impacts ofpolitical oversight over the bureaucracy (Iyer and Mani (2011), Rogger (2014), Akhtariet al. (2016), Gulzar and Pasquale (2016), Ornaghi (2016)), and bureaucrats’ managementpractices (Rasul and Rogger, 2017).15 Weaver (2017) shows how corruption in hiring forpublic sector jobs can lead to the selection of higher quality workers if quality and willingnessto bribe are positively correlated.16 Xu (2017) studies patronage in the historical context ofthe British colonies, showing that socially connected governors performed worse during thehistorical period characterized by political discretion in the appointment of governors.17 Wecontribute to this literature by providing the first causal analysis of the presence and extentof patronage in a contemporary setting, and along the whole public sector hierarchy, and bystudying how patronage (negatively) affects the process of selection to public employment.More generally, by showing how political incentives affect a government’s allocation of publicjobs and the quality of the pool of hires, we speak to the literature on the role of socialincentives in organizations (Ashraf and Bandiera, 2017). Finally, we contribute to a longliterature on the role of political connections for firms (Fisman (2001), Khwaja and Mian(2005), Faccio (2006), Faccio et al. (2006), Cingano and Pinotti (2013), Schoenherr (2017))and individuals (Markussen and Tarp (2014), Gagliarducci and Manacorda (2017), Folkeet al. (2017), Labonne and Fafchamps (2017)).
The rest of the paper is organized as follows. In Section 2 we provide details on keyfeatures of the Brazilian institutional context that are of interest for our analysis. In Section3 we describe the data sources. In Section 4 we present the empirical strategy. In Section5 we present our estimates of political favoritism in public employment. In Section 6 weinvestigate the nature of this favoritism, showing that patronage is its leading explanationand that this negatively affects selection to public employment. In section 7 we discussthe relationship between patronage and the quality of public goods provision. Section 8concludes.15Best et al. (2016) quantify how much of the variation in state effectiveness is due to individual bureaucrats’effectiveness, in the context of Russian public procurement agencies.16Guardado (2017) studies office-selling in the context of colonial provincial governorships in Peru in the17th-18th centuries, linking the type of the appointed governors to long-run development.17Other studies of patronage include Folke et al. (2011) and Ujhelyi (2014), who exploit the different timingof the introduction of civil service systems across U.S. states to study its impact on incumbents’ re-electionprobability and allocation of government spending, respectively. The theoretical literature on patronage hasemphasized how redistribution through public sector jobs emerges as a credible way of rewarding clientssince it solves the political-commitment problem between the client and the patron (Robinson and Verdier(2013)). Acemoglu et al. (2011) argue that inefficient states based on patronage can emerge and persistas the result of a winning coalition between the elite, that is interested in limiting redistribution, and thebureaucrats, who are interested in maintaining their rents. Drugov (2015) underlines how patronage canlead workers to increase effort due to the prospects of promotion.

PATRONAGE IN THE ALLOCATION OF PUBLIC SECTOR JOBS 8
2. Institutional Context
In this section, we first describe the main features of Brazilian municipal elections andthe role played by the two groups of political supporters which are the focus of our paper,namely candidates to Brazilian local councils and individual donors. We then discuss theselection process of public sector workers in Brazil.
2.1. Local Politics in Brazil. Brazil’s 5,570 municipalities are governed by a mayor (prefeito)together with a council of local legislators (Camara de Vereadores), simultaneously electedevery four years. A voter can cast two votes in a municipal election: one for a mayoralcandidate and one for an individual candidate to the council (or, alternatively, a genericvote for a party).
Mayors are term-limited, allowed to be in office in a municipality for a maximum of twoconsecutive terms. Mayors are elected by plurality rule, with municipalities with more than200,000 registered voters holding a second round if no candidate has received a majority inthe first round. While mayors are associated with a party, they are typically supported bya coalition of parties.18
The first group of political supporters analyzed in this paper are candidates who run fora seat in the council of local legislators. Candidates for the local council run individually ina unique “at-large” district comprising the whole municipality, and they are elected usingan open-list proportional representation system.19 Unlike mayors, members of the councildo not face term limits. Candidates are members of a party, with parties generally formingpre-election coalitions.20
Council seats are awarded to a coalition in proportion to the total number of “personal”votes received by its candidates and of “generic” votes received by the parties comprisingthe coalition.21 The seats allocated to a coalition are then assigned to the candidates ofthe coalition who received the highest number of “personal” votes. Therefore, the electoralsystem gives strong incentive to parties and coalitions to present lists with large numbers1881% of mayoral candidates over the 2000-2012 period were supported by a coalition of parties (authors’own calculations using electoral data from the TSE).19The number of council seats, ranging from 9 to 55, varies as a function of the population in the municipality.The allowed number of seats was established by the 1988 Brazilian Constitution up until the 2000 elections,by Resolution 21.702 elaborated by the Tribuanal Superior Eleitoral for the 2004 and 2008 elections, andby the 58th amendment to the Brazilian Constitution for the 2012 elections. These rules leave a degree ofdiscretion to local legislators with respect to the choice of the number of council seats, establishing only amaximum (but not a minimum) number of seats as a function of population size (Dahis, 2015).2087% of parties running in a local election over the 2000-2012 period were part of an electoral coalition.Parties supporting different mayors cannot be part of the same coalition for the local council election.21Specifically, seats are awarded using an electoral quota and the d’Hondt formula.

PATRONAGE IN THE ALLOCATION OF PUBLIC SECTOR JOBS 9
of candidates, since even votes for non-viable candidates are valuable as they contribute toincrease the number of seats allocated to the coalition.22
Although being a local legislator is remunerative, with the average legislator earning awage that is approximately 2.6 times the average wage in her municipality (Ferraz andFinan, 2011), elected candidates are not required to give up their outside jobs upon election,as being a legislator is a part-time activity.23
The second group of political supporters analyzed in this paper are donors to a municipalelection campaign. Up until the 2012 municipal elections, mayoral candidates and candidatesto the local council could receive campaign donations from both corporations and individuals,with the latter being allowed to donate up to 10% of their gross annual income.24 Law no.8713/1993 requires candidates to submit to electoral courts a detailed overview of all thecampaign contributions received in the election cycle. In the 2008 and 2012 elections, theaverage share of funds that came from individuals was 28% for mayoral candidates and 40%for candidates to the local council.25 Individual donors make up a very small share of thepopulation, with only 0.42% of Brazilians who were at least 18 years old donating in the2012 municipal election.26
2.2. The Allocation of Jobs in the Public Sector. Spending by Brazilian municipalitiesis mainly financed by transfers from the state and federal government, with municipalitiesbeing responsible for the provision of a wide range of public goods in areas such as education,health and transportation. (Afonso and Araujo, 2000, Souza, 2002). Municipalities employ22Electoral rules limit the number of candidates on the ballot by specifying that each party (respectively,coalition) can present a maximum of 1.5S (respectively, 2S) candidates, where S is the total number ofcouncil seats in the municipality. For the elections from 2000 to 2012, we find that coalitions take advantageof this rule, with each additional seat in the council being associated with a 1.7 increase in the number ofcandidates running in a coalition. However, the fact that the coefficient is less than 2 potentially impliesthat intra-coalition competition introduces some incentive to limit the number of candidates on the ballot.23As described in Ferraz and Finan (2011), 98 percent of legislators elected in the 2004 election reportedhaving another professional activity outside of politics. In our data, we indeed find no evidence that candi-dates elected to the council give up their external jobs. Members of the local council review and approvethe local budget proposed by the mayor (with the power of vetoing certain budget items), and can submitbills mainly directed to the adoption of social programs.24Until 2015, there was no limit on the total amount of donations a candidate or a party could receive.Donations from corporations have been prohibited by Law 13.165/2015. Therefore, since 2016, candidatescan finance their campaign only with donations from individuals or using party funds.25These shares are based on the authors’ calculations using the campaign data from the Tribunal SuperiorEleitoral described in section 3.1.26While most of the amounts donated are relatively small, cases of large donations by individuals relatedto corporations are not uncommon. In the 2012 election, the largest single donor was a businessman ofthe luxury real estate sector, who donated a total of 2.85 million Reais (about 900,000 USD). See http://veja.abril.com.br/brasil/empresario-da-construcao-da-r-3-milhoes-a-campanhas/, accessed Oc-tober 2017.
PATRONAGE IN THE ALLOCATION OF PUBLIC SECTOR JOBS 10
the largest share of Brazilian public sector employees – 56% as of 2014, up from 40% in1997.27
Selection in most public sector jobs is based on objective selection criteria: applicantspresent academic and professional credentials, and undertake a formal civil service exam-ination (Concurso Publico), which is job-specific and consists of a combination of writtenand oral tests. Article 37 of the Constitution establishes clear transparency requirements forthe selection of public sector workers.28 Public sector workers hired through this procedureacquire tenure after three years of service, following which they can be fired only for reasonsof misconduct after a judicial decision.
Individuals can be hired in a public sector position without passing the civil service exami-nation under three special exempt categories of jobs: commissioned posts (cargos comission-ados), positions of trust (funcao de confianca), and temporary jobs (emprego temporario).Hiring in the first two categories is limited to positions of manager, supervisor or advisor,allowing politicians discretion in the selection of people in leadership roles.29 In practice, thevague language used by the law leaves ample discretion to politicians, with possible casesof violations when individuals are hired in a commissioned post or in a position of trusteven though their occupation does not fall under the leadership categories required by theBrazilian Constitution.30
Politicians can also hire temporary public servants to “meet a temporary need of excep-tional public interest” (Artcle 37 IX of the Brazilian Constitution). In these cases, the lawstates that no civil service exam is necessary and that the selection process can be limited tothe analysis of an applicant’s curriculum, without other formal criteria of objective measure-ment. The law also contains a detailed list of the instances that fall under this category, andpoliticians can be prosecuted in case they hire temporary workers without justification.31
27These shares are based on the authors’ calculations using data from the RAIS dataset described in section3.2.28Article 37 of the Constitution states: “The governmental entities and entities owned by the Government inany of the powers of the union, the states, the federal district and the Municipalities shall obey the principlesof lawfulness, impersonality, morality, publicity, and efficiency...”29The difference between positions of trust and commissioned posts is that the former requires that theindividual is already employed as a civil servant, whereas the latter allows for the hiring of individuals whohave never passed the civil service examination.30For example, in 2012 the mayor of the municipality of Jundiai exploited commissioned posts and ad-hoc lawsto appoint more than 300 people to jobs that did not fall under a leadership category. The public prosecutor ofSao Paulo ordered all individuals to be fired, and initiated a trial against the mayor. See http://www.mpsp.mp.br/portal/page/portal/noticias/noticia?id_noticia=14608320&id_grupo=118, accessed October2017.31For instance, in 2015 the public prosecutor of Pernambuco accused the mayor of the mu-nicipality of Belo Jardim of illegally hiring 574 teachers through temporary contracts. Seehttp://www.mppe.mp.br/mppe/index.php/comunicacao/noticias/ultimas-noticias-noticias/5162-mppe-denuncia-ex-prefeito-de-belo-jardim-por-contratacoes-ilicitas-de-professores,accessed October 2017.
PATRONAGE IN THE ALLOCATION OF PUBLIC SECTOR JOBS 11
In addition to the above exempt categories, there is some anecdotal evidence of casesof fraud in public examinations, especially at the local level. In 2012, a reportage by theteam of journalists of Fantastico, one of the most popular TV shows of the premier Braziliannetwork “Globo,” uncovered an astonishing number of such cases across the country.32 Illegalinterference with the public examinations is typically achieved by (i) providing individualswith the answer sheet prior to the exam, (ii) ex-post replacing specific individual tests withbetter ones, and (iii) directly changing the list of winning candidates.33
3. Data
We use information from two main sources. Data on electoral results, candidates tomunicipal councils, and individual donors come from the Brazilian Electoral Commission(TSE). Data on public sector employment come from the Relacao Anual de InformacoesSociais database (RAIS). In this section we (i) provide a description of the data sources,(ii) discuss the matching of the datasets, and (iii) present a number of descriptive facts thatshow the importance of political dynamics in driving public employment.34
3.1. Electoral Data. We obtain the publicly available electoral data for the 2000, 2004,2008, and 2012 municipal elections from the Tribunal Superior Eleitoral (TSE). The datacontain electoral results for both mayoral elections and elections for the local council.35
We also have information on the coalition each candidate belongs to, and on the mayoralcandidate supported by the coalition.
The TSE provides demographic information on the candidates, including their educationand the amount of money raised during the campaign. Importantly, we have informationon each candidate’s individual tax identification number, called CPF (Cadastro de PessoasFısicas). There are 1,034,194 candidates who run for a seat in the local council over thisperiod, with about 27% of candidates running in more than one election. After droppingthe few cases (0.3%) of candidates without valid information on their CPF, we are left witha sample of 1,031,083 unique members of a political party who run in an election for thelocal council over the 2000-2012 period. We code each candidate as a supporter of a specific32See “Golpe transforma concursos publicos em cabides de emprego”: http://g1.globo.com/fantastico/noticia/2012/06/golpe-transforma-concursos-publicos-em-cabides-de-emprego.html, accessedOctober 2017.33For example, in the municipality of Novo Barreiro, in the state of Rio Grande do Sul, the public prosecutorfound the mayor and other members of the local administration guilty of such a fraudulent scheme: acompany bidding to administer the test won the tender under the condition that a few specific jobs were“kept available” for specific political appointees. In the nearby municipality of Itati, an exam’s supervisornoticed that several applicants turned in blank tests, and then ended up being selected for the position.34In the analysis of section 7 we use a number of additional municipal-level variables. We describe thesevariables and their sources in that section of the paper.35For the remainder of the paper, we use the term “candidate” to refer to a candidate to the local council;we use the expression “mayoral candidate” to refer to a candidate who run for mayor of a municipality.
PATRONAGE IN THE ALLOCATION OF PUBLIC SECTOR JOBS 12
mayoral candidate if she belongs to a party in the coalition that supports that mayoralcandidate.36
For the 2004, 2008, and 2012 municipal elections, TSE provides data on all individuals’campaign contributions in municipal elections. We keep all records for which the datacontain valid information on a donor’s CPF.37 We code each donor as a supporter of a specificmayoral candidate if she either (i) contributed to that mayoral candidate’s campaign, or (ii)contributed to the campaign of a candidate to the local council who belongs to the coalitionthat supports that mayoral candidate.38 It is extremely rare for an individual to donateto the campaign of parties that support different mayoral candidates, and we drop the fewcases (0.32%) where this happens, since this prevents us from identifying the donor as asupporter of a unique mayoral candidate in an election. Our final sample includes donationsby 1,057,216 unique individuals.39
3.2. Labor Market Data. The principal source of employment data is the RAIS (RelacaoAnual de Informacoes Sociais) database. The RAIS database provides a unique picture ofthe universe of Brazilian public sector workers, as well as a general picture of private sectoremployment in the Brazilian formal economy. RAIS is an administrative matched employer-employee dataset managed by the Brazilian Ministry of Labor (Ministerio do Trabalho eEmprego - MTE). The dataset covers the universe of workers among those employed in theBrazilian public sector and in the formal private sector (Menezes-Filho et al., 2008).40 Eachindividual in RAIS is assigned a unique administrative worker identifier, which allows fortracking of the individual over time and across employers. We use data for the years 1997to 2014.
Two categories of individuals who are formally employed do not appear in RAIS : electedpoliticians and self-employed individuals. However, in such circumstances, only the specificjob as politician or self-employed worker is missing: all other jobs of the politician or self-employed individual do appear in the dataset. Importantly, throughout the analysis, when36Appendix Table A1 provides summary statistics for the universe of candidates in our dataset. Only 7%of candidates in our dataset are ever elected to the council. Conditional on running in multiple elections, itis not rare for a candidate to change party (the average number of parties is 1.72). The large majority ofcandidates is male, and there is wide variation in candidates’ level of education.37Missing information on a donor’s CPF is extremely rare for the 2008 and 2012 elections, but about 36% ofdonations in the 2004 elections do not include this information. We also drop donors who are also politicalcandidates during the 2000-2012 period, since these individuals enter our first group of supporters.38While we choose to identify an individual as a supporter simply based on the extensive margin of herdonations (whether she donated to a candidate) and not on the intensive margin (how much she donated),we will also leverage information on the amount donated to investigate possible heterogeneous effects in theamount of financial support provided.39Appendix Table A2 provides summary statistics for the universe of donors in our dataset. The largemajority of donors are active only in one election and donate only to a single party. The average donationis of R$727, corresponding to about USD230.40The dataset also includes information on employees of no-profit and international organizations.
PATRONAGE IN THE ALLOCATION OF PUBLIC SECTOR JOBS 13
we talk about labor market outcomes in the public sector we are excluding the jobs of electedcandidates as local legislators.
For each worker-job pair, the RAIS database contains information on payroll, hiring andseparation dates, employer identifier, as well as location and industry of the employer. Addi-tionally, it contains details on the hours worked by contract, the type of contract (permanentor temporary), the specific occupation of each worker, and the worker’s level of education.Finally, the data contain information on a worker’s CPF.
The Brazilian official occupational classification system divides the Brazilian labor mar-ket in 2,511 occupations. We complement the data from RAIS with information from theClassificacao Brasileira de Ocupacoes 2002 (CBO), an official publication by the Brazil-ian Ministry of Labor which describes, among other things, the educational level typicallyrequired to properly perform a specific occupation. We use this information to code, foreach worker-job pair in RAIS, whether the worker is qualified for the job (namely, whetherher educational level is the same or higher than the educational level typically required toperform her occupation).41
3.3. Matching and Final Dataset. We match our datasets of candidates and donors toRAIS using the individual identifier CPF, which is available in both datasets. We match66.9% of political supporters to RAIS (67.3% of candidates and 66.4% of donors). Of these,69% of candidates and 52% of donors are employed in the public sector for at least one yearin the period 1997-2014.42
We construct a panel dataset at the supporter-year level, with information on employ-ment status, annual earnings, and job characteristics, for the public and the private sectorseparately.43 Each individual is allowed to have both a public sector and a private sector jobin the same year.44
We have detailed information on a supporter’s occupation. We can categorize each publicsector job as a “permanent job”, or as a “temporary job”, the latter being one for which41We code this variable as missing for the few occupations for which the CBO publication does not clearlyspecify a required educational level.42The 33.1% of supporters who are not matched to RAIS are never employed in the public sector or asemployees in the formal private sector in this period. These supporters are either unemployed, workingin the informal economy, self-employed, or holding a job as elected politician (or a combination of these)during the entire 1997-2014 period. Importantly, the presence of an administrative individual identifier inboth datasets means that there is no error in the matching procedure. This allows us to include also theunmatched supporters in the analysis, coding them as never employed in the public or private sector in the1997-2014 period.43If an individual does not work in a specific sector in a given year we impute 0 earnings to the respectivevariable. All earnings measures are expressed in 2000 Brazilian Reals. To reduce the possible influence ofoutliers in the earnings variables in our main analysis, we winsorize the earnings variables at the 1% in oursample of political supporters.44A small subset of individuals have multiple occupations within the same sector in the same year. For thesecases, we keep the job with the highest wage, following the common practice of other studies that use theRAIS dataset (Menezes-Filho et al., 2008, Colonnelli and Prem, 2017).
PATRONAGE IN THE ALLOCATION OF PUBLIC SECTOR JOBS 14
the worker has been hired through a temporary contract or through an exempt occupationalcategory. We also categorize each job into one of five broad occupational categories followingthe CBO classification: managerial, professional, high skilled technical, clerical, and blue col-lar.45 Finally, as described in the previous section, information from the CBO categorizationof occupations allows us to code each supporter employed in the public sector as qualifiedor unqualified, in terms of education, to perform her specific occupation.46
3.4. Descriptive Facts About the Brazilian Public Sector.
3.4.1. Public Sector Turnover Spikes in Election Years. The first interesting stylized factthat emerges from the data is that electoral cycles are a crucial determinant of the size andcomposition of the public sector workforce. Panel A of Figure 1 plots the average share ofyearly new hires and terminations in the municipal public sector in Brazilian municipalitiesover the 1999-2014 period.47 We compute shares using as denominator the total number ofpublic sector workers in the municipality in the previous year.
Local public sector turnover is significantly higher in a year that immediately follows alocal election (indicated by a green vertical line in the figure).48 As it is clear from AppendixFigure A1, there is no significant spike in private-sector turnover following an election year.
We formally investigate the magnitude of this turnover effect in Table 1.49 Years followinga municipal election see an increase in the share of new hires in the local public sector of about7.9 percentage points, and an increase in the share of terminations of about 4.2 percentagepoints (columns 1 and 2). These represent a 50% and 36% increase relative to other years.50
The larger increase in the share of new hires relative to the increase in terminations translates45In the public sector, the most represented jobs in the managerial category are: manager of public sectoragency, school headmaster, administrative director, health services manager; the most represented jobs inthe professional category are: primary school teacher, secondary school teacher, doctor, nurse; the mostrepresented jobs in the high skilled technical jobs category are: primary school teacher, nursing assistant;the most represented jobs in the clerical category are: administrative assistant, administrative supervisor,receptionist; the most represented jobs in the blue collar category are: garbage collector, community healthworker, driver.46Before 2003, RAIS uses a previous occupational classification. While it is possible to construct a matchingbetween the previous and the current classification, the former is less detailed and the same occupationalcode matches multiple, more detailed occupational codes in the latter. For this reason, when we exploitinformation on a worker’s specific occupation we will focus on the 2003-2014 period.47For each municipality, the new hires are defined as the public sector workers employed by the municipalitywho where not public sector workers in the same municipality in the previous year. The terminations aredefined as the municipal public sector workers who were employed by the municipality in the previous yearand are not employed in the current year.48This is consistent with Akhtari et al. (2016), who document the high rate of turnover for teachers andheadmasters in local schools following the change of the party in power in a municipality.49The panel of municipalities is not balanced since some municipalities are merged or split during this period.We obtain very similar estimates if we restrict the sample to a balanced panel of municipalities that existand have positive local public sector employment throughout the entire period.50In all specifications, we include municipality-specific time trends to account for municipality-specific trendsin public sector employment over the period.
PATRONAGE IN THE ALLOCATION OF PUBLIC SECTOR JOBS 15
into a significant net increase in local public sector employment following an election year:the number of public sector employees in municipal governments grows 62% more in yearsfollowing a local election (see column 3 of the table and panel B of Figure 1).
As shown in columns 4-7 of Table 1 (and in Appendix Figures A2), most of the abnormalturnover is driven by temporary jobs in the public sector, although the effect is significantalso for permanent positions. Furthermore, Appendix Figures A3 show that these trends aresignificant for all categories of jobs, from managerial and professional positions to clericaland blue collar jobs.
While post-election years see lower municipal government expenditures (see column 8 ofTable 1), expenditures in personnel is higher (see column 9 of Table 1), consistent with thehigher growth in local public employment discussed above.51
3.4.2. Political Supporters Are Over-represented Among Public Sector Workers. Table 2 pro-vides an overview of the labor market careers of political supporters in the period 1997-2014.We compare local candidates and donors to the population of 87.5 millions workers whoenter the RAIS dataset during this period, having been employed in the formal economy forat least one year. For the purpose of this table, we exclude the 33.1% of supporters who arenot present in RAIS, since they are never employed in the formal economy in the 1997-2014period.
The most striking point of the table is the over-representation of political supportersamong public sector employees. Political supporters are significantly more likely than theaverage Brazilian worker to have been ever employed in the public sector: among the universeof workers, 19% are employed in the public sector on at least one year over the 1997-2014period, while this share is 52% for donors and 69% for local candidates. This is true for bothtemporary and permanent positions, and especially for public sector jobs at the municipallevel.52
Additional interesting facts emerge from the data. Public sector occupations are lucrativerelative to private sector ones: the average annual earnings of a job in the public sector areabout 90% higher than the average earnings in the private sector (13,659 Brazilian Realsversus 7,070 Reals).53 Conditional on being employed in the public sector, earnings of localcandidates are on average slightly lower than the earnings in the population (median wages51The fact that we do not see higher municipal expenditures in budget items other than personnel suggestthat the higher growth in public employment cannot be explained by the mayor’s need to hire new workersin post-election years because of an overall municipal increase in investment or the implementation of newpolicies promised during the campaign.52Political supporters are instead significantly less likely to be ever employed in the private sector.53Appendix Table A3 presents a more extensive investigation of the public sector wage premium, by com-paring log wages in the public and private sector controlling for the worker’s job tenure, the worker’s age,municipality fixed effects, year fixed effects, and 43 occupations fixed effects. Even after conditioning onjob’s and worker’s characteristics, a public job pays on average 7% more than a private sector job, with asignificant premium in all occupational categories. The wage gap is even larger if we consider hourly wages.
PATRONAGE IN THE ALLOCATION OF PUBLIC SECTOR JOBS 16
are very similar), while local candidates earn more in the private sector. Consistent withdonors belonging to a relatively wealthy group of citizens, their earnings in both the publicand the private sector are on average the highest across the three groups of workers.
Figure 2 reveals that the public sector careers of political supporters seem affected bythe fortunes of the political party that they support. We plot the evolution of supporters’employment probability in the public sector around the time of a municipal election, from3 years before to 6 years after the election. Supporters are divided between candidatesand donors, and we further differentiate between those who supported the mayor who endsup winning the election and those who supported one of the losing mayoral candidates.Supporters of the party who wins the mayoral elections experience a sharp increase in publicsector employment probability that takes place precisely in the year of the election andsomewhat dissipates at the end of the term. In the next section, we will use an identificationstrategy based on close races to identify whether these trends underline a causal relationshipbetween political support and an individual’s public sector career.
4. Measuring Favoritism: Empirical strategy
4.1. Main Regression Discontinuity Design Estimates. Our first goal is to estimatethe extent of political favoritism in Brazilian public sector employment, that is the causal ef-fect of supporting the party in power on an individual’s probability of having a public sectorjob. In the ideal experiment, we would compare the public sector employment probabilityof supporters of the party in power, with their employment probability in the counterfac-tual scenario in which they had not been supporters of the party in power. In order toapproximate this ideal experiment, we need to find a suitable control group for supportersof the party in power. Clearly, supporters of the party in power are not a random subsetof the population. One important source of unobservable heterogeneity is public servicemotivation: individuals with stronger public service motivation will be more likely to bothbe employed in the public sector and support a political party.
For this reason, our identification strategy compares the labor market outcomes of sup-porters (candidates and donors) of the successful mayoral candidate with the outcomes ofsupporters of the runner-up mayoral candidate who runs in the same election (i.e. in thesame municipality and in the same year). While both these groups of individuals are politicalsupporters, the choice of which party to support is not random. For instance, individualswho are actively seeking access to public sector employment may be more likely to decide tosupport the stronger party in the election. For this reason, we further restrict the sample toelections where the margin of victory of the winning party over the losing party is small. Theidentification assumption is that, for these very competitive electoral races, whether a partywins or loses the election is “as good as” random. If this assumption holds, then whether a
PATRONAGE IN THE ALLOCATION OF PUBLIC SECTOR JOBS 17
supporter becomes connected to the party in power or to the losing party is also “as goodas” random.54
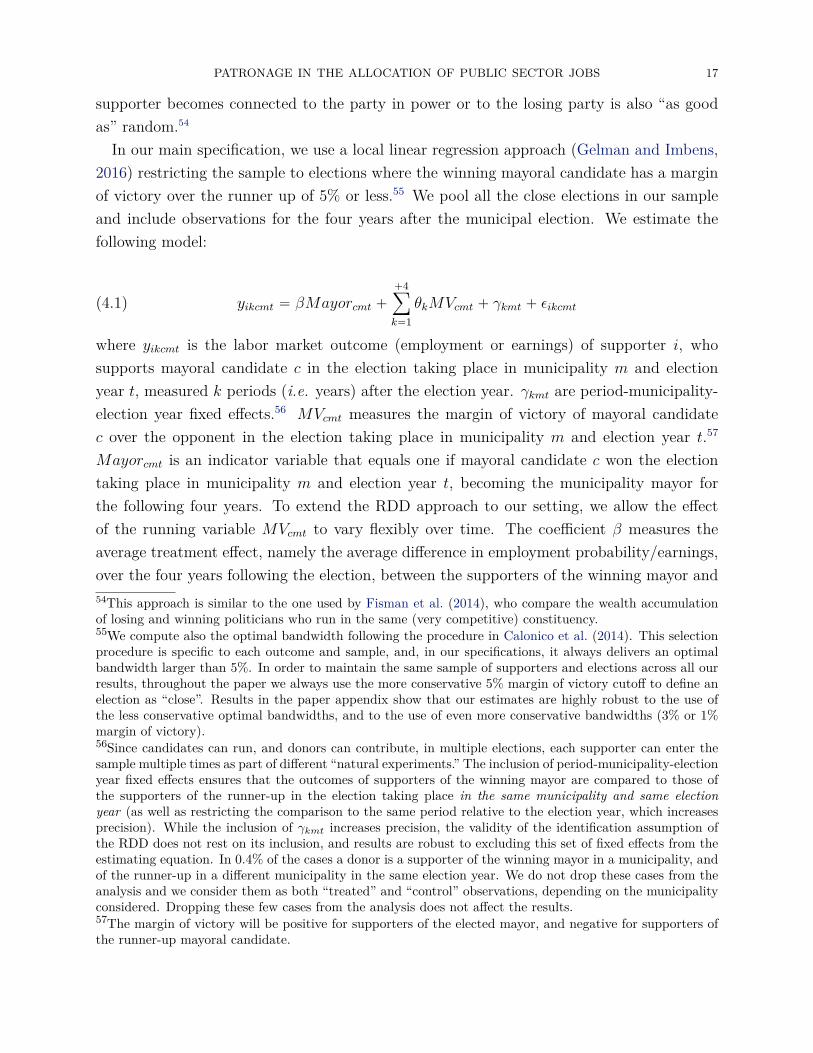
In our main specification, we use a local linear regression approach (Gelman and Imbens,2016) restricting the sample to elections where the winning mayoral candidate has a marginof victory over the runner up of 5% or less.55 We pool all the close elections in our sampleand include observations for the four years after the municipal election. We estimate thefollowing model:
(4.1) yikcmt “ βMayorcmt ``4ÿ
k“1θkMVcmt ` γkmt ` εikcmt
where yikcmt is the labor market outcome (employment or earnings) of supporter i, whosupports mayoral candidate c in the election taking place in municipality m and electionyear t, measured k periods (i.e. years) after the election year. γkmt are period-municipality-election year fixed effects.56 MVcmt measures the margin of victory of mayoral candidatec over the opponent in the election taking place in municipality m and election year t.57
Mayorcmt is an indicator variable that equals one if mayoral candidate c won the electiontaking place in municipality m and election year t, becoming the municipality mayor forthe following four years. To extend the RDD approach to our setting, we allow the effectof the running variable MVcmt to vary flexibly over time. The coefficient β measures theaverage treatment effect, namely the average difference in employment probability/earnings,over the four years following the election, between the supporters of the winning mayor and54This approach is similar to the one used by Fisman et al. (2014), who compare the wealth accumulationof losing and winning politicians who run in the same (very competitive) constituency.55We compute also the optimal bandwidth following the procedure in Calonico et al. (2014). This selectionprocedure is specific to each outcome and sample, and, in our specifications, it always delivers an optimalbandwidth larger than 5%. In order to maintain the same sample of supporters and elections across all ourresults, throughout the paper we always use the more conservative 5% margin of victory cutoff to define anelection as “close”. Results in the paper appendix show that our estimates are highly robust to the use ofthe less conservative optimal bandwidths, and to the use of even more conservative bandwidths (3% or 1%margin of victory).56Since candidates can run, and donors can contribute, in multiple elections, each supporter can enter thesample multiple times as part of different “natural experiments.” The inclusion of period-municipality-electionyear fixed effects ensures that the outcomes of supporters of the winning mayor are compared to those ofthe supporters of the runner-up in the election taking place in the same municipality and same electionyear (as well as restricting the comparison to the same period relative to the election year, which increasesprecision). While the inclusion of γkmt increases precision, the validity of the identification assumption ofthe RDD does not rest on its inclusion, and results are robust to excluding this set of fixed effects from theestimating equation. In 0.4% of the cases a donor is a supporter of the winning mayor in a municipality, andof the runner-up in a different municipality in the same election year. We do not drop these cases from theanalysis and we consider them as both “treated” and “control” observations, depending on the municipalityconsidered. Dropping these few cases from the analysis does not affect the results.57The margin of victory will be positive for supporters of the elected mayor, and negative for supporters ofthe runner-up mayoral candidate.
PATRONAGE IN THE ALLOCATION OF PUBLIC SECTOR JOBS 18
the supporters of the runner-up in the same election. We present results both pooling allsupporters (candidates and donors) and estimating the effect separately for the two types ofsupporters. Throughout the analysis, standard errors are double clustered at the supporterand election level.
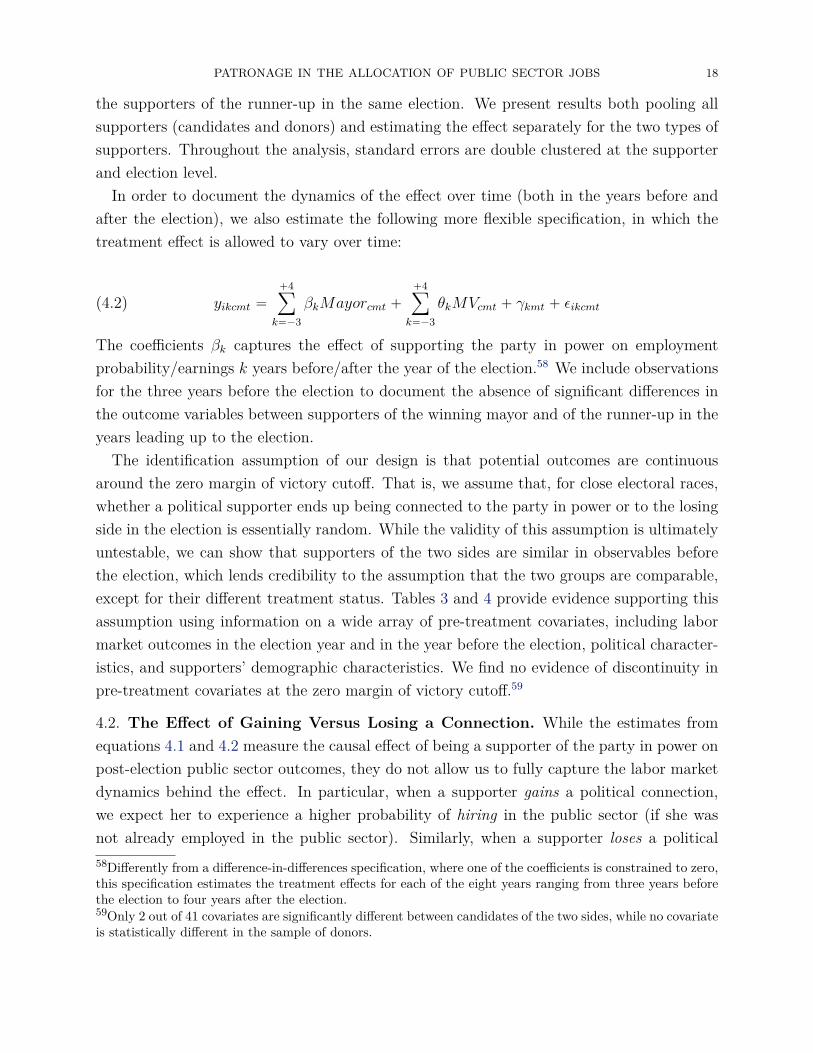
In order to document the dynamics of the effect over time (both in the years before andafter the election), we also estimate the following more flexible specification, in which thetreatment effect is allowed to vary over time:
(4.2) yikcmt “`4ÿ
k“´3βkMayorcmt `
`4ÿ
k“´3θkMVcmt ` γkmt ` εikcmt
The coefficients βk captures the effect of supporting the party in power on employmentprobability/earnings k years before/after the year of the election.58 We include observationsfor the three years before the election to document the absence of significant differences inthe outcome variables between supporters of the winning mayor and of the runner-up in theyears leading up to the election.
The identification assumption of our design is that potential outcomes are continuousaround the zero margin of victory cutoff. That is, we assume that, for close electoral races,whether a political supporter ends up being connected to the party in power or to the losingside in the election is essentially random. While the validity of this assumption is ultimatelyuntestable, we can show that supporters of the two sides are similar in observables beforethe election, which lends credibility to the assumption that the two groups are comparable,except for their different treatment status. Tables 3 and 4 provide evidence supporting thisassumption using information on a wide array of pre-treatment covariates, including labormarket outcomes in the election year and in the year before the election, political character-istics, and supporters’ demographic characteristics. We find no evidence of discontinuity inpre-treatment covariates at the zero margin of victory cutoff.59
4.2. The Effect of Gaining Versus Losing a Connection. While the estimates fromequations 4.1 and 4.2 measure the causal effect of being a supporter of the party in power onpost-election public sector outcomes, they do not allow us to fully capture the labor marketdynamics behind the effect. In particular, when a supporter gains a political connection,we expect her to experience a higher probability of hiring in the public sector (if she wasnot already employed in the public sector). Similarly, when a supporter loses a political58Differently from a difference-in-differences specification, where one of the coefficients is constrained to zero,this specification estimates the treatment effects for each of the eight years ranging from three years beforethe election to four years after the election.59Only 2 out of 41 covariates are significantly different between candidates of the two sides, while no covariateis statistically different in the sample of donors.
PATRONAGE IN THE ALLOCATION OF PUBLIC SECTOR JOBS 19
connection, she will be more likely to lose her public sector job (if she had one).60 Bymeasuring the average difference in outcomes between supporters of the two sides in thepost-election period, estimates from equations 4.1 and 4.2 cannot capture these dynamics.
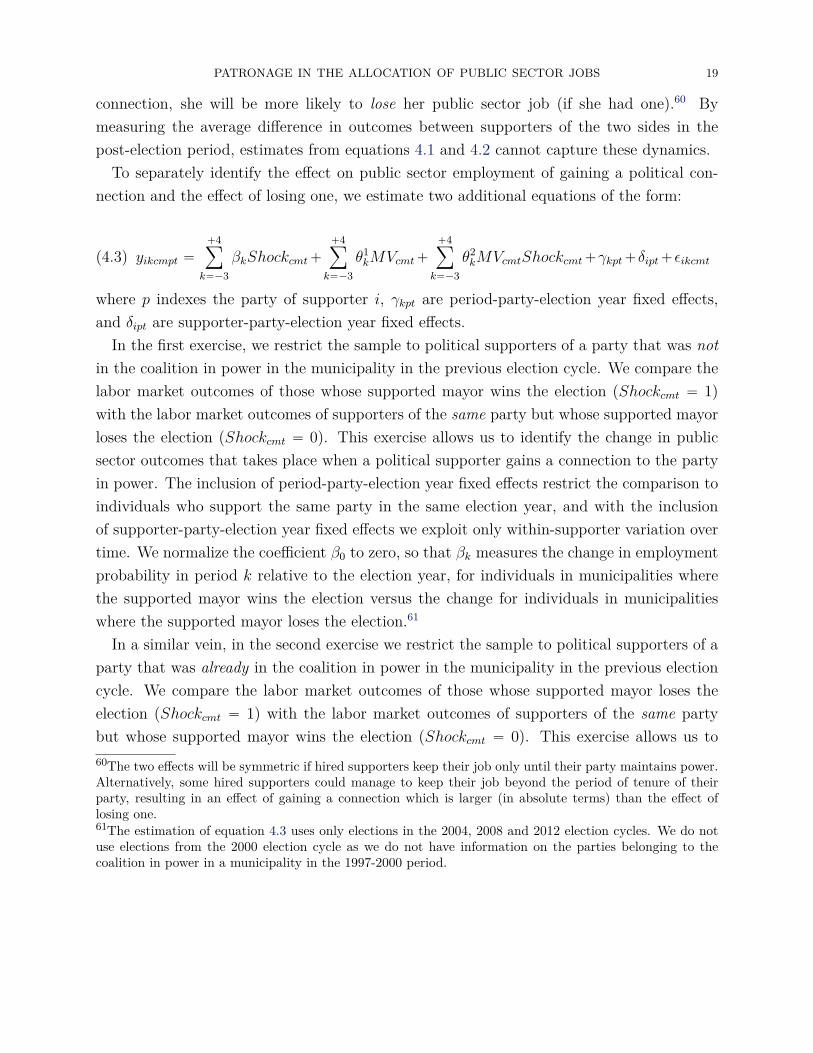
To separately identify the effect on public sector employment of gaining a political con-nection and the effect of losing one, we estimate two additional equations of the form:
(4.3) yikcmpt “`4ÿ
k“´3βkShockcmt`
`4ÿ
k“´3θ1kMVcmt`
`4ÿ
k“´3θ2kMVcmtShockcmt`γkpt`δipt`εikcmt
where p indexes the party of supporter i, γkpt are period-party-election year fixed effects,and δipt are supporter-party-election year fixed effects.
In the first exercise, we restrict the sample to political supporters of a party that was notin the coalition in power in the municipality in the previous election cycle. We compare thelabor market outcomes of those whose supported mayor wins the election (Shockcmt “ 1)with the labor market outcomes of supporters of the same party but whose supported mayorloses the election (Shockcmt “ 0). This exercise allows us to identify the change in publicsector outcomes that takes place when a political supporter gains a connection to the partyin power. The inclusion of period-party-election year fixed effects restrict the comparison toindividuals who support the same party in the same election year, and with the inclusionof supporter-party-election year fixed effects we exploit only within-supporter variation overtime. We normalize the coefficient β0 to zero, so that βk measures the change in employmentprobability in period k relative to the election year, for individuals in municipalities wherethe supported mayor wins the election versus the change for individuals in municipalitieswhere the supported mayor loses the election.61
In a similar vein, in the second exercise we restrict the sample to political supporters of aparty that was already in the coalition in power in the municipality in the previous electioncycle. We compare the labor market outcomes of those whose supported mayor loses theelection (Shockcmt “ 1) with the labor market outcomes of supporters of the same partybut whose supported mayor wins the election (Shockcmt “ 0). This exercise allows us to60The two effects will be symmetric if hired supporters keep their job only until their party maintains power.Alternatively, some hired supporters could manage to keep their job beyond the period of tenure of theirparty, resulting in an effect of gaining a connection which is larger (in absolute terms) than the effect oflosing one.61The estimation of equation 4.3 uses only elections in the 2004, 2008 and 2012 election cycles. We do notuse elections from the 2000 election cycle as we do not have information on the parties belonging to thecoalition in power in a municipality in the 1997-2000 period.

PATRONAGE IN THE ALLOCATION OF PUBLIC SECTOR JOBS 20
identify the change in public sector outcomes that takes place when a political supporterloses a connection to the party in power.62
4.3. Difference-in-differences Estimates: Non-Supporters as Control Group. Ourregression discontinuity design uses supporters of the losing mayoral candidate as a controlgroup for supporters of the elected mayor. While this ensures that we are comparing indi-viduals with similar pre-treatment unobservable characteristics, it also raises two potentialconcerns. First, supporters of the runner-up could be punished for their opposition to themayor and find it more difficult to enter the public sector relative to the counterfactualscenario in which they were not supporters of any party. If this is the case, our estimate ofpolitical favoritism would include this additional “punishment” effect.63
Second, political supporters of the runner-up party could be more likely to turn downoffers of employment in the public sector because of an ideological aversion to the party inpower. If this is the case, then our estimates would not merely capture a demand side effect(the mayor granting preferential access to her own supporters), but also a supply side effect(supporters of the losing side being less likely to apply to a public sector job, or more likelyto turn down offers of employment).
To evaluate whether these two factors play a major role in our estimates, we can use indi-viduals who were not supporters of any party as a control group, in a difference-in-differencesdesign. Under the assumption of no time-varying heterogeneity between supporters of themayor and non-supporters, we can estimate the causal impact of providing political supportto the party in power relative to the counterfactual scenario in which no party was supported.
For each municipality and each election year, we use as a control group all individualswho appear in the RAIS dataset as employed in the municipality in the years before theelection. We use as treated group political supporters of a party that was not in the coalitionin power in the municipality in the previous election cycle, as in the specification of section4.2.64 Therefore, in the pre-election period neither group of individuals is connected to theparty in power in the municipality. In order to compare the magnitude from the difference-in-differences model to our regression discontinuity design, we again focus only on electiondecided by a margin of victory of 5% or less.65
We estimate the following difference in differences specification, using observations from3 years before to 4 years after the election:62The identifying assumption of these two similar empirical designs is once again that, for the supporters inboth specifications, potential outcomes are continuous around the zero margin of victory cutoff. AppendixTables A4, A5, A6 and A7 provide evidence supporting this assumption.63See Labonne and Fafchamps (2017) for a discussion of this point in the context of local elections in thePhilippines.64As for the strategy described in that section, we do not use the 2000 election cycle.65As for the control group, also for supporters of the party in power we restrict the attention only to thosewho appear in the RAIS dataset as employed in the municipality in the years before the election.
PATRONAGE IN THE ALLOCATION OF PUBLIC SECTOR JOBS 21
(4.4) yikmt “`4ÿ
k“´3βkMayorimt ` γkmt ` δimt ` εikmt
Where i indexes an individual, m indexes a municipality, t indexes an election-year, andk indexes the year relative to the election. γkmt are period-municipality-election year fixedeffects and δimt are individual-municipality-election year fixed effects. We normalize thecoefficient β0 to zero, so that each coefficient βk captures the effect of being a politicalsupporter of the party in power (as opposed to not being a supporter of any party) in yeark relative to the election.
In order to measure the average treatment effect, we also estimate the following moreparsimonious equation:
yikmt “ βDIDMayorimt˚Postkmt ` γkmt ` δimt ` εikmt(4.5)
in which the indicator variable Mayorimt is interacted with the variable Postkmt, an indicatortaking value one for the post-election period.
5. Estimates of Favoritism in Public Sector Employment
5.1. Main Regression Discontinuity Estimates. Table 5 shows the results of the es-timation of equation (4.1), pooling all supporters and separately differentiating betweencandidates and donors. Figure 3 shows the results of the estimation of equation (4.2), whileFigure 4 reports a non-parametric representation of the results by plotting the dynamics ofmean public sector outcomes for supporters of the two sides.66
We estimate a large and statistically significant impact of supporting the party in power onthe probability of being employed in the public sector and on annual public sector earnings.The estimates of Table 5 provide the average causal effect pooling all post-election periods:supporters of the winning mayoral candidate are 10.5 percentage points more likely to havea public sector job in the post-election period – 47% more likely than the supporters of therunner-up mayoral candidate. The effect is sizable for both groups of supporters: a 51%higher probability for candidates and a 33% higher probability for donors.67 As shown inFigures 3 and 4, the effect fully materializes at the time of the election and it persists forthe whole post-election period. These effects translate into a significant increase in publicsector earnings: relative to the supporters of the runner-up mayoral candidate, candidates66Appendix Tables A8, A9, and A10 present results when we use a local linear regression using the optimalbandwidth selection procedure following (Calonico et al., 2014), or restricting the margin of victory to definean election as “close” to 3% or 1%.67As shown in Appendix Table A11, we estimate a sizable presence of patronage in all election years overthe 2000-2012 period.
PATRONAGE IN THE ALLOCATION OF PUBLIC SECTOR JOBS 22
supporting the winning mayor have earnings that are 53% higher, and donors have earningsthat are 29% higher.68 69
Figure 5 shows the discontinuous jump in public sector employment probability after theelection that takes place at the zero margin of victory cutoff, for candidates (Panel A) anddonors (Panel B). Interestingly, the effect looks largely independent of the distance from thezero margin of victory cutoff. While differences between supporters of the two sides cannotbe interpreted as causal as we move far away from the discontinuity, the figure suggests thatthe effect that we uncover is likely to generalize to municipalities where the mayoral racewas decided by larger vote margins.
This preferential access to public sector jobs translate into a net increase in supporters’labor market earnings. Panel A of Table 6 shows only a limited crowding out effect of sup-porting the winning mayor on supporters’ private sector earnings (a 9.5% reduction relativeto supporters of the runner-up) and employment probability (a 14.8% reduction relative tosupporters of the runner-up). As a consequence, Panel B shows that there is a sizable netincrease in earnings in the formal economy for supporters of the winning mayor: total annualearnings in the formal economy are 34% higher for candidates in the winning coalition and10% higher for donors in the winning coalition.
Since our data have information on the specific job within the public sector obtained by acandidate, we can break down public sector jobs among those under the jurisdiction of thelocal, state, and federal government. In Table 7 we present the results of the estimation ofequation (4.1) using employment probabilities in a municipal, state or federal public sectorjob as separate dependent variables (and further differentiating between municipal jobs inthe supporter’s municipality and in a different municipality). In line with the mayor beingable to allocate to political supporters only jobs over which she has discretion, the whole68While we take the electoral coalition as our unit of analysis, one may wonder whether the effect is presentonly, or mainly, for supporters of the same party of the elected mayor. In Appendix Table A12 we find thatall supporters enjoy a significant preferential treatment. Among candidates, those of the same party of themayor benefits more, but the effect is sizable also for those belonging to a different party in the mayor’scoalition. Among donors, the largest treatment effect is for those who contributed to the mayor directly, butwe find large and significant effects also among those who contributed to other candidates in the mayor’sparty or coalition.69As shown in Appendix Table A13, most of the effect for candidates is driven by those who fail to wina council seat. However, the effect is significant also for the subset of candidates elected to the council,consistent with the part-time nature of the job as local councilor, which allows successful candidates tohave also a job in the public sector. These results can suggest the presence of an informal within-coalitioninsurance. Candidates may spend considerable financial resources as well as time in the race, and cantherefore be attracted to politics by the promise of a public sector job in the negative state of the world inwhich they do not win a council seat, while they are automatically rewarded with the political wage andother perks from office if they are elected.

PATRONAGE IN THE ALLOCATION OF PUBLIC SECTOR JOBS 23
effect is concentrated at the municipal level and driven by municipal jobs in the supporter’smunicipality.70
5.2. Gaining Versus Losing a Connection. Estimates from equation 4.3 allow us toseparately investigate the effect of gaining a political connection and the effect of losing one.Figure 6 and Appendix Table A15 present the results.71 When a supporter of a party thatwas previously not in the ruling coalition in the municipality gains a connection (i.e. themayor she supports is elected), she experiences a large increase in the probability of havinga public sector job (an increase of 10.2 p.p, or 46% relative to the pre-election period) and inpublic sector earnings (a 46% increase relative to the pre-election period). When instead asupporter of a party that was previously in the ruling coalition in the municipality loses herconnection (i.e. the mayor she supports loses the election), she experiences a large (althoughrelatively smaller) decrease in the probability of having a public sector job (by 8.7 p.p, or30% of the average probability in the pre-election period) and in public sector earnings (31%relative to the pre-election period). These estimates are significant for both candidates anddonors. Both the acquisition and the loss of a connection to the party in power imply asignificant shock to a political supporter’s public employment prospects.
5.3. Difference-in-Differences Estimates. Estimates from equation 4.4 allow us to gaugethe extent to which our RDD estimates of political favoritism are inflated by our use of sup-porters of the losing side as a control group. Figure A4 presents the estimated coefficientsβk. Estimates focusing on candidates as political supporters are in blue, while estimatesfocusing on donors are in red. For both groups of supporters, we find no substantial differ-ential pre-trend in public employment probability relative to non-supporters. The effect ofsupporting the party in power materializes at the time of the election, and it is similar inmagnitude to the effect of gaining a connection reported in Panels (a) and (b) of Figure 6.
In Appendix Table A16 we report a comparison of the estimated average treatment ef-fects of the RDD and difference-in-differences specifications.72 The difference-in-differencesestimates are similar in magnitude to the RDD ones, suggesting that the use of supporters70In Appendix Table A14 we investigate whether the effect is entirely driven by temporary employmentcontracts. While the estimates are significantly larger for temporary contracts, supporters of the winningside are also significantly more likely to be employed in permanent positions. This is consistent with theevidence presented in section 3.4.1, which showed significant turnover also in permanent public sector jobsaround municipal elections.71In Appendix Table A15 we present estimates from a more parsimonious version of equation 4.3, in whichwe estimate the average treatment effect in the post-election period, rather than separate coefficients foreach post-election period.72Specifically, the RDD average treatment effects are the estimated coefficients in columns 2 and 3 of Panel Aof Table A15. For the difference-in-differences average treatment effects, we present the estimates of equation4.5.
PATRONAGE IN THE ALLOCATION OF PUBLIC SECTOR JOBS 24
of the losing side as a control group does not significantly inflate the estimates of politicalfavoritism.
5.4. Favoritism is Widespread Throughout the Entire Hierarchy. Leveraging infor-mation on the specific job in which supporters are hired, we can investigate whether politicalfavoritism is concentrated in specific layers of the public sector hierarchy, or whether it isinstead widespread throughout the entire hierarchy.
We generate five different indicator variables, each turning to one if, in a given year, asupporter has a job belonging to one of five occupational categories – managers, professionals,technical workers, clerks, blue collar workers. Table 8 shows the estimated coefficients βfrom estimating equation (4.1) for these five different dependent variables.73 We estimate apositive and significant effect of supporting the winning mayoral candidate throughout thewhole hierarchy of occupations.
Supporters of the winning mayor are 5.3 percentage points more likely to be employed in ajob at the top of the bureaucracy (in managerial occupations), relative to a 2.8% chance forsupporters of the runner-up. They are also 12% more likely to be employed as professional,14% more likely to be employed in a high-skills technical occupation, 62% more likely to bea white-collar public sector worker, and 27% more likely to be employed in a blue collar job.All the estimates are highly significant, indicating a large presence of political favoritism forall types of public sector jobs.74
The results presented in this section document a significant presence of political favoritismin employment across all the layers of the Brazilian local public sector. The effect is notlimited to a specific group of political supporters: while the magnitude of the effect is largerfor candidates for a seat in a local council, individuals who provided financial support to thewinning party enjoy a sizable benefit as well.75
6. Patronage as Mechanism, and Impact on Selection to Public Employment
In this section, we show that patronage is the leading explanation behind political fa-voritism in public sector employment, and that this negatively affects the quality of thepool of public workers. First, we show that the political supporters enjoying the largestpreferential treatment are those who provided more political support to the party in power.73Appendix Table A17 presents the estimates using the optimal bandwidth selection procedure.74All the estimates are large and significant for both types of supporters, with the exception of professionaland high skills technical occupations in the sample of donors.75In this paper, we can focus only on two groups of political supporters (although arguably two importantones), not considering other individuals connected to politicians, like friends and family members. Evenrestricting attention only to these supporters, as shown in Figure A5, the winning mayor’s supporters makeup between 0.2% and 0.8% of the population in small and medium size Brazilian municipalities. A largeshare of them (between one out of four and one out of two, on average) is employed in the municipal publicsector.
PATRONAGE IN THE ALLOCATION OF PUBLIC SECTOR JOBS 25
Second, we show that the provision of political support substitutes quality as a hiring cri-terion: relative to supporters of the runner-up mayoral candidate, supporters of the mayorare screened less on education and on skills valued by the private sector. Third, we presentevidence against an interpretation of favoritism as the result of a mayor’s better screening ofher supporters on hard-to-observe dimensions of talent. Fourth, we present evidence suggest-ing that politicians’ desire to hire individuals with similar ideological views is not a primarydriver of political favoritism in hiring.
6.1. Political Favoritism is Increasing in the Amount of Political Support. If po-litical favoritism stems from a quid pro quo relationship between a political supporter and apolitical party, we expect the extent of the reward to be dependent on the amount of supportprovided. In this section, we ask whether this is indeed the case. For candidates to the localcouncil, we use their electoral performance as a measure of political support. For donors, weuse the amount of money contributed.
We start by looking at candidates’ electoral performance. Candidates obtaining a largenumber of personal votes are valuable to the mayor’s coalition for two reasons. First, sincecouncil seats are awarded to a coalition in proportion to the total number of votes receivedby its candidates, more successful candidates increase the overall number of seats awardedto the coalition. Second, personal votes for a candidate to the local council are also likelyto translate into votes for the mayor supported by the candidate. As shown in AppendixTable A13, most of the political favoritism for candidates is driven by those failing to win acouncil seat. Therefore, in this section we focus on this subset of candidates.
We calculate, for each losing candidate, the quintile of the vote share distribution withinher coalition (either the mayor’s or the runner-up’s coalition) in which she falls (consideringonly votes brought by losing candidates). We are therefore categorizing losing candidates onthe basis of the number of votes that they contributed to their coalition. We then create fiveindicator variables (Quintileqimt), turning to one if candidate i’s within-coalition vote sharein the election in municipality m and election year t falls into quintile q. We estimate anaugmented version of equation (4.1) in which we interact Mayorcmt with these five indicatorvariables:
yikcmt “5
ÿ
q“1βqQuintileqimt˚Mayorcmt `
5ÿ
q“2θqQuintileqimt`
`
`4ÿ
k“1θkMVcmt ` γkmt ` εikcmt
(6.1)
This specification allows us to investigate whether candidates who contributed relativelymore votes to their coalition are more likely to enjoy a preferential access to public sector
PATRONAGE IN THE ALLOCATION OF PUBLIC SECTOR JOBS 26
jobs. We estimate a similar version of the same equation, categorizing donors on the basisof the amount of money donated to the coalition of the mayoral candidate supported.
Figure 7 presents a graphical representation of the treatment effects at different quintilesof the distribution of political support, looking at employment probability in the top paneland at public sector earnings in the bottom panel.76 Consistent with the hypothesis thatcandidates and donors who provided more support are rewarded more, we find that theamount of political favoritism is strictly increasing in a candidate’s position in the distribu-tion of vote share, and in a donor’s position in the distribution of money contributed. Whilethe effect is positive and significant throughout the whole distribution, the treatment effectmonotonically increases in the amount of support provided. For instance, the treatmenteffect on public sector earnings is 78% higher for candidates in the third quintile of the voteshare distribution relative to candidates in the bottom quintile, and the treatment effect forcandidates in the top quintile is two times higher relative to candidates in the third quintile.The patterns are similar if we look at a donor’s amount of financial support: moving fromthe bottom to the top quintile of the money distribution increases the treatment effect onpublic sector earnings by 349%.77
6.2. Providing Political Support Decreases Screening on Education. Being a po-litical supporter of the party in power could increase the probability of obtaining a publicsector job, but only conditional on being qualified for the position.78 Alternatively, providingpolitical support could act as a substitute for an individual’s level of qualifications, decreas-ing the importance of qualifications for political supporters, and lowering the average qualityof the workforce.
To test whether providing political support decreases screening on education, we combineinformation on (i) the required level of education to perform each occupation in the Brazilianpublic sector, collected from the Classificacao Brasileira de Ocupacoes 2002 as described inSection 3.2, and (ii) information on supporters’ education. Since we do not have informationon the education of all supporters for the sample of donors, we exclude them from the analysis76Appendix Table A18 presents the results in table format.77These heterogeneous effects are similar and equally significant if we look at the effect on public sectoremployment probability.78This scenario would correspond to the mayor having lexicographic preferences over a worker’s qualificationsand political affiliation.
PATRONAGE IN THE ALLOCATION OF PUBLIC SECTOR JOBS 27
of this section.79 We estimate a series of equations of the form:
yikcmt “βQMQualifiedi˚Mayorcmt ` β
MMayorcmt`
` βQQualifiedi ``4ÿ
k“1θkMVcmt ` γkmt ` εikcmt
(6.2)
where yikcmt is an indicator variable equal to one if in period k supporter i is employed ina public sector job that requires a specific educational level, the variable Qualifiedi is anindicator variable equal to one if supporter i has a level of education that is equal or higherto the one required to perform this job, and all the other variables are defined as before. Weestimate three different specifications, where we focus on jobs for which the required levelof education is middle school degree, high school degree, or college degree, respectively. Thecoefficient βQM measures the effect of being a supporter of the mayor on the importance ofeducation to obtain a public sector job. If being a supporter of the mayor decreases screeningon education, then βQM will be negative.
Table 9 presents the results. Column 1 focuses on public sector jobs that require middleschool education, with the coefficient on the double interaction showing that for this categoryof jobs the importance of education is significantly lower for supporters of the winning may-oral candidate. Put it differently, the effect of being connected to the mayor is significantlystronger among supporters who are not qualified for the position in terms of education:being a supporter of the mayor increases the chances of obtaining a job requiring a middleschool degree by 1.7 percentage points conditional on not having a middle school degree, andby only 0.7 percentage points conditional on having it. Column 3 reveals a similar patternwhen we focus on public sector jobs that require a university degree. The coefficient forthe specification focusing on jobs requiring a high school degree is negative, but small andstatistically insignificant.
As a consequence of the lower screening on education for supporters of the winning mayor,Table 10 shows that public sector employees who supported the mayor in the previous electionare 2.7 percentage points (or 17%) more likely to be unqualified in terms of education thanpublic sector employees who supported the runner-up.80 This is true both at the top of the79We have information on donors’ education only for donors who have been matched to the RAIS dataset,but conducting the analysis only on this subset of donors would result in biased estimates since the treatment(i.e. being connected to the mayor) affects the probability of having a public sector job and thus of beingmatched to RAIS. Since we have data on candidates’ education from the TSE, we have this information forall candidates independently on whether they were matched to RAIS.80As for all our previous results, we restrict the sample to elections decided by a 5% margin of victorybetween the winner and the runner-up. We focus on the sample of all public employees who are supportersof the mayor or of the runner-up in the four years after the election in which they are supporters. Eachsupporter enters the sample once for every year in which she has a public sector job. We then regress anindicator variable equal to one if the supporter is unqualified on an indicator for having been a supporterof the winning mayoral candidate, including election (municipality-year of the election) fixed effects and
PATRONAGE IN THE ALLOCATION OF PUBLIC SECTOR JOBS 28
hierarchy (for managerial jobs) and for mid-level bureaucrats (for clerical jobs), as well asamong professional workers.81
These results show that the being a political supporter of the mayor acts as a substitutefor an individual’s qualification, worsening selection on education for applicants to a publicsector job: having the required educational level to perform a public sector job is less relevantfor supporters of the winning mayor.82
6.3. Providing Political Support Decreases Screening on Skills Valued by thePrivate Sector. As a second measure of a supporter’s quality, we use her previous earningsin the private sector. In other words, as in Dal Bo et al. (2013), we consider a supporter’sprivate sector outside opportunity as a measure of her skills, under the assumption thatworkers with higher skills will be compensated with higher earnings in the private sector.
We focus on the subset of supporters who are employees in a formal private sector firm inthe two years preceding the election, and we test whether political favoritism is higher forsupporters with lower previous private sector earnings.83 We estimate the following equation:
yikcmt “βPMPrivateEarningsimt˚Mayorcmt ` β
MMayorcmt`
` βPPrivateEarningsimt ``4ÿ
k“1θkMVcmt ` γkmt ` εikcmt
(6.3)
where yikcmt is an indicator variable equal to one if in period k supporter i is employed ina public sector job, the variable PrivateEarningsimt is a supporter’s private sector earningsbefore the election (in thousands R$), and all the other variables are defined as before. Thecoefficient βPM measures the effect of being a supporter of the mayor on the relationshipbetween private sector opportunities and the likelihood of being employed in a public sectorthe margin of victory of the mayor supported. As these results focus on supporters employed in the publicsector, and thus who appear in the RAIS dataset, we can include also donors in this set of results.81As shown in the table, the share of unqualified public sector workers among managers is high also amongsupporters of the runner-up (44.2%). If we exclude managerial occupations, which require a universitydegree, from the estimation in column 3 of Table 9, we find essentially the same result, with an estimate onthe double interaction equal to -0.025 and a standard error of 0.004.82We also test whether supporters of the mayor are screened less on education relative to non-supporters,augmenting equation 4.5 to test for heterogeneous effects depending on a supporter’s education. Specifically,we add to equation 4.5 the triple interaction between Mayorimt, Postkmt and Qualifiedi, and the doubleinteraction between Postkmt and Qualifiedi. Appendix Table A19 shows that supporters of the mayor arescreened less on education also relative to non-supporters. For instance, results in Column 3 of AppendixTable A19 shows that, while in the post-election period the importance of having a college degree increasesfor non-supporters (among non-supporters, the importance of having a college degree for obtaining a jobrequiring a college education increases by 11.3 percentage points in the post-election period), it decreasesfor supporters of the mayor (among them, the importance of having a college degree for obtaining a jobrequiring a college education decreases by 2 percentage points in the post-election period).83To account for year- and location-specific factors affecting private sector earnings, we first regress privatesector earnings on year times municipality fixed effects, and we take the residuals of this regression. Forsupporters who are employed in the formal private sector in both years preceding the election, we assignthem the average of the residuals.
PATRONAGE IN THE ALLOCATION OF PUBLIC SECTOR JOBS 29
job. If being a supporter of the mayor decreases screening on skills valued by the privatesector, then βPM will be negative.
Panel A of Table 11 shows that the effect of being a supporter of the mayor is significantlystronger among supporters with lower private sector skills. A one standard deviation (i.e.6.59) increase in a supporter’s private sector earnings decreases the treatment effect by 3.3percentage points. In Panel B of Table 11 we present estimates of equation 6.3 in whichthe continuous private sector earnings measure is replaced by indicators turning to one ifsupporter i is in the top tercile or in the second tercile of the private earnings distribution,respectively.84 Favoritism is most limited for supporters in the top tercile of the distribution:moving from the first to the third tercile of the distribution decreases the treatment effectby 38% for candidates (column 2) and by 20% for donors (column 3).
These results show that political favoritism brings into the public workforce a larger shareof individuals with lower skills valued by the private sector.85
6.4. Is the mayor successfully screening on unobservables? The mayor could beusing her discretion in hiring decisions to bring into the public workforce individuals who,despite being of lower ability on observable dimensions, are more talented along hard-to-observe dimensions. In other words, political favoritism could be the result of mayors havingbetter “soft” information about members of their network, and thus being able to screenthem on dimensions of talent that we cannot observe. We investigate the plausibility ofthis interpretation in two ways. First, we use a measure of pre-election personal abilityconditional on observables, as in Besley et al. (2017) and Dal Bo et al. (2017). Second, weprovide a test of this theory based on political supporters’ long-run careers in the publicsector.
6.4.1. Selection on residual ability. In order to obtain a measure of supporters’ individualability that goes beyond observable individual characteristics, we follow the approach inBesley et al. (2017) and Dal Bo et al. (2017), estimating residuals from a Mincer earningsregression controlling for individual and job-specific characteristics.
The intuition for this approach is simple. Workers who have higher private sector earningswhen compared to workers with the same demographic characteristics and employed in asimilar job, will have higher ability. While we cannot observe what accounts for this residualhigher earnings, we can use residuals from the Mincer earnings regression as a measure ofunobservable ability.84We divide supporters in terciles based on the earnings distribution for all supporters in their same coalition(i.e. the coalition of the mayor or the coalition of the runner-up in the election).85We also show these results using non-supporters as a control group, augmenting equation 4.5 to test forheterogeneous effects depending on a supporter’s private sector earnings. Appendix Table A20 shows thatsupporters of the mayor are screened less on skills valued by the private sector also relative to non-supporters.
PATRONAGE IN THE ALLOCATION OF PUBLIC SECTOR JOBS 30
We estimate one equation for each year between 1995 and 2014 using information on allBrazilian private sector employees.86 We also estimate each regression separately for menand women, in order to account for gender-specific differences in labor-market outcomes.Specifically, we obtain, for each individual i and year t, residuals from the following specifi-cation:
(6.4) yi,m,t “ fpagei,t, educationi,t, sectori,tq ` αm ` εi,m,t
where yi,m,t are annual private sector earnings of individual i working in municipality m inyear t, agei,t are a set of age fixed effects (over 5-years intervals), educationi,t are four fixedeffects for individual educational level (less than middle school, middle school degree, highschool degree, university degree), sectori,t are fixed effects for the sector of i’s firm. Weinclude a full-set of interactions between these variables, as well as municipality fixed effects(αm) to account for location-specific differences in earnings. Our residual ability score is theaverage of each individual’s residuals across all years in which she is employed in the privatesector.87
We divide supporters in terciles based on the distribution of individual ability for allsupporters in their same coalition (i.e. the coalition of the mayor or the coalition of therunner-up in the election). We then estimate the following equation:
yikcmt “ βM3Tercile3i˚Mayorcmt ` βM2Tercile2i˚Mayorcmt`
` βMMayorcmt ` β3Tercile3i ` β2Tercile2i `
`4ÿ
t“1θtMVcmt ` γkmt ` εikcmt
(6.5)
where Tercile3i and Tercile2i are indicators turning to one if supporter i has a high levelof ability (i.e. she is in the top tercile of the ability distribution) or a medium level of ability(i.e. she is in the second tercile of the ability distribution), respectively. The coefficient βM3
(respectively, βM2) measures the effect of being a supporter of the mayor on the importance86To minimize endogeneity concerns, we use observations for candidates and donors only in years before thefirst election in which they run/donate. This means that we can calculate this measure only for supporterswho are ever employed in the formal private sector before their first election, that is 27.2% of candidatesand 37.9% of donors.87Dal Bo et al. (2017) calculate this measure for the Swedish population and show that, for males, it issignificantly correlated with leadership and cognitive scores conducted in the Swedish military-draft system.While we cannot present a comparable test in our setting, we find that this measure of ability is a strongpredictor of political success: elected candidates have a score that is 0.075 standard deviations higher thannon-elected candidates. In Appendix Figure A6, we plot the distributions of the ability score for candidates,donors, and the other 75 millions workers in the RAIS dataset: we find that candidates’ average score is0.11 standard deviations lower than that of the average Brazilian worker, while donors’ average score is 0.11standard deviations higher than that of the average Brazilian worker. These differences are statisticallysignificant, with p-values below 0.01. In contrast, supporters (both donors and candidates) of the electedmayor have a similar ability distribution than supporters of other mayoral candidates (see Appendix FiguresA7 and A8).
PATRONAGE IN THE ALLOCATION OF PUBLIC SECTOR JOBS 31
of having high ability (respectively, medium ability) relative to low ability (the excludedcategory) for the probability of obtaining a public sector job.
If being a supporter of the mayor increases screening on this residual measure of ability,then we expect βM3 ą βM2 ą 0.
Contrary to this hypothesis, Table 12 shows that supporting the winning party decreasesthe importance of residual ability for the probability of being hired in the public sector,and this is true for both candidates and donors. Being a supporter of the mayor increasesthe chances of obtaining a job the most for supporters in the bottom tertile of the abilitydistribution. High ability supporters are 3 percentage points less likely than low abilitysupporters to benefit from their connection to the mayor (see column 1).
6.4.2. Supporters’ long-run public sector careers. Mayors could have a superior ability toscreen members of their political network along unobservable dimensions of quality that arenot captured by our measure of residual private sector earnings. For instance, we cannotobserve an individual’s public service motivation, and favoritism could be the result of themayor hiring members of her political network whom she can identify as being particularlymotivated to work in the public sector.
We can provide a test of this hypothesis by analyzing a supporter’s long-run career inthe public sector. Dimensions of a supporter’s quality that are ex-ante unobservable outsideof the mayor’s political network, should be revealed and become common knowledge afterseveral years on a public job. Hence, if mayors are using hiring discretion to select the bestindividuals in their political network, these workers, once hired, should keep their job even ifthe party in power changes. If instead public sector jobs are allocated to supporters on thebasis of patronage relationships, we expect them to be closely linked to the fortunes of theparty supported. In this case, if the party fails to re-win the mayoral elections, the benefitsto political supporters should dissipate.88
We provide evidence to adjudicate between these two hypotheses by testing whether thehigher probability of having a public sector job for supporters of the winning mayor dissipatesright after the party of the mayor loses power. We do so by dividing supporters in threegroups: those supporting a party winning two consecutive elections in the municipality (inperiod 0 and period 4); those supporting a party winning the election in period 0 but losingthe election in period 4; those supporting a party losing both the election in period 0 andthe election in period 4.89 We then estimate the following equation:88The crucial assumption of this argument is that the degree to which hires reveal their ex-ante unobservableability and motivation as they perform their job is on average not lower than the private information thatthe new mayor has on potential replacements among individuals in her network.89We include only supporters of parties presenting a mayoral candidate in two consecutive elections in thesame municipality.
PATRONAGE IN THE ALLOCATION OF PUBLIC SECTOR JOBS 32
(6.6)
yikcmpt “`6ÿ
k“´3βBothk MayorBothcmt `
`6ÿ
k“´3βOnek MayorOnecmt `
`6ÿ
k“´3θkMVcmt ` γkpt ` εikcmt
where MayorOnecmt is an indicator turning to one for supporters of a party that wins theelection in municipality m in election year t (i.e. in period k “ 0) but loses four years later(i.e. in period k “ 4), and MayorBothcmt is an indicator turning to one for supporters of aparty that wins the election in municipality m in both the elections. The excluded categoryof supporters is composed of those whose party loses both elections in the municipality. Withthe inclusion of period-party-election year fixed effects (γkpt) we are leveraging variation in theelectoral fortunes of the same party across different municipalities. We include observationsin the period ranging from 3 years before to 6 years after the first election (i.e. 2 years afterthe second election).
The left panel of Figure 8 plots the estimates of βBothk and βOnek . Relative to supporterswhose party loses both elections, supporters whose party remains in power for both electioncycles have a higher probability of public sector employment that persists beyond period 4.On the contrary, supporters whose party loses the subsequent election see a sharp drop inpublic sector employment probability after period 4.
While we restrict the sample to supporters of parties involved in a close race in the firstelection, one may be concerned that supporters of a party that loses power in the subsequentelection are different than supporters whose party maintains power. In the right panel ofFigure 8 we show that the patterns discussed above hold true even when we focus only onthe subset of parties involved in a close mayoral race in both the election taking place inperiod 0 and in the election taking place in period 4 (and therefore characterized by a similarelectoral strength in both elections).
These patterns show that public sector jobs allocated to supporters are deeply linked tothe fortunes of their party, and cast doubts on the interpretation of political favoritism asan efficient way in which the mayor is screening members of her political network alonghard-to-observe dimensions of quality.
6.5. Is the mayor’s goal to create an ideologically cohesive team? Political support-ers’ preferential access to public sector jobs may be the result of the mayor’s desire to hireindividuals with similar ideological views. Theoretically, the matching between the politicalideology of the mayor and that of her bureaucrats can increase organizational efficiency. Fora politician, hiring top-level bureaucrats who share her same policy agenda could facilitatethe process of policy implementation. But this ideological alignment could in principle bebeneficial also at lower levels of the bureaucratic hierarchy: workers who are ideologically
PATRONAGE IN THE ALLOCATION OF PUBLIC SECTOR JOBS 33
aligned with the party in power may be motivated to increase effort since they care aboutthe mission of their organization.90
If this interpretation of political favoritism is correct, then the supporters who benefit morefrom favoritism should be those who have a stronger ideological link to the party in power.We test for this hypothesis by investigating whether individuals who have been supporters ofthe mayor’s party for a longer period of time are more likely to be favored in accessing publicsector jobs. For each election, we focus on the subset of supporters who had run/donatedalso in the previous election, and we divide them in: “party loyals”, namely those who weresupporters of the party of the mayoral candidate also in the previous election, and “partyswitchers”, namely those who in the previous election were supporters of a different party.
We calculate the extent of political favoritism in these different subsamples of supporters.Figure 9 shows that the effects of supporting the winning party estimated on these differentsubsamples are very similar.91 In fact, we cannot reject the hypothesis that party switchersare rewarded less than party loyals. If anything, we find that “loyals” are rewarded lessthan “switchers” among donors, even if the effects are too noisily estimated to reject thehypothesis of equality of the coefficients in the different samples.
In other words, the mayor is more likely to hire her supporters irrespectively of the lengthof a supporter’s connection to the party: individuals who recently switched political alliancesare as likely to be allocated a public sector job as individuals who have been loyal to theparty for multiple election cycles. This evidence cast doubts on the interpretation of politicalfavoritism as the result of the mayor’s desire to hire individuals with similar ideological views.
7. Patronage and Public Services Provision
Are municipalities where patronage is more widespread characterized by a worse publicgoods provision? While to answer this question in a rigorous way we would need exogenousvariation in the extent of patronage across municipalities, in this section we move a first steptowards answering this question: we analyze how changes in the extent of patronage withinthe same municipality over time correlate with changes in the quality of education, as wellas with changes in the size of the public sector workforce.
As a first step, we calculate, for each of the 7,696 elections in the 2004-2012 period decidedby a margin of victory of 10% or less, an estimate of patronage, defined as the averagedifference in public sector employment probability, over the four years after the election,between the supporters of the mayor versus the supporters of the runner-up.92 Specifically,90There is evidence that workers exert more effort when they care about the mission of their organization(Ashraf et al. (2014), Tonin and Vlassopoulos (2010), Tonin and Vlassopoulos (2015), DellaVigna and Pope(2017)).91Appendix Table A21 presents the estimates in table format.92We do not use the 2000 election cycle since for this specific year we do not have data on donors and, inaddition, we cannot control for a series of important covariates that would require electoral data for the
PATRONAGE IN THE ALLOCATION OF PUBLIC SECTOR JOBS 34
we pool observations for the four post-election years, and for each municipalitym and electionyear t we estimate the following specification:
(7.1) yik “ γk ` βmtMayori ` εit
Where yik is an indicator variable equal to one if supporter i is employed in the municipalityin period k (i.e. year relative to the election year), and γk are period fixed effects. Ourestimate of patronage is the estimate of the coefficient βmt on the indicator variable turningto one for supporters of the winning mayoral candidate. Figure 10 plots the distribution ofthese estimates. Most of the elections (81.4%) have a positive patronage estimate, indicat-ing the widespread importance of political connections as drivers of Brazilian public sectoremployment.
We then focus on the sample of 2,420 municipalities that experience multiple close racesover the 2004-2012 period and we estimate the following model:
(7.2) ymt “ αm ` γt ` δβmt ` θXmt ` ηmt
Where ymt is a specific outcome in municipality m in the years following election year t,αm are municipality fixed effects, γt are election year fixed effects, and βmt is the patronageestimate for municipality m in election year t, estimated from equation 7.1.
Our empirical strategy controls for any time-invariant municipality-specific determinantof patronage that is correlated with welfare related outcomes, as well as for any unobservablethat is common to all municipalities in an election year. However, it could be the case thatother municipality-level time-varying heterogeneity correlated with the extent of patronagein a specific election drives also welfare outcomes. We control for an extensive set of time-varying municipal-level covariates to try to address this concern. First, we control for a setof characteristics of the election.93 We control for a number of time-varying municipalitycharacteristics, which include a second order polynomial in the municipality population, the1996 election cycle, for which we have no information. Relative to the results presented so far, here we focuson a larger bandwidth to define a race as close. Since our analysis leverages variation within municipalitiesover time, if we used a smaller bandwidth we would have few municipalities experiencing multiple closeelections over the sample period. However, as we showed in Figure 5, the magnitude of patronage seemsto be very stable over different margin of victories. Additionally, the corresponding optimal bandwidthcomputed following (Calonico et al., 2014) is actually larger than 10 (11.3 in the sample of candidates and11.4 in the sample of donors).93In order to control for the extent of political turnover in the election, we include covariates for: the shareof supporters of the mayor and of the runner-up whose party was already in the winning coalition, indicatorsfor party turnover, for whether the incumbent mayor was re-elected and for whether the party of the mayoris the same in power at the state level, the share of new parties in power after the election, the share of newcandidates in the winning coalition and in the winning party. We also control for the margin of victory ofthe winning mayoral candidate. In addition, since the identity of the elected mayor could be correlated withthe extent of patronage, we control for the gender of the mayor, for a set of fixed effects for the mayor’seducation, and for a set of fixed effects for the mayor’s party, since specific parties could be more likely toengage in patronage.
PATRONAGE IN THE ALLOCATION OF PUBLIC SECTOR JOBS 35
municipality per-capita gdp, and the number of private sector employees per capita. Thesevariables are meant to address the concern that municipalities that are hit by negativeeconomic shocks could experience worse welfare outcomes and at the same time see anincrease in patronage. We also control for capital and current public expenditures per capitain the municipality. Finally, we control for the personnel turnover (the share of hires andthe share of terminations) in the public sector in the year after the election. This is animportant control, since patronage could be positively correlated with public sector turnover.At the same time, irrespective of whether turnover is driven by the appointment of politicalsupporters, the disruption in the public sector personnel could lead to a worse provision ofpublic services (Akhtari et al. (2016)).
We start by examining whether more patronage is associated with a larger public sectorworkforce.94 Panel A of Table 13 shows that municipalities with an increase in patronagerelative to other elections see a larger increase in the number of public sector workers percapita. An increase of one standard deviation in patronage is associated to a 0.041 standarddeviations increase in the municipality number of public sector workers per capita.95 Theestimate is robust to the inclusion of the full set of controls.
Next, we investigate whether patronage is associated with a better or worse provision ofpublic goods. We use welfare indicators related to education, one of the main responsibilitiesof Brazilian local governments. As a welfare indicator for education we use standardized testscores from Prova Brasil, a standardized exam administered to public schools students inthe 4th and 8th grade.96 We average each student’s test scores in math and Portuguese, andthen take the average in the municipality.97
Panels B and C of Table 13 show that patronage is associated with significantly lower testscores for both 4th grade and 8th grade students. Looking at the most conservative estimates(in column 4, the specification where all controls are included), a standard deviation increasein patronage is correlated with a 0.021 standard deviations decrease in 4th graders’ test scoresand with a 0.03 standard deviations decrease in 8th graders’ test scores.98 The estimates arestable across specifications, and they remain statistically significant even after we control94We average the municipality-level number of public sector workers per capita over the four years after theelection.95To gauge the magnitude of the result, we find that a one standard deviation increase in the municipalitygdp per capita is associated to a 0.082 standard deviations increase in the number of public sector workersper capita.96Schools will less than 20 students enrolled in the 4th and 8th grade do not participate in the Prova Brasilexam, slightly reducing the available sample size.97The exam is administered every two years. We use 2007 test scores for the 2004 election cycle, 2011 testscores for the 2008 election cycle, and 2013 test scores for the 2012 election cycle.98To gauge the magnitude of the result, we find that a one standard deviation increase in the municipalitygdp per capita is associated to a 0.078 standard deviations increase in 4th graders’ test scores and to a 0.09increase in 8th graders’ test scores.
PATRONAGE IN THE ALLOCATION OF PUBLIC SECTOR JOBS 36
for the extent of public sector turnover following the election, suggesting that patronage isrelated to worse education outcomes even after accounting for possible disruptions in thepublic personnel following an election.
These results provide some suggestive evidence that patronage might have significantnegative welfare consequences.
8. Conclusion
In this paper we study patronage – the use of public sector jobs to reward political support-ers of the party in power – in the context of Brazilian local governments. While anecdotalaccounts of patronage are common, multiple empirical challenges have made it difficult toconvincingly document the presence, extent, and consequences of this phenomenon. Usinga unique dataset on the universe of Brazilian public sector employees over the 1997-2014period, matched with information on more than 2,000,000 political supporters of Brazilianlocal parties, this paper aims to fill this gap.
First, by leveraging competitive elections to obtain exogenous shocks to an individual’sconnection with the party in power, we identify the presence of significant political favoritismin public employment: being a political supporter of the party in power increases the prob-ability of having a public sector job by 47%. This favoritism is large at all layers of theBrazilian public sector hierarchy.
Second, we show evidence that patronage is the crucial mechanism behind favoritism inpublic employment, leading to the selection of less qualified public workers. In line with aquid pro quo relationship between supporters and political parties, a supporter’s public sectorreturn is proportional to the amount of support provided. In turn, the provision of politicalsupport acts as a substitute for individual quality: supporters of the party in power arescreened less in terms of education and of skills valued by the private sector. The evidence isinconsistent with a significant role played by alternative channels in explaining the existenceof this favoritism. In particular, we show that the politicians’ desire to hire individuals withsimilar ideological views is not a likely explanation for the results. Similarly, multiple piecesof evidence are inconsistent with an interpretation of favoritism as the result of politicians’efficient screening of supporters along hard-to-observe dimensions of quality.
Third, we move a first step towards understanding whether, in line with the negativeimpact on selection to public employment that we document, patronage negatively affectsthe quality of public goods provision. We do so by linking differential changes in within-municipality variation in the extent of patronage over time to the quality of municipal pri-mary education, one of the main responsibilities of Brazilian local governments. We showthat an increase in patronage is correlated with lower test scores of students enrolled inmunicipal public schools. In addition, an increase in the extent of patronage is associated
PATRONAGE IN THE ALLOCATION OF PUBLIC SECTOR JOBS 37
with significant higher growth in municipal public sector personnel, consistent with politi-cians increasing the size of the bureaucracy in presence of incentives to engage in patronagepractices.
Clearly, we do not study all the possible mechanisms through which patronage might affectwelfare. Potential additional costs of patronage include the disruption in the bureaucracythat is linked to political turnover,99 or the misallocation of funds between public sectorpersonnel and other, more productive investments. We are also unable to quantify potentiallypositive effects of patronage, such as possible decreases in agency problems because of loyaltybetween hired supporters and the party in power. Investigating the additional channelsthrough which the presence of patronage practices might affect the quality of public servicedelivery represents an exciting avenue for future research.
99Akhtari et al. (2016)

PATRONAGE IN THE ALLOCATION OF PUBLIC SECTOR JOBS 38
References
Acemoglu, D., D. Ticchi, and A. Vindigni (2011): “Emergence and Persistence ofInefficient States,” Journal of the European Economic Association, 9(2), 177–208. 17
Afonso, J. R. R. and E. A. Araujo (2000): “A capacidade de gasto dos municıpiosbrasileiros: arrecadacao propria e receita disponıvel,” . 2.2
Akhtari, M., D. Moreira, and L. Trucco (2016): “Political Turnover, BureaucraticTurnover, and the Quality of Public Services,” Working Paper. 1, 48, 7, 99
Ashraf, N. and O. Bandiera (2017): “Social Incentives in Organizations,” Workingpaper. 1
Ashraf, N., O. Bandiera, and B. K. Jack (2014): “No margin, no mission? A fieldexperiment on incentives for public service delivery,” Journal of Public Economics, 120,1–17. 11, 1, 90
Ashraf, N., O. Bandiera, S. S. Lee, et al. (2016): “Do-gooders and go-getters: careerincentives, selection, and performance in public service delivery,” Working paper. 1
Bertrand, M., R. Burgess, A. Chawla, and G. Xu (2016): “The Costs of Bureau-cratic Rigidity: Evidence from the Indian Administrative Service,” Working paper. 1
Besley, T., O. Folke, T. Persson, and J. Rickne (2017): “Gender Quotas and theCrisis of the Mediocre Man: Theory and Evidence from Sweden,” American EconomicReview, forthcoming. 1, 6.4, 6.4.1
Best, M. C., J. Hjort, and D. Szakonyi (2016): “Individuals and Organizations asSources of State Effectiveness, and Consequences for Policy Design,” . 15
Calonico, S., M. D. Cattaneo, and R. Titiunik (2014): “Robust NonparametricConfidence Intervals for Regression-Discontinuity Designs,” Econometrica, 82, 2295–2326.55, 66, 92, A8, A17
Chubb, J. (1982): Patronage, power and poverty in southern Italy: a tale of two cities,Cambridge University Press. 3
Cingano, F. and P. Pinotti (2013): “Politicians at work: The private returns and socialcosts of political connections,” Journal of the European Economic Association, 433–465. 1
Colonnelli, E. and M. Prem (2017): “Corruption and Firms: Evidence from Random-ized Audits in Brazil,” Working Paper. 44
Dahis, R. (2015): “Choosing Institutions Locally: Determinants of Legislative Size inBrazil,” Working Paper. 19
Dal Bo, E., F. Finan, O. Folke, T. Persson, and J. Rickne (2017): “Who Becomesa Politician?” Quarterly Journal of Economics, forthcoming. 1, 6.4, 6.4.1, 87
Dal Bo, E., F. Finan, and M. A. Rossi (2013): “Strengthening State Capabilities:The Role of Financial Incentives in the Call to Public Service,” Quarterly Journal ofEconomics, 128, 1169–1218. 1, 6.3
PATRONAGE IN THE ALLOCATION OF PUBLIC SECTOR JOBS 39
DellaVigna, S. and D. Pope (2017): “What motivates effort? Evidence and expertforecasts,” Review of Economic Studies. 90
Deserranno, E. (2017): “Financial incentives as signals: Experimental evidence from therecruitment of Health Workers,” Working paper. 1
Drugov, M. (2015): “Optimal Patronage,” CEPR Discussion Papers 10343. 17Evans, P. and J. E. Rauch (1999): “Bureaucracy and Growth: A Cross-National Analysis
of the Effects of ”Weberian” State Structures on Economic Growth,” American SociologicalReview, 64, 748–765. 1
Faccio, M. (2006): “Politically connected firms,” The American economic review, 96, 369–386. 1
Faccio, M., R. W. Masulis, and J. J. McConnell (2006): “Political connections andcorporate bailouts,” Journal of Finance, 2597–2635. 1
Ferraz, C. and F. Finan (2011): “Motivating politicians: The impacts of monetaryincentives on quality and performance,” National Bureau of Economic Research. 2.1, 23
Finan, F., B. A. Olken, and R. Pande (2015): “The Personnel Economics of the State,”National Bureau of Economic Research. 1
Fisman, R. (2001): “Estimating the value of political connections,” The American EconomicReview, 91, 1095–1102. 1
Fisman, R., F. Schulz, and V. Vig (2014): “The Private Returns to Public Office,”Journal of Political Economy, 806–862. 54
Folke, O., S. Hirano, and J. M. Snyder (2011): “Patronage and Elections in U.S.States,” American Political Science Review, 105, 567–585. 17
Folke, O., T. Persson, and J. Rickne (2017): “Dynastic Political Rents,” EconomicJournal. 1
Gagliarducci, S. and M. Manacorda (2017): “Politics in the Family: Nepotism andthe Hiring Decisions of Italian Firms,” Working paper. 1
Gelman, A. and G. Imbens (2016): “Why High-order Polynomials should not be usedin Why High-order Polynomials should not be used in Regression Discontinuity Designs,”NBER Working Paper 19649. 4.1
Grindle, M. S. (2010): “Constructing, Deconstructing, and Reconstructing Career CivilService Systems in Latin America,” HKS Faculty Research Working Paper Series. 3
——— (2012): Jobs for the Boys, Harvard University Press. 1, 1Guardado, J. (2017): “Office-Selling, Corruption, and Long-Term Development in Peru,”
Working paper. 16Gulzar, S. and B. Pasquale (2016): “Politicians, bureaucrats, and development: Evi-
dence from India,” American Political Science Review. 1
PATRONAGE IN THE ALLOCATION OF PUBLIC SECTOR JOBS 40
Iacoviello, M. (2006): “Analysis comparativo por subsistemas,” in Informe sobre lasituacion del servicio civil en America Latina, ed. by K. Echebarrıa, Washington, D.C.:Inter-American Development Bank. 1
Iyer, L. and A. Mani (2011): “Traveling Agents: Political Change and BureaucraticTurnover in India,” Review of Economics and Statistics. 1
Khwaja, A. I. and A. Mian (2005): “Do Lenders Favor Politically Connected Firms?Rent Provision in an Emerging Financial Market,” The Quarterly Journal of Economics,120, 1371–1411. 1
Labonne, J. and M. Fafchamps (2017): “Do Politicians’ Relatives Get Better Jobs?Evidence from Municipal Elections,” Journal of Law, Economics, and Organizations, 268–300. 7, 1, 63
Markussen, T. and F. Tarp (2014): “Political connections and land-related investmentin rural Vietnam,” Journal of Development Economics, 291–302. 1
Menezes-Filho, N. A., M.-A. Muendler, and G. Ramey (2008): “The structure ofworker compensation in Brazil, with a comparison to France and the United States,” TheReview of Economics and Statistics, 90, 324–346. 3.2, 44
Ornaghi, A. (2016): “Civil Service Reforms: Evidence from U.S. Police Departments,”Working paper. 1
Rasul, I. and D. Rogger (2015): “The Impact of Ethnic Diversity in Bureaucracies:Evidence from the Nigerian Civil Service,” American Economic Review PP, 105(5), 457–461. 11
——— (2017): “Management of Bureaucrats and Public Service Delivery: Evidence fromthe Nigerian Civil Service,” Economic Journal. 1
Riordon, W. L. (1905): Plunkitt of Tammany Hall: A Series of Very Plain Talks on VeryPractical Politics,, Bedford Books of St. Martin’s Press,. 3
Robinson, J. A. and T. Verdier (2013): “The Political Economy of Clientelism,” Scan-dinavian Journal of Economics, 115, 260–291. 17
Rogger, D. (2014): “The Causes and Consequences of Political Interference in BureaucraticDecision Making: Evidence from Nigeria,” Tech. rep., Working paper. 1
Schoenherr, D. (2017): “Political Connections and Allocative Distortions,” Working pa-per. 1
Shleifer, A. and R. W. Vishny (1994): “Politicians and firms,” The Quarterly Journalof Economics, 995–1025. 13
Souza, C. (2002): “Brazil’s system of local government, local finance and intergovernmentalrelations,” Paper is part of the EngKaR Research Project, 8070. 2.2
Tonin, M. and M. Vlassopoulos (2010): “Disentangling the sources of pro-sociallymotivated effort: A field experiment,” Journal of Public Economics, 1086–1092. 90
PATRONAGE IN THE ALLOCATION OF PUBLIC SECTOR JOBS 41
——— (2015): “Corporate philanthropy and productivity: Evidence from an online realeffort experiment,” Management Science, 1795–1811. 90
Ujhelyi, G. (2014): “Civil Service Rules and Policy Choices: Evidence from US StateGovernments,” American Economic Journal: Economic Policy, 338–380. 17
Weaver, J. (2017): “Jobs for Sale: Corruption and Misallocation in Hiring,” Workingpaper. 1
Weingrod, A. (1968): “Patrons, Patronage, and Political Parties,” Comparative Studiesin Society and History, 10, 377–400. 2
Wilson, J. (1961): “The Economy of Patronage,” Journal of Political Economy, 69, 369–380. 3
Xu, G. (2017): “The Costs of Patronage: Evidence from the British Empire,” WorkingPaper. 1
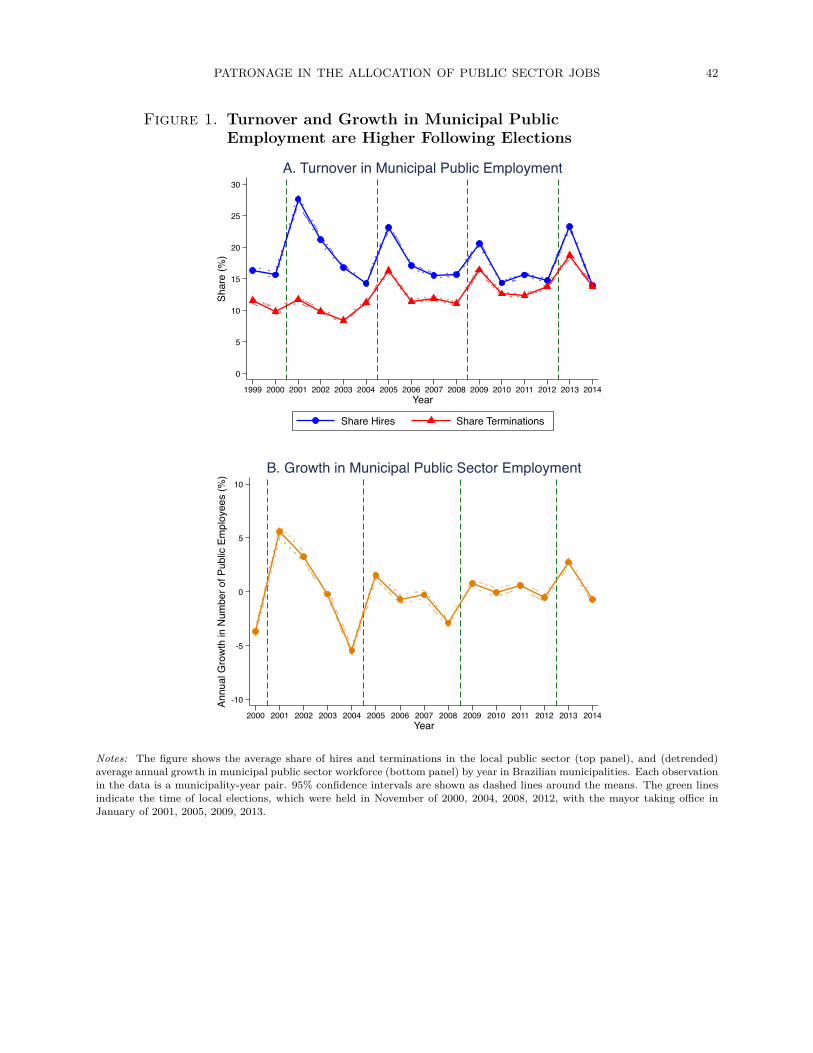
PATRONAGE IN THE ALLOCATION OF PUBLIC SECTOR JOBS 42
Figure 1. Turnover and Growth in Municipal PublicEmployment are Higher Following Elections
0
5
10
15
20
25
30
Shar
e (%
)
1999 2000 2001 2002 2003 2004 2005 2006 2007 2008 2009 2010 2011 2012 2013 2014Year
Share Hires Share Terminations
A. Turnover in Municipal Public Employment
-10
-5
0
5
10
Annu
al G
row
th in
Num
ber o
f Pub
lic E
mpl
oyee
s (%
)
2000 2001 2002 2003 2004 2005 2006 2007 2008 2009 2010 2011 2012 2013 2014Year
B. Growth in Municipal Public Sector Employment
Notes: The figure shows the average share of hires and terminations in the local public sector (top panel), and (detrended)average annual growth in municipal public sector workforce (bottom panel) by year in Brazilian municipalities. Each observationin the data is a municipality-year pair. 95% confidence intervals are shown as dashed lines around the means. The green linesindicate the time of local elections, which were held in November of 2000, 2004, 2008, 2012, with the mayor taking office inJanuary of 2001, 2005, 2009, 2013.
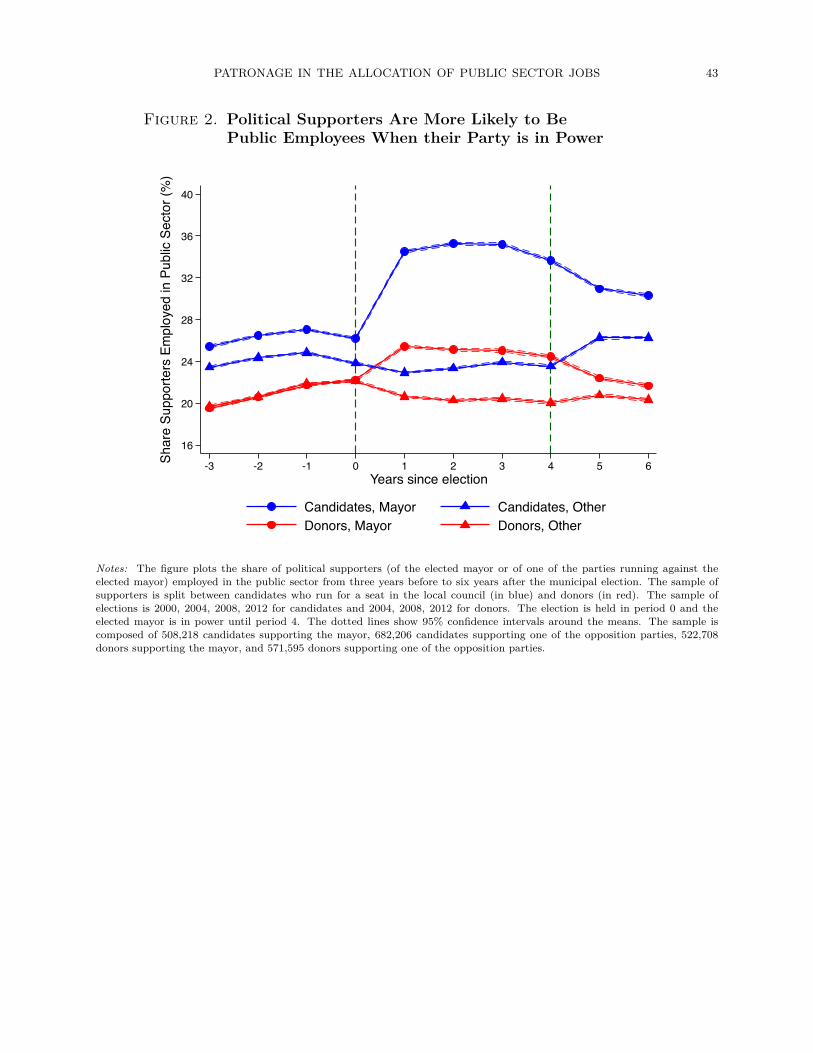
PATRONAGE IN THE ALLOCATION OF PUBLIC SECTOR JOBS 43
Figure 2. Political Supporters Are More Likely to BePublic Employees When their Party is in Power
16
20
24
28
32
36
40
Shar
e Su
ppor
ters
Em
ploy
ed in
Pub
lic S
ecto
r (%
)
-3 -2 -1 0 1 2 3 4 5 6Years since election
Candidates, Mayor Candidates, OtherDonors, Mayor Donors, Other
Notes: The figure plots the share of political supporters (of the elected mayor or of one of the parties running against theelected mayor) employed in the public sector from three years before to six years after the municipal election. The sample ofsupporters is split between candidates who run for a seat in the local council (in blue) and donors (in red). The sample ofelections is 2000, 2004, 2008, 2012 for candidates and 2004, 2008, 2012 for donors. The election is held in period 0 and theelected mayor is in power until period 4. The dotted lines show 95% confidence intervals around the means. The sample iscomposed of 508,218 candidates supporting the mayor, 682,206 candidates supporting one of the opposition parties, 522,708donors supporting the mayor, and 571,595 donors supporting one of the opposition parties.
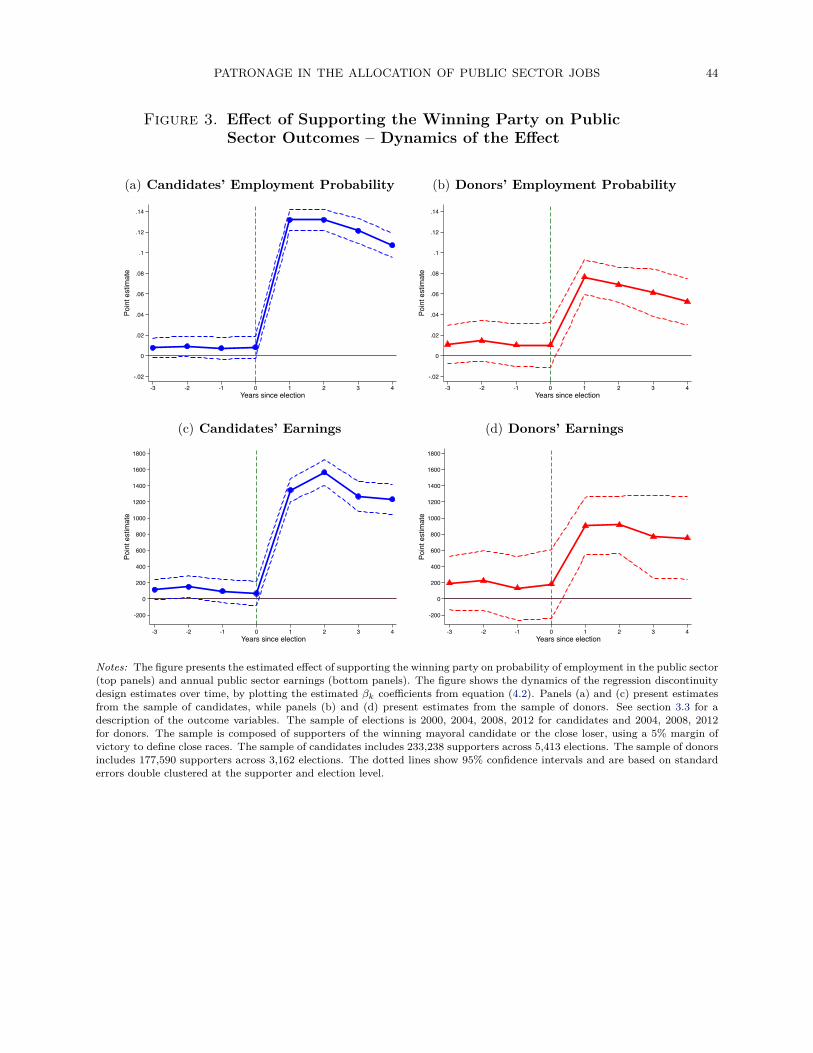
PATRONAGE IN THE ALLOCATION OF PUBLIC SECTOR JOBS 44
Figure 3. Effect of Supporting the Winning Party on PublicSector Outcomes – Dynamics of the Effect
(a) Candidates’ Employment Probability
-.02
0
.02
.04
.06
.08
.1
.12
.14
Poin
t est
imat
e
-3 -2 -1 0 1 2 3 4Years since election
(b) Donors’ Employment Probability
-.02
0
.02
.04
.06
.08
.1
.12
.14
Poin
t est
imat
e
-3 -2 -1 0 1 2 3 4Years since election
(c) Candidates’ Earnings
-200
0
200
400
600
800
1000
1200
1400
1600
1800
Poin
t est
imat
e
-3 -2 -1 0 1 2 3 4Years since election
(d) Donors’ Earnings
-200
0
200
400
600
800
1000
1200
1400
1600
1800
Poin
t est
imat
e
-3 -2 -1 0 1 2 3 4Years since election
Notes: The figure presents the estimated effect of supporting the winning party on probability of employment in the public sector(top panels) and annual public sector earnings (bottom panels). The figure shows the dynamics of the regression discontinuitydesign estimates over time, by plotting the estimated βk coefficients from equation (4.2). Panels (a) and (c) present estimatesfrom the sample of candidates, while panels (b) and (d) present estimates from the sample of donors. See section 3.3 for adescription of the outcome variables. The sample of elections is 2000, 2004, 2008, 2012 for candidates and 2004, 2008, 2012for donors. The sample is composed of supporters of the winning mayoral candidate or the close loser, using a 5% margin ofvictory to define close races. The sample of candidates includes 233,238 supporters across 5,413 elections. The sample of donorsincludes 177,590 supporters across 3,162 elections. The dotted lines show 95% confidence intervals and are based on standarderrors double clustered at the supporter and election level.
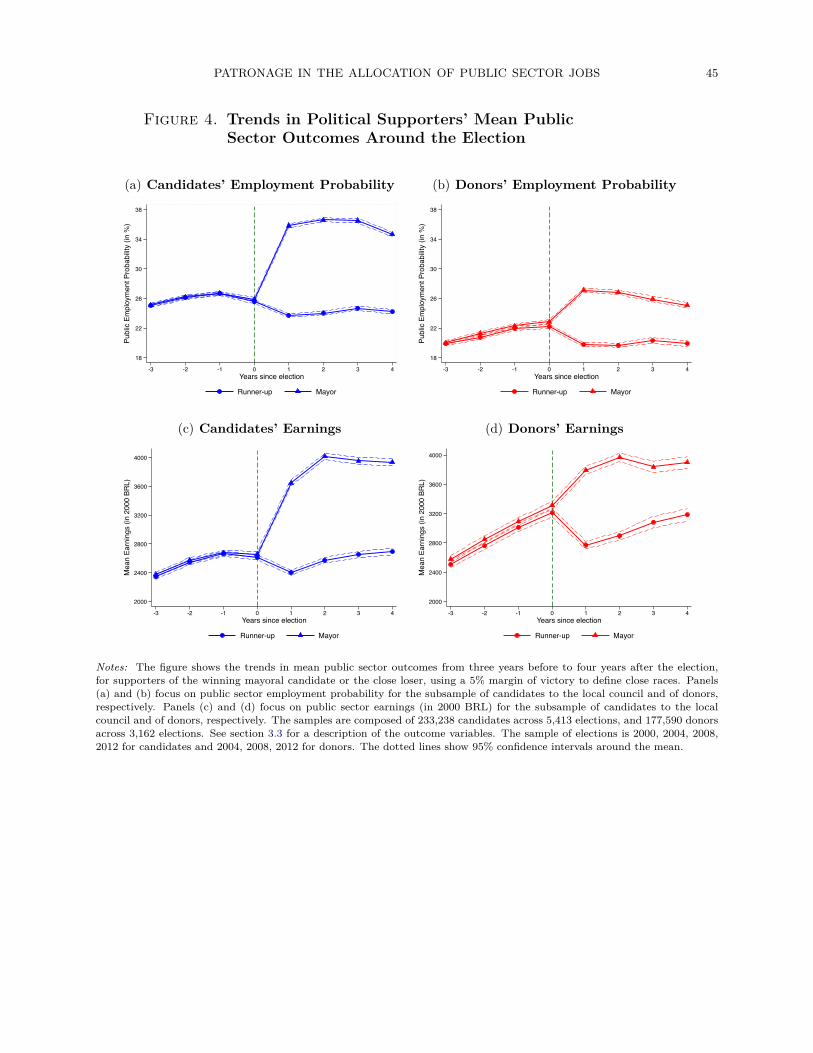
PATRONAGE IN THE ALLOCATION OF PUBLIC SECTOR JOBS 45
Figure 4. Trends in Political Supporters’ Mean PublicSector Outcomes Around the Election
(a) Candidates’ Employment Probability
26
30
38
18
22
34
Publ
ic E
mpl
oym
ent P
roba
bilit
y (in
%)
-3 -2 -1 0 1 2 3 4Years since election
Runner-up Mayor
(b) Donors’ Employment Probability
26
38
18
22
30
34
Publ
ic E
mpl
oym
ent P
roba
bilit
y (in
%)
-3 -2 -1 0 1 2 3 4Years since election
Runner-up Mayor
(c) Candidates’ Earnings
2000
2400
2800
3200
3600
4000
Mea
n Ea
rnin
gs (i
n 20
00 B
RL)
-3 -2 -1 0 1 2 3 4Years since election
Runner-up Mayor
(d) Donors’ Earnings
2000
2400
2800
3200
3600
4000
Mea
n Ea
rnin
gs (i
n 20
00 B
RL)
-3 -2 -1 0 1 2 3 4Years since election
Runner-up Mayor
Notes: The figure shows the trends in mean public sector outcomes from three years before to four years after the election,for supporters of the winning mayoral candidate or the close loser, using a 5% margin of victory to define close races. Panels(a) and (b) focus on public sector employment probability for the subsample of candidates to the local council and of donors,respectively. Panels (c) and (d) focus on public sector earnings (in 2000 BRL) for the subsample of candidates to the localcouncil and of donors, respectively. The samples are composed of 233,238 candidates across 5,413 elections, and 177,590 donorsacross 3,162 elections. See section 3.3 for a description of the outcome variables. The sample of elections is 2000, 2004, 2008,2012 for candidates and 2004, 2008, 2012 for donors. The dotted lines show 95% confidence intervals around the mean.

PATRONAGE IN THE ALLOCATION OF PUBLIC SECTOR JOBS 46
Figure 5. Post-Election Public Sector Employment ProbabilityAround the Discontinuity Cutoff
(a) Candidates
.18
.2
.22
.24
.26
.28
.3
.32
.34
.36
.38
Empl
oym
ent P
roba
bilit
y
-20 -10 0 10 20-5-15 155Margin of Victory of Supported Mayoral Candidate
(b) Donors
.12
.14
.16
.18
.2
.22
.24
.26
.28
.3
.32
Empl
oym
ent P
roba
bilit
y
-20 -10 0 10 205 15-15 -5Margin of Victory of Supported Mayoral Candidate
Notes: The figure shows the average public sector employment probability in the 4 years after the election, by bins of themargin of victory of the mayoral candidate supported over the opponent. Supporters whose supported mayoral candidatelost have a negative margin of victory, while supporters of the winning mayoral candidate have a positive margin of victory.Panel A focuses on the sample of candidates, and Panel B focuses on the sample of donors. The best-fit lines on both sidesof the discontinuity are computed on the underlying data. The sample of elections is 2000, 2004, 2008, 2012 for the sample ofcandidates and 2004, 2008, 2012 for the sample of donors.
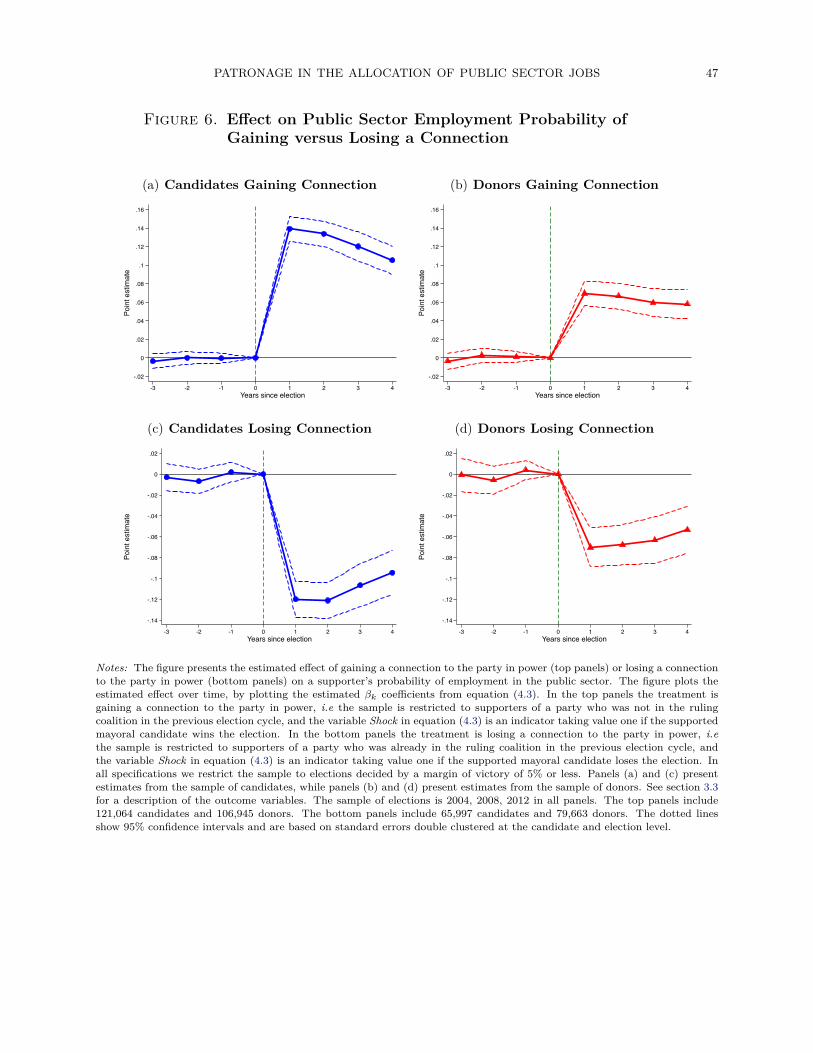
PATRONAGE IN THE ALLOCATION OF PUBLIC SECTOR JOBS 47
Figure 6. Effect on Public Sector Employment Probability ofGaining versus Losing a Connection
(a) Candidates Gaining Connection
-.02
0
.02
.04
.06
.08
.1
.12
.14
.16
Poin
t est
imat
e
-3 -2 -1 0 1 2 3 4Years since election
(b) Donors Gaining Connection
-.02
0
.02
.04
.06
.08
.1
.12
.14
.16
Poin
t est
imat
e
-3 -2 -1 0 1 2 3 4Years since election
(c) Candidates Losing Connection
-.14
-.12
-.1
-.08
-.06
-.04
-.02
0
.02
Poin
t est
imat
e
-3 -2 -1 0 1 2 3 4Years since election
(d) Donors Losing Connection
-.14
-.12
-.1
-.08
-.06
-.04
-.02
0
.02
Poin
t est
imat
e
-3 -2 -1 0 1 2 3 4Years since election
Notes: The figure presents the estimated effect of gaining a connection to the party in power (top panels) or losing a connectionto the party in power (bottom panels) on a supporter’s probability of employment in the public sector. The figure plots theestimated effect over time, by plotting the estimated βk coefficients from equation (4.3). In the top panels the treatment isgaining a connection to the party in power, i.e the sample is restricted to supporters of a party who was not in the rulingcoalition in the previous election cycle, and the variable Shock in equation (4.3) is an indicator taking value one if the supportedmayoral candidate wins the election. In the bottom panels the treatment is losing a connection to the party in power, i.ethe sample is restricted to supporters of a party who was already in the ruling coalition in the previous election cycle, andthe variable Shock in equation (4.3) is an indicator taking value one if the supported mayoral candidate loses the election. Inall specifications we restrict the sample to elections decided by a margin of victory of 5% or less. Panels (a) and (c) presentestimates from the sample of candidates, while panels (b) and (d) present estimates from the sample of donors. See section 3.3for a description of the outcome variables. The sample of elections is 2004, 2008, 2012 in all panels. The top panels include121,064 candidates and 106,945 donors. The bottom panels include 65,997 candidates and 79,663 donors. The dotted linesshow 95% confidence intervals and are based on standard errors double clustered at the candidate and election level.
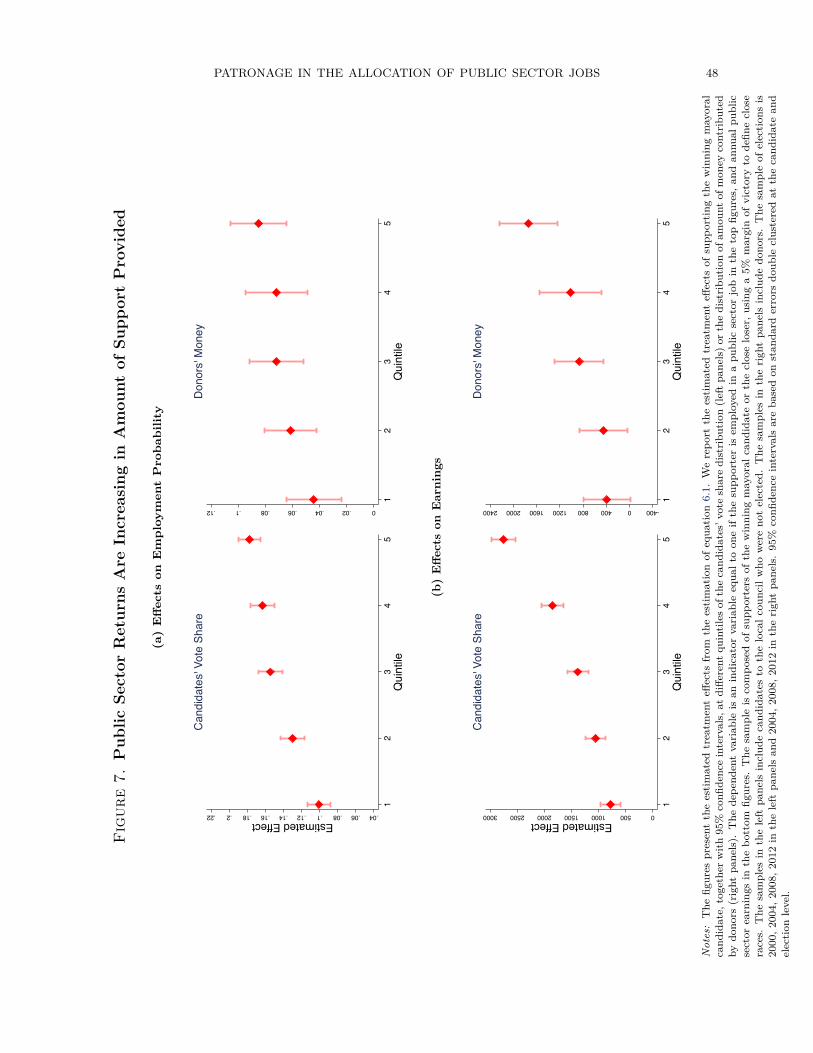
PATRONAGE IN THE ALLOCATION OF PUBLIC SECTOR JOBS 48
Fig
ure
7.P
ublic
Sect
orR
etur
nsA
reIn
crea
sing
inA
mou
ntof
Supp
ort
Pro
vide
d
PAT
RO
NA
GE
INT
HE
ALL
OC
ATIO
NO
FPU
BLI
CSE
CT
OR
JOB
S50
Fig
ure
9.Pu
blic
Sect
orEm
ploy
men
tPr
obab
ility
Dep
ends
onPa
rty
Fort
une
(a)
(a)
E�e
cts
onEm
ploy
men
tP
roba
bilit
y(b
)(a
)E
�ect
son
Ear
ning
s
Not
es:
The
figur
epr
esen
tsth
ees
tim
ated
—One
kan
d—Both
kco
e�ci
ents
from
equa
tion
(7.1
)w
ithpr
obab
ility
ofem
ploy
-m
ent
inth
epu
blic
sect
oras
the
outc
ome
vari
able
.W
ese
para
tely
focu
son
thre
egr
oups
ofsu
ppor
ters
:th
ose
supp
orti
nga
part
yw
inni
ngtw
oco
nsec
utiv
eel
ecti
ons
(in
year
0an
din
year
4);
thos
esu
ppor
ting
apa
rty
win
ning
the
elec
tion
inye
ar0
but
losi
ngth
eel
ectio
nin
year
4;th
ose
supp
ortin
ga
part
ylo
sing
both
the
elec
tion
inye
ar0
and
the
elec
tion
inye
ar4.
Plo
tted
inbl
ueis
the
e�ec
tof
supp
ortin
ga
part
yw
inni
ngbo
thth
eel
ectio
nsve
rsus
supp
ortin
ga
part
ylo
sing
both
the
elec
tion
s.P
lott
edin
red
isth
ee�
ect
ofsu
ppor
ting
apa
rty
win
ning
only
the
first
elec
tion
vers
ussu
ppor
ting
apa
rty
losi
ngbo
thth
eel
ecti
ons.
InPa
nel(
a),t
hesa
mpl
eis
rest
rict
edto
the
subs
etof
supp
orte
rsof
apa
rty
invo
lved
ina
clos
em
ayor
alel
ecti
onin
year
0.In
Pane
l(b)
,the
sam
ple
isre
stri
cted
toth
esu
bset
ofsu
ppor
ters
ofa
part
yin
volv
edin
two
cons
ecut
ive
clos
em
ayor
alel
ectio
ns(in
year
0an
din
year
4).
The
dott
edlin
essh
ow95
%co
nfide
nce
inte
rval
san
dar
eba
sed
onst
anda
rder
rors
doub
lecl
uste
red
atth
esu
ppor
ter
and
elec
tion
leve
l.**
*p†
0.01
,**
p†0.
05,*
p†0.
1.
.04.06.08.1.12.14.16.18.2.22Estimated Effect
12
34
5Q
uint
ile
Can
dida
tes'
Vote
Sha
re
0.02.04.06.08.1.12
12
34
5Q
uint
ile
Don
ors'
Mon
ey
PAT
RO
NA
GE
INT
HE
ALL
OC
ATIO
NO
FPU
BLI
CSE
CT
OR
JOB
S49
Fig
ure
8.Pu
blic
Sect
orEm
ploy
men
tPr
obab
ility
Dep
ends
onPa
rty
Fort
une
(a)
(b)
E�e
cts
onEar
ning
s(b
)C
lose
Ele
ctio
nat
t=0
and
t=4
Not
es:
The
figur
epr
esen
tsth
ees
tim
ated
—One
kan
d—Both
kco
e�ci
ents
from
equa
tion
(7.1
)w
ithpr
obab
ility
ofem
ploy
-m
ent
inth
epu
blic
sect
oras
the
outc
ome
vari
able
.W
ese
para
tely
focu
son
thre
egr
oups
ofsu
ppor
ters
:th
ose
supp
orti
nga
part
yw
inni
ngtw
oco
nsec
utiv
eel
ecti
ons
(in
year
0an
din
year
4);
thos
esu
ppor
ting
apa
rty
win
ning
the
elec
tion
inye
ar0
but
losi
ngth
eel
ectio
nin
year
4;th
ose
supp
ortin
ga
part
ylo
sing
both
the
elec
tion
inye
ar0
and
the
elec
tion
inye
ar4.
Plo
tted
inbl
ueis
the
e�ec
tof
supp
ortin
ga
part
yw
inni
ngbo
thth
eel
ectio
nsve
rsus
supp
ortin
ga
part
ylo
sing
both
the
elec
tion
s.P
lott
edin
red
isth
ee�
ect
ofsu
ppor
ting
apa
rty
win
ning
only
the
first
elec
tion
vers
ussu
ppor
ting
apa
rty
losi
ngbo
thth
eel
ecti
ons.
InPa
nel(
a),t
hesa
mpl
eis
rest
rict
edto
the
subs
etof
supp
orte
rsof
apa
rty
invo
lved
ina
clos
em
ayor
alel
ecti
onin
year
0.In
Pane
l(b)
,the
sam
ple
isre
stri
cted
toth
esu
bset
ofsu
ppor
ters
ofa
part
yin
volv
edin
two
cons
ecut
ive
clos
em
ayor
alel
ectio
ns(in
year
0an
din
year
4).
The
dott
edlin
essh
ow95
%co
nfide
nce
inte
rval
san
dar
eba
sed
onst
anda
rder
rors
doub
lecl
uste
red
atth
esu
ppor
ter
and
elec
tion
leve
l.**
*p†
0.01
,**
p†0.
05,*
p†0.
1.
Clo
seEl
ectio
nat
t=0
050010001500200025003000Estimated Effect
12
34
5Q
uint
ile
Can
dida
tes'
Vote
Sha
re
-40004008001200160020002400
12
34
5Q
uint
ile
Don
ors'
Mon
ey
Not
es:
The
figur
espr
esen
tth
ees
timat
edtr
eatm
ent
effec
tsfr
omth
ees
timat
ion
ofeq
uatio
n6.
1.W
ere
port
the
estim
ated
trea
tmen
teff
ects
ofsu
ppor
ting
the
win
ning
may
oral
cand
idat
e,to
geth
erw
ith95
%co
nfide
nce
inte
rval
s,at
diffe
rent
quin
tiles
ofth
eca
ndid
ates
’vot
esh
are
dist
ribu
tion
(left
pane
ls)o
rthe
dist
ribu
tion
ofam
ount
ofm
oney
cont
ribu
ted
bydo
nors
(rig
htpa
nels
).T
hede
pend
ent
vari
able
isan
indi
cato
rva
riab
leeq
ualt
oon
eif
the
supp
orte
ris
empl
oyed
ina
publ
icse
ctor
job
inth
eto
pfig
ures
,and
annu
alpu
blic
sect
orea
rnin
gsin
the
bott
omfig
ures
.T
hesa
mpl
eis
com
pose
dof
supp
orte
rsof
the
win
ning
may
oral
cand
idat
eor
the
clos
elo
ser,
usin
ga
5%m
argi
nof
vict
ory
tode
fine
clos
era
ces.
The
sam
ples
inth
ele
ftpa
nels
incl
ude
cand
idat
esto
the
loca
lcou
ncil
who
wer
eno
tel
ecte
d.T
hesa
mpl
esin
the
righ
tpa
nels
incl
ude
dono
rs.
The
sam
ple
ofel
ectio
nsis
2000
,200
4,20
08,2
012
inth
ele
ftpa
nels
and
2004
,200
8,20
12in
the
righ
tpa
nels
.95
%co
nfide
nce
inte
rval
sar
eba
sed
onst
anda
rder
rors
doub
lecl
uste
red
atth
eca
ndid
ate
and
elec
tion
leve
l.
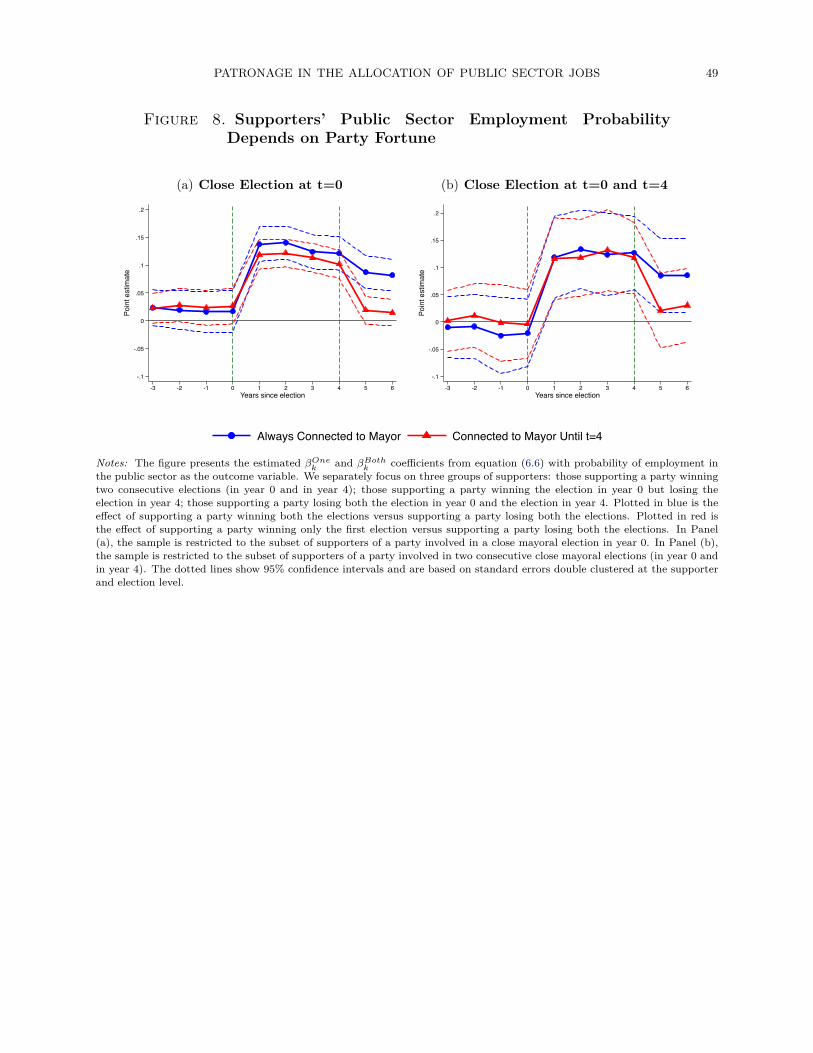
PATRONAGE IN THE ALLOCATION OF PUBLIC SECTOR JOBS 49
Figure 8. Supporters’ Public Sector Employment ProbabilityDepends on Party Fortune
(a) Close Election at t=0
-.1
-.05
0
.05
.1
.15
.2
Poin
t est
imat
e
-3 -2 -1 0 1 2 3 4 5 6Years since election
(b) Close Election at t=0 and t=4
-.1
-.05
0
.05
.1
.15
.2
Poin
t est
imat
e
-3 -2 -1 0 1 2 3 4 5 6Years since election
20
24
28
32
36Sh
are
Empl
oyed
(%)
-3 -2 -1 0 1 2 3 4 5 6Years since election
Always Connected to Mayor Connected to Mayor Until t=4
Panel A: All Jobs
Notes: The figure presents the estimated βOnek and βBoth
k coefficients from equation (6.6) with probability of employment inthe public sector as the outcome variable. We separately focus on three groups of supporters: those supporting a party winningtwo consecutive elections (in year 0 and in year 4); those supporting a party winning the election in year 0 but losing theelection in year 4; those supporting a party losing both the election in year 0 and the election in year 4. Plotted in blue is theeffect of supporting a party winning both the elections versus supporting a party losing both the elections. Plotted in red isthe effect of supporting a party winning only the first election versus supporting a party losing both the elections. In Panel(a), the sample is restricted to the subset of supporters of a party involved in a close mayoral election in year 0. In Panel (b),the sample is restricted to the subset of supporters of a party involved in two consecutive close mayoral elections (in year 0 andin year 4). The dotted lines show 95% confidence intervals and are based on standard errors double clustered at the supporterand election level.

PATRONAGE IN THE ALLOCATION OF PUBLIC SECTOR JOBS 50
Figure 9. Effect of Supporting the Winning PartyAmong Switchers and Loyals
-.08
-.04
0.0
4.0
8.1
2.1
6.2
.24
.28
Estim
ated
Effe
ct
Loyals to Party Party Switchers
(a) Candidates
-.08
-.04
0.0
4.0
8.1
2.1
6.2
.24
.28
Loyals to Party Party Switchers
(b) Donors
Notes: The figure shows the estimated coefficients and 95% confidence intervals for the estimated β from equation (4.1) withprobability of employment in the public sector as the outcome variable, for different subsample supporters. “Loyals to Party”refer to candidates (respectively, donors) who in the previous election run in (respectively, donated to) the same party of themayoral candidate supported in the current election. “Party Switchers” refer to candidates (respectively, donors) who in theprevious election run in (respectively, donated to) a different party than the one of the mayoral candidate supported in thecurrent election. Results in Panel (a) are estimated on the sample of candidates. Results in Panel (b) are estimated on thesample of donors. The sample is composed of supporters of the winning mayoral candidate or the close loser, using a 5% marginof victory to define close races. The sample is further restricted to supporters of the winning mayoral candidate or the closeloser who had run/donated also in the previous elections. The sample of elections is 2004, 2008, 2012 for candidates and 2008and 2012 for donors. 95% confidence intervals are based on standard errors double clustered at the candidate and election level.
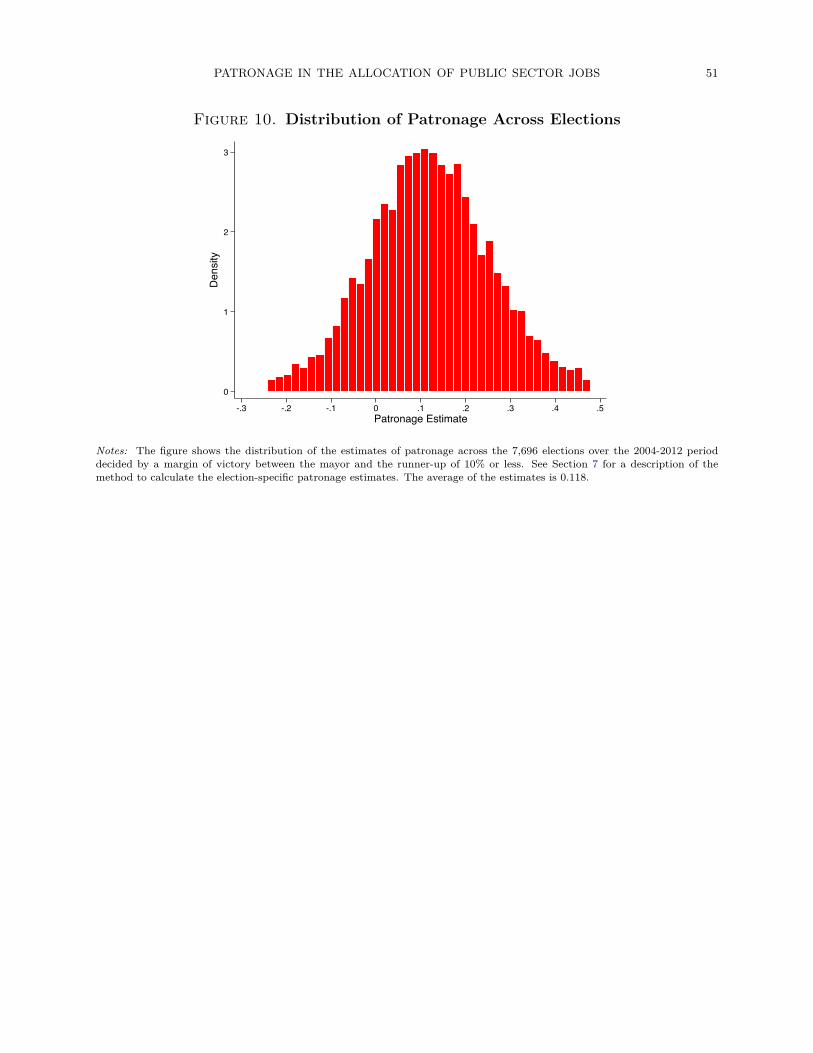
PATRONAGE IN THE ALLOCATION OF PUBLIC SECTOR JOBS 51
Figure 10. Distribution of Patronage Across Elections
0
1
2
3
Den
sity
-.3 -.2 -.1 0 .1 .2 .3 .4 .5Patronage Estimate
Notes: The figure shows the distribution of the estimates of patronage across the 7,696 elections over the 2004-2012 perioddecided by a margin of victory between the mayor and the runner-up of 10% or less. See Section 7 for a description of themethod to calculate the election-specific patronage estimates. The average of the estimates is 0.118.
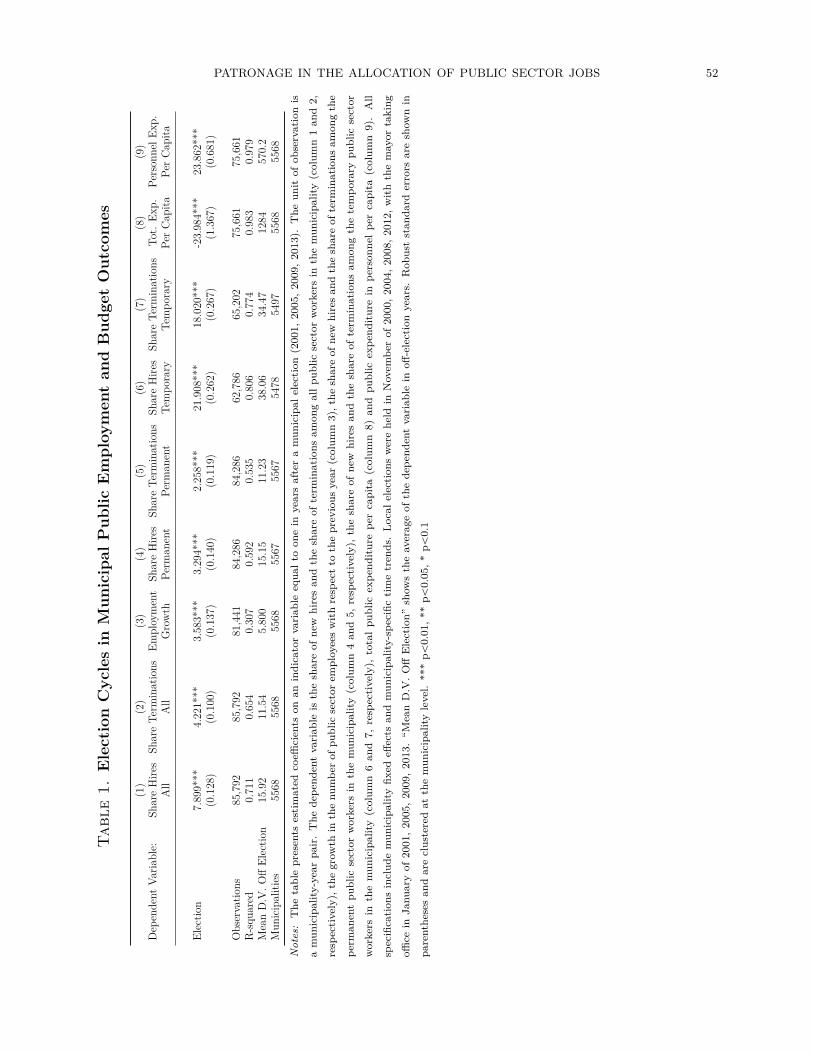
PATRONAGE IN THE ALLOCATION OF PUBLIC SECTOR JOBS 52
Tab
le1.
Ele
ctio
nC
ycle
sin
Mun
icip
alP
ublic
Em
ploy
men
tan
dB
udge
tO
utco
mes
(1)
(2)
(3)
(4)
(5)
(6)
(7)
(8)
(9)
Dep
ende
ntVa
riabl
e:Sh
are
Hire
sSh
are
Term
inat
ions
Empl
oym
ent
Shar
eH
ires
Shar
eTe
rmin
atio
nsSh
are
Hire
sSh
are
Term
inat
ions
Tot.
Exp.
Pers
onne
lExp
.A
llA
llG
row
thPe
rman
ent
Perm
anen
tTe
mpo
rary
Tem
pora
ryPe
rC
apita
Per
Cap
ita
Elec
tion
7.89
9***
4.22
1***
3.58
3***
3.29
4***
2.25
8***
21.9
08**
*18
.020
***
-23.
984*
**23
.862
***
(0.1
28)
(0.1
00)
(0.1
37)
(0.1
40)
(0.1
19)
(0.2
62)
(0.2
67)
(1.3
67)
(0.6
81)
Obs
erva
tions
85,7
9285
,792
81,4
4184
,286
84,2
8662
,786
65,2
0275
,661
75,6
61R
-squ
ared
0.71
10.
654
0.30
70.
592
0.53
50.
806
0.77
40.
983
0.97
9M
ean
D.V
.Off
Elec
tion
15.9
211
.54
5.80
015
.15
11.2
338
.06
34.4
712
8457
0.2
Mun
icip
aliti
es55
6855
6855
6855
6755
6754
7854
9755
6855
68N
otes
:T
heta
ble
pres
ents
estim
ated
coeffi
cien
tson
anin
dica
tor
vari
able
equa
lto
one
inye
ars
afte
ra
mun
icip
alel
ecti
on(2
001,
2005
,200
9,20
13).
The
unit
ofob
serv
atio
nis
am
unic
ipal
ity-y
ear
pair
.T
hede
pend
ent
vari
able
isth
esh
are
ofne
whi
res
and
the
shar
eof
term
inat
ions
amon
gal
lpub
licse
ctor
wor
kers
inth
em
unic
ipal
ity(c
olum
n1
and
2,re
spec
tivel
y),t
hegr
owth
inth
enu
mbe
rof
publ
icse
ctor
empl
oyee
sw
ithre
spec
tto
the
prev
ious
year
(col
umn
3),t
hesh
are
ofne
whi
res
and
the
shar
eof
term
inat
ions
amon
gth
epe
rman
ent
publ
icse
ctor
wor
kers
inth
em
unic
ipal
ity(c
olum
n4
and
5,re
spec
tivel
y),t
hesh
are
ofne
whi
res
and
the
shar
eof
term
inat
ions
amon
gth
ete
mpo
rary
publ
icse
ctor
wor
kers
inth
em
unic
ipal
ity(c
olum
n6
and
7,re
spec
tivel
y),
tota
lpu
blic
expe
nditu
repe
rca
pita
(col
umn
8)an
dpu
blic
expe
nditu
rein
pers
onne
lpe
rca
pita
(col
umn
9).
All
spec
ifica
tions
incl
ude
mun
icip
ality
fixed
effec
tsan
dm
unic
ipal
ity-s
peci
fictim
etr
ends
.Lo
cale
lect
ions
wer
ehe
ldin
Nov
embe
rof
2000
,200
4,20
08,2
012,
with
the
may
orta
king
office
inJa
nuar
yof
2001
,200
5,20
09,2
013.
“Mea
nD
.V.O
ffE
lect
ion”
show
sth
eav
erag
eof
the
depe
nden
tva
riab
lein
off-e
lect
ion
year
s.R
obus
tst
anda
rder
rors
are
show
nin
pare
nthe
ses
and
are
clus
tere
dat
the
mun
icip
ality
leve
l.**
*pă
0.01
,**
pă0.
05,*
pă0.
1
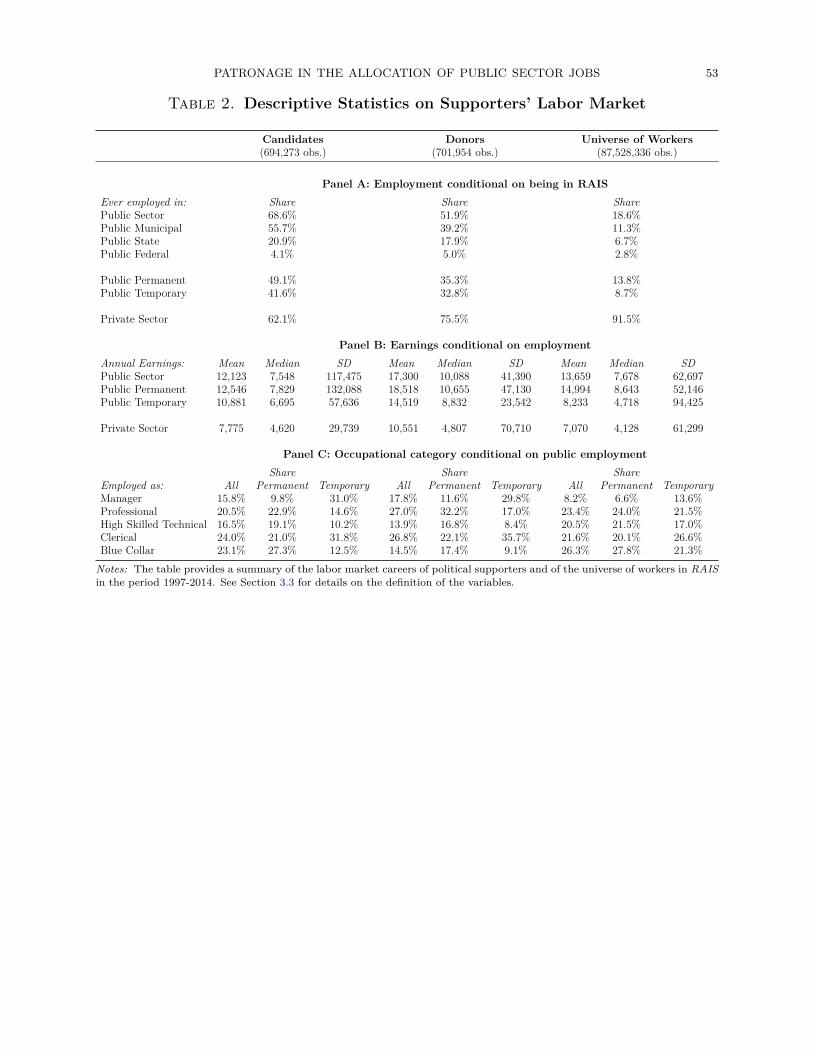
PATRONAGE IN THE ALLOCATION OF PUBLIC SECTOR JOBS 53
Table 2. Descriptive Statistics on Supporters’ Labor Market
Candidates Donors Universe of Workers(694,273 obs.) (701,954 obs.) (87,528,336 obs.)
Panel A: Employment conditional on being in RAISEver employed in: Share Share SharePublic Sector 68.6% 51.9% 18.6%Public Municipal 55.7% 39.2% 11.3%Public State 20.9% 17.9% 6.7%Public Federal 4.1% 5.0% 2.8%
Public Permanent 49.1% 35.3% 13.8%Public Temporary 41.6% 32.8% 8.7%
Private Sector 62.1% 75.5% 91.5%
Panel B: Earnings conditional on employmentAnnual Earnings: Mean Median SD Mean Median SD Mean Median SDPublic Sector 12,123 7,548 117,475 17,300 10,088 41,390 13,659 7,678 62,697Public Permanent 12,546 7,829 132,088 18,518 10,655 47,130 14,994 8,643 52,146Public Temporary 10,881 6,695 57,636 14,519 8,832 23,542 8,233 4,718 94,425
Private Sector 7,775 4,620 29,739 10,551 4,807 70,710 7,070 4,128 61,299
Panel C: Occupational category conditional on public employmentShare Share Share
Employed as: All Permanent Temporary All Permanent Temporary All Permanent TemporaryManager 15.8% 9.8% 31.0% 17.8% 11.6% 29.8% 8.2% 6.6% 13.6%Professional 20.5% 22.9% 14.6% 27.0% 32.2% 17.0% 23.4% 24.0% 21.5%High Skilled Technical 16.5% 19.1% 10.2% 13.9% 16.8% 8.4% 20.5% 21.5% 17.0%Clerical 24.0% 21.0% 31.8% 26.8% 22.1% 35.7% 21.6% 20.1% 26.6%Blue Collar 23.1% 27.3% 12.5% 14.5% 17.4% 9.1% 26.3% 27.8% 21.3%
Notes: The table provides a summary of the labor market careers of political supporters and of the universe of workers in RAISin the period 1997-2014. See Section 3.3 for details on the definition of the variables.

PATRONAGE IN THE ALLOCATION OF PUBLIC SECTOR JOBS 54
Table 3. Covariates Balance for Candidates
(1) (2) (3) (4) (5) (6) (7)Covariate Coefficient P-value Mean Cont. Group Observations Supporters Elections
Earnings Public t=0 66.332 0.389 2613 254,848 233238 5413Earnings Private t=0 21.740 0.454 794.3 254,848 233238 5413Earnings Total t=0 69.593 0.407 3697 254,848 233238 5413Employed Private t=0 -0.004 0.179 0.113 254,848 233238 5413Employed Public t=0 0.008 0.14 0.255 254,848 233238 5413Employed Any t=0 0.002 0.696 0.379 254,848 233238 5413Employed Qualified t=0 0.004 0.451 0.216 191,805 178993 4154Employed Unqualified t=0 0.003 0.364 0.057 191,805 178993 4154Employed Managerial t=0 0.002 0.588 0.038 192,232 179338 4154Employed Professional t=0 0.005** 0.037 0.057 192,232 179338 4154Employed HS Technical t=0 -0.000 0.829 0.045 192,232 179338 4154Employed Clerical t=0 -0.001 0.862 0.063 192,232 179338 4154Employed Blue Collar t=0 0.001 0.75 0.072 192,232 179338 4154Earnings Public t=-1 95.992 0.188 2664 254,848 233238 5413Earnings Private t=-1 34.461 0.234 816.5 254,848 233238 5413Earnings Total t=-1 124.925 0.111 3778 254,848 233238 5413Employed Private t=-1 -0.000 0.97 0.118 254,848 233238 5413Employed Public t=-1 0.007 0.172 0.267 254,848 233238 5413Employed Any t=-1 0.007 0.16 0.396 254,848 233238 5413Employed Qualified t=-1 0.003 0.51 0.223 191,191 178466 4154Employed Unqualified t=-1 0.003 0.318 0.062 191,191 178466 4154Employed Managerial t=-1 0.003 0.339 0.044 191,710 178881 4154Employed Professional t=-1 0.004 0.126 0.055 191,710 178881 4154Employed HS Technical t=-1 0.000 0.884 0.046 191,710 178881 4154Employed Clerical t=-1 -0.001 0.656 0.069 191,710 178881 4154Employed Blue Collar t=-1 0.001 0.724 0.071 191,710 178881 4154Mincer Sample 0.004 0.242 0.264 254,848 233238 5413Mincer Ability -0.065 0.478 -0.681 67,445 63423 5060Secondary School -0.002 0.7 0.216 252,805 231500 5413High School -0.002 0.639 0.347 252,805 231500 5413University Degree 0.008** 0.015 0.147 252,805 231500 5413Age 0.075 0.457 43.44 254,676 233092 5411Male 0.000 0.929 0.762 254,824 233216 5413Run Past Election -0.000 0.993 0.343 254,848 233238 5413Incumbent -0.002 0.651 0.129 254,848 233238 5413Party Already in Power 0.013 0.457 0.354 194,252 180895 4154Governor Party 0.005 0.819 0.220 254,848 233238 5413Fed. Government Party 0.014 0.321 0.483 254,848 233238 5413President Party 0.012 0.472 0.109 254,848 233238 5413Contributions Received 98.115 0.395 2111 194,252 180895 4154Contributions Spent 94.133 0.413 2105 194,252 180895 4154
Notes: The table shows balance tests for candidates’ covariates in the pre-election period. The coefficients and p-values incolumns 2 and 3 are from regressions of the covariate in column 1 on an indicator for treatment status (supporting the winningmayor), controlling for margin of victory and including election (i.e. municipality times election year) fixed effects, focusing onmayoral races decided by a margin of victory of 5% or less. Column 4 reports the mean of the covariate in the control group,namely among supporters of the runner-up mayoral candidate. Earnings Public/Private/Total are annual earnings in the public,private, and formal economy, respectively, in the year of the election (t=0) or the year before the election (t=-1). EmployedPublic/Private/Any are indicators taking value one if the supporter is employed in the public, private, and formal economy,respectively, in the year of the election (t=0) or the year before the election (t=-1). Employed Managerial/Professional/HSTechnical/Clerical/Blue Collar are indicators taking value one if the supporter is employed in a public sector occupation in thespecific category, in the year of the election (t=0) or the year before the election (t=-1). Employed Qualified/Unqualified areindicators taking value one if the supporters is employed in a public sector job for which she is qualified/unqualified in termsof education, in the year of the election (t=0) or the year before the election (t=-1). Mincer Sample is an indicator takingvalue one if the supporter was ever employed in the private sector before her first election. Mincer Ability is a continuousmeasure of ability derived using the approach described in section 6.4.1. Secondary School, High School, and University Degreeare indicators taking value one if the supporter’s highest level of education is secondary school, high school, or university,respectively. Age is the supporters’ age at the time of the election. Male is an indicator for the supporter being male. RunPast Election is an indicator taking value one if the candidate run also in the previous election. Incumbent is an indicatortaking value one if the candidate had a seat in the municipal council at the time of the election. Party Already in Power,Governor Party, Fed. Government Party, President Party are indicators taking value one if the candidate’s party is in theruling coalition in power in the municipality at the time of the election, is the same as the state governor’s party, is in thecoalition of parties in the federal government, is the party of the Federal President, respectively. Contributions Received are theamount of contributions received by the candidate. Contributions Spent are the amount of contributions spent by the candidatein the race. P-values are based on standard errors clustered at the election level. *** pă0.01, ** pă0.05, * pă0.1.

PATRONAGE IN THE ALLOCATION OF PUBLIC SECTOR JOBS 55
Table 4. Covariates Balance for Donors
(1) (2) (3) (4) (5) (6) (7)Covariate Coefficient P-value Mean Cont. Group Observations Supporters Elections
Earnings Public t=0 181.207 0.404 3211 180,886 177590 3162Earnings Private t=0 -42.408 0.594 1481 180,886 177590 3162Earnings Total t=0 -2.222 0.993 5344 180,886 177590 3162Employed Private t=0 -0.001 0.857 0.192 180,886 177590 3162Employed Public t=0 0.010 0.342 0.222 180,886 177590 3162Employed Any t=0 0.009 0.359 0.423 180,886 177590 3162Employed Qualified t=0 0.007 0.496 0.183 180,040 176783 3162Employed Unqualified t=0 0.003 0.342 0.035 180,040 176783 3162Employed Managerial t=0 0.006 0.287 0.044 180,463 177178 3162Employed Professional t=0 -0.001 0.866 0.06 180,463 177178 3162Employed HS Technical t=0 0.002 0.458 0.029 180,463 177178 3162Employed Clerical t=0 0.001 0.758 0.056 180,463 177178 3162Employed Blue Collar t=0 0.002 0.473 0.032 180,463 177178 3162Earnings Public t=-1 130.829 0.517 3013 180,886 177590 3162Earnings Private t=-1 -117.652 0.126 1487 180,886 177590 3162Earnings Total t=-1 -151.033 0.539 5116 180,886 177590 3162Employed Private t=-1 -0.002 0.802 0.198 180,886 177590 3162Employed Public t=-1 0.010 0.336 0.220 180,886 177590 3162Employed Any t=-1 0.006 0.496 0.427 180,886 177590 3162Employed Qualified t=-1 0.008 0.372 0.181 180,052 176800 3162Employed Unqualified t=-1 0.001 0.63 0.036 180,052 176800 3162Employed Managerial t=-1 0.006 0.31 0.045 180,497 177210 3162Employed Professional t=-1 0.002 0.647 0.057 180,497 177210 3162Employed HS Technical t=-1 -0.000 0.893 0.029 180,497 177210 3162Employed Clerical t=-1 0.000 0.917 0.055 180,497 177210 3162Employed Blue Collar t=-1 0.002 0.348 0.031 180,497 177210 3162Mincer Sample 0.002 0.745 0.384 180,886 177590 3162Mincer Ability -0.481 0.107 0.320 68,134 67243 2828Party Already in Power 0.039 0.367 0.435 180,886 177590 3162Governor Party 0.005 0.909 0.208 180,886 177590 3162Fed. Government Party 0.039 0.457 0.546 180,886 177590 3162President Party 0.030 0.475 0.119 180,886 177590 3162Amount of Contributions -17.667 0.842 1387 180,886 177590 3162
Notes: The table shows balance tests for donors’ covariates in the pre-election period. The coefficients and p-values in columns2 and 3 are from regressions of the covariate in column 1 on an indicator for treatment status (supporting the winning mayor),controlling for margin of victory and including election (i.e. municipality times election year) fixed effects, focusing on mayoralraces decided by a margin of victory of 5% or less. Column 4 reports the mean of the covariate in the control group, namelyamong supporters of the runner-up mayoral candidate. Amount of Contributions is the donor’s amount contributed to theparty and coalition of the supported mayor. See Table 3 for a description of the other covariates listed in column 1. P-valuesare based on standard errors clustered at the election level. *** pă0.01, ** pă0.05, * pă0.1.
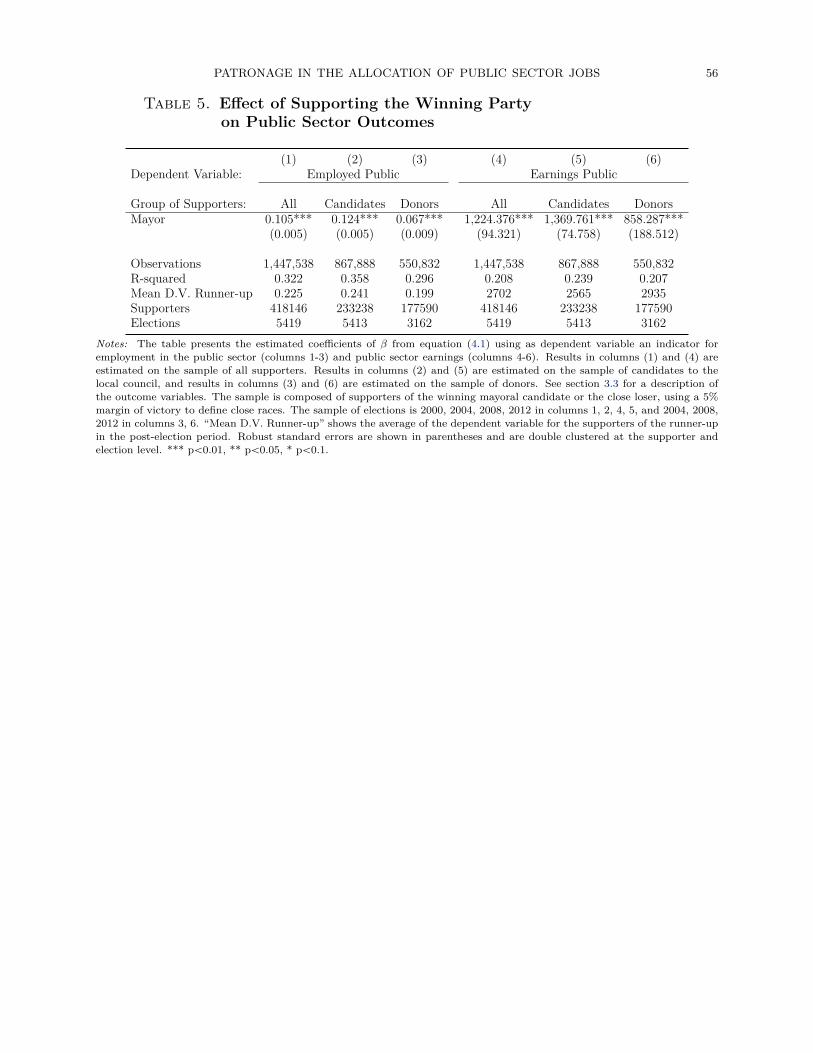
PATRONAGE IN THE ALLOCATION OF PUBLIC SECTOR JOBS 56
Table 5. Effect of Supporting the Winning Partyon Public Sector Outcomes
(1) (2) (3) (4) (5) (6)Dependent Variable: Employed Public Earnings Public
Group of Supporters: All Candidates Donors All Candidates DonorsMayor 0.105*** 0.124*** 0.067*** 1,224.376*** 1,369.761*** 858.287***
(0.005) (0.005) (0.009) (94.321) (74.758) (188.512)
Observations 1,447,538 867,888 550,832 1,447,538 867,888 550,832R-squared 0.322 0.358 0.296 0.208 0.239 0.207Mean D.V. Runner-up 0.225 0.241 0.199 2702 2565 2935Supporters 418146 233238 177590 418146 233238 177590Elections 5419 5413 3162 5419 5413 3162
Notes: The table presents the estimated coefficients of β from equation (4.1) using as dependent variable an indicator foremployment in the public sector (columns 1-3) and public sector earnings (columns 4-6). Results in columns (1) and (4) areestimated on the sample of all supporters. Results in columns (2) and (5) are estimated on the sample of candidates to thelocal council, and results in columns (3) and (6) are estimated on the sample of donors. See section 3.3 for a description ofthe outcome variables. The sample is composed of supporters of the winning mayoral candidate or the close loser, using a 5%margin of victory to define close races. The sample of elections is 2000, 2004, 2008, 2012 in columns 1, 2, 4, 5, and 2004, 2008,2012 in columns 3, 6. “Mean D.V. Runner-up” shows the average of the dependent variable for the supporters of the runner-upin the post-election period. Robust standard errors are shown in parentheses and are double clustered at the supporter andelection level. *** pă0.01, ** pă0.05, * pă0.1.
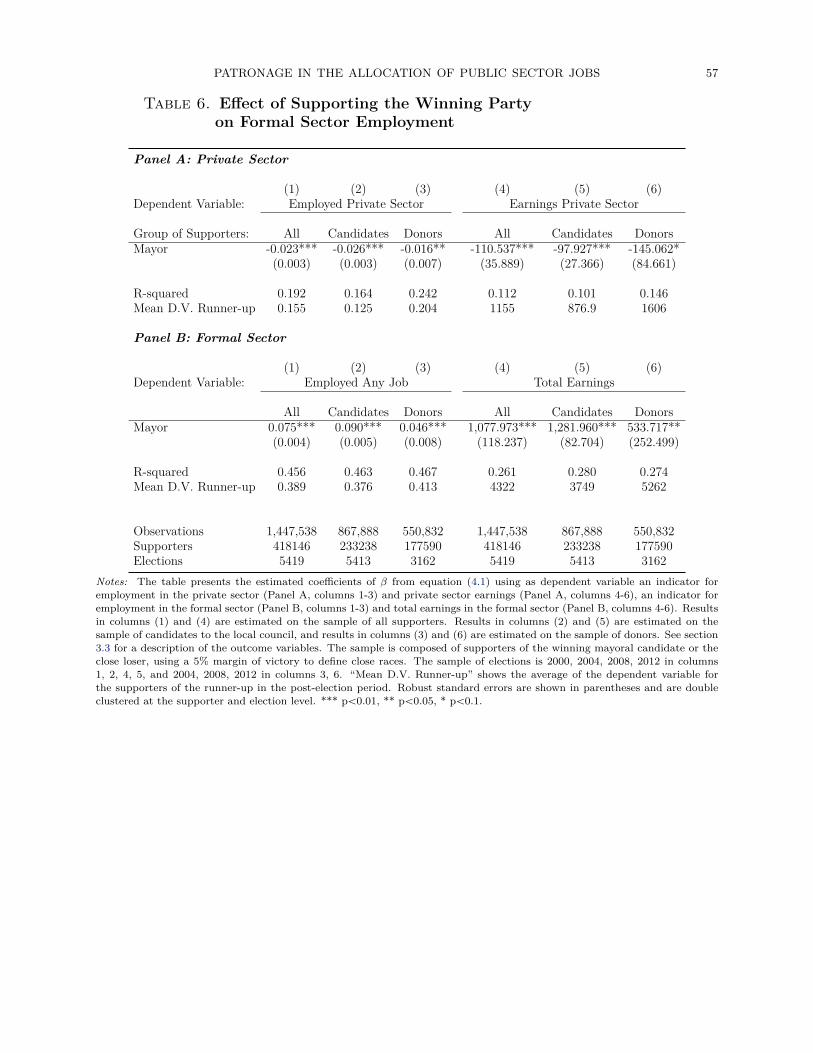
PATRONAGE IN THE ALLOCATION OF PUBLIC SECTOR JOBS 57
Table 6. Effect of Supporting the Winning Partyon Formal Sector Employment
Panel A: Private Sector
(1) (2) (3) (4) (5) (6)Dependent Variable: Employed Private Sector Earnings Private Sector
Group of Supporters: All Candidates Donors All Candidates DonorsMayor -0.023*** -0.026*** -0.016** -110.537*** -97.927*** -145.062*
(0.003) (0.003) (0.007) (35.889) (27.366) (84.661)
R-squared 0.192 0.164 0.242 0.112 0.101 0.146Mean D.V. Runner-up 0.155 0.125 0.204 1155 876.9 1606
Panel B: Formal Sector
(1) (2) (3) (4) (5) (6)Dependent Variable: Employed Any Job Total Earnings
All Candidates Donors All Candidates DonorsMayor 0.075*** 0.090*** 0.046*** 1,077.973*** 1,281.960*** 533.717**
(0.004) (0.005) (0.008) (118.237) (82.704) (252.499)
R-squared 0.456 0.463 0.467 0.261 0.280 0.274Mean D.V. Runner-up 0.389 0.376 0.413 4322 3749 5262
Observations 1,447,538 867,888 550,832 1,447,538 867,888 550,832Supporters 418146 233238 177590 418146 233238 177590Elections 5419 5413 3162 5419 5413 3162
Notes: The table presents the estimated coefficients of β from equation (4.1) using as dependent variable an indicator foremployment in the private sector (Panel A, columns 1-3) and private sector earnings (Panel A, columns 4-6), an indicator foremployment in the formal sector (Panel B, columns 1-3) and total earnings in the formal sector (Panel B, columns 4-6). Resultsin columns (1) and (4) are estimated on the sample of all supporters. Results in columns (2) and (5) are estimated on thesample of candidates to the local council, and results in columns (3) and (6) are estimated on the sample of donors. See section3.3 for a description of the outcome variables. The sample is composed of supporters of the winning mayoral candidate or theclose loser, using a 5% margin of victory to define close races. The sample of elections is 2000, 2004, 2008, 2012 in columns1, 2, 4, 5, and 2004, 2008, 2012 in columns 3, 6. “Mean D.V. Runner-up” shows the average of the dependent variable forthe supporters of the runner-up in the post-election period. Robust standard errors are shown in parentheses and are doubleclustered at the supporter and election level. *** pă0.01, ** pă0.05, * pă0.1.
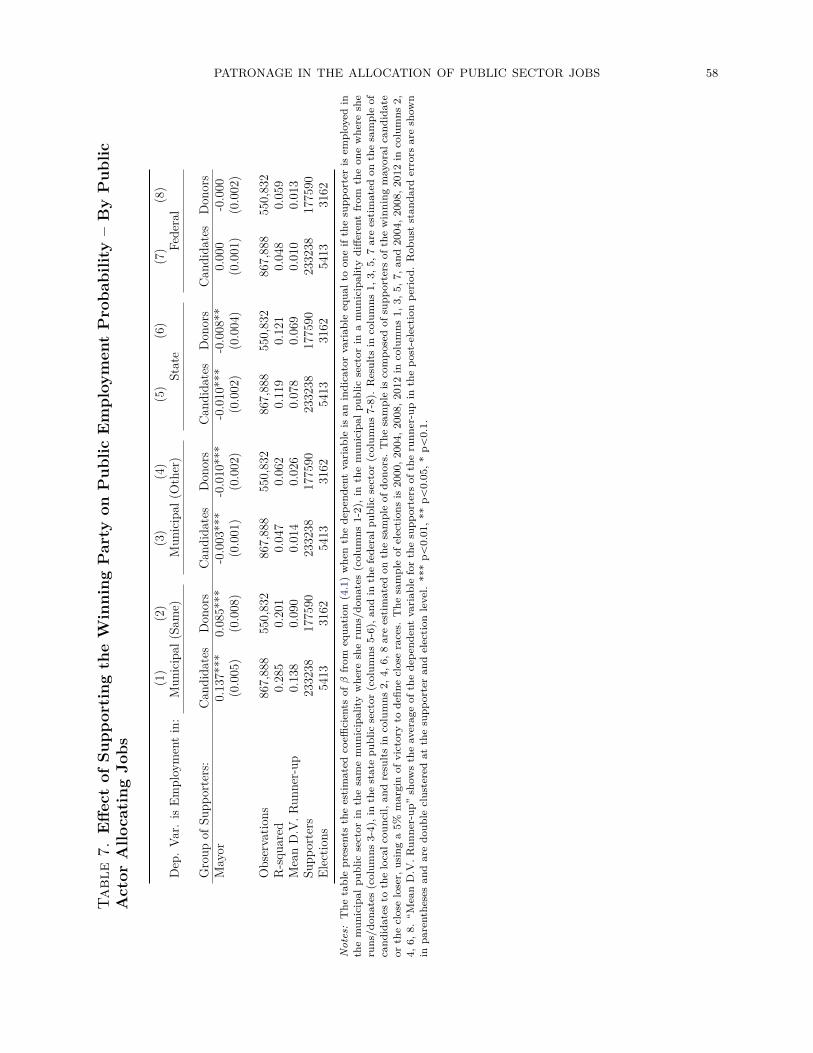
PATRONAGE IN THE ALLOCATION OF PUBLIC SECTOR JOBS 58
Tab
le7.
Effe
ctof
Supp
orti
ngth
eW
inni
ngP
arty
onP
ublic
Em
ploy
men
tP
roba
bilit
y–
By
Pub
licA
ctor
Allo
cati
ngJo
bs
(1)
(2)
(3)
(4)
(5)
(6)
(7)
(8)
Dep
.Va
r.is
Empl
oym
ent
in:
Mun
icip
al(S
ame)
Mun
icip
al(O
ther
)St
ate
Fede
ral
Gro
upof
Supp
orte
rs:
Can
dida
tes
Don
ors
Can
dida
tes
Don
ors
Can
dida
tes
Don
ors
Can
dida
tes
Don
ors
May
or0.
137*
**0.
085*
**-0
.003
***
-0.0
10**
*-0
.010
***
-0.0
08**
0.00
0-0
.000
(0.0
05)
(0.0
08)
(0.0
01)
(0.0
02)
(0.0
02)
(0.0
04)
(0.0
01)
(0.0
02)
Obs
erva
tions
867,
888
550,
832
867,
888
550,
832
867,
888
550,
832
867,
888
550,
832
R-s
quar
ed0.
285
0.20
10.
047
0.06
20.
119
0.12
10.
048
0.05
9M
ean
D.V
.Run
ner-
up0.
138
0.09
00.
014
0.02
60.
078
0.06
90.
010
0.01
3Su
ppor
ters
2332
3817
7590
2332
3817
7590
2332
3817
7590
2332
3817
7590
Elec
tions
5413
3162
5413
3162
5413
3162
5413
3162
Not
es:
The
tabl
epr
esen
tsth
ees
timat
edco
effici
ents
ofβ
from
equa
tion
(4.1
)w
hen
the
depe
nden
tva
riab
leis
anin
dica
tor
vari
able
equa
lto
one
ifth
esu
ppor
ter
isem
ploy
edin
the
mun
icip
alpu
blic
sect
orin
the
sam
em
unic
ipal
ityw
here
she
runs
/don
ates
(col
umns
1-2)
,in
the
mun
icip
alpu
blic
sect
orin
am
unic
ipal
itydi
ffere
ntfr
omth
eon
ew
here
she
runs
/don
ates
(col
umns
3-4)
,in
the
stat
epu
blic
sect
or(c
olum
ns5-
6),a
ndin
the
fede
ralp
ublic
sect
or(c
olum
ns7-
8).
Res
ults
inco
lum
ns1,
3,5,
7ar
ees
timat
edon
the
sam
ple
ofca
ndid
ates
toth
elo
calc
ounc
il,an
dre
sults
inco
lum
ns2,
4,6,
8ar
ees
timat
edon
the
sam
ple
ofdo
nors
.T
hesa
mpl
eis
com
pose
dof
supp
orte
rsof
the
win
ning
may
oral
cand
idat
eor
the
clos
elo
ser,
usin
ga
5%m
argi
nof
vict
ory
tode
fine
clos
era
ces.
The
sam
ple
ofel
ectio
nsis
2000
,200
4,20
08,2
012
inco
lum
ns1,
3,5,
7,an
d20
04,2
008,
2012
inco
lum
ns2,
4,6,
8.“M
ean
D.V
.Run
ner-
up”
show
sth
eav
erag
eof
the
depe
nden
tva
riab
lefo
rth
esu
ppor
ters
ofth
eru
nner
-up
inth
epo
st-e
lect
ion
peri
od.
Rob
ust
stan
dard
erro
rsar
esh
own
inpa
rent
hese
san
dar
edo
uble
clus
tere
dat
the
supp
orte
ran
del
ectio
nle
vel.
***
pă0.
01,*
*pă
0.05
,*pă
0.1.
PATRONAGE IN THE ALLOCATION OF PUBLIC SECTOR JOBS 59
Table 8. Effect of Supporting the Winning Party On Public Em-ployment Probability Across the Public Sector Hierarchy
(1) (2) (3) (4) (5)Dep. Var. is Employment in: Managerial Professional High Skilled Clerical Blue
Job Job Technical Job Job Collar JobPanel A: All SupportersMayor 0.053*** 0.007*** 0.005*** 0.031*** 0.013***
(0.003) (0.002) (0.002) (0.003) (0.002)
Observations 1,186,480 1,186,480 1,186,480 1,186,480 1,186,480R-squared 0.120 0.092 0.068 0.116 0.088Mean D.V. Runner-up 0.0280 0.0600 0.0350 0.0500 0.0490Supporters 361979 361979 361979 361979 361979Elections 4160 4160 4160 4160 4160
Panel B: Candidates
Mayor 0.069*** 0.009*** 0.006*** 0.040*** 0.016***(0.004) (0.003) (0.002) (0.003) (0.003)
Observations 609,018 609,018 609,018 609,018 609,018R-squared 0.157 0.100 0.086 0.142 0.121Mean D.V. Runner-up 0.0270 0.0570 0.0420 0.0540 0.0660Supporters 177659 177659 177659 177659 177659Elections 4153 4153 4153 4153 4153
Panel C: Donors
Mayor 0.031*** 0.003 0.003 0.020*** 0.010***(0.004) (0.004) (0.002) (0.004) (0.002)
Observations 548,694 548,694 548,694 548,694 548,694R-squared 0.114 0.112 0.071 0.114 0.067Mean D.V. Runner-up 0.0300 0.0620 0.0270 0.0470 0.0310Supporters 177011 177011 177011 177011 177011Elections 3159 3159 3159 3159 3159
Notes: The table presents the estimated coefficients of β from equation (4.1) using as dependent variable an indicator foremployment in the occupational category of the public sector indicated in the title of the column. Results in Panel A includesall supporters. Results in Panel B includes only candidates to the local council. Results in Panel C includes only donors. Thesample is composed of supporters of the winning mayoral candidate or the close loser, using a 5% margin of victory to defineclose races. The sample of elections is 2004, 2008, 2012. “Mean D.V. Runner-up” shows the average of the dependent variablefor the supporters of the runner-up in the post-election period. Robust standard errors are shown in parentheses and are doubleclustered at the supporter and election level. *** pă0.01, ** pă0.05, * pă0.1.
PATRONAGE IN THE ALLOCATION OF PUBLIC SECTOR JOBS 60
Table 9. Providing Political Support Decreases the Importance ofEducation as a Hiring Criterion
(1) (2) (3)Dep. Var. is Employment Middle High School Universityin Public Job Requiring: School Degree School Degree Degree
Mayor˚Qualified -0.010*** -0.003 -0.015**(0.002) (0.003) (0.006)
Mayor 0.017*** 0.047*** 0.070***(0.002) (0.004) (0.004)
Qualified 0.011*** 0.081*** 0.352***(0.001) (0.002) (0.005)
Observations 604,366 604,366 604,366R-squared 0.080 0.178 0.299Mean D.V. Unq. Runner-up 0.0270 0.0420 0.0460Supporters 176514 176514 176514Elections 4153 4153 4153
Notes: The table presents the estimated coefficients from equation (6.2) using as dependent variables indicators for employmentin a public sector job that requires a middle school degree (column 1), high school degree (column 2) and university degree(column 3). The sample includes only candidates to the local council, and is restricted to supporters of the winning mayoralcandidate or the close loser, using a 5% margin of victory to define close races. The sample of elections is 2004, 2008, 2012.“Mean D.V. Unq. Runner-up” shows the average of the dependent variable in the post-election period for the supporters of therunner-up who are not qualified for the job. Robust standard errors are shown in parentheses and are double clustered at thesupporter and election level. *** pă0.01, ** pă0.05, * pă0.1.
Table 10. Extent of Public Employees’ Unqualification is LargerAmong Mayor’s Supporters
Dep. Var. is Indicator for Being Unqualified for the Job(1) (2) (3) (4) (5) (6)
Sample: Supporters Any Managerial Professional High Skilled Clerical BlueEmployed in: Job Job Job Technical Job Job Collar JobMayor 0.027*** 0.074*** 0.021*** 0.002 0.039*** 0.002
(0.003) (0.011) (0.005) (0.007) (0.005) (0.006)
Observations 320,233 49,600 66,266 36,140 71,257 56,822R-squared 0.367 0.257 0.227 0.244 0.199 0.203Mean D.V. Runner-Up 0.160 0.442 0.102 0.152 0.100 0.142Supporters 115610 22742 26364 15231 31185 23207Elections 4061 1891 2831 2124 2759 2879
Notes: The table investigates the difference in the share of unqualified workers between public employees who are supporters ofthe mayor and those who are supporters of the runner-up, in the four years after the election in which they are supporters. Weregress an indicator variable equal to one if the supporter is unqualified for the job on an indicator for having been a supporterof the winning mayoral candidate, including election (municipality-year of the election) fixed effects and the margin of victoryof the mayor supported. In column 1 we pool all employees, in column 2 we focus on managerial jobs, in column 3 we focus onprofessionals, in column 4 we focus on high skilled technical jobs, in column 5 we focus on clerical occupations, in column 6 wefocus on blue collar jobs. The sample includes both candidates to the local council and donors, and is restricted to supporters ofthe winning mayoral candidate or the close loser in a close race, using a 5% margin of victory to define close races. The sampleof elections is 2004, 2008, 2012. “Mean D.V. Runner-Up” shows the average of the dependent variable among supporters of therunner-up mayoral candidate. Robust standard errors are shown in parentheses and are double clustered at the supporter andelection level. *** pă0.01, ** pă0.05, * pă0.1.
PATRONAGE IN THE ALLOCATION OF PUBLIC SECTOR JOBS 61
Table 11. Favoritism Stronger for Supporters with Lower PrivateSector Opportunities
Dep. Var. is Employment in Public Sector(1) (2) (3)
Group of Supporters: All Supporters Candidates Donors
Panel A: Continuous Measure of Previous Private EarningsMayor˚Private Earnings -0.003*** -0.005*** -0.002***
(0.000) (0.001) (0.000)Mayor 0.093*** 0.126*** 0.056***
(0.007) (0.010) (0.009)
R-squared 0.270 0.365 0.228Mean D.V. Runner-Up 0.0980 0.111 0.0850
Panel B: Terciles of Previous Private EarningsMayor˚ Tercile 3 -0.038*** -0.059*** -0.013*
(0.006) (0.010) (0.008)Mayor˚ Tercile 2 -0.013** -0.015 -0.010
(0.006) (0.010) (0.008)Mayor 0.112*** 0.154*** 0.065***
(0.008) (0.012) (0.011)
Observations 224,132 104,630 117,202R-squared 0.269 0.364 0.227Mean D.V. Runner-Up 0.103 0.121 0.0880Supporters 71515 31438 39452Elections 4010 3679 2500
Notes: The table presents the estimated coefficients from equation (6.3), estimated in the sample of all supporters (column 1),in the sample of candidates (column 2) and in the sample of donors (column 3). Panel A looks at the heterogeneous treatmenteffect interacting the indicator for supporting the mayor with a continuous measure of previous private sector earnings, whilePanel B looks at the heterogeneous treatment effect interacting the indicator for supporting the mayor with an indicator forbeing in the top tercile of the distribution of previous private sector earnings and with an indicator for being in the secondtercile of the distribution of previous private sector earnings. The dependent variable in all columns is an indicator equal toone if the supporter is employed in the public sector. The sample is restricted to supporters of the winning mayoral candidateor the close loser, using a 5% margin of victory to define close races, and using only the sample of supporters employed inthe private sector in at least one of the two years preceding the election. The sample of elections is 2000, 2004, 2008, 2012 incolumns 1 and 2, and 2004, 2008, 2012 in column 3. “Mean D.V. Runner-up” shows the average of the dependent variable inthe post-election period for the supporters of the runner-up. Robust standard errors are shown in parentheses and are doubleclustered at the supporter and election level. *** pă0.01, ** pă0.05, * pă0.1.
PATRONAGE IN THE ALLOCATION OF PUBLIC SECTOR JOBS 62
Table 12. Favoritism Stronger for Supporters with Lower ResidualAbility
(1) (2) (3)Dep. Var. is Employment in Public Sector
Group of Supporters: All Supporters Candidates DonorsMayor˚Tercile 3 -0.032*** -0.023*** -0.030***
(0.006) (0.087) (0.009)Mayor˚Tercile 2 -0.016*** -0.007 -0.027***
(0.006) (0.008) (0.009)Mayor 0.147*** 0.175*** 0.101***
(0.008) (0.010) (0.013)
Observations 418,012 211,612 204,864R-squared 0.362 0.426 0.334Mean D.V. Tercile 1 Runner-up 0.277 0.291 0.250Supporters 131928 62725 68826Elections 4855 4794 3086
Notes: The table presents the estimated patronage effects from equation (6.5). The dependent variable is an indicator variableequal to one if the supporter is employed in a public sector job. The sample is composed of supporters of the winning mayoralcandidate or the close loser, using a 5% margin of victory to define close races, and using only the sample of supporters witha non-missing value in the Mincer ability variable. The sample in column 1 includes candidates and donors. The sample incolumn 2 includes candidates. The sample in column 3 includes donors. The sample of elections is 2000, 2004, 2008, 2012 incolumns 1, 2, and 2004, 2008, 2012 in column 3. “Mean D.V. Tercile 1 Runner-up” shows the average of the dependent variablein the post-election period for the supporters of the runner-up who are in the bottom tertile of the ability distribution. Robuststandard errors are shown in parentheses and are double clustered at the supporter and election level. *** pă0.01, ** pă0.05,* pă0.1.
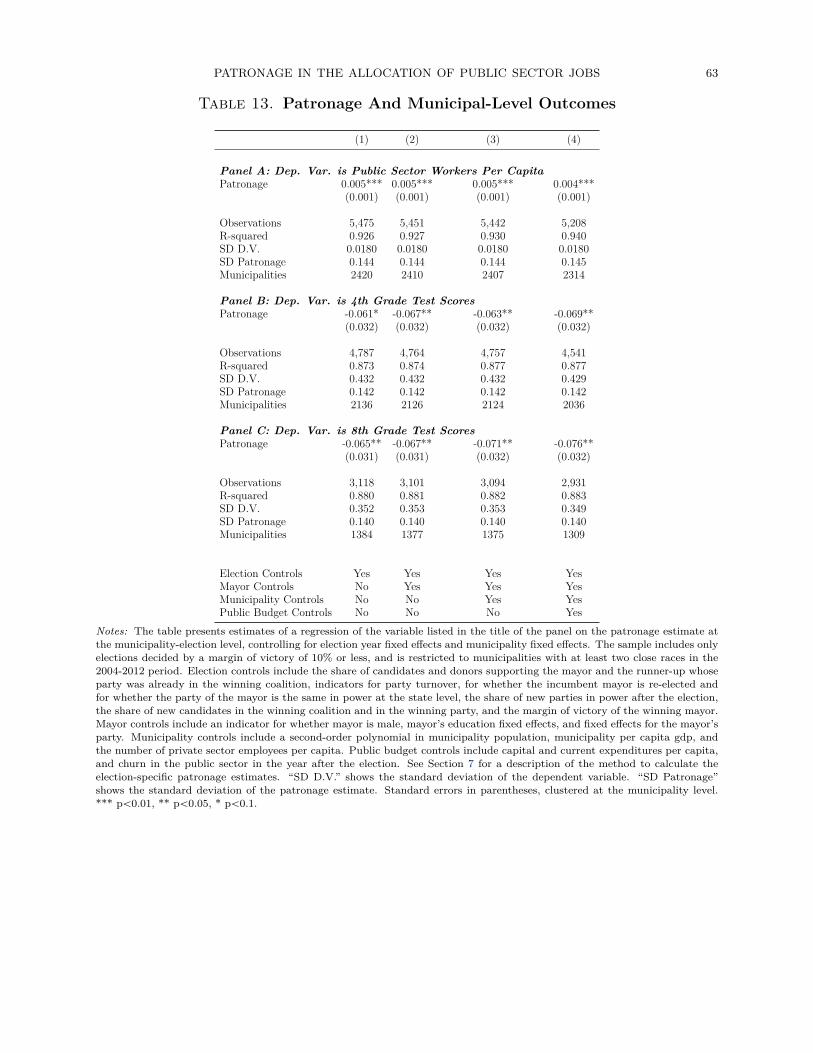
PATRONAGE IN THE ALLOCATION OF PUBLIC SECTOR JOBS 63
Table 13. Patronage And Municipal-Level Outcomes
(1) (2) (3) (4)
Panel A: Dep. Var. is Public Sector Workers Per CapitaPatronage 0.005*** 0.005*** 0.005*** 0.004***
(0.001) (0.001) (0.001) (0.001)
Observations 5,475 5,451 5,442 5,208R-squared 0.926 0.927 0.930 0.940SD D.V. 0.0180 0.0180 0.0180 0.0180SD Patronage 0.144 0.144 0.144 0.145Municipalities 2420 2410 2407 2314
Panel B: Dep. Var. is 4th Grade Test ScoresPatronage -0.061* -0.067** -0.063** -0.069**
(0.032) (0.032) (0.032) (0.032)
Observations 4,787 4,764 4,757 4,541R-squared 0.873 0.874 0.877 0.877SD D.V. 0.432 0.432 0.432 0.429SD Patronage 0.142 0.142 0.142 0.142Municipalities 2136 2126 2124 2036
Panel C: Dep. Var. is 8th Grade Test ScoresPatronage -0.065** -0.067** -0.071** -0.076**
(0.031) (0.031) (0.032) (0.032)
Observations 3,118 3,101 3,094 2,931R-squared 0.880 0.881 0.882 0.883SD D.V. 0.352 0.353 0.353 0.349SD Patronage 0.140 0.140 0.140 0.140Municipalities 1384 1377 1375 1309
Election Controls Yes Yes Yes YesMayor Controls No Yes Yes YesMunicipality Controls No No Yes YesPublic Budget Controls No No No Yes
Notes: The table presents estimates of a regression of the variable listed in the title of the panel on the patronage estimate atthe municipality-election level, controlling for election year fixed effects and municipality fixed effects. The sample includes onlyelections decided by a margin of victory of 10% or less, and is restricted to municipalities with at least two close races in the2004-2012 period. Election controls include the share of candidates and donors supporting the mayor and the runner-up whoseparty was already in the winning coalition, indicators for party turnover, for whether the incumbent mayor is re-elected andfor whether the party of the mayor is the same in power at the state level, the share of new parties in power after the election,the share of new candidates in the winning coalition and in the winning party, and the margin of victory of the winning mayor.Mayor controls include an indicator for whether mayor is male, mayor’s education fixed effects, and fixed effects for the mayor’sparty. Municipality controls include a second-order polynomial in municipality population, municipality per capita gdp, andthe number of private sector employees per capita. Public budget controls include capital and current expenditures per capita,and churn in the public sector in the year after the election. See Section 7 for a description of the method to calculate theelection-specific patronage estimates. “SD D.V.” shows the standard deviation of the dependent variable. “SD Patronage”shows the standard deviation of the patronage estimate. Standard errors in parentheses, clustered at the municipality level.*** pă0.01, ** pă0.05, * pă0.1.
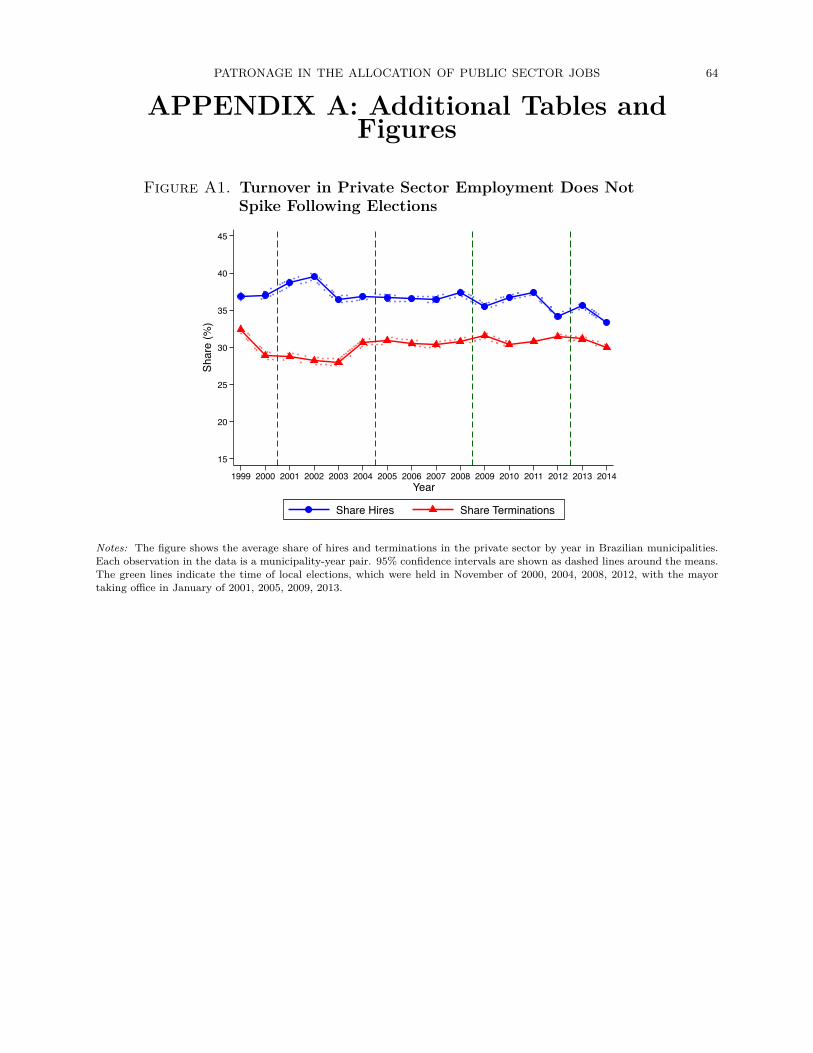
PATRONAGE IN THE ALLOCATION OF PUBLIC SECTOR JOBS 64
APPENDIX A: Additional Tables andFigures
Figure A1. Turnover in Private Sector Employment Does NotSpike Following Elections
15
20
25
30
35
40
45
Shar
e (%
)
1999 2000 2001 2002 2003 2004 2005 2006 2007 2008 2009 2010 2011 2012 2013 2014Year
Share Hires Share Terminations
Notes: The figure shows the average share of hires and terminations in the private sector by year in Brazilian municipalities.Each observation in the data is a municipality-year pair. 95% confidence intervals are shown as dashed lines around the means.The green lines indicate the time of local elections, which were held in November of 2000, 2004, 2008, 2012, with the mayortaking office in January of 2001, 2005, 2009, 2013.
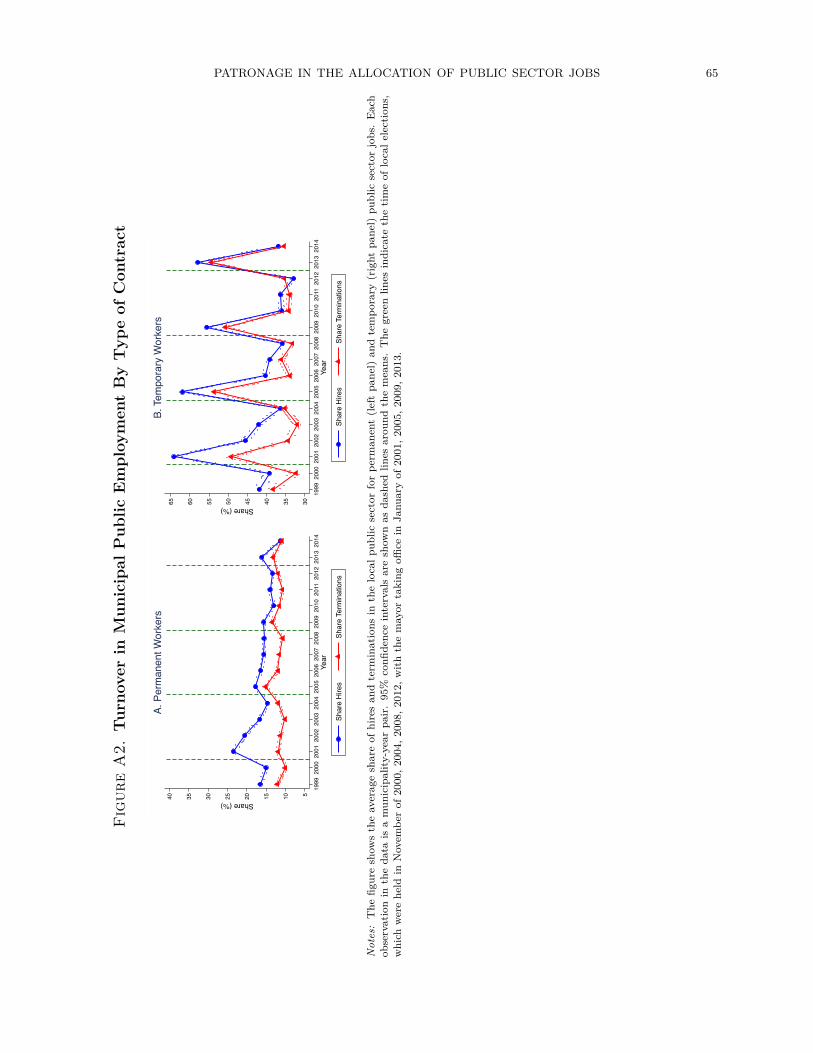
PATRONAGE IN THE ALLOCATION OF PUBLIC SECTOR JOBS 65
Fig
ure
A2.
Tur
nove
rin
Mun
icip
alP
ublic
Em
ploy
men
tB
yT
ype
ofC
ontr
act
510152025303540 Share (%)
1999
2000
2001
2002
2003
2004
2005
2006
2007
2008
2009
2010
2011
2012
2013
2014
Year
Shar
e H
ires
Shar
e Te
rmin
atio
ns
A. P
erm
anen
t Wor
kers
3035404550556065 Share (%)
1999
2000
2001
2002
2003
2004
2005
2006
2007
2008
2009
2010
2011
2012
2013
2014
Year
Shar
e H
ires
Shar
e Te
rmin
atio
ns
B. T
empo
rary
Wor
kers
Not
es:
The
figur
esh
ows
the
aver
age
shar
eof
hire
san
dte
rmin
atio
nsin
the
loca
lpub
licse
ctor
for
perm
anen
t(le
ftpa
nel)
and
tem
pora
ry(r
ight
pane
l)pu
blic
sect
orjo
bs.
Eac
hob
serv
atio
nin
the
data
isa
mun
icip
ality
-yea
rpa
ir.
95%
confi
denc
ein
terv
als
are
show
nas
dash
edlin
esar
ound
the
mea
ns.
The
gree
nlin
esin
dica
teth
etim
eof
loca
lele
ctio
ns,
whi
chw
ere
held
inN
ovem
ber
of20
00,2
004,
2008
,201
2,w
ithth
em
ayor
taki
ngoffi
cein
Janu
ary
of20
01,2
005,
2009
,201
3.
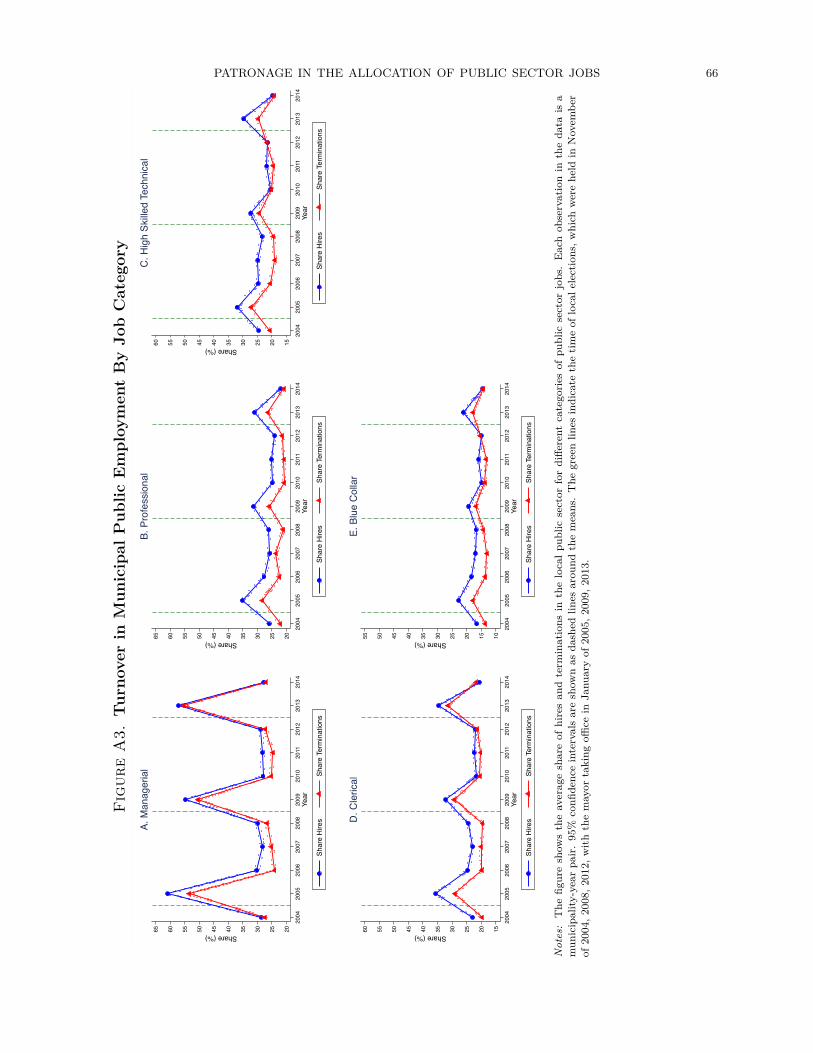
PATRONAGE IN THE ALLOCATION OF PUBLIC SECTOR JOBS 66
Fig
ure
A3.
Tur
nove
rin
Mun
icip
alP
ublic
Em
ploy
men
tB
yJo
bC
ateg
ory
20253035404550556065 Share (%)
2004
2005
2006
2007
2008
2009
2010
2011
2012
2013
2014
Year
Shar
e H
ires
Shar
e Te
rmin
atio
ns
A. M
anag
eria
l
20253035404550556065 Share (%)
2004
2005
2006
2007
2008
2009
2010
2011
2012
2013
2014
Year
Shar
e H
ires
Shar
e Te
rmin
atio
ns
B. P
rofe
ssio
nal
15202530354045505560 Share (%)
2004
2005
2006
2007
2008
2009
2010
2011
2012
2013
2014
Year
Shar
e H
ires
Shar
e Te
rmin
atio
ns
C. H
igh
Skille
d Te
chni
cal
15202530354045505560 Share (%)
2004
2005
2006
2007
2008
2009
2010
2011
2012
2013
2014
Year
Shar
e H
ires
Shar
e Te
rmin
atio
ns
D. C
leric
al
10152025303540455055 Share (%)
2004
2005
2006
2007
2008
2009
2010
2011
2012
2013
2014
Year
Shar
e H
ires
Shar
e Te
rmin
atio
ns
E. B
lue
Col
lar
Not
es:
The
figur
esh
ows
the
aver
age
shar
eof
hire
san
dte
rmin
atio
nsin
the
loca
lpub
licse
ctor
for
diffe
rent
cate
gori
esof
publ
icse
ctor
jobs
.E
ach
obse
rvat
ion
inth
eda
tais
am
unic
ipal
ity-y
ear
pair
.95
%co
nfide
nce
inte
rval
sar
esh
own
asda
shed
lines
arou
ndth
em
eans
.T
hegr
een
lines
indi
cate
the
time
oflo
cale
lect
ions
,whi
chw
ere
held
inN
ovem
ber
of20
04,2
008,
2012
,with
the
may
orta
king
office
inJa
nuar
yof
2005
,200
9,20
13.
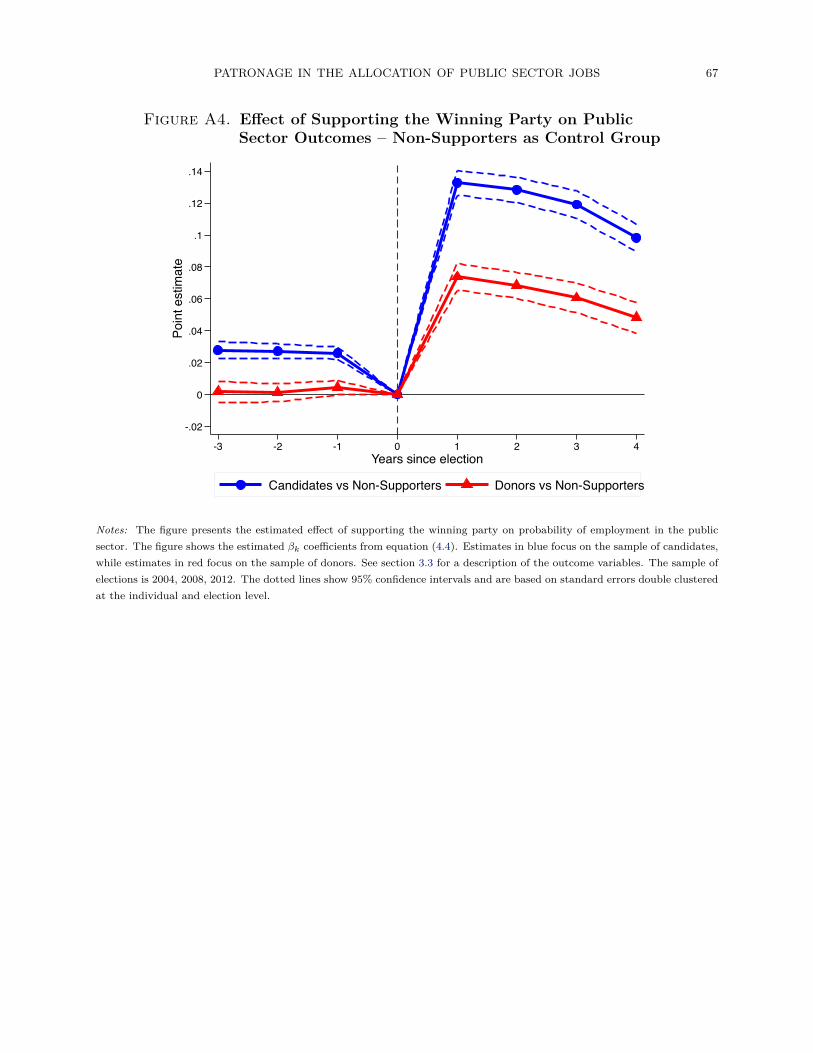
PATRONAGE IN THE ALLOCATION OF PUBLIC SECTOR JOBS 67
Figure A4. Effect of Supporting the Winning Party on PublicSector Outcomes – Non-Supporters as Control Group
-.02
0
.02
.04
.06
.08
.1
.12
.14Po
int e
stim
ate
-3 -2 -1 0 1 2 3 4Years since election
Candidates vs Non-Supporters Donors vs Non-Supporters
Notes: The figure presents the estimated effect of supporting the winning party on probability of employment in the publicsector. The figure shows the estimated βk coefficients from equation (4.4). Estimates in blue focus on the sample of candidates,while estimates in red focus on the sample of donors. See section 3.3 for a description of the outcome variables. The sample ofelections is 2004, 2008, 2012. The dotted lines show 95% confidence intervals and are based on standard errors double clusteredat the individual and election level.
PATRONAGE IN THE ALLOCATION OF PUBLIC SECTOR JOBS 68
Figure A5. Mayor’s Supporters and Employed Supportersas a Share of the Municipality Population
0.2
.4.6
.8Sh
are
of M
unic
ipal
ity P
opul
atio
n (in
%)
2000 4000 6000 8000 10000 12000 14000 16000 18000 20000Population
Mayor's Supporters / Population Employed Supporters / Population
Notes: The figure shows the distribution of the number of the mayor’s supporters (local candidates and donors) as a share ofthe population in the municipality (in blue), and the number of these supporters who are employed as a share of the populationin the municipality (in red), for municipalities with a population between 3,000 and 20,000 inhabitants.
PATRONAGE IN THE ALLOCATION OF PUBLIC SECTOR JOBS 69
Figure A6. Distribution of Ability Scores in the Populationand Among Supporters
0.1
.2.3
.4D
ensi
ty
-4 -2 0 2 4Mincer Ability
CandidatesDonorsPopulation
Notes: The figure shows comparisons of the distribution of the ability scores in the Brazilian population (in blue) and amongsupporters (candidates in red, and donors in green). See section 6.4.1 for a description of the procedure to calculate the abilityscores.

PATRONAGE IN THE ALLOCATION OF PUBLIC SECTOR JOBS 70
Figure A7. Distribution of Ability Scores Among Candidates Sup-porting the Mayor or a Different Mayoral Candidate
0.1
.2.3
.4De
nsity
-4 -2 0 2 4Mincer Ability
MayorOther
Notes: The figure shows comparisons of the distribution of the ability scores among candidates supporting the mayor (in red)or a different mayoral candidate (in green). See section 6.4.1 for a description of the procedure to calculate the ability scores.
Figure A8. Distribution of Ability Scores Among DonorsSupporting the Mayor or a Different Mayoral Candidate
0.1
.2.3
.4De
nsity
-4 -2 0 2 4Mincer Ability
MayorOther
Notes: The figure shows comparisons of the distribution of the ability scores among donors supporting the mayor (in red) or adifferent mayoral candidate (in green). See section 6.4.1 for a description of the procedure to calculate the ability scores.

PATRONAGE IN THE ALLOCATION OF PUBLIC SECTOR JOBS 71
Table A1. Summary Statistics – Universe of Candidates to the LocalCouncil
(1) (2) (3) (4) (5) (6)Variable Mean Std. Dev. Min Max Observations
Times Candidate 1.39 0.74 1 4 1,031,083Times Elected 0.21 0.60 0 4 1,031,083Ever Elected 0.07 0.25 0 1 1,031,083Number of Parties 1.72 0.69 1 4 274,792Amount Spent in Race 2,685 15,621 0 3,445,467 1,079,728Age 43.48 10.85 18 100 1,435,675Male 0.76 0.43 0 1 1,436,252Less than Middle School 0.28 0.45 0 1 1,436,387Middle School 0.22 0.41 0 1 1,436,387High School 0.35 0.48 0 1 1,436,387College 0.16 0.36 0 1 1,436,387
Notes: The table presents summary statistics on the electoral careers and demographic characteristics of the universe ofcandidates to a Brazilian municipal council in the 4 elections held over the 2000-2012 period. Times Candidate is the number ofelections in which an individual runs, Times Elected is the number of elections in which an individual is elected to the council,Ever Elected is an indicator equal to one if the individual was ever elected to the council, Number of Parties is the number ofdifferent parties to which the candidate was affiliated (with summary statistics calculated only on the subsample of individualsrunning in multiple elections), Amount Spent in Race is the amount of money (in Brazilian Reals) spent by a candidate in therace (sample restricted to the 2004-2012 period), Age is the age of the individual at the time of the election, Male is an indicatorfor the candidate being male, Less than Middle School, Middle School, High School and College are indicator variables for asupporter’s highest level of education. The unit of observation is an individual-election, except in the first four rows, where itis an individual.
Table A2. Summary Statistics – Universe of Donors to Local Elections
(1) (2) (3) (4) (5) (6)Variable Mean Std. Dev. Min Max Observations
Number Elections 1.07 0.27 1 3 1,057,216Number of Parties 1.08 0.41 1 21 1,057,216Amount Donated 727,22 5794.79 0 5,609,230 1,144,211Donated to Winning Coalition 0.48 0.50 0 1 1,144,211
Notes: The table presents summary statistics on the universe of donors to Brazilian municipal elections in the 3 electionsheld over the 2004-2012 period. Number Elections is the number of elections in which an individual donated, Number ofParties is the number of different parties to which the individual donated, Amount Donated is the amount of money (in 2000Brazilian Reals) spent by a candidate in the race, Donated to Winning Coalition is an indicator equal to one if the donationwas directed to a party or a candidate in the coalition of the mayoral candidate who will be elected. The unit of observationis an individual-election for variables Amount Donated and Donated to Winning Coalition, and it is an individual for variablesNumber Elections and Number of Parties.

PATRONAGE IN THE ALLOCATION OF PUBLIC SECTOR JOBS 72
Table A3. Public Sector Wage Premium
(1) (2) (3) (4) (5)Type of All Managerial Professional High Skilled Clerical Blue CollarJob: Jobs Jobs Jobs Technical Jobs Jobs JobsPanel A: Dep. Var. is Log Wage:
Public 0.072*** 0.074*** 0.328*** 0.136*** 0.066*** 0.037***(0.000) (0.000) (0.000) (0.000) (0.000) (0.000)
R-squared 0.453 0.304 0.463 0.388 0.335 0.359
Panel B: Dep. Var. is Log Hourly Wage:
Public 0.160*** 0.222*** 0.286*** 0.192*** 0.183*** 0.136***(0.000) (0.000) (0.000) (0.000) (0.000) (0.000)
R-squared 0.478 0.297 0.388 0.355 0.345 0.353
Observations 529,460,038 23,076,149 42,819,113 50,854,596 101,602,667 311,107,509Notes: The table presents the public sector wage premium across five occupational categories. The dependent variable is thelog of wage in Panel A and the log of hourly wage in Panel B, and the variables are winsorized at the 1% level. All regressionsinclude controls for the worker’s job tenure, the worker’s age, municipality fixed effects, year fixed effects, and 43 occupationalgroups fixed effects. The sample includes all worker-job pairs in the Brazilian public and private sector over the 2003-2014period. Standard errors are shown in parentheses. *** pă0.01, ** pă0.05, * pă0.1.

PATRONAGE IN THE ALLOCATION OF PUBLIC SECTOR JOBS 73
Table A4. Covariates Balance for CandidatesGaining a Connection
(1) (2) (3) (4) (5) (6) (7)Covariate Coefficient P-value Mean Cont. Group Observations Supporters Elections
Earnings Public t=0 -37.982 0.685 2521 126,391 121064 4147Earnings Private t=0 -56.279 0.218 875.1 126,391 121064 4147Earnings Total t=0 -127.463 0.289 3687 126,391 121064 4147Employed Private t=0 -0.009* 0.067 0.129 126,391 121064 4147Employed Public t=0 0.010 0.146 0.252 126,391 121064 4147Employed Any t=0 -0.000 0.954 0.392 126,391 121064 4147Employed Qualified t=0 0.007 0.253 0.198 124,958 119826 4147Employed Unqualified t=0 0.003 0.275 0.0450 124,958 119826 4147Employed Managerial t=0 0.002 0.454 0.0270 125,127 119979 4147Employed Professional t=0 0.002 0.497 0.0550 125,127 119979 4147Employed HS Technical t=0 0.000 0.902 0.0420 125,127 119979 4147Employed Clerical t=0 0.001 0.725 0.0560 125,127 119979 4147Employed Blue Collar t=0 0.005 0.153 0.0650 125,127 119979 4147Earnings Public t=-1 -19.453 0.832 2572 126,391 121064 4147Earnings Private t=-1 -53.125 0.239 885.3 126,391 121064 4147Earnings Total t=-1 -104.022 0.391 3760 126,391 121064 4147Employed Private t=-1 -0.005 0.31 0.135 126,391 121064 4147Employed Public t=-1 0.010 0.159 0.264 126,391 121064 4147Employed Any t=-1 0.004 0.553 0.410 126,391 121064 4147Employed Qualified t=-1 0.006 0.327 0.204 124,579 119471 4147Employed Unqualified t=-1 0.004 0.173 0.0490 124,579 119471 4147Employed Managerial t=-1 0.003 0.212 0.0320 124,777 119647 4147Employed Professional t=-1 0.001 0.674 0.0530 124,777 119647 4147Employed HS Technical t=-1 -0.000 0.887 0.0440 124,777 119647 4147Employed Clerical t=-1 0.001 0.687 0.0620 124,777 119647 4147Employed Blue Collar t=-1 0.004 0.189 0.0640 124,777 119647 4147Mincer Sample -0.001 0.895 0.298 126,391 121064 4147Mincer Ability -0.125 0.202 -0.691 37,800 36585 4030Secondary School -0.008 0.179 0.212 125,851 120561 4146High School 0.003 0.637 0.360 125,851 120561 4146University Degree 0.004 0.52 0.149 125,851 120561 4146Age 0.053 0.739 43.32 126,290 120968 4146Male 0.002 0.574 0.751 126,390 121063 4147Run Past Election 0.006 0.374 0.328 126,391 121064 4147Incumbent 0.001 0.905 0.113 126,391 121064 4147Contributions Received -47.229 0.749 1832 126,391 121064 4147Contributions Spent -47.344 0.75 1825 126,391 121064 4147
Notes: The table shows balance tests for candidates’ covariates in the pre-election period, for the sample of candidates whoseparty was not already in power in the municipality. The coefficients and p-values in columns 2 and 3 are from regressions of thecovariate in column 1 on an indicator for treatment status (supporting the winning mayor), controlling for margin of victoryand including election (i.e. municipality times election year) times party fixed effects, focusing on mayoral races decided by amargin of victory of 5% or less. Column 4 reports the mean of the covariate in the control group, namely among supportersof the runner-up mayoral candidate. See Table 3 for a description of the covariates listed in column 1. P-values are based onstandard errors clustered at the election level. *** pă0.01, ** pă0.05, * pă0.1.

PATRONAGE IN THE ALLOCATION OF PUBLIC SECTOR JOBS 74
Table A5. Covariates Balance for CandidatesLosing a Connection
(1) (2) (3) (4) (5) (6) (7)Covariate Coefficient P-value Mean Cont. Group Observations Supporters Elections
Earnings Public t=0 61.865 0.731 3580 67,898 65997 3895Earnings Private t=0 -37.226 0.549 814.1 67,898 65997 3895Earnings Total t=0 76.045 0.729 4716 67,898 65997 3895Employed Private t=0 -0.000 0.995 0.108 67,898 65997 3895Employed Public t=0 0.004 0.657 0.339 67,898 65997 3895Employed Any t=0 0.008 0.443 0.454 67,898 65997 3895Employed Qualified t=0 0.007 0.423 0.250 66,884 65068 3892Employed Unqualified t=0 -0.002 0.713 0.0780 66,884 65068 3892Employed Managerial t=0 -0.001 0.911 0.0610 67,142 65312 3892Employed Professional t=0 -0.007 0.119 0.0620 67,142 65312 3892Employed HS Technical t=0 0.004 0.263 0.0470 67,142 65312 3892Employed Clerical t=0 0.008 0.165 0.0740 67,142 65312 3892Employed Blue Collar t=0 0.000 0.938 0.0870 67,142 65312 3892Earnings Public t=-1 62.381 0.72 3572 67,898 65997 3895Earnings Private t=-1 -27.480 0.653 809.5 67,898 65997 3895Earnings Total t=-1 66.368 0.747 4691 67,898 65997 3895Employed Private t=-1 0.001 0.827 0.116 67,898 65997 3895Employed Public t=-1 0.007 0.516 0.351 67,898 65997 3895Employed Any t=-1 0.009 0.39 0.473 67,898 65997 3895Employed Qualified t=-1 0.008 0.383 0.256 66,649 64842 3894Employed Unqualified t=-1 -0.001 0.85 0.0830 66,649 64842 3894Employed Managerial t=-1 -0.002 0.798 0.0690 66,970 65141 3894Employed Professional t=-1 -0.005 0.304 0.0600 66,970 65141 3894Employed HS Technical t=-1 0.004 0.288 0.0490 66,970 65141 3894Employed Clerical t=-1 0.009 0.157 0.0800 66,970 65141 3894Employed Blue Collar t=-1 -0.000 0.94 0.0850 66,970 65141 3894Mincer Sample -0.000 0.986 0.295 67,898 65997 3895Mincer Ability 0.057 0.734 -0.632 19,883 19493 3423Secondary School -0.018** 0.028 0.210 67,659 65772 3895High School 0.014 0.152 0.365 67,659 65772 3895University Degree 0.008 0.341 0.161 67,659 65772 3895Age 0.058 0.774 43.96 67,858 65958 3893Male -0.000 0.966 0.736 67,896 65995 3895Run Past Election 0.001 0.937 0.392 67,898 65997 3895Incumbent -0.001 0.833 0.161 67,898 65997 3895Contributions Received -112.035 0.698 2578 67,898 65997 3895Contributions Spent -98.041 0.735 2565 67,898 65997 3895
Notes: The table shows balance tests for candidates’ covariates in the pre-election period, for the sample of candidates whoseparty was already in power in the municipality. The coefficients and p-values in columns 2 and 3 are from regressions of thecovariate in column 1 on an indicator for treatment status (supporting the losing mayoral candidate), controlling for marginof victory and including election (i.e. municipality times election year) times party fixed effects, focusing on mayoral racesdecided by a margin of victory of 5% or less. Column 4 reports the mean of the covariate in the control group, namely amongsupporters of the runner-up mayoral candidate. See Table 3 for a description of the covariates listed in column 1. P-values arebased on standard errors clustered at the election level. *** pă0.01, ** pă0.05, * pă0.1.
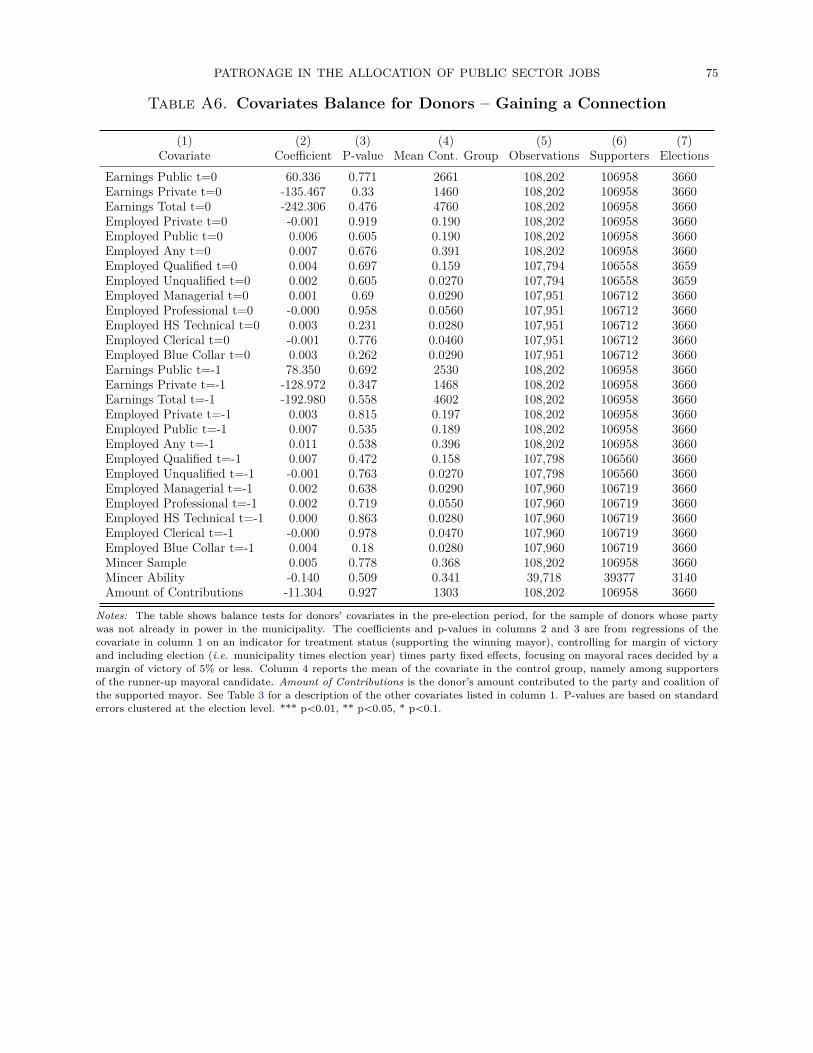
PATRONAGE IN THE ALLOCATION OF PUBLIC SECTOR JOBS 75
Table A6. Covariates Balance for Donors – Gaining a Connection
(1) (2) (3) (4) (5) (6) (7)Covariate Coefficient P-value Mean Cont. Group Observations Supporters Elections
Earnings Public t=0 60.336 0.771 2661 108,202 106958 3660Earnings Private t=0 -135.467 0.33 1460 108,202 106958 3660Earnings Total t=0 -242.306 0.476 4760 108,202 106958 3660Employed Private t=0 -0.001 0.919 0.190 108,202 106958 3660Employed Public t=0 0.006 0.605 0.190 108,202 106958 3660Employed Any t=0 0.007 0.676 0.391 108,202 106958 3660Employed Qualified t=0 0.004 0.697 0.159 107,794 106558 3659Employed Unqualified t=0 0.002 0.605 0.0270 107,794 106558 3659Employed Managerial t=0 0.001 0.69 0.0290 107,951 106712 3660Employed Professional t=0 -0.000 0.958 0.0560 107,951 106712 3660Employed HS Technical t=0 0.003 0.231 0.0280 107,951 106712 3660Employed Clerical t=0 -0.001 0.776 0.0460 107,951 106712 3660Employed Blue Collar t=0 0.003 0.262 0.0290 107,951 106712 3660Earnings Public t=-1 78.350 0.692 2530 108,202 106958 3660Earnings Private t=-1 -128.972 0.347 1468 108,202 106958 3660Earnings Total t=-1 -192.980 0.558 4602 108,202 106958 3660Employed Private t=-1 0.003 0.815 0.197 108,202 106958 3660Employed Public t=-1 0.007 0.535 0.189 108,202 106958 3660Employed Any t=-1 0.011 0.538 0.396 108,202 106958 3660Employed Qualified t=-1 0.007 0.472 0.158 107,798 106560 3660Employed Unqualified t=-1 -0.001 0.763 0.0270 107,798 106560 3660Employed Managerial t=-1 0.002 0.638 0.0290 107,960 106719 3660Employed Professional t=-1 0.002 0.719 0.0550 107,960 106719 3660Employed HS Technical t=-1 0.000 0.863 0.0280 107,960 106719 3660Employed Clerical t=-1 -0.000 0.978 0.0470 107,960 106719 3660Employed Blue Collar t=-1 0.004 0.18 0.0280 107,960 106719 3660Mincer Sample 0.005 0.778 0.368 108,202 106958 3660Mincer Ability -0.140 0.509 0.341 39,718 39377 3140Amount of Contributions -11.304 0.927 1303 108,202 106958 3660
Notes: The table shows balance tests for donors’ covariates in the pre-election period, for the sample of donors whose partywas not already in power in the municipality. The coefficients and p-values in columns 2 and 3 are from regressions of thecovariate in column 1 on an indicator for treatment status (supporting the winning mayor), controlling for margin of victoryand including election (i.e. municipality times election year) times party fixed effects, focusing on mayoral races decided by amargin of victory of 5% or less. Column 4 reports the mean of the covariate in the control group, namely among supportersof the runner-up mayoral candidate. Amount of Contributions is the donor’s amount contributed to the party and coalition ofthe supported mayor. See Table 3 for a description of the other covariates listed in column 1. P-values are based on standarderrors clustered at the election level. *** pă0.01, ** pă0.05, * pă0.1.
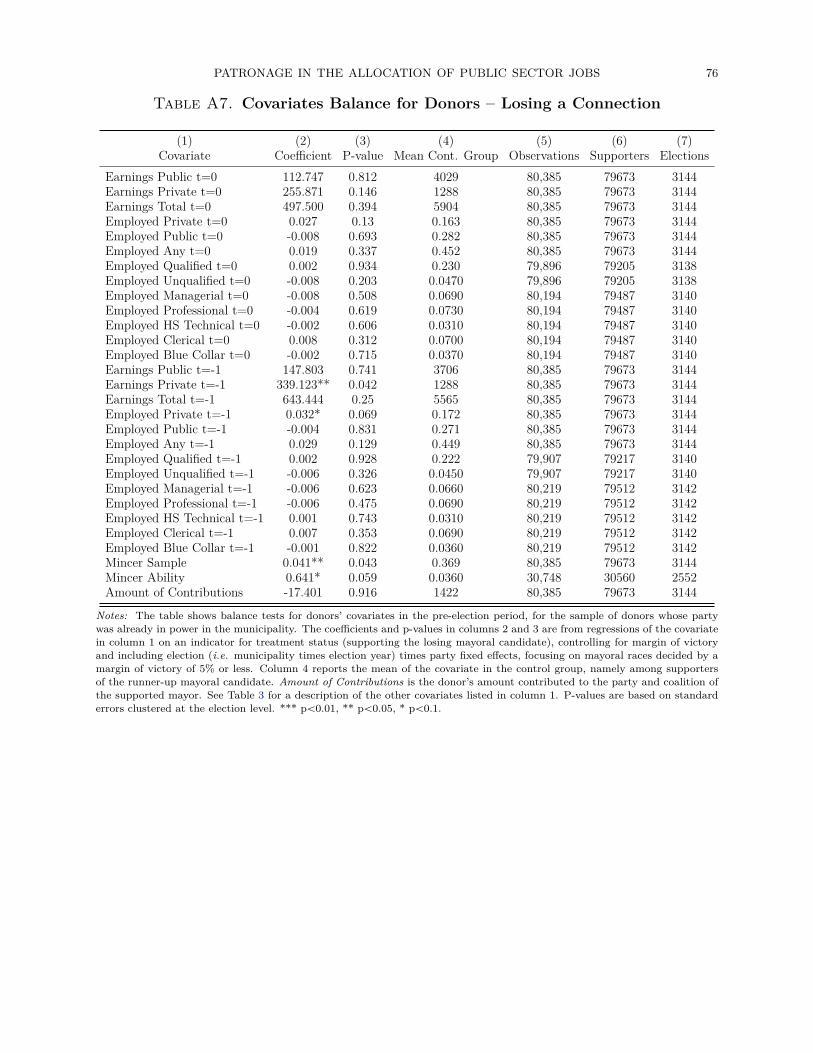
PATRONAGE IN THE ALLOCATION OF PUBLIC SECTOR JOBS 76
Table A7. Covariates Balance for Donors – Losing a Connection
(1) (2) (3) (4) (5) (6) (7)Covariate Coefficient P-value Mean Cont. Group Observations Supporters Elections
Earnings Public t=0 112.747 0.812 4029 80,385 79673 3144Earnings Private t=0 255.871 0.146 1288 80,385 79673 3144Earnings Total t=0 497.500 0.394 5904 80,385 79673 3144Employed Private t=0 0.027 0.13 0.163 80,385 79673 3144Employed Public t=0 -0.008 0.693 0.282 80,385 79673 3144Employed Any t=0 0.019 0.337 0.452 80,385 79673 3144Employed Qualified t=0 0.002 0.934 0.230 79,896 79205 3138Employed Unqualified t=0 -0.008 0.203 0.0470 79,896 79205 3138Employed Managerial t=0 -0.008 0.508 0.0690 80,194 79487 3140Employed Professional t=0 -0.004 0.619 0.0730 80,194 79487 3140Employed HS Technical t=0 -0.002 0.606 0.0310 80,194 79487 3140Employed Clerical t=0 0.008 0.312 0.0700 80,194 79487 3140Employed Blue Collar t=0 -0.002 0.715 0.0370 80,194 79487 3140Earnings Public t=-1 147.803 0.741 3706 80,385 79673 3144Earnings Private t=-1 339.123** 0.042 1288 80,385 79673 3144Earnings Total t=-1 643.444 0.25 5565 80,385 79673 3144Employed Private t=-1 0.032* 0.069 0.172 80,385 79673 3144Employed Public t=-1 -0.004 0.831 0.271 80,385 79673 3144Employed Any t=-1 0.029 0.129 0.449 80,385 79673 3144Employed Qualified t=-1 0.002 0.928 0.222 79,907 79217 3140Employed Unqualified t=-1 -0.006 0.326 0.0450 79,907 79217 3140Employed Managerial t=-1 -0.006 0.623 0.0660 80,219 79512 3142Employed Professional t=-1 -0.006 0.475 0.0690 80,219 79512 3142Employed HS Technical t=-1 0.001 0.743 0.0310 80,219 79512 3142Employed Clerical t=-1 0.007 0.353 0.0690 80,219 79512 3142Employed Blue Collar t=-1 -0.001 0.822 0.0360 80,219 79512 3142Mincer Sample 0.041** 0.043 0.369 80,385 79673 3144Mincer Ability 0.641* 0.059 0.0360 30,748 30560 2552Amount of Contributions -17.401 0.916 1422 80,385 79673 3144
Notes: The table shows balance tests for donors’ covariates in the pre-election period, for the sample of donors whose partywas already in power in the municipality. The coefficients and p-values in columns 2 and 3 are from regressions of the covariatein column 1 on an indicator for treatment status (supporting the losing mayoral candidate), controlling for margin of victoryand including election (i.e. municipality times election year) times party fixed effects, focusing on mayoral races decided by amargin of victory of 5% or less. Column 4 reports the mean of the covariate in the control group, namely among supportersof the runner-up mayoral candidate. Amount of Contributions is the donor’s amount contributed to the party and coalition ofthe supported mayor. See Table 3 for a description of the other covariates listed in column 1. P-values are based on standarderrors clustered at the election level. *** pă0.01, ** pă0.05, * pă0.1.
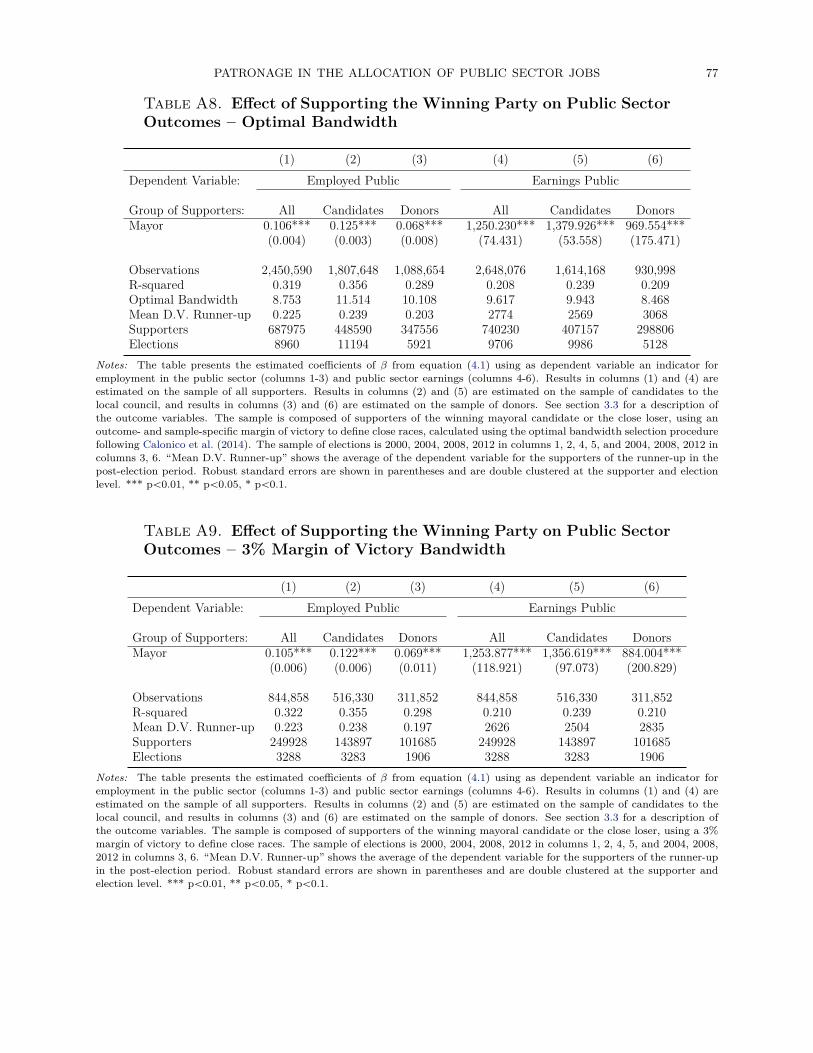
PATRONAGE IN THE ALLOCATION OF PUBLIC SECTOR JOBS 77
Table A8. Effect of Supporting the Winning Party on Public SectorOutcomes – Optimal Bandwidth
(1) (2) (3) (4) (5) (6)Dependent Variable: Employed Public Earnings Public
Group of Supporters: All Candidates Donors All Candidates DonorsMayor 0.106*** 0.125*** 0.068*** 1,250.230*** 1,379.926*** 969.554***
(0.004) (0.003) (0.008) (74.431) (53.558) (175.471)
Observations 2,450,590 1,807,648 1,088,654 2,648,076 1,614,168 930,998R-squared 0.319 0.356 0.289 0.208 0.239 0.209Optimal Bandwidth 8.753 11.514 10.108 9.617 9.943 8.468Mean D.V. Runner-up 0.225 0.239 0.203 2774 2569 3068Supporters 687975 448590 347556 740230 407157 298806Elections 8960 11194 5921 9706 9986 5128
Notes: The table presents the estimated coefficients of β from equation (4.1) using as dependent variable an indicator foremployment in the public sector (columns 1-3) and public sector earnings (columns 4-6). Results in columns (1) and (4) areestimated on the sample of all supporters. Results in columns (2) and (5) are estimated on the sample of candidates to thelocal council, and results in columns (3) and (6) are estimated on the sample of donors. See section 3.3 for a description ofthe outcome variables. The sample is composed of supporters of the winning mayoral candidate or the close loser, using anoutcome- and sample-specific margin of victory to define close races, calculated using the optimal bandwidth selection procedurefollowing Calonico et al. (2014). The sample of elections is 2000, 2004, 2008, 2012 in columns 1, 2, 4, 5, and 2004, 2008, 2012 incolumns 3, 6. “Mean D.V. Runner-up” shows the average of the dependent variable for the supporters of the runner-up in thepost-election period. Robust standard errors are shown in parentheses and are double clustered at the supporter and electionlevel. *** pă0.01, ** pă0.05, * pă0.1.
Table A9. Effect of Supporting the Winning Party on Public SectorOutcomes – 3% Margin of Victory Bandwidth
(1) (2) (3) (4) (5) (6)Dependent Variable: Employed Public Earnings Public
Group of Supporters: All Candidates Donors All Candidates DonorsMayor 0.105*** 0.122*** 0.069*** 1,253.877*** 1,356.619*** 884.004***
(0.006) (0.006) (0.011) (118.921) (97.073) (200.829)
Observations 844,858 516,330 311,852 844,858 516,330 311,852R-squared 0.322 0.355 0.298 0.210 0.239 0.210Mean D.V. Runner-up 0.223 0.238 0.197 2626 2504 2835Supporters 249928 143897 101685 249928 143897 101685Elections 3288 3283 1906 3288 3283 1906
Notes: The table presents the estimated coefficients of β from equation (4.1) using as dependent variable an indicator foremployment in the public sector (columns 1-3) and public sector earnings (columns 4-6). Results in columns (1) and (4) areestimated on the sample of all supporters. Results in columns (2) and (5) are estimated on the sample of candidates to thelocal council, and results in columns (3) and (6) are estimated on the sample of donors. See section 3.3 for a description ofthe outcome variables. The sample is composed of supporters of the winning mayoral candidate or the close loser, using a 3%margin of victory to define close races. The sample of elections is 2000, 2004, 2008, 2012 in columns 1, 2, 4, 5, and 2004, 2008,2012 in columns 3, 6. “Mean D.V. Runner-up” shows the average of the dependent variable for the supporters of the runner-upin the post-election period. Robust standard errors are shown in parentheses and are double clustered at the supporter andelection level. *** pă0.01, ** pă0.05, * pă0.1.

PATRONAGE IN THE ALLOCATION OF PUBLIC SECTOR JOBS 78
Table A10. Effect of Supporting the Winning Party on Public Sec-tor Outcomes – 1% Margin of Victory Bandwidth
(1) (2) (3) (4) (5) (6)Dependent Variable: Employed Public Earnings Public
Group of Supporters: All Candidates Donors All Candidates DonorsMayor 0.103*** 0.112*** 0.082*** 1,289.482*** 1,240.820*** 984.832***
(0.011) (0.012) (0.019) (241.140) (187.805) (346.646)
Observations 274,248 171,602 96,458 274,248 171,602 96,458R-squared 0.321 0.353 0.301 0.215 0.238 0.230Mean D.V. Runner-up 0.223 0.240 0.197 2661 2524 2963Supporters 81798 49089 31063 81798 49089 31063Elections 1092 1091 622 1092 1091 622
Notes: The table presents the estimated coefficients of β from equation (4.1) using as dependent variable an indicator foremployment in the public sector (columns 1-3) and public sector earnings (columns 4-6). Results in columns (1) and (4) areestimated on the sample of all supporters. Results in columns (2) and (5) are estimated on the sample of candidates to thelocal council, and results in columns (3) and (6) are estimated on the sample of donors. See section 3.3 for a description ofthe outcome variables. The sample is composed of supporters of the winning mayoral candidate or the close loser, using a 1%margin of victory to define close races. The sample of elections is 2000, 2004, 2008, 2012 in columns 1, 2, 4, 5, and 2004, 2008,2012 in columns 3, 6. “Mean D.V. Runner-up” shows the average of the dependent variable for the supporters of the runner-upin the post-election period. Robust standard errors are shown in parentheses and are double clustered at the supporter andelection level. *** pă0.01, ** pă0.05, * pă0.1.

PATRONAGE IN THE ALLOCATION OF PUBLIC SECTOR JOBS 79
Table A11. Effect of Supporting the Winning Party on PublicSector Outcomes, By Election Cycle
(1) (2) (3) (4)Dependent Variable: Employed Public Earnings Public
Group of Supporters: Candidates Donors Candidates Donors
Panel A: 2000 Election Cycle:Mayor 0.094*** 1,026.259***
(0.009) (132.944)
Observations 242,384 242,384R-squared 0.310 0.205Mean D.V. Runner-up 0.204 2027Supporters 60596 60596Elections 1259 1259
Panel B: 2004 Election Cycle:Mayor 0.128*** 0.066*** 1,343.418*** 814.873*
(0.010) (0.021) (146.942) (456.498)
Observations 248,732 89,368 248,732 89,368R-squared 0.369 0.356 0.248 0.260Mean D.V. Runner-up 0.248 0.244 2571 3947Supporters 62183 22287 62183 22287Elections 1431 769 1431 769
Panel C: 2008 Election Cycle:Mayor 0.147*** 0.062*** 1,522.456*** 759.917**
(0.010) (0.013) (156.320) (300.431)
Observations 225,268 288,752 225,268 288,752R-squared 0.380 0.272 0.255 0.184Mean D.V. Runner-up 0.261 0.185 2928 2703Supporters 56317 71967 56317 71967Elections 1328 1097 1328 1097
Panel D: 2012 Election Cycle:Mayor 0.139*** 0.075*** 1,778.027*** 1,019.358***
(0.010) (0.012) (160.962) (256.238)
Observations 151,504 172,712 151,504 172,712R-squared 0.367 0.296 0.241 0.206Mean D.V. Runner-up 0.258 0.199 2866 2818Supporters 75752 86018 75752 86018Elections 1395 1296 1395 1296
Notes: The table presents the estimated coefficients of β from equation (4.1) using as dependent variable an indicator variableequal to one if the supporter is employed in a public sector job (columns 1-2) and public sector earnings (columns 3-4). Resultsin columns (1) and (3) are estimated on the sample of candidates. Results in columns (2) and (4) are estimated on the sampleof donors. See section 3.3 for a description of the outcome variables. The sample is composed of supporters of the winningmayoral candidate or the close loser, using a 5% margin of victory to define close races. The sample of elections is 2000 in PanelA, 2004 in Panel B, 2008 in Panel C, 2012 in Panel D. “Mean D.V. Runner-up” shows the average of the dependent variable forthe supporters of the runner-up in the post-election period. Robust standard errors are shown in parentheses and are doubleclustered at the supporter and election level. *** pă0.01, ** pă0.05, * pă0.1.
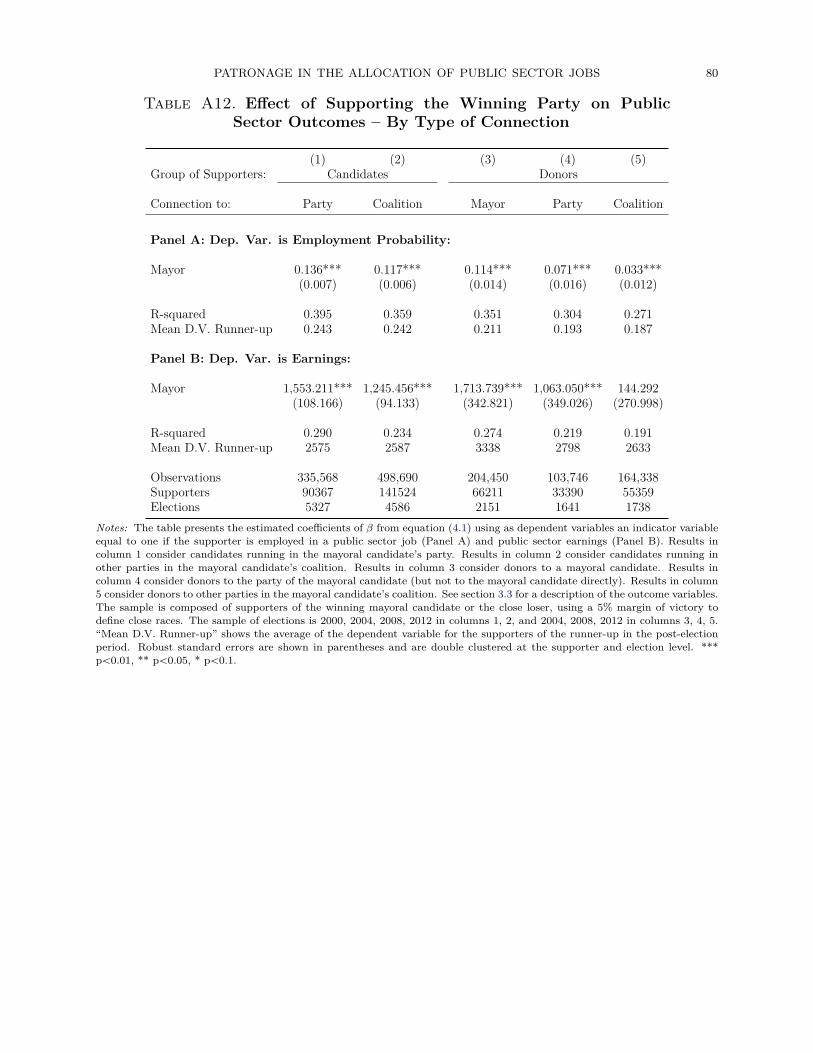
PATRONAGE IN THE ALLOCATION OF PUBLIC SECTOR JOBS 80
Table A12. Effect of Supporting the Winning Party on PublicSector Outcomes – By Type of Connection
(1) (2) (3) (4) (5)Group of Supporters: Candidates Donors
Connection to: Party Coalition Mayor Party Coalition
Panel A: Dep. Var. is Employment Probability:
Mayor 0.136*** 0.117*** 0.114*** 0.071*** 0.033***(0.007) (0.006) (0.014) (0.016) (0.012)
R-squared 0.395 0.359 0.351 0.304 0.271Mean D.V. Runner-up 0.243 0.242 0.211 0.193 0.187
Panel B: Dep. Var. is Earnings:
Mayor 1,553.211*** 1,245.456*** 1,713.739*** 1,063.050*** 144.292(108.166) (94.133) (342.821) (349.026) (270.998)
R-squared 0.290 0.234 0.274 0.219 0.191Mean D.V. Runner-up 2575 2587 3338 2798 2633
Observations 335,568 498,690 204,450 103,746 164,338Supporters 90367 141524 66211 33390 55359Elections 5327 4586 2151 1641 1738
Notes: The table presents the estimated coefficients of β from equation (4.1) using as dependent variables an indicator variableequal to one if the supporter is employed in a public sector job (Panel A) and public sector earnings (Panel B). Results incolumn 1 consider candidates running in the mayoral candidate’s party. Results in column 2 consider candidates running inother parties in the mayoral candidate’s coalition. Results in column 3 consider donors to a mayoral candidate. Results incolumn 4 consider donors to the party of the mayoral candidate (but not to the mayoral candidate directly). Results in column5 consider donors to other parties in the mayoral candidate’s coalition. See section 3.3 for a description of the outcome variables.The sample is composed of supporters of the winning mayoral candidate or the close loser, using a 5% margin of victory todefine close races. The sample of elections is 2000, 2004, 2008, 2012 in columns 1, 2, and 2004, 2008, 2012 in columns 3, 4, 5.“Mean D.V. Runner-up” shows the average of the dependent variable for the supporters of the runner-up in the post-electionperiod. Robust standard errors are shown in parentheses and are double clustered at the supporter and election level. ***pă0.01, ** pă0.05, * pă0.1.
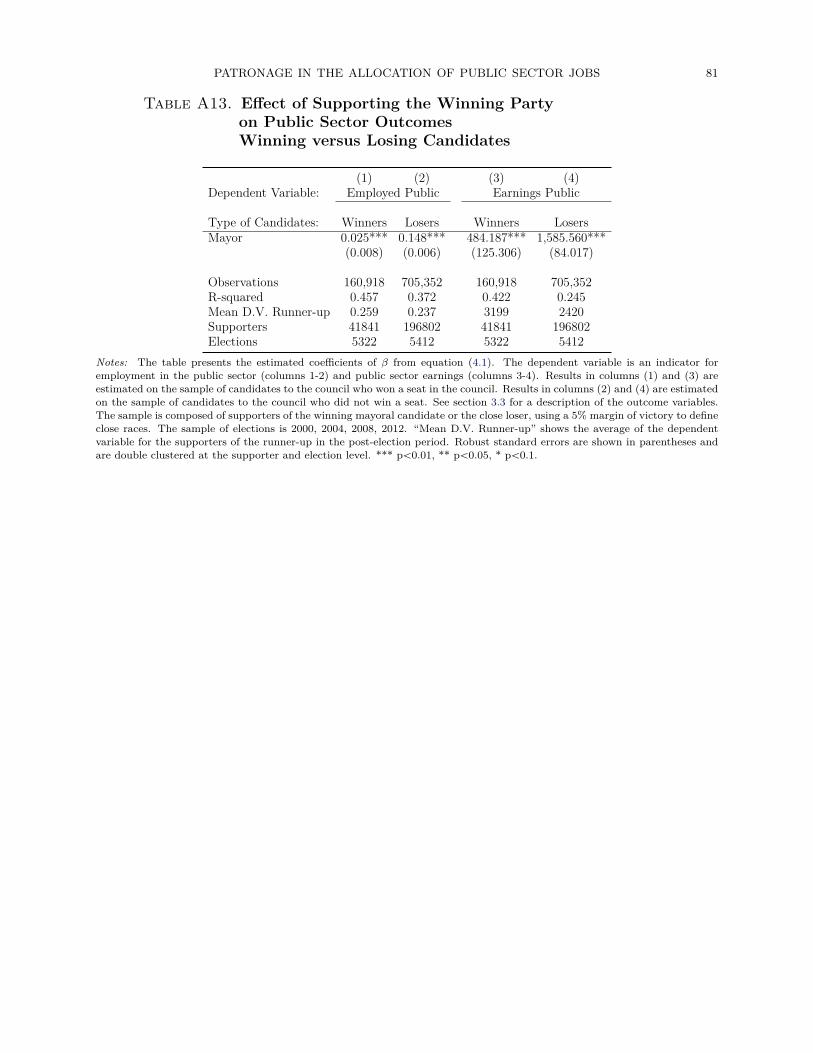
PATRONAGE IN THE ALLOCATION OF PUBLIC SECTOR JOBS 81
Table A13. Effect of Supporting the Winning Partyon Public Sector OutcomesWinning versus Losing Candidates
(1) (2) (3) (4)Dependent Variable: Employed Public Earnings Public
Type of Candidates: Winners Losers Winners LosersMayor 0.025*** 0.148*** 484.187*** 1,585.560***
(0.008) (0.006) (125.306) (84.017)
Observations 160,918 705,352 160,918 705,352R-squared 0.457 0.372 0.422 0.245Mean D.V. Runner-up 0.259 0.237 3199 2420Supporters 41841 196802 41841 196802Elections 5322 5412 5322 5412
Notes: The table presents the estimated coefficients of β from equation (4.1). The dependent variable is an indicator foremployment in the public sector (columns 1-2) and public sector earnings (columns 3-4). Results in columns (1) and (3) areestimated on the sample of candidates to the council who won a seat in the council. Results in columns (2) and (4) are estimatedon the sample of candidates to the council who did not win a seat. See section 3.3 for a description of the outcome variables.The sample is composed of supporters of the winning mayoral candidate or the close loser, using a 5% margin of victory to defineclose races. The sample of elections is 2000, 2004, 2008, 2012. “Mean D.V. Runner-up” shows the average of the dependentvariable for the supporters of the runner-up in the post-election period. Robust standard errors are shown in parentheses andare double clustered at the supporter and election level. *** pă0.01, ** pă0.05, * pă0.1.
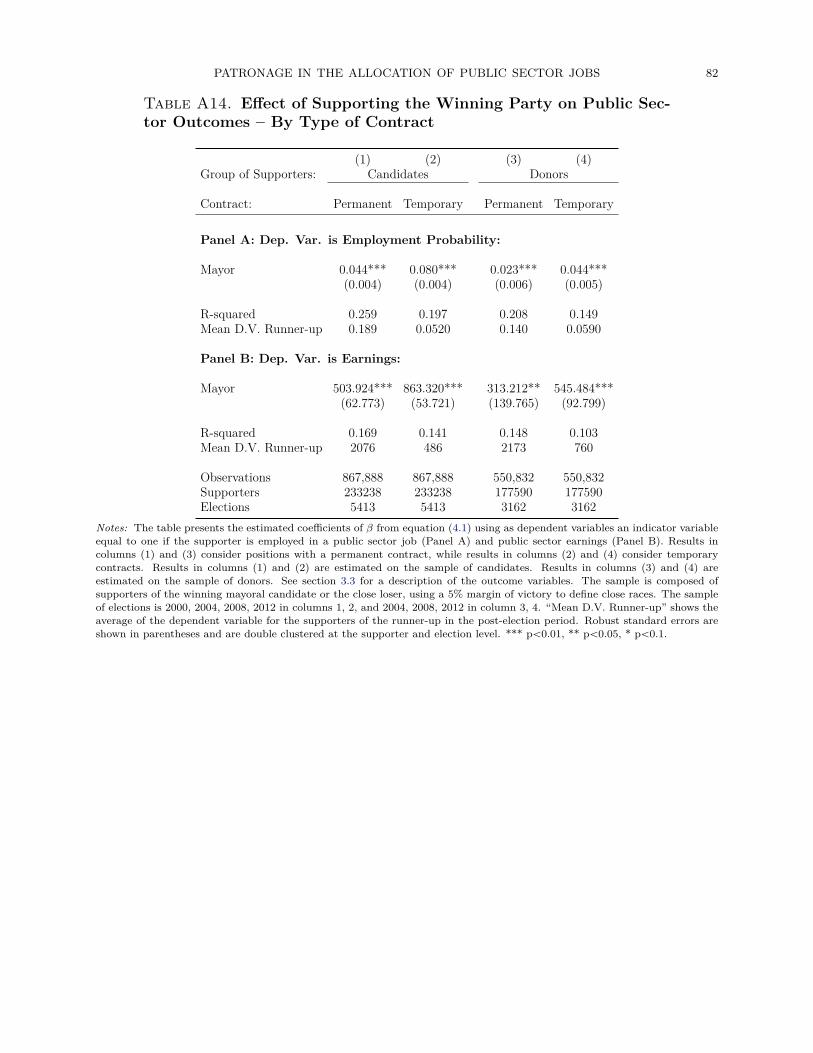
PATRONAGE IN THE ALLOCATION OF PUBLIC SECTOR JOBS 82
Table A14. Effect of Supporting the Winning Party on Public Sec-tor Outcomes – By Type of Contract
(1) (2) (3) (4)Group of Supporters: Candidates Donors
Contract: Permanent Temporary Permanent Temporary
Panel A: Dep. Var. is Employment Probability:
Mayor 0.044*** 0.080*** 0.023*** 0.044***(0.004) (0.004) (0.006) (0.005)
R-squared 0.259 0.197 0.208 0.149Mean D.V. Runner-up 0.189 0.0520 0.140 0.0590
Panel B: Dep. Var. is Earnings:
Mayor 503.924*** 863.320*** 313.212** 545.484***(62.773) (53.721) (139.765) (92.799)
R-squared 0.169 0.141 0.148 0.103Mean D.V. Runner-up 2076 486 2173 760
Observations 867,888 867,888 550,832 550,832Supporters 233238 233238 177590 177590Elections 5413 5413 3162 3162
Notes: The table presents the estimated coefficients of β from equation (4.1) using as dependent variables an indicator variableequal to one if the supporter is employed in a public sector job (Panel A) and public sector earnings (Panel B). Results incolumns (1) and (3) consider positions with a permanent contract, while results in columns (2) and (4) consider temporarycontracts. Results in columns (1) and (2) are estimated on the sample of candidates. Results in columns (3) and (4) areestimated on the sample of donors. See section 3.3 for a description of the outcome variables. The sample is composed ofsupporters of the winning mayoral candidate or the close loser, using a 5% margin of victory to define close races. The sampleof elections is 2000, 2004, 2008, 2012 in columns 1, 2, and 2004, 2008, 2012 in column 3, 4. “Mean D.V. Runner-up” shows theaverage of the dependent variable for the supporters of the runner-up in the post-election period. Robust standard errors areshown in parentheses and are double clustered at the supporter and election level. *** pă0.01, ** pă0.05, * pă0.1.
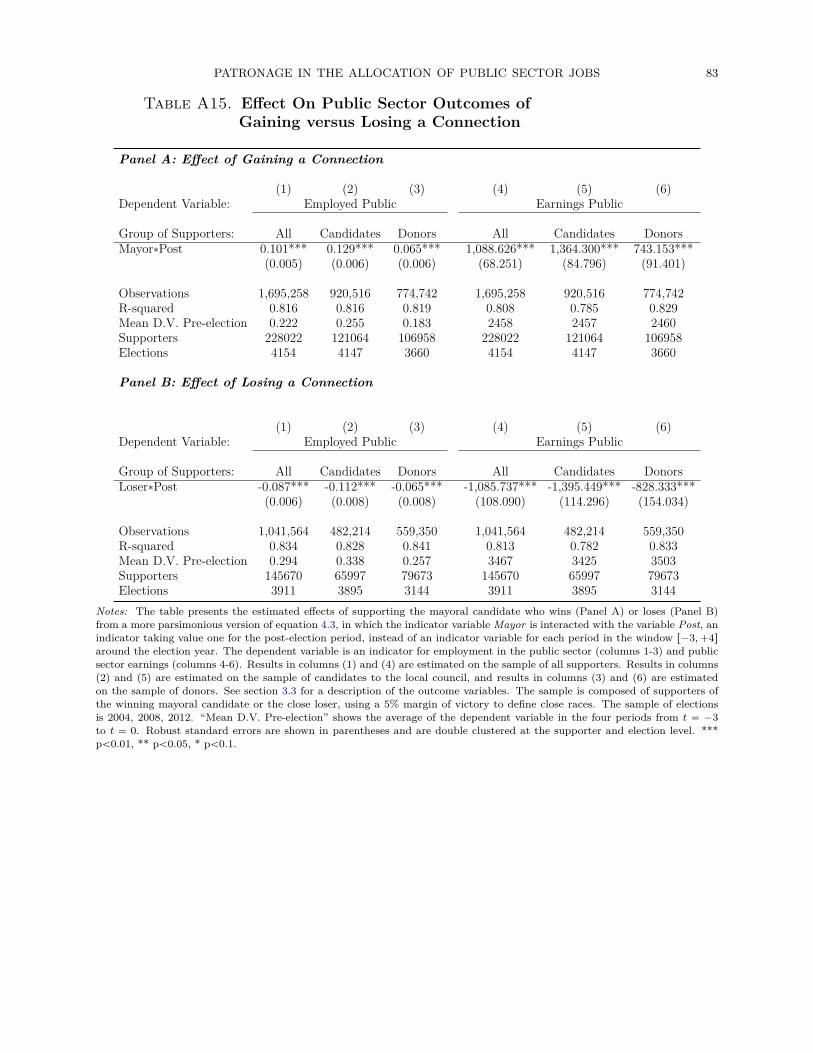
PATRONAGE IN THE ALLOCATION OF PUBLIC SECTOR JOBS 83
Table A15. Effect On Public Sector Outcomes ofGaining versus Losing a Connection
Panel A: Effect of Gaining a Connection
(1) (2) (3) (4) (5) (6)Dependent Variable: Employed Public Earnings Public
Group of Supporters: All Candidates Donors All Candidates DonorsMayor˚Post 0.101*** 0.129*** 0.065*** 1,088.626*** 1,364.300*** 743.153***
(0.005) (0.006) (0.006) (68.251) (84.796) (91.401)
Observations 1,695,258 920,516 774,742 1,695,258 920,516 774,742R-squared 0.816 0.816 0.819 0.808 0.785 0.829Mean D.V. Pre-election 0.222 0.255 0.183 2458 2457 2460Supporters 228022 121064 106958 228022 121064 106958Elections 4154 4147 3660 4154 4147 3660
Panel B: Effect of Losing a Connection
(1) (2) (3) (4) (5) (6)Dependent Variable: Employed Public Earnings Public
Group of Supporters: All Candidates Donors All Candidates DonorsLoser˚Post -0.087*** -0.112*** -0.065*** -1,085.737*** -1,395.449*** -828.333***
(0.006) (0.008) (0.008) (108.090) (114.296) (154.034)
Observations 1,041,564 482,214 559,350 1,041,564 482,214 559,350R-squared 0.834 0.828 0.841 0.813 0.782 0.833Mean D.V. Pre-election 0.294 0.338 0.257 3467 3425 3503Supporters 145670 65997 79673 145670 65997 79673Elections 3911 3895 3144 3911 3895 3144
Notes: The table presents the estimated effects of supporting the mayoral candidate who wins (Panel A) or loses (Panel B)from a more parsimonious version of equation 4.3, in which the indicator variable Mayor is interacted with the variable Post, anindicator taking value one for the post-election period, instead of an indicator variable for each period in the window r´3,`4saround the election year. The dependent variable is an indicator for employment in the public sector (columns 1-3) and publicsector earnings (columns 4-6). Results in columns (1) and (4) are estimated on the sample of all supporters. Results in columns(2) and (5) are estimated on the sample of candidates to the local council, and results in columns (3) and (6) are estimatedon the sample of donors. See section 3.3 for a description of the outcome variables. The sample is composed of supporters ofthe winning mayoral candidate or the close loser, using a 5% margin of victory to define close races. The sample of electionsis 2004, 2008, 2012. “Mean D.V. Pre-election” shows the average of the dependent variable in the four periods from t “ ´3to t “ 0. Robust standard errors are shown in parentheses and are double clustered at the supporter and election level. ***pă0.01, ** pă0.05, * pă0.1.
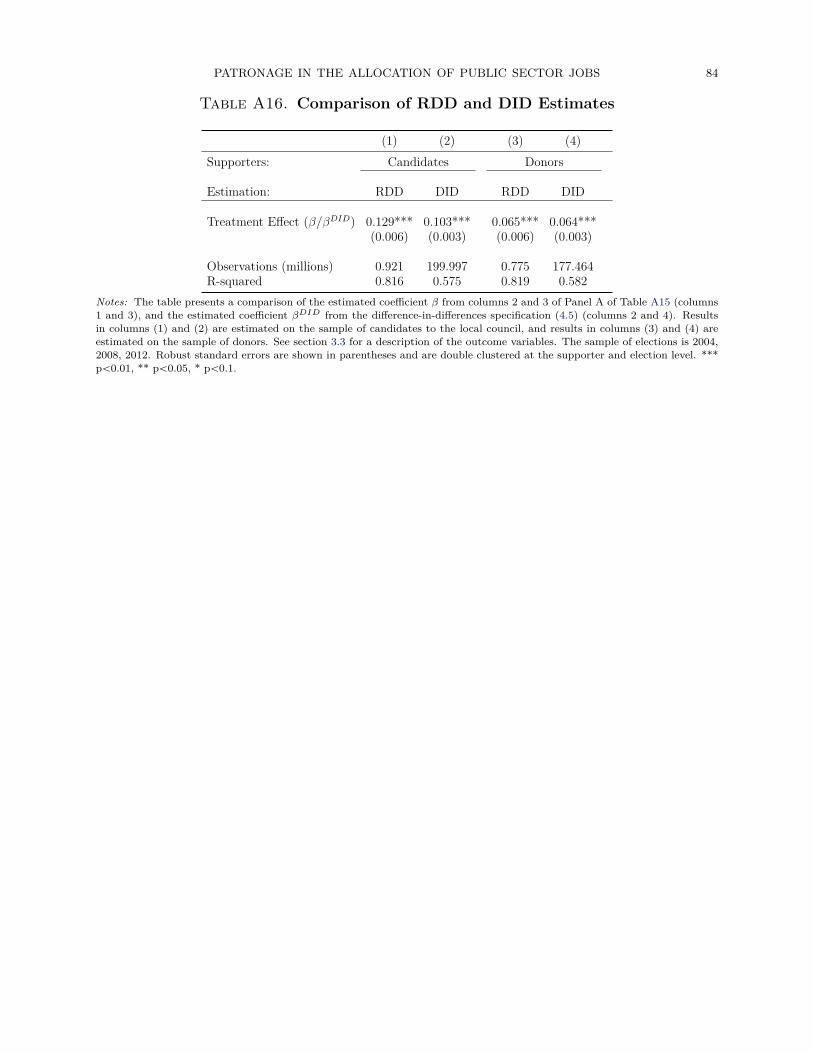
PATRONAGE IN THE ALLOCATION OF PUBLIC SECTOR JOBS 84
Table A16. Comparison of RDD and DID Estimates
(1) (2) (3) (4)Supporters: Candidates Donors
Estimation: RDD DID RDD DID
Treatment Effect (β/βDID) 0.129*** 0.103*** 0.065*** 0.064***(0.006) (0.003) (0.006) (0.003)
Observations (millions) 0.921 199.997 0.775 177.464R-squared 0.816 0.575 0.819 0.582
Notes: The table presents a comparison of the estimated coefficient β from columns 2 and 3 of Panel A of Table A15 (columns1 and 3), and the estimated coefficient βDID from the difference-in-differences specification (4.5) (columns 2 and 4). Resultsin columns (1) and (2) are estimated on the sample of candidates to the local council, and results in columns (3) and (4) areestimated on the sample of donors. See section 3.3 for a description of the outcome variables. The sample of elections is 2004,2008, 2012. Robust standard errors are shown in parentheses and are double clustered at the supporter and election level. ***pă0.01, ** pă0.05, * pă0.1.
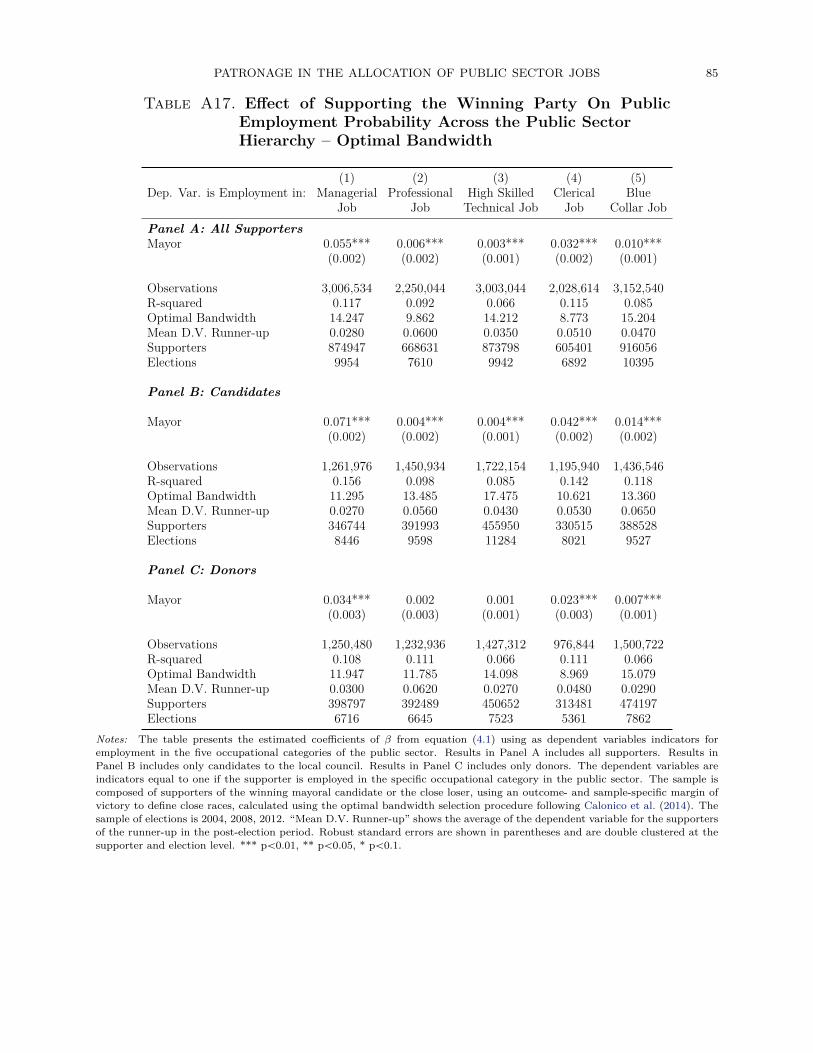
PATRONAGE IN THE ALLOCATION OF PUBLIC SECTOR JOBS 85
Table A17. Effect of Supporting the Winning Party On PublicEmployment Probability Across the Public SectorHierarchy – Optimal Bandwidth
(1) (2) (3) (4) (5)Dep. Var. is Employment in: Managerial Professional High Skilled Clerical Blue
Job Job Technical Job Job Collar JobPanel A: All SupportersMayor 0.055*** 0.006*** 0.003*** 0.032*** 0.010***
(0.002) (0.002) (0.001) (0.002) (0.001)
Observations 3,006,534 2,250,044 3,003,044 2,028,614 3,152,540R-squared 0.117 0.092 0.066 0.115 0.085Optimal Bandwidth 14.247 9.862 14.212 8.773 15.204Mean D.V. Runner-up 0.0280 0.0600 0.0350 0.0510 0.0470Supporters 874947 668631 873798 605401 916056Elections 9954 7610 9942 6892 10395
Panel B: Candidates
Mayor 0.071*** 0.004*** 0.004*** 0.042*** 0.014***(0.002) (0.002) (0.001) (0.002) (0.002)
Observations 1,261,976 1,450,934 1,722,154 1,195,940 1,436,546R-squared 0.156 0.098 0.085 0.142 0.118Optimal Bandwidth 11.295 13.485 17.475 10.621 13.360Mean D.V. Runner-up 0.0270 0.0560 0.0430 0.0530 0.0650Supporters 346744 391993 455950 330515 388528Elections 8446 9598 11284 8021 9527
Panel C: Donors
Mayor 0.034*** 0.002 0.001 0.023*** 0.007***(0.003) (0.003) (0.001) (0.003) (0.001)
Observations 1,250,480 1,232,936 1,427,312 976,844 1,500,722R-squared 0.108 0.111 0.066 0.111 0.066Optimal Bandwidth 11.947 11.785 14.098 8.969 15.079Mean D.V. Runner-up 0.0300 0.0620 0.0270 0.0480 0.0290Supporters 398797 392489 450652 313481 474197Elections 6716 6645 7523 5361 7862
Notes: The table presents the estimated coefficients of β from equation (4.1) using as dependent variables indicators foremployment in the five occupational categories of the public sector. Results in Panel A includes all supporters. Results inPanel B includes only candidates to the local council. Results in Panel C includes only donors. The dependent variables areindicators equal to one if the supporter is employed in the specific occupational category in the public sector. The sample iscomposed of supporters of the winning mayoral candidate or the close loser, using an outcome- and sample-specific margin ofvictory to define close races, calculated using the optimal bandwidth selection procedure following Calonico et al. (2014). Thesample of elections is 2004, 2008, 2012. “Mean D.V. Runner-up” shows the average of the dependent variable for the supportersof the runner-up in the post-election period. Robust standard errors are shown in parentheses and are double clustered at thesupporter and election level. *** pă0.01, ** pă0.05, * pă0.1.
PATRONAGE IN THE ALLOCATION OF PUBLIC SECTOR JOBS 86
Tab
leA
18.
Pub
licSe
ctor
Ret
urns
Are
Incr
easi
ngin
Am
ount
ofSu
ppor
t
(1)
(2)
(3)
(4)
Sam
ple
/H
eter
ogen
eous
effec
tin
Can
dida
tes
/Vo
tes
Don
ors
/M
oney
Dep
ende
ntVa
riabl
eis:
Empl
oyed
Earn
ings
Empl
oyed
Earn
ings
May
or˚Q
uint
ile5
0.08
5***
1,97
6.48
1***
0.04
1***
1,35
4.75
6***
(0.0
06)
(104
.295
)(0
.011
)(2
70.3
86)
May
or˚Q
uint
ile4
0.06
3***
1,07
2.71
8***
0.02
8**
626.
614*
*(0
.006
)(8
8.22
2)(0
.012
)(2
57.9
89)
May
or˚Q
uint
ile3
0.05
4***
603.
133*
**0.
028*
**47
9.57
3**
(0.0
06)
(79.
613)
(0.0
10)
(203
.145
)M
ayor˚Q
uint
ile2
0.02
9***
272.
940*
**0.
017*
60.0
43(0
.006
)(7
3.99
9)(0
.009
)(1
61.6
47)
May
or0.
101*
**77
8.60
1***
0.04
4***
388.
800*
(0.0
07)
(96.
470)
(0.0
10)
(204
.127
)
Obs
erva
tions
705,
352
705,
352
550,
832
550,
832
R-s
quar
ed0.
378
0.26
20.
299
0.22
2M
ean
D.V
.Run
ner-
up0.
237
2420
0.19
929
35Su
ppor
ters
1968
0219
6802
1775
9017
7590
Elec
tions
5412
5412
3162
3162
Not
es:
The
tabl
epr
esen
tsth
ees
timat
edco
effici
ents
from
equa
tion
6.1.
We
repo
rtth
ehe
tero
gene
ous
trea
tmen
teff
ects
atdi
ffere
ntqu
intil
esof
the
vote
shar
edi
stri
butio
n(c
olum
ns1
and
2)or
the
dist
ribu
tion
ofam
ount
ofm
oney
cont
ribu
ted
bydo
nors
(col
umn
3an
d4)
.T
hede
pend
ent
vari
able
isan
indi
cato
rva
riab
leeq
ualt
oon
eif
the
supp
orte
ris
empl
oyed
ina
publ
icse
ctor
job
inod
dco
lum
ns,a
ndpu
blic
sect
orea
rnin
gsin
even
colu
mns
.T
hesa
mpl
eis
com
pose
dof
supp
orte
rsof
the
win
ning
may
oral
cand
idat
eor
the
clos
elo
ser,
usin
ga
5%m
argi
nof
vict
ory
tode
fine
clos
era
ces.
The
sam
ples
inco
lum
ns1
and
2in
clud
eca
ndid
ates
toth
elo
calc
ounc
ilw
how
ere
not
elec
ted.
The
sam
ples
inco
lum
ns5
and
6in
clud
edo
nors
.T
hesa
mpl
eof
elec
tions
is20
00,2
004,
2008
,201
2in
colu
mns
1an
d2,
and
2004
,200
8,20
12in
colu
mns
3an
d4.
“Mea
nD
.V.R
unne
r-up
”sh
ows
the
aver
age
ofth
ede
pend
ent
vari
able
for
the
supp
orte
rsof
the
runn
er-u
pin
the
post
-ele
ctio
npe
riod
.R
obus
tst
anda
rder
rors
are
show
nin
pare
nthe
ses
and
are
doub
lecl
uste
red
atth
esu
ppor
ter
and
elec
tion
leve
l.**
*pă
0.01
,**
pă0.
05,*
pă0.
1.
PATRONAGE IN THE ALLOCATION OF PUBLIC SECTOR JOBS 87
Table A19. Patronage Decreases the Importance of Education inPublic Sector Hiring – Non-Supporters as Control Group
(1) (2) (3)Dep. Var. is Employment Middle High School Universityin Public Job Requiring: School Degree School Degree Degree
Mayor˚Qualified˚Post -0.006** -0.035*** -0.133***(0.003) (0.004) (0.009)
Mayor˚Post 0.015*** 0.064*** 0.087***(0.003) (0.004) (0.003)
Qualified˚Post -0.004*** 0.018*** 0.113***(0.001) (0.001) (0.006)
Observations 181,022,074 181,022,074 181,022,074R-squared 0.430 0.448 0.467Elections 3580 3580 3580
Notes: The table presents the estimated coefficients from an augmented version of equation (4.5), where we add the tripleinteraction between Mayorimt, Postkmt and Qualifiedi, and the double interaction between Postkmt and Qualifiedi. Depen-dent variables are indicator for employment in a public sector job that requires a middle school degree (column 1), high schooldegree (column 2) and university degree (column 3). Qualifiedi is an indicator taking value one if supporter i has a middleschool degree (column 1), high school degree (column 2) and university degree (column 3). The sample of elections is 2004,2008, 2012. Robust standard errors are shown in parentheses and are double clustered at the supporter and election level. ***pă0.01, ** pă0.05, * pă0.1.
PATRONAGE IN THE ALLOCATION OF PUBLIC SECTOR JOBS 88
Table A20. Favoritism Stronger for Supporters with Lower PrivateSector Opportunities – Non-Supporters as Control Group
Dep. Var. is Employment in Public Sector(1) (2) (3)
Group of Supporters: All Supporters Candidates Donors
Panel A: Continuous Measure of Previous Private EarningsMayor˚Post˚Private Earnings -0.004*** -0.006*** -0.002***
(0.000) (0.001) (0.000)Mayor˚Post 0.122*** 0.202*** 0.184***
(0.005) (0.006) (0.006)
R-squared 0.420 0.420 0.420
Panel B: Terciles of Previous Private EarningsMayor˚Post˚Tercile 3 -0.049*** -0.074*** -0.019***
(0.006) (0.010) (0.007)Mayor˚Post˚Tercile 2 -0.019*** -0.025** -0.004
(0.006) (0.010) (0.007)Mayor˚Post 0.138*** 0.207*** 0.076***
(0.006) (0.009) (0.006)
R-squared 0.420 0.420 0.420
Observations 119,464,782 119,374,559 119,395,105Elections 3067 3067 3063
Notes: The table presents the estimated coefficients from an augmented version of equation (4.5). In Panel A we add thetriple interaction between Mayorimt, Postkmt and PrivateEarningsimt, and the double interaction between Postkmt andPrivateEarningsimt. In Panel B we add the triple interactions between Mayorimt, Postkmt and Tercile2imt, and betweenMayorimt, Postkmt and Tercile3imt, and the double interaction between Postkmt and Tercile2imt and between Postkmt andTercile3imt. The dependent variable in all columns is an indicator for employment in the public sector. The sample of electionsis 2004, 2008, 2012. Robust standard errors are shown in parentheses and are double clustered at the supporter and electionlevel. *** pă0.01, ** pă0.05, * pă0.1.

PATRONAGE IN THE ALLOCATION OF PUBLIC SECTOR JOBS 89
Table A21. Effect of Supporting the Winning PartyAmong Switchers and Loyals
Dep. Var. is Employment in Public Sector(1) (2)
Type of Supporter: Loyals to Party Party SwitchersPanel A: CandidatesMayor 0.145*** 0.143***
(0.018) (0.022)
Observations 37,586 25,326R-squared 0.487 0.506Mean D.V. Runner-up 0.251 0.266Supporters 10702 7093Elections 1949 1515
Panel B: DonorsMayor 0.069 0.144**
(0.062) (0.065)
Observations 2,746 3,374R-squared 0.539 0.535Mean D.V. Runner-up 0.335 0.313Supporters 1162 1378Elections 160 263
Notes: The table presents the estimated coefficients β from equation (4.1) using as dependent variables an indicator vari-able equal to one if the supporter is employed in a public sector job, for different subsample of candidates/donors who haverun/donated in subsequent elections. “Loyals Party” refer to candidates (respectively, donors) who in the previous electionrun in (respectively, donated to) the same party of the mayoral candidate supported in the current election. “Party Switch-ers” refer to candidates (respectively, donors) who in the previous election run in (respectively, donated to) a different partythan the one of the mayoral candidate supported in the current election. Results in Panel A are estimated on the sample ofcandidates. Results in Panel B are estimated on the sample of donors. The sample is restricted to supporters of the winningmayoral candidate or the close loser, using a 5% margin of victory to define close races. The sample of elections is 2004, 2008,2012 for candidates and 2008 and 2012 for donors. “Mean D.V. Runner-up” shows the average of the dependent variable forthe supporters of the runner-up in the post-election period. Robust standard errors are shown in parentheses and are doubleclustered at the supporter and election level. *** pă0.01, ** pă0.05, * pă0.1.