docshare01.docshare.tipsdocshare01.docshare.tips/files/19237/192378409.pdf · patron-in-chief dr....
TRANSCRIPT

Patron-in-Chief
Dr. Abdul Hameed Bajoi Vice Chancellor LUAWMS
Patron
Dr. Gul Hasan Pro Vice-Chancellor LUAWMS
Editor-in-Chief
Dr. Muhammad Aslam
Editors
Dr. Abdul Raziq Abdul Qayoom Buzdar Imtiaz Ahmed
Editorial Board
Dr. Abdul Hameed Baloch, Canada Dr. Ghulam Jilani, Pakistan
Dr. M.S. Haider, Pakistan Dr. Faizullah, Pakistan
Dr. Samiullah, Pakistan Dr. Mustajab, Pakistan
Dr. Soukat Ali, Pakistan Dr. Wang Jiming, China
Dr. Guanglei Liu, China Dr. Chi Zhe, China
Dr. Ravindra Pawar, India Dr. Manish Raj Pandey, Nipal
Dr. Faiz Muhammad, Pakistan Dr. Ahmed Nawaz Khoso, Pakistan
Dr. Muhammad Shafi, Pakistan Dr. Imran Ali Sheikh, Pakistan
______________________________________________________________________
Publisher: Lasbela University Printing Press, Uthal, Pakistan Address: Lasbela University of Agriculture, Water & Marine Sciences Post Code: 90150 District Lasbela, Balochistan, Pakistan. Ph: +92-853-610916 Fax: +92-853-610294, Website: www.luawms.edu.pk, Email: [email protected]

For Authors’ Guidance
Authors are requested to follow the steps given below before submitting your article for
efficient and rapid publication process. Article not prepared in accordance with this regulation
will not be given consider for further process.
LUJST's Publication policy
LUJST publisher’s editorial policy insists the authors to disclose the originality of
the manu-scripts that are submitted. Articles submitted to LUJST are peer reviewed
independently by reviewers / experts in the concerned area and the articles are accepted on the
basis of acknowledgement / comments received from the reviewers. Reviewers to each
article are assigned by the editor in chief independently. Research validity, research
significance, authenticity of the research work, quality of the submitted manuscript is being
evaluated by reviewers to ensure the quality before publication. Papers pending in other
journals will not be considered. LUJST request the authors not to communicate an article that
is under consideration / accepted and yet to be published in any other similar journal and if
found the author will be highly noted, will cause for immediate rejection or editorial retraction
after publication and their future correspondence will no longer be encouraged.
Experimental evidence presented to LUJST publishers must provide ethical approval letter. (in
case of animal and human research based experiments) Manuscripts lacking this
information will not be encouraged for publication.
Peer-Reviewed Manuscripts
Research Articles (up to ~6500 words, including references, notes and captions, or ~7
printed pages) are expected to present a major advance. Research Articles include an abstract,
an introduction, up to six figures or tables, sections with brief subheadings, and about 30
references. Materials and Methods should usually be included in supplementary materials,
which should also include information needed to support the paper's conclusions.
Reports (up to ~3500 words including references, notes and captions or ~4 printed pages)
present important new research results of broad significance. Reports should include an abstract,
an introductory paragraph, up to four figures or tables, and about 30 references. Materials and
Methods should usually be included in supplementary materials, which should also include
information needed to support the paper's conclusions.
Reviews (up to 6500 words including references, notes and captions) describe new
developments of interdisciplinary significance and highlight future directions. They include an
abstract, an introduction that outlines the main theme, brief subheadings, and an outline of
important unresolved questions. A maximum of 70 references is suggested. Most Reviews are
solicited by the editors, but unsolicited submissions may also be considered.
Organization of Manuscript:
Manuscripts should be typewritten and double spaced throughout, with line number and 2.5 cm
margins on all sides. Abstract, tables, and figure legends should be included in text and on

separate sheets too. All manuscript sheets must be numbered successively. Authors
should submit his/her manuscript by e-mail.
Title page
The title page of manuscript should contain title, author's names of authors and their
affiliations, a short title (running title), and the name and address of correspondence author
including telephone number, fax number, and e-mail address, if available. Authors with
different affiliations should be identified by the use of the same superscript on name and
affiliation. In addition, a sub-field of submitted papers may be indicated on the top right
corner of the title page.
Abstract
The abstract should provide a clear and succinct statement of the findings and thrusts of the
manuscript. The abstract should be intelligible in itself, written in complete sentences. Since
LUJST is an interdisciplinary journal, it is important that the abstract be written in a manner
which will make it intelligible to biologists in all fields. Authors should avoid non-standard
abbreviations, unfamiliar terms and symbols. References cannot be cited in the Abstract.
Authors should submit their paper in English Language. Each abstract should not contain more
than 250 words.
Introduction
This section should describe the objectives of the study and provide sufficient background
information to make it clear why the study was undertaken. Lengthy reviews of the past
literature are discouraged.
Materials and Methods:
This section should provide the reader with sufficient information that will make it possible to
repeat the work. For modification of published methodology, only the modification needs to be
described with reference to the source of the method. Information regarding statistical analysis
of the data should be included.
Results:
This section should provide hard core data obtained. Same data/information given in a
Table must not be repeated in a Figure, or vice versa. It is not acceptable to repeat extensively
the numbers from Tables in the text and give long explanations of the Tables and Figures.
The results should be presented succinctly and completely.
Discussion:
The discussion should include a concise statement of the principal findings, discussion of the
significance of the work, and appraisal of the findings in light of other published works dealing

with the same or closely related object. Redundant descriptions of material in the
Introduction and Results, and extensive discussion of literature are discouraged.
Acknowledgements:
If necessary, a brief Acknowledgements section may be
included.
References to literature should be listed alphabetically by authors at the end of the article; all
references should be complete. For articles in journals or other serial publications, the reference
should give in order: Author's name, year of publication, full title: full name of periodical or
series, volume number, inclusive pages. For books or other unnumbered publications, it should
give: Author's name, year of publication, full title: place of publication, publisher and page
number. References must be given in full without abbreviations. (REFERENCES TO PAPERS
WITH MORE THAN TWO AUTHORS SHOULD BE CITED THUS IN THE TEXT: (Adams
et al, 1988) but in full in the References. Citations within an article should be to author
and year, with specific pages wherever appropriate.
Example References: Papers:
Manning, C. E., and Bird, D. K., 1991, Porosity evolution and fluid flow in the
basalts of the Skaergaard magma-hydrothermal system, east Greenland:
American Journal of Science, v. 291, p. 201-257.
Theses:
Palin, J. M., 1992, Stable isotope studies of regional metamorphism in the
Wepawaug Schist, Connecticut: Ph.D. thesis, Yale University, New Haven, 170 p.
Books and Related Publications:
McSaveney, M., 1992, A manual of weathering-rind dating for sandstone clasts of
the Torlesse Supergroup: Geological Society of New Zealand Miscellaneous
Publication 63A, 106 p.
Weblink reference:
Gajendran N,
http://www.iseeadyar.org/authorinstruction.html.
Map:
Fritts, C. E., 1963, Bedrock geology of the Mount Carmel Quadrangle,
Connecticut: United States Geological Survey Quadrangle Map GQ-199, scale 1:24,000.

Abstracts:
Sammis, C. G., 1993, Relating fault stability to fault zone structure:
Geological
Society of America Abstracts with Programs, v. 25, no. 6, p. A115-
A116.
Preparation of Covering Letter
Cover letters must state that the paper is new and original and not under consideration for
publication elsewhere.
Preparation of Tables:
Tables should be simple and intelligible without requiring references to the text. Each
table should have a concise heading, should be typed on a separate sheet of paper, and must
have an explanatory title. All tables should be referred to in the text, and their approximate
position indicated on the margin of the manuscript. Ruling in tables, especially vertical or
oblique line should be avoided.
Preparation of Illustrations:
Illustrations should be termed "Figures" (not "plates", even if they cover an entire page) and
labeled with numbers. All figures should be referred to in the text and numbered consecutively
in Arabic numerals (Fig. 1, Fig. 2, etc.). Scales in line drawings must be mounted parallel to
either the top or side of the figures. In planning illustrations, authors should keep the size of the
printed page in mind, making due allowance for the figure legend. The figures must be
identified on the reverse side with the author's name, the figure number, and the orientation of
the figure (top and bottom). The preferred location of the figures should be indicated on the
margin of the manuscript. Illustrations in color may be published at the author's expense. The
legends for several figures may be typed on the same page. Sufficient details should be given in
the legend to make it intelligible without reference to the text.
Reviewers Details
Please suggest two competent reviewers with complete details (Name, Designation, Email
and Contact number)
References: Manuscripts will be sent to one or more referees at the discretion of the Editor-in-
Chief. Reviewers are given the option of providing an anonymous report or a signed report. In
established disciplines, concordance with accepted disciplinary paradigms is the chief guide in
evaluating material for scholarly publication. On many of the matters of interest to the
Society for Scientific Exploration, however, consensus does not prevail. Therefore the
Lasbela University Journal of Science necessarily publishes claimed observations and
proffered explanations that will seem more speculative or less plausible than those appearing in
some mainstream disciplinary journals. Nevertheless, those observations and explanations must

conform to rigorous standards of observational techniques and logical argument. If publication
is deemed warranted but there remain points of disagreement between authors and referee(s),
the reviewer(s) may be given the option of having their opinion(s) published along with the
article, subject to the Editor-in-Chief’s judgment as to length, wording, and the like. The
publication of such critical reviews is intended to encourage debate and discussion of
controversial issues, since such debate and discussion offer the only path toward eventual
resolution and consensus.
Proof and author copies: After reviewing the copyedited manuscript, corresponding authors
will receive typeset PDF page proofs for review. PDF copies of the published Journal will be
sent to all authors.
Copyright: Authors retain copyright to their writings. However, when an article has been
submitted to the Lasbela University Journal of Science & Technology for consideration, the
Journal holds first serial (periodical) publication rights. Additionally, after acceptance and
publication, the journal has the right to post the article on the Internet and to make it
available via electronic as well as print subscription. The material must not appear
anywhere else (including on an Internet website) until it has been published by the Journal (or
rejected for publication). After publication in the Journal, authors may use the material as they
wish but should make appropriate reference to the prior publication in the Journal. For
example: “Reprinted from [or From] “[title of article]”, Lasbela University Journal of
Science, vol. [xx], no. [xx], pp. [xx], published by the journal.
Disclaimer: While every effort is made by the Publisher, Editors, and Editorial Board to see
that no inaccurate or misleading data, opinion, or statement appears in this Journal, they wish to
point out that the data and opinions appearing in the articles and announcements herein are the
sole responsibility of the contributor concerned. The Publisher, Editors, Editorial Board, and
their respective employees, officers, and agents accept no responsibility or liability for the
consequences of any such inaccurate or misleading data, opinion, or statement.
Have you completed the following requirements before submitting your
manuscript?
Acceptable format of your article: Microsoft word (.doc, .docx)
Covering letter should be placed as first page of an article
Tables & Figures in text and as separate document files
Name of two reviewers/Referee/Expert. Who should have at least three research
papers published in indexed journals in their field of specialization.

CONTENTS
Spatial Analysis of Sulfur dioxide (SO2) concentration in Karachi Megapolis, Pakistan
Syed Nawaz-Ul-Huda, Farkhunda Burke, Erma Anwar,Imtiaz Ahmed, Muhammad Miandad ,
Muhammad Azam
1
Integrated geological and geophysical research on Lava effusion in Ziarat, Balochistan, Pakistan Asif Nazeer Rana, Muhammad Saeed, Mehtab Ur Rahman, , Syed Ali Abbas
17
Effect of multiple harvests on chemical composition of important nutrients of Alfalfa (Medicago
sativa L.) grown in Uthal, Lasbela District, Balochistan, Pakistan.
Saeed Ahmed, Abdul Hameed Baloch, Imtiaz Ahmed
30
Genetic differentiation of two Chrysichthys species using mitochondrial DNA sequencing
Nwafili S.A, Eminue B.O , Jamabo. N
36
Preliminary observation on Baseodiscus hemprichii (ribbon worm)
Faiz Muhammad, Muhammad Shafi, Muhammad Aslam
44
Identification and phylogenetic analysis of halophilic fungus isolated from a man-made solar
saltern in Thailand
Imran Ali, Sudip K. Rakshit, Napa Siwarungson, Hunsa Punnapayak, Pongtharin Lotrakul, Sehanat
Prasongsuk, Ali Akber, Zia ur Rehman
47
In vitro antibacterial activity of Sorghum halepense
Rooh-Ul-Amin, Muhammad Adil, Kashif Hayat, Arbab Sikandar, Farmanullah, Saeed Khan, Hazrat Nabi
53
Antagonistic potential of marine isolate DK6-SH8 against fish pathogens Muhammad Naseem Khan, Meng Li, Zulfiqar Ali Mirani, Jingxue Wang And Hong Lin
61
Physico-chemical properties of goat, sheep and camel milk of Balochistan Haseena Sajid, Shafia Muzafar, Abida Peer Muhammad, Illahi Bakhsh Marghazani, Sajid Ali Khosa,
Nasrullah, Ahmed Nawaz Khosa
70


Lasbela University Journal of Science and Technology (2013) Vol-2 ISSN 2306-8256
Online available at www.luawms.edu.pk pg. 1
ENVIRONMENTAL SCIENCES
RESEARCH ARTICLE
Spatial analysis of sulfur dioxide (SO2) concentration in Karachi
Megapolis, Pakistan
Syed Nawaz-ul-Huda1, Farkhunda Burke
1, Erma Anwar
2,Imtiaz Ahmed
3, Muhammad
Miandad1and Muhammad Azam
2
1Department of Geography, University of Karachi, Karachi, Pakistan.
2Department of Geography, Federal Urdu University of Arts, Sciences and Technology,
Gulshan-e-Iqbal Campus, Karachi, Pakistan. 3Faculty of Water Resources Management, Lasbela University of Agriculture, Water and
Marine Sciences, Uthal, Balochistan, Pakistan.
ABSTRACT
Rapid growth of motor vehicles in cities of Pakistan has brought in its wake a range of serious
socio-economic, environmental, health and welfare impacts. Of these impacts, those resulting
from urban air pollution, due to emissions from motor vehicles among other sources, have been
the focus of considerable public concern and policy attention. Vehicular smoke, burning of
garbage and low greenery have a predominant role in Karachi’s air pollution which subsequently
are causes of serious environmental degradation and lung diseases among the population. The
present study focuses on high traffic volume locations of Karachi for the study of SO2
concentration based on Minimum Curvature Interpolation technique. The study also focuses on
24 hours ambient data in selected places and identification of zones of SO2 concentration in
Karachi megapolis.
Keywords: Karachi, Pakistan, SO2, Minimum Curvature Interpolation, Burns Road
_____________________________________________________________________________ Correspondence: Syed Nawaz-ul-Huda Address: Department of Geography, University of Karachi, Karachi, Pakistan.
Email: [email protected] Phone: +92-333-3177399 Received : 02 Feb, 2013 Revised : 25 Jun, 2013 Accepted: 26 Jun, 2013 Copyright: ©2013 Huda et al. This is an open-access article distributed under the terms of the Creative
Commons Attribution License, which permits unrestricted use, distribution, and reproduction in any
medium, provided the original author and source are credited Competing Interests: The authors have declared that no competing interests exist. ______________________________________________________________________________
INTRODUCTION
Clean air is an essential component of life
but air pollution plays a prominent role in its
spoilage and urban atmosphere. It is affected
by industrial development and high volume
of growing traffic. Air pollution is a severe
problem in most cities of the developing
world as compared to cities of the developed
world (Sivaramasundaram and

Lasbela University Journal of Science and Technology (2013) Vol-2 ISSN 2306-8256
Online available at www.luawms.edu.pk pg. 2
Muthusubramanian, 2010; Viana et al, 2006;
Miranda, 2012 & Bell, 2007). The greatest
human and economic impacts of air
pollution are increased incidence of illness
and premature death which result from
human exposure to elevated levels of
harmful pollutants. The most common air
pollutants are sulfur dioxide (SO2), oxides of
nitrogen (NOx), carbon monoxide (CO),
particulate matter (PM) and volatile organic
compounds (VOCs) in urban areas, which
come from a wide variety of sources. The
single most important source generally
being fossil fuels (Gorham 2002 & Tiwari et
al, 2010).
Rapid growth in the number of motor
vehicles in cities of Pakistan has brought in
its wake a range of serious socio-economic,
environmental, health and welfare impacts.
Of these impacts, those resulting from urban
air pollution, due to emissions from motor
vehicles among other sources, have been the
focus of considerable public concern and
policy attention (Ilyas, 2007; Aziz and
Bajwa,2007; Aziz and Bajwa,2008; Ghouri
et al, 2007; Alam, et al., 2011;Majid, et al.,
2012b & Ali and Athar, 2010).
Sulfur oxides are one of the most abundant
pollutants (Dwivedi and Shashi, 2012).
Sulfur dioxide (SO2) is one of the major
oxides of sulfur. It is a heavy, pungent,
colorless gas. It forms from the combination
of sulfur from emissions of coal burning
industries and atmospheric oxygen. Sulfur
dioxide is highly reactive and hence is not
cumulative. The maximum residence time is
probably 10 days. Much of the compound
combines with atmospheric water to form
sulfuric acid. Atmospheric sulfuric acid
causes the leaves of plants to turn yellow. It
dissolves limestone and marble, and is
highly corrosive of iron and steel.
SO2 reduces atmospheric visibility and
blocks out sunlight (Yang, et al, 2009). It is
also responsible for decreased wind speed
and temperature in winter due to its
increased concentration (Luvsan, et al.,
2012) thus being contributory factor of
serious repository ailments in urban
environments especially among children
(Smargiassi, et al., 2009; Dockery et al.,
1996). It is a major irritant to the eyes and
respiratory system and is lethal at a few
parts per million. SO2, which is emitted in
direct proportion to the amount of sulfur in
fuel, causes changes in lung function in
persons with asthma and exacerbates
respiratory symptoms in sensitive
individuals (Gasana, 2012; Thriel, et al.
2010 & Koenig, 1999).
Karachi is the capital city of the province of
Sindh, and the largest and thickly populated
(16 millions) city of Pakistan. Located
strategically between 24.750 to 25.656 N
and 66.653 to 67.574 E on the coast of the
Arabian Sea, north-west of the Indus River
delta, it covers an area of 3,600 km² (Fig.1).
High volume of ground traffic in the urban
areas, mostly heavily populated cities acts as
one of the major factors in climate change
and cities including Karachi have observed
an increasing trend in temperature (Alam
and Rabbani 2007; Edmilson et al. 2007; Liu
et al, 2007; Yin et al. 2007; Chung et al.
2004 & Sajjad et al, 2009). Vehicular
smoke, burning of garbage and low greenery
(Azam, et al., 2012) are significant
contributors to the air pollution of Karachi
and one of the prime causes of serious
environmental degradation and henceforth
lung diseases among the population. SO2
concentration has become one of the
essential factors (Naddafiet al.2012) in
accelerating weathering of monuments,
buildings, and other stone and metal
structures (Plate.1).
The current study focuses on the hypothesis
that high traffic volume in Karachi is a
major cause of high SO2 pollution in various
parts of the city. In this scenario, the
objectives of this study are:

Lasbela University Journal of Science and Technology (2013) Vol-2 ISSN 2306-8256
Online available at www.luawms.edu.pk pg. 3
Analysis of 24 hours SO2 data from
selected sample sites of the city.
Identification ofSO2 concentration zones
in Karachi Megapolis.
Demarcation of probable expansion of
SO2 through Minimum Curvature
method.
S h a
h r
a h
– e
– P a
k I
s t a
n
N o r t h e r n
M a n g h o p i r R
d
Landhi
Bin Qasim
Gulshan
Iqbal
New
Karachi
Gulistan
Jauhar
Malir
Cantonment
Quaidabad
S e a V i e w
Rashid M
inhas Rd
Gulshan-e-
Maymar
Industrial Area Rd
Hub R
iver Rd (R
CD
)
PAF
Masroor
Korangi
Creek
– F
a i s
a l
Karachi Port
0 5
kilometers
Mauripur
M a
l i
r
R i
v e
r
M a l i r R i v e r
Arabian
Sea
Arabian Sea
R
i
v e
rL
y
a r
i
S u p e r H i g h w a y
N a t i o n a l H i g h w a y
Defence
Housing
Authority
B y
p a
s s
Korangi Rd
N o
r t h
e r
n
Korangi
Manora
B y
p a s s
1
25
6
26
2028
2
22
3
23
4
57
148
9
1024
27
12 15
13 16
1719 18
21
1. SUPARCO 2. Karimabad 3. Liaquatabad 10 4. Tin Hatti 5. Guru Mandir 6. Old Numaish 7. Garden Road 8. Tibet Center 9.
Maulvi Musafir Khana Road 10. Merewether Tower 11. Shaheen Complex 12. Burns Road 13. Preedy Street 14. Empress
Market 15. Metropole Hotel 16. FTC 17. Teen Talwar 18. Sunset Boulevard & Gizri Road 19. Gizri Road & Punjab Colony
20. Drigh Road 21. KPT 22. North Nazimabad 23. Nazimabad 24. Mauripur Road 25. Sohrab Goth 26. Gulshan Chowrangi
27. Gulbai 28. Maritime Museum
11
Fig 1: Study Area and Sample Sites
SO2 Affected Part Renovated portion
Plate 1: SO2 affected limestone buildings in the study area.

Lasbela University Journal of Science and Technology (2013) Vol-2 ISSN 2306-8256
Online available at www.luawms.edu.pk pg. 4
Due to reported news regarding rapid
growth of chronic diseases and speedy
weathering of limestone constructed
buildings and monuments; the present study
has focused only on SO2 analysis.
MATERIAL AND METHOD
For the present study 28 locations of varied
local activities including traffic density
based on previous study of SUPARCO have
been selected. Air quality samples were
collected during the period of March 2007 to
October 2007 with the help of Sulfur
Dioxide Monitor Z-1300XP equipment.
Various techniques for the scholarly study of
air pollutants have been applied
(Hadjimitsis, 2009; Wald, et al, 2009).
In present study, surface gridding analysis
has been designed, based on Minimum
Curvature method through Mapinfo
Professional 11/ Encom Discover 12. This
technique is widely used for analysis in the
Earth Sciences (Huda et al., 2011; Briggs,
1974; Kurtzman and Kadmon 1999).
Selection of this method is based on its
smoothness of possible surface within the
area of grid analysis. For the purposes of
spatial analysis, this method is fast, effective
and suitable over a wide range of smoothly
varying regional data.
RESULTS AND DISCUSSION
Spatial analysis, one of the basic tenets of
Geography, is a convenient method of
providing an insight into the measurement of
atmospheric pollution of any area. Under
this technique, ambient expansion can be
observed through visual contacts (Fig.2 to
25). Highest concentration of SO2 has been
observed at various places, among which
Guru Mandir, Mauripur, Metropole and
Sohrab Goth have emerged as the most
prominent locations (Fig.2). These areas are
the high traffic volume belts in Karachi
megapolis. Mauripur, located near Karachi
port is the biggest Trailer Truck stand where
hundreds of Trailers are parked and loaded
round the clock. Sohrab Goth, which is one
of the intercity bus terminuses, is another
busiest traffic zone in the study area located
at the urban periphery. Guru Mandir, which
is a junction of heavy and light traffic, is
located in the center of the city. The Hotel
Metropole junction is another crossroad of
light traffic especially for VIP movement in
the megapolis.
Fig.3 shows almost the same result as that of
the previous hour, however, SO2
concentration movement is diverted to other
directions. The area of concentration has
spread out markedly towards the eastern
part. KPT Interchange, gateway of Landhi-
Korangi Industrial area witnesses heavy
traffic after the mid night since the city
traffic law allows heavy traffic only after
that time. Figs.4 and 5 depict similar
concentration zones. In Figs.6 and 7, Preedy
Street and Drigh Road have emerged as new
zones of SO2 concentration. Fig. 8 depicts an
increase in traffic flow in the city and by
7am the coverage of low SO2 concentration
zones shows a marked decrease (Fig.9).
High pollution zones can be observed from
8am to 11am in the southern part of the city
where business offices, trade centers and
other centers of occupational activities are
concentrated, which lead to an increase in
traffic volume (Figs.10 to 13). Figs 14 and
15 reveal that FTC area appears as being a
high SO2 concentration zone, while
concentration in this area further increases at
14:00 and 15:00 hours (Figs. 16 to 17).
In the study area during the late afternoon
hours, except for some locations, high level
of SO2 can be observed in the northern,
eastern, southeastern and western parts. At
16:00 and 17:00 hours, the central part
shows the same pattern of SO2 concentration
(Figs. 18 &19). The level of pollution
concentration shows an increase that extends
Lasbela University Journal of Science and Technology (2013) Vol-2 ISSN 2306-8256
Online available at www.luawms.edu.pk pg. 5
from Empress Market (14) to FTC (16)
areas at this time. Fig. 20 shows the level of
spread of this area further towards
Merewether Tower (10), engulfing Gizri
Road and Punjab Colony areas as well. By
19:00 hours, depicted in Fig. 21, the SO2
zone moves from FTC towards KPT. At this
time Gulshan Chowrangi also emerges as
another high level SO2 zone. By 20:00 hours
(Fig. 22) SO2 high concentration zone
further spreads from Gulshan Chowrangi to
Sohrab Goth by 21:00 hours towards Drigh
Road area, while increase in concentration at
FTC and its neighboring locations are also
recorded (Fig. 23). In the study area, traffic
volume decreases during the night hours
especially between 20:00 and 23:00 hours.
Except for some critical locations, this
pattern is visible in most of the worst traffic
congested areas where level of SO2 falls
during the nighttime. Daily analysis reveals
that SUPARCO and Maritime Museum
locations are zones of least concentration of
SO2, while high concentration zones have
been recorded at Mauripur Road, Guru
Mandir, Sohrab Goth, Merewether Tower,
Empress Market, Drigh Road, FTC, Gulshan
Chowrangi and KPT areas (Figs. 24 &
25).Hourly variation in concentration can be
observed at SUPARCO location from 13:00
to 20:00 hours when volume of vehicle
movement is considerably higher than
during the nighttime to early morning hours
(Fig.26). Maritime museum is another
location of low concentration of SO2, where
hourly observations reveal negligible
variations because the area lies in the
jurisdiction of cantonment administration
and generally public vehicles do not halt
here for a long time; most of them flowing
in a stream (Fig. 27). Preedy Street reveals
marked variation in terms of SO2
concentration round the clock. Being the
busiest trade center of the city, the volume
of traffic is quite high. The building
structures are multistoried, mostly of stone.
Low concentration of SO2 has been recorded
during the late night to early morning hours
(Fig. 28). Tin Hatti has recorded very little
difference round the clock, with consistently
high readings except for a few hours during
late night. The area is mainly residential,
consisting of single story houses. Buses and
cars in thousands ply through this area (Fig.
29).
Concentration of SO2 at Teen Talwar area is
highly varied. Peak hours are 9am to 18:00
hours but from 19:00 to 21:00 hours the
level shows a decrease and retains high
concentration from 22:00 to 00:00 hours.
This area is a high class residential area of
the megapolis, yet the peaks of SO2 during
late night hours are much higher as
compared to that of working hours (Fig. 30).
The peak hours of SO2 concentration at
Gulshan Chowrangi area is between 18:00 to
00:00 hours (Fig. 31) because of heavy
traffic due to the presence of marriage halls.
Social functions in the megapolis are
arranged mainly during the nighttime, after
working hour’s business activities in that
area then for extend even till late hours i.e.,
22:00 hours. At Maulvi Musafir Khana SO2
concentration can be observed at a low level
during midnight to early morning (Fig. 32).
Empress Market is a purely trading area
where high level concentration of SO2 has
been recorded during 17:00 to 23:00 hours
during which worst traffic congestion is a
common sight (Fig. 33). Ghizri Road and
Punjab Colony’s location portray almost
same picture as that of Empress Market (Fig.
34). High level concentration hours at Tibet
Center location are 18:00 to 00:00 hours
(Fig. 35). Old Nomaish is another location
where concentration level increases
gradually from 12:00 to 20:00 hours and
then rapidly between 21:00 to 00:00 hours
(Fig. 36). SO2 concentration reveals
remarkable variation at Merewether Tower
with reference to 24 hours data. Peak hours
can be in the study area during the late

Lasbela University Journal of Science and Technology (2013) Vol-2 ISSN 2306-8256
Online available at www.luawms.edu.pk pg. 6
afternoon hours. Except for some locations,
high level of SO2 can be observed between
13:00 and 14:00 hours and between 18:00
and 20:00 hours, the peak being recorded at
19:00 hours. Subsequently it drops between
21:00 and 23:00 hours (Fig. 37). Gulbai
peak hours started from 11am and gradually
increased till 17:00 hours while the peak has
been recorded at 18:00 hours. Decreasing
trend is visible from 19:00 hours till 8:00 am
(Fig. 38).
Shaheen Complex shows great variation
between morning and night hours in terms
of SO2 concentration. Lowest volume has
been recorded at 6am, which subsequently
shows gradual increase, dropping one again
at 13:00 hours. Peak hours are 20:00 to
21:00 hours and decreasing trend
commences from 21:00 hours, while
concentration reveals sinking trend till early
morning (Fig. 39). Garden area is a highly
congested area with reference to traffic
volume, and SO2 concentration level
increases between 20:00 to 00:00 hours.
14:00 hour records peak SO2 concentration
probably because of traffic rush due to
plying of school vans, which plays a
significant role in traffic congestion (Fig.
40). In Burns road area, level of
concentration trend has been observed to be
a little different from other locations because
high SO2 concentration has been recorded
even during the fore noon and afternoon
times (Fig. 41). Boulevard and Gizri area
depicts very interesting variation regarding
SO2 concentration where decreasing trends
start from midnight to early morning.
Subsequently, increasing trend commences
from 7:00 to 14:00 hours. Another decreased
trend can be observed from 15:00 to 17:00
hours, while a repeated increase from 20:00
to 00:00 hours is visible. This increased
phenomenon is a real picture of traffic
trends of this location (Fig. 42).
SO2concentration is constant but at a lower
level at Karimabad. Increased peaks can be
observed between 12:00 and 14:00 hours
and between 17:00 to 22:00 hours (Fig.
43).Hourly variation in concentration can be
observed at SUPARCO location from 13:00
to 20:00 hours when volume of vehicle
movement is considerably higher than
during the nighttime to early morning hours
(Fig.26). Maritime museum is another
location of low concentration of SO2, where
hourly observations reveal negligible
variations because the area lies in the
jurisdiction of cantonment administration
and generally public vehicles do not halt
here for a long time; most of them flowing
in a stream (Fig. 27). Preedy Street reveals
marked variation in terms of SO2
concentration round the clock. Being the
busiest trade center of the city, the volume
of traffic is quite high. The building
structures are multistoried, mostly of stone.
Low concentration of SO2 has been recorded
during the late night to early morning hours
(Fig. 28). Tin Hatti has recorded very little
difference round the clock, with consistently
high readings except for a few hours during
late night. The area is mainly residential,
consisting of single story houses. Buses and
cars in thousands ply through this area (Fig.
29).
Concentration of SO2 at Teen Talwar area is
highly varied. Peak hours are 9am to 18:00
hours but from 19:00 to 21:00 hours the
level shows a decrease and retains high
concentration from 22:00 to 00:00 hours.
This area is a high class residential area of
the megapolis, yet the peaks of SO2 during
late night hours are much higher as
compared to that of working hours (Fig.
30).The peak hours of SO2 concentration at
Gulshan Chowrangi area is between 18:00 to
00:00 hours (Fig. 31) because of heavy
traffic due to the presence of marriage halls.

Lasbela University Journal of Science and Technology (2013) Vol-2 ISSN 2306-8256
Online available at www.luawms.edu.pk pg. 7
NNN
Fig.2, 00:00 hours Fig.3, 1:00AM
Fig.4, 02:00 hours Fig.5, 03:00 hours
Fig.6, 04:00 hours Fig.7, 05:00 hours
Fig.8, 06:00 hours Fig.9, 07:00 hours
1. SUPARCO 2. Karimabad 3. Liaquatabad 10 4. Tin Hatti 5. Guru Mandir 6. Old Numaish 7. Garden Road 8.
Tibet Center 9. Maulvi Musafir Khana Road 10. Merewether Tower 11. Shaheen Complex 12. Burns Road 13.
Preedy Street 14. Empress Market 15. Metropole Hotel 16. FTC 17. Teen Talwar 18. Sunset Boulevard & Gizri
Road 19. Gizri Road & Punjab Colony 20. Drigh Road 21. KPT 22. North Nazimabad 23. Nazimabad 24. Mauripur
Road 25. Sohrab Goth 26. Gulshan Chowrangi 27. Gulbai 28. Maritime Museum
1
26
25
2028
22
2
3
23
4
5
6
14
7
138
211819
17
16
1511
129
10
24
27
1
26
25
2028
22
2
3
23
4
5
6
14
7
138
211819
17
16
1511
129
10
24
27
1
26
25
2028
22
2
3
23
4
5
6
14
7
138
211819
17
16
1511
129
10
24
27
1
26
25
2028
22
2
3
23
4
5
6
14
7
138
211819
17
16
1511
129
10
24
27
1
26
25
2028
22
2
3
23
4
5
6
14
7
138
211819
17
16
1511
129
10
24
27
1
26
25
2028
22
2
3
23
4
5
6
14
7
138
211819
17
16
1511
129
10
24
27
1
26
25
2028
22
2
3
23
4
5
6
14
7
138
211819
17
16
1511
129
10
24
27
1
26
25
2028
22
2
3
23
4
5
6
14
7
138
211819
17
16
1511
129
10
24
27
Sulphur Dioxide Concentration at different hours of the day-Karachi
Social functions in the megapolis are
arranged mainly during the nighttime, after
working hour’s business activities in that
areas then for extend even till late hours i.e.,
22:00 hours. At Maulvi Musafir Khana SO2
concentration can be observed at a low level
during midnight to early morning (Fig. 32).
Lasbela University Journal of Science and Technology (2013) Vol-2 ISSN 2306-8256
Online available at www.luawms.edu.pk pg. 8
Empress Market is a purely trading area
where high level concentration of SO2 has
been recorded during 17:00 to 23:00 hours
during which worst traffic congestion is a
common sight (Fig. 33). Ghizri Road and
Punjab Colony’s location portray almost
same picture as that of Empress Market (Fig.
34). High level concentration hours at Tibet
Center location are 18:00 to 00:00 hours
(Fig. 35). Old Nomaish is another location
where concentration level increases
gradually from 12:00 to 20:00 hours and
then rapidly between 21:00 to 00:00 hours
(Fig. 36). SO2 concentration reveals
remarkable variation at Merewether Tower
with reference to 24 hours data. Peak hours
can be in the study area during the late
afternoon hours. Except for some locations,
high level of SO2 can be observed between
13:00 and 14:00 hours and between 18:00
and 20:00 hours, the peak being recorded at
19:00 hours. Subsequently it drops between
21:00 and 23:00 hours (Fig. 37). Gulbai
peak hours started from 11am and gradually
increased till 17:00 hours while the peak has
been recorded at 18:00 hours. Decreasing
trend is visible from 19:00 hours till 8:00 am
(Fig. 38).
Shaheen Complex shows great variation
between morning and night hours in terms
of SO2 concentration. Lowest volume has
been recorded at 6am, which subsequently
shows gradual increase, dropping one again
at 13:00 hours. Peak hours are 20:00 to
21:00 hours and decreasing trend
commences from 21:00 hours, while
concentration reveals sinking trend till early
morning (Fig. 39). Garden area is a highly
congested area with reference to traffic
volume, and SO2 concentration level
increases between 20:00 to 00:00 hours.
14:00 hour records peak SO2 concentration
probably because of traffic rush due to
plying of school vans, which plays a
significant role in traffic congestion (Fig.
40). In Burns road area, level of
concentration trend has been observed to be
a little different from other locations because
high SO2 concentration has been recorded
even during the fore noon and afternoon
times (Fig. 41). Boulevard and Gizri area
depicts very interesting variation regarding
SO2 concentration where decreasing trends
start from midnight to early morning.
Subsequently, increasing trend commences
from 7:00 to 14:00 hours. Another decreased
trend can be observed from 15:00 to 17:00
hours, while a repeated increase from 20:00
to 00:00 hours is visible. This increased
phenomenon is a real picture of traffic
trends of this location (Fig. 42). SO2
concentration is constant but at a lower level
at Karimabad. Increased peaks can be
observed between 12:00 and 14:00 hours
and between 17:00 to 22:00 hours (Fig.
43).North Nazimabad shows smooth traffic
flow between 1am to 10am. The SO2 level
increases at 19:00 hours and subsequently
decreases between19:00 hours till midnight
(Fig. 44). KPT Interchange is another
location of excessive traffic in the
megapolis. Throughout the day, SO2
concentration level at this location can be
observed as being exceedingly high. KPT
being the gateway to the highly populated
areas of Landhi and Korangi, including
Landhi-Korangi Industrial Zone, is the
junction of both light and heavy vehicular
traffic (Fig. 45).

Lasbela University Journal of Science and Technology (2013) Vol-2 ISSN 2306-8256
Online available at www.luawms.edu.pk pg. 9
Fig.10, 08:00 hours Fig.11, 09:00 hours
Fig.12, 10:00 hours Fig.13, 11:00 hours
Fig.14, 12:00 hours Fig.15, 13:00 hours
Fig.16, 14:00 hours Fig.17, 15:00 hours
1
26
25
2028
22
2
3
23
4
5
6
14
7
138
211819
17
16
1511
129
10
24
27
1
26
25
2028
22
2
3
23
4
5
6
14
7
138
211819
17
16
1511
129
10
24
27
1
26
25
2028
22
2
3
23
4
5
6
14
7
138
211819
17
16
1511
129
10
24
27
1
26
25
2028
22
2
3
23
4
5
6
14
7
138
211819
17
16
1511
129
10
24
27
1
26
25
2028
22
2
3
23
4
5
6
14
7
138
211819
17
16
1511
129
10
24
27
1
26
25
2028
22
2
3
23
4
5
6
14
7
138
211819
17
16
1511
129
10
24
27
1
26
25
2028
22
2
3
23
4
5
6
14
7
138
211819
17
16
1511
129
10
24
27
ppb ppb
ppb ppb
ppb ppb
ppb ppb
1. SUPARCO 2. Karimabad 3. Liaquatabad 10 4. Tin Hatti 5. Guru Mandir 6. Old Numaish 7. Garden Road 8.
Tibet Center 9. Maulvi Musafir Khana Road 10. Merewether Tower 11. Shaheen Complex 12. Burns Road 13.
Preedy Street 14. Empress Market 15. Metropole Hotel 16. FTC 17. Teen Talwar 18. Sunset Boulevard & Gizri
Road 19. Gizri Road & Punjab Colony 20. Drigh Road 21. KPT 22. North Nazimabad 23. Nazimabad 24.
Mauripur Road 25. Sohrab Goth 26. Gulshan Chowrangi 27. Gulbai 28. Maritime Museum
Sulphur Dioxide Concentration at different hours of the day-Karachi
1
26
25
2028
22
2
3
23
4
5
6
14
7
138
211819
17
16
1511
129
10
24
27

Lasbela University Journal of Science and Technology (2013) Vol-2 ISSN 2306-8256
Online available at www.luawms.edu.pk pg. 10
Fig.18, 16:00 hours Fig.19, 17:00 hours
Fig.20, 18:00 hours Fig.21, 19:00 hours
Fig.22, 20:00 hours Fig.23, 21:00 hours
Fig.24, 22:00 hours Fig.25, 23:00 hours
1
26
25
2028
22
2
3
23
4
5
6
14
7
138
211819
17
16
1511
129
10
24
27
1
26
25
2028
22
2
3
23
4
5
6
14
7
138
211819
17
16
1511
129
10
24
27
1
26
25
2028
22
2
3
23
4
5
6
14
7
138
211819
17
16
1511
129
10
24
27
1
26
25
2028
22
2
3
23
4
5
6
14
7
138
211819
17
16
1511
129
10
24
27
1
26
25
2028
22
2
3
23
4
5
6
14
7
138
211819
17
16
1511
129
10
24
27
1
26
25
2028
22
2
3
23
4
5
6
14
7
138
211819
17
16
1511
129
10
24
27
1
26
25
2028
22
2
3
23
4
5
6
14
7
138
211819
17
16
1511
129
10
24
27
1
26
25
2028
22
2
3
23
4
5
6
14
7
138
211819
17
16
1511
129
10
24
27
ppb ppb
ppb ppb
ppb ppb
ppb ppb
1. SUPARCO 2. Karimabad 3. Liaquatabad 10 4. Tin Hatti 5. Guru Mandir 6. Old Numaish 7. Garden Road 8.
Tibet Center 9. Maulvi Musafir Khana Road 10. Merewether Tower 11. Shaheen Complex 12. Burns Road 13.
Preedy Street 14. Empress Market 15. Metropole Hotel 16. FTC 17. Teen Talwar 18. Sunset Boulevard & Gizri
Road 19. Gizri Road & Punjab Colony 20. Drigh Road 21. KPT 22. North Nazimabad 23. Nazimabad 24. Mauripur
Road 25. Sohrab Goth 26. Gulshan Chowrangi 27. Gulbai 28. Maritime Museum
Sulphur Dioxide Concentration at different hours of the day-Karachi

Lasbela University Journal of Science and Technology (2013) Vol-2 ISSN 2306-8256
Online available at www.luawms.edu.pk pg. 11
Fig. 27, Maritime Museum Fig. 28, Preedy Street Fig. 29 , Tin Hatti
1 23
4
5
6
7
8
9
10
11121314
15
16
17
18
19
20
21
22
2324
0
10
15
5
1 23
4
5
6
7
8
9
10
11121314
15
16
17
18
19
20
21
2223
24
0
5
10
15
20
Peak and Slack Levels of SO2 Round the Clock at different Samples Sites - Karachi
Fig. 26 , SUPARCO
4
1 23
4
5
6
7
8
9
10
11121314
15
16
17
18
19
20
21
22
232412
8
0
ppb 1 23
4
5
6
7
8
9
1011
12131415
16
17
18
19
20
21
2223
24
0
10
20
30
1 2
34
5
6
7
8
9
10
11121314
15
16
17
18
19
20
21
2223
24
0
10
20
30
40
Fig. 31, Gulshan Chowrangi
0
10
20
301
23
4
5
6
7
8
9
10
11121314
15
16
17
18
19
20
21
2223
24 1 23
4
5
6
7
8
9
10
11121314
15
16
17
18
19
20
21
2223
24
0
10
20
30
40
Fig. 33, Empress MarketFig. 32, M Musafir Khana
12
34
5
6
7
8
9
1011
12131415
16
17
18
19
20
21
2223
24
0
10
20
30
Fig. 30, Teen Talwar
Fig. 43, Karimabad Fig. 42,Boulevard & Gizri Fig. 44, North Nazimabad Fig. 45, KPT
0
5
10
15
20
251 2
34
5
6
7
8
9
1011
12131415
16
17
18
19
20
21
2223
24
0
10
20
30
401 2
34
5
6
7
8
9
1011
12131415
16
17
18
19
20
21
2223
24
0
10
20
30
401 2
34
5
6
7
8
9
1011
12131415
16
17
18
19
20
21
2223
24
0
10
20
301 2
34
5
6
7
8
9
1011
12131415
16
17
18
19
20
21
2223
24
Fig. 41, Burns Road
0
10
20
30
401 2
34
5
6
7
8
9
1011
12131415
16
17
18
19
20
21
2223
24
0
5
10
15
20
251 2
3
4
5
6
7
8
9
1011
12131415
16
17
18
19
20
21
2223
24
Fig. 40, Garden RoadFig.39, Shaheen Complex
0
10
20
30
401 2
3
4
5
6
7
8
9
1011
12131415
16
17
18
19
20
21
22
2324
0
10
20
30
401 2
3
4
5
6
7
8
9
1011
12131415
16
17
18
19
20
21
2223
24
Fig.38, Gulbai
.
Fig. 35, Tibat Center ColonyFig. 34, Ghizri Rd &Punjab Colony Fig. 37, Merewether Tower
1 23
4
5
6
7
8
9
1011
12131415
16
17
18
19
20
21
2223
24
0
10
20
30 1 23
4
5
6
7
8
9
10
11121314
1516
17
18
19
20
21
22
2324
0
10
20
30
40
Fig. 36, Nomaish
1 23
4
5
6
7
8
9
1011
12131415
16
17
18
19
20
21
22
2324
0
10
20
30
401
23
4
5
6
7
8
9
10
11121314
1516
17
18
19
20
21
22
2324
0
5
10
15
20
25

Lasbela University Journal of Science and Technology (2013) Vol-2 ISSN 2306-8256
Online available at www.luawms.edu.pk pg. 12
Fig.51, Metropole Hotel Fig.53, Guru Mandir
Fig. 47, Drigh Road Fig. 49, Nazimabad
0
10
20
30
401
23
4
5
6
7
8
9
1011
1213
1415
16
17
18
19
20
21
2223
24
0
10
20
30
401 2
34
5
6
7
8
9
1011
12131415
16
17
18
19
20
21
2223
24
0
10
20
30
401 2
34
5
6
7
8
9
1011
12131415
16
17
18
19
20
21
2223
24
0
5
10
15
20
25
301 2
34
5
6
7
8
9
1011
12131415
16
17
18
19
20
21
2223
24
Fig. 46, FTC Fig. 48, Liaquatabad 10
0
10
20
301 2
34
5
6
7
8
9
1011
12131415
16
17
18
19
20
21
2223
24
0
10
20
301 2
34
5
6
7
8
9
1011
12131415
16
17
18
19
20
21
2223
24
0
10
20
30
401
23
4
5
6
7
8
9
1011
12131415
16
17
18
19
20
21
2223
24
0
10
20
30
401
23
4
5
6
7
8
9
1011
12131415
16
17
18
19
20
21
2223
24
Fig. 50, Sohrab Goth Fig. 52, Mauripur Road
ppb
FTC shows high SO2 concentration
variations round the clock. During midnight
to early morning the level is considerably
decreased, while concentration increasing
trend can be observed between 7:00 and
13:00 hours. Peak hours are 13:00 and 19:00
hours till 20:00 hours, which is in
accordance the with traffic flow on this road
(Fig. 46). Sohrab Goth depicts more or less
constant values between 15 and 17ppb
during03:00 to 10:00 hours and highest peak
at noon from 11:00 hours and then gradually
increases to a peak of 27ppb around 12
noon. During the night hours especially at
21:00 hours, highest concentration level of
the day i.e. approximately 29 ppb has been
recorded (Fig. 50). Metropole Hotel, where
most of the traffic consists of new and old
cars, have recorded high level of
concentration during the working hours i.e.,
09:00 till 20:00 hours. Lowered SO2
concentration has been recorded between
early morning 03:00 and 07:00 hours (Fig.
51). Mauripur Road showed a marked drop
in concentration level of SO2 during late
night hours i.e., 00:00 hours and afternoon
time i.e.,16:00 to19:00 hours (Fig. 52).
Observations of SO2 concentration at Guru
Mandir round the clock, showed a notable
variation. Peak readings have been recorded
at 03:00, 12:00,16:00, 18:00 and 21:00
hours around 30ppb and highest at 21:00
hours, more than 30ppb (Fig.53).
According to WHO (2006) guidelines
regarding air quality on the basis of 24
hours mean data, except for SUPARCO, all
locations in the study area record high
concentration of SO2 (Fig. 54). Burns Road
has recorded highest concentration due to
high volume of traffic and congestion of
surrounding buildings. The area is also
known as Food Street, where hundreds of
people come for lunch and dinner. During
11:00 to 00:00 hours Burns Road is one of
the busiest locations in terms of people’s
activities in the study area. Guru Mandir,
Mauripur and FTC are areas with second
highest SO2 concentration, where traffic
keeps flowing round the clock.

Lasbela University Journal of Science and Technology (2013) Vol-2 ISSN 2306-8256
Online available at www.luawms.edu.pk pg. 13
Study Area 24 hours mean
Gu
ru M
an
dir
SU
PA
RC
O
Mari
tim
e M
use
um
Pre
ed
y S
treet
Tin
Hatt
i
Teen
Talw
ar
Gu
lsh
an
Ch
ow
ran
gi
Mu
safi
r K
han
a R
oad
Em
pre
ss M
ark
et
Giz
ri R
oad
Tib
et
Cen
ter
Old
Nu
mais
h
Mere
weth
er
To
wer
Gu
lbai
Sh
ah
een
Co
mp
lex
Gard
en
Ro
ad
Bu
rns
Ro
ad
Su
nse
t B
ou
lev
ard
Kari
mab
ad
No
rth
Nazim
ab
ad
KP
T
FT
C
Dri
gh
Ro
ad
Lia
qu
ata
bad
10
Nazim
ab
ad
So
hra
b G
oth
Metr
op
ole
Ho
tel
Mau
rip
ur
Ro
ad
0
10
20
30
40
50
60
70
80(u
g/m
3)
SO
2C
on
cen
trati
on
WHO 24 hours mean
Fig 54: SO2 concentration in Study Area and WHO 24 hours mean
CONCLUSION
Karachi megapolis, aspiring to become a
World Class City, can least afford a polluted
environment. Institutions, both in the public
as well as private sectors, must be revamped
with resources and skills necessary to
control vehicular emissions. With reference
to third world countries, in view of financial
constraints, such measures must be cost
effective in order to ensure success. This
may be possible by extending attractive
incentives to both individual and firms, and
by promoting and adopting advance and
cleaner technologies and fuels. This will go
a long way in achieving a millennium goal,
i.e. improving environmental quality, an
inherent part of quality of life.
REFERENCES
Alam, K, Blaschke T, Madl P, Mukhtar A,
Hussain M., 2011, Aerosol size
distribution and mass concentration
measurements in various cities of
Pakistan : Journal of Environmental
Monitoring 13:1944-52.
Alam, M and Rabbani G.MD., 2007,
Vulnerabilities and responses to
climate change for Dhaka: Environ
Urban 19(1):81–97.
Ali, M., Athar, M., 2010, Impact of transport
and industrial emissions on the
ambient air quality of Lahore City,
Pakistan: Environmental Monitoring
Assessment. 171:353-63.

Lasbela University Journal of Science and Technology (2013) Vol-2 ISSN 2306-8256
Online available at www.luawms.edu.pk pg. 14
Azam, M., Safi, M and Burke, F.,
2012,Impact of open green spaces on
quality of life a case study of Kiamari
Town – Karachi: The Research Journal
of Sciences and Technology
3(1&2):35-46.
Aziz, A., Bajwa IU., 2007,Minimizing
human health effects of urban air
pollution through quantification and
control of motor vehicular carbon
monoxide (CO) in Lahore:
Environmental Monitoring
Assessment; 135:459-64.
Aziz, A, BajwaIU., 2008, Erroneous mass
transit system and its tended
relationship with motor vehicular air
pollution (an integrated approach for
reduction of urban air pollution in
Lahore: Environmental Monitoring
Assessment. 137:25-33.
Bell, M.L., Dominici F., Ebisu K., Zeger
S.L., Samet J.M., 2007, Spatial and
temporal variation in PM2.5 chemical
composition in the United States for
health effects studies: Environmental
Health Perspective 115(7):989–995.
Briggs, I. C. (1974), Machine Contouring
Using Minimum Curvature,
Geophysics, 39(1): 39-48.
Chung, Y-S, Yoon M-B, KimH-S (2004)On
climate variations and changes
observed in South Korea. Clim Change
66:151–161.
Dockery, D.W., Cunningham, J., Damokosh,
A.L., Neas, L.M., John D. Spengler,
J.D., Koutrakis, P., Ware, J.H.,
Raizenne, M and Speizer, F.E 1996,
Health Effects of Acid Aerosols on
North American Children: Respiratory
Symptoms: Environmental Health
Perspectives, 104(5): 500-505.
Dwivedi, A.K. andShashi 2012, Ambient air
sulphur dioxide and sulphate
accumulation in deciduous and
evergreen plants: Journal of
Environmental Biology, 33:1-3.
Edmilson, F.D., Christopher, R.M., William
C. R and Pedro S.L, 2007, Interactions
of an urban heat island and sea-breeze
circulations during winter over the
metropolitan area of São Paulo, Brazil:
Boundary-Layer Meteorol 122(1):43–
65.
Gasana , J., Dillikar, D., Mendy, A., Forno,
E., Vieira, E.R., 2012, Motor vehicle
air pollution and asthma in children: a
meta-analysis, Environmental
Research, 117: 36-45.
Ghauri, B, Lodhi, A., Mansha, M., 2008,
Development of baseline (air quality)
data in Pakistan: Environmental
Monitoring Assessment. 127:237-52.
Gorham, R., 2002,Air pollution from ground
transportation: an assessment of
causes, strategiesand tactics, and
proposed actions forthe international
community, The Global Initiative on
Transport Emissions A Partnership of
the United Nations and the World
Bank, Division for Sustainable
Development, Department of
Economic and Social Affairs, United
Nations.
Hadjimitsis, D.G., 2009, Aerosol optical
thickness (AOT) retrieval over land
using satellite image-based algorithm:
Air Quality Atmosphere and Health,
2:89–97.

Lasbela University Journal of Science and Technology (2013) Vol-2 ISSN 2306-8256
Online available at www.luawms.edu.pk pg. 15
Huda, S.N., Burke, F., Miandad , M. and
Rana, M.N., 2011, Analysis of
National Assembly 55-Rawalpindi
Franchise: An Electoral GIS
Perspective of Pakistan: The Research
Journal of Sciences and Technology,
2(1&2):35-48.
Ilyas, S.Z., 2007,A review of Transport and
Urban Air Pollution in Pakistan: J.
Appl. Sci. Environ. Manage.
11(2):113-121.
Koenig, J.Q., 1999, Air pollution and
asthma, Journal of Allergy and
Clinical Immunology, 104(4): 717-
722.
Kurtzman. D., and Kadmon, R.,
1999,Mapping of temperature
variables in Israel: a comparison of
different interpolation methods:
Climate Research, 13: 33-43.
Liu, W, Ji .C.,Zhong J., Jiang X., Zheng Z.,
2007, Temporal characteristics of the
Beijing urban heat island: Theor. Appl.
Climatol. 87:213–221.
Luvsan, M., Shie, R., Purevdorj, T.,
Badarch, L., Baldorj, B., Chan, C.,
2012.,The influence of emission
sources and meteorological conditions
on SO2 pollution in Mongolia:
Atmospheric Environment, 61:542-
549.
Majid, H., Alam, K., Madl, P & Hofmann,
W., 2012, Exposure assessment and
associated lung deposition calculations
for vehicular exhaust in four
metropolitan cities of Pakistan:
Environmental Monitoring
Assessment.
Miranda, R.G., Fatima, A. M., Fornaro, A.,
Astolfo, R., Andre, P.A. and Saldiva,
P, 2012, Urban air pollution: a
representative survey of PM2.5 mass
concentrations in six Brazilian cities:
Air Quality Atmosphere and Health,
5:63–77.
Naddafi, K., Hassanvand, S.H., Yunesian,
M., Momeniha, F., Nabizadeh, R.,
Faridi, S and Gholampour, A., 2012,
Health impact assessment of air
pollution in megacity of Tehran,
Iran.:Iranian Journal of Environmental
Health Sciences & Engineering, 9:28-
34.
Sajjad, S.H., Hussain, B., Khan, M. A.,
Raza, A., Zaman, B and Ahmed, I.,
2009, On rising temperature trends of
Karachi in Pakistan: Climatic Change,
96:539–547.
Sivaramasundaram, K., and
Muthusubramanian , P., 2010, A
preliminary assessment of PM10 and
TSP concentrations in Tuticorin, India,
Air Quality Atmosphere and Health,
3:95–102.
Smargiassi, A., Kosatsky, T., Hicks, J.,
Plante, C., Armstrong, B., Villeneuve,
P.J., Goudreau, S., 2009, Risk of
asthmatic episodes in children exposed
to sulfur dioxide stack emissions from
a refinery point source in Montreal,
Canada: Environ. Health. Prospect,
117(4):653-659.
Tiwari, V., Hanai, Y and Masunaga, S.,
2010, Ambient levels of volatile
organic compounds in the vicinity of
petrochemical industrial area of
Yokohama, Japan: Air Quality
Atmosphere and Health, 3:65–75.

Lasbela University Journal of Science and Technology (2013) Vol-2 ISSN 2306-8256
Online available at www.luawms.edu.pk pg. 16
Viana, M, Querol X, Alastuey A., 2006,
Chemical characterization of PM
episodes in North-Eastern Spain:
Chemosphere 62:947–956.
Wald, L, Basly L, Balleynaud, J.M., 1999,
Satellite data for the air pollution
mapping. Proceedings of the 18th
EARseL symposium on operational
sensing for sustainable development
(Enschede, Netherlands, 11–14 May
1998) edited by Nieeuwenhuis, G.J.A,
Vaugham, R.A., Molenaar, M.: 133–
139.
WHO-World Health Organization, 2006, Air
quality guidelines, global updates
2005: particulate matter, ozone,
nitrogen dioxide and sulphur dioxide.
Germany; chap. 10:217–305.
Yang, S., Yuesi, W., and Changchun, Z,
2009, Measurement of the vertical
profile of atmospheric SO2 during the
heating period in Beijing on days of
high air pollution Atmospheric
Environment, 43(2):468-472.
Yin, D, Zhiqing X, Yan Z, Yafeng S,
Jingang W., 2007, Impact of urban
expansion on regional temperature
change in the Yangtze River Delta: J
Geogr. Sci. 17(4):387–398.

Lasbela University Journal of Science and Technology (2013) Vol-2 ISSN 2306-8256
Online available at www.luawms.edu.pk pg. 17
GEOLOGICAL SCIENCES
RESEARCH ARTICLE
Integrated geological and geophysical research on Lava effusion in
Ziarat, Balochistan, Pakistan
Asif Nazeer Rana, Muhammad Saeed, Mehtab- ur- Rahman and Syed Ali Abbas
Geosciences Advance Research Labs, Geological Survey of Pakistan, Park Road, Shehzad
Town, Islamabad
__________________________________________________________________________
ABSTRACT
The geological and tectonic legacy of Balochistan has endowed it with massive mountain belts
and arcs, syntaxes as characterized by severe bending of the mountain belts from the ongoing
convergence of the Indo-Pakistan, Eurasian and Arabian plates. The Province is a seismically
active and tectonically unstable region. The eruptive/effusive vent activity on 27th
January
2010 at the Tor Zawar Mountain at Sari, Ziarat is a unique testimony, substantiating the earlier
risk/hazard findings of the area, as no previous post-Tertiary volcanic activity has ever been
reported earlier in the history of the Indo-Pak Subcontinent. Integrated geological and
geophysical surveys were undertaken during January-April 2010 to investigate the short lived
toothpaste lava to map, detect and delineate the changes resulting in the sub surface litho
logical and structural disposition at the vent site. A holistic approach is adopted for the
interpretation and analyses of the Total magnetic field intensity, Electrical resistivity and
Ground penetration radar surveys along with the geology, petrography and the geochemical
analyses of the molten material, which are presented along with a probable model. Keywords: Lava effusion, Ziarat, Balochistan, magnetic survey, Ground Penetrating Radar
Correspondence: Asif Nazir Rana
Address: Geosciences Advance Research Labs, Geological Survey of Pakistan, Park Road, Shehzad
Town, Islamabad
Email: [email protected]
Phone: +92-051- 9255137 Fax: +92-051- 9255136
Received: 25July 2013 Revised: 08 September 2013 Accepted : 08 September 2013
Copyright: ©2013 Rana et al. This is an open-access article distributed under the terms of the Creative
Commons Attribution License, which permits unrestricted use, distribution, and reproduction in any
medium, provided the original author and source are credited
Competing Interests: The authors have declared that no competing interests exist.
____________________________________________________________________________
The synthesis of the magnetic, resistivity
soundings and profiling and ground
penetration radar survey indicate the presence
of highly magnetic dual lobe sources,
resistive and prominent reflectors from the
radar soundings in and around the vent site.

Lasbela University Journal of Science and Technology (2013) Vol-2 ISSN 2306-8256
Online available at www.luawms.edu.pk pg. 18
The resistivity pseudo sections delineate the
lateral and vertical molten flows which have
apparently solidified at shallow depth. The
GPR mapping due to ideal ground conditions
has optimum penetration with high definition
reflector topography, internal scatterers and
hyperbolas. The radar imaging explicitly
shows folding of the overlying fine grained
classics, whereas fracturing in the compact,
hard and brittle rock units of compact
gravels/limestone and volcanics due to the
pressure exerted by the intrusion.
The geological map of the study area
characterizes the presence of older volcanic
rocks which are remnants of past volcanic
episodes. Lava effusion appears as an
interactive play and involvement of the older
volcanics, ascending magma from depth and
dual tectonic-magmatism generating the
eruptive activity. The epicentral/focal locations
and migration of the past and present events in
the area strongly suggest the role of regional
tectonics and a positive connectivity of the
weaker Sibi Re - entrant, Quetta -Kalat fault
zone and the Quetta Transverse zone.
INTRODUCTION
An outpouring of molten material was
reported from Tor Zawar Mountain near Wam
which is about 90 km from Quetta and 36 km
from Ziarat on the main Quetta-Ziarat road
(Fig.A). Ziarat and Harnai areas have a known
seismic history. The name Wam (Wham)
locally means fear of the unknown and the
village was razed to the ground more than
once in the past. Wam was the worst affected
village in the doublet earthquake of 6.4M of
2008 which, was felt over a large area in
Balochistan.
Earthquake events as documented from 8th
to
27th
January 2010 indicate the epicentral
locations of the isolated events of January
2010, appear to be linked events resulting in
the main event of 27th
January, although the
counter clockwise focus have large spatial
separation probably caused by dual level
seismicity as substantiated by the focal depth
of the events varying from 10–60 Km. It is
reckoned that intense and major rock
deformation of sizeable dimension in the area
has taken place.
The present unique volcanic activity
probably enacted by nature after a span of
many millennia in this area provided a
surface thumb print warranting massive
research and follow up exploratory work in
continuity to allay the apprehensions,
concern and fear for the safety and security
of the people.
It is hoped that investigation at the vent site
would probably be a prelude for further
studies by the academic research and
professional public and private sector
institutes and other stakeholders.
Tectonic setting & general geology
The area lies between the active regional
Bibai and Gogai thrusts. The geological map
of the study area characterizes the presence
of older volcanic rocks which are remnants of
past volcanic episodes. The Urghargai fault
northwest of Ziarat is a right lateral wrench
fault which has horizontally displaced the
rock formations comprising the Bibai and
Gogai nappes by more than 2000 ft. This
particular lineament which runs for nearly 40
km in the NNW-SSE direction without any
trace of surface rupture may have been
reactivated in 2008 Gogai Earthquake.
However the origin of the magmatic/
hydrothermal solution from depth associated
with the regional concealed fault at the
moment is somewhat speculative.
Ziarat District is roughly a rectangular piece
of mountainous country comprising several
scenic valleys and is famous for its cool
climate and one of the world’s largest and
oldest Junipers forests. The altitude ranges
from 1, 800 to 3, 488 m.

Lasbela University Journal of Science and Technology (2013) Vol-2 ISSN 2306-8256
Online available at www.luawms.edu.pk pg. 19
Sedimentary rocks ranging in age from
Triassic to Quaternary are well exposed in
the Kach Ziarat area in the following
sequence (A. H Kazmi, 1979).
Fig A. Index Map of Pakistan Showing Study Area, Fig B. Geological Map of the Area

Lasbela University Journal of Science and Technology (2013) Vol-2 ISSN 2306-8256
Online available at www.luawms.edu.pk pg. 20
Geological investigations
The viscous lava flow was observed to
advance down slope for 8 meters reaching near
the foundation of an electric pylon and its
earth wire line. The high tension electricity
wires and earth support were found damaged
and cut off. Ruling out any possibility of
electric short circuiting from the nearby pylon
or thunder bolt/lightening striking at the pole
and absorbed into the subsurface, eruption of
lava was investigated in detail.
The erupted molten material (lava, scoria and
volcanic glass) was found to be cold and
solidified on the surface of the concentric
layers but underneath the viscous sheet of
molten material, the ground was still hot and
burning. Highly porous and crusty lava flow
showing vesicular structure had formed due to
escaping gases. Lava tubes and chambers were
formed when the surface of a basalt flow
highly charged with gas crystallized and still
molten lava within continued to move up.
Walking on cooled deposits of this lava was
similar to walking on crusted snow as the
viscous basaltic lava flow had developed ropy
surfaces like Pahoehoe-Hawaiin type lava
(Swanson, D.A., 1973). The glassy frot–scoria,
pea size globules-lapilli, bunches of finely
spun glassy hair- pele’s hair like structure were
observed at the vent site.
The volcanic activity may be indicative of
surface discharge of magmatic materials from
one central pipe and four satellite feeder
fissures that communicate with the heated
depths.
Fig3: Two larger fissures of 50.8 cm x133.2
cm and 71 cm x 33 cm brought lava to the
surface
Apparently the volcanic activity lived for
matter of a few hours and died out instantly.
The dimension of this lava structure was 1.9
m x 8.2 m in length and 15 cm to 0.6 m thick.
The solidified material on the surface was 2.9
m long and 1.5 m wide and formed
scoriaceous blocks with dangerously knife
sharp edges.
Fig4: The 35.5 cm cone shaped vent was
plugged by the solidification of the material
on the orifice.
Two larger fissures which brought lava to the
surface were of 50.8 cm x133.2 cm and 71 cm
x 33 cm. The two smaller ones were of 16.5
cm and 33 cm and 13 cm and all were found to
be still emitting heat. Solidified sheet of lava
formed after a thin skin of cool lava shoved
into folds by hot, more fluid lava just below

Lasbela University Journal of Science and Technology (2013) Vol-2 ISSN 2306-8256
Online available at www.luawms.edu.pk pg. 21
the surface, was removed from the surface
after documenting the event. Samples of
volcanic material of different nature, including
volcanic glass, obsidian, scoria, pumice and
lava were collected for geochemical analyses
and petrographic studies.
The ejection of molten material and scoria
cone was excavated by digging a ditch of ~2 m
along the fissures to find the opening of the
vent and tracing of the source channel of the
extruded material. The complete structure of
the scoria cone and pipe was preserved for
display in the GSP Museum of Earth Sciences
for further research. The vent pipe of the main
cone was found to be 0.9 m deep from the
surface. The orifice was found to be widening
and inclined below the surface. The chamber
was found hollow up-to 50 cm blocked with
the solidification of material.
Fig5: Viscous lava had formed short stubby
flow down the mountain slope for 8 meters
The temperature of the chamber walls was
found still burning hot and when dry bushes
were put on the mouth of these chambers, they
caught fire.
Another smaller feeder which originated from
the central cone led towards SE direction. It
was measured to be about 4.75 m from the
main chamber.
Fig 6: After the upper surface had solidified,
the last of the molten lava drained away,
leaving an empty tunnel, with black icicles of
glass which adorned its side walls.
No fresh extrusion of volcanic material was
observed during field investigation.
However, heat was still coming out for ten
consecutive days.
Fig7: A chamber of 1m length and 5 cm
diameter lead vertically down to a funnel
shaped structure
Geochemical analysis
Cox et al (1979) diagram was used for fresh
lava specimens, nomenclature. Samples
overlap and fall in vacant domain below the
Hawaiite and above the basaltic field (Fig.2).
On SiO2 versus total alkali diagram, these
rocks are alkaline (Fig.3).The major elements
data classify the rocks as basaltic in
composition and alkaline. The geologists
inferred that it may be formed due to the

Lasbela University Journal of Science and Technology (2013) Vol-2 ISSN 2306-8256
Online available at www.luawms.edu.pk pg. 22
crustal assimilation and re-melting of pre-
existing rocks of Bibai Volcanics under very
high pressure condition at depth as the data
corresponds to Bibai Formation (Bibai
volcanics of Kazmi, 1984; Siddiqui et al.,
1996). If these represent lava flow coming up
directly from the upper mantle, then the trace
elements data must have been depleted in Nb,
TiO2, Na2O and K2O.
Table 1: Geochemistry
Fe2O3 is total iron; Major trace elements are
analyzed on WD-XRF at GSP’s Geolab.
GEOPHYSICAL INVESTIGATIONS
The integrated techniques were adopted as the
effusive vent produced after an earthquake
resulted due to magmatic/lava activity which
was likely to have made major changes in the
sub surface detectable by the variation caused
in the magnetic properties of the rocks (host
sedimentary rocks enclosing magmatic
intrusive) , changed electrical rock
characteristics like resistivity in environments
of intrusions and shallow GPR scanning for
detecting near surface structural changes or
variations in the electrical properties of the
rocks.
35 45 55 65 750
3
6
9
12
15
18
Nephel in
P-N
B+T
P-T
Phonoli te
Benmorite
Mugearite
Hawaiite
Basalt
B-A Andesite
Dacite
Trachyandesite
Rhyolite
Trachyte
SiO2
Na
2O
+K
2O
Fig 8: Total Alkali vs Silica Diagram
35 40 45 50 55 60 65 70 75 80 850
2
4
6
8
10
12
14
16
18
20
Alkaline
Subalkaline
SiO2
Na
2O
+K
2O
Fig 9: Cox Diagram
Magnetic Survey
The total magnetic field intensity anomaly
map (Fig.10) shows the magnetic variation of
subsurface rocks in and around the
perforation vent. A circular rim of high
magnetic values is clearly discernable. This
high magnetic zone is bounded by the
continuous sharp gradient from all sides and
is comprised of about eight high magnetic
anomalies distributed within the circular
zone. The amplitude of the positive
anomalous poles vary from 700 to 1100 nT.

Lasbela University Journal of Science and Technology (2013) Vol-2 ISSN 2306-8256
Online available at www.luawms.edu.pk pg. 23
An interesting feature in the area is the
positive poles are inside the semi ring zone
and the negative poles relatable to these
positive poles are located outside the rim.
The anomaly rim is separated by a sharp
gradient in between them. The general trend
of this ring pattern shows positive values
with the negative values encountered in the
rest of the area, which indicates that all these
positive values are related to the same
causative dipolar body at depth. The four
positive magnetic peaks bound the vent site
with contour values ranging from 700 nT to
1100 nT. The magnetic anomalies indicate a
dipolar nature and the sharp gradient shows
shallow depth. The maximum depth to the
top of these bodies is about 11 meters. A
north-south trending sharp gradient is
observed near the profile W3 of the grid,
which probably indicates a concealed fault or
the sharp contact between sedimentary rocks
and volcanic intrusive. Maximum positive
anomaly signature is produced near the vent.
These anomalies are probably related to the
older Bibai volcanics or present activity of
fusion of the older rocks with the
hydrothermal/ magmatic intrusion ascending
and mixing with the older shallow volcanics
which could not reach the surface except at
the vent site. It is difficult to conclude,
whether this susceptibility contrast
corresponds to the already existing Bibai
volcanics and sedimentary rocks or
recent/new intrusion of different composition
showing the contrast. The composition of the
vent molten material is similar to Bibai
volcanics, dominantly basaltic (Mafic) which
are less viscous than the silicific lavas and
tends to be lighter than felsic lavas (Silica >
63 %).
The residual total magnetic field intensity
anomaly maps at an average ring radius of
24, 36, 48, 60, 72 and 84 meters are also
prepared by Griffin’s method for enhancing
the shallow anomalous features in and around
the vent.
Fig10: Total Field Magnetic Intensity
Anomaly
These maps also show the continuity of the
causative source, i.e the intrusion with depth.
The vent site is located at the Zero profile
and the residual total field magnetic intensity
anomaly map at average ring radius of 84
meters show that the main causative body lies
under E5 profile. This shows that the
causative intrusion likely moved from the
East.
Electrical resistivity survey
3 VES and 2 Dipole-Dipole profiles were
made at the vent site.
Vertical Electrical Sounding-1
The sounding depth attained at the vent site is
200 meters. The resistivity ranges from 1.91
Ohm-m to 341 Ohm-m. Alternating layers
of gravels/boulders with varying proportion
of clays are present down to the explored
depth. Anomalous very low resistivity 1.91
Ohm-m is attained by the bottom layer down
to the 200 meters.
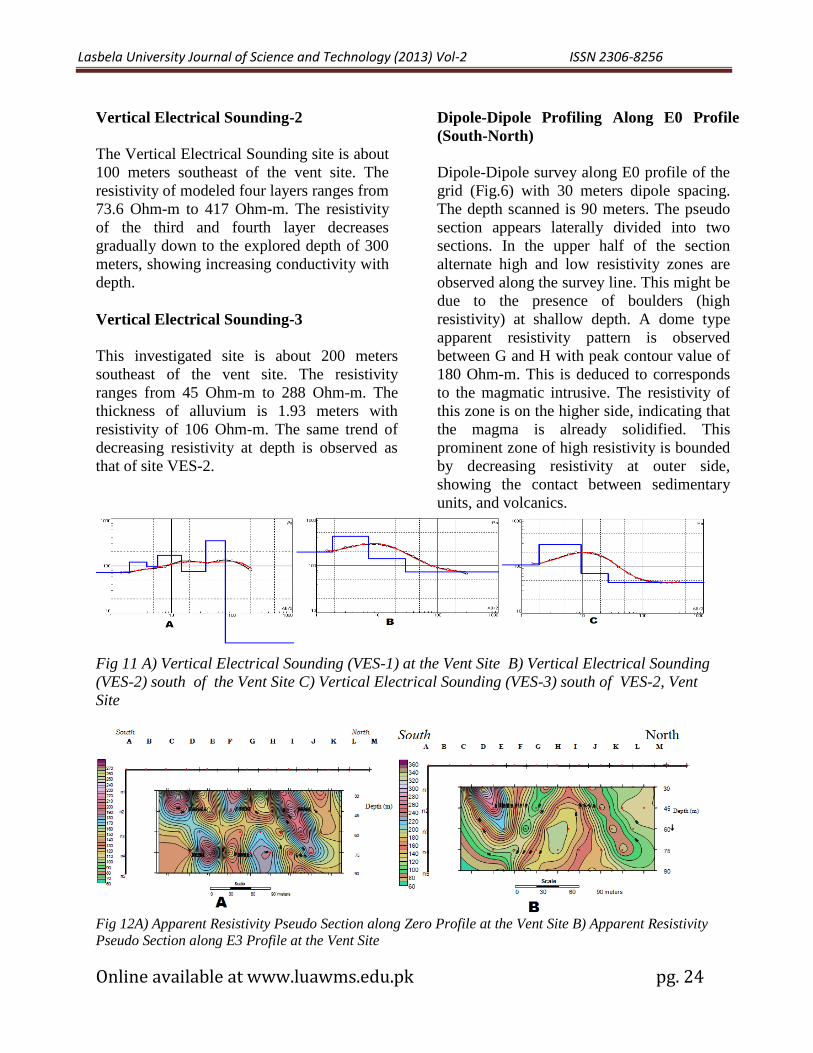
Lasbela University Journal of Science and Technology (2013) Vol-2 ISSN 2306-8256
Online available at www.luawms.edu.pk pg. 24
Vertical Electrical Sounding-2
The Vertical Electrical Sounding site is about
100 meters southeast of the vent site. The
resistivity of modeled four layers ranges from
73.6 Ohm-m to 417 Ohm-m. The resistivity
of the third and fourth layer decreases
gradually down to the explored depth of 300
meters, showing increasing conductivity with
depth.
Vertical Electrical Sounding-3
This investigated site is about 200 meters
southeast of the vent site. The resistivity
ranges from 45 Ohm-m to 288 Ohm-m. The
thickness of alluvium is 1.93 meters with
resistivity of 106 Ohm-m. The same trend of
decreasing resistivity at depth is observed as
that of site VES-2.
Dipole-Dipole Profiling Along E0 Profile
(South-North)
Dipole-Dipole survey along E0 profile of the
grid (Fig.6) with 30 meters dipole spacing.
The depth scanned is 90 meters. The pseudo
section appears laterally divided into two
sections. In the upper half of the section
alternate high and low resistivity zones are
observed along the survey line. This might be
due to the presence of boulders (high
resistivity) at shallow depth. A dome type
apparent resistivity pattern is observed
between G and H with peak contour value of
180 Ohm-m. This is deduced to corresponds
to the magmatic intrusive. The resistivity of
this zone is on the higher side, indicating that
the magma is already solidified. This
prominent zone of high resistivity is bounded
by decreasing resistivity at outer side,
showing the contact between sedimentary
units, and volcanics.
Fig 11 A) Vertical Electrical Sounding (VES-1) at the Vent Site B) Vertical Electrical Sounding
(VES-2) south of the Vent Site C) Vertical Electrical Sounding (VES-3) south of VES-2, Vent
Site
Fig 12A) Apparent Resistivity Pseudo Section along Zero Profile at the Vent Site B) Apparent Resistivity
Pseudo Section along E3 Profile at the Vent Site

Lasbela University Journal of Science and Technology (2013) Vol-2 ISSN 2306-8256
Online available at www.luawms.edu.pk pg. 25
Dipole-Dipole Profiling along E3 Profile
(South-North)
The observed profile is 30 meters east of E0
profile. A distinct anomaly (Vertical to
Inclined) is indicated in the center of the
profile with a decreasing resistivity on the
outer side. The apparent resistivity of this
body is high with peak value of 190 Ohm-m
and bounded by decreasing resistivity. There
is a sharp resistivity gradient along this pattern
which probably shows the contact between
sedimentary and volcanic intrusive. Another
very high resistivity zone is observed in the
southern part of the section but its downward
extension is limited to only 60 meters depth.
This may correlates with a lateral flow (Sill)
of intrusion and is not exposed at the surface.
Ground Penetration Radar (GPR) Survey
Ground Penetrating Radar survey with 25
MHz unshielded with parallel antenna
configuration was observed from NW to SE
direction along a track that passes over the
vent in the study area. The depth of
penetration attained is above 50 meters.
Velocity calculated is 95 m/nsec by the
“hyperbola fitting” to an arch like pattern
along 90 meters profile length and at 900
nsec. The GPR echo shows the subsurface
geological section along the profile. At the
top an eight meters smooth pattern is
observed with some variations at some
places. This parallel and smooth signature is
produced because of the resolution of the
antenna. The resolution of the 25 MHz
antenna is about 1 meter. The distortion in
the sub surface structure at the vent site as
evidenced by the GPR section is probably
the intrusive activity that had taken place. A
prominent reflector is observed with top at
40 meters at the profile end. The north
western portion of the section appears more
disturbed than the rest.
Another very smooth bedding signature is
produced at 36 meters depth with some
disturbances at places, along 10-25 meters
profile length, a clear fracture at 50 meters, a
disturbed signal from 14 to 32 meters and
below 42 meters depth. A convex feature at
18 meters depth, look likes to be a resultant
fracture in the layer by the upward
stress/strain developed during intrusion of
magma. Along the profile the vent site is
located at 90 meters profile distance from
NW. A very good GPR signature at this
point at 42 meters depth as a
prominent/hyperbola is produced. This
strong signal directly under the vent site
leads to the presence of some hard and
compact source hosted within the
sedimentary surroundings. It is deduced that
this is from the solidified magma present in
the subsurface. The other features like
folding, fracturing and arc like structures are
the resulting signs of the volcanic intrusion
that took place causing structural change in
the subsurface under the vent site.
Fig13: Interpreted GPR Section at the Vent Site
The 27th
January 2010 earthquake was
resulted due to an effusion of molten
material. The vent site was investigated by
integrated geophysical surveys employing
magnetic, resistivity and GPR techniques.
The magnetic survey in the investigated area
shows a presence of a circular pattern of high

Lasbela University Journal of Science and Technology (2013) Vol-2 ISSN 2306-8256
Online available at www.luawms.edu.pk pg. 26
magnetic anomalies in the background of
low magnetic values in the area. The vent
site is located within the high anomalous
magnetic rim bounded by four positive
magnetic anomalous closures. The positive
and circular shaped corresponding negative
lobes of anomalies are separated by a
continuous sharp gradient from all sides. The
residual total magnetic field intensity
anomaly maps at different planes indicates
that the different magnetic anomalies
reflected in the total field magnetic intensity
anomaly map as different bodies are actually
the manifestation of a single causative source
at depth. The residual maps clearly show that
the causative source of these apparently
discrete anomalies at shallow depth is a
distinct single source which apparently shifts
towards east/southeast with increasing ring
radius/depth. The body center lies at E5
profile, 50 meters east of the vent in the
residual map at the average ring radius of 84
meters. VES-2 and VES-3 are located about
100 meters and 200 meters SE from the vent.
VES-2 and VES-3 show similar resistivity
response for the subsurface, but VES-1
encountered a relatively low resistivity layer
at 14.7 meters depth. The apparent resistivity
pseudo section along E0 profile shows a very
disturbed resistivity behavior. The upper and
lower sections along the profile are separated
laterally by a relatively low resistivity zone.
In both the upper and lower section,
alternating high and low resistivity values
are observed. These indicate
vertical/inclined/ segregated high and low
resistivity bodies. The comparison of
magnetic responses with apparent resistivity
pseudo section along E0 profile shows that a
high resistivity closure at depth of about 50
meters corresponds to high magnetic value.
This is also quite evident from the E3 profile
that high magnetic signature corresponds to
high resistivity. The GPR section also shows
a prominent reflector under the vent site at
42 meters depth. The GPR echo sounding
also indicates the folding and fracturing in
the subsurface structural litho configuration.
Visible folds are discernable in the low
resistivity layer (clays/shale) under the
gravels. Compact and brittle rock units,
however, have been fractured as shown in
the section. These anomalous magnetic,
resistivity signatures with the GPR echo
sounding results all interpreted in
conjunction leads to a deduction of an
intrusive characterized by high resistivity,
high magnetic and prominent reflector. The
solidified causative intrusive in the form of a
dyke/sill is a hard/compact body resulting
out from the hydrothermal /magmatic source
ascending from deeper zones at the vent site
and its surroundings. This intrusion has
caused significant structural changes and
fractures and folding in the subsurface.
Comparative total magnetic intensity
anomaly profile and GPR section shows an
arc like structure at the vent site located at 42
meters depth, corresponds to the high
magnetic response. The source of causative
body is shifted towards south east, also
corroborated by the apparent resistivity
pseudo sections along E0 and E3. A high
resistivity dome like structure an intrusive is
well correlated with the high magnetic along
E3 profile.
CONCLUSIONS
The event may be a hybrid between a
volcano-tectonic seismic event and seismo-
tectonic volcanic event. Apparently this
outpouring seems to be related to deep
seated basement geo-fracture which may
have been vertically active through much of
the geologic time.
The close proximity of the epicenter of 2008
and effusion of 2010 shows that the event,
though at different times, but being proximal
in the same zone appears related. The event of
the 2008 near Gogai had already rendered the
epicentral area as a weak ruptured zone which
was further weakened and become unstable

Lasbela University Journal of Science and Technology (2013) Vol-2 ISSN 2306-8256
Online available at www.luawms.edu.pk pg. 27
with the tectonic stress from the 2010 event
resulting in an eruption at the Tor Zawar
Mountain.
The main event followed by the aftershocks
with scattered epicenters over a large area
shows the ruptures and rock fractures in the
subsurface occurring in a large area probably
along concealed regional fault or unstable
weakened tectonic/structural fronts much
deeper at the 10-50 km depth in the crust and
upper mantle.
The anomalies identified on the basis of
magnetic, resistivity, and GPR at the vent site
and surroundings indicate the presence of
intrusion with both vertical and lateral flows.
The alkaline basaltic lava flow at the vent site
appears to originate from the east/southeast of
a regional fracture, east of the vent site,
probably activated in the 2010 event which
resulted in the sluggish eruption.
The effusive lava is characterized by high
resistivity, high magnetic and prominent
reflector formed due to the crustal assimilation
and re-melting of pre-existing rocks of Bibai
Volcanics under very high pressure condition
at depth as the data corresponds to Bibai
Formation.
The odds are not zero that an earthquake
accompanied by an eruption will occur in
certain area during a certain period of time
and estimating eruption possibilities is an
interesting research field and one in which
more questions would be raised than
answered.
The present data caution us for an extremely
violent earthquake in this region, which may
or may not be accompanied with volcanic
effusions. The magnitude and scale of such
an eruption, even if a remote possibility
warrants that if we fail to plan, we plan to
fail.
ACKNOWLEDGEMENTS
The authors acknowledge the generous
support, encouragement and guidance of Dr.
Imran Khan, Director General, Geological
Survey of Pakistan in all stages of the
investigations.
REFERENCES
Armbruster, J., Seeber, L . Quittmeyer, R.,
and Farah, A.,1979, Seismic network
data from Quetta Pakistan, GSP
Record Vol.49
Bardintzeff, J.M., and McBirney., 2000,
Volcanology second Edition, Jones
and A., Bartlett Publishers,
Massachusetts, USA.
Bowen, R, 1979, Geothermal Resources,
Applied Science, Publishers Ltd.
New York, USA.
Carret, B, A., 2006, Geophysical hazards and
hazard awareness On Nisyros
Volcano Greece, M.SC Dissertation,
University College London.
Cox, K.G., Bell, J.D., and Pankhurst, R.J.,
1979,The interpretation of igneous
rocks, George Allen and Unwin,
Boston, 450 pp.
Farah, A., and Dejong, Kees A.,1979,
Geodynamics of Pakistan, GSP
Quetta.
Farah, A., Lawrence, R, D., And Dejong, K,
A., 1984, An overview of the
Tectonics of Pakistan, printed in
marine geology and oceanography of
Arabian sea and coastal Pakistan,
Bilal U Haq and John D Milliman
edition.
Farah, A., Abbas, G., De jong ., 1984,
Evolution of the lithosphere in
Pakistan.Hunting Survey Corp.Ltd.
(HSC), 1960, Reconnaissance geology,

Lasbela University Journal of Science and Technology (2013) Vol-2 ISSN 2306-8256
Online available at www.luawms.edu.pk pg. 28
Part of West Pakistan, publ.under
Columbo Plan Coop.Project, Govt. of
Canada, Toronto, Canada.
Kakar, D.M., Szeliga, W., and Bilham, R.,
2010, Seismic Potential of the
Pishin/Mach Shear Zone in Northern
Baluchistan, Pakistan, Seismological
Research Letters, v. 81, no. 2, pp.
324.
Kerr, A.C., Khan, M., and McDonald, I.,
2010, Eruption of basaltic magma at
Tor Zawar, Balochistan, Pakistan on
27 January 2010: geochemical and
petrological constraints on
petrogenesis, Mineralogical
Magazine, v. 74, no. 6, pp. 1027-
1036
Kazmi, A.H., 1979; The Bibai and Gogai
nappes in the Kach Ziarat areas of
north-eastern Balochistan,
Geodynamics of Pakistan. Ed: Farah
& Dejong.
Kazmi, A.H., 1984; Petrology of Bibai
Volcanics in Baluchistan, Geol
Bull.of Univ. of Peshawar, 7.Kazmi,
A.H & Jan, M. Qasim, 1997;
Geology and Tectonics of Pakistan.
Mona, Lisa and Jan, M.Q., 2010,
Geoseismological study of the Ziarat
(Balochistan) earthquake (doublet?)
Of 28 October 2008, Current
Science, v. 98, no. 1, p. 50-57.
Gawad, M, Abdel., 1971, Wrench
movements in the Balochistan Arc
and relation to Himalayan-Indian
Ocean Tectonics, Geological Society
of America Bulletin, Wrench
movements in the Balochistan Arc
and relation to Himalayan-Indian
Ocean Tectonics, Geological Society
of America Bulletin.
Geological map No 26,1958,
Reconnaissance geology of part of
West Pakistan, Colombo plan co-
operative Project.
IPI2Win-IPI Win, Resistivity Sounding
Interpretation software, (1990-2003),
Version: 3.0.1.a 7.01.03
Kazmi, A, H.,1979, Preliminary seismo
tectonic map of Pakistan, GSP, Map
series First Edition.
Kazmi, A, H.,1979, The Bibai and Gogai
Nappes in the Kach-Ziarat area of
north eastern Balochistan,
Geodynamics of Pakistan.
Lawrence, R,D., Khan, S,H., Dejong, K, A.,
Farah, A., and Yeats, R,S., 1981,
Thrust and strike slip faults along the
Chaman Transform zone Pakistan,
Thrust and Nappe tectonics. The
Geological Society of London.
Nakata, T., Otsuki, K., and Khan, S.H.,
1990, Active faults, stress field and
plate motion along the Indo-Eurasian
plate boundary, Tectonophysics,
Elsevier Science Publishers, B.V.
Amsterdam.
Rana, A.N., Akhtar, S.S. and Qadir,
G.T.,2008, Seismotectonic
investigations of October 29, 2008
earthquake of Gogai Ziarat,
Balochistan, Information Release No.
874, Geological Survey of Pakistan,
Islamabad.
Rana, A.N., and Akhtar, S.S., 2010, Effusion
of Molten Material in Tor Zawar
Mountain, Sari, Ziarat, Balochistan

Lasbela University Journal of Science and Technology (2013) Vol-2 ISSN 2306-8256
Online available at www.luawms.edu.pk pg. 29
on January 27, 2010, Information
Release No. 891, Geological Survey
of Pakistan, Islamabad, 24 pp.
(Summary in GSP News. V. 17, No.
1-12, p. 12.)
.
Rittman, A., and Vincent, E.A., 1960,
Volcanoes and their Activity ,
Interscience Publishers, A division of
John Wiley and Sons Inc New York
US.
Siddiqui, R. H, Khan I.H and Aziz A; Dec
1996, Geology and Petrogenesis of
Hot spot related magmatism on the
Northwestern Margin of Indian
Continent; Proceedings of
Geoscience Colloquim, GSP Vol. 16.
Siddiqui, R. H, Dec 1999, Petrogenetic
Study of Hotspot related magmatism
on the Northwestern Margin of
Indian Continent and its implications
for Paleosedimentary.
Shah, S.H.A, 1965; The structure of the area
between Ziarat and Wani, Sibi and
Loralai districts, W.Pakistan,
Rec.Vol. XIV Part II, Geological
Survey of Pakistan, Islamabad.
Swanson, D.A., 1973, Pahoehoe flows from
the 1969-1971 Mauna Ulu Eruption
Kilauea volcano, Hawaii, Geological
Society of America Bulletin, v. 84, p.
615-626.
Telford , W,M., Geldart,L,P., 1993, Applied
Geophysics, Second Edition
Cambridge Sheriff, R,E. university
Press , reprinted 1993 USA.
Verma,R,K., and Sekhar, CH, C., 1986.
Focal mechanism solutions and
nature of plate movements in
Pakistan, Journal of Geodynamics.
Welch, B, C., Dwyer, K, Helgen,M.,
Waythomas, C, F., Jacobel, Mt.
R,W., Geophysicalsurvey of intra-
caldera ice field of Veniamin,
Alaska.
Lasbela University Journal of Science and Technology (2013) Vol-2 ISSN 2306-8256
Online available at www.luawms.edu.pk pg. 30
AGRICULTURAL SCIENCES
RESEARCH ARTICLE
Effect of multiple harvests on chemical composition of
important nutrients of Alfalfa (Medicago sativa L.) grown in
Uthal, Lasbela District, Balochistan, Pakistan.
Saeed Ahmed1, Abdul Hameed Baloch
1 and Imtiaz Ahmed
2
1Faculty of Agriculture, LUAWMS, Uthal, Lasbela, Balochistan, Pakistan.
2Faculty of Water Resources Management, LUAWMS, Uthal, Lasbela, Balochistan,
Pakistan.
ABSTRACT
The purpose of this paper was to study the effect of different harvests on alfalfa
(Medicago sativa L.)biomass through the assessment of DM (Dry Matter contents), CP
(Crude Protein), EE (Ether Extract), CF (Crude Fibre) and NFE (Nitrogen free extract).
Alfalfa was collected from five cuts (three cuts from 1-3 months, first harvest and
second harvest). The results of present study revealed that feed quality of alfalfa
harvested as silage depends, to a great extent, on the maturity of the stand. With
increasing maturity, CP, and Ash quantity decreases and on the other hand crude fibre
(CF) and nitrogen free extract (NFE) fractions, were increased. These fibre fractions
represent the more indigestible parts of the plant. As a result, digestibility and energy of
alfalfa as a fodder crop decreased with maturity.
Keywords:Medicago sativa L, multiple harvests, biomass , Lasbela District
_____________________________________________________________________ Correspondence: Abdul Hameed Baloch Address: Faculty of Agriculture, LUAWMS, Pakistan. Email: [email protected] Phone: +92-333-2218439 Received: 05 Jun 2013 Revised: 03 Aug 2013 Accepted : 05 Aug 2013 Copyright: ©2013 Ahmed et al. This is an open-access article distributed under the terms of
the Creative Commons Attribution License, which permits unrestricted use, distribution, and
reproduction in any medium, provided the original author and source are credited Competing Interests: The authors have declared that no competing interests exist. ______________________________________________________________________
INTRODUCTION
Alfalfa (Medicago sativa L.) often called
the “Queen of Forages,” belongs to family
Fabaceae, cultivated as an important forage
crop, which is grown in areas oflimited
rainfall, high temperature and high level of
salinity (Safarnejad et al, 1996). Alfalfa
offers the prospect of enhancing the
management of major crop weeds. Alfalfa
Lasbela University Journal of Science and Technology (2013) Vol-2 ISSN 2306-8256
Online available at www.luawms.edu.pk pg. 31
enhances and protects the soil due to its
vigorous and perennial root system, fast
growing protecting canopy and capability
to fix atmospheric nitrogen (Shahriari et al,
2007). Its vigorous growth combined with
annual harvest during the growing period
provides excellent weed control. As a
fodder crop, Alfalfa is rich in protein,
minerals and vitamins. The relative feed
value has been extensively used in ranking
fodder for sale, inventorying and assigning
forage lots to animal groups, according to
their quality needs and determination when
to harvest. The nutrient contents of the
feeding value largely depend upon the stage
of growth at the time of utilization.Because
nutritive value falls with advancing
maturity and associated increase in stem-
leaf ratio. In later stages of growth cell wall
constituents (cellulose, hemicellulose,
lignin) increased by 0.l6% of dry matter per
day with advancing maturity, which
decreases forages digestibility (Keftassa
and Tuvesson, l993). Although cutting at
earlier stages of growth improves forage
digestibility and crude protein content it
decreases total yield (Brink and Marten,
l989; Hesterman et al, l993). Compared
with any forage grass at similar stages of
growth, alfalfa has lower cell wall and
digestible fibre contents but higher
digestible cell and crude protein contents
(Campling, l984). It was suggested that
frequent cutting deceases alfalfa yields
(Judd and Radcliffe, 1970), however, it has
been found that increasing cutting height,
reduced yield per unit area of protein and
carotene (Ogden and Kehr, 1968).
District Lasbela is the 7th
largest district in
Balochistan and has an area of 15,153
square kilometres, Lasbela District, lies
between 65°12'11"-67°25'39" East
longitudes and 24°53'2"-26°39'20" North
latitudes. The major Rabi crops of this
district are Wheat, Barley, Mutters pulse
and Fodder. However, alfalfa as a major
fodder crop receives much attention in this
district. Alfalfa production has been
increasing in the Lasbela District to support
a rapidly expanding dairy industry.
Lactating dairy animals fed physically
effective alfalfa fibre are healthy and very
productive. Therefore, a common variety of
alfalfa (Omani), which is successfully
grown in Kech district, was introduced for
the first time in Lasbela District.
The purpose of the present study was to
investigate at the effect of cuttings and the
influence of cutting frequency on the
productive and qualitative characteristics of
alfalfa cultivars widely grown in the Kech
region in Pakistan. Our objectives in this
study were: to understand whether or not
cutting frequency affects alfalfa
productivity (biomass) and quality (CP
etc.,) and; to determine if this variety
(Omani) had higher yield and quality with
increased cutting frequency in Lasbela
District.
MATERIALS AND METHODS
The experiments were conducted in
Agronomy field of Lasbela University of
Agriculture Water and Marine Sciences
campus, Tehsil Uthal. The site is located at
latitude between 65°12'11"-67°25'39" East
longitudes and 24°53'2"-26°39'20" North
latitudes, in arid climate in the centre of
Lasbela District, where the summer is dry
and hot, while the winter is cool. Before
seeding of alfalfa the soil was fertilized
with DFA. Seeds of alfalfa cultivars
‘Omani’ were planted @ 2.5 kg/acre, on
October 1, 2012. The field was rolled after
planting. Once seeding appeared and
reached at 2-3 leaves stages regular urea
fertilizer was used to enhance the growth of
fodder. At different stages of growth
traditional manure was also applied. Pest
and weed controls were carried out

Lasbela University Journal of Science and Technology (2013) Vol-2 ISSN 2306-8256
Online available at www.luawms.edu.pk pg. 32
according to general local practices and
recommendations.
The first harvest was taken on first month
after seeding followed by second and third
harvest at the interval of one month
respectively. The first cutting was done at
the first week of November, 2013 and the
second was done at the first week of
December 2013. The whole-plant samples
were taken from experiment quadrates (one
square meter) and dried at 100ºC. All
samples were grinded in a regular mill
through a 1-mm screen. The Following
analysis was conducted by using standard
methods.
The Crude Protein (CP) is approximated by
multiplying the Kjeldahl nitrogen analysis
by the factor 6.25. The plant materials were
treated with sulfuric acid, which
decomposes the organic substance by
oxidation to liberate the reduced nitrogen as
ammonium sulfate. In this step potassium
sulfate is added to increase the boiling point
of the medium (from 169°C to 189°C). The
solution is then distilled with a small
quantity of sodium hydroxide, which
converts the ammonium salt to ammonia.
Total nitrogen derived from the analysis is
converted into protein by multiplying with
factor that takes into account the nitrogen
content of a known or average amino acid
composition (López et al, 2010).
Ether Extract (EE), the ground sample of
alfalfa, is extracted with diethyl ether which
dissolves fats, oils, pigments and other fat
soluble substances. The ether is then
evaporated from the fat solution. The
resulting residue is weighed and referred to
as ether extract or crude fat.
Total Ash is determined by igniting in a
furnace at 600oC to oxidize all organic
matter. Ash is determined by weighing the
resulting inorganic residue.
Crude Fibre (CF) refers to organic matter
insoluble in a hot diluted sulphuric acid and
diluted sodium hydroxide solution (Goering
et al, 1972). Nitrogen free extract (NFE)
was mathematically calculated, as
difference between organic matters values
and analytically assessed organic
compounds. Dry Matter (DM), is the
determination of dry matter on ground air-
dry or partially dried (85% dry matter)
forages. Moisture is evaporated from the
sample by oven drying. Dry matter is
determined gravimetrically as the residue
remaining after drying.
Calcium (Ca) and Phosphorus (P) were
determined with spectrophotometer model
DR3900 HACH, USA. All chemical
analyses were carried out in triplicate for
each harvest of alfalfa.
RESULTS
The variability of DM, CP, CF, Ash, EE, and NFE of alfalfa as influenced by stage of growth is presented in Table 1. Dry matter (DM) content gradually increased after first cutting from 19.9% to 21.1% at 4 weeks interval (table 1). In contrast, crude protein (CP) content and Ash contents decreased by 51% and 50% respectively. It is because the nutritional substances from cell content decreased, accompanied by an increase of cell walls content, therefore a diminution of organic matters digestibility. Alfalfa harvested during bud stage presented 25.4% CP proportion,
which decreased till 14.9% CP (full
flowering,2nd
harvest). There were no significant
differences among different harvest of
alfalfa in terms of Ether Extract (EE) when
compared with crude protein concentration
of Nitrogen Free Extract (NFE), exhibited
an inconsistent change pattern with
advancing maturity of alfalfa. From the
result, it is also clear that of the chemical nutrients’ concentration (Ca, P) change

Lasbela University Journal of Science and Technology (2013) Vol-2 ISSN 2306-8256
Online available at www.luawms.edu.pk pg. 33
pattern over the study period is gradually increasing (Table 1). The percentage of crude fibre (CF) gradually increased from 17.2% at one months old plant to 28.9% at second harvest (after 5 months of seeding). This is because the total content of cell wall was influenced by plants age at harvesting. As plants turned old, cellulose and lignin proportion increased,
while hemicelluloses decrease
DISCUSSION
The qualityof alfalfa as a forage crop is
depending upon the palatability and
maximizing intake and production of dairy
cows. Alfalfa is low in fibre and high in
protein compared with other forages, which
makes it an excellent compliment in dairy
rations. The quantity of crude protein is
higher in immature alfalfa but the protein is
rapidly fermented in the rumen to ammonia
and not used efficiently (Broderick and
Satter, 1998). Like any other forages grass,
the percentage of Crude Fibre (CF) the
proportions of fibre and lignin increase
with maturity in alfalfa. However alfalfa
fibre contains a high proportion of lignin
compared with forage grasses resulting in
low digestibility relative to grasses.
It was suggested that 60 to 80% of grass
fibre is potentially digestible; the possible
level of digestion of alfalfa fibre is only
40% to 60% due to its high lignin content
(Martin and Mertens, 2005). However,
alfalfa has a great advantage over grasses
because the rate of digestion of its
important digestible fibre is 2 to 3 times
that of forage grasses. It is also appear that
the indigestible fibre in alfalfa disintegrates
into particles that rapidly pass out of the
rumen. The higher intake and digestibility
often observed with alfalfa-based diets
compared to those containing grass is not
due to greater digestibility of alfalfa fibre,
but due to alfalfa’s low fibre content and
the rapid rates of digestion and passage of
that fibre. (Martin and Mertens, 2005).
CONCLUSION
The replacement of traditional forage
grasses to alfalfa in Lasbela District is
obvious because of the nutrient contents and
higher digestibility. An ideal alfalfa as an
alternative fodder crop would contain a
better balance of protein and rapidly
fermentable carbohydrate. Similarly it
would be desirable to have about 18% crude
protein, less ash, and about 30% crude fibre
CF. It would also be beneficial to have a
better balance of amino acids in the protein
and with a slower rate of degradation in the
Table 1: Composition of different nutrient contents in dry biomass of Medicago sativa L.
Harvest
1 month
2 months
3 months
First cutting
Second cutting
DM Percentage of dry matter
CP CF Ash EE NFE Ca P
25.4 17.2 16.7 2.7 41.0 1.96 0.42
20.9 26.7 15.2 3.2 37.1 2.25 0.35
17.5 30.7 10.7 3.6 41.1 1.90 0.24
19.9 14.4 30.9 8.1 2.9 45.9 1.75 0.17
21.1 14.9 28.9 8.7 4.3 46.0 1.55 0.25

Lasbela University Journal of Science and Technology (2013) Vol-2 ISSN 2306-8256
Online available at www.luawms.edu.pk pg. 34
rumen to minimize its losses as ammonia.
Although the rate of digestion and passage
of alfalfa fibre is outstanding, compared
with any other forage grass but it would be
excellent if low lignin containing verities
introduce in Lasbela District. Similarly the
yield of alfalfa should be enhanced with a
reduction in the number of cuttings needed
to produce dairy-quality alfalfa forage
ACKNOWLEDGEMENT
We are grateful to Dr. Gul Hasan Vice
Chancellor and Mr. Amanullah Ronjha
Registrar, LUAWMS for providing
transport facilities.
REFERENCES
Brink, G.E. and Marten, G.C., 1989,
Harvest management of alfalfa-
nutrient yield vs. forage quality and
relationship to persistence: Jour. of
Prod. Agri. (2): 32-26.
Broderick, G.A. and Satter, L.D.,1998,
Balancing forage proteins. In State
Forage and Feeding and
Management Conf: Wisconsin Dells,
WI: p. 19-34.
Campling, R.C., 1984, Lucerne, red clover
and other forage legumes: feeding
value and animal production.
Thomson, D.J. (ed.) Forage
Legumes. Occasional Symposium
No. 16: British Grassland Society,
Hurley. 140-146.
Collin, H. A., Bruce, K. D. and McNeilly,
T., 1996, Characterization of alfalfa
(Medicago sativa L.) following in
vitro selection for salt tolerance:
Euphytica. 92(1-2): 55-61.
Goering, H.K., Gordon, Hemken, C.H.
R.W., Waldo, D.R., Van Soest, P.J.
and Smith, L.W., 1972, Analytical
estimates of nitrogen digestibility in
heat damaged forages. Jour. of Dairy
Sci. 55(9): 1275-1280.
Hesterman, O.B., Kells, J.J. and Tiffin,
P.L., 1993, Interaction among
harvest frequency, fertilizer and
herbicide use with intensively
managed alfalfa in the north-central
USA. Baker, M.J. (ed.). Proceedings
of the XVII International Grassland
Congress, New Zealand and
Australia, Vol. I. New Zealand
Grassland Association: Palmerstone
North, pp. 885-887.
Judd, P. and Radcliffe, J.C., 1970, The
influence of cutting frequency on
yield, composition and composition
and persistence of irrigated. Jour. of
Exper.Agri. and Animal Husb. .10:
48-52.
Keftassa, D. and Tuvesson, M., 1993, The
nutritive value of lucerne (Medicago
sativa, L.) in different development
stages. Swedish Jour. of Agri. Res.
23: 153-159.
López, C.V.G., García, M.C.C., Fernández,
F.G.A., Bustos, C.S., Chisti, Y. and
Sevilla, J.M.F., 2010, Protein
measurements of microalgal and
cyanobacterial biomass. Bioresource
Tech. 101: 7587–7591
Martin, N.P. and Mertens D.R., 2005,
Reinventing alfalfa for dairy cattle
and novel uses. In: Proceedings,
California Alfalfa and Forage
Symposium, 12-14 December, 2005,
Visalia, CA, UC Cooperative
Extension, Agronomy Research and

Lasbela University Journal of Science and Technology (2013) Vol-2 ISSN 2306-8256
Online available at www.luawms.edu.pk pg. 35
Extension Center, Plant Sciences
Department, University of
California, Davis 95616.
Ogden, R.L. and Kehr, N.R., 1968, Field
management for dehydration and
hay production. Proc. 10th
Tech.
Alfalfa Conf. USDA., AR.S. 74-
46:23-37.
Shahriari, M.H., G.R. Savaghebi-
Firoozabadi, M. Azizi, F. Kalantari
and Minai-Tehrani, D., 2007, Study
of growth and germination of
Medicago sativa (Alfalfa) in light
crude oil-contaminated soil. Res. J.
Agric. Biol. Sci., 3: pp. 46–51.

Lasbela University Journal of Science and Technology (2013) Vol-2 ISSN 2306-8256
Online available at www.luawms.edu.pk pg. 36
INTRODUCTION
The catfish Chrysichthys (lacepede), a
siluroid belonging to the Claroteidae is
widely distributed in fresh and brackish
waters of West Africa, (Holden etal, 1991).
The Chrysichthys species are among the
dominant species of commercial catches.
The realization of aquaculture potentials of
Chrysichthys nigrodigitatus has increased
the demands for its seeds for stocking,
leading to increased fishing pressure.
Different species of Chrysicthys seeds are
harvested because of difficulty in
distinguishing them at fry stage. Moreover,
the present state of taxonomy using
MARINE SCIENCES
RESEARCH ARTICLE
Genetic differentiation of two Chrysichthys species using
mitochondrial DNA sequencing
Nwafili S.A, Eminue B.O And Jamabo. N
Department of Animal Science and Fisheries, University of Port-Harcourt, PMB 5523 Port
Harcourt, Nigeria
______________________________________________________________________________
ABSTRACT
Genetic variation of two Chrysichthys species, Chrysichthys nigrodigitatus and Chrysichthys
walkeri from the Lagos lagoon were investigated at mitochondrial DNA level. Mitochondrial
DNA control region (D-loop) fragment was amplified. Twenty four D-loop fragments were
randomly sequenced. Among 13 individuals of C. walkeri and 11 individuals of C. nigrodigitatus
the number of haplotypes were 7, respectively. The haplotype and nucleotide diversities were
respectively 0.846 and 0.010 C. nigrodigitatus and 0.873 and 0.006 for C. walkeri. The NJ tree
clearly distinguished the two species into two clades with a mean genetic distance of 0.898. High
diversities despite heavy fishing may indicate high recruitment of the species.
Keywords:Chrysichthys species, Genetic variation,, Mitochondrial DNA
_____________________________________________________________________________
Correspondence: Nwafili S.A
Address:Department of Animal Science and Fisheries, University of Port-Harcourt, PMB 5523
Port Harcourt, Nigeria
Email: [email protected].
Phone: +2347037964676 Fax: +2347037964676
Received: 08 April 2013 Revised: 12 July 2013 Accepted 14 July 2013
Copyright: ©2013 Nwafili et al. This is an open-access article distributed under the terms of the
Creative Commons Attribution License, which permits unrestricted use, distribution, and
reproduction in any medium, provided the original author and source are credited
Competing Interests: The authors have declared that no competing interests exist.
______________________________________________________________________________

Lasbela University Journal of Science and Technology (2013) Vol-2 ISSN 2306-8256
Online available at www.luawms.edu.pk pg. 37
morphological keys on Chrysichthysis not
adequate for proper identification of species.
The species C. walkeri is also endangered
(IUCN, 2012) and its genetic features need
documentation. Molecular markers are
effective methods for detecting genetic
differences (Whitehead 2003).
Mitochondrial DNA (mtDNA) has been
widely used in resolving identity issues
owing to its higher mutation rate and lower
effective population size than nuclear DNA
(Brown et al, 1979; Birky et al, 1989). This
is because mtDNA is inherited maternally
without recombination, making it a powerful
tool for detecting past mtDNA lineages in
populations. Tudela (2009) demonstrated the
use of the control region identification of
tuna species. …….((
In this work, we employ mitochondrial
DNA control region to differentiate and
characterize two species of Chrysichthys.
The mitochondrial control region is
noncoding and has used to detect genetic
variations of fishes for the studies of
population structure and phylogeny because
it varies greater than the other regions
(Aurelle & Berrebi 2001; Hoelzel et al.
1998; Nesbo et al. 1998).
MATERIALS AND METHODS
Samples: 11 and 13 individuals of C.
nigrodigitatus and C. walkeri were
respectively obtained from Lagos lagoon,
Nigeria for the study.
DNA extraction, amplification, and
sequencing
The Muscles of the samples were preserved
in 95% ethanol. Total genomic DNA was
isolated using the standard Phenol-
Chloroform-Isoamyl-alcohol after digestion
of tissue with proteinase K. This was
followed by PCR amplification to obtain a
portion of the control region in a total of 20
µl volumes containing 1.25 units of Taq
polymerase, 200 nmolL-1
forward and
reverse primers, 200 µmolL-1
each of
dNTPs, 10 mMolL-1
Tris (PH 8.3), 50
mMolL-1
KCl, 1.5 mMolL-1
MgCl2.Part of
the control region was amplified using the
set of primers cited in Watanabe and
Nishida (2003) undercycling conditions of 3
min initial denaturation at 94 oC and 40
cycles of 45 s at 94 oC for denaturation, 45 s
at 50 oC for annealing, 45 s at 72
oC for
extension, and a final extension of 10 min at
72 oC.
MtDNAanalysis
The sequences were viewed and edited
using Seqman as implemented in
DNASTAR software (DNASTAR Inc.). The
alignment was carried out using ClustalX2.
The number of variable sites (Ps), number of
haplotypes (Nhap), nucleotide (π) and
haplotype (Hd) diversities was calculated
using Dnasp 4.0 (Excoffer et al, 2005). A
genetic distance was generated to see how
the species are genetically separated using
MEGA 3.1. This distance is the proportion
(p) of nucleotide sites at which two
sequences being compared are different. It
was obtained by dividing the number of
nucleotide differences by the total number of
nucleotides compared.
RESULTS AND DISCUSSION
The length of the region examined varied
between 513 and 514 after cutting off the
primers from both ends prior to alignment.
After the alignment, a total of 517
nucleotides sites were obtained. Among the
24 sequences examined 47 sites or 9.09%
were variable, which resulted in 14
haplotypes (Fig. 1). It also resulted in 44
parsimony informative sites. The total
nucleotide diversity was 0.04245±0.002
while the total haplotype diversity was

Lasbela University Journal of Science and Technology (2013) Vol-2 ISSN 2306-8256
Online available at www.luawms.edu.pk pg. 38
0.931±0.033. This indicates that both
species are genetically diverse. Also the
haplotype and nucleotide diversities for C.
nigrodigitatus were (0.846±0.085,
0.01021±0.002) and the haplotype and
nucleotide diversities for C. walkeri were
(0.873±0.089, 0.00563± 0.0015). The
haplotype and nucleotide diversities were
quite high despite the fact that Chrysichthys
were generally are heavily fished. This
could be due to an exceptionally high initial
population and possible recruitment from
adjacent basins. The estimates of the genetic
parameters are shown in Table 1. The
characteristic of the control region of the
two species as revealed by the nucleotide
composition are shown in Table 2.
Fig 1: Alignments of the variable sites of mtDNA CR sequences from the two fish species.
Dashes indicate indels introduced for optimal alignment. CN1- CN7 represents the haplotypes
from 13 individuals of Chrysichthys nigrodigitatus and CW1- CW7 are representatives
haplotypes of Chrysichthys walkeri.

Lasbela University Journal of Science and Technology (2013) Vol-2 ISSN 2306-8256
Online available at www.luawms.edu.pk pg. 39
Table 1: Estimates of Genetic parameters for mitochondrial DNA Control region of Chrysichthys
nigrodiigitatus and Chrysichthys walker
Table 2: Nucleotide composition of two Chrysichthys species: CN1-7 reperesent base
characteristics of C. nigrodigitatus and CW1-7 for those C. walkeri haplotypes

Lasbela University Journal of Science and Technology (2013) Vol-2 ISSN 2306-8256
Online available at www.luawms.edu.pk pg. 40
There was a bias towards the purines, which
were consistently higher than the
pyrimidines. Thetotal composition of
purines varied between consistently about
47% and 49.2% in C. nigrodigitatus and
about 50% in C. walkeri. The nucleotide
compositions of C. nigrodigitatus and C.
walkeri revealed in this study are similar to
those of the control regions for other
mitochondrial genomes, with a
predominance of purine bases (Chiang et al,
2006). The region was also A + T rich in
both species than the G + C content among
the sequences examined, which was
consistent with previous studies (Brown et
al, 1986; Cheng et al, 2010).
The net mean genetic distance between
Chrysichthys nigrodigitatus and
Chrysichthys walkeri computed using
MEGA 3.1 was 0.067% or 6.7%. This level
has been reported for other teleosts
including Clarias. The mean genetic
distance of 0.898 between the walker and
nigro clade (Fig. 2) implies that this region
of MtDNA is effective in differentiating
between the Chrysichthys species. Within
each clade in the neighbour joining tree (Fig.
2) are minor clades, indicating high diversity
and divergence among individuals within
the two species. For example, the overall
mean genetic distance within Walkeri was
9.1% while it was 16.9% within nigro.
Among some tilapiine species, Wu and
Yang (2012) found within species genetic
distance ranging from 0.00-0.072 and
interspecies range of 0.012-0.210. All of the
sequences were successfully differentiated
to the two species by the phylogenetic tree
with high bootstrap values.
Fig 2. Neighbour joining tree showing genetic differentiation between C. nigrodigitatus and C.
walkeri using the control region. Two clades nigro for C. nigrodigitatus and Walkeri for C.
walkeri can be distinguished with bootstrap value of above 83% (a reliability index)

Lasbela University Journal of Science and Technology (2013) Vol-2 ISSN 2306-8256
Online available at www.luawms.edu.pk pg. 41
CONCLUSION
The major objective of this study was to
characterize and distinguish C.
nigrodigitatus from C. walkeri. Dependence
on morphological differences wereunreliable
in resolving taxonomic and systematic
ambiguities. The mitochondrial DNA has
previously been shown to be a very efficient
molecular marker for identifying fish
species (Nwafili and Gao, 2007; Ardura et
al, 2010, Wu and Yang, 2012). Use of the
control region successfully identified
tilapine species inferred the phylogeography
of the dourada, Brachyplatystoma
rousseauxii (Castelnau) (Batista & Alves-
Gomes, 2006), and also the panmixia of the
piramutaba, Brachyplatystoma vaillantii
(Valenciennes) (Formiga-Aquino, 2004),
and the tambaqui, Colossoma macropomum
(Cuvier) (Santos et al, 2007).
The mtDNA control region has shown
strong phylogenetic signals and
discriminating power as a genetic marker for
identification of Chrysichthys. From Fig. 2,
two clearly different clades were
distinguished. However, regions such as cyt
b and CO1 have been suggested as more
useful for tracing long evolutionary
relationships. We therefore recommend that
these more conserved regions of the mtDNA
be used to elucidate the phylogenetic
relationship among the species of
Chrysichthys in Nigerian waters. In this
regard CO1 is now internationally used in
barcoding of fish organisms and could be
most useful for Chrysichthys identification.
Sampling should cover major distribution
areas throughout the country for the results
to be more realistic.
REFERENCE
Ardura, A., Linde, A.R., Moreira, J.C., and
Garcia-Vazquez, E., 2010,DNA
barcoding for conservation and
management of Amazonian
commercial fish: Biological
Conservation, v. 143(6), p. 1438-
1443.
Aurelle, D., and Berrebi, P., 2001, Genetic
structure of brown trout (Salmo
trutta, L.) populations from south-
western France: data from
mitochondrial control region
variability: Molecular Ecology, v.
10(6), p. 1551–1561.
Batista, J.S., and Alves-gomes, J.A., 2006,
Phylogeography of
Brachyplatystoma rousseauxii
(Siluriformes: Pimelodidae) in the
Amazon Basin offer preliminary
Amazon migratory catfish: Genetics
and Molecular Research, V. 5(4), p.
723-740.
Birky, C.W Jr., Fuerst P., and Maruyama T.,
1989,Organelle gene diversity under
migration, mutation, and drift:
equilibrium expectations, approach
to equilibrium, effects of
heteroplasmic cells, and comparison
to nuclear genes: Genetics, V. 121, p.
613–627.
Brown, W.M., George, J.R. M., and Wilson,
A.C., 1979. Rapid evolution of
animal mitochondrial DNA:
Proceedings National Academy of
Sciences, USA, V. 7(4), p. 1967-
1971.
Brown, G.G., Gadaleta, G., Pepe, G., and
Saccone, C., 1986, Structural
conservation and variation in the D-
loop containing region of vertebrate
mitochondrial DNA: Journal of
Molecular Biology, v. 192, p. 503-
511.

Lasbela University Journal of Science and Technology (2013) Vol-2 ISSN 2306-8256
Online available at www.luawms.edu.pk pg. 42
Cheng, Y., Xu, T., Shi, G., and Wang, R.,
2010, Complete mitochondrial
genome of the miiuy croaker
Miichthys miiuy (Perciformes,
Sciaenidae) with phylogenetic
consideration: Marine Genomics, v.
3, p. 201-209.
Chiang, H.C., Hsu, C.C., Lin, H.D., Ma,
G.C., Chiang, T.Y., and Yang, H.Y.,
2005, Population structure of bigeye
tuna (Thunnus obesus) in South
China Sea, Phillipine Sea and
Western Pacific Ocean inferred from
mitochondrial DNA: Fisheries
Research, v. 79, p. 219-225.
Excoffier, G., Laval, G., and Schneider, S.,
2005, Arlequin Version 3.0: An
integrated software package for
population genetics data
analysis:Evolutionary Bioinformatics
Online, v.1, p. 4750.
Formiga-Aquino, K., 2004, Variabilidade
genética da piramutaba
Brachyplatystoma vaillantii
(Valenciennes, 1840) (Siluriformes:
Pimelodidae) no sistema Estuário-
Amazonas-Solimões: Master Thesis,
National Institute for Amazonian
Research, Manaus, Brasil, 77p.
Hoelzel, A.R., M. Dahlheim and Stern,
1998, Low genetic variation among
killer whales (Orcinus orca) in the
eastern north Pacific and genetic
differentiation between foraging
specialists: Journal of Heredity, v.
89(2), p. 121–128.
Holden, M., and Reed, W., 1991, West
African freshwater fish.Longman
publishers LTD Singapore. 68p.
IUCN, 2012.IUCN Red List of Threatened
Species.Version 2012.1.IUCN
2012.IUCN Red List of Threatened
Species.
Nesbo, C.L., Arab, M.O., and Jakobsen,
K.S., 1998, Heteroplasmy, length
and sequence variation in the
mtDNA control regions of three
percid fish species (Perca fluviatilis,
Acerina cernua, Stizostedion
lucioperca): Genetics, v. 148(4), p.
1907–1919.
Nwafili, S.A., and Gao, T.X., 2007, Is the
Dutch domesticated Clarias
gariepinus a hybrid?: African
Journal of Biotechnology V.6(8), p.
1072-1076.
Santos, M.C.F., Ruffino, M.L., and Farias,
I.P., 2007, High levels of genetic
variability and panmixia of the
tambaqui Colossoma macropomum
(Cuvier, 1816) in the main channel
of Amazon River: Journal of Fish
Biology, V. 71(Suppl. A), p.33-44.
Vin˜ as, J., and Tudela S., 2009, A Validated
Methodology for Genetic
Identification of Tuna Species
(Genus Thunnus): PLoS ONE 4(10):
e7606.doi:10.1371/journal.pone.000
7606.
Watanabe, K., and Nishida, M., 2003,
Genetic population structure of
Japanese bagrid catfishes:
Ichtyological Research 50:140-148.
Whitehead, A., Aderson, S.L., Kuivila,
K.M., Roach, J.L., and May, B.,
2003, Genetic variation among
interconnected populations of
catostomus occidentalis:

Lasbela University Journal of Science and Technology (2013) Vol-2 ISSN 2306-8256
Online available at www.luawms.edu.pk pg. 43
implications for distinguishing impacts of
contaminants from biogeographic
structuring: Molecular Ecology, v.12,
p.2817-2833.
Wu, L., and Yang, J., 2012, Identification of
captive and wild Tilapia species existing in
Hawaii
by mitochondrial DNA control region
sequence PLoSONE,v. 7(12),p.51731.

Lasbela University Journal of Science and Technology (2013) Vol-2 ISSN 2306-8256
Online available at www.luawms.edu.pk pg. 44
MARINE SCIENCES
SHORT COMMUNICATION
Preliminary observation on Baseodiscus hemprichii (ribbon worm)
Faiz Muhammad1,
and Muhammad Shafi 2
1Centre of Excellence in Marine Biology, University of Karachi, Pakistan
2Lasbela University of Agriculture, Water and Marine Sciences, Uthal, Pakistan
ABSTRACT
Baseodiscus hemprichii were sampled from tidal rock pools; (5" in depth) from Buleji.
Observations were made on abundance and morphology of these two nemerteans. Length
measured as 45 cm on death. The relative abundance of Baseodiscus hemprichiiis 0.5%.
Keywords: Baseodiscus hemprichii, Buleji, nemerteans
Correspondence: Faiz Muhammad
Address:Centre of Excellence in Marine Biology University of Karachi, Pakistan
Email: [email protected]
Phone: +92-219261551 Fax: +92-21261398
Received: 5 May 2013 Revised: 8 Jun 2013 Accepted: 8 Jun 2013
Copyright: ©2013 Muhammad et al. This is an open-access article distributed under the terms
of the Creative Commons Attribution License, which permits unrestricted use, distribution, and
reproduction in any medium, provided the original author and source are credited
Competing Interests: The authors have declared that no competing interests exist.
______________________________________________________________________________
INTRODUCTION
Nemertean are commonly called as ribbon
worms, and are comprised two classes, 250
genera and 1150 species (Gibson 1995),
these animals are not found in abundance
(Thiel and Kruse 2001) and prey on
polychaetes and crustaceans (McDermott
and Roe, 1985) but some species are
scavengers (Heine et, al. 1991; Thiel 1998)
The size of nemertean varies ranging from
few millimeters to over 30 m such as Lineus
longissium. Scanty information is available
on this group of fauna because of difficulties
in their taxonomy.
In Pakistan insufficient studies were
conducted on Baseodiscus hemprichii.
Someauthors like (Puri1924) reported
Baseodiscus hemprichii while same species
was re-discovered (Kazmi and Gibson
1994). Present study is an attempt to give an
overview to this species.
MATERIALS AND METHODS
Observations were done at Buleji, rocky
shore (24o
51’N and 66o 48’E). At rocky
shore random tide pools were selected,
having mean depth of 5 inches, quadrate was
placed and animals were handpicked with
the help of forceps. Animal were narcotized
and preserved in 5% formalin for further

Lasbela University Journal of Science and Technology (2013) Vol-2 ISSN 2306-8256
Online available at www.luawms.edu.pk pg. 45
studies. Identification was done with key to
marine invertebrate (Wood hole). The
relative abundance was noted.
RESULTS AND DISCUSSION
aseodiscus hemprichii was found in tide
pools ( Fig 1A & B),the average water
level of tide pool was five inches and it was
lying on the rocks and color of Baseodiscus
hemprichii was milky white ventrally while
single long straight red scarlet was present
dorsally on entire body. The head
hadtransversered mark and the length
measured as 45 cm on death.The relative
abundance of Baseodiscus hemprichiiwas
0.5%. Earlier from Pakistan, Puri (1924) and
Kazmi and Gibson (1994) recorded this
species from the Pakistani coast. However,
moredimensional studies are needed to
reveal the ecological role, its reproduction,
development and molecular identification
Figure 1 A and B showing Baseodiscus hemprichii in tide pool
REFERENCES
Gibson. R, 1995. Nemertean Genera and
species of the world: an annotated
checklist of original names and
description citations, synonyms,
current taxonomic status habitats and
recorded zoogeographic distribution.
J.Nat.Histo. Vol 29,pp 271-561.
Heine, J.N., J.B. McClintock, M.Slattery &
J.Weston, 1991.Energetic
compositin, biomass, and chemical
defense in the common Antarctic
nemertean Parborlaia corrugatus
McIntosh. J.exp.mar.Biol.Ecol.153:
15-25.
McDermott. J.J and Roe,P.,1985.Food,
feeding behavior and feeding
ecology of nemerteans. Am.Zool.25:
113-125.
Puri, I.M. 1924. Nemertine worms from
Karachi. Proceedings of the Lahore
Philosophical society 3:71-72
Lasbela University Journal of Science and Technology (2013) Vol-2 ISSN 2306-8256
Online available at www.luawms.edu.pk pg. 46
Kazmi Q.B and Gibson R. 1994.On the
rediscovery of Baseodiscus
hemprichii (Ehrenberg, 1831)
(Nemertea, Anopla, Baseodiscidae)
from Karachi waters.
Thiel, M., 1998.Nemertines as predators on
tidal flats- High Noon at low tide.
Hydrobiologia 265:241-250.
Thiel.M. and Kruse.I, 2001.Status of the
Nemertea as predators in marine
ecosystems. Hydrobiologia 456:21-
32.
Lasbela University Journal of Science and Technology (2013) Vol-2 ISSN 2306-8256
Online available at www.luawms.edu.pk pg. 47
MICROBIOLOGY
RESEARCH ARTICLE
Identification and phylogenetic analysis of halophilic fungus
isolated from a man-made solar saltern in Thailand
Imran Ali1,2,4
, Sudip K. Rakshit1, Napa Siwarungson
3, Hunsa Punnapayak
4, Pongtharin
Lotrakul4, Sehanat Prasongsuk
4, Ali Akber
1 and Zia Ur Rehman
1,2
1Food Engineering and Bioprocess Technology, School of Environment, Resources and
Development, Asian Institute of Technology, Klong Luang, Pathumthani 12120, Thailand. 2Institute of Biochemistry, University of Balochistan, Quetta, 83700, Pakistan.
3Department of Biochemistry, Faculty of Science, Chulalongkorn University, Bangkok 10330,
Thailand. 4Department of Botany, Faculty of Science, Plant Biomass Utilization Research Unit,
Chulalongkorn University, Bangkok, 10330, Thailand.
ABSTRACT
The halophilic fungus was isolated from one of the man-made solar salterns located in Ban
Laem district of Phetchaburi province in Thailand. Harsh physical conditions were found in
hypersaline habitat. Morphological identification revealed that the fungus was having white
colored colonies, cotton like appearance, septate mycelia, pointed hyphae and medium sized
spores. The fungus was able to grow from 0-20% of NaCl concentration (w/v). The halophilic
fungus was identified as Engyodontium album with 100% similarity. Phylogenetic analysis
expressed the evolution pattern of isolated halophilic fungus.
Keywords:Halophilic fungus, solar saltern, Engyodontium album, Thailand
____________________________________________________________________________
Correspondence: Imran Ali
Address: Food Engineering and Bioprocess Technology, School of Environment, Resources
and Development, Asian Institute of Technology, Klong Luang, Pathumthani 12120, Thailand.
Email: [email protected]
Phone: +66-2692-0583 Fax: +66-2524-6200
Received: 18 April 2013 Revised: 16 August 2013 Accepted: 20 August 2013
Copyright: ©2013 Ali et al. This is an open-access article distributed under the terms of the
Creative Commons Attribution License, which permits unrestricted use, distribution, and
reproduction in any medium, provided the original author and source are credited
Competing Interests: The authors have declared that no competing interests exist.
____________________________________________________________________________

Lasbela University Journal of Science and Technology (2013) Vol-2 ISSN 2306-8256
Online available at www.luawms.edu.pk pg. 48
INTRODUCTION
Extremophiles requiring salt concentrations
for their growth and reproduction are termed
as halophiles (Ali et al, 2012; Madigan et al,
1997; Reed, 1986). Larsen. (1962) classified
halophilic microorganisms into four classes
on the basis of their saline habitats: 1) Non
halophilic microorganism. This group
represents those microorganisms which can
survive and grow in salt concentrations
lower than 2% NaCl (w/v); 2) Slight
halophilic microorganisms: which can
survive and reproduce in NaCl concentration
of 2-5% (w/v); 3) Moderate halophilic
microorganisms: which can grow, survive
and reproduce in NaCl concentration of 5-
20% (w/v) and; 4) Extreme halophilic
microorganisms: which can grow, survive
and reproduce in NaCl concentration of 20-
30% (w/v).
Fungi that are halophilic microorganisms
have only been found in the last decade
(Gunde-Cimerman et al., 2000). According
to Gunde-Cimerman et al., (2009), the fungi
which can be isolated frequently across the
globe from natural hypersaline habitats
having upto 3 M concentration of sodium
chloride, can be categorized as halophiles.
Sporadic fungi which are capable of
tolerating in vitro concentration of 3 M
sodium chloride are termed as halotolerants
(Al-Abri, 2011). However, there is a
difference between halophilic fungi and
obligate halophilic fungi, as the later one
cannot grow and survive in NaCl free
medium.
The mycobiota of halophilic fungi in the
hypersaline environments around the world
comprise of different species of genus
Cladosporium, Alternaria, Scopulariopsis
and Wallemia (Butinar et al, 2005; Gunde-
Cimerman et al, 2000; Zalar et al, 2007) and
random species from the genus Aspergillus
and Penicillium (Ali et al, 2012; Ali et al,
2013, Cantrell et al, 2006).
Engyodontium album has been known
mostly as marine fungi and it has been
reported to be potential fungi for the
production of proteases (Chellappan et al,
2006; Chellappan et al, 2010). Interestingly
it has also been sampled from the
stratospheric air (Wainwright et al,
2003).However it has never been reported
from the hypersaline environment.
Our aim of this study is to report the
presence of Engyodontium album in
hypersaline environment (man-made solar
saltern) and to check its halotolerance.
METHODOLOGY
Site Description
The soil sample was collected from one of
the man-made solar salterns located at
Phetchaburi province of Thailand in the
month of April. Soil analysis confirmed the
site to be hypersaline habitat with NaCl
concentration of 13.11% and low levels of
total organic carbon, nitrogen and organic
matter were found (Ali et al., 2012)
.
Isolation of halophilic fungus
Fungus was isolated by serial dilution
method on potato dextrose agar (PDA)
having 15% of NaCl. The isolate was
separated from obligate halophilic fungi by
checking its growth in NaCl free medium
(Ali et al. 2012).
Morphological identification of fungus
Morphological study was aided by available
literatures (Barnett and Hunter, 1972;
Carmichael et al, 1980; Ellis, 1971; Ellis,
1976; Klich and Pitt, 1988; Subramanian,
1976). Microscopic studies were performed
by the help of stereomicroscope (Olympus
SZ30) and by fluorescent microscope
(Olympus BX60).

Lasbela University Journal of Science and Technology (2013) Vol-2 ISSN 2306-8256
Online available at www.luawms.edu.pk pg. 49
Molecular identification of halophilic fungus
DNA was isolated from the fungus by using
NucleoSpin® Plant II Kit (Macherey-Nagel,
Germany). Standard protocol for fungal
DNA isolation, provided with the kit was
used. Isolated DNA was sent for obtaining
internal transcribed spacer (ITS) 1-4
sequence to the mycology lab at National
Science and Technology Development
Agency (NSTDA) Pathumthani, Thailand.
Isolate was identified and sequence
similarities were studied by using Basic
Local Alignment Search Tool (BLAST)
from National Centre for Biotechnology
Information (NCBI) website. Phylogenetic
tree was reconstructed by neighbor joining
(NJ) method, using Editseq (DNASTAR
Lasergene), Clustal X version 1.81
(Thompson et al, 1997) and MEGA 4.0.2
(Tamura et al, 2007).
RESULTS AND DISCUSSION
Fungal isolation and morphological study
Morphological observations are summarized
in table 1.
Table1:Morphological observations of
Engyodontium album isolated from a man-
made solar saltern in Thailand
Parameter Result
Lab code SWAF
Colony color White
Colony appearance Cotton like
Spore size Medium
Mycelium Septate
Number of isolates 3
Halotolerance 0-20 % NaCl (w/v)
Colony color of cotton like SWAF (lab
code) was found white in color (Fig 1).
The isolated fungus was able to grow on
PDA supplemented with 15% NaCl (w/v),
which proves that this is halotolerant
fungus.Initial quantity of NaCl provided for
culture isolation was selected on the basis of
soil salinity which was found as 13.11% (Ali
et al, 2012).
Figure1: Colony of SWAF (Engyodontium
album) on PDA supplemented with 15 %
NaCl concentration (w/v).
The halotolerance of the fungus was found
ranging from 0-20 % of NaCl concentration
(w/v). The halotolerance test proved the
isolate to be halophilic fungus as it was
isolated from the hypersaline habitat and
was able to survive over 3 molar
concentration of NaCl. Total 3 numbers of
SWAF were found amongst 43 fungal
isolates, which makes approximately 7% of
its presence in total fungal population.
Microscopic observations revealed the
isolate having septated mycelia, pointed
fruiting hyphae and medium sized spores
(Fig 2).

Lasbela University Journal of Science and Technology (2013) Vol-2 ISSN 2306-8256
Online available at www.luawms.edu.pk pg. 50
Figure 2: Engyodontium album, under
stereoscopic microscope showing:
mycelium, reproductive hyphae and spores.
Molecular identification
SWAF was found to be Engyodontium
album strain NRRL 2312 when ITS 1-4
sequences obtained was compared using
BLAST tool analysis on NCBI. Accession
number was found as JF77960. The
similarity was found as 100% (Table 2).
Table 2: Information of species, strain,
similarity percentage and accession number
of Engyodontium album isolated from a
man-made solar saltern in Thailand.
Information Findings
Species Engyodontium album
Strain strain NRRL 2312
Similarity 100%
Accession number JF77960
Phylogenetic analysis
The phylogenetic tree for Engyodontium
album JF77960 is presented in figure 3.Tree
shows that Engyodontium album
DFFSCS022 is found to be the most closely
related species, while Engyodontium album
UTHSCSA and Engyodontium sp FSU9303
were found to be earlier evolved than
Engyodontium album JF77960.
Figure 3.Phylogenetic tree: The genus and
species are followed by their accession
number. Isolated fungus in the tree is given
in bold.
Engyodontium species and Lecanicillium
lecanii V56 were found to have a common
node at boot strap value of 96%.
Simplicillium wallacei CBS 101237 and
Cordyceps pseudomilitaris NBRC 101410
appeared to be far relatives of Engyodontium
album JF77960 in the phylogenetic tree.
CONCLUSION
This study reports the presence of
Engyodontium album from the hypersaline
habitat which is a man-made solar saltern
located in Phetchaburi province, Thailand.
To the best of our knowledge this is the first
time any strain of Engyodontium album
being reported as halophilic fungus. Our
findings will increase interests of scientific
community in Engyodontium album. In
depth, study of this strain will provide more
information about adaptations and responses
of Engyodontium album to its saline
environment. This halophilic fungus also
holds potential to be the sources of
important biological compounds and are
being studied further.
Lasbela University Journal of Science and Technology (2013) Vol-2 ISSN 2306-8256
Online available at www.luawms.edu.pk pg. 51
ACKNOWLEDGEMENT
We will like to thanks all lab staff of King
Mongkut’s University of Technology
Thonburi for their technical support and
guidance throughout this work.
REFERENCES
Al-Abri, S.K. 2011,Use of molecular
approaches to study the occurrence
of extremophiles and extremodures
in non-extreme environments:
Doctoral Thesis, University of
Sheffield, England, Sheffield:
University of Sheffield.
Ali, I. Kanhayuwa, L. Rachdawong, S.
Rakshit, S.K. 2012, Identification,
phylogenetic analysis and
characterization of obligate
halophilic fungi isolated from a man-
made solar saltern in Phetchaburi
province, Thailand: Annals of
Microbiology, doi: 10.1007/s13213-
012-0540-6
Ali, I. Siwarungson, N. Punnapayak, H.
Lotrakul, P. Prasongsuk, S.
Bankeeree, W. Rakshit, S.K.
2013,Screening of potential
biotechnological applications from
obligate halophilic fungi, isolated
from a man-made solar saltern
located in Phetchaburi province,
Thailand (in press) Pak. J. Bot.
Barnett, H.L. Hunter, B.B. 1972, Illustrated
Genera of Imperfect Fungi, 3rd edn:
Burgess Publishing Company.
Butinar, L. Zalar, P. Frisvad, J.C. Gunde-
Cimerman, N. 2005, The genus
Eurotium – members of indigenous
fungal community in hypersaline
waters of salterns: FEMS
Microbiology Ecology, v.51, p. 155–
166.
Cantrell, S.A. Casillas-Martinez, L. Molina,
M. 2006, Characterization of fungi
from hypersaline environments of
solar salterns using morphological
and molecular techniques:
Mycological research v.110, p. 962–
970.
Carmichael, J.W. Kendrick, W.B. Conners,
I.L. Sigler, L. 1980,Genera of
Hyphomycetes: University of
Alberta Press, Alberta, Canada.
Chellappan, S. Jasmin, C. Basheer, S.M.
Kishore, A. Elyas, K.K. Bhat, S.G.
Chandrasekaran, M. 2010,
Characterization of an extracellular
alkaline serine protease from marine
Engyodontium album BTMFS10:
Journal ofIndian Microbiology and
Biotechnology,v. 38, p. 743–752.
Chellappan, S. Jasmin, C. Basheer, S.M.
Elyas, K.K. Bhat, S.
Chandrasekaran, M. 2006,
Production, purification and partial
characterization of a novel protease
from marine Engyodontium album
BTMFS10 under solid state
fermentation: Process Biochemistry,
v. 41, p. 956–961.
Ellis, M.B. 1971,Dematiaceous
Hyphomycetes: Commonwealth
Mycological Institute, Kew England.
Ellis, M.B. 1976, More Dematiaceous
hyphomycetes: Commonwealth,
Mycological Institute, Kew,
England.
Lasbela University Journal of Science and Technology (2013) Vol-2 ISSN 2306-8256
Online available at www.luawms.edu.pk pg. 52
Klich, M.A. Pitt, J.I. 1988,A laboratory
guide to the common Aspergillus
species and their teleomorphs:
Commonwealth Scientific and
Industrial Research Organization,
Division of Food Processing in
North Ryde, N.S.W.
Larsen, H. 1962, Halophilism. Quoted in
R.H. Vreeland and L.I. Hochstein
(eds.). (1993). The Biology of
Halophilic Bacteria (p. 87). Boca
Raton: CRC Press
Madigan, M.T. Martinko, J.M. Parker, J.
1997,Brock: Biology of
Microorganisms: 8th ed. Prentice-
Hall, Inc., Upper Saddle River, New
Jersey.
Subramanian, C.V. 1976, Hyphomycetes:
Indian Council of Agricultural
Research, New Delhi.
Tamura, K. Dudley, J. Nei, M. Kumar, S.
2007, MEGA4: Molecular
Evolutionary Genetics Analysis
(MEGA) software version 4.0:
Molecular Biology and Evolution, v.
24, p. 1596-1599.
Thompson, J.D. Gibson, T.J. Plewniak, F.
Jeanmougin, F. Higgins, D.G. 1997,
The Clustal X windows interface:
flexible strategies for multiple
sequence alignment aided by quality
analysis tools: Nucleic Acids
Research, v. 24, p. 4876–4882.
Reed, R.H. 1986, Halotolerant and
halophilic microbes. In: Herbert RA,
Codd GA (eds), Microbes in
Extreme Environments. Academic
Press Inc, London, pp. 55-82.
Gunde-Cimerman, N. Ramos, J. Plemenitaš,
A. 2009, Halotolerant and halophilic
fungi: Mycological Research, v. 113,
p. 1231–1241.
Gunde-Cimerman, N. Zalar, P. de Hoog, S.
Plemenitaš, A. 2000, FEMS
Microbiol Ecology, v. 32, p. 235–
240.
Wainwright, M. Wickramasinghe, N.C.
Narlikar, J.V. Rajaratnam, P. 2003,
Microorganisms cultured from
stratospheric air samples obtained at
41 km: FEMS Microbiology Letters,
v. 218, p.161–165.
Zalar, P. de Hoog, G.S. Schroers, H-J.
Frank, J.M. Gunde-Cimerman, N.
2005, Taxonomy and phylogeny of
the xerophilic genus Wallemia
(Wallemiomycetes and Wallemiales,
cl. et ord. nov.): Antonie van
Leeuwenhoek, v. 87, p. 311–328.

Lasbela University Journal of Science and Technology (2013) Vol-2 ISSN 2306-8256
Online available at www.luawms.edu.pk pg. 53
VETERINARY SCIENCES
RESEARCH ARTICLE
In vitro antibacterial activity of Sorghum halepense
Rooh-ul-Amin1, Muhammad Adil
2, Kashif Hayat
1, Arbab Sikandar
2, Farmanullah
3, Saeed
Khan4
and Hazrat Nabi4
1Department of Botany, Abdul Wali Khan University, Mardan, Pakistan
2Department of Basic sciences, College of Veterinary & Animal sciences, Jhang,
Pakistan 3Lasbela University of Agriculture, Water and Marine Sciences, Uthal, Pakistan
4Department of Livestock & Dairy Development, Khyber Pakhtunkhwa, Pakistan
ABSTRACT
Agar well diffusion assay was executed to evaluate the in vitro antibacterial activity of
chloroform, ethyl acetate and n-hexane extracts of Sorghum halepense against three
bacterial species i.e., Bacillus subtilis (ATCC-6633), Escherichia coli (ATCC-25922)
and Staphylococcus aureus (ATCC-25923). Results of the current study revealed that
chloroform, ethyl acetate and n-hexane extracts exhibited notable antibacterial action
against the tested gram positive bacteria, i.e., Bacillus subtilis and Staphylococcus
aureus. Whereas the sensitivity of gram negative bacteria (Escherichia coli) to
antibacterial action of plant extracts was considerably trivial. Moreover, chloroform
extract was superior to ethyl acetate and n-hexane extracts in terms of antibacterial
activity. By taking the overall results it was concluded that Sorghum halepense is a
potential source of natural antibacterial constituents. Additional research should be
undertaken to elaborate the mechanism of action and antimicrobial spectrum of Sorghum
halepense. Furthermore, screening of plant extracts for antibacterial efficacy against
resistant strains of Staphylococcus aureus, for instance methicillin-resistant
Staphylococcus aureus (MRSA) is also recommended.
Keywords:Sorghum hlepense, antibacterial, Escherichia coli, Staphylococcus aureus
_____________________________________________________________________ Correspondence: Muhammad Adil Address: Department of Basic sciences, College of Veterinary & Animal sciences, Jhang,
Pakistan Email: [email protected] Phone: +92-345-9358013 Received: 15 Jun 2013 Revised: 03 July 2013 Accepted: 10 July 2013 Copyright: ©2013 Adil et al. This is an open-access article distributed under the terms of the
Creative Commons Attribution License, which permits unrestricted use, distribution, and
reproduction in any medium, provided the original author and source are credited Competing Interests: The authors have declared that no competing interests exist. ________________________________________________________________________
Lasbela University Journal of Science and Technology (2013) Vol-2 ISSN 2306-8256
Online available at www.luawms.edu.pk pg. 54
INTRODUCTION
Plants constitute the oldest and
Indispensablesource for the derivation
of vast number of drugs thus providing the
remedy for various human and animal
diseases.Severalforms of complementary
medicine practicedin developing countries
exclusively rely on the use of herbal
preparations to treat ailments. Growing
progress in the fields of medicinal
chemistry, pharmacognosy and ethno-
pharmacology has further extended the
scope and utility of herbal
medicines.Likewise the optimal application
of various drug discovery methods (such as
bio-prospecting and random screening) has
enabled scientists to exploit the medicinal
potential of more and more plant-
derivedsubstances. The antimicrobial
potential of medicinal plants has been
globally acknowledged (Valero and
Salmeron, 2003).
It has been reported that certain bacterial
isolates have acquired the capabilityfor
developing antibiotic resistance (Fluit et al.,
2000; Sahm et al., 2001; Schwaber et al.,
2006)that is regarded as a global challenge
for medical science. This emergent
antibiotic resistance is attributable to
indiscriminate use of antibiotics for treating
human and animal diseases. The problem is
further exacerbated by the inability of new
antibiotics to attack bacteria in disparate
ways therebyevading the resistant genes.
Therefore, finding antimicrobial agents
effective against resistant bacteria would be
an advantage.
Bacillus subtilis (B. subtilis), Escherichia
coli (E. coli)andStaphylococcus aureus (S.
aureus) have been implicated in causing
hospital-acquired infections (Fluit et al.,
2000; Karlowsky et al., 2004; Huang et al.,
2006). Regardless of being considered as
the normal inhabitants of humans, animals
and environment, these organisms manifest
an incredible tendency of acting as
opportunistic pathogens.
Sorghumhalepense(S. halepense) is a
globallydistributed perennial weed (Huang
et al., 2010; Loddo et al., 2012). Its
nutritional value is equivalent to that of
Sudangrassandalfalfa(Bennert,
1973).Conversely this plant can sometimes
instigate cyanide toxicity in livestock owing
to the presence of cyanogenic glycosides
(Findlay, 1975; Looker, 1981). The
allelopathic potential of S. halepense has
been well-documented due to the presence
of numerous phenolics and flavonoids in its
different parts (Huang et al., 2010; Liu et
al., 2011).S. halepense also possesses
ethnomedicinal value and is being used as
demulcent and diuretic (Naw Bahaar and
Bhat, 2012). This study was accomplished
to investigate the in vitro antibacterial
activity of chloroform, ethyl acetate and n-
hexaneextracts of S. halepense using agar
well diffusion method.
MTERIALS AND METHODS
Collection of plant and extraction
The plant material, specimen (Voucher
specimen # AWK/BOT/S.H/02) was
collected randomly from two areas i.e.,
Parmoli and Shewa Adda (district, Swabi,
Khyber Pakhtunkhwa, Pakistan). The
research work of this project was carried
out in Botany Laboratory, Department of
Botany, Abdul Wali Khan University,
Mardan, Pakistan. The plant material was
air dried by keeping it at room temperature
for three weeks in the dark conditions. The
dried plant material was milled to obtain a
fine powder. Two liters of methanol
solution was taken in an air tight glass jar
for soaking two hundred grams of the
minced plant material for 7 days at room
temperature. Filtration was performed
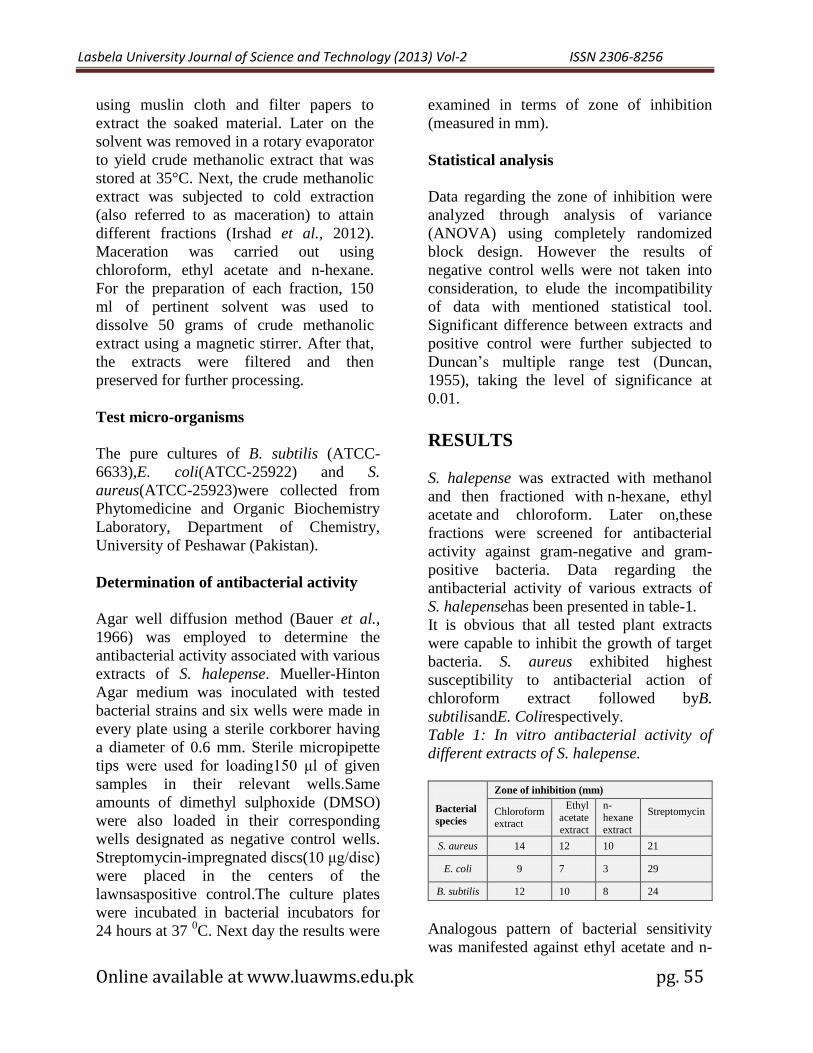
Lasbela University Journal of Science and Technology (2013) Vol-2 ISSN 2306-8256
Online available at www.luawms.edu.pk pg. 55
using muslin cloth and filter papers to
extract the soaked material. Later on the
solvent was removed in a rotary evaporator
to yield crude methanolic extract that was
stored at 35°C. Next, the crude methanolic
extract was subjected to cold extraction
(also referred to as maceration) to attain
different fractions (Irshad et al., 2012).
Maceration was carried out using
chloroform, ethyl acetate and n-hexane.
For the preparation of each fraction, 150
ml of pertinent solvent was used to
dissolve 50 grams of crude methanolic
extract using a magnetic stirrer. After that,
the extracts were filtered and then
preserved for further processing.
Test micro-organisms
The pure cultures of B. subtilis (ATCC-
6633),E. coli(ATCC-25922) and S.
aureus(ATCC-25923)were collected from
Phytomedicine and Organic Biochemistry
Laboratory, Department of Chemistry,
University of Peshawar (Pakistan).
Determination of antibacterial activity
Agar well diffusion method (Bauer et al.,
1966) was employed to determine the
antibacterial activity associated with various
extracts of S. halepense. Mueller-Hinton
Agar medium was inoculated with tested
bacterial strains and six wells were made in
every plate using a sterile corkborer having
a diameter of 0.6 mm. Sterile micropipette
tips were used for loading150 μl of given
samples in their relevant wells.Same
amounts of dimethyl sulphoxide (DMSO)
were also loaded in their corresponding
wells designated as negative control wells.
Streptomycin-impregnated discs(10 μg/disc)
were placed in the centers of the
lawnsaspositive control.The culture plates
were incubated in bacterial incubators for
24 hours at 37 0C. Next day the results were
examined in terms of zone of inhibition
(measured in mm).
Statistical analysis
Data regarding the zone of inhibition were
analyzed through analysis of variance
(ANOVA) using completely randomized
block design. However the results of
negative control wells were not taken into
consideration, to elude the incompatibility
of data with mentioned statistical tool.
Significant difference between extracts and
positive control were further subjected to
Duncan’s multiple range test (Duncan,
1955), taking the level of significance at
0.01.
RESULTS
S. halepense was extracted with methanol
and then fractioned with n-hexane, ethyl
acetate and chloroform. Later on,these
fractions were screened for antibacterial
activity against gram-negative and gram-
positive bacteria. Data regarding the
antibacterial activity of various extracts of
S. halepensehas been presented in table-1.
It is obvious that all tested plant extracts
were capable to inhibit the growth of target
bacteria. S. aureus exhibited highest
susceptibility to antibacterial action of
chloroform extract followed byB.
subtilisandE. Colirespectively.
Table 1: In vitro antibacterial activity of
different extracts of S. halepense.
Bacterial
species
Zone of inhibition (mm)
Chloroform extract
Ethyl
acetate
extract
n-
hexane
extract
Streptomycin
S. aureus 14 12 10 21
E. coli 9 7 3 29
B. subtilis 12 10 8 24
Analogous pattern of bacterial sensitivity
was manifested against ethyl acetate and n-

Lasbela University Journal of Science and Technology (2013) Vol-2 ISSN 2306-8256
Online available at www.luawms.edu.pk pg. 56
hexane extracts. Significantly higher zones
of inhibition were observed in case of
positive control wells whereas negative
control wells did not demonstrate detectable
zones of inhibition.
Table 2: ANOVA-based comparison of
antibacterial activity of plant extracts and
control
Experimental
unit
Calculated
F-value
F-
table
value
Conclusion
Bacterial
species 0.42857 10.92 Non-
significant Plant
extracts 15.08 9.78 Significant
Both gram positive bacterial species (B.
subtilis and S. aureus)demonstrated a
comparable degree of growth inhibition in
response to the application of plant extracts.
Nevertheless gram negative bacteria (E.
coli) exhibited relatively less susceptibility
to the antibacterial activity of administered
plant extracts. Comparison of the bacterial
sensitivity to plant extracts was carried out
using analysis of variance (ANOVA). The
type of targeted bacteria did not induce
substantial modification in bacterial
sensitivityto respective plant extracts (as
signified in table: 2).
Table 3: Comparisons among the treatment
means
Plant extracts Mean values n-hexane extract 7ab
Ethyl acetate extract 9.66bc
Chloroform extract 11.66ac
Streptomycin 24.66
According to DMRT,values followed by
similar subscript are not significantly
different.
Remarkable discrepancy was evident in the
antibacterial activity of various plant
extracts. This phenomenal variation in the
antibacterial activity of different extracts
could be attributed to substantial polar
diversity of individual solvents thus
governing the composition and efficacy of
resultant extracts. Apparently chloroform
extract was found to yield highest
antibacterial activity against the tested
bacteria followed by ethyl acetate and n-
hexane extracts respectively (as illustrated
in table: 1). Therefore comparisons among
the treatment means were executed using
Duncan’s multiple range test (Duncan,
1955). However the comparison of
antibacterial potential among various
extracts reflected the lack of statistical
significance. Conversely, a statistically
significant variation was observed by
comparing the antibacterial activity of each
distinct plant extract with positive control
(as indicated in table: 3).
DISCUSSION
Results of the current study provided
evidence regarding theantibacterial activity
of chloroform, ethyl acetate and n-hexane
extracts of S. halepenseagainst the tested
bacteria. Our results reinforce the findings
of Nicollieret al., 1983, who reported that
methanolic extract of S. halepense inhibited
the growth of several bacteria. Besides,
many studies have reflected the
antimicrobial activity of S. halepense
against different pathogens (Bahraminejadet
al., 2011; Yanar et al.,2011 and Javaidet al.,
2012). The shoot portion of this plant
consists of many active phytotoxic
substances including ethyl p-
hydroxybenzoate and p-
hydroxybenzaldehyde which could be
expected to exert the consequent
antimicrobial activity (Javaidet al.,
2012).Appraisal of the biosynthesis of plant
phenolics stipulates that p-
hydroxybenzaldehyde is formed from
salicylic acid (Dicko et al., 2006) which is

Lasbela University Journal of Science and Technology (2013) Vol-2 ISSN 2306-8256
Online available at www.luawms.edu.pk pg. 57
known for having optimal antibacterial
activity (El-mougy, 2002). Furthermore, the
leaf and rhizome extracts of S. halepense
have been documented to contain many
flavonoids and phenolic compounds such as
dhurrin, taxiphyllin, sorgoleone, prunasin,
proanthocyanidins, p-coumaric acidand
chlorogenic acid (Nicollier et al., 1983;
Czarnota et al., 2003). Another probable
mechanism for the antimicrobial activity of
phenolic compounds could be the chelation
of iron with subsequent disruption of
microbial oxidative metabolic system (O,
Connell and Fox, 2001).
Crude phenolic, saponin and methanolic
extracts of Sorghum have been recorded to
exert inhibitory action on the growth of L.
monocytogenes, B. cereus, S. aureus and E.
coli (Khadambi, 2005; Soetan et al., 2006;
Mohamed et al., 2009). Several studies have
evinced the effectiveness of sorghum
proanthocyanidins against influenza virus,
herpes simplex virus (Lu et al., 2004;
Hamauzu et al., 2005) and human
melanoma (Gomez-Cordoves et al.,2001).
Proanthocyanidins exhibit their
antimicrobial action through the inhibition
of hydrolytic enzymes and inactivation of
microbial adhesions (Cowan, 1999).
The differential sensitivity of microbial
strains to administered extracts can be
elucidated on the basis of peculiarity in the
structure of bacterial cell wall. Gram
negative bacteria tend to be relatively
resistant to antibacterial substances by
virtue of outer membrane in their cell wall
and surrounding glycocalyx. Outer
membrane imparts hydrophilic nature to the
cell wall and acts as a strict permeability
barrier(Smith-Palmer et al., 1998). Another
integral element of gram negative cell wall
is the periplasmic space that contains
essential enzymes meant for the
neutralization of foreign substances (Duffy
and Power, 2001).
By taking the overall results it was
concluded thatS. halepenseis a potential
source of natural antibacterial constituents.
Nevertheless additional research should be
undertaken to elaborate the mechanism of
action and antimicrobial spectrum ofS.
halepense. Furthermore, screening of plant
extracts for antibacterial efficacy against
resistant strains of S. aureus, for example
methicillin-resistant S. aureus (MRSA) is
also recommended.
REFRENCES
Bahraminejad, S., Abbasi, S., and Fazlali,
M., 2011, In vitro antifungal activity
of 63 Iranian plant species against
three different plant pathogenic fungi,
African Journal of Biotechnology, v.
10, p. 16193-16201.
Bauer, A. W., Kirby, W. M., Sherris, J. C.,
and Turk, M., 1966,Antibiotic
susceptibility testing by a standardized
single disk method, American Journal
of Clinical Pathology, v. 4, p. 493-
496.
Bennett, H. W., 1973, Johnsongrass,
carpetgrass and other grasses for the
humid south, in Heath, M. E.,
Metcalfe, D. S., and Barnes, R. F.,
editors, Forages, Iowa State
University Press, Ames, Iowa, p. 286-
293.
Cowan, M. M., 1999, Plants products as
antimicrobial agents. Clinical
Microbiology Reviews, v. 12, p. 564-
582.
Czarnota, M. A., Rimando, A. M., and
Weston, L. A., 2003, Evaluation of
root exudates of seven sorghum
accessions,Journal of

Lasbela University Journal of Science and Technology (2013) Vol-2 ISSN 2306-8256
Online available at www.luawms.edu.pk pg. 58
ChemicalEcology, v. 29, p. 2073–
2083.
Dicko, M. H., Gruppen, H., Traoré, A. S.,
Voragen, A. G. J., and Van Berkel,
W. J. H., 2006, Phenolic compounds
and related enzymes as determinants
of sorghum for food use,
Biotechnology and Molecular Biology
Review, v.1, p. 21-38.
Duffy, C. F., and Powell, R. F., 2001,
Antioxidant and antimicrobial
properties of some Chinese plant
extracts, International Journal of
Antimicrobial Agents, v. 17, p. 527-
529.
Duncan, D. B., 1955, Multiple rangeand
multiple F test, Biometrics, v. 11, p.
1–24.
El-Mougy, N. S., 2002, In vitro studies on
antimicrobial activity of salicylic acid
and acetylsalicylic acid as pesticidal
alternatives against some soilborne
plant pathogens, Egyptian Journal of
Phytopathology, v. 30, p. 41-55.
Findlay, R. M., 1975, Potential menace of
Johnsongrass, New Zealand Journal of
Agriculture,v. 130, p. 40-41.
Fluit, A. C., Jones, M. E., Schmitz, F. J.,
Acar, J. G., and Verhoef, J., 2000,
Antimicrobial susceptibility and
frequency of occurrence of clinical
blood isolates in Europe from the
SENTRY antimicrobial surveillance
program, 1997-1998, Clinical
Infectious Diseases, v. 30, p. 454-60.
Gomez-Cordoves C., Bartolome B., Vieira
W., and Virador V. M., 2001, Effects
of wine phenolics and sorghum
tannins on tyrosinase activity and
growth of melanoma cells, Journal of
Agriculture and Food Chemistry, v.
49, p.1620-1624.
Hamauzu, Y., Yasui, H., Inno, T., Kume,
C., and Omanyuda, M., 2005,
Phenolic profile, antioxidant property,
and anti-influenza viral activity of
chinese quince (Pseudocydonia
sinensis Schneid.), quince (Cydonia
oblonga Mill.), and apple (Malus
domestica Mill.) fruits, Journal of
Agriculture and Food Chemistry, v.
53, p. 928-934.
Huang, Y. C., Chou, Y. H., Su, L. H., Lien,
R. I., Lin, and T. Y., 2006,
Methicillin-Resistant Staphylococcus
aureuscolonization and its association
with infection among infants
hospitalized in neonatal intensive care
units, Pediatrics, v. 118, p. 469-474.
Huang, H., Liu, Y., Meng, Q., Cui S. W.
H., and Zhang, C., 2010,
Flavonolignans and other phenolic
compounds from Sorghum halepense
(L.) Pers,Biochemical Systematics and
Ecology, v.38,p. 656-658.
Irshad, S., Mahmood, M., and Perveen, F.,
2012, In-vitro anti-bacterial activities
of three medicinal plants using agar
well diffusion method, Research
Journal of Biology, v. 2, p. 1-8.
Javaid, A., Naqvi, S. F., and Shoaib, A.,
2012, Antifungal activity of
methanolic extracts of Sorghum
halepense against Macrophomina
phaseolina, Journal of Medicinal
Plants Research, v. 6, p.4102-4106
Karlowsky, J. A., Jones, M. E., Draghi, D.
C., Thornsberry, C., Sahm, D. F., and
Volturo, G. A., 2004, Prevalence of

Lasbela University Journal of Science and Technology (2013) Vol-2 ISSN 2306-8256
Online available at www.luawms.edu.pk pg. 59
antimicrobial susceptibilities of
bacteria isolated from blood cultures
of hospitalized patients in the United
States in 2002,Annals of Clinical
Microbiology and Antimicrobials, v.
3, p. 7.
Khadambi, T. N., 2005, Antimicrobial
properties of phenolic compounds
from sorghum, M. Sc. (Agric.), thesis:
University of Pretoria, Pretoria, p. 46-
65.
Liu, Y., Zhang, C., Wei, S., Cui, H., and
Huang, H., 2011,Compounds from the
subterranean part of Johnsongrass and
their allelopathic potential, Weed
Biology and Management, v. 11, p.
160-166.
Loddo, D., Masin, R., Otto, S., and Zanin,
G., 2012,Estimation of base
temperature for Sorghum halepense
rhizome sprouting, Weed Research, v.
52, p. 42-49.
Looker, D., l98l, Johnsongrass has an
Achilles heel, New Farm,v. 3,p. 40-
47.
Lu, L., Liu, S., Jiang, S., and Wu, S.,
2004,Tannins inhibit HIV-1 entry by
targeting gp41, Acta Pharmacologica
Sinica, v.25, p. 213-218.
Mohamed, S. K., Ahmed, A. A. A., Yagi,
S. M., and Abd Alla, A. E. W. H.,
2009, Antioxidant and Antibacterial
Activities of Total Polyphenols
Isolated from Pigmented Sorghum
(Sorghum bicolor) Lines, Journal of
Genetic Engineering and
Biotechnology, v. 7, p. 51-58.
Naw Bahaar, S. W., and Bhat, G. A.,
2012,Diversity and distribution of
ethno-medicinal flora in the rice field
agro-ecosystems of Kashmir valley (J
and K) India, Journal of Science, v. 1,
p. 63-71.
Nicollier, G. F., Pope, D. F., and
Thompson, A. C., 1983, Biological
activity of dhurrin and other
compounds from Johnson grass
(Sorghum halepense), Journal of
Agriculture and Food Chemistry, v.
31, p. 744–748.
O, Connell, G. E., and Fox, P. F., 2001,
Significance and applications of
phenolic compounds in the production
and quality of milk and dairy
products: a review, International Dairy
Journal, v. 11, p. 103-120.
Sahm, D. F., Thornsberry, C., Mayfield, D.
C., Jones, M. E., and Karlowsky, J.
A., 2001, Multidrug-resistant urinary
tract isolates of E. coli: prevalence and
patient demographics in the United
States,Antimicrobial Agents and
Chemotherapy, v. 45, p. 1402-1406.
Schwaber, M. J., Navon-Venezia, S.,
Kaye, K. S., Ami, R. B., Schwartz, D.,
and Carmeli, Y., 2006, Clinical and
economic impact of bacteremia with
extended- spectrum-ß-lactamase-
producing
Enterobacteriaceae,Antimicrobial
Agents and Chemotherapy,v. 50, p.
1257-1262.
Smith-Palmar, A., Stewart, J., and Fyfe, L.,
1998, Antimicrobial properties of
plant essential oils and essences
against five important food-borne
pathogens, Letters in Applied
Microbiology, v. 26, p. 118-122.

Lasbela University Journal of Science and Technology (2013) Vol-2 ISSN 2306-8256
Online available at www.luawms.edu.pk pg. 60
Soetan, K. O., Oyekunle, M. A.,
Aiyelaagbe O. O., and Fafunso, M. A.,
2006, Evaluation of the antimicrobial
activity of saponins extract of
Sorghum bicolor L. Moench,African
Journal of Biotechnology, v. 5, p.
2405-2407.
Valero, M., Salmeron, and M. C., 2003,
Antibacterial activity of 11 essential
oilsagainst Bacillus cereus in
tyndallized carrot broth, International
Journal of FoodMicrobiology, v. 85,
p. 73-81.
Yanar, Y., Kadioglu, I. A., Gokce, I.,
Demirates, I., Goren, N., Cam, H., and
Whalon, M., 2011,In vitro antifungal
activities of 26 plant extracts on
mycelial growth of Phytophthora
infestans (Mont.) de Bary, African
Journal of
Biotechnology, v. 10, p. 2625-2629.

Lasbela University Journal of Science and Technology (2013) Vol-2 ISSN 2306-8256
Online available at www.luawms.edu.pk pg. 61
RESEARCH ARTICLE
Antagonistic potential of marine isolate DK6-SH8 against fish
pathogens
Muhammad Naseem Khan1, 2
, Meng Li1, Zulfiqar A Mirani
2, Jingxue Wang
1&Hong Lin
1
1 Food Safety Laboratory, College of Food Science and Engineering, Ocean University of
China, Qingdao, 266003, China
2 Microbiological Analytical Centre, PCSIR Labs. Complex Karachi, 75280, Pakistan
ABSTRACT
Oceanic hunt by marine organism enforces to produce contemporary and novel strategies to
compete, survive and reproduce their population. This fact facilitates to find new solutions to
control pathogenic bacteria. In this study Strain DK6-SH8 was identified via EzTaxon-e server,
and analyzed for its antagonistic potential against fish pathogens by organism-organism
interaction on agar plate. The results revealed that DK6-SH8 was 99.65% pairwise similar to
Vibrio kanaloae. Antagonistic test suggest that DK6-SH8 is active against Vibrio anguillarum,
Vibrio alginolyticus, Vibrio campbellii, Vibrio harveyi, Vibrio tubiashii and Vibrio vulnificus. It
has been concluded that Vibrio kanaloae DK6-SH8 could be potential candidate to control fish
pathogens.
Keywords:Vibrio kanaloae, fish pathogens, EzTaxon-e, antagonistic
______________________________________________________________________________ Correspondence:Jingxue Wang
Address: Food Safety Laboratory, College of Food Science and Engineering, Ocean University of China,
Qingdao, 266003, China
Email: [email protected] Phone: +86-532-820-32203Fax:+86-532-820-32389
Received: 15 Aug 2013 Revised: 03 Sept 2013 Accepted: 15 Sept 2013
Copyright: ©2013 Wang et al. This is an open-access article distributed under the terms of the Creative
Commons Attribution License, which permits unrestricted use, distribution, and reproduction in any
medium, provided the original author and source are credited
Competing Interests: The authors have declared that no competing interests exist.
______________________________________________________________________________
INTRODUCTION
Marine is the source of food and many
tremendous compounds.Aquatic
environment studies particularly microbial
interactions are the key for new solutions
for pathogenic microbial control. Diversity
and oceanic hunt among microorganism for
food and living space enforces to adapt
unique and contemporary physiological and
structure characteristic, this behavior is not
seen in soil organisms (Radajewski et al,
MARINE SCIENCES

Lasbela University Journal of Science and Technology (2013) Vol-2 ISSN 2306-8256
Online available at www.luawms.edu.pk pg. 62
2002). Additionally, these conditions
resulted in extraordinary unique compounds
production from marine microorganism as
compare to terrestrial microorganisms
(Wagner-Dobler et al., 2002) Many natural
compounds have been obtained from
various microbial sources, and are being
successfully used in different fields. In the
period of past five decades more than one
million compounds were isolated from
marine resources, and about 18% are from
microbial community (Bhatnagar and Kim,
2010).
Rosenfeld and Zobell (1947) first time
revealed that marine bacteria can produce
antimicrobial agents. After that many
studies for isolation and purification and
application of these antibiotics and bacteria
itself were reported. Application of bacteria
as probiotics in aquaculture is also on focus
in many research groups (Prado et al, 2009).
Synthetic and engineered antibiotics and
other chemical treatments are losing
acceptability among consumers. Green
technology to grow food and rearing
animals and aquaculture are gaining interest
over harmful effect of chemical treatments
(Yebra et al, 2004). Marine bacteria with
antibacterial potential could be a safe
andreliable option to control pathogens in
aquaculture.
The major fish pathogens among vibrios are
luminous vibrio, group of vibrio causes
luminous vibriosis in shrimp’s
cultures.These include V. parahaemolyticus,
V. alginolyticus, V. harveyi, V. damsel and
V. vulnificus. Among these V. harveyi has
been considered as very important pathogen
and predominantly involved in deterioration
of shrimp rearing industries and causes
huge economic loss (Leano et al, 1998,
Lightner and Redman, 1998).
Many members of marine Vibrios are
omnipresent in aquatic environment and
exhibit an unusually rapid growth rate,
which makes them predominant in
eutrophic environments (Aiyar et al, 2002,
Macian et al, 2000). To control these
pathogenic vibrios, bacteria which have
similar growth rate in aquatic environment
may have higher success rate. Considering
our previous report on isolation and
antibacterial activity of isolate DK6-SH8
(paper under review), we plan this study to
evaluate the antagonistic activity of isolate
DK6-SH8 against fish pathogens.
Moreover, EzTaxon-e database server was
compiled to identify the strain by
comparing 16S rRNA gene with valid,
identified and published bacterial strains.
The accuracy and validity of results from
ExTaxon-e was also discussed.
MATERIALS AND METHODS
BacterialStrain DK6-SH8 were selected
from 272 isolates (paper under review) on
the basis of initial screening of antibacterial
activity against four pathogenic indicator
strains including Staphylococcus aureus,
Escherichia coli, Listeria monocytogenes
and Vibrio cholrea. Strain DK6-SH8 was
isolated from surface attached marine
invertebrate samples obtained from coast of
Taiping bay in China (N 360 03’ 35.5”, E
120o 18’ 34.4”). Marine fish pathogenic
bacteria were obtained from College of
Marine Life Sciences, Ocean University of
China. All isolates were revived before
experiments from preserved culture in
Marine broth 2216E with 30% glycerol at -
80 oC.
Identification of marine isolates strain by
EzTaxon-e
Strain DK6-SH8 16S rDNA sequence
accession number (KC737551) was fetched
in ExTaxon-e server (http://eztaxon-
e.ezbiocloud.net/) and identify within
cultured database of systematically
identified and verified bacteria. The number
of percent pairwise similarity was obtained

Lasbela University Journal of Science and Technology (2013) Vol-2 ISSN 2306-8256
Online available at www.luawms.edu.pk pg. 63
and isolationwas identified on the basis of
highest rank of type bacteria. The
phylogeny tree constructed via Mega 5.1
software by maximum likelihood method
and tree topology were reproduced by
bootstrap analysis of 1000 replicates (Hall,
2013) .
Antagonistic activity test
Antagonistic activity were tested by method
described by Jin et al, (2010) with
modification. Strain DK6-SH8 and putative
pathogenic strains were cultured for 24 h on
marine 2216E broth at 28 oC with 180 rev
min-1
. All test cultures were diluted 100
times with sterile physiologic saline (SPS).
Each putative pathogenic strain was spread
on a marine 2216E plate with sterile cotton
stick. After absorption, sterile oxford cups
were place on each test plate. After that 10
µL of 24 h old broth of strain DK6-SH8
was inoculated in oxford cups. All plates
were incubated for 24 h at 28 oC, and the
diameters of the inhibitory zones were
measured. Antagonistic activity of strain
DK6-SH8 cultured for 12, 24, 36, 48, 60
and 72 h also measured against Vibrio
anguillarum. Colonies were visualized
clearly after spraying aqueous solution of
MTT (2mg/mL) followed by incubation at
30 oC for 15 min.
Statistical calculations
Data were presented as mean of triplicate
experiments and statistical mean and
standard error of mean were analyzed by
statistical software SPSS (v 16.0).
RESULTS
Identification of marine isolates strain by
EzTaxon-e
The strain DK6-SH6 have shown highest
pairwise similarity to many strains of genus
vibrios, and have 99.65% similarity to
Vibrio kanaloae LMG 20539T(Table 1).
The phylogeny analysis also revealed that
strain DK6-SH8 cluster with Vibrio
kanaloae LMG 20539T (Figure 1). On the
basis of EzTaxon-e data base strain was
identified as Vibrio kanaloae DK6-SH8.
Table 1: Identification table of Strain DK6-SH8 by EzTaxon-e Database
Rank Name Strain Pairwise
Similarity (%) Diff/Total nt Accession Authors
1 Vibrio kanaloae LMG 20539(T) 99.65 5/1438 AJ316193 Thompson et al (2003a)
2 Vibrio pomeroyi LMG 20537(T) 98.75 18/1436 AJ491290 Thompson et al (2003a)
3 Vibrio splendidus ATCC33125(T) 98.70 18/1381 X74724 Baumann et al (1980)
4 Vibrio artabrorum Vb 11.8(T) 98.68 19/1441 EF599164 Dieguez et al (2011)
5 Vibrio gigantis CAIM 25(T) 98.54 21/1442 EF094888 Le Roux et al (2005)
6 Vibrio celticus Rd 8.15(T) 98.54 21/1438 EF599162 Beaz-Hidalgo et al (2010)
7 Vibrio atlanticus Vb 11.11(T) 98.34 24/1442 EF599163 Dieguez et al (2011)
8 Vibrio tasmaniensis LMG 21574(T) 98.33 24/1441 AJ514912 Thompson et al (2003b)
9 Vibrio crassostreae CAIM 1405(T) 98.33 24/1441 EF094887 Faury et al (2004)
10 Vibrio cyclitrophicus P-2P44(T) 97.98 29/1434 U57919 Hedlund and Staley (2001)

Lasbela University Journal of Science and Technology (2013) Vol-2 ISSN 2306-8256
Online available at www.luawms.edu.pk pg. 64
Fig1: Phylogeny analysis of Marine
isolate.DK6-SH8 via MEGA 5.1 software by
Maximum likelihood method. Numbers at
the nodes indicated the bootstrap values of
1000 resembled data sets. Scale bar 0.001
represents sequence divergence
Antagonistic spectrum
Strain DK6-SH8 have shown good
antimicrobial activity against fish pathogens
including Vibrio anguillarum, Vibrio
alginolyticus, Vibrio campbellii, Vibrio
harveyi, Vibrio tubiashii and Vibrio
vulnificus,while there is no activity against
the strain Vibrio parahaemolyticus (Table
2). Antagonistic activity was observed after
12 h old broth of DK6-SH8 against Vibrio
anguillarum, and increase when more than
24 h old broth suspensions were used
(Figure 2). This shows that antagonistic
activity on plate culture was improved after
24 h of initial broth revival.
Table 2: Antagonistic activity of DK6-SH8 against fish pathogens
Microorganism Source Zone of inhibition in mm ± SEM*
Vibrio anguillarum LMG 4437T; cod, Norway 22 + 0.34
Vibrio alginolyticus LMG 4408T 19 + 0.58
Vibrio campbellii LMG 11216T; USA 13 + 0.34
Vibrio harveyi LMG 7890T; USA (1982) 14 + 0.89
Vibrio parahaemolyticus LMG 2850T; Japan IN
Vibrio tubiashii LMG 10936T; USA 23 + 0.34
Vibrio vulnificus LMG 13545T; USA 20 + 0.58
* Mean of triplicates + Standard Error of Mean IN : invisible
Fig 2: Zone on inhibition by strain DK6-SH8 against Vibrio anguillarum lawn on Marine agar
2216E after (1) 12 h old culture (2) 24 h (3) 36 h (4) 48 h ( 5) 60 h ( 6) 72 h ; ( A) without MTT
spray (B) after 2 mg/ mL MTT spray followed by incubation at 30 oC.

Lasbela University Journal of Science and Technology (2013) Vol-2 ISSN 2306-8256
Online available at www.luawms.edu.pk pg. 65
DISCUSSION
Regardless of current development in
industrially validated identification options,
Identification of bacteria is still a difficult
assignment in a lot of microbiological
routine laboratories, particularly in
conditions where taxonomically new strains
are concerned. Genetic level identification
of strain for general and research purpose
has been widely used with well-curetted
gene database, such as EMBL, NCBI and
ExTaxon. Although, uncultured prokaryotic
species sequences and unpublished gene
sequences may leads to ambiguity and miss
calculation, if user are beginners. These
issued were overcome by new generation
database ExTaxon-e; this segmented and
separated uncultured and unpublished or
non-validated sequence when analyzing 16S
rDNA sequence. The results from this
database shows pairwise global sequence
alignment with basic local alignment search
tool (blast) of formally identified, validated,
up-to-date, nomenclature system. Isolate
DK6-SH8 was identified as Vibrio
kanaloae.Who was previously identified as
Vibrio sp. DK6-SH8 due to massive
comparison with cultured but unverified and
unpublished sequences (paper under
review). EzTaxon-e database seems to be a
very powerful tool for the taxonomic
research in right direction with accuracy.
Additionally, the sequenced strains relevant
information, real-time research updates and
meaningful data resource link for a
particular gene sequence or strains are added
advantages. (Kim et al, 2012).
TheVibrionaceae family, Gram-
negative Gammaproteobacteria omnipresent
in aquatic and salty environments
(Thompson et al, 2004), harbors strains with
antagonistic activity (Gram et al,
2010). Antimicrobials from Vibrio spp. can
decrease the quantity of additional microbial
population members and manipulate
microscale variations in challenging
bacterial populations (Long and Azam,
2001). Antibacterial actions have been
describedfrom V.parahaemolyticus (Radjasa
OK et al, 2007), V. alginolyticus (Austin et
al, 1995), V. anguillarum (Hjelm et al,
2004) ,and several unidentified Vibrio spp.
(Castro et al, 2002, Long et al, 2005). But,
the nature and frequency of antagonism
among vibrios is still mostly mysterious, and
only a little antibiotic Vibrio compounds
have been structure elucidated to date
(Kobayashi et al, 1994, Oclarit et al,
1994).Wietz et al (2010) also reported V.
coralliilyticus and V. neptunius with
antimicrobial compounds. These facts
suggest that, although, the vibrios are mainly
classified in pathogenic bacteria of fish and
human, but it could be a potential source to
control pathogens as well. Antagonistic
activity could be achieved by vibrios by
mean of antimicrobial compounds produced
and by application of vibrios itself as
probiotics in aquaculture.
So far conventional approaches such as use
of disinfectants and antimicrobial drugs to
control diseases have had limited success in
the prevention or cure of aquatic disease.
The massive use of antibiotics encourages
natural emergence of antibiotic resistant
bacteria, which can transfer their resistance
genes to other bacteria that have never been
exposed to the antibiotics (Davison, 1999).
This led to suggestions of suitable
alternative disease prevention methods,
which could be the use of non-pathogenic
bacteria as probiotic biocontrol agents
(Verschuere et al, 2000). From best of our
knowledge, all the previously identified
strains of Vibrio kanaloae were never being
reported as pathogens. The antibacterial
potential of isolate Vibrio kanaloae DK6-
SH8 against fish pathogens suggest that
stain Vibrio kanaloae DK6-SH8 could be a

Lasbela University Journal of Science and Technology (2013) Vol-2 ISSN 2306-8256
Online available at www.luawms.edu.pk pg. 66
potential source for control of pathogenic
strains.
CONCLUSIONS
We have successfully identified our isolate
DK6-SH8 as Vibrio kanaloae, which have
antagonistic activity against fish pathogens.
These results facilitate to investigate further
for purifying it antimicrobial compounds
and application in aquaculture.
ACKNOWLEDGEMENTS
Authors would like to thankful to Ocean
University of China (OUC) and Chinese
Scholarship Council (CSC) for providing
resources to complete this study.
REFRENCES
Aiyar, S. E., Gaal, T. & Gourse, r. L.2002,
rRNA promoter activity in the fast-
growing bacterium Vibrio
natriegens: Journal of Bacteriology,
v. 184, p. 1349-1358.
Austin, b., Stuckey, l. F., Robertson, P. A.
W., Effendi, I. & Griffith, D. R.
W.1995, a probiotic strain of Vibrio
alginolyticus effective in reducing
diseases caused by Aeromonas
salmonicida, Vibrio anguillarum and
Vibrio ordalii: Journal of Fish
Diseases, v. 18, p. 93-96.
Baumann, P., Baumann, l., Bang, S.
&Woolkalis, M.1980,Reevaluation
of the taxonomy ofVibrio, beneckea,
andPhotobacterium: Abolition of the
genusBeneckea: Current
Microbiology, v. 4, p. 127-132.
Beaz-Hidalgo, R., Dieguez, A. L.,
Cleenwerck, I., Balboa, S., Doce, A.,
De Vos, P. &Romalde, J.
L.2010,Vibrio celticus sp nov., a
new Vibrio species belonging to the
Splendidus clade with pathogenic
potential for clams: Systematic and
Applied Microbiology, v. 33, p. 311-
315.
Bhatnagar, I. &Kim, S. K.2010,Immense
Essence of Excellence: Marine
Microbial Bioactive Compounds:
Marine Drugs, v. 8, p. 2673-2701.
Castro, D., Pujalte, M.J., Lopez-Cortes, l.,
Garay, E. &Borrego, J. J.2002,
Vibrios isolated from the cultured
manila clam (Ruditapes
philippinarum): numerical taxonomy
and antibacterial activities: J Appl
Microbiol, v. 93, p. 438-47.
Davison, J.1999, Genetic Exchange between
Bacteria in the Environment:
Plasmid, v. 42, p. 73-91.
Dieguez, A. L., Beaz-hidalgo, R.,
Cleenwerck, I., Balboa, S., De vos,
P. &Romalde, j. L.2011, Vibrio
atlanticus sp nov and Vibrio
artabrorum sp nov., isolated from the
clams Ruditapes philippinarum and
Ruditapes decussatus: International
Journal of Systematic and
Evolutionary Microbiology, v. 61, p.
2406-2411.
Faury, N., Saulnier, D., Thompson, F. L.,
Gay, M., Swings, J. &Le Roux,
F.2004, Vibrio crassostreae sp nov.,
isolated from the haemolymph of
oysters (Crassostrea gigas):
International Journal of Systematic
and Evolutionary Microbiology, v.
54, p. 2137-2140.

Lasbela University Journal of Science and Technology (2013) Vol-2 ISSN 2306-8256
Online available at www.luawms.edu.pk pg. 67
Gram, L., Melchiorsen, J. &Bruhn, J.
B.2010, Antibacterial activity of
marine culturable bacteria collected
from a global sampling of ocean
surface waters and surface swabs of
marine organisms: Mar Biotechnol
(NY), v. 12, p. 439-51.
Hall, B. G.2013, Building phylogenetic trees
from molecular data with MEGA:
Mol Biol Evol, v. 30, p. 1229-35.
Hedlund, B. P. &Staley, J. T.2001, Vibrio
cyclotrophicus sp nov., a polycyclic
aromatic hydrocarbon (PAH)-
degrading marine bacterium:
International Journal of Systematic
and Evolutionary Microbiology, v.
51, p. 61-66.
Hjelm, M., Riaza, A., Formoso, F.,
Melchiorsen, J. &Gram,
L.2004,Seasonal incidence of
autochthonous antagonistic
Roseobacter spp. and Vibrionaceae
strains in a turbot larva
(Scophthalmus maximus) rearing
system: Appl Environ Microbiol, v.
70, p. 7288-94.
Jin, G., Wang, S., Yu, M., Yan, S. &Zhang,
X.-H.2010, Identification of a marine
antagonistic strain JG1 and
establishment of a polymerase chain
reaction detection technique based
on the gyrB gene: Aquaculture
Research, v. 41, p. 1867-1874.
Kim, O. S., Cho, Y. J., Lee, K., Yoon, S. H.,
Kim, M., Na, H., Park, S. C., Jeon,
Y. S., Lee, J. H., Yi, H., Won, s.
&Chun, J.2012, Introducing
EzTaxon-e: a prokaryotic 16S rRNA
gene sequence database with
phylotypes that represent uncultured
species: International Journal of
Systematic and Evolutionary
Microbiology, v. 62, p. 716-721.
Kobayashi, M., Aoki, S., Gato, K.,
Matsunami, K., Kurosu, M.
&Kitagawa, I.1994, Marine natural
products. XXXIV. Trisindoline, a
new antibiotic indole trimer,
produced by a bacterium of Vibrio
sp. separated from the marine sponge
Hyrtios altum: Chem Pharm Bull
(Tokyo), v. 42, p. 2449-51.
Le Roux, F., Goubet, A., Thompson, F. L.,
Faury, N., Gay, M., Swings, J.
&Saulnier, d.2005,Vibrio gigantis sp
nov., isolated from the haemolymph
of cultured oysters (Crassostrea
gigas): International Journal of
Systematic and Evolutionary
Microbiology, v. 55, p. 2251-2255.
Leano, E. M., Lavilla-Pitogo, C. R. &Paner,
M. G.1998, Bacterial flora in the
hepatopancreas of pond-reared
Penaeus monodon juveniles with
luminous vibriosis: Aquaculture, v.
164, p. 367-374.
Lightner, D. V. &Redman, R. M.1998,
Shrimp diseases and current
diagnostic methods: Aquaculture, v.
164, p. 201-220.
Long, R. A. &Azam, F.2001,Antagonistic
interactions among marine pelagic
bacteria: Appl Environ Microbiol, v.
67, p. 4975-83.
Long, R. A., Rowley, D. C., Zamora, e., Liu,
J., Bartlett, D. H. &Azam, f.2005,
Antagonistic interactions among

Lasbela University Journal of Science and Technology (2013) Vol-2 ISSN 2306-8256
Online available at www.luawms.edu.pk pg. 68
marine bacteria impede the
proliferation of Vibrio cholerae:
Appl Environ Microbiol, v. 71, p.
8531-6.
Macian, M. C., Garay, E., Gonzalez-
Candelas, F., pujalte, M. J. &Aznar,
R.2000, Ribotyping of Vibrio
populations associated with cultured
oysters (Ostrea edulis): Systematic
and Applied Microbiology, v. 23, p.
409-417.
Oclarit, J. M., Okada, H., Ohta, S.,
Kaminura, K., Yamaoka, Y., Iizuka,
T., Miyashiro, S.&Ikegami, S.1994,
Anti-bacillus substance in the marine
sponge, Hyatella species, produced
by an associated Vibrio species
bacterium: Microbios, v. 78, p. 7-16.
Prado, S., Montes, J., Romalde, J. L.
&Barja, J. L.2009, Inhibitory activity
of Phaeobacter strains against
aquaculture pathogenic bacteria: Int
Microbiol, v. 12, p. 107-14.
Radajewski, S., Webster, G., Reay, D. S.,
Morris, S. A., Ineson, P., Nedwell,
D. B., Prosser, J. I. &Murrell, J.
C.2002, Identification of active
methylotroph populations in an
acidic forest soil by stable-isotope
probing: Microbiology, v. 148, p.
2331-42.
Radjasa Ok, Sabdono A, Zocchi J&E.,
Z.2007, Richness of secondary
metabolite-producing marine
bacteria associated with the sponge
Haliclona sp: Int J Pharmacol, v. 3,
p. 275–279.
Rosenfeld, W. D. &Zobell, C. E.1947,
Antibiotic Production by Marine
Microorganisms: J Bacteriol, v. 54,
p. 393-8.
Thompson,F. L., Iida, T. & Swings, J.2004,
Biodiversity of vibrios: Microbiol
Mol Biol Rev, v. 68, p. 403-31, table
of contents.
Thompson, F. L., Thompson, C. C., Li, Y.,
Gomez-Gil, B., Vandenberghe, J.,
Hoste, B. &Swings, J.2003a, Vibrio
kanaloae sp nov., Vibrio pomeroyi
sp nov and Vibrio chagasii sp nov.,
from sea water and marine animals:
International Journal of Systematic
and Evolutionary Microbiology, v.
53, p. 753-759.
Thompson, f. L., thompson, c. C. & swings,
j.2003b, Vibrio tasmaniensis sp nov.,
isolated from Atlantic Salmon
(Salmo salar L.): Systematic and
Applied Microbiology, v. 26, p. 65-
69.
Verschuere, L., Rombaut, G., Sorgeloos, P.
&Verstraete, W.2000, Probiotic
bacteria as biological control agents
in aquaculture: Microbiology and
Molecular Biology Reviews, v. 64,
p. 655-+.
Wagner-Dobler, I., Beil, W., Lang, S.,
Meiners, M. &Laatsch, H.2002,
Integrated approach to explore the
potential of marine microorganisms
for the production of bioactive
metabolites: Adv Biochem Eng
Biotechnol, v. 74, p. 207-38.
Wietz, M., Mansson, M., Gotfredsen, C. H.,
Larsen, T. O. &Gram,

Lasbela University Journal of Science and Technology (2013) Vol-2 ISSN 2306-8256
Online available at www.luawms.edu.pk pg. 69
L.2010,Antibacterial Compounds
from Marine Vibrionaceae Isolated
on a Global Expedition: Marine
Drugs, v. 8, p. 2946-2960.
Yebra, D. M., Kiil, S. &Dam-Johansen,
K.2004, Antifouling technology -
past, present and future steps towards
efficient and environmentally
friendly antifouling coatings:
Progress in Organic Coatings, v. 50,
p. 75-104.

Lasbela University Journal of Science and Technology (2013) Vol-2 ISSN 2306-8256
Online available at www.luawms.edu.pk pg. 70
VETERINARY SCIENCES
RESEARCH ARTICLE
Physico-chemical properties of goat, sheep and camel milk of
Balochistan
Haseena Sajid1, Shafia Muzafar
1, Abida Peer Muhammad
2, Illahi Bakhsh Marghazani
3, Sajid Ali
Khosa3, Nasrullah
3and Ahmed Nawaz Khosa
3
1 Sardar Bahadur Khan Women University, Quetta, Balochistan
2Health, Education, Agriculture, Livestock Upgradation Programs (HEAL UP)
Balochistan; 3
Faculty of Veterinary and Animal Sciences, Lasbela University of Agriculture, Water
and Marine Sciences (LUAWMS), Uthal, Balochistan
ABSTRACT
This Study was conducted to determine the physic-chemical properties of goat, sheep and camel milk
of Quetta district, Balochistan. Result showed comparatively highest (6.65) milk pH in sheep,
followed by goat (6.24) whilst lowest (5.47) in camel. The electrical conductivity of milk was
recorded maximum (7.80 ms) in goat, followed by sheep (7.20 ms) and minimum (3.18 ms) in camel.
Milk titratable acidity was highest in camel (0.14%) followed by sheep (0.11%) and goat (0.10%).
Milk specific gravity was highest in sheep (1.04), followed by camel (1.03) and goat (1.02). In milk
chemical properties, total solid, casein and ash contents were more in sheep (20.7%, 11.11%, 1.06%,
respectively), followed by camel (13.5%, 6.3%, 0.6%, respectively) and goat (11.6%, 4.4%, 0.4%,
respectively).
Keywords: Milk, goat, sheep, camel, physico-chemical properties
__________________________________________________________________________________ Correspondence: Illahi Bakhsh Marghazani
Address: Faculty of Veterinary and Animal Sciences, LUAWMS, Uthal, Balochistan, Pakistan.
Email: [email protected]
Phone: +92-333-2218439
Received: 05 Jun 2013 Revised: 03 Aug 2013 Accepted: 15 Aug 2013
Copyright: ©2013 Ahmed et al. This is an open-access article distributed under the terms of the Creative
Commons Attribution License, which permits unrestricted use, distribution, and reproduction in any medium,
provided the original author and source are credited
Competing Interests: The authors have declared that no competing interests exist.
__________________________________________________________________________________
INTRODUCTION
Milk is the secretion of the memory gland and
is the only food of the young mammals
during the first period of life. Milk from
various mammals such as cow, buffalo, goat,
sheep and camel is used for different
nutritional purpose e.g. feeding to young ones
and preparation of some nutritional products

Lasbela University Journal of Science and Technology (2013) Vol-2 ISSN 2306-8256
Online available at www.luawms.edu.pk pg. 71
such as milk, cream, butter, yogurt, ghee, sour
milk (Webb et al., 1974; Hassan, 2005). Goat
has been referred as the “poor man’s cow” due
to its great contribution to the health and
nutrition of the landless and rural areas
(Dresch, 1988). Goat milk differs from cow or
human milk in having better digestibility,
alkalinity and buffer capacity (Park, 1994).
Sheep milk is an excellent raw material for the
milk processing industry (Park et al., 2007).
Sheep milk has higher specific gravity,
viscosity, refractive index, titratable acidity and
lower freezing point than average cow milk
(Haenlein and Wendroff, 2006). Globally, there
are 19.5 million camels, Pakistan rank at 5th
position with 0.9 million heads of camels
(FAO, 1997). These animals are mainly used
for transportation and less for meat and milk.
Despite the large population of camel in
Pakistan, camel milk is not utilized to any
significant extent probably due to unawareness
of use and market value of camel milk or
because of saltish taste and high acidic nature
(Abu-Tarboush, 1996). Camel milk is highly
nutritious so that much generation of our
ancestors survived on his beverage alone. As
like other mammal’s milk camel milk is almost
a complete food consisting of proteins (mainly
casein) fat, salt and milk sugar (lactose) as well
as vitamins and minerals (Sawaya et al., 1984).
The major physic-chemical components of
milk include water, fat, proteins,
carbohydrates, minerals, organic acids,
enzymes and vitamins has been extensively
studied from various countries (Dobzanski et
al., 2005; Honda et al., 2003; Romonaityte,
2001), however in Balochistan limited work
has been carried out on physic-chemical
properties of milk of different species. Keeping
in view these facts, the present study planned
to determine the physico-chemical
characteristics of milk of goat, sheep and camel
species collected from district Quetta,
Balochistan.
MATERIALS AND METHOD
The study was consisted of two main phases
i.e., sample collection and laboratory work.
Phase -1: Sample collection
Three different areas for milk sampling
(approximately 250 ml each) in district Quetta
were selected. Total ninety milk samples of
goats (n=30), sheep (n=30) and camels (n=30)
were collected from those selected areas. All
milk samples were labeled for individual
species and locations and stored in plastic jars
at -20 0C till laboratory analyses.
Phase-2: Laboratory Analyses
Before laboratory analyses, the stored milk
samples were thawed properly. The physico-
chemical measurements i.e., pH, electrical
conductivity, specific gravity, titratable acidity,
casein, total solids and ash were performed
using Lactoscan-S Milk Analyser (50W,
Milkotronic Ltd., Bulgaria).
RESULTS AND DISCUSSION
Raw milk is a complete food for mammals. It is
a good source of protein, fats, lactose, minerals
and vitamins. Its composition is affected by
species, breeds, feeding, lactation stage and
other environmental factors (Enb et al., 2009).
The present work was carried out to compare
the physico-chemical parameters of milk
samples of goats, sheep and camels. In
chemistry, pH is the measure of the acidity or
basicity of a solution. The acidity of milk
sample is usually expressed as pH (Tasci,
2011). The mean values of pH of fresh milk
samples collected from goats, sheep and
camels were determined. The mean pH values
of milk samples of goat, sheep and camel were
6.24, 6.65 and 5.47, respectively (table 1). The
results showed that pH of sheep milk

Lasbela University Journal of Science and Technology (2013) Vol-2 ISSN 2306-8256
Online available at www.luawms.edu.pk pg. 72
washigher than that of goat and camel milk. pH
value found in sheep milk were similar to the
reported findings (Asif and Sumaira, 2010;
Park et al., 2007; Haenlein and Wendorff,
2006 and Rashida Kanwal et al., 2004). The
pH value of goat milk recorded in our study
was slightly less than pH value than the
findings of Asif and Sumaira (2010). Likewise,
pH of camel milk determined in our study was
less than pHreported in earlier literature
(Zubeir and Ibrahim, 2007; Khaskheli, 2005).
Acidity in terms of lactic acid content is called
titratable acidity (Khaskheli et al., 2005).
Acidity of milk is due to the presence of lactic
acid, citric acid, and phosphoric acid (Bylund
1995). The titratable acidity is simple acid base
reaction. This test allows calculation of percent
acidity in milk (Rashida et al., 2004). Titratable
acidity (%) determined in goat, sheep and
camel milk was 0.10%, 0.11% and 0.14%,
respectively (table 1). The camel milk showed
maximum titratable acidity (0.14%) whilst goat
milk showed minimum titratable acidity
(0.10%). These findings are in agreement with
the reported findings (Park et al., 2007; Asif
and Sumaira, 2010; Heanlein and Wendorff,
2006, Rashida et al., 2004. The value of
titratable acidity in sheep milk is comparable
with the values reported by Abdalla and
Daffalla (2010) and Salwa et al., (2009).
Titratable acidity of camel milk recorded in
present study are in line with earlier workers
(Mint et al., 2011; Zubair and Ibrahim, 2007;
Khaskheli et al., 2005). The little difference in
mean values may be due to lactation stage of
species which had a great effect on titratable
acidity in milk (Bhosale et al., 2009; Zubair
and Marwa, 2007).
Electrical conductivity is dependent on the
concentration of anions, cations with Na+, K
+
and Cl- being most important (Mauropovinelli
et al., 2005). The conductivity range of milk
samples collected from goat, sheep and camel
milk were 7.80 ms, 7.20 ms and 3.18 ms
respectively (table 1). Minimum conductivity
was recorded for the camel milk followed by
the goat milk and highest was measured for
sheep milk. Conductance of the goat milk in
present study was observed to be within the
range whilst conductance of sheep and camel
milk was comparatively lower than the findings
of Park et al., (2007). Conductance of camel
milk was lower than findings of Janzekovic et
al., (2009). The variation in conductivity may
be due to the different level of electrolytes
present in milk samples (Imran et al., 2008).
As the content of chloride (Cl-) and sodium
(Na+) increases the content of lactose and
potassium (K+) decreases, which leads to the
higher electrical conductivity of milk (Billon et
al.,2007).
Specific gravity of milk samples of goat, sheep
and camel was 1.02, 1.04 and 1.03,
respectively (table 1). The specific gravity of
sheep milk was comparatively higher than
camel and goat. The specific gravity of sheep
milk determined in this research was slightly
higher than the findings of Asif and Sumaira
(2010) and Park et al., (2007) and lower than
value reported by Haenlian and Wendoff
(2006) and Rashida et al., (2004). The specific
gravity of the goat milk was less than that cited
by Bhosale et al., (2009), Imran et al. (2008)
and Rashida et al., (2004). The Specific gravity
of camel milk was comparable to that reported
by Mint et al., (2011) and Khaskheli et al.,
(2005). Sheep milk had highest value of
specific gravity due to its contents of solid not
fat (Mehmood and Sumaira, 2010). It was
observed that lactation age affects the specific
gravity of milk by increasing its value in milk
(Bhosale et al., 2009).
The milk protein has the high nutritional value.
The principal component of milk protein is
casein which constitutes 75% of all milk
protein (Hassan, 2005). Casein contents (table
2) were more in sheep (11.11), followed by
camel (6.3%) and goat (4.4%). Casein (%)
obtained from goat milk is in line with the
results obtained by Abdalla and Daffala (2010)
and Park et al., (2007). Sheep milk casein
%age found higher than the casein (%) value

Lasbela University Journal of Science and Technology (2013) Vol-2 ISSN 2306-8256
Online available at www.luawms.edu.pk pg. 73
(4.2%) reported by other workers (Mehmood
and Sumaira, 2010; Abdalla and Daffalla,
2010). Casein (%) determined for camel milk
was also higher than the casein (%) value
obtained by M. Khaskheli et al., (2005). It was
found that variation in casein level in goat,
sheep and camel milk was influenced by the
breed difference, health status and stage of
lactation (Mehmood and Sumaira, 2010 and
Bhosale et al., 2009). Casein composition in
goat and sheep milk is also influenced by
genetic polymorphism (Martin et al., 2003).
Milk samples collected from goat, sheep and
camel showed that total solid (TS) contents of
sheep was highest (20.7%) whilst lowest
(11.6%) in goat milk (table 2). The TS content
in camel milk were intermediate i.e., 13.5%.
The TS contents observed in present findings is
also fall in the reported literature (Mehmood
and Usman (2010); Bhosale et al., (2009),
Imran et al., (2008) and Rasheeda et al.,
(2004).Similarly, the present values obtained in
case of sheep milk (Talevski et al., 2009;
Roberta, 2002; Grevilla et al., 1997) and camel
milk (Zubair et al., 2007; Farag and Kebary,
1992 and Ahmed, 1990) are in agreement with
the earlier workers. One of the main reasons in
variation in total solid contents in different
species is partly due to inherited capabilities of
the animals or attribute due to various seasonal
and environmental factors (Khaskheli et al.,
2005).
The water of milk is removed by evaporation
and the dry residue is incinerated at a low red
heat, there after a white or nearly white ash is
left which contains inorganic residues like Ca ,
Mg, Na, K, P, Zn, Fe, phosphate, carbonates,
oxides (Gallego et al., 2006: Khaskheli et al.,
2005; Rasheeda et al., 2004). Ash contents %
in milk samples collected from goat sheep and
camel milk were 0.4%, 1.0% and 0.6%,
respectively (table 2). The result of this study
revealed that ash content % in goat milk was
lower than in sheep and camel milk.Ash
contents found in goat milk were slightly less
than that reported by Abdullah and Daffalla
(2010), Bhosale et al., (2009), andjandal
(1996)whilst obtained ash % value was higher
than findings of Rasheedaet al., (2004). Ash
contents found in sheep milk were nearly
comparable with that reported by Asif and
Sumaira (2010), Imran et al., (2009) and Park
et al., (2007). Ash contents found in camel
milk during this research was quite less than
reported by Mint et al. (2011) and Khaskheli et
al., (2005). Ash contents in camel milk vary
due to free grazing of camel on bushes or plant
growth at saline soil (Khaskheli et al., 2005).
Table 1: Physical parameters of goats, sheep and milk samples
Parameters Goat Sheep Camel
pH 6.24 6.65 5.47
Electrical conductivity
(ms)
7.80 7.20 3.18
Titratable acidity 0.10 0.11 0.14
Specific Gravity 1.02 1.04 1.03
Table 2: Chemical properties of goat, sheep and camel milk
Parameters Goats Sheep Camels
Total solids % 11.6 20.7 13.5
Casein % 4.4 11.11 6.3
Ash % 0.4 1.06 0.6

Lasbela University Journal of Science and Technology (2013) Vol-2 ISSN 2306-8256
Online available at www.luawms.edu.pk pg. 74
CONCLUSION
Based on the result of present study, it is
concluded that sheep milk has higher physico-
chemical characteristic than goat and camel
milk. The difference in physico-chemical
properties of goat, sheep and camel milk are
influenced by numerous factors such as genetic
(breed and genotype), physiological condition
(age, lambing ,body weight, number of lambing
stage and number of lactation), production
conditions (feeding and management condition
in the area) and individual characteristic of
particular animal are some of them. Physico-
chemical characteristics of milk are essential
for successful development of dairy industries
as well as for marketing the products. Therefore
regular survey of milk should be carried out by
the local authority for milk quality at various
critical control points. These findings may
helpful for the concerned lawmakers to monitor
the quality of milk products in Quetta
Baluchistan.
ACKNOWLEDGEMENT
The principal author is highly thankful to her
friends for their supporting company during
sample collection.
REFERENCES
Abdalla, M. O. M., and Daffalla, M. S., 2010,
Comparison of chemical and
microbiological parameters of charcoal
verses gas and solar energy treated milk:
Advance journal of food, science and
technology, v. 2(5), p. 286-290.
Abu-Tarboush, H. M., 1996, Comparison of
associative growth andproteolytic activity
of yogurt starters in whole milk from
camels and cows: J. Dairy Sci, v.79, p.
366-371.
Aganga, A. A., Amarteifio, J. O., and Nkile,
N., 2002, Effect of stage of lactation on
nutrient composition of Tswana sheep and
goat`s milk: Journal of Food Composition
and Analysis, v.15, p.533-543.
Ahmad, B., Qureshi, K. A, and Bajwa M.
A.,1990, Economic relationship of
cottonseed cake and wheat bran with milk
production: Pakistan Journal of
Agriculture and Science,v. 27(3), p. 203-
206.
Anonymous, 2009-10, Pakistan Economic
Survey 2008-09: Economic Advisory
Wing, Ministry of Finance, Govt. of
Pakistan, Islamabad.
Asif, M., and Usman, S., 2010, A comparative
study on the physico-chemical parameters
of milk smples collected from buffalo,
cow, goat and sheep of Gujrat, Pakistan:
Pakistan Journal of Nutrition, v. 9 (12), p.
1192-1197.
Bhosale, S. S., Kahate, P. A, Kamble, K.,
Thakare, V. M., and Gubbawar, S. G.,
2009, Effect of lactation on Physico-
Chemical properties of local goat milk:
Veterinary World, v. 2(1), p. 17-19.
Billon, P., Pledel, D., and Gaudin, V., 2007,
Effects of increasing the milk flow switch
point when using ACR’s on milking and
milk quality: Proc. Annual meeting of the
National Mastitis Council, p. 222-223.
Bylund, G., 1995, Dairy processing
handbook.Tetra Pak processing systems
AB. S-22186, Lund, Sweden.
Composition and nutritional quality of
camel milk: Journal of Food Science, v.
49, p.744.

Lasbela University Journal of Science and Technology (2013) Vol-2ISSN 2306-8256
Online available at www.luawms.edu.pk pg. 75
Coni, E., Bocca, A., Ianni, D., and Caroli, S.,
1995, Preliminary evaluation of the
factors influencing the trace element
content of milk and dairy products: Food
Chemistry, v. 52(2), p. 123-130.
Dabeka, R. W., 1989, Survey of lead, cadmium,
cobalt and nickel in infant formulas and
evaporated milks and estimation of
dietary intakes of the elements by infants
0-12 months old: Science Total
Environment, v. 89(3), p. 279-289.
Dabeka, R. W., and McKenzie, A. D., 1987,
Lead, cadmium and fluoride levels in
market milk and infant formulas in
Canada: Journal of Association of
Analytical Chemistry, v. 70(4), p. 754-
757.
Dobrzañski, Z., Kolacz, R., Górecka, H.,
Chojnacka, K., and Bartkowiak A., 2005,
The content of microelements and trace
elements in raw milk from cows in the
Silesian region: Polish journal of
Environmental Study, v. 14(5), p. 685-
689.
Dresch, J., 1988, A plea for the goat:
Production-Pastorale-et-Societe OAE,
1982, v. 10, p. 81-83.
Enb, A., Abou donia, M. A., Abd-Rabou, N.S.,
Abou-Arab, A. A. K., and El-Senaity, M.
H., 2009, Chemical composition of raw
milk and heavy metals behavior during
processing of milk products: Global of
veterinary, v. 3, p. 268-275.
Farag, S. I., and Kebary, K. M. K., 1992,
Chemical composition and physical
properties of camels milk and milk fat:
Procd. 5th Egyptian Conference for Dairy
Science and Technology, p. 57–67.
Fuertes, J. A., Gonzalo, C., and Carriedo, J. A.,
and Primitive, F. S., 1998, Parameters of
test day milk yield and milk components
for dairy ewes: Journal of dairy science, v.
81, p. 1300-1307.
Fulya, T., 2011, Microbiological and chemical
properties of raw milk consumed in
burdur: Journal of Ani. and Vet. Adv., v.
10 (5), p. 635-641.
Gonzales, G. C., Caamo, D. L., and Schryvers,
A. B., 1990, Identification and
characterisation of a porcine-specific
transferring receptor in Actinobacillus
pleuropneumoniae: Molecular
Microbiology, v. 4, p. 1173–1179.
Haenlein, G. F. W., and Wendorff, W. L., 2006,
Sheep milk production and utilization of
sheep milk. In: Park, Y.W. and
G.F.W.Haenlein, (Eds.), Handbook of
Milk of Non-Bovine Mammals: Blackwell
Publishing Professional, Oxford, UK and
Ames, Iowa, USA, p. 137-194.
Hallen, I. P., Jorhem L., Lagerkvist, B. J., and
Oskarsson, A., 1995, Lead and cadmium
levels in human milk and blood: Science
Total Environment, v. 166 (1-3), p. 149-
155.
Hassan, S. S., 2005, Quality assurance of
various dairy products of Pakistan:
Department of Chemistry, University of
Peshawar.
Honda, R., Tawara, K., Nishijo, M.,
Nakagawa, H., Tanebe, K., and Saito, S.,
2003, Cadmium exposure and trace
elements in human breast milk:
Toxicology, v. 186 (3), p. 255-259.
Ikem, A., Nwankwoala, A., Odueyungbo, S.,
Nyavor, K., and Egiebor N., 2002, Levels
of 26 elements in infant formula from

Lasbela University Journal of Science and Technology (2013) Vol-2ISSN 2306-8256
Online available at www.luawms.edu.pk pg. 76
USA, UK, and Nigeria by microwave
digestion and ICP-OES: Food Chemistry,
v. 77(4), p. 439-447.
Imran, M., Khan, H., Hassan, S. S., and Khan
R., 2008, Physico-chemical characteristics
of various milk samples available in
Pakistan: Journal of Zhejiang University
Science, v. 9(7), p. 546-551.
Iqbal, A., Gill, R. M., and Younas, M., 2001,
Milk composition of Pakistani camel
(Camelus dromedaries) kept under station/
farmer's condition: Emirate Journal of
Agricultural Science, v.(13), p. 7-10.
Janzekovic M., Brus, M., Mursec, B., Vinis, P.,
Stajnko, D., and Cus, F.,2009, Mastitis
detection based on electric conductivity of
milk: Journal of achievements in materials
and manufacturing engineering, v. 34 (1),
p. 39-46.
Javaid, S. B., Gadahi, J.A., Khaskheli, M.,
Bhutto, M. B., Kumbher, S., and Panhwar
A. H., 2009, Pakistan veterinary journal,
v. 29(1), p. 27-31.
Khaskheli, M., Arain, M. A. Chuadhary, S.,
Soomro, A. H., and Qureshi, T. A., 2005,
Physico-chemical quality of camel Milk:
Journal of Agriculture and Social
Sciences, v. 2, p. 164–166.
Krelowska-Kulas, M., 1990, Lead, cadmium,
iron, copper and zinc in fresh milk from
the selected areas of the Cracowregion:
Nahrung, v. 34(3), p. 13-217.
Martin, R., Langa, S., Reviriego, C., Jiminez,
E., Marin, M. L, Xaus, J., Fernandez, L.,
and Rodriguez, J. M., 2003, Human milk
is a source of lactic acid bacteria for the
infant gut: J. Pediatr., v. 143, p. 754-758.
Meiloudg, M., Bourayai, O., Samband, N., and
Houmeida, 2011, Composition of
Mauritanian camel Milk. Results of First
Study: International journal of agriculture
and biology, v. 13 (1), p. 145-147.
Park, Y. W., 1994, Hypo-allergenic and
therapeutic significance of goat milk:
Small Rum. Res., v. 14, p. 151-159.
Park,Y. W., Ju´arez, M., Ramosc, M., and
Haenlein, G. F. W., 2007, Physico-
chemical characteristics of goat and sheep
milk: Small Rum. Res., v. 68, p. 88–113.
Rajor, A., 2006,Experimental methods for
general and environmental chemistry (1st
edition): Standard publisher’s distributors,
v. 81, p. 8014-065.
Ramonaityte, D.T., 2001, Copper, zinc, tin and
lead in canned evaporated milk, produced
in Lithuania: the initial content and its
change at storage: Food Addition and
Contamination, v. 18 (1), p. 31-37.
Rashida, K., Toqeer, A., and Bushra, M., 2004,
Comparative analysis of quality of milk
collected from buffalo, cow, goat and
sheep of Rawalpindi/Islamabad region of
Pakistan: Asian journal of plant science,
v. 3 (3), p. 300-305.
Robert, B., 2002, Factors affecting the clotting
properties of sheep milk: Journal of the
science of food and agriculture, v. 82, p.
705-719.
Rodriguez, E. M., Sanz, A. M., and Diaz, R.C.,
2000, Concentration of iron, copper and
zinc in human milk and powdered infant
formula: International Journal of Food
Science and Nutrition, v. 51 (5), p. 373-
380.

Lasbela University Journal of Science and Technology (2013) Vol-2ISSN 2306-8256
Online available at www.luawms.edu.pk pg. 77
Salwa, B., Ali, S., Amira, A., and Hamadi, A.,
2009, Physicochemical characteristics and
renneting properties of camel milk: a
comparison with goat’s, ewe’s and cow’s
milk: International journal of dairy
technology, v. 62 (4), p. 505-513.
Simsek, O., Gultekin, R., Oksuz, O., and
Kurultay, S., 2000, The effect of
environmental pollution on the heavy
metal contents of raw milk: Nahrung, the
Nutrition Society, v. 44 (5), p. 360-363.
Talevski, G., Vasilevska, R., Csrbinovska, S.,
and Sireta, Z., 2009, Quality of the sheep
milk as a raw material in dairy industry of
Macedonia: Biotechnology of Animal
Husbandry, v. 25, p. 971-977.
Vander-Jagt, D. J., Okolo, S. N., Romero, L.,
Millson, M., and Glew, R. H., 2001, Lead
levels in the milk of Fulani women in
Nigeria: J. Natl. Med. Assoc., v. 93 (3),
p.104-108.
Vavilis, D., Bontis, J., Agorastos, T.,
Angelikakis, G., Zournatzi, V.,
Loufopoulos, A. Constantinou, A., and
Patsourou, A., 1997, Lead concentration
in early human milk of urban and rural
mothers: Clin. Exp. Obstet. Gynecol., v.
24 (4), p. 198-199.
Webb, B. H, Johnson, A. H., and Alford, J. A.,
1974,Fundamentals of dairy chemistry:
2nd
Ed. Westport, CT: AVI Publishing
Company.
Zubair, I. E. M., and El Ibrahium, M. I., 2009,
Effect of pasteurization of milk on the
keeping quality of fermented camel milk
(gariss) in Sudan: Traditional Dairy Food,
Karnal, India, v. 2, p. 1-9.
