patient blood management guidelines: module 2 perioperative · guidelines: module 2 perioperative...
TRANSCRIPT

Patient Blood Management Guidelines: Module 2
PerioperativeTechnical Report Volume 1b Review of the evidence (question 3)

Technical report on perioperative patient blood management – Volume 1b July 2011 ii
Contents
Abbreviations and acronyms .............................................................................................................. vii Introduction ............................................................................................................................................ 1 1 Acute normovolemic haemodilution ............................................................................................ 1 2 Intraoperative cell salvage .......................................................................................................... 28 3 Perioperative acute normovolemic haemodilution combined with intraoperative cell salvage
....................................................................................................................................................... 55 4 Postoperative cell salvage .......................................................................................................... 62 5 Deliberate induced hypotension ................................................................................................. 73 6 Prevention of hypothermia .......................................................................................................... 86 7 Point-of-care testing using thromboelastography .................................................................... 97 8 Administration of antifibrinolytics and DDAVP ....................................................................... 108 9 Appropriate patient positioning ................................................................................................ 211 10 Preoperative autologous donation ........................................................................................... 219 References .......................................................................................................................................... 229

Technical report on perioperative patient blood management – Volume 1b July 2011 iii
Tables Table 1.1 Characteristics and quality of Level I evidence for acute normovolemic haemodilution
.................................................................................................................................. 2 Table 1.2 Results for Level I evidence: ANH versus no ANH ................................................... 3 Table 1.3 Characteristics and quality of Level II evidence for acute normovolemic haemodilution
.................................................................................................................................. 7 Table 1.4 Results for Level II evidence: ANH versus no ANH (blood loss) ............................ 10 Table 1.5 Results for Level II evidence: ANH versus no ANH (transfusion requirements) ..... 12 Table 1.6 Results for Level II evidence: ANH versus no ANH (mortality and morbidity) .......... 18 Table 1.7 Results for Level II evidence: ANH versus no ANH (haemoglobin concentration and
coagulation parameters) .......................................................................................... 21 Table 1.8 Results for Level II evidence: ANH versus no ANH (length of hospital/ICU stay,
reoperation for bleeding and duration of surgery) .................................................... 25 Table 2.1 Characteristics and quality of Level I evidence for intraoperative cell salvage ........ 28 Table 2.2 Results for Level I evidence: Intraoperative cell salvage versus no cell salvage ..... 29 Table 2.3 Characteristics and quality of Level II evidence for intraoperative cell salvage ....... 34 Table 2.4 Results for Level II evidence: Intraoperative cell salvage versus no cell salvage (blood
loss and transfusion requirements) ......................................................................... 36 Table 2.5 Results for Level II evidence: Intraoperative cell salvage versus no cell salvage
(mortality and morbidity) .......................................................................................... 42 Table 2.6 Results for Level II evidence: Intraoperative cell salvage versus no cell salvage
(haemoglobin concentration and coagulation parameters) ...................................... 47 Table 2.7 Results for Level II evidence: Intraoperative cell salvage versus no cell salvage (length
of hospital/ICU stay, reoperation for bleeding and duration of surgery) ................... 50 Table 2.8 Incremental cost-effectiveness of cell salvage versus other strategies, for all surgical
procedures .............................................................................................................. 53 Table 2.9 Expected allogeneic blood requirements (allogeneic blood transfusion vs cell salvage)
................................................................................................................................ 53 Table 2.10 Sensitivity analysis of device usage and provision of cell salvage operator: autologous
versus homologous transfusion ............................................................................... 54 Table 3.1 Characteristics and quality of Level II evidence for combined ANH and intraoperative
cell salvage ............................................................................................................. 56 Table 3.2 Results for Level II evidence: Perioperative ANH and intraoperative cell salvage ... 57 Table 4.1 Characteristics and quality of Level I evidence for postoperative cell salvage ........ 62 Table 4.2 Results for Level I evidence: postoperative cell salvage versus no cell salvage ..... 64 Table 4.3 Characteristics and quality of Level II evidence for postoperative cell salvage ....... 67 Table 4.4 Results for Level II evidence: postoperative cell salvage versus no cell salvage .... 68 Table 5.1 Characteristics and quality of Level I evidence for deliberate induced hypotension 73 Table 5.2 Results for Level I evidence: induced hypotension vs no induced hypotension ...... 74 Table 5.3 Characteristics and quality of Level II evidence for deliberate induced hypotension 76 Table 5.4 Results for Level II evidence: induced hypotension versus no induced hypotension77 Table 6.1 Characteristics and quality of Level I evidence for prevention of hypothermia ........ 86 Table 6.2 Results for Level I evidence: prevention of hypothermia versus no prevention of
hypothermia............................................................................................................. 88 Table 6.3 Characteristics and quality for Level II evidence for prevention of hypothermia ...... 90 Table 6.4 Results for Level II evidence: prevention of hypothermia versus no prevention of
hypothermia............................................................................................................. 90 Table 7.1 Characteristics and quality of Level II evidence for TEG-based point-of-care testing98

Technical report on perioperative patient blood management – Volume 1b July 2011 iv
Table 7.2 Results for Level II evidence: TEG-based point-of-care testing versus no TEG-based point-of-care testing ................................................................................................. 99
Table 7.3 Characteristics and quality of Level III evidence for TEG-based point-of-care testing105 Table 7.4 Results for Level III evidence: TEG-based point-of-care testing versus no TEG-based
point-of-care testing ............................................................................................... 106 Table 8.1 Characteristics of Level I evidence for aprotinin .................................................... 110 Table 8.2 Results for Level I evidence: aprotinin versus no aprotinin in adults ..................... 114 Table 8.3 Results for supportive Level I evidence: aprotinin versus no aprotinin in adult cardiac
surgery patients (Henry, 2009) .............................................................................. 120 Table 8.4 Results for supportive Level I evidence: aprotinin versus no aprotinin in adult cardiac
surgery patients (Brown, 2007) ............................................................................. 123 Table 8.5 Results for Level I evidence: IV aprotinin versus no aprotinin in adult cardiac surgery
patients receiving aspirin (McIlroy, 2009)(70) ........................................................ 125 Table 8.6 Results for supportive Level I evidence: aprotinin versus no aprotinin in adult hip and
knee replacement surgery patients (Kagoma 2009)(74) ....................................... 127 Table 8.7 Results for additional supportive Level III evidence: safety of aprotinin in
epidemiological studies (Gagne, 2009)(86) ........................................................... 129 Table 8.8 Results for Level I evidence: topical aprotinin versus no aprotinin in adult on-pump
cardiac surgery (Abrishami, 2009) (67) ................................................................. 130 Table 8.9 Results for Level I evidence: IV aprotinin versus no aprotinin in paediatric cardiac and
scoliosis surgery patients (Schouten, 2009) .......................................................... 131 Table 8.10 Results for Level I evidence: aprotinin versus no aprotinin – comparison between
Schouten (2009) review and more recent reviews ................................................ 132 Table 8.11 Characteristics of Level II evidence for aprotinin ................................................... 132 Table 8.12 Results for Level II evidence for transfusion incidence: IV aprotinin acid versus placebo
in adults ................................................................................................................. 134 Table 8.13 Results for Level II evidence for transfusion volume: IV aprotinin acid versus placebo in
adults ..................................................................................................................... 134 Table 8.14 Results for Level II evidence for blood loss: IV aprotinin acid versus placebo in adults
.............................................................................................................................. 136 Table 8.15 Results for Level II evidence for mortality: IV aprotinin acid versus placebo in adults137 Table 8.16 Results for Level II evidence for reoperation: IV aprotinin acid versus placebo in adults
.............................................................................................................................. 137 Table 8.17 Results for Level II evidence for thromboembolic events: IV aprotinin acid versus
placebo in adults ................................................................................................... 138 Table 8.18 Results for Level II evidence for renal effects: IV aprotinin acid versus placebo in adults
.............................................................................................................................. 139 Table 8.19 Results for Level II evidence for ICU length of stay: IV aprotinin acid versus placebo in
adults ..................................................................................................................... 140 Table 8.20 Results for Level II evidence for hospital length of stay: IV aprotinin acid versus placebo
in adults ................................................................................................................. 140 Table 8.21 Results for Level II evidence: topical aprotinin versus placebo in adults ............... 141 Table 8.22 Characteristics of Level I evidence for tranexamic acid ......................................... 143 Table 8.23 Results for Level I evidence: tranexamic acid versus no tranexamic acid in adults
(Henry, 2007) ........................................................................................................ 146 Table 8.24 Results for Level I evidence: tranexamic acid versus no tranexamic acid in adult cardiac
surgery patients (Henry, 2009) .............................................................................. 152 Table 8.25 Results for supportive Level I evidence: tranexamic acid versus no tranexamic acid in
adult cardiac surgery patients (Brown, 2007) ........................................................ 155

Technical report on perioperative patient blood management – Volume 1b July 2011 v
Table 8.26 Results for Level I evidence: lysine analogue versus no lysine analogue in adult cardiac surgery patients receiving aspirin (McIlroy, 2009) ................................................. 157
Table 8.27 Results for supportive Level I evidence: tranexamic acid versus no tranexamic acid in adult hip and knee replacement surgery patients (Kagoma, 2009) ....................... 159
Table 8.28 Results for Level I evidence: topical tranexamic acid versus no tranexamic acid in adult on-pump cardiac surgery (Abrishami, 2009) .......................................................... 160
Table 8.29 Results for Level I evidence: oral tranexamic acid versus no tranexamic acid in adult liver resection (Gurusamy, 2009) .......................................................................... 161
Table 8.30 Results for Level I evidence: IV tranexamic acid versus no tranexamic acid in paediatric cardiac and scoliosis surgery patients (Schouten, 2009)....................................... 162
Table 8.31 Results for Level I evidence: tranexamic acid versus no tranexamic acid – comparison between Schouten review and the Tzortzopoulou review...................................... 163
Table 8.32 Characteristics of Level II evidence for tranexamic acid ........................................ 163 Table 8.33 Results for Level II evidence for transfusion incidence: intravenous tranexamic acid
versus placebo in adults ........................................................................................ 165 Table 8.34 Results for Level II evidence for transfusion volume: IV tranexamic acid versus placebo
in adults ................................................................................................................. 167 Table 8.35 Results for Level II evidence for blood loss: IV tranexamic acid versus placebo in adults
.............................................................................................................................. 169 Table 8.36 Results for Level II evidence for mortality: intravenous tranexamic acid versus placebo
in adults ................................................................................................................. 170 Table 8.37 Results for Level II evidence for reoperation: IV tranexamic acid versus placebo in
adults ..................................................................................................................... 171 Table 8.38 Results for Level II evidence for thromboembolic events: intravenous tranexamic acid
versus placebo in adults ........................................................................................ 171 Table 8.39 Results for Level II evidence for renal effects: intravenous tranexamic acid versus
placebo in adults ................................................................................................... 172 Table 8.40 Results for Level II evidence for intensive care unit length of stay: intravenous
tranexamic acid versus placebo in adults .............................................................. 173 Table 8.41 Results for Level II evidence for hospital length of stay: IV tranexamic acid versus
placebo in adults ................................................................................................... 173 Table 8.42 Results for Level II evidence for transfusion volume: topical tranexamic acid versus
placebo in adults ................................................................................................... 174 Table 8.43 Results for Level II evidence for blood loss: topical tranexamic acid versus placebo in
adults ..................................................................................................................... 175 Table 8.44 Results for Level II evidence for mortality, reoperation, myocardial infarction, length of
stay: topical tranexamic acid versus placebo in adults .......................................... 175 Table 8.45 Characteristics of Level I evidence for ε-aminocaproic acid .................................. 178 Table 8.46 Results for Level I evidence: ε-aminocaproic acid versus no ε-aminocaproic acid in
adults (Henry, 2007) .............................................................................................. 181 Table 8.47 Results for supportive Level I evidence: ε-aminocaproic acid versus no ε-aminocaproic
acid in adult cardiac surgery patients (Brown, 2007) ............................................. 186 Table 8.48 Results for Level I evidence: lysine analogue versus no lysine analogue in adult cardiac
surgery patients receiving aspirin (McIlroy, 2009) ................................................. 188 Table 8.49 Results for supportive Level I evidence: ε-aminocaproic acid versus no ε-aminocaproic
acid in adult hip and knee replacement surgery patients (Kagoma, 2009) ............ 189 Table 8.50 Results for Level I evidence: IV ε-aminocaproic acid versus no ε-aminocaproic acid in
paediatric cardiac and scoliosis surgery patients (Schouten, 2009) ...................... 190

Technical report on perioperative patient blood management – Volume 1b July 2011 vi
Table 8.51 Results for Level I evidence: tranexamic acid versus no tranexamic acid – comparison between Schouten review and Tzortzopoulou, 2008 ............................................. 191
Table 8.52 Characteristics of Level II evidence for ε-aminocaproic acid ................................. 192 Table 8.53 Results for Level II evidence: IV ε-aminocaproic acid versus placebo in adults
(Berenholtz, 2009) ................................................................................................. 193 Table 8.54 Characteristics of Level I evidence for desmopressin ........................................... 197 Table 8.55 Results for Level I evidence: desmopressin versus no desmopressin in adults
(Crescenzi, 2008) .................................................................................................. 199 Table 8.56 Results for Level I evidence: desmopressin versus no desmopressin in adults (Carless,
2008) ..................................................................................................................... 203 Table 9.1 Characteristics and quality of Level II evidence for appropriate patient positioning during
surgery .................................................................................................................. 211 Table 9.2 Results for Level II evidence: appropriate patient positioning during surgery versus
usual positioning .................................................................................................... 212 Table 10.1 Characteristics and quality of Level I evidence for preoperative autologous donation219 Table 10.2 Results for Level I evidence: PAD versus no PAD ............................................... 220 Table 10.3 Characteristics and quality of Level II evidence for preoperative autologous donation223 Table 10.4 Results for Level II evidence: PAD versus no PAD .............................................. 224

Technical report on perioperative patient blood management – Volume 1b July 2011 vii
Abbreviat ions and acronyms
AAA abdominal aortic aneurysm
ACT anticoagulant therapy
AE adverse event
ANH acute normovolemic haemodilation
APTT activated partial thromboplastin time
CABG coronary artery bypass graft
CI confidence interval
CPB cardiopulmonary bypass
CRG Consumer/Clinical Reference Group
CVA cardiovascular accident
DDAVP desmopressin (1-deamino-8-D-arginine vasopressin)
DVT deep vein thrombosis
EACA epsilon-aminocaproic acid
FFP Fresh frozen plasma
Hb haemoglobin
ICU intensive care unit
INR international normalised ratio
IQR interquartile range
IV intravenous
KIU kallikrein inactivator units
MD mean difference
MI myocardial infarction
NA not applicable
NHMRC National Health and Medical Research Council
NR not reported
NS not significant
OPCAB off-pump cardiopulmonary artery bypass
OR odds ratio
Phet P value of the Q-test for heterogeneity
PRBC packed red blood cells
PR-INR preoperative international normalised ratio
PT prothrombin time

Technical report on perioperative patient blood management – Volume 1b July 2011 viii
PT-INR postoperative international normalised ratio
QALY quality adjusted life year
R2 coefficient of determination
RBC red blood cell
RCT randomised controlled trial
RR relative risk
SD standard deviation
SE standard error
SEM standard error of mean
TEG thromboelastography
THK total hip arthroplasty
TKR total knee replacement
VAS visual analog scale
VTE venous thromboembolism
WMD weighted mean difference

Technical report on perioperative patient blood management – Volume 1b July 2011 1
Introduction
This volume deals with question 3 of the systematic review for perioperative patient blood
management.
In patients undergoing surgery, what is the effect of perioperative strategies that minimise blood loss on morbidity, mortality and blood transfusion?
This volume is accompanied by Volume 2b, which presents the appendixes for the systematic review
of the evidence and the evidence-based recommendations for this question. Two other volumes – 1a
and 2a – cover questions 1, 2 and 4–9.
Question 3 includes the following 10 interventions:
• Intervention 1 – acute normovolemic haemodilution (ANH)
• Intervention 2 – intraoperative cell salvage
• Intervention 3 – perioperative acute normovolemic haemodilution combined with intraoperative cell salvage
• Intervention 4 – postoperative cell salvage
• Intervention 5 – deliberate induced hypotension
• Intervention 6 – prevention of hypothermia
• Intervention 7 – point-of-care testing using thromboelastography
• Intervention 8 – administration of antifibrinolytics (aprotinin, tranexamic acid, ε-aminocaproic acid) and desmopressin (1-deamino-8-D-arginine vasopressin, DDAVP)
• Intervention 9 – appropriate patient positioning
• Intervention 10 – preoperative autologous donation (PAD).
Technical report on perioperative patient blood management – Volume 1b July 2011 1
1 Acute normovolemic haemodi lut ion
Methods
The systematic review process identified five relevant Level I studies that assessed the effect of acute normovolemic haemodilution (ANH) in patients undergoing surgery. An additional literature search was conducted to identify Level II studies that were published after the literature search dates of key Level I evidence. Fourteen relevant randomised controlled trials (RCTs) were identified.
No socioeconomic literature pertaining to Australia’s Indigenous population was identified in the literature search for this research question.
No published economic evaluations on the use of ANH for minimising blood loss were identified in the literature search for this research question.
Level I evidence Five systematic reviews of RCTs examined whether ANH reduces mortality, morbidity and the need for allogeneic blood transfusion in patients undergoing surgery. The main characteristics of these reviews are summarised in Table 1.1.
There was substantial overlap between many of the systematic reviews. Therefore, a decision was made to limit the assessment of evidence to the most up-to-date and comprehensive reviews for each population and surgery type. For these reasons, the following reviews were chosen to form the basis of this evidence review:
• Carless (2004)(1) – provides a comprehensive analysis of ANH in adults undergoing any surgery type. The review does not include an analysis of the effect of ANH on blood loss.
• Bryson (1998)(2) – includes an analysis of the effect of ANH on blood loss in adults undergoing any surgery type.
• Gurusamy (2009)(3) – provides a more up-to-date analysis of the use of ANH in adults undergoing liver resection.

Technical report on perioperative patient blood management – Volume 1b July 2011 2
Table 1.1 Characteristics and quality of Level I evidence for acute normovolemic haemodilution
Author (Year) Study quality
Date of literature search
Population Surgery
No. of included studies assessing ANH
Relevant outcomes
Gurusamy (2009)(3) Good
November 2008 Adults undergoing liver resection a
3 trials Blood loss Transfusion incidence Transfusion volume Mortality Morbidity Operative time Length of hospital stay
Segal (2004)(4) Poor
October 2002 Adults undergoing any type of surgery
25 trials Transfusion incidence Transfusion volume Mortality Morbidity
Carless (2004)(5) Fair
July 2002 Adults undergoing any type of surgery
30 trials Transfusion incidence Transfusion volume Mortality Morbidity Re-operation for bleeding Length of hospital stay
Laupacis (1998)(2) Fair
March 1997 Adults undergoing any type of elective surgery
16 trials Transfusion incidence Transfusion volume
Bryson (1998)(2) Good
August 1996 Adults undergoing any type of surgery
24 trials Blood loss Transfusion incidence Transfusion volume Mortality Morbidity
Note: Systematic reviews that form the basis of this evaluation ((i.e. pivotal reviews) are shaded. ANH, acute normovolemic haemodilution a Trials were included irrespective of whether they included major or minor liver resections, or normal or cirrhotic livers; whether vascular occlusion was used or not, and irrespective of the reason for liver resection.
The results from the three pivotal reviews(2;3;5) are provided in Table 1.2. The outcomes assessed in the systematic reviews include incidence of transfusion, volume of blood transfused, blood loss, morbidity, mortality, length of hospital stay, length of surgery and reoperation for bleeding. None of the systematic reviews reported on quality of life, haemoglobin concentration or intensive care unit (ICU) admission/length of stay.

Technical report on perioperative patient blood management – Volume 1b July 2011 3
Table 1.2 Results for Level I evidence: ANH versus no ANH
Author (year) No.of trials (N) ANH No ANH Pooled risk estimate
Operative blood loss (mL)
Mean ± SD Mean difference (95%CI) Bryson 1998(2) 13 trials (fair and poor
quality a; N=500) NR NR –117 (–292, 58)
P>0.05 (Phet<0.001) Cardiac surgery Bryson 1998(2) 7 trials (fair and poor
quality b; N=350) NR NR –233 (–459, –5)
P<0.05 (Phet<0.001) Orthopaedic surgery Bryson 1998(2) 1 trial (fair/poor quality c;
N=31) NR NR 33 (–512, 578)
P>0.05 (Phet=NA) Liver surgery Gurusamy (2009)(3)
2 trials (fair quality; N=98) NR NR 1.53 (–102.37, 105.44) P>0.05 (Phet=0.83)
Miscellaneous surgery Bryson 1998(2) 5 trials (fair and poor
quality; N=119) NR NR –97 (–339, 145)
P>0.05 (Phet=0.013)
Incidence of allogeneic blood transfusion
n/N (%) RR (95%CI) Carless (2004)(5) 25 trials (quality NR d;
N=1081) 273/567 (48) 357/514 (69) 0.69 (0.56, 0.84)
P<0.05 (Phet<0.00001) Cardiac surgery Carless (2004) (5)
10 trials (quality NR; N=NR)
NR NR 0.77 (0.57, 1.04) P>0.05 (Phet=NR)
Orthopaedic surgery Carless (2004) (5)
6 trials (quality NR; N=NR) NR NR 0.79 (0.60, 1.06) P>0.05 (Phet=NR)
Liver surgery Gurusamy (2009)(3)
3 trials (fair quality; N=233) NR NR 0.41 (0.25, 0.66) P<0.05 (Phet=0.70)
Miscellaneous surgery e
Carless (2004) (5)
9 trials (quality NR; N=NR) NR NR 0.42 (0.24, 0.74) P<0.05 (Phet=NR)
Studies with a transfusion protocol Carless (2004) (5)
16 trials (quality NR; N=NR)
NR NR 0.81 (0.62, 1.00) P=0.05 (Phet=NR)
Studies without a transfusion protocol Carless (2004) (5)
9 trials (quality NR: N=NR) NR NR 0.53 (0.36, 0.76) P<0.05 (Phet=NR)
Technical report on perioperative patient blood management – Volume 1b July 2011 4
Author (year) No.of trials (N) ANH No ANH Pooled risk estimate
Volume of allogeneic blood transfused (mean units)
Mean ± SD Mean difference (95%CI) Carless (2004) (5)
17 trials (quality NR f; N=NR)
NR NR –1.9 (–1.1, –2.7) P<0.05 (Phet=NR)
Liver surgery Gurusamy (2009)(3)
2 trials (N=150) NR NR –0.09 (–0.48, 0.29) P>0.05 (Phet<0.00001)
Studies with a transfusion protocol Carless (2004) (5)
NR NR NR –1.0 (–1.7, –0.4) P<0.05 (Phet=NR)
Studies without a transfusion protocol Carless (2004) (5)
NR NR NR –3.0 (–4.9, –1.1) P<0.05 (Phet=NR)
Mortality
n/N (%) RR (95%CI) Carless (2004) (5)
8 trials (quality NR; N=NR) NR NR 1.16 (0.19, 7.15) P>0.05 (Phet=NR)
Liver surgery Gurusamy (2009)(3)
2 trials (fair quality; N=150) NR NR 0.35 (0.04, 3.32) P>0.05 (Phet=1.00)
Morbidity
Infection n/N (%) RR (95%CI) Carless (2004) (5)
2 trials (quality NR: N=NR) NR NR 4.94 (0.61, 40.19) P>0.05 (Phet=NR)
Any thrombosis n/N (%) RR (95%CI) Carless (2004) (5)
3 trials (quality NR; N=NR) NR NR 0.44 (0.21, 0.93) P<0.05 (Phet=NR)
Non-fatal MI n/N (%) RR (95%CI) Carless (2004) (5)
3 trials (quality NR: N=NR) NR NR 3.43 (0.15, 79.74) P>0.05 (Phet=NR)
Bile leak (liver resection) n/N (%) RR (95%CI) Gurusamy (2009) (3)
1 trial (fair quality; N=78) NR NR 1.5 (0.27, 8.49) P>0.05 (Phet=NA)
Intra-abdominal bleeding (liver resection) n/N (%) RR (95%CI) Gurusamy (2009) (3)
2 trials (fair quality; N=208) NR NR 1.87 (0.4, 8.67) P>0.05 (Phet=0.39)
Intra-abdominal infection (liver resection) n/N (%) RR (95%CI) Gurusamy (2009) (3)
1 trial (fair quality; N=78) NR NR 0.33 (0.04, 3.07) P>0.05 (Phet=NA)

Technical report on perioperative patient blood management – Volume 1b July 2011 5
Author (year) No.of trials (N) ANH No ANH Pooled risk estimate
Intra-abdominal collection requiring drainage (liver resection)
n/N (%) RR (95%CI)
Gurusamy (2009) (3)
1 trial (fair quality; N=130) NR NR 1.26 (0.061, 2.60) P>0.05 (Phet=NA)
Wound infection (liver resection) n/N (%) RR (95%CI) Gurusamy (2009) (3)
2 trials (fair quality; N=208) NR NR 0.84 (0.34, 2.03) P>0.05 (Phet=0.18)
Chest infection (liver resection) n/N (%) RR (95%CI) Gurusamy (2009) (3)
1 trial (fair quality; N=78) NR NR 1.50 (0.27, 8.49) P>0.05 (Phet=NA)
Reoperation for bleeding
n/N (%) RR (95%CI) Carless (2004)(5) 7 trials (quality NR; N=NR) NR NR 1.59 (0.20, 12.53)
P>0.05 (Phet=NR)
Length of hospital stay (days)
Mean ± SD Mean difference (95%CI) Carless (2004)(5) 3 trials (quality NR; N=96) NR NR 0.21 (–1.26, 1.68)
P>0.05 (Phet=NR) Liver surgery Gurusamy (2009) (3)
1 trial (fair quality; N=130) NR NR 0.0 (–2.66, 2.66) P>0.05 (Phet=NA)
Operating time (minutes)
Mean ± SD Mean difference (95%CI) Liver surgery Gurusamy (2009) (3)
2 trials (fair quality; N=208) NR NR –28.86 (–57.37, –0.35) P<0.05 (Phet=0.90)
ANH, acute normovolemic haemodilution; CI, confidence interval; het, heterogeneity; MI, myocardial infarction; NA, not applicable; NR, not reported; RR, relative risk; SD, standard deviation a Three studies had a Jadad score of 2 and the other studies had a Jadad score of 1. Five studies reported the use of a transfusion protocol. Two studies (Kochamba 1996 and Triulzi 1995) with a Jadad score of 2 reported the use of a transfusion protocol. Full texts of these two papers were retrieved. Kochamba 1996 and Triulzi 1995 were considered to be fair quality (not double-blinded, no allocation concealment reported, demographics similar between groups, all randomised patients included in analysis, statistical methods appropriate). The other 11 studies in Bryson 1998(2) would have been rated as either fair or poor, based on the Jadad scores and whether or not a transfusion protocol was reported. b Two studies had a Jadad score of 2 and the other studies had a Jadad score of 1. Three studies reported the use of a transfusion protocol. Two studies (Kochamba 1996 and Triulzi 1995) with a Jadad score of 2 reported the use of a transfusion protocol. Full texts of these two papers were retrieved. Kochamba 1996 and Triulzi 1995 were considered to be fair quality (not double-blinded, no allocation concealment reported, demographics similar between groups, all randomised patients included in analysis, statistical methods appropriate). The other five studies in Bryson 1998(2) in this subgroup would have been rated as either fair or poor, based on the Jadad scores and whether or not a transfusion protocol was reported. c One study had a Jadad score of 2 and the other studies had a Jadad score of 1. One study reported the use of a transfusion protocol. Neither of the studies with a Jadad score of 2 reported the use of a transfusion protocol. Therefore, all the studies in this subgroup would have been rated as either fair or poor, based on the Jadad scores and whether or not a transfusion protocol was reported. d Bryson 1998(2) reported the quality of 16 of the studies included in Carless 2004(5) that reported this outcome. Three studies had a Jadad score of 2 and the rest had a Jadad score of 1. Seven studies reported a transfusion protocol. Two studies (Triulzi 1995 and Von Bormann 1986) with a Jadad score of 2 reported the use of a transfusion protocol. Full texts of these two papers were retrieved. Triulzi

Technical report on perioperative patient blood management – Volume 1b July 2011 6
1995 was considered to be fair quality (not double-blinded, no allocation concealment reported, demographics similar between groups, all randomised patients included in analysis, statistical methods appropriate). Von Bormann (1986) was in German; therefore, its quality was not assessed further. The other 14 studies in Bryson 1998(2) would have been rated as either fair or poor, based on the Jadad scores and whether or not a transfusion protocol was reported. e Urological, thoracic, or vascular. f Bryson 1998(2) reported the quality of 13 of the studies included in Carless 2004(5) that reported this outcome. Five studies had a Jadad score of 2 and the rest had a Jadad score of 1. Six studies reported the use of a transfusion protocol. Three studies (Kochamba [1996], Triulzi [1995] and Von Bormann [1986]) with a Jadad score of 2 reported the use of a transfusion protocol. Full texts of these three papers were retrieved. Kochamba (1996) and Triulzi (1995) were considered to be fair quality (not double-blinded, no allocation concealment reported, demographics similar between groups, all randomised patients included in analysis, statistical methods appropriate). Von Bormann (1986) was in German; therefore, its quality was not assessed further. The other 10 studies in Bryson 1998(2) would have been rated as either fair or poor, based on the Jadad scores and whether or not a transfusion protocol was reported.
Blood loss Bryson (1998)(2) and Gurusamy (2009)(3) were the only systematic reviews that assessed the effect of ANH on operative blood loss. Bryson (1998)(2) found that ANH significantly decreased operative blood loss in cardiac surgery (7 studies; mean difference [MD]: –233 mL; 95%CI: –459, –5), but not orthopaedic surgery (1 study; MD: 33 mL; 95%CI: –512, 578) or other miscellaneous surgery (5 studies; MD: –97 mL; 95%CI: –339, 145). Gurusamy (2009)(3) found no significant effect for ANH on operative blood loss in patients undergoing liver resection (2 studies; MD: 1.53 mL; 95%CI: –102.37; 105.44).
Incidence of transfusion On the basis of 25 included studies, Carless (2004)(5) reported that, overall, ANH significantly reduced the proportion of patients requiring allogeneic transfusion (48% vs 69%; RR 0.69; 95%CI: 0.56, 0.84). However, ANH did not significantly reduce the requirement for allogeneic transfusion in patients undergoing cardiac surgery (RR 0.77; 95%CI: 0.57, 1.04) or orthopaedic surgery (RR 0.79; 95%CI: 0.60, 1.06), but had a significant effect in other surgery types (RR 0.42; 95%CI: 0.24, 0.74). ANH significantly reduced the incidence of transfusion in studies with a transfusion protocol (RR 0.81; 95%CI: 0.62, 1.00), and studies without a transfusion protocol (RR 0.53; 95%CI: 0.36, 0.76).
Based on three studies, Gurusamy (2009)(3) reported that ANH was associated with a significantly lower incidence of allogeneic transfusion in adults undergoing liver surgery (RR 0.41; 95%CI: 0.25, 0.66).
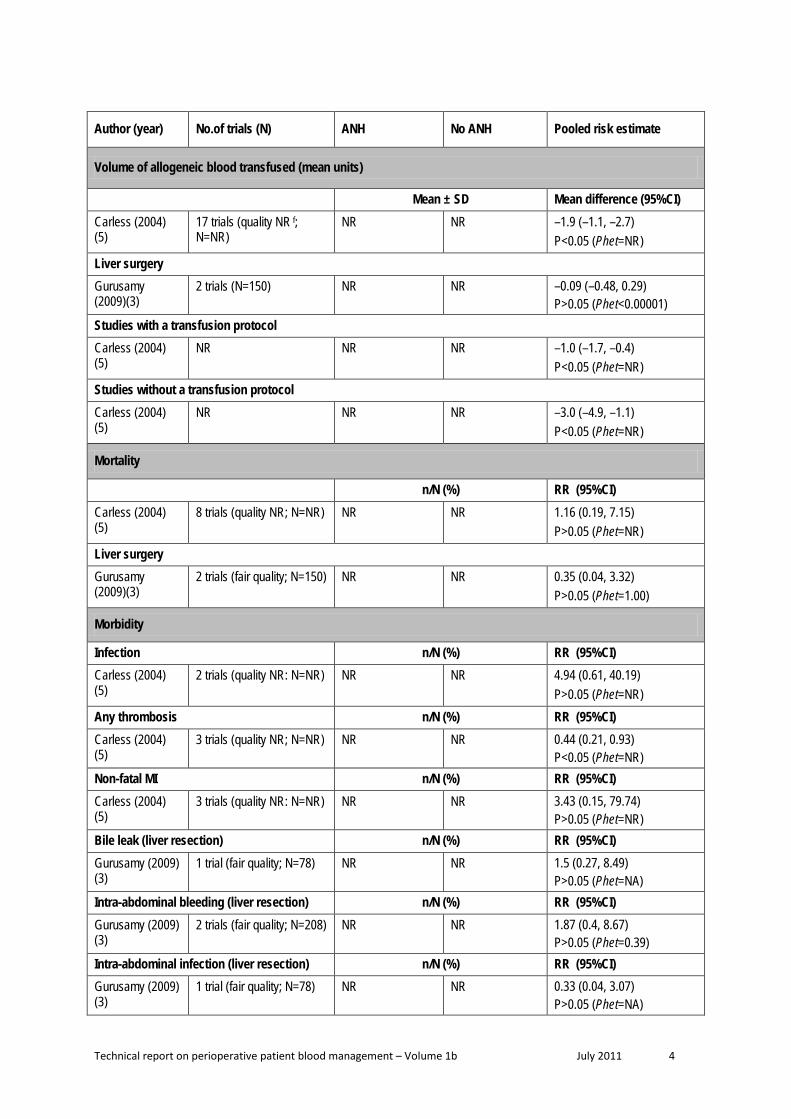
Volume of transfusion Carless (2004)(5) found that for all surgery types combined, ANH significantly reduced the volume of allogeneic blood transfused (17 studies; MD: –1.9 units; 95%CI: –1.1, –2.7). Gurusamy (2009)(3) found that ANH had no significant effect on volume of allogeneic blood transfused in adults undergoing liver surgery (2 studies; MD: –0.09 units; 95%CI: –0.48, 0.29).
Mortality Carless (2004)(5) found no significant association between ANH and mortality for adults undergoing any elective surgery (8 trials; RR 1.16; 95%CI: 0.19, 7.15). Similarly, Gurusamy (2009)(3) found no significant association in adults undergoing liver surgery (2 trials; RR 0.35; 95%CI: 0.04, 3.32).

Technical report on perioperative patient blood management – Volume 1b July 2011 7
Morbidity According to Carless (2004)(5), ANH is significantly associated with a lower rate of thrombosis compared with control (3 trials; RR 0.44; 95%CI: 0.21, 0.93). However, the Carless review found no significant association between ANH and infection (2 trials; RR 4.94; 95%CI: 0.61, 40.19), or non-fatal myocardial infarction (MI) (3 trials; RR 3.43; 95%CI: 0.15, 79.74).
Reoperation for bleeding Based on seven studies, Carless (2004)(5) found no significant association between ANH and reoperation for bleeding in adults undergoing elective surgery (RR 1.59; 95%CI: 0.20, 12.53).
Hospital length of stay The Carless (2004)(5) and Gurusamy (2009)(3) reviews both reported hospital length of stay. There was no significant association between ANH and hospital length of stay for adults undergoing elective surgery (3 trials; MD: 0.21 days; 95%CI: –1.26, 1.68)(5), and adults undergoing liver surgery (1 trial; MD: 0.0 days; 95%CI: –2.66, 2.66)(3).
Operative time In adults undergoing liver surgery, Gurusamy (2009)(3) reported that ANH is associated with a significant reduction in operating time (2 trials; MD: –28.86 minutes; 95%CI: –57.37, –0.35).
Level II evidence A literature search was conducted to identify Level II evidence published after the literature search conducted in the Carless (2004)(5) systematic review. Fourteen studies were identified and the main characteristics of these studies are summarised in Table 1.3.
Table 1.3 Characteristics and quality of Level II evidence for acute normovolemic haemodilution
Author Study type Study quality
Population Relevant outcomes
Akhlagh (2007)(6)
RCT Poor
Adults undergoing on-CPB CABG. (N=60; 30 ANH, 30 control)
Transfusion volume Haematocrit concentration
Bennett (2006)(7) RCT Fair
Adults undergoing elective hip surgery (anticipated blood loss between 1 to 1.5 L); most patients underwent primary total hip replacement, with 15 revision hip arthroplasties (7 in ANH and 8 in standard transfusion) and 1 hip resurfacing procedure (N=155; 78 ANH, 77 control)
Blood loss Transfusion incidence Transfusion volume Mortality Morbidity Length of hospital stay Postoperative need for medical attention after discharge
Casati (2002)(8) RCT Poor
Adults undergoing on-CPB cardiac surgery (N=204; 103 ANH, 101 control)
Blood loss Transfusion incidence Transfusion volume Mortality Morbidity Length of hospital/ICU stay

Technical report on perioperative patient blood management – Volume 1b July 2011 8
Author Study type Study quality
Population Relevant outcomes
Casati (2004)(9) RCT Fair
Adults undergoing off-CPB CABG (N=100; 50 ANH, 50 control
Blood loss Transfusion incidence Transfusion volume Mortality Morbidity Length of hospital/ICU stay Intubation time
Friesen (2006)(10)
RCT Fair
Infants undergoing on-CPB cardiac surgery (N=36; 16 ANH, 16 control)
Blood loss Haematocrit concentration Coagulation parameters
Hohn (2002)(11) RCT Poor
Adults undergoing on-CPB cardiac surgery (N=80; 39 ANH, 41 control)
Transfusion incidence Transfusion volume Haematocrit concentration Mortality Length of hospital/ICU stay Reoperation for bleeding Duration of surgery
Jarnagin (2008)(12)
RCT Fair
Adults undergoing major hepatic resection (3 or more liver segments) for any diagnosis, with or without any other planned procedures (N=130; 63 ANH, 67 control)
Blood loss Transfusion incidence Transfusion volume Morbidity Length of hospital stay Duration of surgery
Juelsgaard (2002)(13)
RCT Fair
Adults undergoing TKA (N=28; 14 ANH, 14 control)
Blood loss Transfusion volume
Lim (2003)(14) RCT Fair
Adults undergoing spinal surgery (N=30; 15 ANH, 15 control)
Blood loss Transfusion incidence Transfusion volume Haemoglobin concentration Morbidity
Matot (2002)(15) RCT Fair
Adults undergoing liver resection (N=78; 39 ANH, 39 control)
Blood loss Transfusion incidence Transfusion volume Haematocrit concentration Mortality Morbidity
Obasi (2006)(16) RCT Poor
Adults undergoing a variety of procedures a (N=62; 31 ANH, 31 control)
Haemoglobin concentration
Technical report on perioperative patient blood management – Volume 1b July 2011 9
Author Study type Study quality
Population Relevant outcomes
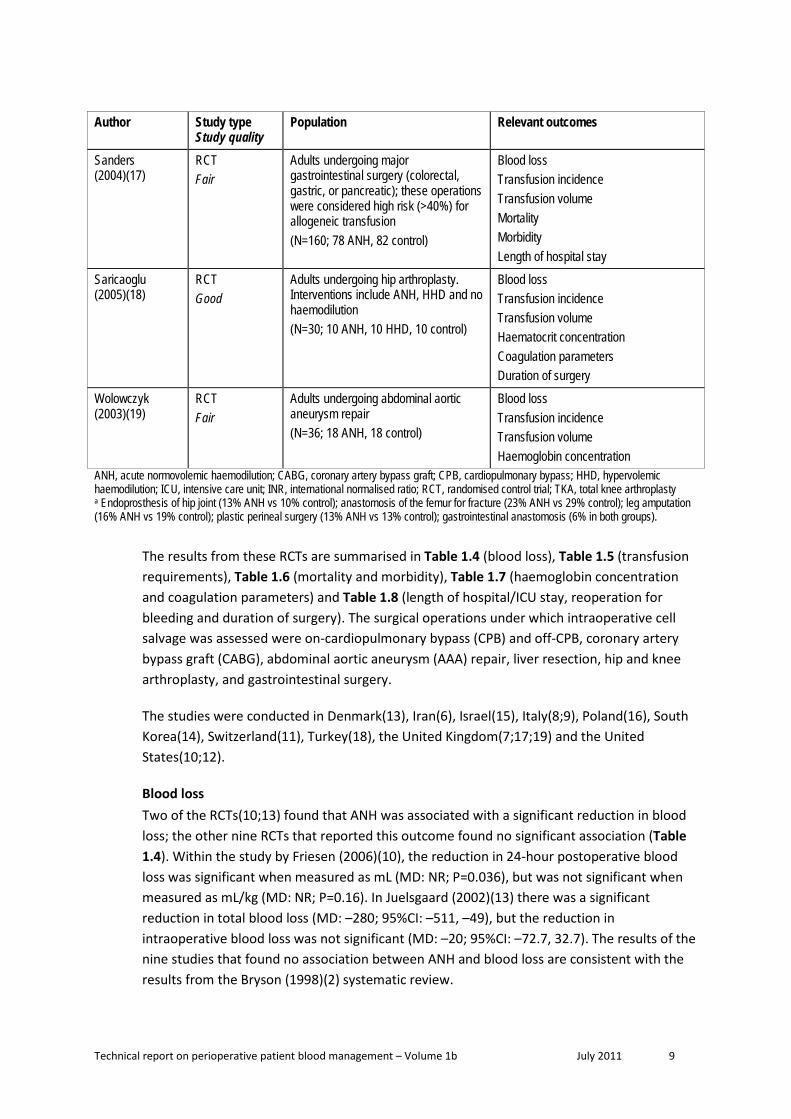
Sanders (2004)(17)
RCT Fair
Adults undergoing major gastrointestinal surgery (colorectal, gastric, or pancreatic); these operations were considered high risk (>40%) for allogeneic transfusion (N=160; 78 ANH, 82 control)
Blood loss Transfusion incidence Transfusion volume Mortality Morbidity Length of hospital stay
Saricaoglu (2005)(18)
RCT Good
Adults undergoing hip arthroplasty. Interventions include ANH, HHD and no haemodilution (N=30; 10 ANH, 10 HHD, 10 control)
Blood loss Transfusion incidence Transfusion volume Haematocrit concentration Coagulation parameters Duration of surgery
Wolowczyk (2003)(19)
RCT Fair
Adults undergoing abdominal aortic aneurysm repair (N=36; 18 ANH, 18 control)
Blood loss Transfusion incidence Transfusion volume Haemoglobin concentration
ANH, acute normovolemic haemodilution; CABG, coronary artery bypass graft; CPB, cardiopulmonary bypass; HHD, hypervolemic haemodilution; ICU, intensive care unit; INR, international normalised ratio; RCT, randomised control trial; TKA, total knee arthroplasty a Endoprosthesis of hip joint (13% ANH vs 10% control); anastomosis of the femur for fracture (23% ANH vs 29% control); leg amputation (16% ANH vs 19% control); plastic perineal surgery (13% ANH vs 13% control); gastrointestinal anastomosis (6% in both groups).
The results from these RCTs are summarised in Table 1.4 (blood loss), Table 1.5 (transfusion requirements), Table 1.6 (mortality and morbidity), Table 1.7 (haemoglobin concentration and coagulation parameters) and Table 1.8 (length of hospital/ICU stay, reoperation for bleeding and duration of surgery). The surgical operations under which intraoperative cell salvage was assessed were on-cardiopulmonary bypass (CPB) and off-CPB, coronary artery bypass graft (CABG), abdominal aortic aneurysm (AAA) repair, liver resection, hip and knee arthroplasty, and gastrointestinal surgery.
The studies were conducted in Denmark(13), Iran(6), Israel(15), Italy(8;9), Poland(16), South Korea(14), Switzerland(11), Turkey(18), the United Kingdom(7;17;19) and the United States(10;12).
Blood loss Two of the RCTs(10;13) found that ANH was associated with a significant reduction in blood loss; the other nine RCTs that reported this outcome found no significant association (Table 1.4). Within the study by Friesen (2006)(10), the reduction in 24-hour postoperative blood loss was significant when measured as mL (MD: NR; P=0.036), but was not significant when measured as mL/kg (MD: NR; P=0.16). In Juelsgaard (2002)(13) there was a significant reduction in total blood loss (MD: –280; 95%CI: –511, –49), but the reduction in intraoperative blood loss was not significant (MD: –20; 95%CI: –72.7, 32.7). The results of the nine studies that found no association between ANH and blood loss are consistent with the results from the Bryson (1998)(2) systematic review.

Technical report on perioperative patient blood management – Volume 1b July 2011 10
Table 1.4 Results for Level II evidence: ANH versus no ANH (blood loss)
Author Surgical procedure ANH No ANH Statistical significance
Intraoperative blood loss (mL) Mean (SD)
Juelsgaard (2002)(13) TKA 131 (78) 111 (56) MD: (95%CI): –20 (–72.7, 32.7);
P=0.44 Lim (2003)(14) Spinal surgery 1600 (620)
1500 (697)
MD: (95%CI): –100 (–593. 393);
P=0.68
Intraoperative blood loss (mL) Median (IQR)
Bennett (2006)(7) Hip surgery 692 (452, 1019) 641 (477, 1007) P=0.82
Wolowczyk (2003)(19) AAA repair 1780 (930, 5000) 1700 (750, 2600) P=0.55
Intraoperative blood loss (mL) Median (95%CI)
Saricaoglu (2005)(18) Hip arthroplasty 740 (600, 830)
HHD: 650 (500, 855)
Control: 695 (510, 855) P=0.275
Blood loss less than 1000 mL n/N (%)
Wolowczyk (2003) (19) AAA repair 4/16 (25) 5/18 (28) RR (95%CI): 0.90 (0.29, 2.78)
Postoperative blood loss (mL) Mean (SD)
Lim (2003)(14) Spinal surgery 600 (372)
883 (473)
MD: (95%CI): 283 (–35, 601);
P=0.08
Blood loss 0–4 hours postoperative, mL Median (IQR)
Casati (2002)(8)
On-CPB cardiac surgery 158 (106, 305) 172 (117.5, 265) P=0.93
Casati (2004)(9) Off-CPB CABG 160 (110, 235) 150 (100, 220) P>0.05
Blood loss 24 hours postoperative Median (IQR)
Friesen (2006)(10)
Infants undergoing on-CPB cardiac surgery
NR NR
In mL per 24 hour: Significantly lower in ANH group (P=0.036)
In mL/kg per 24 hour: ANH group not significantly lower
(P=0 16) Total blood loss Mean (SD)
Matot (2002)(15) Liver resection 1442 (1827) 1528 (1822) MD: (95%CI): 86 (–737, 909);
P=0.84
Total blood loss Median (IQR)
Bennett (2006)(7) Hip surgery 1182 (840, 1646) 1210 (816, 1545) P=0.82
Casati (2002)(8)
On-CPB cardiac surgery 374 (255, 704) 412 (313, 552) P=0.94
Casati (2004)(9) Off-CPB CABG 375 (248, 475) 350 (300, 443) NS

Technical report on perioperative patient blood management – Volume 1b July 2011 11
Author Surgical procedure ANH No ANH Statistical significance
Juelsgaard (2002)(13) TKA 1306 (300) 1026 (294) MD: (95%CI): –280 (–511, –49);
P=0.02 Total blood loss Median (range)
Jarnagin (2008)(12) Liver resection 800 (100–3200) 700 (100–4000) P=0.42
Sanders (2004)(17)
Gastrointestinal surgery
750–1000 (100–4500) 750–1000 (100–4368) NR
Volume of blood collected during ANH (mL) Mean (SD)
Hohn (2002)(11)
On-CPB cardiac surgery 1099 (333) NA NA
Lim (2003)(14) Spinal surgery 717 (194)
NA NA
Volume of blood collected during ANH (mL) Median (range)
Jarnagin (2008)(12) Liver resection 2250 (800 to 3000) NA NA
Wolowczyk (2003) (19) AAA repair 890 (670 to 1620) NA NA
Volume of blood collected during ANH (mL) Median (95%CI)
Saricaoglu (2005)(18) Hip arthroplasty 1065 (975, 1170) NA NA
Volume of RBC concentrate recovered by intraoperative cell salvage and retransfused
Median (IQR)
Wolowczyk (2003) (19) AAA repair 590 (200, 1410) 540 (210, 740) P=0.60
AAA, abdominal aortic aneurysm; ANH, acute normovolemic haemodilution; CABG, coronary artery bypass graft; CI, confidence interval; CPB, cardiopulmonary bypass; FFP; fresh frozen plasma; HHD, hypervolemic haemodilution; IQR, interquartile range; MD, mean difference; NA, not applicable; NR, not reported; NS, not significant; RBC, red blood cell; RR, relative risk; SD, standard deviation; TKA, total knee arthroplasty.
Incidence and volume of transfusion Table 1.5 summarises the results from the included RCTs regarding the proportion of patients receiving allogeneic blood transfusion and the volume of transfusion received.

Technical report on perioperative patient blood management – Volume 1b July 2011 12
Table 1.5 Results for Level II evidence: ANH versus no ANH (transfusion requirements)
Author Surgical procedure ANH No ANH Statistical significance
Transfusion with allogeneic blood components (including PRBC, FFP, PLTC)
n/N (%)
Casati (2002)(8)
On-CPB cardiac surgery 35/103 (34%) 36/101 (36%) RR (95%CI): 0.95 (0.65, 1.39);
P=0.80 Casati (2004)(9) Off-CPB CABG 2/50 (4%) 10/50 (20%) RR (95%CI): 0.20 (0.05, 0.87);
P=0.03
Jarnagin (2008)(12) Liver resection 14/63 (22.2%) 23/67 (34%) RR (95%CI): 0.65 (0.37, 1.14);
P=0.13
Units of allogeneic blood components transfused (including PRBC, FFP, PLTC)
Mean (SD)
Jarnagin (2008)(12) Liver resection 5.6 (13.5)
6.9 (22.1)
MD: (95%CI): 1.3 (–5.1, 7.7);
P=0.69
Transfusion with allogeneic blood n/N (%)
Bennett (2006)(7) Hip surgery 15 /78(19%) 22/77 (29%) RR (95%CI): 0.67 (0.38, 1.20);
P=0.18 Hohn (2002)(11)
On-CPB cardiac surgery 12/39 (31%) 12/41 (29%) RR (95%CI): 1.05 (0.54, 2.05);
P=0.88 Sanders (2004)(17)
Gastrointestinal surgery 22/78 (28%) 25/82 (30%) RR (95%CI): 0.93 (0.57, 1.50);
P=0.75 Units of allogeneic blood transfused
Mean (SD) for those transfused with allogeneic blood
Sanders (2004)(17)
Gastrointestinal surgery 4.1 (NR) 3.7 (NR) NR
Mean volume of allogeneic blood transfused, mL Mean (SD)
Akhlagh (2007)(6) On-CPB CABG 870 (NR) 2010 (NR) P=0.024
Units of allogeneic blood transfused Mean (SD)
Bennett (2006)(7) Hip surgery 2.2 (NR) 2.9 (NR) NR
Transfusion with allogeneic packed RBCs n/N (%)
Casati (2002)(8)
On-CPB cardiac surgery 32/103 (31%) 34/101 (34%) RR (95%CI): 0.92 (0.62, 1.37);
P=0.69 Casati (2004)(9) Off-CPB CABG 2/50 (4%) 10/50 (20%) RR (95%CI): 0.2 (0.05, 0.87);
P=0.028 Jarnagin (2008)(12) Liver resection 8/63 (12.7%) 17/67 (25.4%) RR (95%CI): 0.50 (0.23, 1.08);
P=0.08

Technical report on perioperative patient blood management – Volume 1b July 2011 13
Author Surgical procedure ANH No ANH Statistical significance
Juelsgaard (2002)(13) TKA 7/14 (50%) 6/14 (43%) RR (95%CI): 1.17 (0.52, 2.60);
P=0.71 Lim (2003)(14) Spinal surgery 10/15 (67%) 15/15 (100%) RR (95%CI): 0.68 (0.47, 0.98);
P=0.04 Matot (2002)(15) Liver resection 4/39 (10%) 14/39 (36%) RR (95%CI): 0.29 (0.10, 0.79);
P=0.014
Saricaoglu (2005)(18) Hip arthroplasty 2/10 (20%) HDD: 4/10 (40%)
Control: 10/10 (100%)
ANH vs HHD RR (95%CI): 0.50 (0.12, 2.14);
P=0.35 ANH vs control
RR (95%CI): 0.24 (0.08, 0.71); P=0.01
Units of allogeneic packed RBCs transfused Mean (SD) per transfused patient
Casati (2002)(8)
On-CPB cardiac surgery 3.8 (NR) 3.7 (NR) NR
Casati (2004)(9) Off-CPB CABG 2.5 (NR) 2.4 (NR) NR
Jarnagin (2008)(12) Liver resection 3.5 (10.3) 2.1 (4.1)
MD: (95%CI): –1.4 (–4.1, 1.3);
P>0.05
Saricaoglu (2005)(18) Hip arthroplasty 1.5 (0.7) HHD: 1.25 (0.5)
Control: 1.3 (0.5)
ANH vs HHD RR (95%CI): –0.25 (–0.82, 0.32);
P=0.37 ANH vs control
RR (95%CI): –0.2 (–0.77, 0.37); P=0.47
Units of allogeneic packed RBCs transfused Mean (SD) a
Lim (2003)(14) Spinal surgery 2.2 (2.3)
4.3 (1.5)
MD: (95%CI): 2.1 (0.7, 3.6);
P=0.0062
Units of allogeneic packed RBCs transfused Median (range) per transfused patient
Hohn (2002)(11)
On-CPB cardiac surgery 2 (1 to 5) 2 (1 to 3) P=0.219
Volume of allogeneic packed RBCs transfused (mL) Mean (SD) per transfused patient
Juelsgaard (2002)(13) TKA 386 (NR) 343 (NR) P=0.85
Transfusion with FFP n/N (%)
Jarnagin (2008)(12) Liver resection 11/63 (17.5%) 19/67 (28.4%) RR (95%CI): 0.62 (0.32, 1.19);
P=0.15
Transfusion with banked autologous blood ( intraoperatively)
n/N (%)

Technical report on perioperative patient blood management – Volume 1b July 2011 14
Author Surgical procedure ANH No ANH Statistical significance
Wolowczyk (2003) (19) AAA repair 7/16 (44%) 7/18 (39%) RR (95%CI): 1.13 (0.50, 2.51);
P=0.77
Transfusion with banked autologous blood (postoperatively)
n/N (%)
Wolowczyk (2003) (19) AAA repair 5/16 (31%)
10/18 (56%) RR (95%CI): 0.56 (0.24, 1.30);
P=0.18
Transfusion with banked autologous blood (intra- and postoperatively)
n/N (%)
Wolowczyk (2003) (19) AAA repair 10/16 (63%) 13/18 (72%) RR (95%CI): 0.87 (0.54, 1.39);
P=0.55
Units of banked autologous blood transfused intraoperatively
Median (IQR)
Wolowczyk (2003) (19) AAA repair 0 (0 to 4) 0 (0 to 2) P=0.51
Units of banked autologous blood transfused postoperatively
Median (IQR)
Wolowczyk (2003) (19) AAA repair 0 (0 to 2) 1 (0 to 2) P=0.33
Units of banked autologous blood transfused (intra- and postoperatively)
Median (IQR)
Wolowczyk (2003) (19) AAA repair 2 (0 to 5) 2.5 (0 to 5) P=0.68
AAA, abdominal aortic aneurysm; ANH, acute normovolemic haemodilution; CABG, coronary artery bypass graft; CI, confidence interval; CPB, cardiopulmonary bypass; FFP; fresh frozen plasma; HHD, hypervolemic haemodilution; IQR, interquartile range; MD, mean difference; NA, not applicable; NR, not reported; PLTC, platelet concentration; PRBC, packed red blood cells; RBC, red blood cell; RR, relative risk; SD, standard deviation; TKA, total knee arthroplasty a It is unclear whether the values represent the mean for the entire study population or only the patients transfused with allogeneic packed RBCs.
There is inconsistency between the Carless (2004)(5) systematic review and the subsequently published RCTs with regard to the proportion of individuals transfused with allogeneic blood. Therefore a meta-analysis was conducted herein (Figure 1.1). Using data from the Carless (2004) systematic review and the RCTs published from July 2002 onwards, the meta-analysed incidence of allogeneic blood transfusion is significantly lower for patients who received ANH (37 trials; RR 0.71; 95%CI: 0.61, 0.84). The effect was not significant for cardiac surgery overall (14 trials; RR 0.84; 95%CI: 0.70, 1.02), but there was a significant reduction in the incidence of allogeneic blood transfusion in the ANH arm of one of the included RCTs of off-pump cardiac bypass surgery (4% in the ANH group vs 20% in the no ANH group; Casati [2004](9)). The effect was borderline for orthopaedic surgery (9 trials; RR 0.76; 95%CI: 0.58, 1.00) and statistically significant for other surgery types (14 trials; RR 0.57; 95%CI: 0.43, 0.76).
Technical report on perioperative patient blood management – Volume 1b July 2011 15
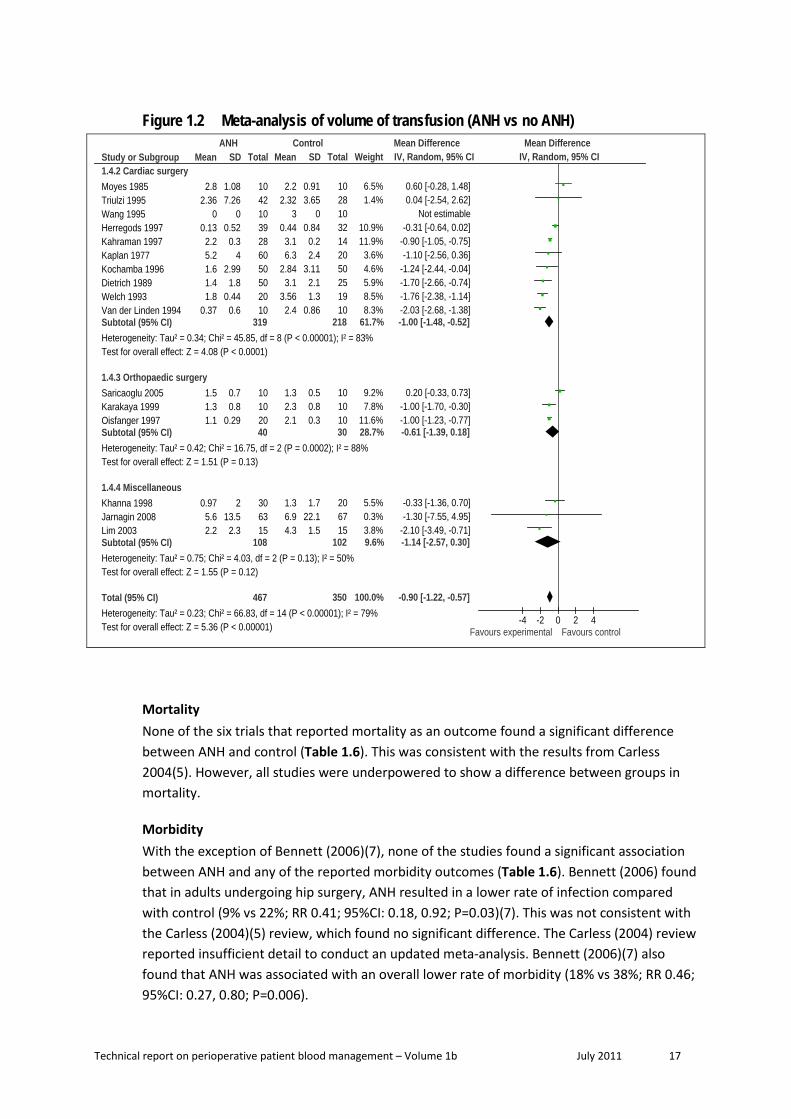
A meta-analysis of the units of allogeneic blood transfused was conducted combining the results from the Carless (2004) review1 with the results from subsequently published studies (Figure 1.2). ANH significantly decreases the volume of allogeneic transfusion compared with no ANH (MD: –0.90 units; 95%CI: –1.22, –0.57). The association is consistent for cardiac surgery (MD: –1.00 units; 95%CI: –1.48, –0.52), but is not significant in orthopaedic surgery (MD: –0.61 units; 95%CI: –1.39, 0.18) and other types of surgery (MD: –1.14 units; 95%CI: –2.57, 0.30).
The meta-analysis conducted herein showed a significant degree of heterogeneity (P<0.0001; I2=83%). The heterogeneity remains significant when assessed by surgery type.
1 Carless (2004) did not provide sufficient detail for the meta-analysis; therefore, the original RCTs were sourced. Lilleaasen (1977) was not included because the study comparator was low volume ANH; Von Bormann (1986) was excluded because the study was not in English; and Vedrinne (1992) was excluded due to insufficient detail.

Technical report on perioperative patient blood management – Volume 1b July 2011 16
Figure 1.1 Meta-analysis of incidence of transfusion (ANH vs no ANH)
Study or Subgroup1.1.2 Cardiac surgeryBoldt 1991Casati 2002Casati 2004Dietrich 1989Friesen 2006Hallowell 1972Herregods 1995Herregods 1997Hohn 2002Kahraman 1997Tempe 1996Triulzi 1995Vedrinne 1992Wang 1995Subtotal (95% CI)Total eventsHeterogeneity: Tau² = 0.07; Chi² = 74.81, df = 13 (P < 0.00001); I² = 83%Test for overall effect: Z = 1.72 (P = 0.09)
1.1.3 Orthopaedic surgeryAhlberg 1977Bennett 1994Bennett 2006Juelsgaard 2002Karakaya 1999Lorentz 1991Oisfanger 1997Saricaoglu 2005Vara Thorbeck 1990Subtotal (95% CI)Total eventsHeterogeneity: Tau² = 0.09; Chi² = 21.73, df = 8 (P = 0.005); I² = 63%Test for overall effect: Z = 1.95 (P = 0.05)
1.1.4 Miscellaneous surgeryAtallah 1993Boldt 1999Bonnet 1986-1Bonnett 1986-2Boussofare 2002Jarnagin 2008Khanna 1998Lim 2003Malinovsky 1989Matot 2002Moyes 1985Rose 1981Sanders 2004Von Bormann 1986Subtotal (95% CI)Total eventsHeterogeneity: Tau² = 0.11; Chi² = 27.73, df = 13 (P = 0.010); I² = 53%Test for overall effect: Z = 3.87 (P = 0.0001)
Total (95% CI)Total eventsHeterogeneity: Tau² = 0.13; Chi² = 212.06, df = 36 (P < 0.00001); I² = 83%Test for overall effect: Z = 4.16 (P < 0.0001)
Events
035
222
125
714122843
519
0
213
167
1578
1511
210
91
09041
148
100440
2217
93
397
Total
30103
502516251539392850183020
488
202078141016201052
240
1020101017632015153910157822
344
1072
Events
2361023
5251120121443102310
244
237
226
1010101020
118
1012
610
4231615
314
76
2522
173
535
Total
15101
502516251532411450283010
452
232077141015101048
227
1020101021672015153910
68222
347
1026
Weight
0.3%4.1%1.0%4.9%0.6%5.2%2.9%3.5%2.7%5.1%5.0%2.0%4.2%0.3%
41.7%
4.7%2.1%3.1%2.3%4.2%4.0%3.9%1.5%2.8%
28.7%
0.3%3.0%0.3%2.5%0.5%3.1%3.1%4.1%0.3%1.7%2.1%0.3%3.5%4.7%
29.7%
100.0%
M-H, Random, 95% CI
0.10 [0.01, 2.02]0.95 [0.65, 1.39]0.20 [0.05, 0.87]0.96 [0.79, 1.15]0.20 [0.03, 1.53]1.00 [0.93, 1.08]0.64 [0.34, 1.18]0.57 [0.35, 0.94]1.05 [0.54, 2.05]1.00 [0.90, 1.11]1.00 [0.85, 1.17]0.78 [0.32, 1.90]0.83 [0.59, 1.16]0.02 [0.00, 0.39]0.84 [0.70, 1.02]
0.80 [0.64, 1.01]1.00 [0.43, 2.33]0.67 [0.38, 1.20]1.17 [0.52, 2.60]0.81 [0.57, 1.14]1.41 [0.96, 2.06]0.57 [0.38, 0.86]0.24 [0.08, 0.71]0.46 [0.24, 0.88]0.76 [0.58, 1.00]
0.05 [0.00, 0.72]0.75 [0.41, 1.37]0.08 [0.00, 1.21]0.43 [0.21, 0.88]0.31 [0.04, 2.51]0.65 [0.37, 1.14]0.50 [0.28, 0.89]0.68 [0.47, 0.98]0.14 [0.01, 2.55]0.29 [0.10, 0.79]0.57 [0.24, 1.35]0.03 [0.00, 0.52]0.93 [0.57, 1.50]0.78 [0.61, 0.99]0.57 [0.43, 0.76]
0.71 [0.61, 0.84]
ANH Control Risk Ratio Risk RatioM-H, Random, 95% CI
0.01 0.1 1 10 100Favours experimental Favours control
Technical report on perioperative patient blood management – Volume 1b July 2011 17
Figure 1.2 Meta-analysis of volume of transfusion (ANH vs no ANH)
Study or Subgroup1.4.2 Cardiac surgeryMoyes 1985Triulzi 1995Wang 1995Herregods 1997Kahraman 1997Kaplan 1977Kochamba 1996Dietrich 1989Welch 1993Van der Linden 1994Subtotal (95% CI)Heterogeneity: Tau² = 0.34; Chi² = 45.85, df = 8 (P < 0.00001); I² = 83%Test for overall effect: Z = 4.08 (P < 0.0001)
1.4.3 Orthopaedic surgerySaricaoglu 2005Karakaya 1999Oisfanger 1997Subtotal (95% CI)Heterogeneity: Tau² = 0.42; Chi² = 16.75, df = 2 (P = 0.0002); I² = 88%Test for overall effect: Z = 1.51 (P = 0.13)
1.4.4 MiscellaneousKhanna 1998Jarnagin 2008Lim 2003Subtotal (95% CI)Heterogeneity: Tau² = 0.75; Chi² = 4.03, df = 2 (P = 0.13); I² = 50%Test for overall effect: Z = 1.55 (P = 0.12)
Total (95% CI)Heterogeneity: Tau² = 0.23; Chi² = 66.83, df = 14 (P < 0.00001); I² = 79%Test for overall effect: Z = 5.36 (P < 0.00001)
Mean
2.82.36
00.132.25.21.61.41.8
0.37
1.51.31.1
0.975.62.2
SD
1.087.26
00.520.3
42.991.8
0.440.6
0.70.8
0.29
213.52.3
Total
10421039286050502010
319
10102040
306315
108
467
Mean
2.22.32
30.443.16.3
2.843.1
3.562.4
1.32.32.1
1.36.94.3
SD
0.913.65
00.840.22.4
3.112.11.3
0.86
0.50.80.3
1.722.11.5
Total
10281032142050251910
218
10101030
206715
102
350
Weight
6.5%1.4%
10.9%11.9%3.6%4.6%5.9%8.5%8.3%
61.7%
9.2%7.8%
11.6%28.7%
5.5%0.3%3.8%9.6%
100.0%
IV, Random, 95% CI
0.60 [-0.28, 1.48]0.04 [-2.54, 2.62]
Not estimable-0.31 [-0.64, 0.02]
-0.90 [-1.05, -0.75]-1.10 [-2.56, 0.36]
-1.24 [-2.44, -0.04]-1.70 [-2.66, -0.74]-1.76 [-2.38, -1.14]-2.03 [-2.68, -1.38]-1.00 [-1.48, -0.52]
0.20 [-0.33, 0.73]-1.00 [-1.70, -0.30]-1.00 [-1.23, -0.77]-0.61 [-1.39, 0.18]
-0.33 [-1.36, 0.70]-1.30 [-7.55, 4.95]
-2.10 [-3.49, -0.71]-1.14 [-2.57, 0.30]
-0.90 [-1.22, -0.57]
ANH Control Mean Difference Mean DifferenceIV, Random, 95% CI
-4 -2 0 2 4Favours experimental Favours control
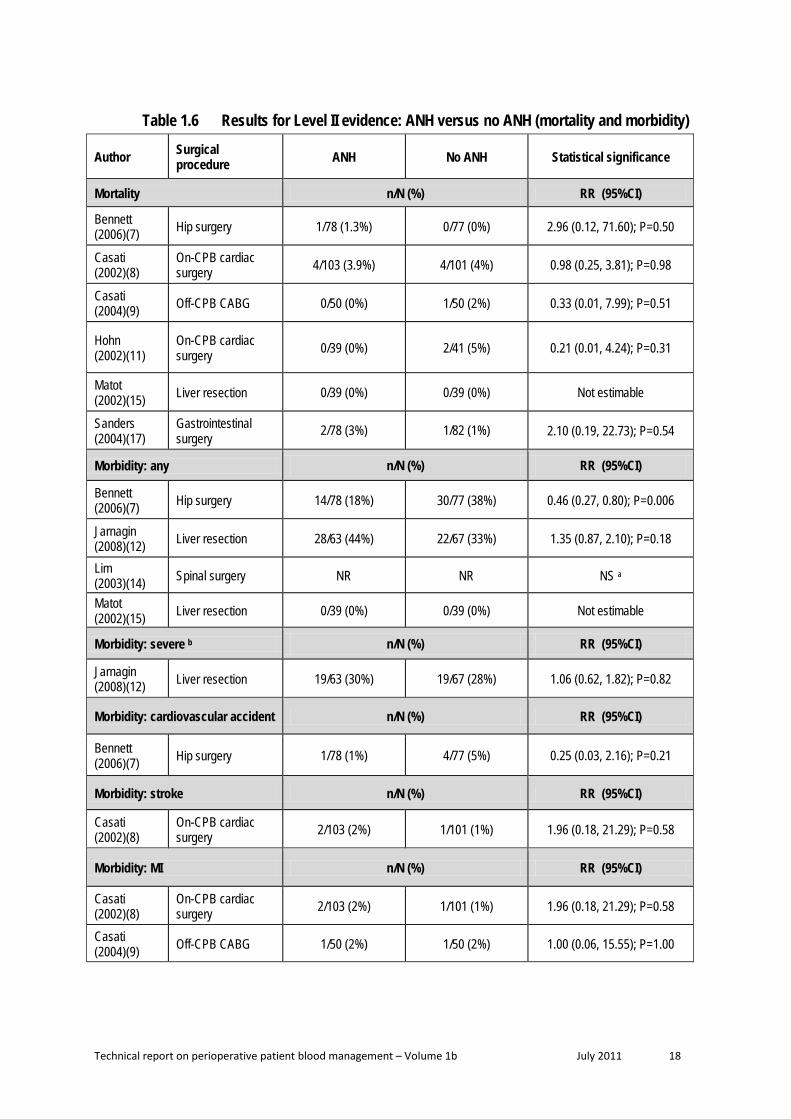
Mortality None of the six trials that reported mortality as an outcome found a significant difference between ANH and control (Table 1.6). This was consistent with the results from Carless 2004(5). However, all studies were underpowered to show a difference between groups in mortality.
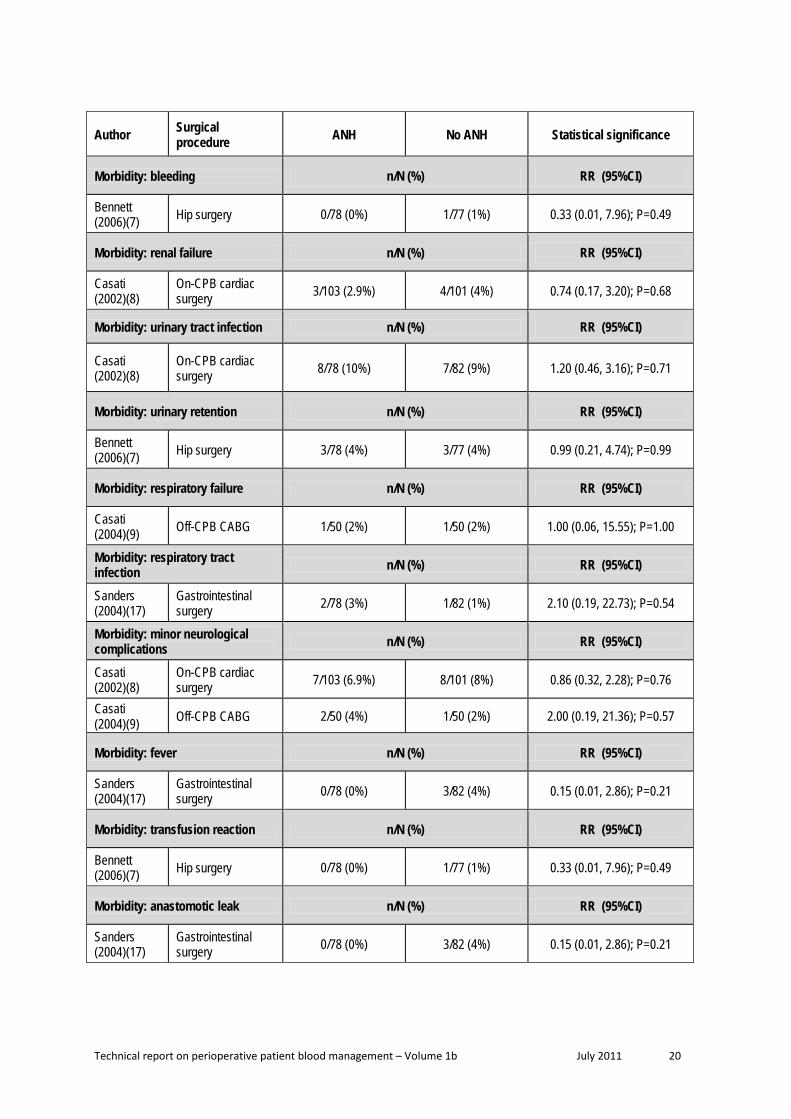
Morbidity With the exception of Bennett (2006)(7), none of the studies found a significant association between ANH and any of the reported morbidity outcomes (Table 1.6). Bennett (2006) found that in adults undergoing hip surgery, ANH resulted in a lower rate of infection compared with control (9% vs 22%; RR 0.41; 95%CI: 0.18, 0.92; P=0.03)(7). This was not consistent with the Carless (2004)(5) review, which found no significant difference. The Carless (2004) review reported insufficient detail to conduct an updated meta-analysis. Bennett (2006)(7) also found that ANH was associated with an overall lower rate of morbidity (18% vs 38%; RR 0.46; 95%CI: 0.27, 0.80; P=0.006).
Technical report on perioperative patient blood management – Volume 1b July 2011 18
Table 1.6 Results for Level II evidence: ANH versus no ANH (mortality and morbidity)
Author Surgical procedure ANH No ANH Statistical significance
Mortality n/N (%) RR (95%CI)
Bennett (2006)(7) Hip surgery 1/78 (1.3%) 0/77 (0%) 2.96 (0.12, 71.60); P=0.50
Casati (2002)(8)
On-CPB cardiac surgery 4/103 (3.9%) 4/101 (4%) 0.98 (0.25, 3.81); P=0.98
Casati (2004)(9) Off-CPB CABG 0/50 (0%) 1/50 (2%) 0.33 (0.01, 7.99); P=0.51
Hohn (2002)(11)
On-CPB cardiac surgery 0/39 (0%) 2/41 (5%) 0.21 (0.01, 4.24); P=0.31
Matot (2002)(15) Liver resection 0/39 (0%) 0/39 (0%) Not estimable
Sanders (2004)(17)
Gastrointestinal surgery 2/78 (3%) 1/82 (1%) 2.10 (0.19, 22.73); P=0.54
Morbidity: any n/N (%) RR (95%CI)
Bennett (2006)(7) Hip surgery 14/78 (18%) 30/77 (38%) 0.46 (0.27, 0.80); P=0.006
Jarnagin (2008)(12) Liver resection 28/63 (44%) 22/67 (33%) 1.35 (0.87, 2.10); P=0.18
Lim (2003)(14) Spinal surgery NR NR NS a
Matot (2002)(15) Liver resection 0/39 (0%) 0/39 (0%) Not estimable
Morbidity: severe b n/N (%) RR (95%CI)
Jarnagin (2008)(12) Liver resection 19/63 (30%) 19/67 (28%) 1.06 (0.62, 1.82); P=0.82
Morbidity: cardiovascular accident n/N (%) RR (95%CI)
Bennett (2006)(7) Hip surgery 1/78 (1%) 4/77 (5%) 0.25 (0.03, 2.16); P=0.21
Morbidity: stroke n/N (%) RR (95%CI)
Casati (2002)(8)
On-CPB cardiac surgery 2/103 (2%) 1/101 (1%) 1.96 (0.18, 21.29); P=0.58
Morbidity: MI n/N (%) RR (95%CI)
Casati (2002)(8)
On-CPB cardiac surgery 2/103 (2%) 1/101 (1%) 1.96 (0.18, 21.29); P=0.58
Casati (2004)(9) Off-CPB CABG 1/50 (2%) 1/50 (2%) 1.00 (0.06, 15.55); P=1.00

Technical report on perioperative patient blood management – Volume 1b July 2011 19
Author Surgical procedure ANH No ANH Statistical significance
Morbidity: thromboembolism n/N (%) RR (95%CI)
Bennett (2006)(7) Hip surgery 2/78 (3%) 1/77 (1%) 1.97 (0.18, 21.33); P=0.58
Morbidity: atrial fibrillation n/N (%) RR (95%CI)
Casati (2004)(9) Off-CPB CABG 5/50 (10%) 6/50 (12%) 0.83 (0.27, 2.55); P=0.75
Morbidity: major ventricular arrhythmia n/N (%) RR (95%CI)
Casati (2004)(9) Off-CPB CABG 1/50 (2%) 1/50 (2%) 1.00 (0.06, 15.55); P=1.00
Morbidity: pulmonary embolism n/N (%) RR (95%CI)
Casati (2002)(8)
On-CPB cardiac surgery 0/103 (0%) 1/101 (1%) 0.33 (0.01, 7.93); P=0.49
Sanders (2004)(17)
Gastrointestinal surgery 0/78 (0%) 2/82 (2%) 0.21 (0.01, 4.31); P=0.31
Morbidity: deep vein thrombosis n/N (%) RR (95%CI)
Sanders (2004)(17)
Gastrointestinal surgery 2/78 (3%) 2/82 (2%) 1.05 (0.15, 7.28); P=0.96
Morbidity: infection n/N (%) RR (95%CI)
Bennett (2006)(7) Hip surgery 7/78 (9%) 17/77 (22%) 0.41 (0.18, 0.92); P=0.03
Morbidity: wound infection n/N (%) RR (95%CI)
Sanders (2004)(17)
Gastrointestinal surgery 3/78 (4%) 6/82 (7%) 0.53 (0.14, 2.03); P=0.35
Bennett (2006)(7) Hip surgery 5/78 (6%) 15/77 (19%) 0.33 (0.13, 0.86); P=0.03
Morbidity: deep infection n/N (%) RR (95%CI)
Sanders (2004)(17)
Gastrointestinal surgery 1/78 (1%) 0/78 (0%) 3.00 (0.12, 72.53); P=0.50
Morbidity: septicaemia n/N (%) RR (95%CI)
Sanders (2004)(17)
Gastrointestinal surgery 1/78 (1%) 1/82 (1%) 1.05 (0.07, 16.52); P=0.97
Morbidity: wound (non-infective) n/N (%) RR (95%CI)
Bennett (2006)(7) Hip surgery 2/78 (3%) 0/77 (0%) 4.94 (0.24, 101.18); P=0.30
Technical report on perioperative patient blood management – Volume 1b July 2011 20
Author Surgical procedure ANH No ANH Statistical significance
Morbidity: bleeding n/N (%) RR (95%CI)
Bennett (2006)(7) Hip surgery 0/78 (0%) 1/77 (1%) 0.33 (0.01, 7.96); P=0.49
Morbidity: renal failure n/N (%) RR (95%CI)
Casati (2002)(8)
On-CPB cardiac surgery 3/103 (2.9%) 4/101 (4%) 0.74 (0.17, 3.20); P=0.68
Morbidity: urinary tract infection n/N (%) RR (95%CI)
Casati (2002)(8)
On-CPB cardiac surgery 8/78 (10%) 7/82 (9%) 1.20 (0.46, 3.16); P=0.71
Morbidity: urinary retention n/N (%) RR (95%CI)
Bennett (2006)(7) Hip surgery 3/78 (4%) 3/77 (4%) 0.99 (0.21, 4.74); P=0.99
Morbidity: respiratory failure n/N (%) RR (95%CI)
Casati (2004)(9) Off-CPB CABG 1/50 (2%) 1/50 (2%) 1.00 (0.06, 15.55); P=1.00
Morbidity: respiratory tract infection n/N (%) RR (95%CI)
Sanders (2004)(17)
Gastrointestinal surgery 2/78 (3%) 1/82 (1%) 2.10 (0.19, 22.73); P=0.54
Morbidity: minor neurological complications n/N (%) RR (95%CI)
Casati (2002)(8)
On-CPB cardiac surgery 7/103 (6.9%) 8/101 (8%) 0.86 (0.32, 2.28); P=0.76
Casati (2004)(9) Off-CPB CABG 2/50 (4%) 1/50 (2%) 2.00 (0.19, 21.36); P=0.57
Morbidity: fever n/N (%) RR (95%CI)
Sanders (2004)(17)
Gastrointestinal surgery 0/78 (0%) 3/82 (4%) 0.15 (0.01, 2.86); P=0.21
Morbidity: transfusion reaction n/N (%) RR (95%CI)
Bennett (2006)(7) Hip surgery 0/78 (0%) 1/77 (1%) 0.33 (0.01, 7.96); P=0.49
Morbidity: anastomotic leak n/N (%) RR (95%CI)
Sanders (2004)(17)
Gastrointestinal surgery 0/78 (0%) 3/82 (4%) 0.15 (0.01, 2.86); P=0.21

Technical report on perioperative patient blood management – Volume 1b July 2011 21
Author Surgical procedure ANH No ANH Statistical significance
Morbidity: creatinine 2x baseline n/N (%) RR (95%CI)
Casati (2004)(9) Off-CPB CABG 1/50 (2%) 2/50 (4%) 0.50 (0.05, 5.34); P=0.57
ANH, acute normovolemic haemodilution; CABG, coronary artery bypass graft; CI, confidence interval; CPB, cardiopulmonary bypass; MI, myocardial infarction; NR, not reported; RR, relative risk a All patients were evaluated 1 week after the operation and there were no postoperative complications (thromboembolism, neurologic sequelae or wound infection) in either group. b Reported as Grade 3 to Grade 5 events, where Grade 3 was defined as complications requiring hospital admission, transfer to the intensive care unit, surgical or radiologic interventions, Grade 4 was defined as complications resulting in chronic disability, organ resection or enteral division, and Grade 5 as complications resulting in death.
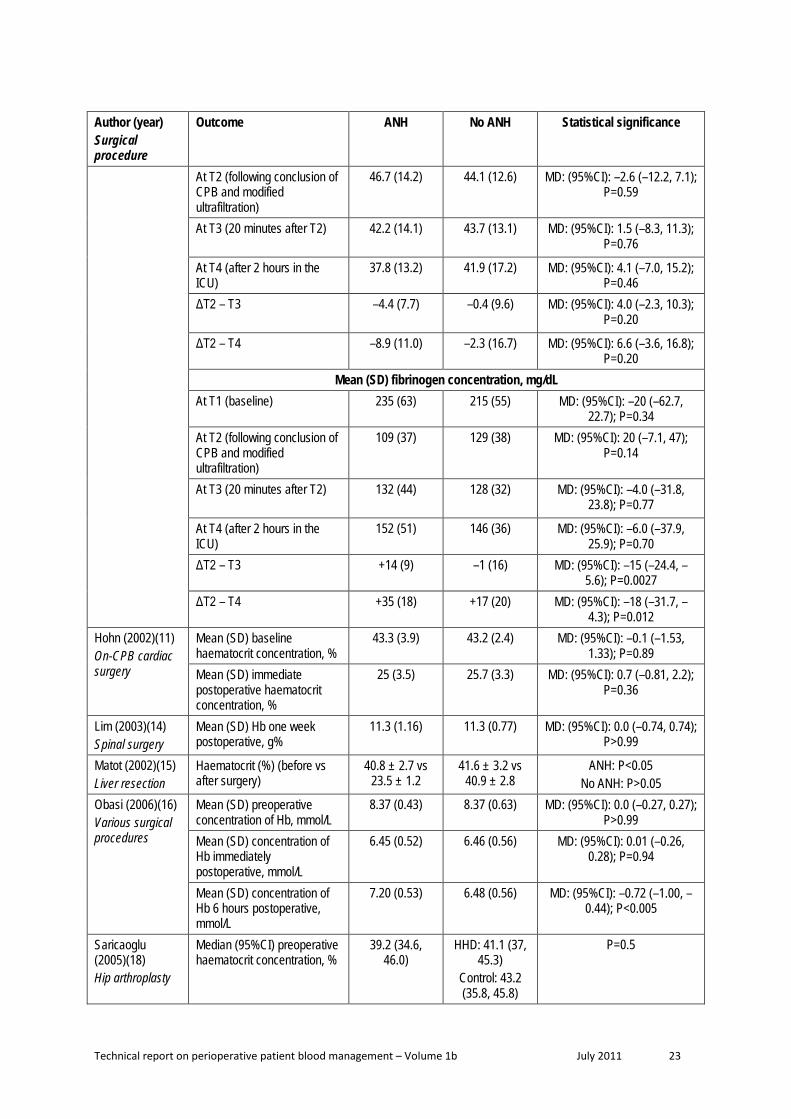
Haemoglobin concentration and coagulation parameters Eight studies reported haemoglobin/haematocrit concentration as a clinical outcome. The results from these studies are reported in Table 1.7. With the exception of Wolowczyk (2003)(19) and Obasi (2006)(16), all of the studies are consistent in finding no significant association between ANH and haemoglobin concentration. Wolowczyk (2003)(19) found that ANH was significantly associated with a lower median haemoglobin concentration at aortic clamping (ANH vs control; median [range], g/dL: 9.2 [6.8 to 10.6] vs 11.3 [7.2 to 14.5]; P=0.001) and clamp release (7.7 [6.6 to 9.3] vs 9.1 [5.1 to 11.9]; P=0.004) but a significantly higher median haemoglobin concentration at seven days postoperative (11.5 [10.2 to 12.4] vs 10.7 [9.1 to 11.9]). In Obasi (2006)(16), there was a significantly higher haemoglobin concentration in the ANH group compared with the no ANH group at 6 hours post-surgery but not immediately post-surgery.
Table 1.7 Results for Level II evidence: ANH versus no ANH (haemoglobin concentration and coagulation parameters)
Author (year) Surgical procedure
Outcome ANH No ANH Statistical significance
Akhlagh (2007)(6) on-CPB CABG
Mean (SD) 24 hour post-operational haematocrit concentration, %
36.5 (1.5) 37 (2) MD: (95%CI): 0.5 (–0.41, 1.4); P=0.27
Friesen (2006)(10) Infants undergoing on-CPB cardiac surgery
Mean (SD) haematocrit, % At T1 (baseline) 32 (3) 32 (4) MD: (95%CI): 0.0 (–2.6, 2.5);
P>0.99 At T2 (following conclusion of CPB and modified ultrafiltration)
32 (8) 34 (6) MD: (95%CI): 2.0 (–3.1, 7.1); P=0.43
At T3 (20 minutes after T2) 33 (7) 34 (6) MD: (95%CI): 1.0 (–3.7, 5.7); P=0.67
At T4 (after 2 hours in the ICU)
35 (8) 34 (5) MD: (95%CI): f.0 (–5.8, 3.8); P=0.67
ΔT2 – T3 +1 (2) +1 (1) MD: (95%CI): 0.0 (–1.1, 1.1); P>0.99
ΔT2 – T4 +3 (4) 0 (3) MD: (95% C): –3.0 (–5.6, –0.45); P=0.02

Technical report on perioperative patient blood management – Volume 1b July 2011 22
Author (year) Surgical procedure
Outcome ANH No ANH Statistical significance
Mean (SD) platelet count, x109/L At T1 (baseline) 353 (92) 335 (92) MD: (95%CI): –18 (–84, 48);
P=0.58 At T2 (following conclusion of CPB and modified ultrafiltration)
126 (49) 140 (47) MD: (95%CI): 14 (–20.7, 48.7); P=0.42
At T3 (20 minutes after T2) 161 (55) 158 (57)
MD: (95%CI): –3 (–43.4, 37.4); P=0.88
At T4 (after 2 hours in the ICU)
207 (53) 217 (59)
MD: (95%CI): 10 (–30.5, 50.5); P=0.62
ΔT2 – T3 +36 (22) +18 (17) MD: (95%CI): –18 (–32.2, –3.8); P=0.015
ΔT2 – T4 +82 (43) +70 (42) MD: (95%CI): –12 (–42.7, 18.7); P=0.43
Mean (SD) platelet aggregation, seconds At T1 (baseline) 205 (62) 189 (54) MD: (95%CI): –16 (–58.0,
26.0); P=0.44 At T2 (following conclusion of CPB and modified ultrafiltration)
222 (71) 210 (70) MD: (95%CI): –12 (–62.9, 38.9); P=0.63
At T3 (20 minutes after T2) 144 (58)
159 (72) MD: (95%CI): 15 (–32.2, 62.2); P=0.52
At T4 (after 2 hours in the ICU)
112 (23) 113 (32) MD: (95%CI): 1 (–19.1, 21.1); P=0.92
ΔT2 – T3 –78 (53) –49 (77) MD: (95%CI): 29 (–18.7, 76.7); P=0.22
ΔT2 – T4 –109 (67) –97 (64) MD: (95%CI): 12 (–35.3, 59.3); P=0.61
Mean (SD) prothrombin time, seconds At T1 (baseline) 13.4 (0.9) 14.1 (1.1) MD: (95%CI): 0.7 (–0.03, 1.4);
P=0.058 At T2 (following conclusion of CPB and modified ultrafiltration)
20.4 (4.3) 19.9 (3.8) MD: (95%CI): –0.5 (–3.4, 2.4); P=0.73
At T3 (20 minutes after T2) 18.1 (3.1) 18.9 (3.6)
MD: (95%CI): 0.8 (–1.6, 3.2); P=0.51
At T4 (after 2 hours in the ICU)
15.9 (2.1) 16.8 (2.0) MD: (95%CI): 0.9 (–0.58, 2.38); P=0.22
ΔT2 – T3 –2.3 (1.9) –0.9 (1.2) MD: (95%CI): 1.4 (0.25, 2.55); P=0.019
ΔT2 – T4 –4.5 (3.2) –3.0 (2.7) MD: (95%CI): 1.5 (–0.64, 3.64); P=0.16
Mean (SD) activated partial thromboplastin time, seconds At T1 (baseline) 35.9 (9.3) 36.9 (8.7) MD: (95%CI): 1 (–5.5, 7.5);
P=0.76
Technical report on perioperative patient blood management – Volume 1b July 2011 23
Author (year) Surgical procedure
Outcome ANH No ANH Statistical significance
At T2 (following conclusion of CPB and modified ultrafiltration)
46.7 (14.2) 44.1 (12.6) MD: (95%CI): –2.6 (–12.2, 7.1); P=0.59
At T3 (20 minutes after T2) 42.2 (14.1)
43.7 (13.1) MD: (95%CI): 1.5 (–8.3, 11.3); P=0.76
At T4 (after 2 hours in the ICU)
37.8 (13.2) 41.9 (17.2) MD: (95%CI): 4.1 (–7.0, 15.2); P=0.46
ΔT2 – T3 –4.4 (7.7)
–0.4 (9.6) MD: (95%CI): 4.0 (–2.3, 10.3); P=0.20
ΔT2 – T4 –8.9 (11.0) –2.3 (16.7) MD: (95%CI): 6.6 (–3.6, 16.8); P=0.20
Mean (SD) fibrinogen concentration, mg/dL At T1 (baseline) 235 (63) 215 (55) MD: (95%CI): –20 (–62.7,
22.7); P=0.34 At T2 (following conclusion of CPB and modified ultrafiltration)
109 (37) 129 (38) MD: (95%CI): 20 (–7.1, 47); P=0.14
At T3 (20 minutes after T2) 132 (44)
128 (32) MD: (95%CI): –4.0 (–31.8, 23.8); P=0.77
At T4 (after 2 hours in the ICU)
152 (51) 146 (36) MD: (95%CI): –6.0 (–37.9, 25.9); P=0.70
ΔT2 – T3 +14 (9) –1 (16) MD: (95%CI): –15 (–24.4, –5.6); P=0.0027
ΔT2 – T4 +35 (18) +17 (20) MD: (95%CI): –18 (–31.7, –4.3); P=0.012
Hohn (2002)(11) On-CPB cardiac surgery
Mean (SD) baseline haematocrit concentration, %
43.3 (3.9) 43.2 (2.4) MD: (95%CI): –0.1 (–1.53, 1.33); P=0.89
Mean (SD) immediate postoperative haematocrit concentration, %
25 (3.5) 25.7 (3.3) MD: (95%CI): 0.7 (–0.81, 2.2); P=0.36
Lim (2003)(14) Spinal surgery
Mean (SD) Hb one week postoperative, g%
11.3 (1.16)
11.3 (0.77)
MD: (95%CI): 0.0 (–0.74, 0.74); P>0.99
Matot (2002)(15) Liver resection
Haematocrit (%) (before vs after surgery)
40.8 ± 2.7 vs 23.5 ± 1.2
41.6 ± 3.2 vs 40.9 ± 2.8
ANH: P<0.05 No ANH: P>0.05
Obasi (2006)(16) Various surgical procedures
Mean (SD) preoperative concentration of Hb, mmol/L
8.37 (0.43) 8.37 (0.63) MD: (95%CI): 0.0 (–0.27, 0.27); P>0.99
Mean (SD) concentration of Hb immediately postoperative, mmol/L
6.45 (0.52) 6.46 (0.56) MD: (95%CI): 0.01 (–0.26, 0.28); P=0.94
Mean (SD) concentration of Hb 6 hours postoperative, mmol/L
7.20 (0.53) 6.48 (0.56) MD: (95%CI): –0.72 (–1.00, –0.44); P<0.005
Saricaoglu (2005)(18) Hip arthroplasty
Median (95%CI) preoperative haematocrit concentration, %
39.2 (34.6, 46.0)
HHD: 41.1 (37, 45.3)
Control: 43.2 (35.8, 45.8)
P=0.5

Technical report on perioperative patient blood management – Volume 1b July 2011 24
Author (year) Surgical procedure
Outcome ANH No ANH Statistical significance
Median (95%CI) postoperative haematocrit concentration, %
32.7 (26.5, 38.6)
HHD: 29.1 (26.5, 38.6)
Control: 32.3 (26.5, 38.6)
P=0.398
Median (95%CI) 24 hour postoperative haematocrit concentration, %
32.7 (30.1, 40.1)
HHD: 34.9 (30.2, 36.7)
Control: 32.9 (30, 36.5)
P=0.89
Mean (95%CI) preoperative platelet count, 1000/mm3
280 (132, 367) HHD: 286 (240, 387)
Control: 285 (240, 387)
P=0.98
Mean (95%CI) postoperative platelet count, 1000/mm3
258 (123, 354) HHD: 204 (167, 300)
Control: 241 (175, 310)
P=0.96
Mean (95%CI) 24 hour postoperative platelet count, 1000/mm3
283 (138, 356) HHD: 195 (163, 300)
Control: 283 (190, 356)
P=0.010
Mean (95%CI) preoperative INR
1.1 (0.92, 1.3) HHD: 1.15 (0.95, 1.4)
Control: 1.15 (0.92, 1.14)
P=0.6
Mean (95%CI) postoperative INR
1.2 (1.1, 2.3) HHD: 1.4 (1.2, 1.5)
Control: 1.35 (1.2, 1.5)
P=0.052
Mean (95%CI) 24 hour postoperative INR
1.2 (1.1, 1.87) HHD: 1.2 (1.1, 1.3)
Control: 1.2 (1.1, 1.3)
P=0.68
Mean (95%CI) preoperative aPTT, seconds
27.6 (26.4, 35.9)
HHD: 28.5 (26.8, 32.1)
Control: 27.6 (26.4, 32.1)
P=0.4
Mean (95%CI) postoperative aPTT, seconds
26.75 (23.8, 32.3)
HHD: 33.8 (30.1, 35.6)
Control: 27.5 (24.7, 34.2)
P=0.01 P(ANH vs HDD)<0.008
Mean (95%CI) 24 hour postoperative aPTT, seconds
26.5 (24.7, 30.1)
HHD: 30.1 (24.7, 34.2)
Control: 24.2 (24.2, 34.7)
P=0.182
Wolowczyk (2003)(19) Abdominal aortic aneurysm repair
Hb concentration, g/dL Preoperative 14.2 (12.1 to
16.5) 13.8 (12.1 to
15.6) P=0.57
Post-ANH 9.4 (7.0 to 12.1) NA NA
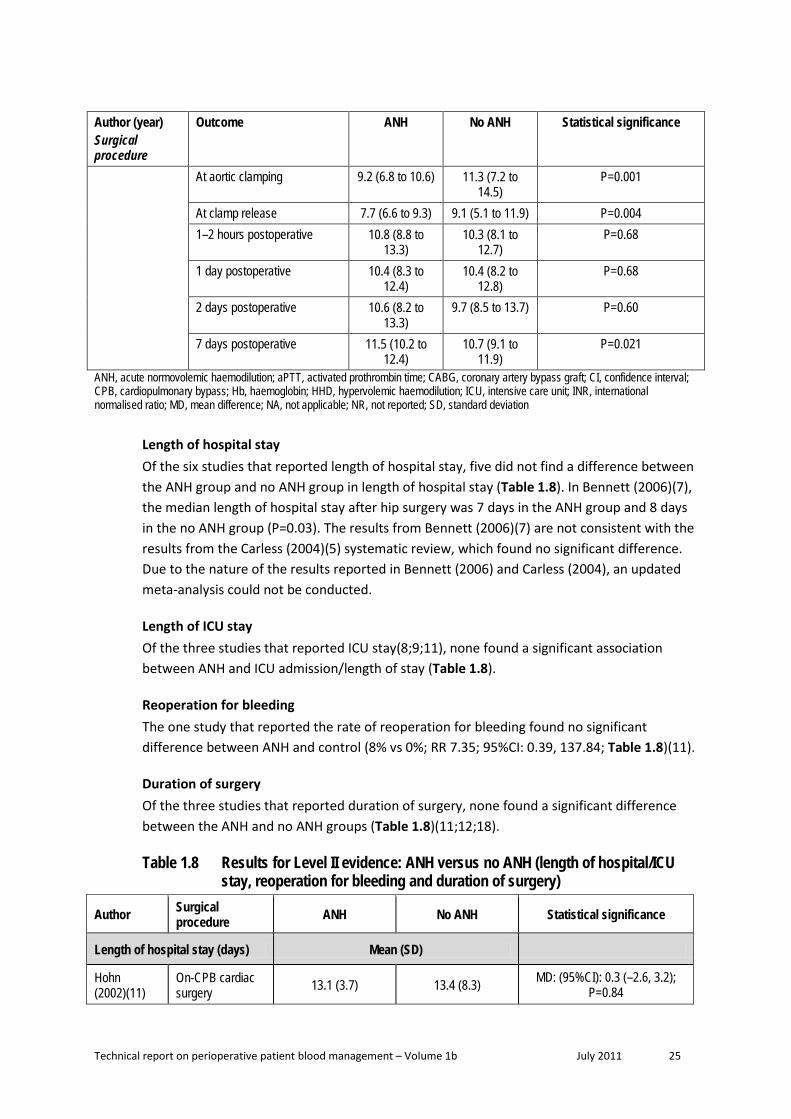
Technical report on perioperative patient blood management – Volume 1b July 2011 25
Author (year) Surgical procedure
Outcome ANH No ANH Statistical significance
At aortic clamping 9.2 (6.8 to 10.6) 11.3 (7.2 to 14.5)
P=0.001
At clamp release 7.7 (6.6 to 9.3) 9.1 (5.1 to 11.9) P=0.004 1–2 hours postoperative 10.8 (8.8 to
13.3) 10.3 (8.1 to
12.7) P=0.68
1 day postoperative 10.4 (8.3 to 12.4)
10.4 (8.2 to 12.8)
P=0.68
2 days postoperative 10.6 (8.2 to 13.3)
9.7 (8.5 to 13.7) P=0.60
7 days postoperative 11.5 (10.2 to 12.4)
10.7 (9.1 to 11.9)
P=0.021
ANH, acute normovolemic haemodilution; aPTT, activated prothrombin time; CABG, coronary artery bypass graft; CI, confidence interval; CPB, cardiopulmonary bypass; Hb, haemoglobin; HHD, hypervolemic haemodilution; ICU, intensive care unit; INR, international normalised ratio; MD, mean difference; NA, not applicable; NR, not reported; SD, standard deviation
Length of hospital stay Of the six studies that reported length of hospital stay, five did not find a difference between the ANH group and no ANH group in length of hospital stay (Table 1.8). In Bennett (2006)(7), the median length of hospital stay after hip surgery was 7 days in the ANH group and 8 days in the no ANH group (P=0.03). The results from Bennett (2006)(7) are not consistent with the results from the Carless (2004)(5) systematic review, which found no significant difference. Due to the nature of the results reported in Bennett (2006) and Carless (2004), an updated meta-analysis could not be conducted.
Length of ICU stay Of the three studies that reported ICU stay(8;9;11), none found a significant association between ANH and ICU admission/length of stay (Table 1.8).
Reoperation for bleeding The one study that reported the rate of reoperation for bleeding found no significant difference between ANH and control (8% vs 0%; RR 7.35; 95%CI: 0.39, 137.84; Table 1.8)(11).
Duration of surgery Of the three studies that reported duration of surgery, none found a significant difference between the ANH and no ANH groups (Table 1.8)(11;12;18).
Table 1.8 Results for Level II evidence: ANH versus no ANH (length of hospital/ICU stay, reoperation for bleeding and duration of surgery)
Author Surgical procedure ANH No ANH Statistical significance
Length of hospital stay (days) Mean (SD)
Hohn (2002)(11)
On-CPB cardiac surgery 13.1 (3.7) 13.4 (8.3) MD: (95%CI): 0.3 (–2.6, 3.2);
P=0.84

Technical report on perioperative patient blood management – Volume 1b July 2011 26
Author Surgical procedure ANH No ANH Statistical significance
Length of hospital stay (days) Median (IQR)
Bennett (2006)(7) Hip surgery 7 (6, 9) 8 (6, 11) P=0.03
Casati (2002)(8)
On-CPB cardiac surgery 7 (6, 9) 7 (6, 8.25) P=0.54
Casati (2004)(9) Off-CPB CABG 6 (6, 7) 6 (6, 7) NR
Length of hospital stay (days) Median (range)
Jarnagin (2008)(12) Liver resection 7 (5 to 50) 7 (4 to 26) P=0.33
Sanders (2004)(17)
Gastrointestinal surgery 8 (5 to 110) 10 (5 to 92) P>0.05
Patients who needed to seek medical attention after discharge n/N (%)
Bennett (2006)(7) Hip surgery 29/78 (37%) 43/77 (56%) RR (95%CI: 0.67 (0.47, 0.94);
P=0.02
Length of ICU stay (days) Mean (SD)
Hohn (2002)(11)
On-CPB cardiac surgery 3.1 (1.3) 3.0 (1.3) MD: (95%CI): –0.1 (–0.68, 0.48);
P=0.73
Length of ICU stay (days) Median (IQR)
Casati (2002)(8)
On-CPB cardiac surgery 1 (1, 1) 1 (1, 2) P=0.49
Casati (2004)(9) Off-CPB CABG 1 (1, 1) 1 (1, 1) P=1.0
Reoperation for bleeding n/N (%)
Hohn (2002)(11)
On-CPB cardiac surgery 3/39 (8) 0/41 (0) RR (95%CI: 7.35 (0.39, 137.84);
P=0.18
Duration of surgery (minutes) Mean (SD)
Hohn (2002)(11)
On-CPB cardiac surgery 245 (65) 271 (80) MD: (95%CI): 26 (–6.5, 58.5);
P=0.12
Duration of surgery (minutes) Median (range)
Jarnagin (2008)(12) Liver resection 255 (135 to 546) 288 (140 to 535) P=0.35
Duration of surgery (minutes) Median (IQR)
Saricaoglu (2005)(18) Hip arthroplasty 105 (95, 125) HHD: 102.5 (95, 125)
Control: 105 (95, 125) P=0.795
Intubation time (minutes) Mean (IQR)

Technical report on perioperative patient blood management – Volume 1b July 2011 27
Author Surgical procedure ANH No ANH Statistical significance
Casati (2004)(9) Off-CPB CABG 252 (151, 186) 244 (165, 182) NR
ANH, acute normovolemic haemodilution; CABG, coronary artery bypass graft ; CI, confidence interval; CPB, cardiopulmonary bypass; HHD, hypervolemic haemodilution; ICU, intensive care unit; IQR, interquartile range; MD, mean difference; NR, not reported; RR, relative risk; SD, standard deviation.
Level III evidence As no evidence for quality of life was captured in the Level I or II evidence, a specific quality-of-life search for Level III evidence for ANH was conducted. No relevant Level III studies were identified.
Level IV evidence As no evidence for quality of life was captured in the Level I or II evidence, a specific quality-of-life search for Level IV evidence for ANH was conducted. No relevant Level IV studies were identified.

Technical report on perioperative patient blood management – Volume 1b July 2011 28
2 Intraoperat ive cel l salvage
Methods
The systematic review process identified five relevant Level I studies which assessed the effect of intraoperative cell salvage. An additional literature search was conducted to identify Level II studies that were published after the literature search dates of key Level I evidence. Nine relevant RCTs were identified.
No socioeconomic literature pertaining to Australia’s Indigenous population was identified in the literature search for this research question.
Two published economic evaluations on the use of cell salvage for minimising blood loss were identified in the literature search for this research question. A summary of the findings of these reports is presented after the clinical evidence review for this intervention.
Level I evidence There were five systematic reviews examining whether intraoperative cell salvage reduces the incidence of allogeneic blood transfusion and other relevant outcomes in patients undergoing surgery. The main characteristics of these reviews are summarised in Table 2.1.
There is a substantial overlap between many of the systematic reviews. As such, a decision was made to limit the consideration of evidence to the most up-to-date and comprehensive reviews for each population and surgery type. For these reasons, Carless (2006)(20) was chosen to form the basis of the evidence review. Carless (2006) provides a comprehensive analysis of cell salvage in adults undergoing all surgery types. Takagi (2007)(21), the most recent systematic review, did not find any RCTs that were not already captured in Carless (2006)(20).
Table 2.9 Characteristics and quality of Level I evidence for intraoperative cell salvage Author (Year) Study quality
Date of literature search
Population Surgery
No. of included studies assessing intraoperative cell salvage
Relevant outcomes
Takagi (2007)(21) a
Good
Nov 2005 Adult Abdominal aortic aneurysm
4 trials Transfusion incidence
Carless (2006)(20) Good
Jan 2004 Adult Any
10 trials Transfusion incidence Transfusion volume Blood loss Reoperation Hospital length of stay Mortality Morbidity
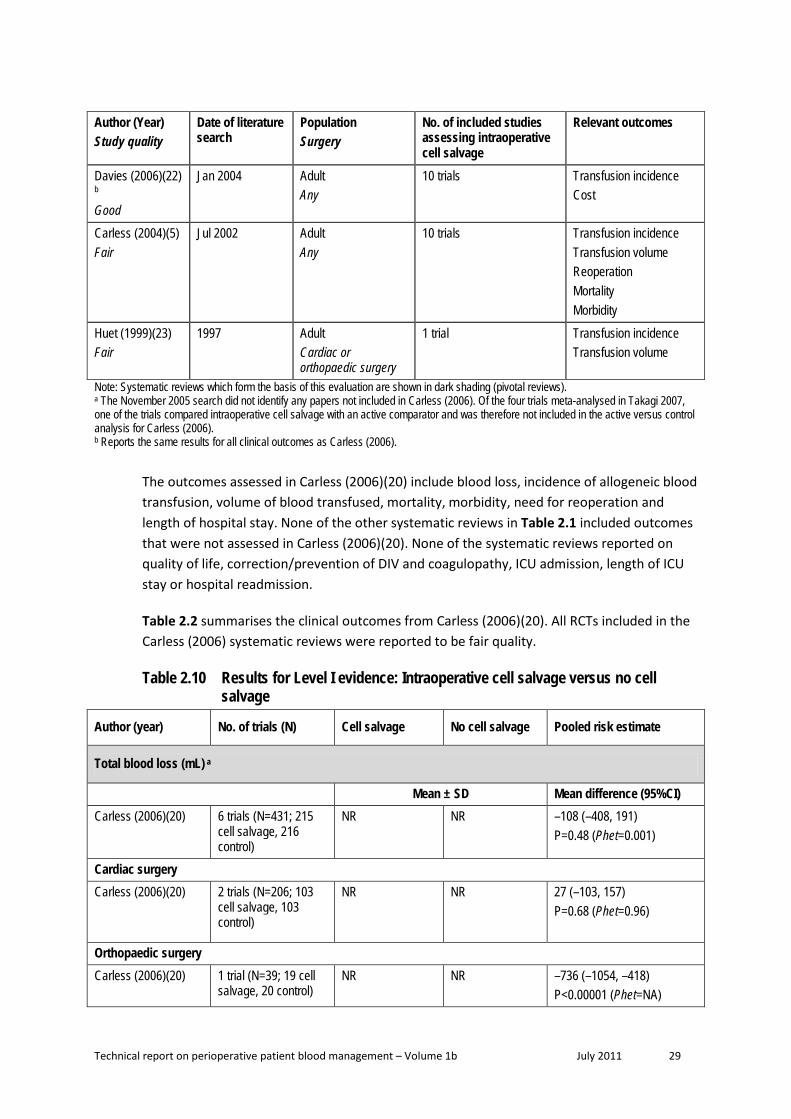
Technical report on perioperative patient blood management – Volume 1b July 2011 29
Author (Year) Study quality
Date of literature search
Population Surgery
No. of included studies assessing intraoperative cell salvage
Relevant outcomes
Davies (2006)(22) b
Good
Jan 2004 Adult Any
10 trials Transfusion incidence Cost
Carless (2004)(5) Fair
Jul 2002 Adult Any
10 trials Transfusion incidence Transfusion volume Reoperation Mortality Morbidity
Huet (1999)(23) Fair
1997 Adult Cardiac or orthopaedic surgery
1 trial Transfusion incidence Transfusion volume
Note: Systematic reviews which form the basis of this evaluation are shown in dark shading (pivotal reviews). a The November 2005 search did not identify any papers not included in Carless (2006). Of the four trials meta-analysed in Takagi 2007, one of the trials compared intraoperative cell salvage with an active comparator and was therefore not included in the active versus control analysis for Carless (2006). b Reports the same results for all clinical outcomes as Carless (2006).
The outcomes assessed in Carless (2006)(20) include blood loss, incidence of allogeneic blood transfusion, volume of blood transfused, mortality, morbidity, need for reoperation and length of hospital stay. None of the other systematic reviews in Table 2.1 included outcomes that were not assessed in Carless (2006)(20). None of the systematic reviews reported on quality of life, correction/prevention of DIV and coagulopathy, ICU admission, length of ICU stay or hospital readmission.
Table 2.2 summarises the clinical outcomes from Carless (2006)(20). All RCTs included in the Carless (2006) systematic reviews were reported to be fair quality.
Table 2.10 Results for Level I evidence: Intraoperative cell salvage versus no cell salvage
Author (year) No. of trials (N) Cell salvage No cell salvage Pooled risk estimate
Total blood loss (mL) a
Mean ± SD Mean difference (95%CI) Carless (2006)(20) 6 trials (N=431; 215
cell salvage, 216 control)
NR NR –108 (–408, 191) P=0.48 (Phet=0.001)
Cardiac surgery Carless (2006)(20) 2 trials (N=206; 103
cell salvage, 103 control)
NR NR 27 (–103, 157) P=0.68 (Phet=0.96)
Orthopaedic surgery Carless (2006)(20) 1 trial (N=39; 19 cell
salvage, 20 control) NR NR –736 (–1054, –418)
P<0.00001 (Phet=NA)

Technical report on perioperative patient blood management – Volume 1b July 2011 30
Author (year) No. of trials (N) Cell salvage No cell salvage Pooled risk estimate
Vascular surgery Carless (2006)(20) 3 trials (N=186; 93
salvage, 93 control) NR NR 35 (–269, 338)
P=0.82 (Phet=0.83)
Incidence of allogeneic blood transfusion
n/N (%) RR (95%CI) Carless (2006)(20) 5 trials (N=382; 191
cell salvage, 191 control)
74/191 (41%) 113/191 (59%) 0.61 (0.39, 0.95) P=0.03 (Phet=0.01)
Cardiac surgery Carless (2006)(20) 2 trials (N=206; 103
cell salvage, 103 control)
31/103 (30%) 56/103 (54%) 0.56 (0.39, 0.79) P=0.0009 (Phet=0.32)
Orthopaedic surgery Carless (2006)(20) 1 trial (N=40; 20 cell
salvage, 20 control) 6/20 (30%) 18/20 (90%) 0.33 (0.17, 0.66)
P=0.002 (Phet=NA) Vascular surgery Carless (2006)(20) 2 trials (N=136; 68 cell
salvage, 68 control) 37/68 (54%) 39/68 (57%) 0.93 (0.72, 1.20)
P=0.58 (Phet=0.58)
Volume of allogeneic blood transfused (mean units) a
Mean ± SD Mean difference (95%CI) Carless (2006)(20) 6 trials (N=432; 216
cell salvage, 216 control)
NR NR –0.69 (–1.47, 0.08) P=0.08 (Phet<0.0001)
Cardiac surgery Carless (2006)(20) 2 trials (N=206; 103
cell salvage, 103 control)
NR NR –0.46 (–0.86, –0.05) P=0.03 (Phet=0.58)
Orthopaedic surgery Carless (2006)(20) 1 trial (N=40; 20 cell
salvage, 20 control) NR NR –2.04 (–2.58, –1.50)
P<0.00001 (Phet=NA) Vascular surgery Carless (2006)(20) 3 trials (N=186; 93 cell
salvage, 93 control) NR NR 0.02 (–0.32, 0.52)
P=0.91 (Phet=0.42)
Mortality a
n/N RR (95%CI) Carless (2006)(20) 3 trials b (N=186; 93
cell salvage, 93 control)
4/93 (4%) 4/93 (4%) 0.90 (0.10, 8.02) P=0.93 (Phet=0.18)

Technical report on perioperative patient blood management – Volume 1b July 2011 31
Author (year) No. of trials (N) Cell salvage No cell salvage Pooled risk estimate
Morbidity: infection a
n/N RR (95%CI) Carless (2006)(20) 2 trials (N=268; 134
cell salvage, 134 control)
16/134 (12%) 17/134 (13%) 0.91 (0.30, 2.78) P=0.86 (Phet=0.09)
Cardiac surgery Carless (2006)(20) 1 trial (N=168; 84 cell
salvage, 84 control) 11/84 (13%) 7/84 (8%) 1.57 (0.64, 3.86)
P=0.32 (Phet=NA) Vascular surgery Carless (2006)(20) 1 trial (N=100; 50 cell
salvage, 50 control) 5/50 (10%) 10/50 (20%) 0.50 (0.18, 1.36)
P=0.17 (Phet=NA)
Morbidity: wound complication a
n/N RR (95%CI) Carless (2006)(20) 1 trial c (N=100; 50 cell
salvage, 50 control) 3/50 (6%) 3/50 (6%) 1.0 (0.21, 4.72)
P=1.00 (Phet=NA)
Morbidity: any thrombosis a
n/N RR (95%CI) Carless (2006)(20) 2 trials (N=139; 69 cell
salvage, 70 control) 3/69 (4%) 2/70 (3%) 1.58 (0.30, 8.43)
P=0.59 (Phet=NA) Orthopaedic surgery Carless (2006)(20) 1 trial (N=39; 19 cell
salvage, 20 control) 3/19 (16%) 2/20 (10%) 1.58 (0.30, 8.43)
P=0.59 (Phet=NA) Vascular surgery Carless (2006)(20) 1 trial (N=100; 50 cell
salvage, 50 control) 0/50 (0%) 0/50 (0%) Not estimable
Morbidity: stroke a
n/N RR (95%CI) Carless (2006)(20) 2 trials (N=268; 134
cell salvage, 134 control)
1/134 (1%) 3/134 (2%) 0.43 (0.06, 2.91) P=0.39 (Phet=0.84)
Orthopaedic surgery Carless (2006)(20) 1 trial (N=168; 84 cell
salvage, 84 control) 1/84 (1%) 2/84 (2%) 0.50 (0.05, 5.41)
P=0.57 (Phet=NA) Vascular surgery Carless (2006)(20) 1 trial (N=100; 50 cell
salvage, 50 control) 0/50 (0%) 1/50 (2%) 0.33 (0.01, 7.99)
P=0.50 (Phet=NA)

Technical report on perioperative patient blood management – Volume 1b July 2011 32
Author (year) No. of trials (N) Cell salvage No cell salvage Pooled risk estimate
Morbidity: non-fatal MI a
n/N RR (95%CI) Carless (2006)(20) 3 trials (N=304; 152
cell salvage, 152 control)
5/152 (3%) 13/152 (9%) 0.44 (0.17, 1.12) P=0.09 (Phet=0.84)
Cardiac surgery Carless (2006)(20) 1 trial (N=168; 84 cell
salvage, 84 control) 5/84 (6%) 10/84 (12%) 0.50 (0.18, 1.40)
P=0.19 (Phet=0.19) Vascular surgery Carless (2006)(20) 2 trials (N=136; 68 cell
salvage, 68 control) 0/68 (0%) 3/68 (4%) 0.26 (0.03, 2.24)
P=0.22; (Phet=0.22)
Morbidity: DVT a
n/N RR (95%CI) Carless (2006)(20) 1 trial d (N=39; 19 cell
salvage, 20 control) 3/19 (16%) 2/20 (10%) 1.58 (0.30, 8.43)
P=0.59 (Phet=NA)
Reoperation for bleeding a
n/N RR (95%CI) Carless (2006)(20) 2 trials (N=218; 109
cell salvage, 109 control)
2/109 (2%) 4/109 (4%) 0.57 (0.12, 2.63) P=0.47 (Phet=0.71)
Cardiac surgery Carless (2006)(20) 1 trial (N=168; 84 cell
salvage, 84 control) 2/84 (2%) 3/84 (4%) 0.67 (0.11, 3.89)
P=0.65 (Phet=NA) Vascular surgery Carless (2006)(20) 1 trial (N=50; 50 cell
salvage, 50 control) 0/25 (0%) 1/25 (4%) 0.33 (0.01, 7.81)
P=0.49 (Phet=NA)
Hospital length of stay (days) a
Mean ± SD Mean difference (95%CI) Carless (2006)(20) 1 trial c (N=100; 50 cell
salvage, 50 control) 12.2 ± 4.7 12.7 ± 5.3 –0.50 (–2.46, 1.46)
P=0.62 (Phet=NA) CI; confidence interval; DVT, deep vein thrombosis; MI, myocardial infarction; NA, not applicable; NR, not reported; RR, relative risk; SD, standard deviation. a Carless (2006)(20) did not conduct meta-analyses for these outcomes specifically in studies assessing intraoperative cell salvage. However, the results from Carless (2006) were sufficient to conduct meta-analyses herein. The classification of studies as ‘intraoperative’ in the meta-analysis conducted herein is consistent with Analysis 3.5 (pg 122) in Carless (2006), which provides a forest plot for the effect of cell salvage on transfusion frequency with timing of salvage as subgroups. There are four studies that did not report transfusion frequency (and are therefore not listed in Analysis 3.5), but reported other relevant outcomes (Davies 1987; Ekback 1995; Schaff 1978; and Zhao 1996). Based on a review of the ‘Characteristics of the studies’ section of Carless (2006), one study (Davies 1987) is categorised herein as ‘intraoperative’. b All three trials were in patients undergoing vascular surgery. c Vascular surgery. d Orthopaedic surgery.
Technical report on perioperative patient blood management – Volume 1b July 2011 33
Blood loss Of the RCTs in Carless (2006)(20) that reported blood loss, two studies were in patients undergoing cardiac surgery (N=206), one study was in patients undergoing orthopaedic surgery (N=39) and three studies were in patients undergoing vascular surgery (N=186). Intraoperative cell salvage significantly reduced operative blood loss compared with control for the patients who underwent orthopaedic surgery (MD: –736 mL; 95%CI: –1054, –418) but not for those who underwent cardiac surgery (MD: 27 mL; 95%CI: –103, 157) or vascular surgery (MD: 35 mL; 95%CI: –269, 338).
Incidence of transfusion Of the RCTs in Carless (2006)(20) that reported the proportion of subjects transfused with allogeneic blood, two studies were in patients undergoing cardiac surgery (N=206), one study was in patients undergoing orthopaedic surgery (N=40) and two studies were in patients undergoing vascular surgery (N=136). Intraoperative cell salvage significantly reduced the proportion on individuals who required allogeneic blood transfusion compared with control (41% vs 59%; RR 0.61; 95%CI: 0.39, 0.95). The reduced incidence of allogeneic blood transfusion was significant for those undergoing cardiac surgery (30% vs 54%; RR 0.56; 95%CI: 0.39, 0.79) and orthopaedic surgery (30% vs 90%; RR 0.33; 95%CI: 0.17, 0.66), but not for those undergoing vascular surgery (54% vs 57%; RR 0.93; 95%CI: 0.72, 1.20).
Volume of transfusion Of the RCTs in Carless (2006)(20) that reported the volume of allogeneic blood transfused, two studies were in patients undergoing cardiac surgery (N=206), one study was in patients undergoing orthopaedic surgery and three studies were in patients undergoing vascular surgery. Intraoperative cell salvage significantly reduced the mean units of allogeneic blood transfused for patients undergoing cardiac surgery (MD: –0.46 units; 95%CI: –0.86, –0.05) and orthopaedic surgery (MD: –2.04units; 95%CI: –2.58, –1.50), but not for those undergoing vascular surgery (MD: 0.02 units; 95%CI: –0.32, 0.52). When the results of the surgery types are combined, the reduction in mean units of allogeneic blood transfused is not significant (MD: –0.69 units; 95%CI: –1.47, 0.08).
All of the RCTs assessing intraoperative cell salvage reported the use of a transfusion protocol.
Mortality There were three RCTs in Carless (2006)(20) that reported mortality as an outcome, all in patients undergoing vascular surgery (N=186). There is no significant difference in the reported mortality rates between individuals who receive intraoperative cell salvage and those who did not (4% vs 4%; RR 0.91; 95%CI: 0.30, 2.78).
Morbidity In Carless (2006)(20), two RCTs (cardiac surgery and vascular surgery) reported infection as an outcome (N=268), one RCT (vascular surgery) reported wound complication (N=100), two RCTs (orthopaedic surgery and vascular surgery) reported any thrombosis (N=139), two RCTs (orthopaedic surgery and vascular surgery) reported stroke, three RCTs (one in cardiac

Technical report on perioperative patient blood management – Volume 1b July 2011 34
surgery and two in vascular surgery) reported non-fatal MI (N=304) and one RCT (orthopaedic surgery) reported deep vein thrombosis (DVT) (N=39). Intraoperative cell salvage, compared with control, does not significantly affect the risk of infection (12% vs 13%; RR 0.91; 95%CI: 0.30, 2.78), wound complication (6% vs 6%; RR 1.0; 95%CI: 0.21, 4.72), thrombosis (4% vs 3%; RR: 1.58; 95%CI: 0.30, 8.43), stroke (1% vs 2%; RR 0.43; 95%CI: 0.06, 2.91) and DVT (16% vs 10%; RR 1.58; 95%CI: 0.30, 8.43). However, intraoperative cell salvage is associated with a significantly lower risk of non-fatal MI (3% vs 9%; RR 0.44; 95%CI: 0.17, 1.12).
Reoperation for bleeding Of the RCTs in Carless (2006)(20) that reported reoperation for bleeding as an outcome, one RCT was in cardiac surgery (N=168) and one was in vascular surgery (N=50). There was no significant difference in the risk of reoperation for bleeding between individuals who received intraoperative cell salvage and those who did not (2% vs 4%; RR 0.57; 95%CI: 0.12, 2.63).
Hospital length of stay One RCT in Carless (2006)(20) reported length of hospital stay as an outcome for patients undergoing vascular surgery (N=100). In this study, intraoperative cell salvage did not significantly decrease the length of hospital stay compared with control (MD: 0.50; 95%CI: –2.46, 1.46).
Level II evidence A literature search was conducted to identify Level II studies published after the search conducted in the pivotal Carless (2006) systematic review. Nine studies were identified and the main characteristics of these studies are summarised in Table 2.3.
Table 2.11 Characteristics and quality of Level II evidence for intraoperative cell salvage
Author Study type Study quality
Population Setting
Relevant outcomes
Bowley (2006)(24)
RCT Fair
Penetrating torso injury requiring a laparotomy and who had exhibited hypotension either pre-hospital or on arrival and in whom there was considered to be significant blood loss Hospital in Johannesburg (N=44; 21 cell salvage, 23 control)
Transfusion volume
Damgaard (2006)(25)
RCT Good
Elective or sub-acute off-CPB CABG Hospital in Denmark (N=60; 30 cell salvage, 30 control)
Transfusion incidence Transfusion volume Cost
Goel (2007)(26) RCT Fair
Off-CPB coronary artery bypass grafting Hospital in India (N=50; 25 cell salvage, 25 control)
Transfusion incidence Transfusion volume Volume of salvaged blood retransfused

Technical report on perioperative patient blood management – Volume 1b July 2011 35
Author Study type Study quality
Population Setting
Relevant outcomes
Mercer (2004)(27)
RCT Good
Surgery for abdominal aortic aneurysm Hospital in United Kingdom (N=81; 40 cell salvage, 41 control)
Transfusion incidence Transfusion volume Volume of salvaged blood retransfused
Murphy (2005)(28)
RCT Fair
Non-emergency first-time CABG (off-CPB) Hospital in United Kingdom. (N=61; 30 cell salvage, 31 control)
Transfusion incidence Volume of salvaged blood retransfused
Niranjan (2006)(29)
RCT Good
First-time isolated CABG Hospital in United Kingdom (N=80; 20 cell salvage CPB, 20 cell salvage off-CPB, 20 control CPB, 20 control off-CPB)
Transfusion volume
Selo-Ojeme (2007)(30)
RCT Fair
Women with a diagnosis of ruptured ectopic pregnancy Hospital in Nigeria (N=112; 56 cell salvage, 56 control)
Transfusion incidence (% who received ≥ 1000 mL)
Wiefferink (2007)(31)
RCT Fair
CABG with CPB Hospital in Netherlands (N=30; 15 cell salvage, 15 control)
Transfusion incidence
Zhang (2004)(32) RCT Poor
Operation for scoliosis Hospital in China (N=48; 36 cell salvage, 12 control)
Transfusion incidence
CABG, coronary artery bypass graft; CPB, cardiopulmonary bypass; ICU, intensive care unit; RCT, randomised controlled trial; RR, relative risk
The surgical operations under which intraoperative cell salvage was assessed were on and off-CPB, CABG, AAA, surgery for traumatic injury, ruptured ectopic pregnancy and operation for scoliosis. Niranjan (2006)(29) included patients both on and off-CPB. The included studies were conducted in China(32), Denmark(25), India(26), Netherlands(31), Nigeria(30), South Africa(24) and the United Kingdom(27-29;33).
The results from these RCTs are summarised below in Table 2.4 (blood loss and transfusion requirements), Table 2.5 (mortality and morbidity), Table 2.6 (haemoglobin concentration and coagulation parameters) and Table 2.7 (length of hospital/ICU stay, reoperation for bleeding and duration of surgery).
Blood loss Four RCTs published after Carless (2006) reported blood loss as an outcome (Table 2.4). Mercer (2004)(27) and Zhang (2004)(32) found no significant difference between intraoperative cell salvage and control. In the study by Niranjan (2006)(29), cell salvage was significantly associated with lower operative blood loss for on-CPB patients (MD: –181 mL; 95%CI: –357, –5) but not off-CPB patients (MD: –34 mL; 95%CI: –220, 152). Damgaard (2006)(25) reported a significant decrease in net blood loss for the individuals who received

Technical report on perioperative patient blood management – Volume 1b July 2011 36
intraoperative cell salvage compared with those who did not (median difference not reported; P<0.01).
Table 2.12 Results for Level II evidence: Intraoperative cell salvage versus no cell salvage (blood loss and transfusion requirements)
Author Surgical procedure Cell salvage No cell salvage Statistical
significance
Operative blood loss (mL) Mean (SD)
Niranjan (2006)(29)
On vs off-CPB CABG
On-CPB: 842 (276) Off-CPB: 869 (286)
On-CPB: 1023 (291) Off-CPB: 903 (315)
On-CPB Mean difference: –
181 (–357, –5); P=0.04 Off-CPB
Mean difference: –34 (–220, 152); P=0.72
Zhang (2004)(32)
Operation for scoliosis NR NR NS
Operative blood loss (mL) Median (IQR)
Damgaard (2006)(25) Off-CPB CABG 300 (193 to 403) 610 (450 to 928) Mean difference:
NR; P<0.001 Mercer (2004)(27) AAA 1950 (775 to 285) 1270 (775 to 2850) Mean difference:
NR; P=0.140 Patients transfused with salvaged blood n/N (%)
Murphy (2005)(28) Off-CPB CABG 20/30 (67%) NA NA
Volume of blood salvaged (mL) Median (IQR)
Murphy (2005)(28) Off-CPB CABG 747 (607 to 978) NA NA
Volume of salvaged blood retransfused (mL) Median (IQR)
Goel (2007)(26) Off-CPB CABG 714.8 (317.5) NA NA
Mercer (2004)(27) AAA 650 (500 to 1125) NA NA
Murphy (2005)(28) Off-CPB CABG 236 (206 to 342) NA NA
Patients transfused with allogeneic blood components n/N (%)
Damgaard (2006)(25) Off-CPB CABG 17/30 (57%) 21/29 (72%) RR (95%CI): 0.78
(0.53, 1.15); P=0.21 Murphy (2005)(28) Off-CPB CABG 5/30 (17%)
11/31 (36%) RR (95%CI): 0.47
(0.19, 1.19); P=0.11

Technical report on perioperative patient blood management – Volume 1b July 2011 37
Author Surgical procedure Cell salvage No cell salvage Statistical
significance
Units of allogeneic blood components transfused Median (IQR)
Damgaard (2006)(25) Off-CPB CABG 1 (0 to 2) 2 (0 to 7) Mean difference:
NR; P=0.06 Patients transfused with ≥ 1000 mL with blood n/N (%)
Selo-Ojeme (2007)(30)
Ruptured ectopic pregnancy 34/56 (60%) 11/56 (20%)
RR (95%CI): 3.09 (1.75, 5.47); P=0.0001
Patients transfused with allogeneic blood n/N (%)
Goel (2007)(26) Off-CPB CABG 20/24 (83%) 25/25 (100%) RR (95%CI): 0.84
(0.69, 1.01); P=0.07
Mercer (2004)(27) AAA 21/40 (53%) 31/41 (76%) RR (95%CI): 0.69
(0.49, 0.98); P=0.04
Murphy (2005)(28) Off-CPB CABG 4/30 (13%)
7/31 (23%) RR (95%CI): 0.59
(0.19, 1.81); P=0.36
Zhang (2004)(32)
Operation for scoliosis 11/36 (31%) 12/12 (100%)
RR (95%CI): 0.32 (0.20, 0.53); P<0.00001
Units of allogeneic blood transfused Mean (SD)
Bowley (2006)(24) Traumatic surgery a 6.47 (5.14) 11.17 (6.06)
Mean difference: –4.70 (–8.01, –1.39);
P=0.005
Goel (2007)(26) Off-CPB CABG 1.5 (1.1) 2.4 (1.3)
Mean difference: –0.90 (–1.57, –0.23);
P=0.008
Millilitres of allogeneic blood transfused Mean (SD)
Niranjan (2006)(29)
On vs off-CPB CABG
On-CPB: 179 (214) Off-CPB: 141 (183)
Combined: 159 (196)
On-CPB: 230 (240) Off-CPB: 595 (438)
Combined: 413 (394)
On-CPB Mean difference: –51 (–192, 90); P=0.48
Off-CPB Mean difference: –454 (–662, –246);
P<0.0001 Combined
Mean difference: –254 (–390, –118);
P=0.0003

Technical report on perioperative patient blood management – Volume 1b July 2011 38
Author Surgical procedure Cell salvage No cell salvage Statistical
significance
Units of allogeneic blood transfused Median (IQR)
Mercer (2004)(27) AAA 1 (0 to 3) 3 (1 to 5) Mean difference:
NR; P=0.012
Patients transfused with allogeneic packed RBCs n/N (%)
Wiefferink (2007)(31) On-CPB CABG 8/15 (54%) 10/15 (67%) RR (95%CI): 0.80
(0.44, 1.45); P=0.46 Patients transfused with ≥2 units of allogeneic packed RBCs n/N (%)
Wiefferink (2007)(31) On-CPB CABG 2/15 (13%) 7/15 (47%) RR (95%CI): 0.20
(0.05, 0.76); P=0.08 Units of allogeneic packed RBCs transfused Median (IQR)
Damgaard (2006)(25) Off-CPB CABG 1 (0 to 2) 2 (0 to 5) Mean difference:
NR; P=0.07
Units of FFP transfused (ICU) Median (IQR)
Damgaard (2006)(25) Off-CPB CABG 0 (0 to 0)
Range: 0 to 4 0 (0,0)
Range: 0 to 22 Mean difference:
NR; P=0.40
Units of FFP transfused (ward) Median (IQR)
Damgaard (2006)(25) Off-CPB CABG 0 (0 to 0)
Range: 0 to 0 0 (0, 0)
Range: 0 to 1 Mean difference:
NR; P=0.31
Patients transfused with platelets n/N (%)
Murphy (2005)(28) Off-CPB CABG 2/30 (7%) 6/31 (19%) RR (95%CI): 0.34
(0.08, 1.57); P=0.17
Units of platelets transfused Median (IQR)
Damgaard (2006)(25) Off-CPB CABG 0 (0 to 0)
Range: 0 to 1 0 (0 to 0)
Range: 0 to 1 Mean difference:
NR; P=NR Patients transfused with clotting factor n/N (%)
Murphy (2005)(28) Off-CPB CABG 0/30 (0%) 1/31 (3%) RR (95%CI): 0.34
(0.01, 8.13); P=0.51 AAA, abdominal aortic aneurysm; CABG, coronary artery bypass graft; CI, confidence interval; CPB, cardiopulmonary bypass; FFP, fresh frozen plasma; ICU, intensive care unit; IQR, interquartile range; NA, not applicable; NR, not reported; NS, not significant; RBC, red blood cell; RR, relative risk; SD, standard deviation a Specifically patients with penetrating torso injury requiring a laparotomy and who had exhibited hypotension either pre-hospital or on arrival and in whom there was considered significant blood loss
Incidence and volume of transfusion Table 2.4 summarises the incidence and volume of transfusions reported in the included RCTs. There was no significant difference between intraoperative cell salvage and control in the proportion of individuals transfused with allogeneic blood components in either

Technical report on perioperative patient blood management – Volume 1b July 2011 39
Damgaard (2006)(25) or Murphy (2005)(28). Similarly intraoperative cell salvage did not significantly affect the proportion transfused with allogeneic blood in the Goel (2007)(26) or Murphy (2005)(28) trials. On the other hand, intraoperative cell salvage significantly reduced the incidence of allogeneic blood transfusion in patients undergoing surgery for abdominal aortic aneurysm in Mercer (2004)(27) (53% vs 76%; RR 0.69; 95%CI: 0.49, 0.98) and surgery for scoliosis in Zhang (2004)(32) (31% vs 100%; RR 0.32; 95%CI: 0.20, 0.53).
A meta-analysis of the incidence of transfusion with allogeneic blood was conducted herein, combining the outcome data from Carless (2006)(20) with the results from Goel (2007)(26), Mercer (2004)(27), Murphy (2005)(28) and Zhang (2004)(32) (Figure 2.1). The meta-analysed incidence of allogeneic blood transfusion is significantly lower for the individuals who received intraoperative cell salvage than for those who did not receive cell salvage (40% vs 63%; RR 0.61; 95%CI: 0.46, 0.81). The effect is significant for cardiac surgery (35% vs 55%; RR 0.63; 95%CI: 0.41, 0.98) and orthopaedic surgery (30% vs 94%; RR 0.33; 95%CI: 0.22, 0.49), but not vascular surgery (54% vs 64%; RR 0.83; 95%CI: 0.67, 1.03). The inclusion of the updated RCTs does not change any of the findings from the Carless (2006) meta-analysis; however, it does decrease the level of uncertainty around the point estimates.
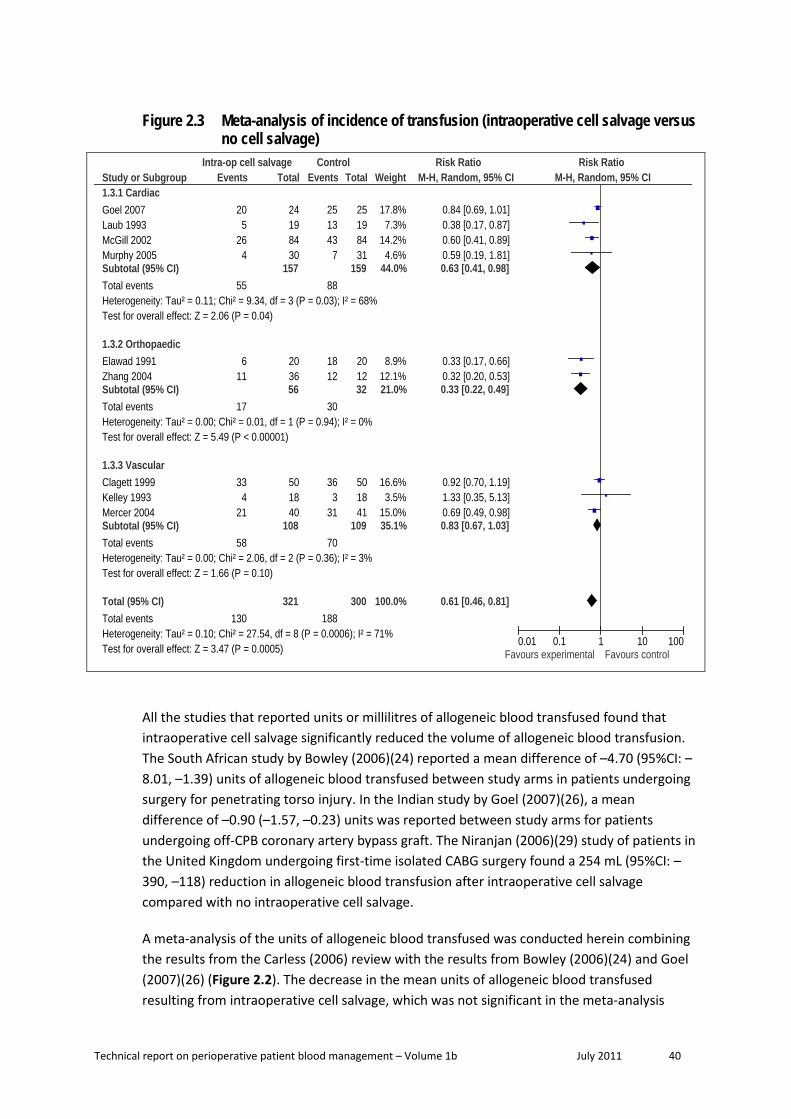
Technical report on perioperative patient blood management – Volume 1b July 2011 40
Figure 2.3 Meta-analysis of incidence of transfusion (intraoperative cell salvage versus no cell salvage)
Study or Subgroup1.3.1 CardiacGoel 2007Laub 1993McGill 2002Murphy 2005Subtotal (95% CI)Total eventsHeterogeneity: Tau² = 0.11; Chi² = 9.34, df = 3 (P = 0.03); I² = 68%Test for overall effect: Z = 2.06 (P = 0.04)
1.3.2 OrthopaedicElawad 1991Zhang 2004Subtotal (95% CI)Total eventsHeterogeneity: Tau² = 0.00; Chi² = 0.01, df = 1 (P = 0.94); I² = 0%Test for overall effect: Z = 5.49 (P < 0.00001)
1.3.3 VascularClagett 1999Kelley 1993Mercer 2004Subtotal (95% CI)Total eventsHeterogeneity: Tau² = 0.00; Chi² = 2.06, df = 2 (P = 0.36); I² = 3%Test for overall effect: Z = 1.66 (P = 0.10)
Total (95% CI)Total eventsHeterogeneity: Tau² = 0.10; Chi² = 27.54, df = 8 (P = 0.0006); I² = 71%Test for overall effect: Z = 3.47 (P = 0.0005)
Events
205
264
55
611
17
334
21
58
130
Total
24198430
157
203656
501840
108
321
Events
2513437
88
1812
30
363
31
70
188
Total
25198431
159
201232
501841
109
300
Weight
17.8%7.3%
14.2%4.6%
44.0%
8.9%12.1%21.0%
16.6%3.5%
15.0%35.1%
100.0%
M-H, Random, 95% CI
0.84 [0.69, 1.01]0.38 [0.17, 0.87]0.60 [0.41, 0.89]0.59 [0.19, 1.81]0.63 [0.41, 0.98]
0.33 [0.17, 0.66]0.32 [0.20, 0.53]0.33 [0.22, 0.49]
0.92 [0.70, 1.19]1.33 [0.35, 5.13]0.69 [0.49, 0.98]0.83 [0.67, 1.03]
0.61 [0.46, 0.81]
Intra-op cell salvage Control Risk Ratio Risk RatioM-H, Random, 95% CI
0.01 0.1 1 10 100Favours experimental Favours control
All the studies that reported units or millilitres of allogeneic blood transfused found that intraoperative cell salvage significantly reduced the volume of allogeneic blood transfusion. The South African study by Bowley (2006)(24) reported a mean difference of –4.70 (95%CI: –8.01, –1.39) units of allogeneic blood transfused between study arms in patients undergoing surgery for penetrating torso injury. In the Indian study by Goel (2007)(26), a mean difference of –0.90 (–1.57, –0.23) units was reported between study arms for patients undergoing off-CPB coronary artery bypass graft. The Niranjan (2006)(29) study of patients in the United Kingdom undergoing first-time isolated CABG surgery found a 254 mL (95%CI: –390, –118) reduction in allogeneic blood transfusion after intraoperative cell salvage compared with no intraoperative cell salvage.
A meta-analysis of the units of allogeneic blood transfused was conducted herein combining the results from the Carless (2006) review with the results from Bowley (2006)(24) and Goel (2007)(26) (Figure 2.2). The decrease in the mean units of allogeneic blood transfused resulting from intraoperative cell salvage, which was not significant in the meta-analysis

Technical report on perioperative patient blood management – Volume 1b July 2011 41
reported in Carless (2006), becomes significant when the results from the more recent trials are added (MD: –0.86 units; 95%CI: –1.54, –0.18). The decrease in mean units of blood transfused is significant in orthopaedic surgery (MD: –2.04 units; 95%CI: –2.58, –1.50), trauma surgery (MD: –4.70 units; 95%CI: –8.01, –1.39) and cardiac surgery (MD: –0.58 units; 95%CI: –0.92, –0.23), but not vascular surgery (MD: 0.02 units; 95%CI: –0.34, 0.38).
Figure 2.4 Meta-analysis of volume of transfusion (intraoperative cell salvage versus no cell salvage)
Study or Subgroup1.4.1 CardiacGoel 2007Laub 1993McGill 2002Subtotal (95% CI)Heterogeneity: Tau² = 0.00; Chi² = 1.54, df = 2 (P = 0.46); I² = 0%Test for overall effect: Z = 3.24 (P = 0.001)
1.4.2 OrthopaedicElawad 1991Subtotal (95% CI)Heterogeneity: Not applicableTest for overall effect: Z = 7.37 (P < 0.00001)
1.4.3 VascularClagett 1999Davies 1987Kelley 1993Subtotal (95% CI)Heterogeneity: Tau² = 0.00; Chi² = 1.74, df = 2 (P = 0.42); I² = 0%Test for overall effect: Z = 0.11 (P = 0.91)
1.4.4 Trauma surgeryBowley 2006Subtotal (95% CI)Heterogeneity: Not applicableTest for overall effect: Z = 2.78 (P = 0.005)
Total (95% CI)Heterogeneity: Tau² = 0.69; Chi² = 47.52, df = 7 (P < 0.00001); I² = 85%Test for overall effect: Z = 2.46 (P = 0.01)Test for subgroup differences: Chi² = 44.23, df = 3 (P < 0.00001), I² = 93.2%
Mean [Units]
1.50.640.68
0.69
2.14
0.33
6.47
SD [Units]
1.11.161.55
0.87
2.13.4
0.69
5.14
Total
251984
128
2020
50251893
2121
262
Mean [Units]
2.41.3
1.07
2.73
2.35.5
0.22
11.17
SD [Units]
1.31.451.56
0.88
2.15.8
0.55
6.06
Total
251984
128
2020
50251893
2323
264
Weight
15.1%13.9%16.3%45.3%
15.9%15.9%
14.0%4.9%
16.6%35.5%
3.4%3.4%
100.0%
IV, Random, 95% CI [Units]
-0.90 [-1.57, -0.23]-0.66 [-1.49, 0.17]-0.39 [-0.86, 0.08]
-0.58 [-0.93, -0.23]
-2.04 [-2.58, -1.50]-2.04 [-2.58, -1.50]
-0.20 [-1.02, 0.62]-1.50 [-4.14, 1.14]0.11 [-0.30, 0.52]0.02 [-0.34, 0.38]
-4.70 [-8.01, -1.39]-4.70 [-8.01, -1.39]
-0.86 [-1.54, -0.18]
Intra-op cell salvage Control Mean Difference Mean DifferenceIV, Random, 95% CI [Units]
-10 -5 0 5 10Favours experimental Favours control
In terms of packed RBCs, the study by Wiefferink (2007)(31) found that intraoperative cell salvage did not significantly reduce the incidence of transfusion with allogeneic packed RBCs, but did significantly reduce the proportion of patients transfused with two or more units of packed RBCs (13% vs 47%; RR 0.20; 95%CI: 0.05, 0.76). The evidence available from Damgaard (2006) and Murphy (2005) shows no effect of intraoperative cell salvage on the incidence or volume of transfusion of fresh frozen plasma, platelets, or clotting factor.
Mortality None of the seven trials that reported mortality as an outcome found a significant difference between intraoperative cell salvage and control (Table 2.5). This is consistent with the results from the Carless (2006) systematic review. However, the studies were not powered to find a difference in mortality.

Technical report on perioperative patient blood management – Volume 1b July 2011 42
Table 2.13 Results for Level II evidence: Intraoperative cell salvage versus no cell salvage (mortality and morbidity)
Author Surgical procedure Cell salvage No cell salvage Statistical
significance
Mortality n/N (%)
Bowley (2006)(24)
Laparotomy – trauma a 14/21 (67%) 15/23 (65%) RR (95%CI): 1.02
(0.67, 1.56); P=0.92 Damgaard (2006)(25) Off-CPB CABG 0/30 (0%) 2/30 (7%) RR (95%CI): 0.20
(0.01, 4.00); P=0.29 Goel (2007)(26) Off-CPB CABG 0/24 (0%) 0/25 (0%) Not estimable
Mercer (2004)(27) AAA 1/40 (3%) b 1/41 (2%) c
RR (95%CI): 1.02 (0.07, 15.83);
P=1.000 Murphy (2005)(28) Off-CPB CABG 0/30 (0%) 0/31 (0%) Not estimable
Selo-Ojeme (2007)(30)
Ruptured ectopic pregnancy 0/56 (0%) 0/56 (0%) Not estimable
Zhang (2004)(32) Scoliosis surgery 0/36 (0%) 0/12 (0%) Not estimable
Morbidity: cardiovascular accident n/N (%)
Niranjan (2006)(29)
On vs off-CPB CABG
On-CPB: 0/20 (0%) Off-CPB: 1/20 (5%)
On-CPB: 1/20 (5%) Off-CPB: 0/20 (0%)
On-CPB RR (95%CI): 0.33
(0.01, 7.72); P=0.49 Off-CPB
RR (95%CI): 3.00 (0.13, 69.52); P=0.49
Morbidity: stroke n/N (%)
Damgaard (2006)(25) Off-CPB CABG 0/30 (0%) 1/30 (3%) RR (95%CI): 0.33
(0.01, 7.87); P=0.50 Murphy (2005)(28) Off-CPB CABG 0/30 (0%) 0/31 (0%) Not estimable
Morbidity: myocardial infarction n/N (%)
Damgaard (2006)(25) Off-CPB CABG 0/30 (0%) 1/30 (3%) RR (95%CI): 0.33
(0.01, 7.87); P=0.50
Murphy (2005)(28) Off-CPB CABG 2/30 (7%) 0/31 (0%)
RR (95%CI): 5.16 (0.26, 103.25);
P=0.28 Morbidity: pulmonary complications n/N (%)
Murphy (2005)(28) Off-CPB CABG 0/30 (0%) 4/31 (13) RR (95%CI): 0.11
(0.01, 2.04); P=0.11

Technical report on perioperative patient blood management – Volume 1b July 2011 43
Author Surgical procedure Cell salvage No cell salvage Statistical
significance
Niranjan (2006)(29)
On vs off-CPB CABG
On-CPB: 4/20 (20%) Off-CPB: 2/20 (10%)
On-CPB: 3/20 (15%) Off-CPB: 1/20 (5%)
On-CPB RR (95%CI): 1.33
(0.34, 5.21); P=0.68 Off-CPB
RR (95%CI): 2.00 (0.20, 20.33); P=0.56
Morbidity: pneumonia n/N (%)
Damgaard (2006)(25) Off-CPB CABG 2/30 (7%) 3/30 (10%) RR (95%CI): 0.67
(0.12, 3.71); P=0.64 Morbidity: Gastrointestinal bleeding n/N (%)
Damgaard (2006)(25) Off-CPB CABG 0/30 (0%) 3/30 (10%) RR (95%CI): 0.14
(0.01, 2.65); P=0.19
Morbidity: infection n/N (%)
Damgaard (2006)(25) Off-CPB CABG
Deep sterna wound infection: 0/30 (0%)
Leg wound infection: 0/30 (0%)
Deep sterna wound infection: 1/30 (3%)
Leg wound infection: 1/30 (3%)
Deep sterna RR (95%CI): 0.33
(0.01, 7.87); P=0.50 Leg
RR (95%CI): 0.33 (0.01, 7.87); P=0.50
Goel (2007)(26) Off-CPB CABG Deep sterna wound
infection: 0/24 (0%) Deep sterna wound infection 0/25 (0%) Not estimable
Mercer (2004)(27) AAA 5/40 (13%) d 14/41 (34%) e RR (95%CI): 0.37
(0.15, 0.92); P=0.03 Murphy (2005)(28) Off-CPB CABG 2/30 (7%) 1/31 (3%) RR (95%CI): 2.07
(0.20, 21.61); P=0.54 Selo-Ojeme (2007)(30)
Ruptured ectopic pregnancy 3/56 (5%) 4/56 (7%) RR (95%CI): 0.75
(0.18, 3.20); P=0.70
Morbidity: sepsis n/N (%)
Mercer (2004)(27) AAA 4/40 (10%) 8/41 (20%) RR (95%CI): 0.51
(0.17, 1.57)
Morbidity: renal complications n/N (%)
Murphy (2005)(28) Off-CPB CABG 0/30 (0%) 2/31 (7%) RR (95%CI): 0.21
(0.01, 4.13); P=0.49
Niranjan (2006)(29)
On vs off-CPB CABG
On-CPB: 2/20 (10%) Off-CPB: 1/20 (5%)
On-CPB: 1/20 (5%) Off-CPB: 0/20 (0%)
On-CPB RR (95%CI): 2.00
(0.20, 20.33); P=0.56 Off-CPB
RR (95%CI): 3.00 (0.13, 69.52); P=0.49

Technical report on perioperative patient blood management – Volume 1b July 2011 44
Author Surgical procedure Cell salvage No cell salvage Statistical
significance
Morbidity: need for dialysis n/N (%)
Damgaard (2006)(25) Off-CPB CABG 1/30 (3%) 2/30 (7%) RR (95%CI): 0.50
(0.05, 5.22); P=0.56 Morbidity: low cardiac output syndrome f n/N (%)
Damgaard (2006) (25) Off-CPB CABG 0/30 (0%) 6/30 (20%) RR (95%CI): 0.08
(0.00, 1.31); P=0.08
Morbidity: arrhythmia n/N (%)
Murphy (2005)(28) Off-CPB CABG 6/30 (20%) 7/31 (23%) RR (95%CI): 0.89
(0.34, 2.33); P=0.81
Niranjan (2006)(29)
On vs off-CPB CABG
On-CPB: 7/20 (35%) Off-CPB: 3/20 (25%)
On-CPB: 5/20 (25%) Off-CPB: 4/20 (20%)
On-CPB RR (95%CI): 1.40
(0.53, 3.68); P=0.49 Off-CPB
RR (95%CI): 0.75 (0.19, 2.93); P=0.68
Morbidity: atrial arrhythmia n/N (%)
Damgaard (2006)(25) Off-CPB CABG 14/30 (47%) 20/30 (67%) RR (95%CI): 0.70
(0.44, 1.11); P=0.13
Morbidity: ventricular arrhythmia n/N (%)
Damgaard (2006)(25) Off-CPB CABG 0/30 (0%) 3/30 (10%) RR (95%CI): 0.14
(0.01, 2.65); P=0.19
Morbidity: allergic reaction n/N (%)
Zhang (2004)(32)
Operation for scoliosis 0/36 (0%) 3/12 (25%) RR (95%CI): 0.05
(0.00, 0.91); P=0.04
Morbidity: postoperative fever n/N (%)
Selo-Ojeme (2007)(30)
Ruptured ectopic pregnancy 20/56 (36%) 21/56 (38%) RR (95%CI): 0.95
(0.58, 1.55); P=0.84
Morbidity: inotropic infusion n/N (%)
Damgaard (2006) (25) Off-CPB CABG 6/30 (20%) 9/30 (30%) RR (95%CI): 0.67
(0.27, 1.64); P=0.38 Morbidity: systemic inflammatory response syndrome n/N (%)
Mercer (2004)(27) AAA 9/40 (23%) 20/41 (49%) RR (95%CI): 0.46
(0.24, 0.89); P=0.02 AAA, abdominal aortic aneurysm; CABG; coronary artery bypass graft; CI, confidence interval; CPB; cardiopulmonary bypass;vRR; relative risk a Specifically patients with penetrating torso injury requiring a laparotomy and who had exhibited hypotension either pre-hospital or on arrival and in whom there was considered significant blood loss.
Technical report on perioperative patient blood management – Volume 1b July 2011 45
b The patient died within 30 days of surgery owing to postoperative myocardial infarction and methicillin-resistant Staphylococcus aureus (MRSA). c The patient died in hospital 37 days after surgery with pneumonia, MRSA septicaemia and acute renal failure. d Including four chest infections and one line infection. e Including twelve chest infections, one graft infection and one blood infection. f Low cardiac output syndrome was defined as infusion of epinephrine/norepinephrine at a rate above 0.05 µg/kg/hour in more than one hour after arrival to the intensive care unit, to maintain a systolic blood pressure above 90 mmHg.
Morbidity In the Mercer (2004) study of patients undergoing surgery for abdominal aortic aneurysm(27), intraoperative cell salvage was associated with a significantly lower rate of infection compared with control (13% vs 34%; RR 0.37; 95%CI: 0.15, 0.92). In contrast, Damgaard (2006)(25), Murphy (2005)(28) and Selo-Ojeme (2007)(30) found no significant difference in infection rates between cell salvage and control (Table 2.5)., However, infection was not well defined in the publications.
A meta-analysis of infection rates was conducted combining the results of these RCTs with the infection data from the trials reported in Carless (2006) (Figure 2.3). Based on the results of the meta-analysis, intraoperative cell salvage significantly lowers the rate of infection for individuals undergoing vascular surgery (11% vs 26%; RR 0.42; 95%CI: 0.21, 0.83) but not for those undergoing cardiac surgery or surgery for ruptured ectopic pregnancy.
There were significantly fewer allergic reactions in the Zhang (2004)(32) study for patients who received intraoperative cell salvage compared with those who did not (0% vs 10%; RR 0.14; 95%CI: 0.01, 2.65). Mercer (2004)(27) found that intraoperative cell salvage was associated with significantly fewer cases of systemic inflammatory response syndrome (23% vs 49%; RR 0.46; 95%CI: 0.24, 0.89). None of the trials provided evidence for a significant difference between cell salvage and control for any other morbidity outcome.

Technical report on perioperative patient blood management – Volume 1b July 2011 46
Figure 2.5 Meta-analysis of rates of infection (intraoperative cell salvage versus no cell salvage)
Study or Subgroup1.7.1 OtherSelo-Ojeme 2007Subtotal (95% CI)Total eventsHeterogeneity: Not applicableTest for overall effect: Z = 0.39 (P = 0.70)
1.7.2 CardiacDamgaard 2006Goel 2007McGill 2002Murphy 2005Subtotal (95% CI)Total eventsHeterogeneity: Tau² = 0.00; Chi² = 1.83, df = 2 (P = 0.40); I² = 0%Test for overall effect: Z = 0.81 (P = 0.42)
1.7.4 VascularClagett 1999Mercer 2004Subtotal (95% CI)Total eventsHeterogeneity: Tau² = 0.00; Chi² = 0.20, df = 1 (P = 0.65); I² = 0%Test for overall effect: Z = 2.49 (P = 0.01)
Total (95% CI)Total eventsHeterogeneity: Tau² = 0.16; Chi² = 6.94, df = 5 (P = 0.23); I² = 28%Test for overall effect: Z = 1.15 (P = 0.25)Test for subgroup differences: Not applicable
Events
3
3
00
112
13
55
10
26
Total
5656
30248430
168
504090
314
Events
4
4
2071
10
1014
24
38
Total
5656
30258431
170
504191
317
Weight
13.9%13.9%
3.9%
26.7%6.2%
36.8%
23.5%25.8%49.3%
100.0%
M-H, Random, 95% CI
0.75 [0.18, 3.20]0.75 [0.18, 3.20]
0.20 [0.01, 4.00]Not estimable
1.57 [0.64, 3.86]2.07 [0.20, 21.61]1.40 [0.62, 3.13]
0.50 [0.18, 1.36]0.37 [0.15, 0.92]0.42 [0.21, 0.83]
0.70 [0.38, 1.29]
Intra-op cell salvage Control Risk Ratio Risk RatioM-H, Random, 95% CI
0.01 0.1 1 10 100Favours experimental Favours control
Haemoglobin concentration Five RCTs published after Carless (2006)(26) reported haemoglobin/haematocrit concentration as an outcome. Goel (2007) reported a significantly lower decrease in haemoglobin from preoperative to immediately postoperative (MD: –0.90 g/dL; 95%CI: –1.68, –0.12) (Table 2.6). In contrast, Niranjan (2006)(29) found that intraoperative cell salvage did not have a significant effect on the change in haemoglobin concentration from preoperative to 24 hours postoperative either on-pump (MD: 0.55 g/dL; 95%CI: –0.07, 1.17) or off-pump (MD: –0.05 g/dL; 95%CI: –1.01, 0.91). Murphy (2005)(28) reported a significantly higher haemoglobin concentration 24 hours postoperative for individuals who underwent intraoperative cell salvage compared with control (MD: 1.02), although the trial did not report the preoperative haemoglobin concentration.

Technical report on perioperative patient blood management – Volume 1b July 2011 47
Table 2.14 Results for Level II evidence: Intraoperative cell salvage versus no cell salvage (haemoglobin concentration and coagulation parameters)
Author (year) Surgical
procedure Outcome Cell salvage No cell salvage Statistical
significance
Damgaard (2006)(25) Off-CPB CABG
Baseline Hb concentration (median [IQR]), mmole/L
7.9 (7.4 to 8.7)
8.2 (7.4 to 8.9)
Mean difference: NR; P=0.43
Lowest Hb concentration in ICU (median [IQR[), mmole/L
5.9 (5.3 to 6.6)
5.8 (5.2 to 6.7)
Mean difference: NR; P=0.97
Lowest Hb concentration in ward (median [IQR]) mmole/L 6.4 (5.9 to 6.8) 6.6 (5.8 to 7.1) Mean difference: NR;
P=0.58
Lowest haematocrit concentration at hospital
discharge (median [IQR]), mmole/L
7.1 (6.5 to 7.4) 7.2 (6.5 to 8.1) Mean difference: NR; P=0.25
Baseline haematocrit concentration (median [IQR]),
%
39 (36 to 42) 41 (38 to 44) Mean difference: NR;
P=0.21
Lowest haematocrit concentration in ICU (median
[IQR]), % 29 (27 to 33) 29 (25 to 33) Mean difference: NR;
P=0.69
Median (IQR) intraoperative activated coagulation time, sec
(highest) 259 (207 to 283) 257 (208 to 292) Mean difference: NR;
P=0.95
Goel (2007)(26) Off-CPB CABG
Decrease in Hb (from preoperative to immediately
postoperative) (mean [SD]), g/dL
1.8 (1.2) 2.7 (1.6) Mean difference
(95%CI): –0.90 (–1.68, –0.12); P=0.02
Haematocrit concentration of the autotransfused blood (mean
[SD]), % 34.6 (4.6) NA NA
Murphy (2005)(28) Off-CPB CABG
Hb concentration immediately postoperative (mean [SD]), g/dL 11.14 (1.15) 11.25 (1.17)
Mean difference (95%CI): –0.11 (–0.69,
0.47); P=0.71
Hb concentration 1 hour postoperative (mean [SD]), g/dL 10.55 (1.15) 10.40 (1.11)
Mean difference (95%CI): 0.15 (–0.42,
0.72); P=0.60
Hb concentration 24 hours postoperative (mean [SD]), g/dL 11.71 (1.15) 10.69 (1.11)
Mean difference (95%CI): 1.02 (0.45,
1.59); P=0.0007 Haematocrit concentration immediately postoperative
(mean [SD]), % 0.345 (0.033) 0.344 (0.033)
Mean difference (95%CI): 0.00 (–0.02,
0.02); P=0.91 Haematocrit concentration
1 hour postoperative (mean [SD]), %
0.312 (0.033) 0.305 (0.033) Mean difference
(95%CI): 0.01 (–0.01, 0.02); P=0.46
Haematocrit concentration 24 hour postoperative (mean
[SD]), % 0.350 (0.033) 0.319 (0.033)
Mean difference (95%CI): 0.03 (0.01,
0.05); P=0.0008 Platelet count 1 hour
postoperative (mean [SD]), X109/L
192.8 (0.15) 189.7 (0.14) Mean difference
(95%CI): –3.1 (–3.2, –3.0); P<0.0001

Technical report on perioperative patient blood management – Volume 1b July 2011 48
Author (year) Surgical
procedure Outcome Cell salvage No cell salvage Statistical
significance
Platelet count 24 hour postoperative (mean [SD]),
X109/L 225.4 (0.15) 218.2 (0.14)
Mean difference (95%CI): –7.2 (–7.3, –
7.1); P<0.0001
Prothrombin ratio immediately postoperative (mean [SD]) 1.27 (0.07) 1.27 (0.07)
Mean difference (95%CI): 0.0 (–0.03,
0.03); P>0.99
Prothrombin ratio 1 hour postoperative (mean [SD]) 1.19 (0.06) 1.19 (0.06)
Mean difference (95%CI): 0.0 (–0.03,
0.03); P>0.99
Prothrombin ratio 24 hour postoperative (mean [SD]) 1.15 (0.07) 1.15 (0.07)
Mean difference (95%CI): 0.0 (–0.03,
0.03); P>0.99
APTT ratio immediately postoperative (mean [SD]) 1.17 (0.13) 1.14 (0.12)
Mean difference (95%CI): –0.03 (–0.10,
0.04); P=0.36
APTT ratio 1 hour postoperative (mean [SD]) 1.08 (0.12) 1.13 (0.12)
Mean difference (95%CI): 0.05 (–0.01,
0.11); P=0.11
APTT ratio 24 hours postoperative (mean [SD]) 1.08 (0.12) 1.11 (0.12)
Mean difference (95%CI): 0.03 (–0.03,
0.09); P=0.34 Fibrinogen concentration
immediately postoperative (mean [SD]), g/L
2.59 (0.20) 2.68 (0.18) Mean difference
(95%CI): 0.09 (–0.01, 0.19); P=0.07
Fibrinogen concentration 1 hour postoperative (mean [SD]), g/L 2.21 (0.19) 2.34 (0.18)
Mean difference (95%CI): 0.13 (0.035,
0.22); P=0.008 Fibrinogen concentration
24 hours postoperative (mean [SD]), g/L
4.92 (0.19) 5.04 (0.19) Mean difference
(95%CI): 0.12 (0.02, 0.22); P=0.02
Niranjan (2006)(29) On vs off-CPB CABG
Decrease in Hb (from preoperative to 24 hours
postoperative) (mean [SD]), g/dL
On-CPB: 4.95 (1.1)
Off-CPB: 4.95 (1.5)
On-CPB: 4.4 (0.9) Off-CPB: 5.0 (1.6)
On-CPB Mean difference: 0.55 (–0.07, 1.17); P=0.08
Off-CPB Mean difference: –0.05 (–1.01, 0.91); P=0.92
Prothrombin time NR NR NS
Partial thromboplastin time (ratio) NR NR NS
Selo-Ojeme (2007)(30) Ruptured ectopic pregnancy
Haematocrit concentration immediately postoperative, % 29 26 Mean difference: NR;
P<0.01
APTT, activated partial thromboplastin time; CABG, coronary artery bypass graft; CI, confidence interval; CPB, cardiopulmonary bypass; Hb, haemoglobin; ICU, intensive care unit; IQR, interquartile range; NA, not applicable; NR, not reported; SD, standard deviation
Technical report on perioperative patient blood management – Volume 1b July 2011 49
Coagulation parameters Two RCTs published after Carless (2006) reported coagulation parameters. Murphy (2005)(28) reported platelet count, prothrombin ratio, activated partial thromboplastin time (APTT) ratio and fibrinogen concentration. Intraoperative cell salvage was associated with a significantly greater platelet count compared with control 1 hour postoperative (MD: 3.1x10⁹/L; 95%CI: 3.2x10⁹, 3.0x10⁹) and 24 hours postoperative (MD: 7.2x10⁹/L; 95%CI: 7.3x10⁹, 7.1x10⁹). Intraoperative cell salvage was not associated with a significant change in prothrombin ratio immediately postoperative (MD: 0.0; 95%CI: –0.03, 0.03), 1 hour postoperative (MD: 0.0; 95%CI: –0.03, 0.03), or 24 hours postoperative (MD: 0.0; 95%CI: –0.03, 0.03). Similarly there was no significant difference in APTT ratio immediately postoperative (MD: –0.03; 95%CI: –0.04, 0.10), 1 hour postoperative (MD: –0.05; 95%CI: –0.11, 0.01), or 24 hours postoperative (MD: –0.03, 95%CI: –0.09, 0.03). There was no significant difference in fibrinogen concentration immediately postoperative (MD: –0.09 g/L; 95%CI: –0.19, 0.01); however, intraoperative cell salvage was associated with a significant reduction in fibrinogen concentration 1 hour postoperative (MD: –0.13 g/L; 95%CI: –0.035, –0.22) and 24 hours postoperative (MD: –0.12 g/L; 95%CI: –0.02, –0.22),
Niranjan (2006)(29) did not report specific values for coagulation parameters but there was no significant difference in prothrombin time, or partial thromboplastin time between subjects who underwent intraoperative cell salvage compared with control.
Length of hospital stay and duration of surgery None of the studies found a significant relationship between the use of intraoperative cell salvage and length of hospital stay or duration of surgery (Table 2.7).
Length of ICU stay Three RCTs published after Carless (2006) reported length of ICU stay as an outcome (Table 2.7). Intraoperative cell salvage significantly reduced the proportion of patients whose length of ICU stay was more than 24 hours in the Damgaard (2006)(25) trial (3% vs 21%; RR 0.17; 95%CI: 0.02, 1.30). Niranjan (2006)(29) and Murphy (2005)(28) found no significant difference between treatment arms in length of ICU stay. Murphy (2005)(28) found that reoperation for bleeding did not significantly affect the rate of readmission to ICU.
Reoperation Two RCTs (25;26) published after Carless (2006) reported reoperation for bleeding as an outcome (Table 2.7). Neither of the studies found a significant relationship between the use of intraoperative cell salvage and rate of reoperation.
Duration of surgery Damgaard (2006)(25) was the only RCT published after Carless (2006) that reported duration of surgery as an outcome (Table 2.7). No significant relationship between the use of intraoperative cell salvage and duration of surgery.

Technical report on perioperative patient blood management – Volume 1b July 2011 50
Table 2.15 Results for Level II evidence: Intraoperative cell salvage versus no cell salvage (length of hospital/ICU stay, reoperation for bleeding and duration of surgery)
Author Surgical procedure Cell salvage No cell salvage Statistical
significance
Length of hospital stay (days) Mean (SD)
Bowley (2006)(24) Traumatic surgery a 15.7 (9.17) 14.6 (6.8)
Mean difference: 1.10 (–3.71, 5.91);
P=0.65
Niranjan (2006)(29)
On vs off-CPB CABG
On-CPB: 8.1 (2) Off-CPB: 7.2 (2.3)
On-CPB: 8.3 (3.1) Off-CPB: 7.4 (2.1)
On-CPB Mean difference: –0.20 (–1.82, 1.42);
P=0.81 Off-CPB
Mean difference: –0.20 (–1.56, 1.16);
P=0.77
Length of hospital stay (days) Median (IQR)
Damgaard (2006)(25) Off-CPB CABG 7 (6 to 8) 7 (6 to 9) Mean difference:
NR; P=NS Mercer (2004)(27) AAA 12 (8 to 19) 13 (10 to 19) Mean difference:
NR; P=0.385 Murphy (2005)(28) Off-CPB CABG 6.0 (5.0, 8.3) 6.0 (5.0, 8.0) Mean difference:
NR; P=0.73
Length of hospital stay > 7 days n/N (%)
Selo-Ojeme (2007)(30)
Ruptured ectopic pregnancy 8/56 (14%) 6/56 (11%) RR (95%CI): 1.33
(0.49, 3.59); P=0.57
Length of ICU stay (days) Mean (SD)
Niranjan (2006)(29)
On vs off-CPB CABG
On-CPB: 0.9 (0.4) Off-CPB: 1 (0.4)
On-CPB: 1 (0.4) Off-CPB: 0.9 (0.2)
On-CPB Mean difference: –0.10 (–0.35, 0.15);
P=0.43 Off-CPB
Mean difference: 0.10 (–0.10, 0.30);
P=0.32
Length of ICU stay (days) Median (IQR)
Murphy (2005)(28) Off-CPB CABG 1.0 (1.0, 1.0) 1.0 (1.0, 1.0) Mean difference:
NR; P=0.50

Technical report on perioperative patient blood management – Volume 1b July 2011 51
Author Surgical procedure Cell salvage No cell salvage Statistical
significance
Length of ICU stay > 24 hours n/N (%)
Damgaard (2006)(25) Off-CPB CABG 1/30 (3%) 6/30 (21%) RR (95%CI): 0.17
(0.02, 1.30); P=0.09
Readmission to ICU n/N (%)
Murphy (2005)(28) Off-CPB CABG 1/30 (3) 1/31 (3) RR (95%CI): 1.03
(0.07, 15.78); P=0.98
Reoperation for bleeding n/N (%)
Damgaard (2006)(25) Off-CPB CABG 1/30 (3%) 3/30 (10%) RR (95%CI): 0.33
(0.04, 3.03); P=0.35 Goel (2007)(26) Off-CPB CABG 0/24 (0%) 0/25 (0%) Not estimable
Duration of surgery (minutes) Mean (SD)
Selo-Ojeme (2007)(30)
Ruptured ectopic pregnancy NR NR Mean difference:
NR; P=NS
Wiefferink (2007)(31) b On-CPB CABG 98 (25) 86 (21)
Mean difference: 12.00 (–4.52, 28.52);
NS
Duration of surgery (minutes) Median (IQR)
Damgaard (2006)(25) Off-CPB CABG 165 (135 to 186) 150 (135 to 188) Mean difference:
NR; P=0.39 AAA, abdominal aortic aneurysm; CABG, coronary artery bypass graft; CI, confidence interval; CPB, cardiopulmonary bypass; ICU; intensive care unit; IQR, interquartile range; NR, not reported; NS, not significant; RR, relative risk; SD, standard deviation. a Specifically patients with penetrating torso injury requiring a laparotomy and who had exhibited hypotension either pre-hospital or on arrival and in whom there was considered significant blood loss. b Refers specifically to bypass time.
Level III evidence As no evidence for quality of life was captured in the Level I or II evidence, a specific quality-of-life search for Level III evidence for intraoperative cell salvage was conducted. No relevant Level III studies were found.
Level IV evidence As no evidence for quality of life was captured in the Level I or II evidence, a specific quality-of-life search for Level IV evidence for intraoperative cell salvage was conducted. No relevant Level IV studies were found.
Published economic evaluations The literature search identified two economic analyses of interventions relevant to intraoperative cell salvage(22;34). Davies (2006)(22) conducted a systematic review to

Technical report on perioperative patient blood management – Volume 1b July 2011 52
examine the cost-effectiveness of the use of cell salvage and other methods to minimise perioperative allogeneic blood transfusion. Haynes (2002)(34) conducted a cost-analysis for the use of cell salvage and ANH during aortic surgery. Both studies were conducted in the UK.
The cost inputs in both economic evaluations are not applicable to the Australian setting in the context of the national blood arrangements.
Davies 2006 The systematic review by Davies (2006)(22) identified seven papers that conducted economic evaluations on the use of cell salvage and other methods to minimise perioperative allogeneic blood transfusion.
Of the seven studies, four conducted cost-utility analysis and reported cost per quality adjusted life year (QALY) saved, and three conducted cost-effectiveness analyses and reported the cost-per-life-year-gained.
Cell salvage versus allogeneic blood transfusion Two studies compared the use of cell salvage versus allogeneic blood transfusion. One study reported that the use of cell salvage during cardiac surgery was associated with reduced cost (US$55) and reduced the need for allogeneic blood transfusion by 54%. Another study indicated that post-arthroplasty RBC salvage was not cost effective in preventing viral complications of allogeneic transfusion, with a cost per QALY of US$5.7 million.
Preoperative autologous donation versus allogeneic blood transfusion Six studies compared the use of preoperative autologous donation (PAD) versus allogeneic blood transfusion during cardiac or hip surgical procedures.
Three studies indicated that PAD was not cost effective, with cost per QALY ranging from US$235,000 to US$1,784,946. In contrast, three other studies indicated that PAD was cost effective. These studies assumed an increased risk of infection with allogeneic transfusion. The cost per QALY ranged from US$532 to US$2750.
Results of economic model An economic model was developed to assess the costs, effectiveness and net benefit of cell salvage compared with allogeneic blood transfusion and other alternative transfusion strategies (antifibrinolytics, PAD, ANH).
As shown in Table 2.8, cell salvage was associated with lower cost and slightly higher QALYs compared with allogeneic blood transfusion and antifibrinolytics. Compared to ANH, cell salvage was associated with higher cost and a higher QALY. In contrast, cell salvage was associated with a lower cost and lower QALY compared to PAD. It is important to note that the estimates for expected cost and/or QALY include the null value (0). Consequently, differences between treatment strategies may not be statistically significantly.
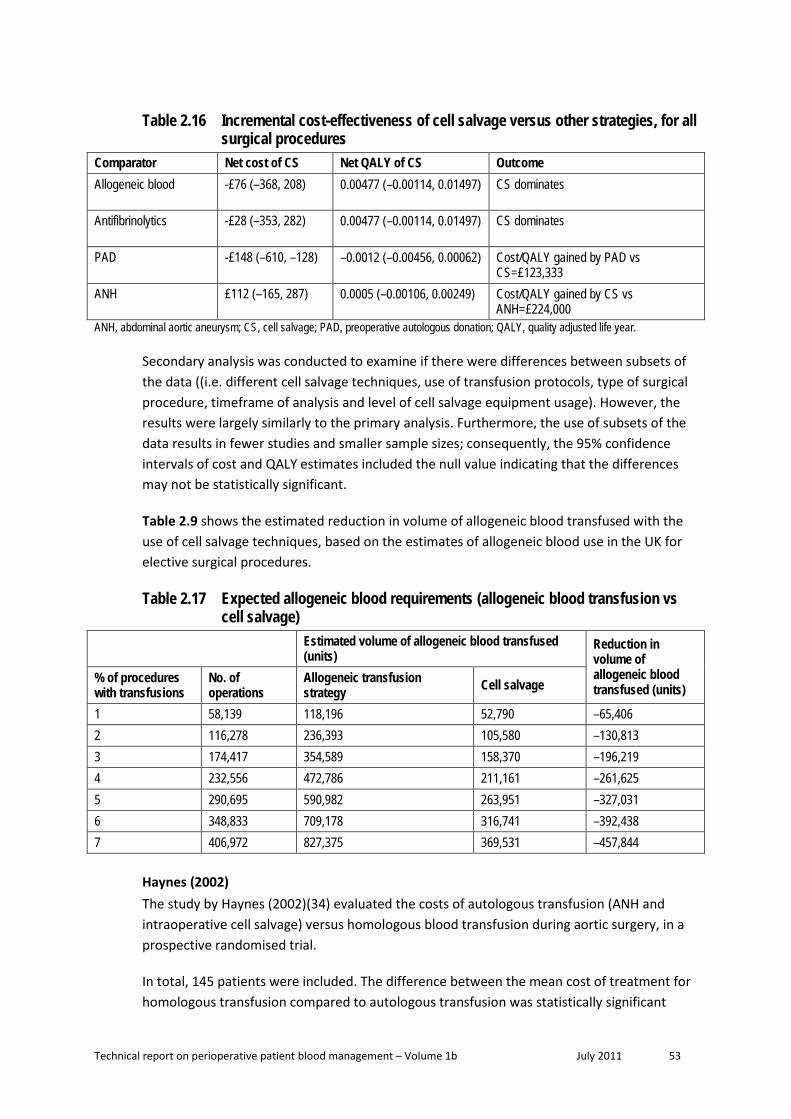
Technical report on perioperative patient blood management – Volume 1b July 2011 53
Table 2.16 Incremental cost-effectiveness of cell salvage versus other strategies, for all surgical procedures
Comparator Net cost of CS Net QALY of CS Outcome Allogeneic blood -£76 (–368, 208) 0.00477 (–0.00114, 0.01497)
CS dominates
Antifibrinolytics -£28 (–353, 282) 0.00477 (–0.00114, 0.01497)
CS dominates
PAD -£148 (–610, –128) –0.0012 (–0.00456, 0.00062)
Cost/QALY gained by PAD vs CS=£123,333
ANH £112 (–165, 287) 0.0005 (–0.00106, 0.00249)
Cost/QALY gained by CS vs ANH=£224,000
ANH, abdominal aortic aneurysm; CS, cell salvage; PAD, preoperative autologous donation; QALY, quality adjusted life year.
Secondary analysis was conducted to examine if there were differences between subsets of the data ((i.e. different cell salvage techniques, use of transfusion protocols, type of surgical procedure, timeframe of analysis and level of cell salvage equipment usage). However, the results were largely similarly to the primary analysis. Furthermore, the use of subsets of the data results in fewer studies and smaller sample sizes; consequently, the 95% confidence intervals of cost and QALY estimates included the null value indicating that the differences may not be statistically significant.
Table 2.9 shows the estimated reduction in volume of allogeneic blood transfused with the use of cell salvage techniques, based on the estimates of allogeneic blood use in the UK for elective surgical procedures.
Table 2.17 Expected allogeneic blood requirements (allogeneic blood transfusion vs cell salvage)
Estimated volume of allogeneic blood transfused (units)
Reduction in volume of allogeneic blood transfused (units)
% of procedures with transfusions
No. of operations
Allogeneic transfusion strategy Cell salvage
1 58,139 118,196 52,790 –65,406 2 116,278 236,393 105,580 –130,813 3 174,417 354,589 158,370 –196,219 4 232,556 472,786 211,161 –261,625 5 290,695 590,982 263,951 –327,031 6 348,833 709,178 316,741 –392,438 7 406,972 827,375 369,531 –457,844
Haynes (2002) The study by Haynes (2002)(34) evaluated the costs of autologous transfusion (ANH and intraoperative cell salvage) versus homologous blood transfusion during aortic surgery, in a prospective randomised trial.
In total, 145 patients were included. The difference between the mean cost of treatment for homologous transfusion compared to autologous transfusion was statistically significant

Technical report on perioperative patient blood management – Volume 1b July 2011 54
(£5859 vs £5384). The majority of the total cost was due to intensive care and ward stays, while transfusion only accounted for 6–7% of the total cost. The difference in cost relating to transfusion was not statistically significant (MD: £17; 95%CI: –184, 174).
The study also compared the cost of three different cell salvage devices, namely: Haemonetics Cell® Saver 5®, Cobe® BRAT® 2 and Fresenius CATS. However, the difference in capital, disposable and maintenance cost for the three devices did not differ significantly. As shown in Table 2.10, sensitivity analysis for the usage of the cell salvage device and the provision of a cell salvage operator indicated a change in the cost savings. However, these differences did not attain statistical significance.
Table 2.18 Sensitivity analysis of device usage and provision of cell salvage operator: autologous versus homologous transfusion
Activity (operations per year) Mean difference (£)
With cell salvage operator
20 –321 (–2391, 1391)
50 –475 (–2231, 1342)
150 –514 (–2315, 1147)
Without cell salvage operator
20 –361 (–2254, 1274)
50 –495 (–2406, 1170)
150 –555 (–2423, 1202)

Technical report on perioperative patient blood management – Volume 1b July 2011 55
3 Perioperat ive acute normovolemic haemodilut ion combined w ith intraoperat ive cel l salvage
Methods
The systematic review process identified no Level I evidence relevant to this research question. A literature search for Level II evidence identified two relevant RCTs examining the effect of ANH and intraoperative cell salvage.
No socioeconomic literature pertaining to Australia’s Indigenous population was identified in the literature search for this research question.
One published economic evaluation on the use of ANH and intraoperative cell salvage for minimising blood loss was identified in the literature search (Haynes [2006]). A brief summary of the findings of this report was presented after the review of the clinical evidence for intraoperative cell salvage (see Section 2).
Level I evidence No systematic reviews of Level II evidence examining the effect of combined perioperative ANH and intraoperative cell salvage on mortality, morbidity and the need for allogeneic blood transfusion were identified by the literature search.
Level II evidence A literature search of Level II studies identified two RCTs examining the effect of combined perioperative ANH and intraoperative cell salvage during surgery to reduce mortality, morbidity and transfusion rate(35;36). The search also identified an economic analysis that included unreported outcomes from the Wong (2002)(34) trial. The main characteristics of the included studies are summarised in Table 3.1.
Wong (2002)(36) compared patients who received ANH and intraoperative cell salvage with patients who only received allogeneic blood transfusion. McGill (2002)(35) compared three study arms: ANH combined with intraoperative cell salvage, intraoperative cell salvage alone, and neither intraoperative cell salvage nor ANH. Both studies were conducted in UK hospitals.

Technical report on perioperative patient blood management – Volume 1b July 2011 56
Table 3.1 Characteristics and quality of Level II evidence for combined ANH and intraoperative cell salvage
Author (Year)
Study type Study quality
Population Outcomes
Haynes (2002)(34)
Economic analysis of Wong (2002) a
Fair
See Wong (2002) Length of ICU stay Cost Operative time
McGill (2002)(35) RCT Fair
Cardiac surgery in a UK hospital setting. (N=254; 86 ANH + intraoperative cell salvage; 84 intraoperative cell salvage alone; 84 no mechanical blood conservation)
Transfusion incidence Transfusion volume Hb concentration Length of hospital/ICU stay Operative time Morbidity
Wong (2002)(36) RCT Fair
Aortic surgery in a UK hospital setting. (N=145; 74 ANH and intraoperative cell salvage; 71 control)
Transfusion incidence Transfusion volume Change in Hb Length of hospital/ICU stay Morbidity Mortality
ANH, acute normovolemic haemodilution; Hb, haemoglobin; ICU, intensive care unit; RCT, randomised controlled trial. a Although Haynes (2002) is only an economic analysis, the paper includes clinical outcomes not reported in Wong (2002) including operative time and length of ICU stay.
The RCT results are summarised in Table 3.2. The relevant outcomes assessed include operative blood loss, transfusion requirements, haemoglobin concentration, mortality, morbidity, length of hospital/ICU stay and duration of surgery.
Operative blood loss Wong (2002)(36) found no significant difference in median intraoperative blood loss between patients who received ANH with intraoperative cell salvage and control (MD: NR; P=0.37). McGill (2002) did not report operative blood loss.
Incidence and volume of transfusion McGill (2002)(35) found that ANH combined with intraoperative cell salvage significantly reduced the incidence of allogeneic blood transfusion compared with no mechanical blood conservation (34% vs 51%; RR 0.66; 95%CI: 0.46, 0.95; P=0.02). The mean units of allogeneic blood transfused was also significantly lower in the group of patients who received ANH combined with intraoperative cell salvage (0.63 ± 1.22 vs 1.07 ± 1.56; P=0.04). There was no significant difference in the incidence or volume of allogeneic blood transfusion when ANH combined with intraoperative cell salvage was compared with intraoperative cell salvage alone. Transfusion requirements (both incidence and volume) for FFP and platelets were similar between the three study arms.
Wong (2002)(36) found no significant difference between ANH combined with intraoperative cell salvage and control in the incidence of transfusion (RR 0.77; 95%CI: 0.55, 10.07), but

Technical report on perioperative patient blood management – Volume 1b July 2011 57
found that ANH with intraoperative cell salvage was associated with a significant reduction in median units of allogeneic blood transfused compared with control (median [IQR]: 0 [0 to 2] vs 2 [0 to 4]).
Haemoglobin concentration Although McGill (2002)(35) reported the median values for preoperative and postoperative haemoglobin concentration, the authors did not conduct a statistical comparison of intervention arms. The median haemoglobin concentrations were similar between the intervention arms preoperatively (ANH + cell salvage vs cell salvage vs control [g/dL]: 145 vs 145 vs 142), on admission to ICU (108 vs 105 vs 100), 24 hours after surgery (105 vs 104 vs 100) and three days after surgery (108 vs 105 vs 106).
Mortality Wong (2002)(36) found no significant difference in mortality rate between patients who received ANH combined with intraoperative cell salvage compared with control. McGill (2002)(35) did not report any deaths.
Morbidity In the McGill (2002)(35) study, there was no significant difference between the three intervention groups in the rate of perioperative complications. Specifically, there was no significant difference in haemorrhagic complications, cerebrovascular accidents, arrhythmia, renal failure, infection and MI. Wong (2002)(36) found no significant difference in infection, minor transfusion reaction, or cardiac events.
Length of hospital/ICU stay There was no significant difference in the length of hospital or ICU stay between the intervention groups for either of the RCTs.
Duration of surgery There was no significant difference in duration of surgery between the intervention groups for either of the RCTs.
Table 3.2 Results for Level II evidence: Perioperative ANH and intraoperative cell salvage
Author (year) Surgical
procedure Outcome
ANH and intraoperative cell
salvage
No ANH/intraoperative
cell salvage Statistical analysis
McGill (2002)(35) Cardiac surgery Patients transfused
with any allogeneic blood product (n/N
[%]) 33/86 (38%)
Cell salvage: 32/84 (38%)
Control: 47/84 (56%)
vs cell salvage RR (95%CI): 1.01 (0.69, 1.48);
P=0.97 vs control
RR (95%CI): 0.69 (0.49, 0.95); P=0.02

Technical report on perioperative patient blood management – Volume 1b July 2011 58
Author (year) Surgical
procedure Outcome
ANH and intraoperative cell
salvage
No ANH/intraoperative
cell salvage Statistical analysis
Patients transfused with allogeneic blood (n/N [%])
29/86 (34%)
Cell salvage: 26/84 (31%)
Control: 43/84 (51%)
vs cell salvage RR (95%CI): 1.09 (0.70, 1.68);
P=0.70 vs control
RR (95%CI): 0.66 (0.46, 0.95); P=0.02
Units of allogeneic blood transfused during surgery a
(mean [SD]) 0.63 (1.22)
cell salvage – 0.68 (1.55)
control – 1.07 (1.56)
vs cell salvage Mean difference: –0.05 (–0.47,
0.37); P=0.82 vs control
Mean difference: –0.44 (–0.86, –0.02); P=0.04
Patients transfused with FFP (n/N [%]) 13/86 (15%)
Cell salvage: 14/84 (17%)
Control: 13/84 (15%)
vs cell salvage RR (95%CI): 0.91 (0.45, 1.81);
P=0.78 vs control
RR (95%CI): 0.98 (0.48, 1.98); P=0.95
Units of FFP transfused (mean
[SD]) 0.43 (1.12)
Cell salvage: 0.57 (1.47)
Control: 0.49 (1.25)
vs cell salvage Mean difference: –0.14 (–0.53,
0.25); P=0.49 vs control
Mean difference: –0.06 (–0.42, 0.30); P=0.74
Patients transfused with platelets (n/N
[%]) 15/86 (17%)
Cell salvage: 11/84 (13%)
Control: 15/84 (18%)
vs cell salvage RR (95%CI): 1.33 (0.65, 2.73);
P=0.43 vs control
RR (95%CI): 0.98 (0.51, 1.87); P=0.94
Units of platelets transfused (mean
[SD]) 0.31 (0.81)
Cell salvage: 0.20 (0.62)
Control: 0.29 (0.67)
vs cell salvage Mean difference: 0.11 (–0.11,
0.33); P=0.32 vs control
Mean difference: 0.02 (–0.20, 0.24); P=0.86
Preoperative Hb concentration
(median [IQR]), g/dL
145 (138 to 150) Cell salvage: 145
(136 to 150) Control: 142 (135 to
150) NR
Hb concentration on admission to ICU
(median [IQR]), g/dL
108 (99 to 116) Cell salvage: 105
(98 to 116) Control: 100 (91 to
107) NR
Hb concentration 24 hours after surgery (median [IQR]), g/dL
105 (96 to 113) Cell salvage: 104
(95 to 115) Control: 100 (94 to
109) NR

Technical report on perioperative patient blood management – Volume 1b July 2011 59
Author (year) Surgical
procedure Outcome
ANH and intraoperative cell
salvage
No ANH/intraoperative
cell salvage Statistical analysis
Hb concentration 3 days after surgery
(median [IQR]), g/dL
108 (100 to 119)
Cell salvage: 105 (98 to 115)
Control: 106 (98 to 112)
NR
Morbidity: all perioperative
complications (n/N [%])
46/86 (53%)
Cell salvage: 46/84 (55%)
Control: 42/84 (50%)
vs cell salvage RR (95%CI): 0.98 (0.74, 1.29);
P=0.87 vs control
RR (95%CI): 1.07 (0.80; 1.43); P=0.65
Morbidity: inotropes required after
24 hours (n/N [%]) 11/86 (13%)
Cell salvage: 12/84 (14%)
Control: 9/84 (11%)
vs cell salvage RR (95%CI): 0.90 (0.42, 1.92);
P=0.78 vs control
RR (95%CI): 1.19 (0.52, 2.73); P=0.68
Morbidity: haemorrhagic
complications (n/N [%])
2/86 (2%) Cell salvage: 2/84
(2%) Control: 3/84 (4%)
vs cell salvage RR (95%CI): 0.98 (0.14, 6.77);
P=0.98 vs control
RR (95%CI): 0.65 (0.11, 3.80); P=0.63
Morbidity: cerebrovascular
accident (n/N [%]) 1/86 (1%)
Cell salvage: 1/84 (1%)
Control: 2/84 (2%)
vs cell salvage RR (95%CI): 0.98 (0.06, 15.36);
P=0.99 vs control
RR (95%CI): 0.49 (0.05, 5.29); P=0.56
Morbidity: arrhythmias (n/N
[%]) 20/86 (23%)
Cell salvage: 17/84 (20%)
Control: 27/84 (32%)
vs cell salvage RR (95%CI): 1.15 (0.65, 2.04);
P=0.63 vs control
RR (95%CI): 0.72 (0.44, 1.19); P=0.20
Morbidity: renal failure (n/N [%]) 2/86 (2%)
Cell salvage: 1/84 (1%)
Control: 0/84 (0%)
vs cell salvage RR (95%CI): 1.95 (0.18, 21.14);
P=0.58 vs control
RR (95%CI): 4.89 (0.24, 100.26); P=0.30
Morbidity: infection (n/N [%]) 7/86 (8%)
Cell salvage: 11/84 (13%)
Control: 7/84 (8%)
vs cell salvage RR (95%CI): 0.62 (0.25, 1.53);
P=0.30 vs control
RR (95%CI): 0.98 (0.36, 2.66); P=0.96

Technical report on perioperative patient blood management – Volume 1b July 2011 60
Author (year) Surgical
procedure Outcome
ANH and intraoperative cell
salvage
No ANH/intraoperative
cell salvage Statistical analysis
Morbidity: MI (n/N [%]) 4/84 (5%)
Cell salvage: 5/84 (6%)
Control: 10/84 (12%)
vs cell salvage RR (95%CI): 0.80 (0.22, 2.88);
P=0.73 RR (95%CI): 0.40 (0.13, 1.23);
P=0.11
Length of hospital stay (median [IQR]),
days 170 (147.1 to 221.6)
Cell salvage: 160.7 (145.5 to 198.8) Control: 168.9
(140.3 to 219.3)
Kruskal-Wallis P-value=0.724
Length of ICU stay (median [IQR]),
days 23.3 (22.5 to 25.0)
Cell salvage: 22.7 (22.0 to 24.6)
Control: 22.9 (21.8 to 24.5)
Kruskal-Wallis P-value=0.249
Duration of surgery (median [IQR],
minutes 154 (131 to 174)
Cell salvage: 160 (140 to 184)
Control: 160 (135 to 196)
NR
Wong (2002)(36) Aortic surgery
Units of blood withdrawn during ANH (mean [SD])
1.66 (0.71) NA NA
Intraoperative blood loss (median [IQR]), mL
921 (661 to 1374) 1000 (688 to 1734) Mean difference: NR; P=0.37
Packed red cell volume reinfused after cell salvage (mean [SD]), mL
415 (225 to 543) b NA NA
Patients transfused with allogeneic blood during
surgery (n/N [%]) 32/74 (43%) 40/71 (56%) RR (95%CI): 0.77 (0.55, 10.07);
P=0.12
Median units of allogeneic blood transfused during surgery (median
[IQR])
0 (0 to 2) 2 (0 to 4) Mean difference: NR; P=0.008
Total units of allogeneic blood transfused during
surgery (aneurysm patients) c
102 201 NR
Median units of allogeneic blood transfused during
surgery (for all occlusive disease
patients) d
0 (0 to 2) 0 (0 to 2) Mean difference: NR; P=0.87
Total units of allogeneic blood
transfused (occlusive disease
patients) d
15 50 NR

Technical report on perioperative patient blood management – Volume 1b July 2011 61
Author (year) Surgical
procedure Outcome
ANH and intraoperative cell
salvage
No ANH/intraoperative
cell salvage Statistical analysis
Mortality (n/N [%]) 13/74 (18%) 11/71 (15%) RR (95%CI): 1.13 (0.54, 2.36); P=0.91
Morbidity: infection (n/N [%]) 16/74 (22%) 19/71 (27%) RR (95%CI): 0.81 (0.45, 1.44);
P=0.6 Morbidity: minor
transfusion reaction (n/N [%])
0/74 (0%) 1/71 (1%) RR (95%CI): 0.32 (0.01, 7.73); P=0.48
Morbidity: cardiac events (n/N [%]) 13/74 (18%) 8/71 (11%) RR (95%CI): 1.56 (0.69, 3.53);
P=0.4 Morbidity:
haemorrhagic complications (n/N
[%]) 5/74 (7%) 8/71 (11%) RR (95%CI): 0.60 (0.21, 1.75);
P=0.35
Reoperation (n/N [%]) 10/74 (14%)e 7/71 (10%)r RR (95%CI): 1.37 (0.55, 3.40);
P=0.50 Length of hospital
stay (median [IQR]), days
10 (8 to 13) 9 (7 to 12) Mean difference: NR; P=0.17
Wong (2002) (via Haynes [2002](34)) Aortic surgery
Length of ICU stay (median [IQR]),
days 1 (0 to 25) 1 (0 to 25) Mean difference: NR; P=0.89
Duration of surgery (median [IQR]),
minutes 195 (162 to 238) 205 (170 to 231) Mean difference: NR; P = 0.86
ANH, acute normovolemic haemodilution; CI, confidence interval; FFP, fresh frozen plasma; Hb, haemoglobin; ICU, intensive care unit; IQR, interquartile range; MI, myocardial infarction; RR, relative risk; SD, standard deviation. a Nine patients needed a markedly higher amount of transfused blood (≥3 units). These patients were returned to the operating theatre for re-exploration of the mediastinum. A surgical cause of bleeding was found in seven of these patients (three in the control group and two each in the cell salvage and combined treatment groups). b Equivalent to more than one unit of allogeneic blood because the haematocrit of reinfused red cells was approximately 65%. c Two of the patients required a laparotomy (one for massive bleeding from the proximal aortic anastomosis, one for upper gastrointestinal haemorrhage). d Three patients had intraoperative bleeding and a further five required reoperation for intra-abdominal bleeding. e Five thromboembolectomies, two laparotomies for haemorrhage, two laparotomies for bowel obstruction, one groin resuturing. f Five required reoperation for intra-abdominal bleeding and two thromboembolectomies.
Level III evidence No Level III evidence was found that examined whether ANH with intraoperative cell salvage reduces mortality, morbidity and the need for allogeneic blood transfusion in patients undergoing surgery.
Level IV evidence There was no Level IV evidence found examining whether ANH with intraoperative cell salvage reduces mortality, morbidity and the need for allogeneic blood transfusion in patients undergoing surgery.
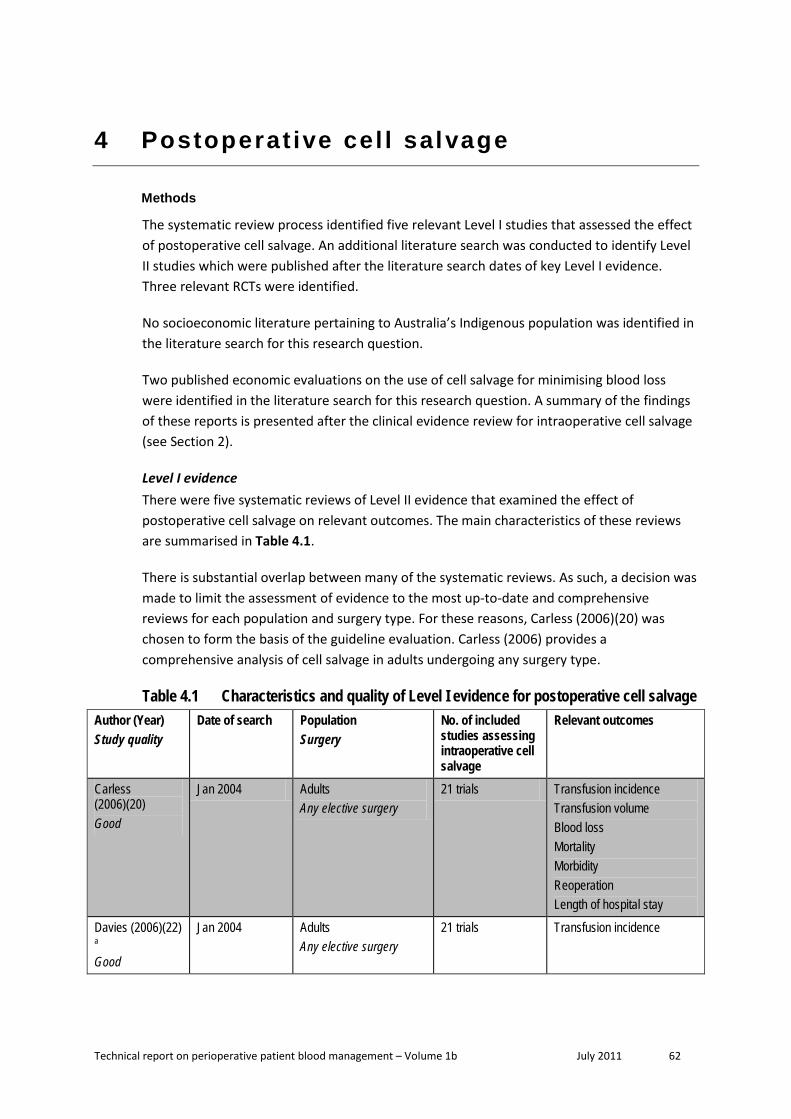
Technical report on perioperative patient blood management – Volume 1b July 2011 62
4 Postoperat ive cel l salvage
Methods
The systematic review process identified five relevant Level I studies that assessed the effect of postoperative cell salvage. An additional literature search was conducted to identify Level II studies which were published after the literature search dates of key Level I evidence. Three relevant RCTs were identified.
No socioeconomic literature pertaining to Australia’s Indigenous population was identified in the literature search for this research question.
Two published economic evaluations on the use of cell salvage for minimising blood loss were identified in the literature search for this research question. A summary of the findings of these reports is presented after the clinical evidence review for intraoperative cell salvage (see Section 2).
Level I evidence There were five systematic reviews of Level II evidence that examined the effect of postoperative cell salvage on relevant outcomes. The main characteristics of these reviews are summarised in Table 4.1.
There is substantial overlap between many of the systematic reviews. As such, a decision was made to limit the assessment of evidence to the most up-to-date and comprehensive reviews for each population and surgery type. For these reasons, Carless (2006)(20) was chosen to form the basis of the guideline evaluation. Carless (2006) provides a comprehensive analysis of cell salvage in adults undergoing any surgery type.
Table 4.1 Characteristics and quality of Level I evidence for postoperative cell salvage Author (Year) Study quality
Date of search Population Surgery
No. of included studies assessing intraoperative cell salvage
Relevant outcomes
Carless (2006)(20) Good
Jan 2004 Adults Any elective surgery
21 trials Transfusion incidence Transfusion volume Blood loss Mortality Morbidity Reoperation Length of hospital stay
Davies (2006)(22)
a
Good
Jan 2004 Adults Any elective surgery
21 trials Transfusion incidence

Technical report on perioperative patient blood management – Volume 1b July 2011 63
Author (Year) Study quality
Date of search Population Surgery
No. of included studies assessing intraoperative cell salvage
Relevant outcomes
Carless (2004)(5) Fair
Jul 2002 Adult Any
18 trials Transfusion incidence Transfusion volume Mortality Morbidity Reoperation
Duffy (1996)(37) Fair
NR Adults Any
1 trial Morbidity (infection)
Huet (1999)(23) Fair
December 1997 Adults Cardiac or orthopaedic surgery
6 trails Transfusion incidence
Note: Systematic reviews that form the basis of this evaluation are shown in dark shading (pivotal reviews). a Systematic update of Carless (2004); the outcome results were identical to Carless (2006).
The outcomes assessed in the Carless (2006)(20) systematic review include blood loss, incidence of allogeneic blood transfusion, volume of blood transfused, mortality, morbidity, rate of reoperation and length of hospital stay. None of the other systematic reviews in Table 4.1 included outcomes that were not assessed in Carless (2006). None of the systematic reviews reported on quality of life, correction/prevention of disseminated intravascular coagulation (DIC) and coagulopathy, ICU admission, length of ICU stay, or hospital readmission. Table 4.2 summarises the clinical outcomes from Carless (2006).
Transfusion requirements Carless (2006)(20) reported that postoperative cell salvage significantly decreased the proportion of individuals requiring allogeneic blood transfusion for cardiac surgery (10 trials; 62% vs 75%; RR 0.86; 95%CI: 74, 1.00), orthopaedic surgery (8 trials; 15% vs 56%; RR 0.31; 95%CI: 0.19, 0.50) and both surgery types combined (18 trials; 39% vs 65%; RR 0.60; 95%CI: 0.46, 0.79). The proportion requiring transfusion was significant in the studies with a transfusion protocol (15 trials; 40% vs 63%; RR 0.66; 95%CI: 0.51, 0.86) but not the ones without a transfusion protocol (3 trials; 33% vs 77%; RR 0.14; 95%CI: 0.00, 4.48).
Postoperative cell salvage also significantly decreased the mean units of allogeneic blood transfused for cardiac surgery (7 trials; MD: [units] –0.83; 95%CI: –1.25, –0.40), orthopaedic surgery (2 trials; MD: [units] –0.80; 95%CI: –1.17, –0.43) and both surgery types combined (9 trials; MD: [units] –0.82; 95%CI: –1.12, –0.51)(20). The relationship remained significant, whether transfusion protocol was used or not.
Mortality There was no significant relationship between use of postoperative cell salvage and mortality (5 trials; 3% vs 2%; RR 1.64; 95%CI: 0.52, 5.17)(20).
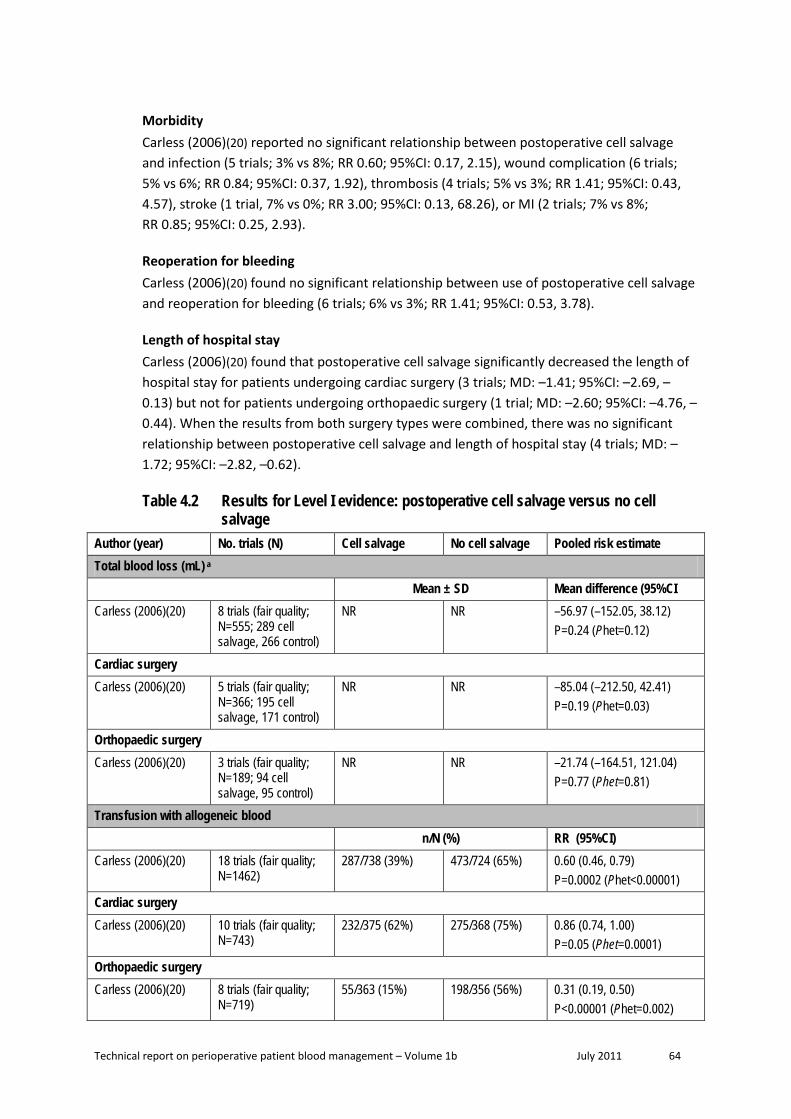
Technical report on perioperative patient blood management – Volume 1b July 2011 64
Morbidity Carless (2006)(20) reported no significant relationship between postoperative cell salvage and infection (5 trials; 3% vs 8%; RR 0.60; 95%CI: 0.17, 2.15), wound complication (6 trials; 5% vs 6%; RR 0.84; 95%CI: 0.37, 1.92), thrombosis (4 trials; 5% vs 3%; RR 1.41; 95%CI: 0.43, 4.57), stroke (1 trial, 7% vs 0%; RR 3.00; 95%CI: 0.13, 68.26), or MI (2 trials; 7% vs 8%; RR 0.85; 95%CI: 0.25, 2.93).
Reoperation for bleeding Carless (2006)(20) found no significant relationship between use of postoperative cell salvage and reoperation for bleeding (6 trials; 6% vs 3%; RR 1.41; 95%CI: 0.53, 3.78).
Length of hospital stay Carless (2006)(20) found that postoperative cell salvage significantly decreased the length of hospital stay for patients undergoing cardiac surgery (3 trials; MD: –1.41; 95%CI: –2.69, –0.13) but not for patients undergoing orthopaedic surgery (1 trial; MD: –2.60; 95%CI: –4.76, –0.44). When the results from both surgery types were combined, there was no significant relationship between postoperative cell salvage and length of hospital stay (4 trials; MD: –1.72; 95%CI: –2.82, –0.62).
Table 4.2 Results for Level I evidence: postoperative cell salvage versus no cell salvage
Author (year) No. trials (N) Cell salvage No cell salvage Pooled risk estimate Total blood loss (mL) a Mean ± SD Mean difference (95%CI Carless (2006)(20) 8 trials (fair quality;
N=555; 289 cell salvage, 266 control)
NR NR –56.97 (–152.05, 38.12) P=0.24 (Phet=0.12)
Cardiac surgery
Carless (2006)(20) 5 trials (fair quality; N=366; 195 cell salvage, 171 control)
NR NR –85.04 (–212.50, 42.41) P=0.19 (Phet=0.03)
Orthopaedic surgery
Carless (2006)(20) 3 trials (fair quality; N=189; 94 cell salvage, 95 control)
NR NR –21.74 (–164.51, 121.04) P=0.77 (Phet=0.81)
Transfusion with allogeneic blood n/N (%) RR (95%CI) Carless (2006)(20) 18 trials (fair quality;
N=1462) 287/738 (39%) 473/724 (65%) 0.60 (0.46, 0.79)
P=0.0002 (Phet<0.00001) Cardiac surgery Carless (2006)(20) 10 trials (fair quality;
N=743) 232/375 (62%) 275/368 (75%) 0.86 (0.74, 1.00)
P=0.05 (Phet=0.0001) Orthopaedic surgery Carless (2006)(20) 8 trials (fair quality;
N=719) 55/363 (15%) 198/356 (56%) 0.31 (0.19, 0.50)
P<0.00001 (Phet=0.002)

Technical report on perioperative patient blood management – Volume 1b July 2011 65
Author (year) No. trials (N) Cell salvage No cell salvage Pooled risk estimate Studies with a transfusion protocol Carless (2006)(20) 15 trials (fair quality;
N=1137) 233/576 (40%) 348/561 (62%) 0.66 (0.51, 0.86)
P=0.002 (Phet<0.00001) Studies without a transfusion protocol Carless (2006)(20) 3 trials (fair quality;
N=179) 54/162 (33%) 125/163 (77%) 0.14 (0.00, 4.48)
P=0.27 (Phet<0.00001) Mean units of allogeneic blood transfused a Mean ± SD Mean difference (95%CI) Carless (2006)(20) 9 trials (fair quality;
N=689; 355 cell salvage, 334 control)
NR NR –0.82 (–1.12, –0.51) P<0.00001 (Phet=0.03)
Cardiac surgery Carless (2006)(20) 7 trials (fair quality;
N=580; 301 cell salvage, 279 control)
NR NR –0.83 (–1.25, –0.40) P=0.0001 (Phet=0.01)
Orthopaedic surgery Carless (2006)(20) 2 trials (fair quality;
N=109; 54 cell salvage, 55 control)
NR NR –0.80 (–1.17, –0.43) P<0.0001 (Phet=1.00)
Studies with a transfusion protocol Carless (2006)(20) 6 trials (fair quality;
N=398; 203 cell salvage, 195 control)
NR NR –0.75 (–1.02, –0.47) P<0.00001 (Phet=0.09)
Studies without a transfusion protocol Carless (2006)(20) 3 trials (fair quality;
N=291; 152 cell salvage, 139 control)
NR NR –1.64 (–2.96, –0.33) P=0.01 (Phet=0.05)
Mortality a n/N (%) RR (95%CI) Carless (2006)(20) 5 trials b (fair quality;
N=471) 8/246 (3%) 4/225 (2%) 1.64 (0.52, 5.17)
P=0.40 (Phet=0.92) Morbidity: infection a n/N (%) RR (95%CI) Carless (2006)(20) 5 trials (fair quality;
N=429) 7/210 (3%) 17/219 (8%) 0.60 (0.17, 2.15)
P=0.43 (Phet=0.26) Cardiac surgery Carless (2006)(20) 3 trials (N=259) 4/125 (3%) 13/134 (10%) 0.51 (0.06, 4.29
P=0.53 (Phet=0.14) Orthopaedic surgery Carless (2006)(20) 2 trials (fair quality;
N=170) 3/85 (4%) 4/85 (5%) 0.78 (0.13, 4.48)
P=0.78 (Phet=0.28)
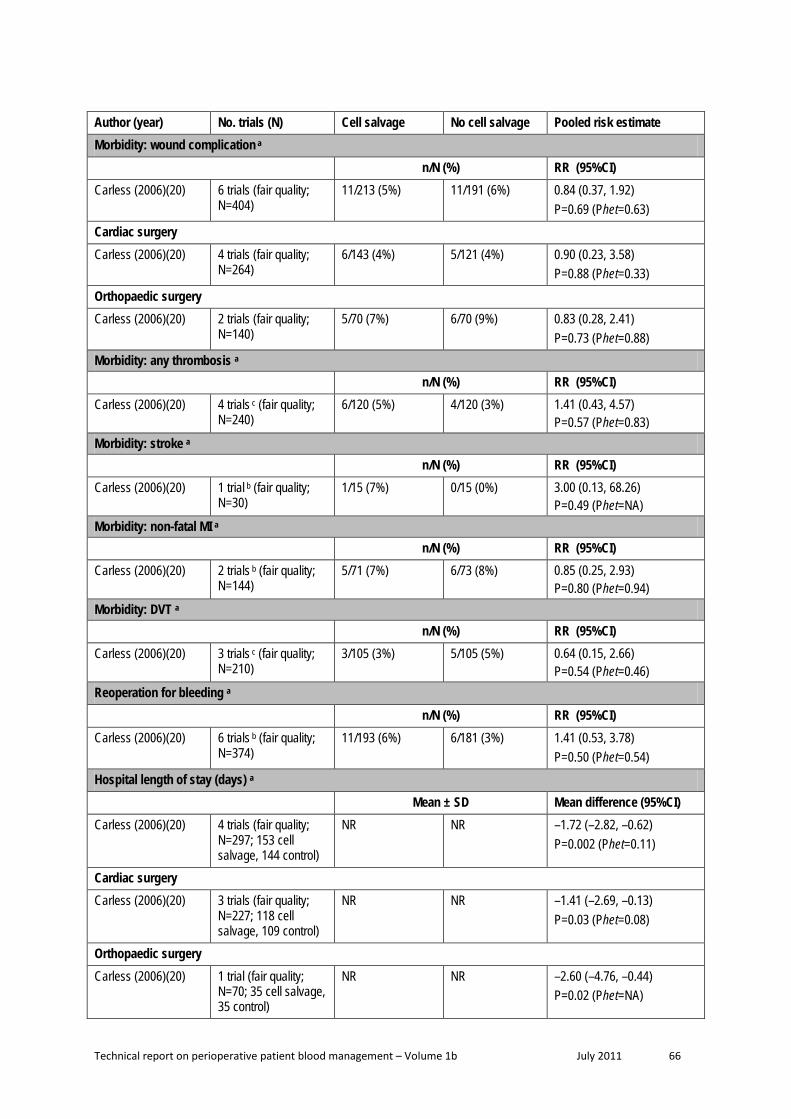
Technical report on perioperative patient blood management – Volume 1b July 2011 66
Author (year) No. trials (N) Cell salvage No cell salvage Pooled risk estimate Morbidity: wound complication a n/N (%) RR (95%CI) Carless (2006)(20) 6 trials (fair quality;
N=404) 11/213 (5%) 11/191 (6%) 0.84 (0.37, 1.92)
P=0.69 (Phet=0.63) Cardiac surgery Carless (2006)(20) 4 trials (fair quality;
N=264) 6/143 (4%) 5/121 (4%) 0.90 (0.23, 3.58)
P=0.88 (Phet=0.33) Orthopaedic surgery Carless (2006)(20) 2 trials (fair quality;
N=140) 5/70 (7%) 6/70 (9%) 0.83 (0.28, 2.41)
P=0.73 (Phet=0.88) Morbidity: any thrombosis a n/N (%) RR (95%CI) Carless (2006)(20) 4 trials c (fair quality;
N=240) 6/120 (5%) 4/120 (3%) 1.41 (0.43, 4.57)
P=0.57 (Phet=0.83) Morbidity: stroke a n/N (%) RR (95%CI) Carless (2006)(20) 1 trial b (fair quality;
N=30) 1/15 (7%) 0/15 (0%) 3.00 (0.13, 68.26)
P=0.49 (Phet=NA) Morbidity: non-fatal MI a n/N (%) RR (95%CI) Carless (2006)(20) 2 trials b (fair quality;
N=144) 5/71 (7%) 6/73 (8%) 0.85 (0.25, 2.93)
P=0.80 (Phet=0.94) Morbidity: DVT a n/N (%) RR (95%CI) Carless (2006)(20) 3 trials c (fair quality;
N=210) 3/105 (3%) 5/105 (5%) 0.64 (0.15, 2.66)
P=0.54 (Phet=0.46) Reoperation for bleeding a n/N (%) RR (95%CI) Carless (2006)(20) 6 trials b (fair quality;
N=374) 11/193 (6%) 6/181 (3%) 1.41 (0.53, 3.78)
P=0.50 (Phet=0.54) Hospital length of stay (days) a Mean ± SD Mean difference (95%CI) Carless (2006)(20) 4 trials (fair quality;
N=297; 153 cell salvage, 144 control)
NR NR –1.72 (–2.82, –0.62) P=0.002 (Phet=0.11)
Cardiac surgery Carless (2006)(20) 3 trials (fair quality;
N=227; 118 cell salvage, 109 control)
NR NR –1.41 (–2.69, –0.13) P=0.03 (Phet=0.08)
Orthopaedic surgery Carless (2006)(20) 1 trial (fair quality;
N=70; 35 cell salvage, 35 control)
NR NR –2.60 (–4.76, –0.44) P=0.02 (Phet=NA)

Technical report on perioperative patient blood management – Volume 1b July 2011 67
CI, confidence interval; DVT, deep vein thrombosis; het, heterogeneity; MI, myocardial infarction; NR, not reported; RR, relative risk; SD, standard deviation a Carless (2006) did not conduct meta-analyses for these outcomes specifically in studies assessing postoperative cell salvage. However, the results from Carless (2006) were sufficient to conduct meta-analyses herein. The classification of studies as ‘postoperative’ in the meta-analysis conducted herein is consistent with Analysis 3.5 (pg 122) of Carless (2006), which provides a forest plot for the effect of cell salvage on transfusion frequency with timing of salvage as subgroups. Four studies did not report transfusion frequency (and are therefore not listed in Analysis 3.5), but did report other relevant outcomes (Davies 1987; Ekback 1995; Schaff 1978; and Zhao 1996). Based on a review of the ‘Characteristics of the studies’ section of Carless (2006), three of these studies (Ekback 1995; Schaff 1978; and Zhao 1996) are categorised herein as ‘postoperative’. b All of the trials were in patients undergoing cardiac surgery. c All of the trials were in patients undergoing orthopaedic surgery.
Level II evidence A literature search was conducted to identify Level II studies published after the search date conducted in the Carless (2006)(20) systematic review. Three studies were identified and the main characteristics of these studies are summarised in Table 4.3.
Table 4.3 Characteristics and quality of Level II evidence for postoperative cell salvage
Author Study type Study quality
Population Setting
Relevant outcomes
Amin (2008)(38) RCT Fair
Patients over 55 years old undergoing TKA Setting in United Kingdom hospital (N=178; 92 cell salvage, 86 control)
Transfusion incidence Transfusion volume Hb concentration Morbidity Reoperation Length of hospital stay
Cheng (2005)(39) RCT Fair
TKA Hong Kong Hospital (N=60; 26 cell salvage, 34 control)
Transfusion incidence Transfusion volume Hb concentration Morbidity
Zacharopoulos (2007)(40)
RCT Poor
TKA. Study conducted in a rural Greek town of 8000 inhabitants. (N=60; 30 cell salvage, 30 control)
Transfusion incidence Hb concentration
Hb, haemoglobin; RCT, randomised controlled trial; TKA, total knee arthroplasty.
The results from these three RCTs are summarised in Table 4.4. The relevant outcomes assessed include transfusion requirements, haemoglobin concentration, morbidity, reoperation and length of hospital stay. All three of the included RCTs were in patients undergoing total knee arthroplasty (TKA).

Technical report on perioperative patient blood management – Volume 1b July 2011 68
Table 4.4 Results for Level II evidence: postoperative cell salvage versus no cell salvage
Author Surgical procedure Cell salvage No cell salvage Statistical significance
Operative blood loss, mL Median (IQR)
Cheng (2005)(39) TKA 273 (100 to 600) 280 (100 to 800) P=0.84
Drainage volume, mL Median (IQR)
Amin (2008)(38) TKA 659 (100 to 1900) 638 (86 to 1470) P=0.468
Volume of salvaged blood retransfused, mL Median (IQR)
Amin (2008)(38) TKA 481 (200 to 1110) NA NA
Cheng (2005)(39) TKA 425.2 (180 to 620) NA NA
Volume of salvaged blood retransfused, mL Mean (IQR)
Zacharopoulos (2007)(40) TKA 808 (300 to 1750) NR NR
Patients transfused with allogeneic blood n/N (%)
Amin (2008)(38) TKA 12/92 (13%) 13/86 (15%) RR (95%CI): 0.86 (0.42, 1.79);
P=0.69
Cheng (2005)(39) TKA 4/26 (15%) 13/34 (38%) RR (95%CI): 0.40 (0.15, 1.09);
P=0.07
Zacharopoulos (2007) (40) TKA 5/30 (17%) 10/30 (33%) RR (95%CI): 0.50 (0.19, 1.29);
P=0.15 Total units of allogeneic blood transfused N
Amin (2008)(38) TKA 22 26 NR
Units of allogeneic blood transfused Mean (SD)
Zacharopoulos (2007) (40) TKA 0.3 (NR) 1.5 (NR) NR
Units of allogeneic blood transfused Median (IQR)
Cheng (2005)(39) TKA 0.15 (0 to 1) 0.46 (0 to 4) P=0.033
Change in Hb concentration (pre- vs postoperative), g/dL Mean (SD)
Amin (2008)(38) TKA 2.2 (0.7) 2.6 (0.8) P=0.354

Technical report on perioperative patient blood management – Volume 1b July 2011 69
Author Surgical procedure Cell salvage No cell salvage Statistical significance
Zacharopoulos (2007)(40) TKA NR NR NS
Change in Hb concentration (pre- vs immediately postoperative), g/dL
Median (IQR)
Cheng (2005)(39) TKA 101 (84 to 128) 104 (87 to 137) P=0.332
Change in Hb concentration (pre- vs Day 3 postoperative), g/dL Median (IQR)
Cheng (2005)(39) TKA 98 (77 to 130) 101 (77 to 130) P=0.401
Change in haematocrit concentration (pre- vs postoperative), %
Mean (SD)
Zacharopoulos (2007)(40) TKA NR NR NS
Morbidity: wound infection n/N (%)
Amin (2008)(38) TKA 3/92 (3%) 2/86 (2%) RR (95%CI): 1.40 (0.24, 8.19);
P=0.71 Morbidity: infections other than wound infections n/N (%)
Amin (2008)(38) TKA 2/92 (2%) 2/86 (2%) RR (95%CI): 0.93 (0.13, 6.49);
P=0.95
Morbidity: DVT n/N (%)
Amin (2008)(38) TKA 1/92 (1%) 2/86 (2%) RR (95%CI): 0.47 (0.04, 5.06);
P=0.53
Length of hospital stay, days Median (IQR)
Amin (2008)(38) TKA 6.6 (3 to 14) 7.0 (3 to 16) P=0.54
CI, confidence interval; DVT, deep vein thrombosis; Hb, haemoglobin; IQR, interquartile range; NA, not applicable; NR, not reported; NS, not significant; RR, relative risk; SD, standard deviation; TKA, total knee arthroplasty
Incidence of transfusion None of the three studies published after the Carless (2006) systematic review found that postoperative cell salvage significantly decreases the proportion of patients requiring allogeneic blood transfusion, or the volume of allogeneic blood required.
A meta-analysis of the proportion of individuals transfused with allogeneic blood was conducted herein (Figure 4.1), combining the outcome data from Carless (2006) with the results from Amin (2008)(38), Cheng (2005)(39) and Zacharopoulos (2007)(40). The use of postoperative cell salvage resulted in a significant reduction in the incidence of transfusion in patients undergoing orthopaedic surgery (11 trials; 15% vs 46%; RR 0.37; 95%CI: 0.24, 0.55)

Technical report on perioperative patient blood management – Volume 1b July 2011 70
but not patients undergoing cardiac surgery (10 trials; 62% vs 75%; RR 0.86; 95%CI: 0.74, 1.00). There was significant heterogeneity in the results of the trials in both cardiac (Phet=0.00001; I2=73%) and orthopaedic patients (Phet=0.002; I2=65%).
Figure 4.1 Meta-analysis of incidence of transfusion by surgery type (postoperative cell salvage vs no cell salvage)
Study or Subgroup2.2.1 CardiacBouboulis 1994Dalrymple-Hay 1999Eng 1990Lepore 1989Naumenko 2003Schmidt 1996Shirvani 1991Unsworth 1996Ward 1993Zhao 2003Subtotal (95% CI)Total eventsHeterogeneity: Tau² = 0.04; Chi² = 33.63, df = 9 (P = 0.0001); I² = 73%Test for overall effect: Z = 1.96 (P = 0.05)
2.2.2 OrthopaedicAdalberth 1998Amin 2008Cheng 2005Heddle 1992Majowski 1991Newman 1997Rosencher 1994Sait 1999Shenolikar 1997Thomas 2001Zacharopoulos 2007Subtotal (95% CI)Total eventsHeterogeneity: Tau² = 0.28; Chi² = 28.28, df = 10 (P = 0.002); I² = 65%Test for overall effect: Z = 4.91 (P < 0.00001)
Total (95% CI)Total eventsHeterogeneity: Tau² = 0.24; Chi² = 201.77, df = 20 (P < 0.00001); I² = 90%Test for overall effect: Z = 3.98 (P < 0.0001)
Events
342817502
1520321519
232
8124
1073618
125
76
308
Total
42562067325321361830
375
249226392035206050
11530
511
886
Events
284617621
3121318
30
275
1013132719286
35403310
234
509
Total
33562068335621341730
368
258634402035106050
11630
506
874
Weight
6.5%6.3%6.4%6.6%1.0%5.4%6.7%6.6%5.2%6.3%
57.0%
4.3%4.3%3.3%5.0%4.9%3.0%3.9%1.3%4.7%4.9%3.5%
43.0%
100.0%
M-H, Random, 95% CI
0.95 [0.78, 1.17]0.61 [0.46, 0.81]1.00 [0.77, 1.30]0.82 [0.70, 0.96]
2.06 [0.20, 21.64]0.51 [0.31, 0.83]0.95 [0.84, 1.09]0.97 [0.83, 1.14]1.77 [1.03, 3.05]0.64 [0.49, 0.84]0.86 [0.74, 1.00]
0.83 [0.40, 1.75]0.86 [0.42, 1.79]0.40 [0.15, 1.09]0.38 [0.21, 0.68]0.37 [0.20, 0.68]0.11 [0.04, 0.32]0.50 [0.22, 1.16]0.03 [0.00, 0.20]0.20 [0.10, 0.38]0.37 [0.20, 0.67]0.50 [0.19, 1.29]0.37 [0.24, 0.55]
0.60 [0.47, 0.77]
Post-op cell salvage Control Risk Ratio Risk RatioM-H, Random, 95% CI
0.005 0.1 1 10 200Favours experimental Favours control
In studies that used transfusion protocols, postoperative cell salvage resulted in a significant decrease in the incidence of transfusion compared with no postoperative cell salvage (17 trials; 36% vs 55%; RR 0.66; 95%CI: 0.52, 0.85); however, there was no significant difference in studies where no transfusion protocol was used (4 trials; 31% vs 70%; RR 0.21; 95%CI: 0.03, 1.70; see Figure 4.2). There was significant heterogeneity between the results of both studies that used a transfusion protocol (Phet<0.00001; I2=87%) and those that did not (Phet<0.00001; I2=96%).

Technical report on perioperative patient blood management – Volume 1b July 2011 71
Figure 4.2 Meta-analysis of incidence of transfusion by transfusion protocol use (postoperative cell salvage vs no cell salvage)
Study or Subgroup2.15.1 Transfusion protocol usedAdalberth 1998Amin 2008Bouboulis 1994Cheng 2005Dalrymple-Hay 1999Eng 1990Heddle 1992Majowski 1991Naumenko 2003Rosencher 1994Schmidt 1996Shenolikar 1997Shirvani 1991Thomas 2001Unsworth 1996Ward 1993Zhao 2003Subtotal (95% CI)Total eventsHeterogeneity: Tau² = 0.19; Chi² = 127.58, df = 16 (P < 0.00001); I² = 87%Test for overall effect: Z = 3.29 (P = 0.001)
2.15.2 No transfusion protocolLepore 1989Newman 1997Sait 1999Zacharopoulos 2007Subtotal (95% CI)Total eventsHeterogeneity: Tau² = 4.26; Chi² = 72.75, df = 3 (P < 0.00001); I² = 96%Test for overall effect: Z = 1.47 (P = 0.14)
Total (95% CI)Total eventsHeterogeneity: Tau² = 0.24; Chi² = 201.77, df = 20 (P < 0.00001); I² = 90%Test for overall effect: Z = 3.98 (P < 0.0001)
Events
812344
281710726
158
2012321519
249
50315
59
308
Total
24924226562039203220535021
115361830
694
67356030
192
886
Events
101328134617271916
31402133318
30
374
62283510
135
509
Total
25863334562040203310565021
116341730
681
68356030
193
874
Weight
4.3%4.3%6.5%3.3%6.3%6.4%5.0%4.9%1.0%3.9%5.4%4.7%6.7%4.9%6.6%5.2%6.3%
85.6%
6.6%3.0%1.3%3.5%
14.4%
100.0%
M-H, Random, 95% CI
0.83 [0.40, 1.75]0.86 [0.42, 1.79]0.95 [0.78, 1.17]0.40 [0.15, 1.09]0.61 [0.46, 0.81]1.00 [0.77, 1.30]0.38 [0.21, 0.68]0.37 [0.20, 0.68]
2.06 [0.20, 21.64]0.50 [0.22, 1.16]0.51 [0.31, 0.83]0.20 [0.10, 0.38]0.95 [0.84, 1.09]0.37 [0.20, 0.67]0.97 [0.83, 1.14]1.77 [1.03, 3.05]0.64 [0.49, 0.84]0.66 [0.52, 0.85]
0.82 [0.70, 0.96]0.11 [0.04, 0.32]0.03 [0.00, 0.20]0.50 [0.19, 1.29]0.21 [0.03, 1.70]
0.60 [0.47, 0.77]
Experimental Control Risk Ratio Risk RatioM-H, Random, 95% CI
0.005 0.1 1 10 200Favours experimental Favours control
Haemoglobin concentration No difference between postoperative cell salvage and standard care in the change in haemoglobin from pre- to postoperative concentrations was observed in Amin (2008)(38) (mean [SD] 2.2 g/dL [0.7 vs 2.6 [0.8]; P=0.354), Zacharopoulos (2007)(40) (mean [SD] NR; P<0.05) and Cheng (2005)(39) (median [IQR] 101 g/dL [84 to 128] vs 104 [87 to 137]; P=0.332). Cheng (2005)(39) observed no difference between treatment arms in the change in haemoglobin concentration from preoperative to day 3 postoperative (median [IQR] 98 [77 to 130] vs 101 [77 to 130]; P=0.401). Zacharopoulos (2007)(40) found no difference between postoperative cell salvage and standard care in the change in haematocrit from pre- to postoperative concentration (mean [SD] NR; P<0.05).
Morbidity Amin (2008)(38) found no relationship between postoperative cell salvage and rates of wound infection (3% vs 2%; RR 1.40; 95%CI: 0.24, 8.19), infections other than wound

Technical report on perioperative patient blood management – Volume 1b July 2011 72
infection (2% vs 2%; RR 0.93; 95%CI: 0.13, 6.49) and DVT (1% vs 2%; RR 0.47; 95%CI: 0.04, 5.06).
Length of hospital stay Amin (2008)(38) found no difference between postoperative cell salvage and standard care in the length of hospital stay (median [IQR] 6.6 [3 to 14] vs 7.0 [3 to 16]). No other RCTs published after Carless (2006) reported this outcome.
Level III evidence As no evidence for quality of life was captured in the Level I or II evidence, a specific quality-of-life search for Level III evidence for postoperative cell salvage was conducted. No relevant Level III studies were found.
Level IV evidence As no evidence for quality of life was captured in the Level I or II evidence, a specific quality-of-life search for Level IV evidence for postoperative cell salvage was conducted. No relevant Level IV studies were found.

Technical report on perioperative patient blood management – Volume 1b July 2011 73
5 Del iberate induced hypotension
Methods
The systematic review process identified one Level I study which assessed the effect of deliberate induced hypotension on blood loss and transfusion volume in patients undergoing orthopaedic surgery. Due to the narrow focus of this study, an additional literature search was conducted to identify relevant Level II evidence which was not included in the Level I study. Ten RCTs examining the effect of deliberate induced hypotension during surgery were identified.
No socioeconomic literature pertaining to Australia’s Indigenous population was identified in the literature search for this research question.
No published economic evaluations on the use of deliberate induced hypotension for minimising blood loss were identified in the literature search for this research question.
Level I evidence One good quality systematic review assessing deliberate induced hypotension during orthopaedic surgery was identified by the literature search(41). The main characteristics of this review are summarised in Table 5.1.
Table 5.5 Characteristics and quality of Level I evidence for deliberate induced hypotension
Author (Year) Quality
Date of search
No. of trials included
Patient population / Characteristics? Relevant outcomes
Paul (2007)(41) Good
Up to 2006 17 RCTs Studies investigating the effects of deliberate induced hypotension (by any method) during anaesthesia in patients undergoing orthopaedic surgery.
Blood loss Transfusion volume Surgery duration
RCT, randomised controlled trial.
The identified systematic review, by Paul 2007(41), included 17 RCTs, of which 1 was double-blinded, 6 were single blinded and 10 were unblinded. A total of 636 subjects were included in the RCTs, 341 received deliberate hypotension and 295 controls. Sixteen of the 17 RCTs were assigned a Jadad quality index score of 3 or less (out of 5) by the authors of the Paul (2007)(41) review, reflecting the lack of blinding and absent description of a randomisation method in the majority of included studies. Only one RCT was assigned a perfect score of 5. None of the studies described whether or not there was adequate allocation concealment of patient randomisation.
The surgical population in the 17 RCTs included patients undergoing orthognathic surgery (eight studies), total hip arthroplasty (seven studies), total knee arthroplasty (one study) and spinal fusion (one study). Six methods of deliberate hypotension were investigated: sodium

Technical report on perioperative patient blood management – Volume 1b July 2011 74
nitroprusside, volatile anaesthetic, prostaglandin E1, epidural blockade, remifentanil and propranolol.
According to the authors of the systematic review(41), in the 16 studies that described the intraoperative blood pressure of the treatment group, the measured mean arterial blood pressure ranged from 48 to 78 mmHg. The remaining study reported that blood pressure was maintained within 75% of baseline values for the treatment group. Ten of the 17 RCTs did not have a transfusion protocol (the transfusion trigger was not reported in eight RCTs and was left to the discretion of the attending anaesthesiologist in two studies). The authors of the systematic review noted that several of the transfusion protocols were very conservative. In the seven studies that explicitly described the transfusion triggers, the triggers included volume of blood loss (300–400 mL), haematocrit thresholds (28–30%) and percentage of blood volume loss (20%).
The systematic review reported the results of meta-analyses for two relevant outcomes, namely intraoperative blood loss and transfusion volume(41). A meta-analysis was also conducted for duration of surgery. The results are shown in Table 5.2.
Table 5.6 Results for Level I evidence: induced hypotension vs no induced hypotension
Author Surgical procedure No. of trials in analysis (N) Treatment effect Statistical
significance
Volume of blood transfusion (mL)
Paul (2007)(41) Orthopaedic surgery 6 (N=222) WMD: –667 mL (95%CI: : –963, –370) NR
Blood loss (mL)
Paul (2007) (41) Orthopaedic surgery 17 (N=586) WMD: –286 mL (95%CI: : –447, –127) NR
Surgery duration (minutes)
Paul (2007) (41) Orthopaedic surgery 12 (N=439) WMD: –1.9 minutes (95%CI: : –7.2, 3.5) NR
CI, confidence intervals; NR, not reported; WMD, weighted mean difference.
Incidence of blood transfusion According to the Paul et al (2007) review(41), 3 of the 17 RCTs reported the number of patients who did and did not receive any blood transfusion. Based on these three RCTs (one in patients undergoing total hip arthroplasty, one in total knee arthroplasty and one in patients undergoing orthognathic surgery), the incidence of receiving a blood transfusion in the hypotensive groups was 55.8% vs 78.7% in the control groups. No further details were provided.

Technical report on perioperative patient blood management – Volume 1b July 2011 75
Volume of blood transfusion The systematic review by Paul et al (2007)(41) included six RCTs that reported transfusion volume in patients undergoing orthopaedic surgery with deliberate induced hypotension. Overall, transfusion requirements were significantly lower among patients with induced hypotension compared with those without (WMD: –667 mL; 95%CI: –963, –370). A random-effects model used as the test of heterogeneity was significant (P<0.05). This suggests that some of the variance between studies was due to differences in methods of inducing hypotension and the surgical procedures investigated.
Blood loss Paul et al (2007)(41) conducted a meta-analysis of 17 RCTs that reported volume of blood loss. The results showed a significant reduction in intraoperative blood loss among patients with induced hypotension, compared to patients with no induced hypotension during orthopaedic surgery (WMD: –286 mL; 95%CI: –447, –127). The authors reported that the reduction in blood loss was similar for low (score ≤3) vs high (score >3) quality studies and for older (pre–1990) vs newer (post–1990) studies.
Subgroup analyses showed that the significant effect was consistent across the different methods used to produce deliberate hypotension and for all surgical procedures except total knee arthroplasty(41). The authors acknowledged that caution is warranted when interpreting the results of subgroup analyses but reported that it appears that deliberate hypotension reduces blood loss most effectively for total hip arthroplasty (503 mL reduction), followed by spine fusion (318 mL reduction), with the smallest benefit seen in orthognathic surgery (147 mL reduction).
The authors noted significant heterogeneity (P<0.001) and suggested that some of the variance between studies may be due to differences in the surgery procedure examined and methods of inducing hypotension(41). They found significant heterogeneity (P<0.001) between subgroups of all surgery types except orthognathic surgery and for all hypotensive drugs except prostaglandin E1 (P<0.0001).
Mortality The systematic review by Paul et al (2007)(41) noted that none of the included RCTs were designed or powered sufficiently to assess patient harm. Of the nine RCTs that reported information on patient harm, there were no reported deaths.
Morbidity Of the nine RCTs that reported information on patient harm, there were no differences in the reported rates of cardiopulmonary, renal or hepatic complications between the hypotensive and control groups. The authors of the systematic review by Paul et al (2007)(41) noted that further study is required to clarify the potential harm of deliberate induced hypotension.
Surgery duration Paul et al (2007)(41) conducted a meta-analysis of 12 RCTs and found that the duration of surgery appeared to be shorter in the intervention group (WMD: –1.9 minutes; 95%CI: –7.2,
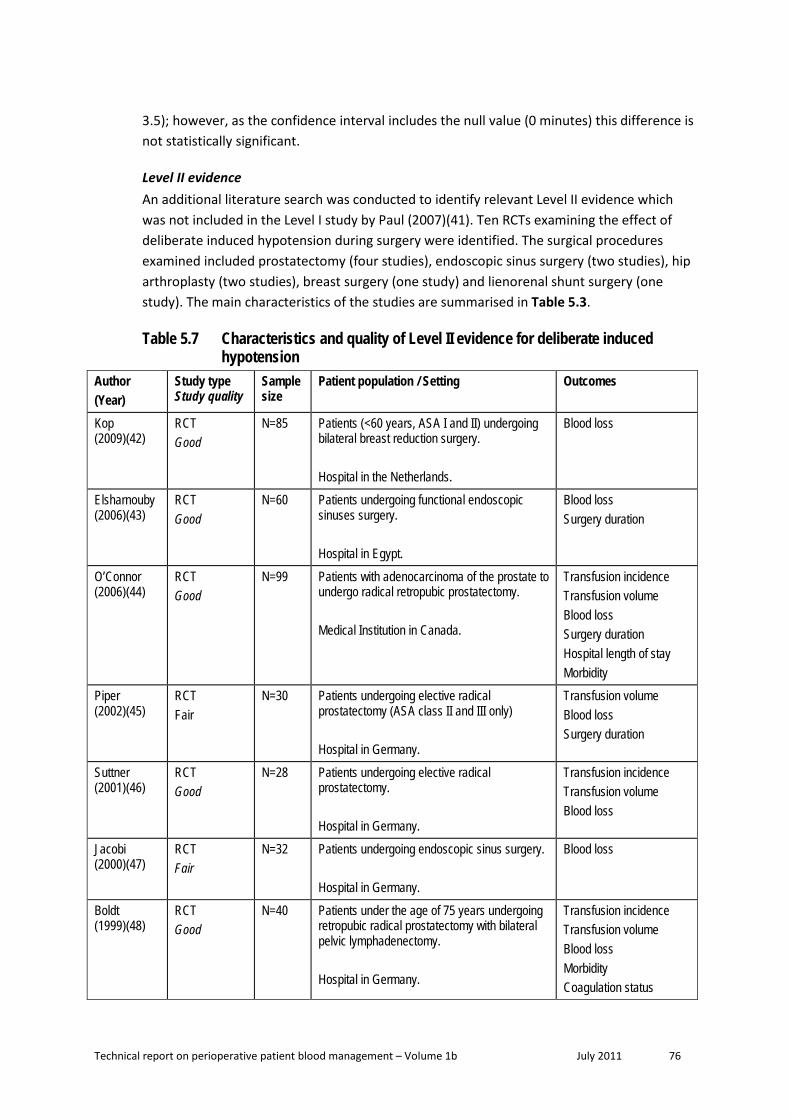
Technical report on perioperative patient blood management – Volume 1b July 2011 76
3.5); however, as the confidence interval includes the null value (0 minutes) this difference is not statistically significant.
Level II evidence An additional literature search was conducted to identify relevant Level II evidence which was not included in the Level I study by Paul (2007)(41). Ten RCTs examining the effect of deliberate induced hypotension during surgery were identified. The surgical procedures examined included prostatectomy (four studies), endoscopic sinus surgery (two studies), hip arthroplasty (two studies), breast surgery (one study) and lienorenal shunt surgery (one study). The main characteristics of the studies are summarised in Table 5.3.
Table 5.7 Characteristics and quality of Level II evidence for deliberate induced hypotension
Author (Year)
Study type Study quality
Sample size
Patient population / Setting Outcomes
Kop (2009)(42)
RCT Good
N=85 Patients (<60 years, ASA I and II) undergoing bilateral breast reduction surgery. Hospital in the Netherlands.
Blood loss
Elsharnouby (2006)(43)
RCT Good
N=60 Patients undergoing functional endoscopic sinuses surgery. Hospital in Egypt.
Blood loss Surgery duration
O’Connor (2006)(44)
RCT Good
N=99 Patients with adenocarcinoma of the prostate to undergo radical retropubic prostatectomy. Medical Institution in Canada.
Transfusion incidence Transfusion volume Blood loss Surgery duration Hospital length of stay Morbidity
Piper (2002)(45)
RCT Fair
N=30 Patients undergoing elective radical prostatectomy (ASA class II and III only) Hospital in Germany.
Transfusion volume Blood loss Surgery duration
Suttner (2001)(46)
RCT Good
N=28 Patients undergoing elective radical prostatectomy. Hospital in Germany.
Transfusion incidence Transfusion volume Blood loss
Jacobi (2000)(47)
RCT Fair
N=32 Patients undergoing endoscopic sinus surgery. Hospital in Germany.
Blood loss
Boldt (1999)(48)
RCT Good
N=40 Patients under the age of 75 years undergoing retropubic radical prostatectomy with bilateral pelvic lymphadenectomy. Hospital in Germany.
Transfusion incidence Transfusion volume Blood loss Morbidity Coagulation status

Technical report on perioperative patient blood management – Volume 1b July 2011 77
Author (Year)
Study type Study quality
Sample size
Patient population / Setting Outcomes
Karakaya (1999)(49)
RCT Fair
N=20 ASA class I and II patients undergoing primary total hip arthroplasty, performed via the posterior approach in the lateral decubitus position. Medical Institution in Turkey.
Transfusion volume Surgery duration Haemoglobin level
Sood (1987)(50)
RCT Fair
N=18 Patients undergoing elective, proximal, lienorenal shunts for portal hypertension. Hospital in India.
Transfusion volume Blood loss
Fredin (1984)(51)
RCT Fair
N=57 Patients undergoing total hip arthroplasty. Hospital in Sweden.
Transfusion volume Blood loss Morbidity
ASA, American Society for Anaesthesiology; RCT, randomised controlled trial.
Of the 10 RCTs identified, five were considered to be of good quality, while the remaining five were of fair quality. It is important to note that three publications were conducted at the same institution(45;46;48). However, based on the information provided in the publications it is not possible to determine if there was an overlap in the study populations. Consequently, the possible lack of independence should be considered when interpreting the results from these three studies. It is also important to note the modest sample sizes of some of the included studies (e.g. Sood (1987)(50) randomised 18 subjects), which would have limited their ability to detect significant differences between treatment arms.
The results from the included Level II studies are summarised in Table 5.4.
Table 5.8 Results for Level II evidence: induced hypotension versus no induced hypotension
Author Surgical procedure Induced hypotension No induced hypotension Statistical significance
Incidence of blood transfusion
Incidence of blood transfused n/N (%) O’Connor (2006)(44) Prostatectomy 2/49 (4%) 9/50 (18%) P=0.028
Piper (2002)(45) Prostatectomy 0/15 (0%) 4/15 (27%) P<0.05
Suttner (2001)(46) Prostatectomy 1/14 (7%) 7/14 (50%) P<0.05
Boldt (1999)(48) Prostatectomy 5/20 (25%) 12/20 (60%) P<0.05
Sood (1987)(50) Lienorenal shunt surgery 5/8 (63%) 10/10 (100%) NR

Technical report on perioperative patient blood management – Volume 1b July 2011 78
Author Surgical procedure Induced hypotension No induced hypotension Statistical significance
Volume of transfusion
Volume of blood transfused (units) Mean (SD)
Karakaya (1999)(49) Hip arthroplasty 2.3 (0.8) 2.7 (1.1) NS
Sood (1987)(50) Lienorenal shunt surgery 0.88 (0.9) 3.0 (1.2) P<0.01
Volume of blood transfused (mL) Mean (SD)
Fredin (1984)(51) Hip arthroplasty Intraoperative: 580 (390)
Total: 920 (580) 1210 (620)
1540 (1050) P<0.01 P<0.01
Total volume of RBC transfused (units) Total volume
O’Connor (2006)(44) Prostatectomy 3 24 NR
Piper (2002)(45) Prostatectomy 0 10 P<0.05
Suttner (2001)(46) Prostatectomy 3 17 P<0.05
Boldt (1999)(48) Prostatectomy 14 28 P<0.05
Blood loss
Blood loss (mL) Mean (SD) Elsharnouby (2006)(43)
Endoscopic sinus surgery 165 (19) 257 (21) P<0.05
O’Connor (2006)(44) Prostatectomy 955 (517) 1477 (823) P<0.001
Piper (2002)(45) Prostatectomy 843 (233) 1526 (409) P<0.05
Suttner (2001)(46) Prostatectomy 788 (193) 1335 (460) P<0.05
Jacobi (2000)(47) Endoscopic sinus surgery 278 (528) 245 (440) NS
Boldt (1999)(48) Prostatectomy 1260 (570) 1920 (590) P<0.05
Sood (1987)(50) Lienorenal shunt surgery 517 (220) 1286 (523) P<0.01
Fredin (1984)(51) Hip arthroplasty Intraoperative: 620 (240)
Total: 1170 (395) 1070 (630) 1700 (860)
P<0.001 P<0.01
Blood loss (mL) Mean (range)
Kop (2009)(42) Breast surgery 316 (133–560) 598 (250–1335) P<0.001

Technical report on perioperative patient blood management – Volume 1b July 2011 79
Author Surgical procedure Induced hypotension No induced hypotension Statistical significance
Morbidity
Serious adverse events (including death, myocardial infarction, stroke, renal impairment, DVT, PE) O’Connor (2006)(44) Prostatectomy 0 0 NA
Coagulation status
Boldt (1999)(48) Prostatectomy No significant difference between treatment groups NR
Incidence of DVT n/N (%)
Fredin (1984)(51) Hip arthroplasty 11/24 (46%) 10/26 (38%) NS
Incidence of PE n/N (%)
Fredin (1984)(51) Hip arthroplasty 6/26 (26%) 1/28 (4%) NS
Haemoglobin concentration
Effect on haemoglobin levels (g/dL) Mean (SD) Karakaya (1999)(49) Hip arthroplasty After intubation: 11.6 (0.4)
After operation: 9.2 (0.19)
11.9 (0.8) 9.7 (0.2)
NS
Piper (2002)(45) Prostatectomy Higher in intervention group than control group P<0.05
Coagulation status
aPTT (seconds) Mean time (SD)
Boldt (1999)(48) Prostatectomy Preop: 34.1 (2.7) Post-op: 42.3 (5.4)
Preop: 34.3 (2.3) Post-op: 52.2 (12.1) NS
AT III (%) Mean (SD)
Boldt (1999)(48) Prostatectomy Preop: 78.7 (5.5) Post-op: 58.7 (4.3)
Preop: 81.5 (7.8) Post-op: 60.1 (12.1) NS
Fibrinogen (mg/dL) Mean (SD)
Boldt (1999)(48) Prostatectomy Preop: 308 (39) Post-op: 181 (37)
Preop: 318 (44) Post-op: 145 (22) NS
Platelet count Mean (SD)
Boldt (1999)(48) Prostatectomy Preop: 209 (30) Post-op: 166 (35)
Preop: 221 (36) Post-op: 119 (33) NS
Length of hospital stay
Hospital stay > 5 days n/N (%)
O’Connor (2006)(44) Prostatectomy 24/49 (49%) 34/50 (68%) P=0.055

Technical report on perioperative patient blood management – Volume 1b July 2011 80
Author Surgical procedure Induced hypotension No induced hypotension Statistical significance
Duration of surgery
Surgery duration (minutes) Mean (SD) Elsharnouby (2006)(43)
Endoscopic sinus surgery 68 (15) 88 (10) P<0.001
O’Connor (2006)(44) Prostatectomy 107 (36) 122 (32) P=0.038
Piper (2002)(45) Prostatectomy 154 (20.6) 164 (20.6) NS
Karakaya (1999)(49) Hip arthroplasty 171.0 (26.6) 163.5 (24.9) NS
Surgery duration (minutes) Mean (range)
Kop (2009)(42) Breast surgery 56.4 (41–73) 62.7 (48–78) P=0.013
aPTT, activated partial thromboplastin time; AT, antithrombin III; DVT, deep vein thrombosis; NA, not applicable; NR, not reported; NS; not significant; PE, pulmonary embolism; RBC, red blood cells; SD, standard deviation.
Blood transfusion incidence Five studies compared the incidence of blood transfusion in patients with induced hypotension versus patients with normotension. Four studies examined patients undergoing prostatectomy and found that significantly fewer patients in the intervention group required blood transfusion compared to the control group (P<0.05)(44-46;48). Similarly, Sood (1987)(50) also reported that among lienorenal shunt surgery patients, a smaller proportion of patients in the induced hypotension group received blood transfusion compared to the normotension group (63% vs 100%); however, no statistical tests were performed.
To clarify the effect of induced hypotension on blood transfusion incidence, a meta-analysis of the five studies was conducted. As shown in Figure 5.1, treatment effect is expressed as a ratio of the incidence of blood transfusion between treatment groups. The meta-analysis showed that, overall, the incidence of blood transfusion was significantly reduced (P=0.005) in patients with induced hypotension compared with no induced hypotension (ratio: 0.38; 95%CI: 0.19, 0.75). This difference was primarily driven by the treatment effect in the four prostatectomy trials (ratio: 0.30; 95%CI: 0.16, 0.59).

Technical report on perioperative patient blood management – Volume 1b July 2011 81
Figure 5.3 Meta-analysis of the effect of deliberate induced hypotension on the incidence of blood transfusion
Transfusion volume Four studies reported the total volume of packed red blood cells transfused to patients during prostatectomy(44-46;48). All four studies found that the total volume of packed red blood cells transfused in the induced hypotension group was lower than in the normotension group (0–14 units vs 10–28 units; P<0.05).
Three studies reported mean volume of blood transfused per patient. Karakaya (1999)(49) and Fredin (1984)(51) included patients undergoing hip arthroplasty, while Sood (1987)(50) examined patients undergoing lienorenal shunt surgery. Karakaya (1999)(49) did not observe significant differences between treatment groups in the mean volume of blood transfused per patient (2.3 units vs 2.7 units; P>0.05). In contrast, Fredin (1984)(51) found that patients in the induced hypotension group received significantly more blood than patients in the normotension group intraoperatively (580 mL vs 1210 mL; P<0.01) and in total (920 mL vs 1540 mL; P<0.01). Similarly, Sood (1987)(50) observed that lienorenal shunt surgery patients with induced hypotension received significantly less units of blood transfused compared to patients with normotension (0.88 units vs 3.0 units; P<0.01).
Blood Loss Ten studies examined the effect of induced hypotension on blood loss during surgery. Of these, nine studies found that induced hypotension was associated with a significant decrease in blood loss.
Four studies examined patients undergoing prostatectomy(44-46;48). In these studies, the volume of blood loss among patients in the induced hypotension group was reduced significantly by between 522mL to 683mL (P<0.05), compared to the control group.
Study / Subgroup Prostatectomy Boldt et al. O'Connor et al. Piper et al. Suttner et al. Subtotal (95% CI) Heterogeneity: I² = 0% Test for overall effect: (P = 0.0004)
Lienorenal shunt surgery Sood et al. Subtotal (95% CI) Heterogeneity: Not applicable Test for overall effect: (P = 0.10)
Total (95% CI)
Heterogeneity: I² = 42% Test for overall effect: (P = 0.005)
M-H, Random, 95% CI
0.42 [0.18, 0.96] 0.23 [0.05, 1.00] 0.11 [0.01, 1.90] 0.14 [0.02, 1.01] 0.30 [0.16, 0.59]
0.64 [0.37, 1.10] 0.64 [0.37, 1.10]
0.38 [0.19, 0.75]
Risk Ratio Risk Ratio M-H, Random, 95% CI
0.1 0.2 0.5 1 2 5 10 Favours experimental Favours control
Technical report on perioperative patient blood management – Volume 1b July 2011 82
Two studies examined patients undergoing endoscopic sinus surgery. Elsharnouby (2006)(43) reported that patients in the induced hypotension group lost significantly less blood than patients in the normotension group (165 mL vs 257 mL; P<0.05). In contrast, Jacobi (2000)(47) failed to detect a significant difference in blood loss between the treatment groups (278 mL vs 245 mL, P>0.05). The use of endoscopy may explain the lower levels of blood loss observed in these studies.
Sood (1987)(50) examined patients undergoing lienorenal shunt surgery and also found that patients in the induced hypotension group had significantly lower blood loss compared to patients in the normotension group (517 mL vs 1286 mL; P<0.01).
Among patients undergoing hip arthroplasty, Fredin (1984)(51) found that intraoperative blood loss among patients with induced hypotension was reduced by 450 mL (P<0.001), while total blood loss was reduced by 530 mL (P<0.01), compared to normotension patients.
In the study by Kop (2009)(42), mean blood loss was significantly lower among patients with induced hypotension compared to normotension patients during breast surgery (316 mL vs 598 mL; P<0.001).
To clarify the effect of induced hypotension on blood loss, a meta-analysis was conducted of the eight studies that reported mean (SD) blood loss. As shown in Figure 5.2, treatment effect is expressed as the mean difference in volume of blood loss (in millilitres) between treatment groups. From the meta-analysis estimate, blood loss was reduced by 460mL (95%CI: 709, 210) in patients with induced hypotension compared to patients with normotension.
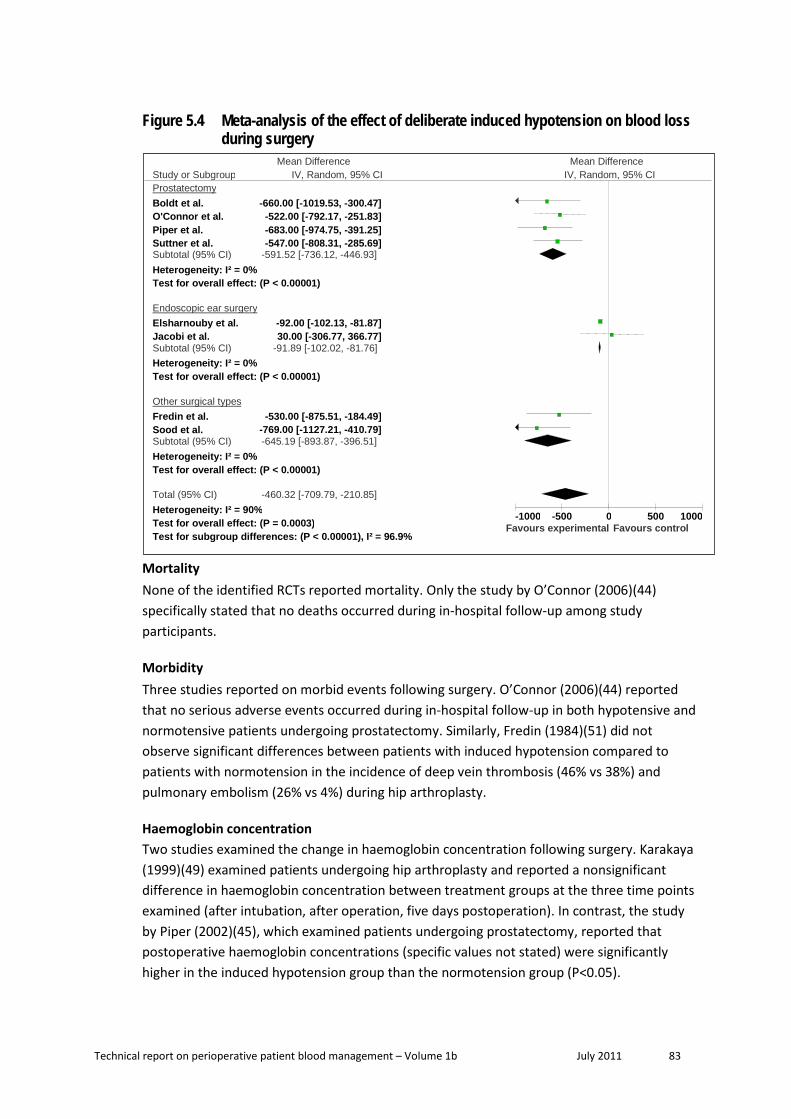
Technical report on perioperative patient blood management – Volume 1b July 2011 83
Figure 5.4 Meta-analysis of the effect of deliberate induced hypotension on blood loss during surgery
Mortality None of the identified RCTs reported mortality. Only the study by O’Connor (2006)(44) specifically stated that no deaths occurred during in-hospital follow-up among study participants.
Morbidity Three studies reported on morbid events following surgery. O’Connor (2006)(44) reported that no serious adverse events occurred during in-hospital follow-up in both hypotensive and normotensive patients undergoing prostatectomy. Similarly, Fredin (1984)(51) did not observe significant differences between patients with induced hypotension compared to patients with normotension in the incidence of deep vein thrombosis (46% vs 38%) and pulmonary embolism (26% vs 4%) during hip arthroplasty.
Haemoglobin concentration Two studies examined the change in haemoglobin concentration following surgery. Karakaya (1999)(49) examined patients undergoing hip arthroplasty and reported a nonsignificant difference in haemoglobin concentration between treatment groups at the three time points examined (after intubation, after operation, five days postoperation). In contrast, the study by Piper (2002)(45), which examined patients undergoing prostatectomy, reported that postoperative haemoglobin concentrations (specific values not stated) were significantly higher in the induced hypotension group than the normotension group (P<0.05).
Study or Subgroup Prostatectomy Boldt et al. O'Connor et al. Piper et al. Suttner et al. Subtotal (95% CI) Heterogeneity: I² = 0% Test for overall effect: (P < 0.00001)
Endoscopic ear surgery Elsharnouby et al. Jacobi et al. Subtotal (95% CI) Heterogeneity: I² = 0% Test for overall effect: (P < 0.00001)
Other surgical types Fredin et al. Sood et al. Subtotal (95% CI) Heterogeneity: I² = 0% Test for overall effect: (P < 0.00001)
Total (95% CI) Heterogeneity: I² = 90% Test for overall effect: (P = 0.0003) Test for subgroup differences: (P < 0.00001), I² = 96.9%
IV, Random, 95% CI
-660.00 [-1019.53, -300.47] -522.00 [-792.17, -251.83] -683.00 [-974.75, -391.25] -547.00 [-808.31, -285.69]
-591.52 [-736.12, -446.93]
-92.00 [-102.13, -81.87] 30.00 [-306.77, 366.77]
-91.89 [-102.02, -81.76]
-530.00 [-875.51, -184.49] -769.00 [-1127.21, -410.79] -645.19 [-893.87, -396.51]
-460.32 [-709.79, -210.85]
Mean Difference Mean Difference IV, Random, 95% CI
-1000 -500 0 500 1000 Favours experimental Favours control

Technical report on perioperative patient blood management – Volume 1b July 2011 84
Coagulation status The study by Boldt (1999)(48) stated that the change in coagulation status (aPTT, AT III, fibrinogen, platelet count) in patients before and after surgery were similar in both treatment groups.
Hospital length of stay Hospital length of stay was examined in the study by O’Connor (2006)(44). The study found that the proportion of patients with a hospital stay over 5 days was not significantly different between patients with induced hypotension and patients with normotension (49% vs 68%; P=0.055).
Surgery duration Five studies examined the effect of induced hypotension on surgery duration. Three studies found that induced hypotension significantly reduced surgery duration. Elsharnouby (2006)(43) observed that the duration of endoscopic sinus surgery was significantly shorter in patients with induced hypotension compared to patients with normotension (68 minutes vs 88 minutes; P<0.001). Kop (2009)(42) also observed that induced hypotension reduced operating time during breast surgery (56.4 minutes vs 62.7 minutes; P=0.013). O’Connor (2006)(44) and Piper (2002)(45) examined patients undergoing prostatectomy. O’Connor (2006)(44) found that surgery duration was significantly shorter among patients in the induced hypotension group compared to the normotension group (107 minutes vs 122 minutes; P=0.038). In contrast, Piper (2002)(45) did not find a difference in surgery duration between treatment groups (154 minutes in the induced hypotension group vs 164 minutes in the normotension group; P>0.05). Likewise, the study by Karakaya (1999)(49) found no significant difference in the duration of surgery between induced hypotension and normotension patients undergoing hip surgery (171 minutes vs 163.5 minutes; P>0.05).
To clarify the effect of induced hypotension on surgery duration, a meta-analysis of the studies was conducted. The ratio of surgery duration between treatment groups was computed for each study. The use of a ratio between treatment arms (rather than mean difference) allows a more intuitive comparison of studies involving different surgical procedures. The pooled estimate for surgery duration reported by the Paul (2007) systematic review in the previous section was not included in the meta-analysis as it did not provide sufficient data to compute the ratio of surgery duration between treatment arms and had focused specifically on orthopaedic surgery. The study by Kop (2009)(42) did not provide sufficient information for standard deviation to be calculated and, as such, it was also not included in the meta-analysis.
As shown in Figure 5.3, meta-analysis of four studies revealed no significant difference in the duration of surgery in patients with induced hypotension compared to patients with normotension. However, this does not exclude the possibility that induced hypotension might reduce operating time in certain surgical procedures; additional studies are needed to determine any surgery-specific effects.
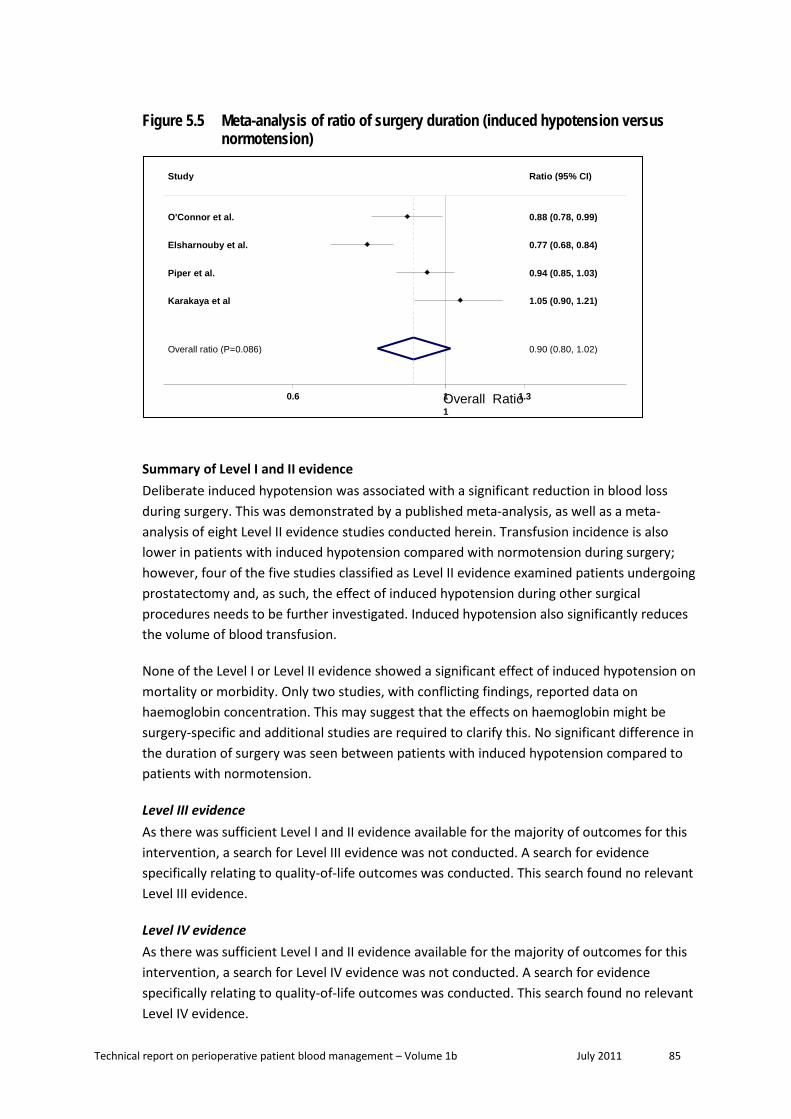
Technical report on perioperative patient blood management – Volume 1b July 2011 85
Figure 5.5 Meta-analysis of ratio of surgery duration (induced hypotension versus normotension)
Summary of Level I and II evidence Deliberate induced hypotension was associated with a significant reduction in blood loss during surgery. This was demonstrated by a published meta-analysis, as well as a meta-analysis of eight Level II evidence studies conducted herein. Transfusion incidence is also lower in patients with induced hypotension compared with normotension during surgery; however, four of the five studies classified as Level II evidence examined patients undergoing prostatectomy and, as such, the effect of induced hypotension during other surgical procedures needs to be further investigated. Induced hypotension also significantly reduces the volume of blood transfusion.
None of the Level I or Level II evidence showed a significant effect of induced hypotension on mortality or morbidity. Only two studies, with conflicting findings, reported data on haemoglobin concentration. This may suggest that the effects on haemoglobin might be surgery-specific and additional studies are required to clarify this. No significant difference in the duration of surgery was seen between patients with induced hypotension compared to patients with normotension.
Level III evidence As there was sufficient Level I and II evidence available for the majority of outcomes for this intervention, a search for Level III evidence was not conducted. A search for evidence specifically relating to quality-of-life outcomes was conducted. This search found no relevant Level III evidence.
Level IV evidence As there was sufficient Level I and II evidence available for the majority of outcomes for this intervention, a search for Level IV evidence was not conducted. A search for evidence specifically relating to quality-of-life outcomes was conducted. This search found no relevant Level IV evidence.
Overall ratio (P=0.086)
Study
Karakaya et al
Elsharnouby et al.
Piper et al.
O'Connor et al.
0.90 (0.80, 1.02)
Ratio (95% CI)
1.05 (0.90, 1.21)
0.77 (0.68, 0.84)
0.94 (0.85, 1.03)
0.88 (0.78, 0.99)
1 0.6 Overall Ratio 1
1.3

Technical report on perioperative patient blood management – Volume 1b July 2011 86
6 Prevent ion of hypothermia
Methods
The systematic review process identified a total of eight Level I or Level II studies that were considered to be relevant to this research question. Three Level I studies were identified which assessed the effect of prevention of hypothermia on transfusion incidence and other relevant outcomes. However, the Level I evidence did not adequately address all primary outcomes specified in the research question. A second literature search was therefore conducted to identify relevant Level II evidence that was not included in the Level I studies. An additional five RCTs were identified and included.
No socioeconomic literature pertaining to Australia’s Indigenous population was identified in the literature search for this research question.
No published economic evaluations on the prevention of hypothermia for minimising blood loss were identified in the literature search for this research question.
Level I evidence Three systematic reviews examining the effect of hypothermia prevention strategies during surgery were identified by the literature search(52-54). The main characteristics of these studies are summarised in Table 6.1. One of the identified systematic reviews included 15 RCTs and three non-randomised studies(54). It is therefore not strictly Level I evidence.
Table 6.9 Characteristics and quality of Level I evidence for prevention of hypothermia
Author (Year) Study quality
Date of search
Population Number of included trials
Relevant outcomes (no. of trials included in analysis)
Rajagopalan (2008)(52) Good
1996 to 2006
Normothermic patients compared to those with mild intraoperative hypothermia, undergoing any surgical procedure
18 RCTs Transfusion incidence (10) Blood loss (14)
Scott (2006)(53) Fair
1948 to 2003
Patients undergoing any surgical procedure (except cardiac procedures) under regional or general anaesthesia
26 RCTs Transfusion incidence (3) a Morbidity (2)
Mahoney (1999)(54) Poor
1989 to 1997
Patients undergoing any surgical procedure
15 RCTs 3 non-randomised trials
Transfusion dose (5) Transfusion incidence (2) b Mortality rate (2) Morbidity (2) Hospital stay (3) ICU stay (2)
ICU, intensive care unit; RCT, randomised controlled trials. a Two of the studies identified by Scott et al. (2006) that reported transfusion incidence were also identified in the more recent review by Rajagopalan et al (2008). b The two studies which reported transfusion incidence in Mahoney (1999) were also included in the review by Rajagopalan (2008). As such, the results in Mahoney et al. will not be discussed separately.

Technical report on perioperative patient blood management – Volume 1b July 2011 87
The systematic review by Rajagopalan (2008)(52) was considered to be of good quality. Studies in which average core temperature decreased to less than 34°C or in which local cooling was used to decrease bleeding from the surgical site were excluded. Trials with sample sizes smaller than 15 subjects were also excluded. The statistical analyses were well conducted and clearly presented. Quality scores were assigned for each study; however, quality scores were only reported for studies that reported blood loss and detailed characteristics of each study were absent from the publication. The review included 18 RCTs, of which 14 were included in a meta-analysis of blood loss and 10 were included in a meta-analysis of transfusion incidence. Of RCTs reporting total blood loss, the following surgery types were represented: hip arthroplasty (four studies), hysterectomy (two studies), cardiac surgery (two studies), major surgery (two studies), major abdominal surgery (one study), spine surgery (one study), off-pump CABG (one study) and gastric bypass (one study). Ten of the 14 studies that examined blood loss reported the method of randomisation and ten conducted an intention-to-treat analysis.
The systematic review by Scott (2006)(53) was considered to be of fair quality. Although 26 RCTs were included in the review, the pooled estimates for morbid cardiac events were derived from just two studies, while the need for blood transfusion was derived from three studies. In terms of quality of individual RCTs, randomisation was not fully described in 17 of the 26 RCTs and eight RCTs did not fully describe any method of blinding. Eight RCTs reported blinding of participants and outcome assessors (warming took place after the patient was anaesthetised and warming equipment was removed before assessment).
The following warming methods were used in the 26 RCTs included in the Scott (2006)(53) systematic review: forced air warming (17 studies), intravenous fluid warming (11 studies), electric blankets (two studies), irrigation fluid warming (two studies), warming of insufflations gases (two studies), circulating water mattresses (one study), reflective (i.e. ‘space’) blankets (one study), and warming of anaesthetic gases (one study). In all studies the interventions were used intraoperatively but five studies also included preoperative warming in the operating room before anaesthesia induction and six studies continued to warm the patients into the postoperative phase. Control of ambient temperatures in the operating room was described in six studies.
The systematic review by Mahoney (1999)(54) was considered to be of poor quality. The overall quality of this review was diminished by the inclusion of three non-randomised trials, and the small number of studies included in the meta-analysis for some of the outcomes. Results from the meta-analyses were not presented separately for randomised and non-randomised studies. Furthermore, the authors did not undertake quality assessment of included studies.
Results of the three systematic reviews are presented in Table 6.2.

Technical report on perioperative patient blood management – Volume 1b July 2011 88
Table 6.10 Results for Level I evidence: prevention of hypothermia versus no prevention of hypothermia
Author Surgical procedure
No. of trials included in analysis (N)
Prevention of hypothermia
No prevention of hypothermia
Statistical significance
Incidence of transfusion
Risk of transfusion (95%CI) Rajagopalan (2008)(52) Any procedure 10 (N=895) 0.78 (0.63, 0.97) P=0.027
Scott (2006)(53) All, except cardiac procedures 3 (N=250) a 0.39 (0.22, 0.68) NR
Volume of transfusion Red blood cells transfusion (Units) Pooled mean (SD) Mahoney (1999)(54) Any procedure 5 (N=859) b 0.117 (0.025) 1.167 (0.087) P<0.05
Blood loss
Ratio of blood loss (Intervention : Control) Ratio (95%CI) Rajagopalan (2008)(52) Any procedure 14 (N=1249) 0.84 (0.74, 0.96) P=0.009
Mortality
Mahoney (1999)(54)
Abdominal, thoracic or vascular surgery 2 (N=562) b
Pooled rate (RCT and non-RCT) P<0.05 2.70% 6.01% Rate from RCT only (N=300)
P=0.91 2/158 (1.3%) 2/142 (1.4%)
Morbidity
Primary complication during surgery c RR (95%CI)
Scott (2006)(53) All, except cardiac procedures 7 (N=1061) 0.37 (0.27, 0.51) P<0.00001
Morbid cardiac events d RR (95%CI)
Scott (2006)(53) All, except cardiac procedures 2 (N=287) 0.34 (0.20, 0.57) NR
Wound infection RR (95%CI)
Scott (2006)(53) All, except cardiac procedures 2 (N=284) 0.26 (0.12, 0.58) NR
Pain
Scott (2006)(53) All, except cardiac procedures 3 (N=131) No significant difference in pain between
groups NR
CI, confidence intervals; NR, not reported; RCT, randomised controlled trial; RR, relative risk; SD, standard deviation. a Two of the studies identified by Scott (2006) that reported transfusion incidence were also identified in the more recent review by Rajagopalan et al. b Pooled estimate derived from one RCT (N=300) and one non-randomised trial (N=262). c Primary complications include cardiac events, wound infection, pressure ulcers, need for blood transfusion. d The definition of morbid cardiac events in Scott et al. (2006) included tachycardia and hypotension.
Incidence of blood transfusion Rajagopalan (2008)(52) conducted a meta-analysis of 10 studies and estimated that the incidence of blood transfusion was 22% lower when hypothermia prevention strategies were
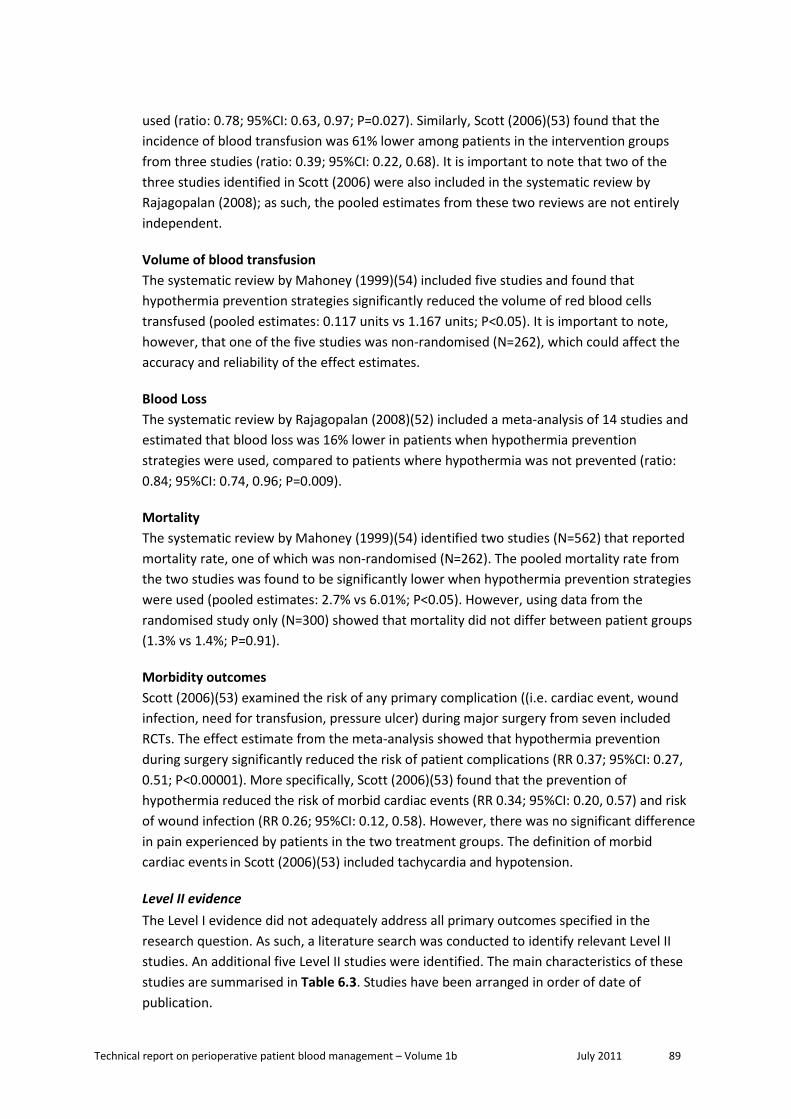
Technical report on perioperative patient blood management – Volume 1b July 2011 89
used (ratio: 0.78; 95%CI: 0.63, 0.97; P=0.027). Similarly, Scott (2006)(53) found that the incidence of blood transfusion was 61% lower among patients in the intervention groups from three studies (ratio: 0.39; 95%CI: 0.22, 0.68). It is important to note that two of the three studies identified in Scott (2006) were also included in the systematic review by Rajagopalan (2008); as such, the pooled estimates from these two reviews are not entirely independent.
Volume of blood transfusion The systematic review by Mahoney (1999)(54) included five studies and found that hypothermia prevention strategies significantly reduced the volume of red blood cells transfused (pooled estimates: 0.117 units vs 1.167 units; P<0.05). It is important to note, however, that one of the five studies was non-randomised (N=262), which could affect the accuracy and reliability of the effect estimates.
Blood Loss The systematic review by Rajagopalan (2008)(52) included a meta-analysis of 14 studies and estimated that blood loss was 16% lower in patients when hypothermia prevention strategies were used, compared to patients where hypothermia was not prevented (ratio: 0.84; 95%CI: 0.74, 0.96; P=0.009).
Mortality The systematic review by Mahoney (1999)(54) identified two studies (N=562) that reported mortality rate, one of which was non-randomised (N=262). The pooled mortality rate from the two studies was found to be significantly lower when hypothermia prevention strategies were used (pooled estimates: 2.7% vs 6.01%; P<0.05). However, using data from the randomised study only (N=300) showed that mortality did not differ between patient groups (1.3% vs 1.4%; P=0.91).
Morbidity outcomes Scott (2006)(53) examined the risk of any primary complication ((i.e. cardiac event, wound infection, need for transfusion, pressure ulcer) during major surgery from seven included RCTs. The effect estimate from the meta-analysis showed that hypothermia prevention during surgery significantly reduced the risk of patient complications (RR 0.37; 95%CI: 0.27, 0.51; P<0.00001). More specifically, Scott (2006)(53) found that the prevention of hypothermia reduced the risk of morbid cardiac events (RR 0.34; 95%CI: 0.20, 0.57) and risk of wound infection (RR 0.26; 95%CI: 0.12, 0.58). However, there was no significant difference in pain experienced by patients in the two treatment groups. The definition of morbid cardiac events in Scott (2006)(53) included tachycardia and hypotension.
Level II evidence The Level I evidence did not adequately address all primary outcomes specified in the research question. As such, a literature search was conducted to identify relevant Level II studies. An additional five Level II studies were identified. The main characteristics of these studies are summarised in Table 6.3. Studies have been arranged in order of date of publication.

Technical report on perioperative patient blood management – Volume 1b July 2011 90
Table 6.11 Characteristics and quality for Level II evidence for prevention of hypothermia
Author (Year) Study type Study quality
Sample size
Patient population / Setting Outcomes
Kim (2009)(55) RCT Fair
N=50 ASA I or II patients undergoing arthroscopic shoulder surgery. Military hospital in South Korea
Change in haemoglobin Surgery duration Morbidity Effect on body temperature
Jeong (2008)(56) RCT Poor
N=40 Patients undergoing isolated off-pump coronary artery bypass (OPCAB) surgery. Hospital in South Korea
Blood loss Hospital stay ICU stay Surgery duration Effect on body temperature
Zhao (2005)(57) RCT Fair
N=40 Patients (ASA class I and II) undergoing abdominal surgery lasting at least 2 hours. Hospital in China
Blood loss Transfusion requirements Surgery duration Effect on body temperature
Melling (2001)(58) RCT Good
N=421 Patients having clean surgery (e.g. breast, varicose vein, or hernia), that would result in a scar longer than 3 cm. Hospital in United Kingdom
Morbidity
Yau (1992)(59) RCT Fair
N=20 Patients undergoing isolated primary CABG. Hospital in Canada
Transfusion volume Transfusion incidence Change in haemoglobin
ASA, American Society of Anaesthesiologists; CABG, coronary artery bypass graft; ICU, intensive care unit; OPCAB, off-pump coronary artery bypass; RCT, randomised controlled trial.
Of the five RCTs identified, one study was considered to be of good quality(58), four were of fair quality(55;57;59) and one was considered to be of poor quality(56). The results from these studies are summarised in Table 6.4.
Table 6.12 Results for Level II evidence: prevention of hypothermia versus no prevention of hypothermia
Author Surgical procedure (Method of hypothermia prevention)
Prevention of hypothermia
No prevention of hypothermia
Statistical significance
Incidence of blood transfusion
n/N (%)
Yau (1992)(59) CABG (Warm systemic perfusion) 6/8 (75) 9/12 (75) NS
Volume of blood transfusion
Blood (mL) Mean (SD)

Technical report on perioperative patient blood management – Volume 1b July 2011 91
Author Surgical procedure (Method of hypothermia prevention)
Prevention of hypothermia
No prevention of hypothermia
Statistical significance
Jeong (2008)(56) OPCAB (Warming of all intravenous fluids)
400.5 (622.8) 365.0 (437.1) NS
Red blood cell (units) Mean (SD)
Zhao (2005)(57) Abdominal surgery (Warm forced-air blanket and warming of intravenous fluids)
2.6 (2.5) 1.6 (2.4) NS
Plasma (mL) Mean (SD)
Zhao (2005)(57) Abdominal surgery (Warm forced-air blanket and warming of intravenous fluids)
220 (460) 240 (480) NS
Blood loss
Total blood loss (mL) Mean (SD)
Zhao (2005)(57) Abdominal surgery (Warm forced-air blanket and warming of intravenous fluids)
639 (441) 421 (249) NS
Yau (1992)(59) CABG (Warm systemic perfusion) 949 (427) 1253 (796) NS
Morbidity
Wound infections n/N (%)
Melling (2001)(58) Clean surgery (Preoperative warming) 13/277 (5) 19/139 (14) P=0.001
Pain Mean VAS score (SD)
Kim (2009)(55) Arthroscopic shoulder surgery (Warming of irrigation fluid) 5.0 (1.7) 4.9 (1.6) P=0.927
Change in haemoglobin
Mean (SD)
Kim (2009)(55) Arthroscopic shoulder surgery (Warming of irrigation fluid) 1.7 (0.7) g/dL 1.4 (0.6) g/dL P=0.165
Yau (1992)(59) CABG (Warm systemic perfusion) No significant difference between treatment groups NR
Length of hospital stay
Total stay in hospital (days) Mean (SD)
Jeong (2008)(56) OPCAB (Warming of all intravenous fluids)
10.6 (2.2) 11.6 (2.7) NS

Technical report on perioperative patient blood management – Volume 1b July 2011 92
Author Surgical procedure (Method of hypothermia prevention)
Prevention of hypothermia
No prevention of hypothermia
Statistical significance
Length of ICU stay
Length of stay in ICU (hours) Mean (SD)
Jeong (2008)(56) OPCAB (Warming of all intravenous fluids)
59.6 (19.6) 70.5 (17.8) NS
Length of surgery
Surgery duration (hours) Mean (SD)
Jeong (2008)(56) OPCAB (Warming of all intravenous fluids)
4.1 (1.0) 4.1 (0.8) NS
Kim (2009)(55) Arthroscopic shoulder surgery (Warming of irrigation fluid) 1.6 (0.4) 1.5 (0.5) P=0.68
Zhao (2005)(57) Abdominal surgery (Warm forced-air blanket and warming of intravenous fluids)
3.4 (1.3) 3.8 (1.5) NS
Effect on body temperature
Postoperative body temperature (°C) Mean (SD)
Jeong (2008)(56) OPCAB (Warming of all intravenous fluids)
36.6 (0.32) 35.8 (0.7) P<0.05
Kim (2009)(55) Arthroscopic shoulder surgery (Warming of irrigation fluid) 36.2 (0.3) 35.5 (0.3) P<0.001
Zhao (2005)(57) Abdominal surgery (Warm forced-air blanket and warming of intravenous fluids)
36.4 (0.4) 35.3 (0.5) P<0.001
Frequency of hypothermia n/N (%)
Kim (2009)(55) Arthroscopic shoulder surgery (Warming of irrigation fluid) 4/23 (17.4) 21/23 (91.3) P<0.001
CABG, coronary artery bypass graft; CI, confidence interval; OPCAB, off-pump coronary artery bypass; ICU, intensive care unit; NR, not reported; NS, not statistically significant; SD, standard deviation; SEM, standard error of mean; VAS, visual analogue scale.
Incidence of blood transfusion Only one study reported data on the incidence of blood transfusion. Yau (1992)(59) examined the use of warm systemic perfusion during CABG surgery on the incidence of blood transfusion. There was no significant difference in the incidence of blood transfusion in patients with warm systemic perfusion, compared to patients with unwarmed systemic perfusion (75% vs 75%). However, due to the small sample size of this study (N=20), the study results should be interpreted with caution.
As shown in Figure 6.1, a meta-analysis of the treatment effect reported in Level I or Level II studies (expressed as a ratio for the need of transfusion between treatment groups) was conducted. The meta-analysis (random effects model used) estimated that transfusion

Technical report on perioperative patient blood management – Volume 1b July 2011 93
incidence is significantly reduced when hypothermia prevention strategies are used (ratio: 0.78; 95%CI: 0.63, 0.96).
Figure 6.6 Meta-analysis of ratio of blood loss (hypothermia prevention vs no hypothermia prevention)
Overall
Winkler et al.
Smith et al.
Scott et al.
Hohn et al.
Study
Kurz et al.
Yau et al.
Hofer et al.
Johansson et al.
Widman et al.
Nathan et al.
0.78 (0.63, 0.96)
0.73 (0.51, 1.03)
1.94 (0.19, 20.24)
0.39 (0.22, 0.68)
0.94 (0.57, 1.57)
Ratio (95% CI)
0.62 (0.40, 0.98)
1.00 (0.60, 1.68)
0.45 (0.18, 1.14)
1.15 (0.70, 1.89)
0.89 (0.46, 1.73)
0.93 (0.58, 1.49)
1.1 1 2.5
Volume of transfusion Jeong (2008)(56) examined the effect of warming all intravenous fluids during off-pump coronary artery bypass surgery. The authors did not observe a significant difference in the volume of blood transfused between patient groups (400.5 mL for the hypothermia prevention group vs 365.0 mL for the non-intervention group). Similarly, Zhao (2005) examined patients undergoing abdominal surgery and did not find a significant reduction in the volume of red blood cells (2.6 units vs 1.6 units) or plasma transfused (220 mL vs 240 mL) with the use of hypothermia prevention strategies (warm force-air blankets and warm intravenous fluids) compared with no prevention of hypothermia..
Blood loss Two studies examined the effect of hypothermia prevention on blood loss during surgery. Blood loss appeared to be lower in the intervention group in the study by Yau (1992)(59), while Zhao (2005)(57) reported higher blood loss in the intervention group. However, none of the differences were statistically significant. The modest sample sizes of these studies may
Studies included in Rajagopalan et al. (excluding those included in Scott et al.)

Technical report on perioperative patient blood management – Volume 1b July 2011 94
have limited their study power to detect a difference. To clarify the effect of the various hypothermia prevention strategies on blood loss, a meta-analysis of these two studies, together with the 14 studies included in the systematic review by Rajagopalan (2008), was conducted herein.
As shown in Figure 6.2, treatment effect is expressed as a ratio of the mean blood loss between treatment groups rather than a difference in mean as this allows a more intuitive comparison of studies examining different surgical procedures with varying volumes of blood loss. From the meta-analysis estimate, blood loss was significantly reduced by an average of 14% when hypothermia prevention strategies were used (ratio: 0.86; 95%CI: 0.75, 0.98; P=0.021).
Figure 6.7 Meta-analysis of ratio of blood loss (hypothermia prevention versus no prevention of hypothermia)
Morbidity Melling (2001) examined patients undergoing clean surgery, and found that wound infection was significantly lower in patients who were warmed preoperatively, compared to patients who were not warmed (5% vs 14%; P=0.001)(58).
Overall Ratio 1
Johansson et al. Bock et al.
Casati et al.
Hofer et al.
Hohn et al. Nathan et al.
Murat et al.
Winkler et al.
Study
Yau et al.
Persson et al. Widman et al.
Frank et al. Smith et al.
Schmied et al.
Zhao et al.
0.86 (0.76, 0.98)
0.99 (0.80, 1.23) 0.58 (0.38, 0.89)
0.73 (0.60, 0.89) 1.11 (0.89, 1.40)
0.65 (0.55, 0.77)
0.69 (0.36, 1.34) 0.85 (0.70, 1.02)
1.09 (0.84, 1.43)
0.90 (0.82, 1.00)
Ratio (95% CI)
0.76 (0.45, 1.33)
0.62 (0.43, 0.89) 0.87 (0.68, 1.11)
0.56 (0.43, 0.73) 3.14 (1.82, 5.42)
0.79 (0.70, 0.88)
1.52 (0.98, 2.29)
1 0.2 1 5.4

Technical report on perioperative patient blood management – Volume 1b July 2011 95
Pain following surgery was assessed by Kim (2009)(55). The authors reported that there was no significant difference in the pain score of patients with the use of warm irrigation fluid, compared to using irrigation fluid at room temperature (VAS score 5.0 vs 4.9; P=0.927).
Change in haemoglobin Two studies examined the effect of hypothermia prevention on haemoglobin following surgery. The studies by Kim (2009)(55) and Yau (1992)(59) comprised patients undergoing arthroscopic shoulder surgery and CABG surgery, respectively. However, both studies found no significant difference in haemoglobin levels between patients with or without hypothermia prevention.
Length of hospital stay The study by Jeong (2008)(56) examined the effect of hypothermia prevention during off-pump coronary artery bypass surgery on the length of hospital stay. Hypothermia prevention appeared to shorten the duration of hospital stay; however, the difference was not statistically significantly (10.6 days vs 11.6 days), and may be a consequence of the modest study sample size (N=40).
Length of ICU stay One study examined the effect of the hypothermia prevention on the length of ICU stay. Jeong (2008)(56) examined patients undergoing off-pump coronary artery bypass surgery and found that hypothermia prevention was associated with a shorter length of ICU stay. However, the difference was not statistically significant (59.6 hours in the hypothermia prevention group vs 70.5 hours in the non-intervention group).
Length of surgery Three studies examined the effect of preventing hypothermia on surgery duration(55-57). The studies comprised patients undergoing a variety of surgeries, namely, abdominal, off-pump coronary artery bypass surgery and arthroscopic shoulder surgery. However, none of the studies found a significant difference in surgery duration between patients with or without hypothermia prevention.
Effect on body temperature Three studies investigated the effect of hypothermia prevention strategies on body temperature. Postoperative body temperature among patients in the intervention group was found to be significantly higher than that of patients in the control group in the studies by Jeong (2008)(56) (36.6°C vs 35.8°C; P<0.05), Kim (2009)(55) (36.2°C vs 35.5°C; P<0.001) and Zhao (2005)(57) (36.4°C vs 35.3°C; P<0.001).
The study by Kim (2009)(55) also reported that the frequency of hypothermia (body temperature <36°C) was significantly lower among patients in the intervention group compared with the control group (17.4% vs 91.3%; P<0.001).
Level III evidence As there was sufficient Level I and II evidence available for the majority of outcomes for this intervention, a search for Level III evidence was not conducted. A search for evidence

Technical report on perioperative patient blood management – Volume 1b July 2011 96
specifically relating to quality of life outcomes was conducted. This search found no relevant Level III evidence.
Level IV evidence As there was sufficient Level I and II evidence available for the majority of outcomes for this intervention, a search for Level IV evidence was not conducted. A search for evidence specifically relating to quality-of-life outcomes was conducted. This search found no relevant Level IV evidence.

Technical report on perioperative patient blood management – Volume 1b July 2011 97
7 Point -of -care test ing using thromboelastography
Methods
A preliminary literature search found a limited body of comparative evidence for the effect of point-of-care testing other than thromboelastography (TEG) on mortality, morbidity and the need for allogeneic blood transfusion. The Consumer/Clinical Reference Group (CRG) made a decision to limit the scope of this intervention to comparative studies of thromboelsatography (TEG) and TEG-based point-of-care tests.
The systematic review process identified a total of seven studies that examined the effect of TEG-based point-of-care testing and were considered to be relevant to this research question. No Level I evidence examining the effect of TEG-based point-of-care testing was identified. Five relevant Level II studies and two relevant Level III studies were identified.
No socioeconomic literature pertaining to Australia’s Indigenous population was identified in the literature search for this research question.
No published economic evaluations on point-of-care testing for minimising blood loss were identified in the literature search for this research question.
Level I evidence No systematic reviews of RCTs examining the effect of TEG-based point-of-care testing on mortality, morbidity and the need for allogeneic blood transfusion were identified by the literature search.
Level II evidence A literature search of Level II studies identified five RCTs examining the effect of TEG-based point-of-care testing to reduce mortality, morbidity and transfusion rate in a perioperative setting(60-64). The main characteristics of the studies are summarised in Table 7.1.
None of the included RCTs were double-blinded; four were considered to be of fair quality(60-63) and one was of poor quality(64).
In the RCTs by Ak (2009)(60), Avidan (2004)(61) and Shore-Lesserson (1999)(62), the comparator groups followed transfusion protocols. In Royston (2001)(64) and Westbrook (2009)(63), clinician discretion was used to determine transfusion without the use of transfusion protocols.
When interpreting the results, it is important to note that the point-of-care test algorithm in the RCT by Avidan (2004)(61) included TEG plus three other tests (ACT+/Junior, Hepcon HMS Hemostasis Management System and PFA–100 platelet function analyser).
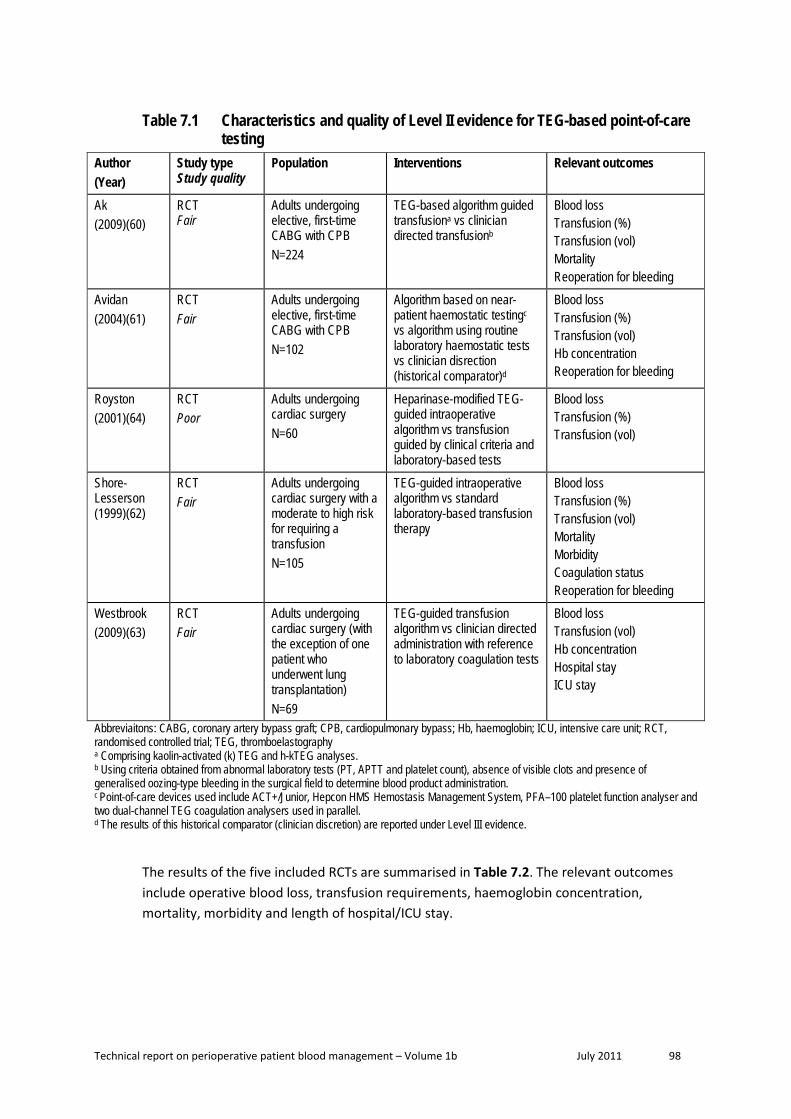
Technical report on perioperative patient blood management – Volume 1b July 2011 98
Table 7.1 Characteristics and quality of Level II evidence for TEG-based point-of-care testing
Author (Year)
Study type Study quality
Population Interventions Relevant outcomes
Ak (2009)(60)
RCT Fair
Adults undergoing elective, first-time CABG with CPB N=224
TEG-based algorithm guided transfusiona vs clinician directed transfusionb
Blood loss Transfusion (%) Transfusion (vol) Mortality Reoperation for bleeding
Avidan (2004)(61)
RCT Fair
Adults undergoing elective, first-time CABG with CPB N=102
Algorithm based on near-patient haemostatic testingc vs algorithm using routine laboratory haemostatic tests vs clinician disrection (historical comparator)d
Blood loss Transfusion (%) Transfusion (vol) Hb concentration Reoperation for bleeding
Royston (2001)(64)
RCT Poor
Adults undergoing cardiac surgery N=60
Heparinase-modified TEG-guided intraoperative algorithm vs transfusion guided by clinical criteria and laboratory-based tests
Blood loss Transfusion (%) Transfusion (vol)
Shore-Lesserson (1999)(62)
RCT Fair
Adults undergoing cardiac surgery with a moderate to high risk for requiring a transfusion N=105
TEG-guided intraoperative algorithm vs standard laboratory-based transfusion therapy
Blood loss Transfusion (%) Transfusion (vol) Mortality Morbidity Coagulation status Reoperation for bleeding
Westbrook (2009)(63)
RCT Fair
Adults undergoing cardiac surgery (with the exception of one patient who underwent lung transplantation) N=69
TEG-guided transfusion algorithm vs clinician directed administration with reference to laboratory coagulation tests
Blood loss Transfusion (vol) Hb concentration Hospital stay ICU stay
Abbreviaitons: CABG, coronary artery bypass graft; CPB, cardiopulmonary bypass; Hb, haemoglobin; ICU, intensive care unit; RCT, randomised controlled trial; TEG, thromboelastography a Comprising kaolin-activated (k) TEG and h-kTEG analyses. b Using criteria obtained from abnormal laboratory tests (PT, APTT and platelet count), absence of visible clots and presence of generalised oozing-type bleeding in the surgical field to determine blood product administration. c Point-of-care devices used include ACT+/Junior, Hepcon HMS Hemostasis Management System, PFA–100 platelet function analyser and two dual-channel TEG coagulation analysers used in parallel. d The results of this historical comparator (clinician discretion) are reported under Level III evidence.
The results of the five included RCTs are summarised in Table 7.2. The relevant outcomes include operative blood loss, transfusion requirements, haemoglobin concentration, mortality, morbidity and length of hospital/ICU stay.

Technical report on perioperative patient blood management – Volume 1b July 2011 99
Table 7.2 Results for Level II evidence: TEG-based point-of-care testing versus no TEG-based point-of-care testing
Author (year) Surgical procedure
Outcome TEG No TEG Statistical significance
Ak (2009)(60) CABG with CPB
Mean (SD) mediastinal chest tube drainage, mL 480.5 (351) 591.4 (339.2) P=0.087
Transfusion with PRBC, n/N (%) 52/114 (45.6) 60/110 (54.5) RR (95%CI): 0.84
(0.64.1.09); P=0.181
Transfusion with FFP, n/N (%) 19/114 (16.6) 31/110 (28.1) RR (95%CI): 0.59 (0.36, 0.98); P=0.038
Transfusion with platelets, n/N (%) 17/114 (14.9) 29/110 (26.3) RR (95%CI): 0.57 (0.33,
0.97); P=0.033 Median (IQR) units of PRBCs transfused intraoperatively 1 (0, 1) 0 (0, 1) P=0.581
Median (IQR) units of FFP transfused intraoperatively 0 (0, 1) 1 (0, 1) P=0.008
Median (IQR) units of FFP transfused postoperatively 1 (0, 1) 1 (0, 1) P=0.034
Median (IQR) units FFP transfused both intra- and postoperatively
1 (0, 1) 1 (1, 2) P=0.001
Median (IQR) units of platelets transfused intraoperatively 0 (0, 1) 1 (0, 1) P=0.004
Median (IQR) units of platelets transfused postoperatively 1 (0, 1) 1 (0, 1) P=0.028
Median (IQR) units of platelets transfused both intra- and postoperatively
1 (1, 1) 1 (1, 2) P=0.001
Median (range) allogeneic units transfused (PRBC, FFP and platelets)
2 (1–3) 3 (2–4) P=0.001
Early mortality (defined as death within 30 days of operation), n (%)
3 (2.6) a
2 (1.8)
RR (95%CI): 1.45 (0.25, 8.50); P=0.68
Re-exploration for bleeding, n (%)
6 (5.2) b
5 (4.5) b
RR (95%CI): 1.16 (0.36, 3.68); P=0.80
Avidan (2004)(61) CABG with CPB
Median (IQR) 24 hour postoperative blood loss, mL 755 (606, 975) 850 (688, 1095) NR
Transfusion with PRBCs, n/N (%) 34/51 (67) 35/51 (69) RR (95%CI): 0.97 (0.74,
1.27); P=0.83
Transfusion with FFP, n/N (%) 2/51 (4) 0/51 (0) RR (95%CI): 5.00 (0.25, 101.63); P=0.29
Transfusion with platelets, n/N (%) 2/51 (4) 1/51 (2) RR (95%CI): 2.00 (0.19,
21.37); P=0.57 Total units of PRBCs transfused 99 93 NR Median (IQR) volume of PRBCs transfused, mL 500 (0, 678) 495 (0, 612) NR

Technical report on perioperative patient blood management – Volume 1b July 2011 100
Author (year) Surgical procedure
Outcome TEG No TEG Statistical significance
Total units of platelets transfused 3 2 NR
Total units of FFP transfused 6 0 NR Median (IQR) postoperative Hb concentration, g/dL 9.3 (8.4, 10.3) 9.3 (8.5, 9.7) NR
Median (IQR) postoperative 24 hour Hb, g/dL 10.1 (9, 10.9) 9.9 (9, 10.8) NR
Median (IQR) postoperative platelet count, x109/L 131 (110, 165) 140 (111, 168) NR
Median (IQR) postoperative 24-hour platelet count, x109/L 149 (123, 187) 159 (135, 200) NR
Reoperation for bleeding, n/N (%) 1/51 (2) 1/51 (2) RR (95%CI): 1.00 (0.06,
15.56); P=1.00 Royston (2001)(64) Cardiac surgery
Median (IQR) 12-hour chest tube loss, mL 470 (295, 820) 390 (240, 820) NR
Transfusion with blood components, n/N (%) 5/30 (17) 10/30 (33) RR (95%CI): 0.50 (0.19,
1.29); P=0.15
Volume of blood components transfused
5 units of FFP and 1 pool of
platelets
16 units of FFP and 9 platelet
pools P<0.05
Shore-Lesserson (1999)(62) Cardiac surgery
Mean (SD) 6-hour mediastinal drainage, mL 362 (274) 469 (637) P>0.05
Mean (SD) 24-hour mediastinal drainage, mL 702 (500) 901 (847) P>0.05
Transfusion with allogeneic blood components (total), n/N (%)
22/53 (42) 34/52 (65) RR (95%CI): 0.63 (0.44, 0.92); P=0.01
Transfusion with packed RBC (intraoperative), n/N (%) 17/53 (32) 23/52 (44) RR (95%CI): 0.73 (0.44,
1.19); P=0.2 Transfusion with packed RBC (postoperative), n/N (%) 10/53 (19) 16/52 (31) RR (95%CI): 0.61 (0.31,
1.22); P=0.16 Transfusion with packed RBC (total), n/N (%) 22/53 (42) 31/52 (60) RR (95%CI): 0.70 (0.47,
1.03); P=0.06 Transfusion with FFP (intraoperative), n/N (%) 3/53 (6) 8/52 (44) RR (95%CI): 0.37 (0.10,
1.31); P=0.12 Transfusion with FFP (postoperative), n/N (%) 2/53 (4) 11/52 (21) RR (95%CI): 0.18 (0.04,
0.77); P=0.02 Transfusion with FFP (total), n/N (%) 4/53 (8) 16/52 (31) RR (95%CI): 0.25 (0.09,
0.68); P=0.007 Transfusion with platelet concentrates (intraoperative), n/N (%)
5/53 (9) 8/52 (15) RR (95%CI): 0.61 (0.21, 1.75); P=0.36
Transfusion with platelet concentrates (postoperative), n/N (%)
3/53 (6) 9/52 (17) RR (95%CI): 0.33 (0.09, 1.14); P=0.08
Transfusion with platelet concentrates (total), n/N (%) 7/53 (13) 15/52 (29) RR (95%CI): 0.46 (0.20,
1.03); P=0.06
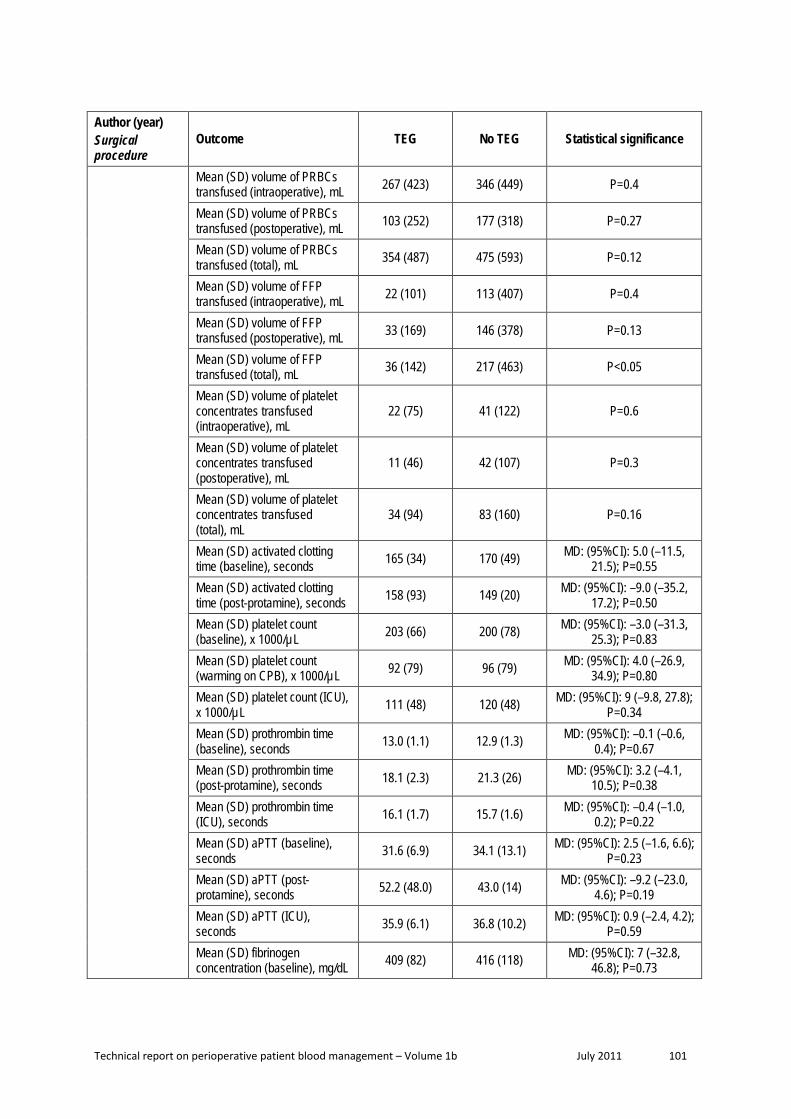
Technical report on perioperative patient blood management – Volume 1b July 2011 101
Author (year) Surgical procedure
Outcome TEG No TEG Statistical significance
Mean (SD) volume of PRBCs transfused (intraoperative), mL 267 (423) 346 (449) P=0.4
Mean (SD) volume of PRBCs transfused (postoperative), mL 103 (252) 177 (318) P=0.27
Mean (SD) volume of PRBCs transfused (total), mL 354 (487) 475 (593) P=0.12
Mean (SD) volume of FFP transfused (intraoperative), mL 22 (101) 113 (407) P=0.4
Mean (SD) volume of FFP transfused (postoperative), mL 33 (169) 146 (378) P=0.13
Mean (SD) volume of FFP transfused (total), mL 36 (142) 217 (463) P<0.05
Mean (SD) volume of platelet concentrates transfused (intraoperative), mL
22 (75) 41 (122) P=0.6
Mean (SD) volume of platelet concentrates transfused (postoperative), mL
11 (46) 42 (107) P=0.3
Mean (SD) volume of platelet concentrates transfused (total), mL
34 (94) 83 (160) P=0.16
Mean (SD) activated clotting time (baseline), seconds 165 (34) 170 (49) MD: (95%CI): 5.0 (–11.5,
21.5); P=0.55 Mean (SD) activated clotting time (post-protamine), seconds 158 (93) 149 (20) MD: (95%CI): –9.0 (–35.2,
17.2); P=0.50 Mean (SD) platelet count (baseline), x 1000/µL 203 (66) 200 (78) MD: (95%CI): –3.0 (–31.3,
25.3); P=0.83 Mean (SD) platelet count (warming on CPB), x 1000/µL 92 (79) 96 (79) MD: (95%CI): 4.0 (–26.9,
34.9); P=0.80 Mean (SD) platelet count (ICU), x 1000/µL 111 (48) 120 (48) MD: (95%CI): 9 (–9.8, 27.8);
P=0.34 Mean (SD) prothrombin time (baseline), seconds 13.0 (1.1) 12.9 (1.3) MD: (95%CI): –0.1 (–0.6,
0.4); P=0.67 Mean (SD) prothrombin time (post-protamine), seconds 18.1 (2.3) 21.3 (26) MD: (95%CI): 3.2 (–4.1,
10.5); P=0.38 Mean (SD) prothrombin time (ICU), seconds 16.1 (1.7) 15.7 (1.6) MD: (95%CI): –0.4 (–1.0,
0.2); P=0.22 Mean (SD) aPTT (baseline), seconds 31.6 (6.9) 34.1 (13.1) MD: (95%CI): 2.5 (–1.6, 6.6);
P=0.23 Mean (SD) aPTT (post-protamine), seconds 52.2 (48.0) 43.0 (14) MD: (95%CI): –9.2 (–23.0,
4.6); P=0.19 Mean (SD) aPTT (ICU), seconds 35.9 (6.1) 36.8 (10.2) MD: (95%CI): 0.9 (–2.4, 4.2);
P=0.59 Mean (SD) fibrinogen concentration (baseline), mg/dL 409 (82) 416 (118) MD: (95%CI): 7 (–32.8,
46.8); P=0.73

Technical report on perioperative patient blood management – Volume 1b July 2011 102
Author (year) Surgical procedure
Outcome TEG No TEG Statistical significance
Mean (SD) fibrinogen concentration (post-protamine), mg/dL
239 (86) 246 (86) MD: (95%CI): 7.0 (–26.6, 40.6); P=0.68
Mean (SD) fibrinogen concentration (ICU), mg/dL 259 (95) 263 (118) MD: (95%CI): 4.0 (–37.9,
45.9); P=0.85
Mortality, n/N (%) 0/53 (0) 2/52 (4) RR (95%CI): 0.20 (0.01, 3.99); P=0.29
Reoperation for bleeding, n/N (%) 0/53 (0) 2/52 (4) RR (95%CI): 0.20 (0.01,
3.99); P=0.29
Cerebrovascular ischemic event, n/N (%) 1/53 (2) 0/52 (0)
RR (95%CI): 2.94 (0.12, 70.67) P=0.51
Westbrook (2009)(63) Cardiac surgery c
Median (IQR) blood loss, mL 875 (755–1130) 960 (820–1200) P=0.437 Units of blood products transfused intraoperatively 19 44 NS (P-value NR)
Units of blood products transfused in ICU 18 46 NS (P-value NR)
Total units of blood products transfused 37 90 NS (P-value NR)
Units of PRBCs transfused intraoperatively 11 15 NS (P-value NR)
Units of PRBCs transfused in ICU 3 18 NS (P-value NR)
Total units of PRBCs transfused 14 33 NS (P-value NR) Units of FFP transfused intraoperatively 8 14 NS (P-value NR)
Units of FFP transfused postoperatively 10 8 NS (P-value NR)
Total units of FFP transfused 18 22 NS (P-value NR) Units of platelets transfused intraoperatively 0 10 NS (P-value NR)
Units of platelets transfused postoperatively 5 5 NS (P-value NR)
Total units of platelets transfused 5 15 NS (P-value NR)
Units of cryoprecipitate transfused intraoperatively 0 5 NS (P-value NR)
Units of cryoprecipitate transfused postoperatively 0 15 NS (P-value NR)
Total units of cryoprecipitate transfused 0 20 NS (P-value NR)
Median (IQR) Hb concentration, g/L 87 (83–94) 86 (82–104) NS (P-value NR)
Median (IQR) length of ICU stay, hours
29.4 (14.3, 56.4) 32.5 (22, 74.5) NS (P-value NR)
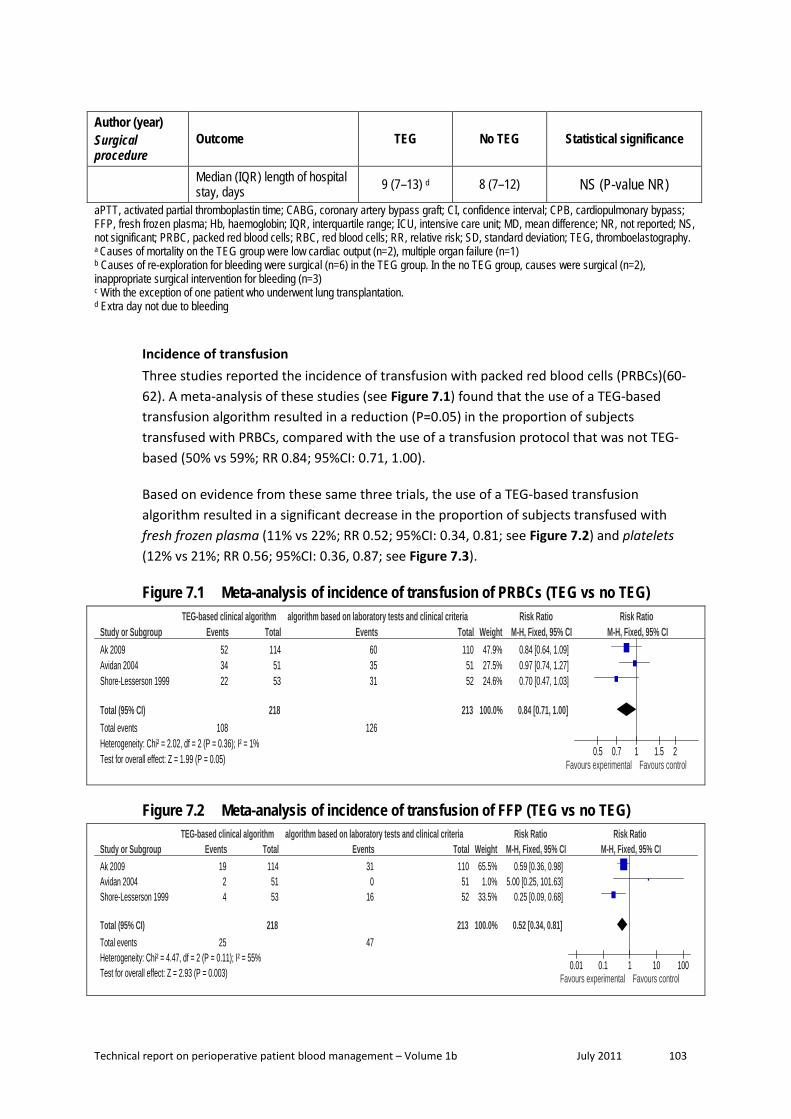
Technical report on perioperative patient blood management – Volume 1b July 2011 103
Author (year) Surgical procedure
Outcome TEG No TEG Statistical significance
Median (IQR) length of hospital stay, days 9 (7–13) d 8 (7–12) NS (P-value NR)
aPTT, activated partial thromboplastin time; CABG, coronary artery bypass graft; CI, confidence interval; CPB, cardiopulmonary bypass; FFP, fresh frozen plasma; Hb, haemoglobin; IQR, interquartile range; ICU, intensive care unit; MD, mean difference; NR, not reported; NS, not significant; PRBC, packed red blood cells; RBC, red blood cells; RR, relative risk; SD, standard deviation; TEG, thromboelastography. a Causes of mortality on the TEG group were low cardiac output (n=2), multiple organ failure (n=1) b Causes of re-exploration for bleeding were surgical (n=6) in the TEG group. In the no TEG group, causes were surgical (n=2), inappropriate surgical intervention for bleeding (n=3) c With the exception of one patient who underwent lung transplantation. d Extra day not due to bleeding
Incidence of transfusion Three studies reported the incidence of transfusion with packed red blood cells (PRBCs)(60-62). A meta-analysis of these studies (see Figure 7.1) found that the use of a TEG-based transfusion algorithm resulted in a reduction (P=0.05) in the proportion of subjects transfused with PRBCs, compared with the use of a transfusion protocol that was not TEG-based (50% vs 59%; RR 0.84; 95%CI: 0.71, 1.00).
Based on evidence from these same three trials, the use of a TEG-based transfusion algorithm resulted in a significant decrease in the proportion of subjects transfused with fresh frozen plasma (11% vs 22%; RR 0.52; 95%CI: 0.34, 0.81; see Figure 7.2) and platelets (12% vs 21%; RR 0.56; 95%CI: 0.36, 0.87; see Figure 7.3).
Figure 7.1 Meta-analysis of incidence of transfusion of PRBCs (TEG vs no TEG)
Study or SubgroupAk 2009Avidan 2004Shore-Lesserson 1999
Total (95% CI)Total eventsHeterogeneity: Chi² = 2.02, df = 2 (P = 0.36); I² = 1%Test for overall effect: Z = 1.99 (P = 0.05)
Events523422
108
Total114
5153
218
Events603531
126
Total110
5152
213
Weight47.9%27.5%24.6%
100.0%
M-H, Fixed, 95% CI0.84 [0.64, 1.09]0.97 [0.74, 1.27]0.70 [0.47, 1.03]
0.84 [0.71, 1.00]
TEG-based clinical algorithm algorithm based on laboratory tests and clinical criteria Risk Ratio Risk RatioM-H, Fixed, 95% CI
0.5 0.7 1 1.5 2Favours experimental Favours control
Figure 7.2 Meta-analysis of incidence of transfusion of FFP (TEG vs no TEG)
Study or SubgroupAk 2009Avidan 2004Shore-Lesserson 1999
Total (95% CI)Total eventsHeterogeneity: Chi² = 4.47, df = 2 (P = 0.11); I² = 55%Test for overall effect: Z = 2.93 (P = 0.003)
Events1924
25
Total1145153
218
Events310
16
47
Total1105152
213
Weight65.5%1.0%
33.5%
100.0%
M-H, Fixed, 95% CI0.59 [0.36, 0.98]
5.00 [0.25, 101.63]0.25 [0.09, 0.68]
0.52 [0.34, 0.81]
TEG-based clinical algorithm algorithm based on laboratory tests and clinical criteria Risk Ratio Risk RatioM-H, Fixed, 95% CI
0.01 0.1 1 10 100Favours experimental Favours control

Technical report on perioperative patient blood management – Volume 1b July 2011 104
Figure 7.3 Meta-analysis of incidence of transfusion of platelets (TEG vs no TEG)
Study or SubgroupAk 2009Avidan 2004Shore-Lesserson 1999
Total (95% CI)Total eventsHeterogeneity: Chi² = 1.35, df = 2 (P = 0.51); I² = 0%Test for overall effect: Z = 2.59 (P = 0.010)
Events1727
26
Total1145153
218
Events291
15
45
Total1105152
213
Weight64.6%2.2%
33.2%
100.0%
M-H, Fixed, 95% CI0.57 [0.33, 0.97]
2.00 [0.19, 21.37]0.46 [0.20, 1.03]
0.56 [0.36, 0.87]
TEG-based clinical algorithm algorithm based on laboratory tests and clinical criteria Risk Ratio Risk RatioM-H, Fixed, 95% CI
0.01 0.1 1 10 100Favours experimental Favours control
The study by Royston (2001) reported the proportion of patients transfused with blood components but did not report what blood products were transfused. Although the proportion of patients transfused was lower in the group transfused using a TEG-based algorithm compared with clinician discretion (17% vs 33%), this difference was not statistically significant (RR 0.50; 95%CI: 0.19, 1.29), which may be due to the small population size (N=60).
Volume of transfusion Three studies reported the volume of PRBCs transfused as an outcome(60;62;63). All three studies found no significant difference between study arms in the volume of PRBCs transfused. Due to differences in reporting of this outcome, a meta-analysis could not be conducted.
In terms of the volume of FFP transfused, Ak (2009)(60) reported a significantly lower volume in the group that used a TEG-based transfusion algorithm compared with clinician-directed transfusion (P=0.001). Shore-Lesserson (1999)(62) also found a significant reduction in the total volume of FFP transfused in patients transfused using a TEG-guided algorithm versus a laboratory-based protocol (mean 36 vs 217 units; P<0.05). However, Westbrook (2009)(63) found no significant difference between study groups in the total volume of FFP transfusion, although the direction of effect favoured the group that used a TEG-based transfusion algorithm compared with clinician directed administration (18 units in the TEG group vs 22 units in the clinician discretion group).
In terms of the volume of platelets transfused, Shore-Lesserson (1999)(62) and Westbrook (2009)(63) found no statistically significant difference between study groups for this outcome; however, in both studies the mean volume of platelets transfused was lower in the group using a TEG-based transfusion algorithm. Ak (2009)(60) reported that the use of a TEG-based transfusion algorithm significantly reduced the volume of platelets transfused compared with clinician-directed transfusion (P=0.001).
Mortality A meta-analysis of the two Level II studies(60;62) that reported mortality as an outcome found no significant difference between groups transfused using a TEG-based transfusion algorithm compared with a transfusion protocol that was not TEG-based (1.8% vs 2.5%;

Technical report on perioperative patient blood management – Volume 1b July 2011 105
RR 0.75; 95%CI: 0.19, 3.02; see Figure 7.4). These studies were insufficiently powered to detect a difference in this outcome.
Figure 7.4 Meta-analysis of rate of mortality (TEG vs no TEG)
Study or SubgroupAk 2009Shore-Lesserson 1999
Total (95% CI)Total eventsHeterogeneity: Chi² = 1.29, df = 1 (P = 0.26); I² = 22%Test for overall effect: Z = 0.40 (P = 0.69)
Events30
3
Total11453
167
Events22
4
Total11052
162
Weight44.7%55.3%
100.0%
M-H, Fixed, 95% CI1.45 [0.25, 8.50]0.20 [0.01, 3.99]
0.75 [0.19, 3.02]
TEG-based clinical algorithm algorithm based on laboratory tests and clinical criteria Risk Ratio Risk RatioM-H, Fixed, 95% CI
0.01 0.1 1 10 100Favours experimental Favours control
Reoperation for bleeding All three studies that reported reoperation for bleeding as an outcome found that the use of a TEG-based transfusion algorithm had no significant effect on the rate of reoperation for bleeding compared with a transfusion protocol that was not based on TEG(60-62). A meta-analysis conducted herein (see Figure 7.5) confirmed these findings (3.2% vs 3.8%; RR 0.86; 95%CI: 0.33, 2.25).
Figure 7.5 Meta-analysis of rate of reoperation for bleeding (TEG vs no TEG)
Study or SubgroupAk 2009Avidan 2004Shore-Lesserson 1999
Total (95% CI)Total eventsHeterogeneity: Chi² = 1.19, df = 2 (P = 0.55); I² = 0%Test for overall effect: Z = 0.31 (P = 0.76)
Events610
7
Total1145153
218
Events512
8
Total1105152
213
Weight59.1%11.6%29.3%
100.0%
M-H, Fixed, 95% CI1.16 [0.36, 3.68]
1.00 [0.06, 15.56]0.20 [0.01, 3.99]
0.86 [0.33, 2.25]
TEG-based clinical algorithm algorithm based on laboratory tests and clinical criteria Risk Ratio Risk RatioM-H, Fixed, 95% CI
0.005 0.1 1 10 200Favours experimental Favours control
Level III evidence A literature search of Level III studies found two studies examining the effect of perioperative point-of-care testing that were considered relevant to this research question(61;65). The main characteristics of the studies are summarised in Table 7.3.
Table 7.3 Characteristics and quality of Level III evidence for TEG-based point-of-care testing
Author (Year)
Study type Study quality
Population Interventions Outcomes
Avidan (2004)(61)
Historical cohort Fair
Adults undergoing elective, first-time CABG with CPB N=102
Algorithm based on near-patient haemostatic testinga vs algorithm using routine laboratory haemostatic tests vs clinician disrection (historical comparator)
Blood loss Transfusion (%) Transfusion volume Haemoglobin concentration Reoperation for bleeding

Technical report on perioperative patient blood management – Volume 1b July 2011 106
Author (Year)
Study type Study quality
Population Interventions Outcomes
Spalding (2007)(65)
Before and after cohort study Fair
Adults undergoing cardiac surgery N=1422
TEG vs no TEG Mortality
CABG, coronary artery bypass graft; CPB, cardiopulmonary bypass; TEG, thromboelastography. a The point-of-care test algorithm in Avidan (2004) included not only TEG but also ACT+/Junior, Hepcon HMS Hemostasis Management System and PFA–100 platelet function analyser.
The results from the two Level III studies are summarised in Table 7.4. The relevant outcomes assessed include operative blood loss, transfusion requirements, haemoglobin concentration, mortality and reoperation for bleeding.
Table 7.4 Results for Level III evidence: TEG-based point-of-care testing versus no TEG-based point-of-care testing
Author (year) Surgical
procedure Outcome TEG No TEG Statistical significance
Avidan (2004)(61) CABG with CPB
Median (IQR) 24-hour postoperative blood loss, mL 755 (606, 975) 810 (550, 1295) NR
Patients transfused with PRBCs, n/N (%) 34/51 (67) 92/108 (85) RR (95%CI): 0.78 (0.63,
0.96); P=0.02 Patients transfused with FFP, n/N (%) 2/51 (4) 16/108 (15) RR (95%CI): 0.26 (0.06,
1.11); P=0.07 Patients transfused with platelets, n/N (%) 2/51 (4) 14/108 (13) RR (95%CI): 0.30 (0.07,
1.28); P=0.10
Total units of PRBCs transfused 99 285 NR
Median (IQR) volume of PRBCs transfused, mL 500 (0, 678) 512 (286, 962) NR
Total units of platelets transfused 3 14 NR
Total units of FFP transfused 6 65 NR Median (IQR) postoperative 24-hour Hb, g/dL 10.1 (9, 10.9) 10.1 (9.6, 10.8) NR
Median (IQR) postoperative 24-hour platelet count, x109/L 149 (123, 187) 144 (121, 174) NR
Reoperation for bleeding, n/N (%) 1/51 (2) 3/108 (3) RR (95%CI): 0.71 (0.08,
6.62); P=0.76 Spalding (2007)(65) Cardiac
Reoperation, n/N (%) 38/693 (5.5) 48/729 (6.6) RR (95%CI): 0.83 (0.55, 1.26); P=0.38
Mortality, n/N (%) 41/693 (6) 43/729 (5.9) RR (95%CI): 1.00 (0.66, 1.52); P=0.99
CI, confidence interval; FFP, fresh frozen plasma; Hb, haemoglobin; IQR, interquartile range; NR, not reported; PRBC, packed red blood cells; RR, relative risk; TEG, thromboelastography.
A meta-analysis of Level II and III evidence evaluating the association between the use of a TEG-based transfusion algorithm and mortality was conducted (see Figure 7.6). The Level II
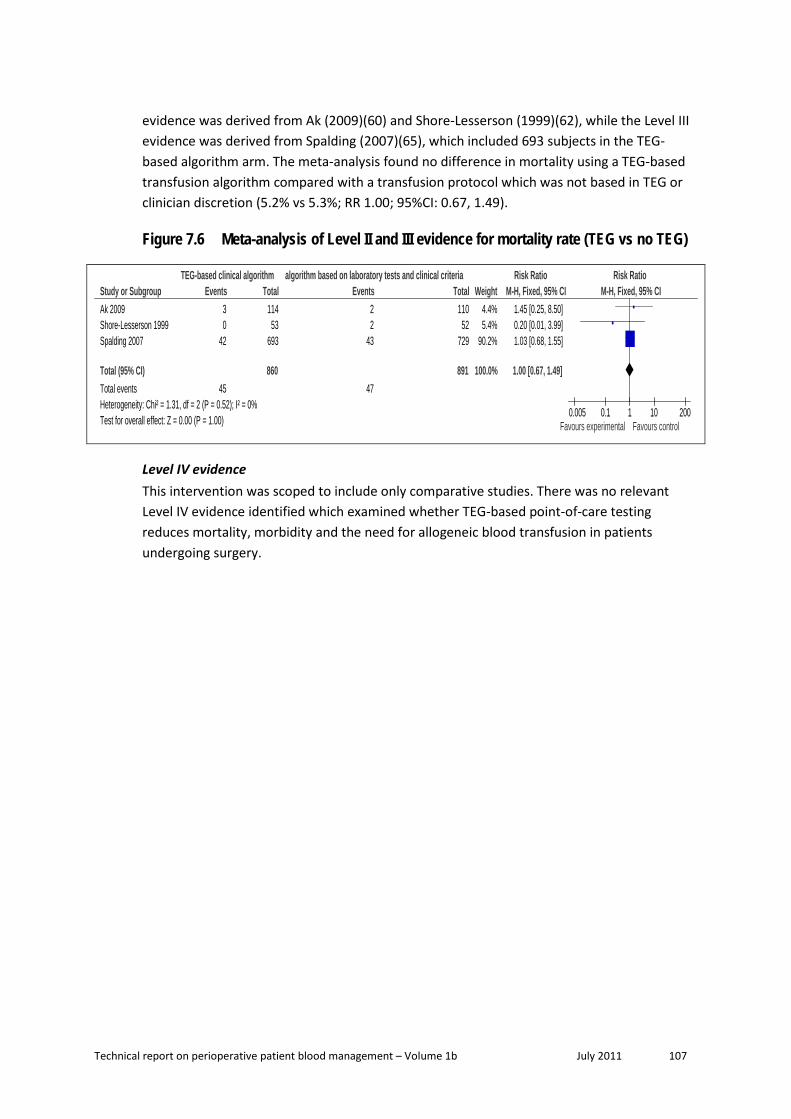
Technical report on perioperative patient blood management – Volume 1b July 2011 107
evidence was derived from Ak (2009)(60) and Shore-Lesserson (1999)(62), while the Level III evidence was derived from Spalding (2007)(65), which included 693 subjects in the TEG-based algorithm arm. The meta-analysis found no difference in mortality using a TEG-based transfusion algorithm compared with a transfusion protocol which was not based in TEG or clinician discretion (5.2% vs 5.3%; RR 1.00; 95%CI: 0.67, 1.49).
Figure 7.6 Meta-analysis of Level II and III evidence for mortality rate (TEG vs no TEG)
Study or SubgroupAk 2009Shore-Lesserson 1999Spalding 2007
Total (95% CI)Total eventsHeterogeneity: Chi² = 1.31, df = 2 (P = 0.52); I² = 0%Test for overall effect: Z = 0.00 (P = 1.00)
Events30
42
45
Total11453
693
860
Events22
43
47
Total11052
729
891
Weight4.4%5.4%
90.2%
100.0%
M-H, Fixed, 95% CI1.45 [0.25, 8.50]0.20 [0.01, 3.99]1.03 [0.68, 1.55]
1.00 [0.67, 1.49]
TEG-based clinical algorithm algorithm based on laboratory tests and clinical criteria Risk Ratio Risk RatioM-H, Fixed, 95% CI
0.005 0.1 1 10 200Favours experimental Favours control
Level IV evidence This intervention was scoped to include only comparative studies. There was no relevant Level IV evidence identified which examined whether TEG-based point-of-care testing reduces mortality, morbidity and the need for allogeneic blood transfusion in patients undergoing surgery.

Technical report on perioperative patient blood management – Volume 1b July 2011 108
8 Administrat ion of ant i f ibrinolyt ics and DDAVP
A. APROTININ Aprotinin is a serine protease inhibitor with antifibrinolytic activity that has been used to reduce bleeding during surgery with a risk of substantial blood loss.
Aprotinin is not currently available in Australia and New Zealand. The following quote is from the Therapeutic Goods Administration (TGA) website:2
On 6 November 2007, Bayer Australia Ltd announced a worldwide suspension of the supply of Trasylol (aprotinin) injection. This follows the release of preliminary results from the BART clinical trial that suggested an increased risk of death for patients receiving Trasylol (aprotinin) compared to those receiving the alternative medications of aminocaproic acid or tranexamic acid for control of bleeding during heart surgery.
Trasylol is registered in Australia to reduce the risk of blood loss and reduce the need for blood transfusion in adults undergoing cardiopulmonary bypass for coronary artery bypass graft surgery where the risk of bleeding is high or where blood transfusion is unavailable or unacceptable. Aminocaproic acid and tranexamic acid injections are not registered in Australia. However tranexamic acid injection has some use under the Special Access Scheme for individual patients.
The BART clinical trial was a randomised, controlled trial in cardiac surgery patients in Canada. It was halted early due to safety concerns. The information on this trial is limited and preliminary at this stage. Once the full data are available, the TGA, along with other regulatory agencies, will review the findings and reassess the risk benefit profile for Trasylol (aprotinin).
Due to these safety concerns and the restricted availability of aprotinin, these guidelines make no recommendations on the use of aprotinin.
Methods
The systematic review process identified 30 Level I studies (systematic reviews of randomised controlled trials; RCTs) that assessed the effect of aprotinin, tranexamic acid and ε-aminocaproic acid or desmopressin for minimising perioperative blood loss on morbidity, mortality and transfusion. Due to the large amount of available evidence, Level I studies were only included if they formally pooled the relevant outcome data; this resulted in the exclusion of only three potentially relevant Level I studies.
2 http://www.tga.gov.au/alerts/trasylol.htm; accessed15 February 2010.

Technical report on perioperative patient blood management – Volume 1b July 2011 109
Of the 30 Level I studies identified, 19 studies provided data on aprotinin. As 19 studies meeting the requirements of Level I evidence were identified, lower levels of evidence were not comprehensively searched. However, as the most comprehensive and highest quality Level I evidence available for aprotinin, Henry (2007), was updated only to June 2006, a search of Level II (RCT) evidence was conducted to identify additional studies. This search identified seven RCTs relevant to this review.
The search for evidence of the effectiveness and safety of aprotinin was limited to the comparison between aprotinin and no aprotinin (i.e. no treatment or placebo). Thus, a formal systematic review comparing aprotinin with other active therapies including the lysine analogues, tranexamic acid and ε-aminocaproic acid, was not conducted. However, where appropriate, evidence relating to the comparison between aprotinin and the lysine analogues has been discussed.
No socioeconomic literature pertaining to Australia’s Indigenous population was identified in the literature search for this research question.
One published cost-effectiveness analysis on the use of cell salvage compared with alternative transfusion strategies (including antifibrinolytics as a group) was identified in the literature search for this research question. A brief summary of the findings of this report was presented after the review of the clinical evidence for intraoperative cell salvage (see Section 2).
Level I evidence Nineteen relevant systematic reviews that included formal meta-analysis of data were identified. All compared aprotinin with no aprotinin (placebo or no treatment). A summary of the key features of the 19 identified systematic reviews is provided in Table 8.1. Studies have been arranged in order of literature search date to show which of the systematic reviews provide the most up-to-date and comprehensive data.
There is substantial overlap between many of the systematic reviews. As such, a decision was made to limit the consideration of evidence to the most up-to-date and comprehensive reviews for each population and surgery type. For these reasons, the following reviews provide pivotal evidence and were chosen to form the basis of the guideline evaluation (shown in shading in Table 8.1):
• Henry (2007)(66) – provides a comprehensive analysis of intravenous (IV) aprotinin in adults undergoing all surgery types.
• Abrishami (2009)(67) – provides an analysis of the use of topical aprotinin in adults undergoing cardiac surgery.
• Schouten (2009)(68) – provides a comprehensive analysis of IV aprotinin in children undergoing major surgery (cardiac and scoliosis).

Technical report on perioperative patient blood management – Volume 1b July 2011 110
Most other reviews were either superseded by one of the included reviews, or were limited to specific surgery types. Reviews published after the pivotal reviews have been included as supportive evidence. Reviews published prior to the pivotal reviews are considered to have been superseded and have not been formally assessed in this review.
The quality of each of the included systematic reviews was assessed using National Health and Medical Research Council (NHMRC) criteria and is presented in Table 8.1.
Table 8.1 Characteristics of Level I evidence for aprotinin Author (Year) Study quality
Date of search
Population Surgery
Treatment (mode of administration)
No. of included RCTs
Relevant outcomes
Gurusamy (2009)(69) Cochrane review Faira
Nov 2008 Adult Liver resection
AP (IV) TXA (Oral) DP (IV)
1 1 1
Transfusion incidence Transfusion volume Blood loss Mortality Morbidity
Abrishami (2009)(67) Good
Jul 2008 Adult Cardiac
AP (topical) TXA (topical)
5 4
Transfusion incidence Transfusion volume Blood loss
McIlroy (2009)(70) Good
Jul 2008 Adult + aspirin Cardiac
AP (IV) TXA/ACA (IV)
13 3
Transfusion incidence Transfusion volume Blood loss Mortality Reoperation Morbidity
Henry (2009)(71) Good
Jan 2008 Adult Cardiac
AP (IV) TXA (IV) ACA (IV)
81 23 6
Mortality Morbidity
Liu (2008)(72) Poor
NR Adult Orthotopic liver transplant
AP (IV) 7b Morbidity
Tzortzopoulou (2008)(73) Cochrane review Good
Jul 2007 Children Scoliosis
AP (IV) TXA (IV) ACA (IV)
2 2 2
Transfusion incidence Transfusion volume Blood loss
Kagoma (2009)(74) Good
May 2007 Adult Orthopaedic
AP/TXA/ACA (IV)c 29 Transfusion incidence Blood loss Morbidity
Schouten (2009)(68) Fair
Oct 2006 Children Cardiac and scoliosis
AP (IV) TXA (IV) ACA (IV)
18 7 4
Transfusion volume Blood loss

Technical report on perioperative patient blood management – Volume 1b July 2011 111
Author (Year) Study quality
Date of search
Population Surgery
Treatment (mode of administration)
No. of included RCTs
Relevant outcomes
Brown (2007)(75) Fair
Jul 2006 Adult Cardiac
AP (IV) TXA (IV) ACA (IV)
110 31 18
Transfusion incidence Blood loss Mortality Reoperation Morbidity
Henry (2007)(66) Cochrane review Good
Jul 2006 Adult Any
AP (IV) TXA (IV) ACA (IV)
116 45 11
Transfusion incidence Transfusion volume Blood loss Mortality Reoperation Morbidity
Zufferey (2006)(76) Jul 2005 Adult Orthopaedic
AP (IV) TXA (IV) ACA (IV)
23 20 4
Transfusion incidence Morbidity
Arnold (2006)(77) Jan 2005 Children Cardiac
AP (IV) 12 Transfusion incidence Transfusion volume Blood loss
Gill (2006)(78) NR Adult Orthopaedic
AP (IV) TXA (IV)
7 6
Transfusion incidence Transfusion volume Blood loss Morbidity
Shiga (2005)(79) Oct 2004 Adult Orthopaedic
AP (IV) 13 Transfusion volume Blood loss Morbidity
Sedrayken (2004)(80)
2001 Adult CABG
AP (IV) 35 Transfusion incidence Mortality
Levi (1999)(81) Dec 1999 Adult Cardiac
AP (IV) TXA/ACA (IV) DP (IV)
45 17 16
Transfusion incidence Transfusion volume Blood loss Mortality Reoperation Morbidity
Fergusson (2005)(82) Mar 1997 Adult Cardiac
AP (IV) 64 Transfusion incidence
Laupacis (1997)(83) Mar 1997 Adult Cardiac
AP (IV) TXA (IV) ACA (IV) DP (IV)
45 12 3 12
Transfusion incidence

Technical report on perioperative patient blood management – Volume 1b July 2011 112
Author (Year) Study quality
Date of search
Population Surgery
Treatment (mode of administration)
No. of included RCTs
Relevant outcomes
Fremes (1994)(84) Jun 1993 Adult Cardiac
AP (IV) TXA (IV) ACA (IV) DP (IV)
14 2 2 13
Transfusion incidence Transfusion volume Blood loss Mortality Reoperation
Note: Systematic reviews that form the basis of this evaluation are shown in dark shading (pivotal reviews). Systematic reviews which have literature searches which are more up-to-date than the pivotal reviews are shown in light shading (supportive reviews). Only treatments relevant to this module are shown here. Relevant treatments not assessed in this section of the report are shown in italics. Treatments were assumed to be given intravenously if the mode of administration was not specifically stated as IV, topical or oral. ACA, ε-aminocaproic acid; AP, aprotinin; DP, desmopressin; IV, intravenous; RCT, randomised controlled trial; TXA, tranexamic acid. a This was a good quality systematic review including data from one fair quality RCT for aprotinin. b 7 studies were included in the systematic review (6 RCTs and 1 non-RCT). However, only the analysis of thrombosis (morbidity) was limited to data from RCTs, so this is the only outcome included in the current review. One RCT used TXA as a comparator. This study was excluded from the analysis presented in this report. c All treatments were administered intravenously except for some oral use of TXA in one included study.
The results of the included reviews will be presented according to population group (adult and paediatric). In addition, two different formulations of aprotinin will be assessed in the adult population (IV aprotinin and topical aprotinin).
Adult population Intravenous aprotinin The results of the comprehensive Cochrane review by Henry (2007)(66), which assessed the use of IV aprotinin in adults and provides the pivotal evidence for this review, are summarised in Table 8.2. This review was considered to be of good methodological quality based on assessment using NHMRC quality criteria. The meta-analyses were conducted using the random effects method (REM).
Three dose stratifications were used in the Henry (2007) review and were defined as follows:
• High dose-aprotinin:
o For cardiac surgery, this was defined as the ‘full Hammersmith’ regimen and involved an initial loading dose of 2 million kallikrein inactivator units (KIU) of aprotinin given intravenously (280 mg) over a 20–30 minute period commencing at the induction of anaesthesia, followed by a continuous infusion of 500,000 KIU per hour (70 mg/hour) until the end of surgery. An additional 2 million KIU of aprotinin (280 mg) is added to the oxygenator prime or pump prime of the cardiopulmonary bypass (CPB).
o For noncardiac surgery, high dose was classified as a total dose equal to or exceeding 5 million KIU or 700 mg aprotinin.
• Low-dose aprotinin:

Technical report on perioperative patient blood management – Volume 1b July 2011 113
o For cardiac surgery, low-dose aprotinin was classified as any regimen that did not follow the full Hammersmith regimen or where the regimen was described as ‘half Hammersmith’ (in which doses were half that of the full Hammersmith regimen).
o For noncardiac surgery, low-dose aprotinin was defined as a regimen with a total dose < 5 million KIU or 700 mg aprotinin.
• ‘Prime’ dose aprotinin:
o For cardiac surgery only. Included regimens that added aprotinin to the pump prime solution of the CPB exclusively. The majority of trials (12/16) used a ‘prime’ dose of 2 million KIU while other doses used were 1 million KIU (2 trials), 500,000 KIU (1 trial) and 500,000 KIU/kg (1 trial; range 1.375 to 2.3 million in total).
The results of the analyses show that aprotinin therapy compared with no therapy (i.e. placebo/no treatment) is highly effective at reducing the requirement for allogeneic blood transfusion (RR 0.66; 95%CI: 0.62, 0.71; P<0.001)(66). The difference in the proportion of surgical patients in the two treatment arms who required transfusion was consistent regardless of study quality (RR 0.65; 95%CI: 0.54, 0.78 for Cochrane Scale A; RR 0.68; 95%CI: 0.63, 0.73 for Cochrane Scale B and; RR 0.60; 95%CI: 0.49, 0.73 for Cochrane Scale C; with Cochrane Scale A representing the highest quality evidence and Cochrane Scale C representing the lowest quality evidence). While there was significant heterogeneity for the overall analysis and most of the surgery-type subgroup analyses, this heterogeneity appears to be the result of differences in the magnitude of effect for aprotinin therapy compared with no therapy, rather than a lack of effect in some studies.
There were also significant differences between aprotinin therapy and no therapy in reducing the units of blood transfused in patients who required a transfusion (WMD: –0.96; 95%CI: –1.24, –0.68; P<0.001) and reducing the volume (mL) of total blood loss (WMD: –414.48; 95%CI: –520.13, –308.82; P<0.001)(66).
The effectiveness of aprotinin is consistent across most surgery types and, in particular, the most commonly studied surgery types: cardiac and orthopaedic surgery.
Treatment with aprotinin did not result in increased mortality compared with no treatment (RR 0.90; 95%CI: 0.67, 1.20; P=0.47)(66); however, the analysis is underpowered to detect a clinically significant difference. In addition, aprotinin was not associated with increased morbidity; however, non-statistically significant increases in pulmonary embolism (RR 1.98; 95%CI: 0.38, 10.46; P=0.42) and renal failure/dysfunction (RR 1.16; 95%CI: 0.79, 1.70; P=0.46) were observed. Once again, the analyses may not have been sufficiently powered to detect a difference for these or other morbidity outcomes. Large observational studies have shown increased risk of renal failure, MI and all-cause mortality associated with the use of aprotinin in cardiac surgery.

Technical report on perioperative patient blood management – Volume 1b July 2011 114
Table 8.2 Results for Level I evidence: aprotinin versus no aprotinin in adults Author (year) No. of trials (N)
No. of trials included in analysis (N)a
Aprotinin No aprotinin Pooled risk estimate
Exposure to allogeneic blood transfusion
n/N (%) RR (95%CI) Henry (2007)(66) 99 trials (N=10,144)
96 trials (N=9949) 2521/5750 (43.8) 2827/4394 (64.3) All studies
0.66 (0.62, 0.71) P<0.001 (Phet<0.001)
By surgery type
Henry (2007)(66) 77 trials (N=8837) 76 trials (N=8793)
2279/5003 (45.6) 2535/3834 (66.1) Cardiac surgery 0.66 (0.61, 0.72) P<0.001 (Phet<0.001)
Henry (2007)(66) 14 trials (N=794) 13 trials (N=771)
111/480 (23.1) 138/314 (43.9) Orthopaedic surgery 0.69 (0.56, 0.85) P<0.001 (Phet=0.23)
Henry (2007)(66) 2 trials (N=62) 4/30 (13.3) 16/32 (50.0) Thoracic surgery 0.28 (0.11, 0.74) P=0.011(Phet=0.54)
Henry (2007)(66) 2 trials (N=188) 1 trial (N=60)
94/105 (89.5) 77/83 (92.8) Vascular surgery 1.01 (0.72, 1.40) P=0.98 (Phet=NA)
Henry (2007)(66) 2 trials (N=177) 21/87 (24.1) 39/90 (43.3) Liver surgery 0.58 (0.37, 0.90) P=0.015 (Phet=0.31)
Henry (2007)(66) 1 trial (N=56) 11/30 (36.7) 13/26 (50.0) Neuro surgery 0.73 (0.40, 1.35) P=0.32 (Phet=NA)
Henry (2007)(66) 1 trial (N=30) 1/15 (6.7) 9/15 (60.0) Orthognathic surgery 0.11 (0.02, 0.77) P=0.026 (Phet=NA)
By dose
Henry (2007)(66) 16 trials (N=1251) 345/649 (53.2) 394/602 (65.4) Prime doseb 0.83 (0.71, 0.96) P=0.014 (Phet<0.001)
Henry (2007)(66) 46 trials (N=3268) 43 trials (N=3073)
648/1733 (37.4) 882/1535 (57.5) Low dosec 0.66 (0.59, 0.74) P<0.001 (Phet<0.001)
Henry (2007)(66) 56 trials (N=6569)
1522/3320 (45.8) 2204/3249 (67.8) High dosed 0.65 (0.60, 0.71) P<0.001 (Phet<0.001)
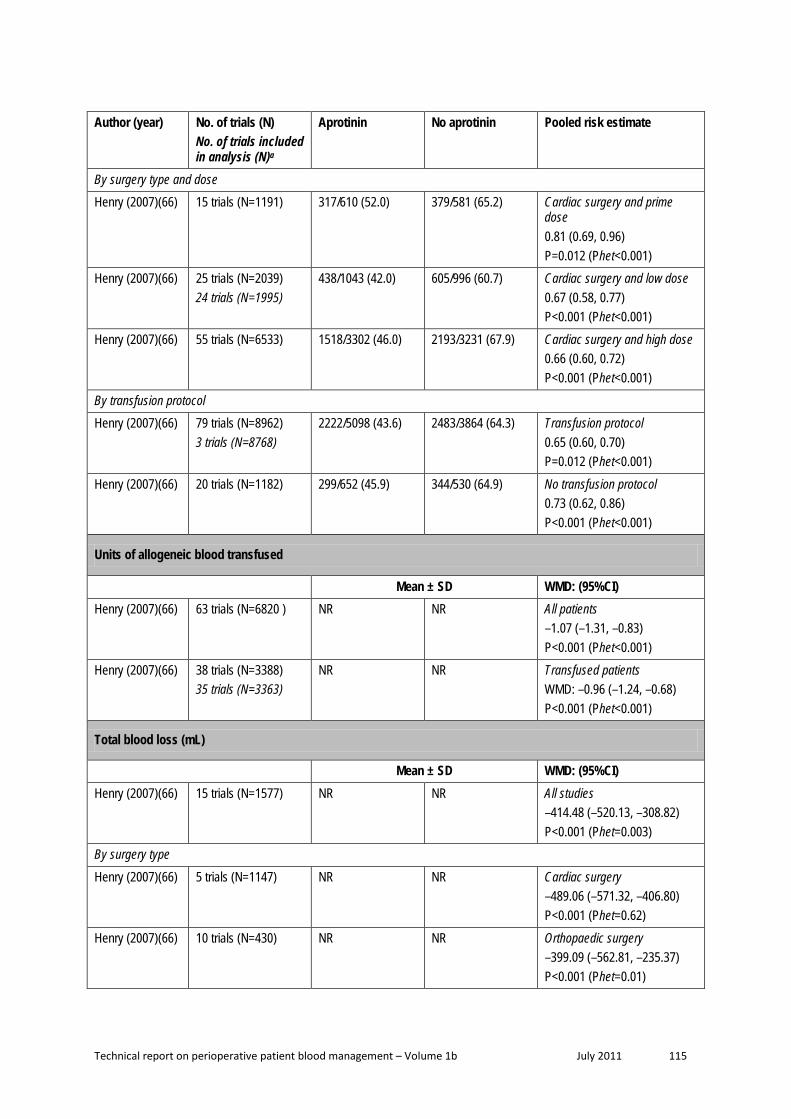
Technical report on perioperative patient blood management – Volume 1b July 2011 115
Author (year) No. of trials (N) No. of trials included in analysis (N)a
Aprotinin No aprotinin Pooled risk estimate
By surgery type and dose
Henry (2007)(66) 15 trials (N=1191) 317/610 (52.0) 379/581 (65.2) Cardiac surgery and prime dose 0.81 (0.69, 0.96) P=0.012 (Phet<0.001)
Henry (2007)(66) 25 trials (N=2039) 24 trials (N=1995)
438/1043 (42.0) 605/996 (60.7) Cardiac surgery and low dose 0.67 (0.58, 0.77) P<0.001 (Phet<0.001)
Henry (2007)(66) 55 trials (N=6533) 1518/3302 (46.0) 2193/3231 (67.9) Cardiac surgery and high dose 0.66 (0.60, 0.72) P<0.001 (Phet<0.001)
By transfusion protocol
Henry (2007)(66) 79 trials (N=8962) 3 trials (N=8768)
2222/5098 (43.6) 2483/3864 (64.3) Transfusion protocol 0.65 (0.60, 0.70) P=0.012 (Phet<0.001)
Henry (2007)(66) 20 trials (N=1182) 299/652 (45.9) 344/530 (64.9) No transfusion protocol 0.73 (0.62, 0.86) P<0.001 (Phet<0.001)
Units of allogeneic blood transfused
Mean ± SD WMD: (95%CI) Henry (2007)(66) 63 trials (N=6820 ) NR NR All patients
–1.07 (–1.31, –0.83) P<0.001 (Phet<0.001)
Henry (2007)(66) 38 trials (N=3388) 35 trials (N=3363)
NR NR Transfused patients WMD: –0.96 (–1.24, –0.68) P<0.001 (Phet<0.001)
Total blood loss (mL)
Mean ± SD WMD: (95%CI) Henry (2007)(66) 15 trials (N=1577) NR NR All studies
–414.48 (–520.13, –308.82) P<0.001 (Phet=0.003)
By surgery type
Henry (2007)(66) 5 trials (N=1147) NR NR Cardiac surgery –489.06 (–571.32, –406.80) P<0.001 (Phet=0.62)
Henry (2007)(66) 10 trials (N=430) NR NR Orthopaedic surgery –399.09 (–562.81, –235.37) P<0.001 (Phet=0.01)

Technical report on perioperative patient blood management – Volume 1b July 2011 116
Author (year) No. of trials (N) No. of trials included in analysis (N)a
Aprotinin No aprotinin Pooled risk estimate
Intraoperative blood loss (mL)
Mean ± SD WMD: (95%CI) Henry (2007)(66) 13 trials (N=722) NR NR All studies
–185.32 (–280.23, –90.41) P<0.001 (Phet<0.001)
By surgery type
Henry (2007)(66) 5 trials (N=360) NR NR Cardiac surgery –140.00 (–244.42, –35.59) P=0.0086 (Phet=0.01)
Henry (2007)(66) 5 trials (N=201) NR NR Orthopaedic surgery –151.05 (–317.63, 15.52) P=0.076 (Phet=0.16)
Henry (2007)(66) 1 trial (N=24) NR NR Thoracic surgery –532.0 (–863.00, –199.00) P=0.0016 (Phet=NA)
Henry (2007)(66) 2 trials (N=137) NR NR Liver surgery –1200.40 (–2943.39, 542.59) P=0.18 (Phet=0.02)
Postoperative blood loss (mL)
Mean ± SD WMD: (95%CI) Henry (2007)(66) 79 trials (N=7414) NR NR All studies
–358.13 (–403.64, –312.62) P<0.001 (Phet<0.001)
By surgery type
Henry (2007)(66) 68 trials (N=6948) NR NR Cardiac surgery –385.43 (–432.36, –338.50) P<0.001 (Phet<0.001)
Henry (2007)(66) 7 trials (N=318) NR NR Orthopaedic surgery –113.58 (–223.69, –3.46) P=0.043 (Phet=0.005)
Henry (2007)(66) 1 trial (N=24) NR NR Thoracic surgery –441.0 (–786.40, –95.60) P=0.012 (Phet=NA)
Henry (2007)(66) 1 trial (N=30) NR NR Orthognathic surgery –513.0 (–717.21, –308.79) P<0.001 (Phet=NA)
Henry (2007)(66) 1 trial (N=44) NR NR Liver surgery –105.0 (–194.36, –15.64) P=0.021 (Phet=NA)

Technical report on perioperative patient blood management – Volume 1b July 2011 117
Author (year) No. of trials (N) No. of trials included in analysis (N)a
Aprotinin No aprotinin Pooled risk estimate
Henry (2007)(66) 1 trial (N=50) NR NR Vascular surgery –203.00 (–404.93, –1.07) P=0.049 (Phet=NA)
By surgery type and dose
Henry (2007)(66) 15 trials (N=1158) NR NR Cardiac surgery and prime dose –343.08 (–458.13, –228.04) P<0.001 (Phet<0.001)
Henry (2007)(66) 21 trials (N=1781) NR NR Cardiac surgery and low dose –293.24 (–348.67, –237.81) P<0.001 (Phet<0.001)
Henry (2007)(66) 48 trials (N=4819) NR NR Cardiac surgery and high dose –428.09 (–485.38, –370.80) P<0.001 (Phet<0.001)
Reoperation for bleeding
n/N (%) RR (95%CI) Henry (2007)(66) 51 trials (N=5384)
36 trials (N=4715) 58/3030 (1.9) 110/2354 (4.7) All trials
0.48 (0.35, 0.68) P<0.001 (Phet=0.51)
Henry (2007)(66) 47 trials (N=5153) 33 trials (N=4534)
55/2915 (1.9) 101/2238 (4.5) Cardiac surgery 0.49 (0.34, 0.70) P<0.001 (Phet=0.41)
Mortality
n/N (%) RR (95%CI) Henry (2007)(66) 52 trials (N=7721)
37 trials (N=6645) 105/4319 (2.4) 87/3402 (2.6) All trials
0.90 (0.67, 1.20) P=0.47 (Phet=0.95)
Henry (2007)(66) 45 trials (N=7078) 31 trials (N=6058)
99/3907 (2.5) 77/3171 (2.4) Cardiac surgery 0.95 (0.70, 1.28) P=0.72 (Phet=0.93)
Myocardial infarction
n/N (%) RR (95%CI) Henry (2007)(66) 40 trials (N=6107)
34 trials (N=5758) 153/3523 (4.3) 118/2584 (4.6) All trials
0.92 (0.72, 1.18) P=0.50 (Phet=0.91)
Henry (2007)(66) 37 trials (N=5628) 31 trials (N=5279)
152/3204 (4.7) 113/2424 (4.7) Cardiac surgery 0.95 (0.74, 1.22) P=0.69 (Phet=0.92)

Technical report on perioperative patient blood management – Volume 1b July 2011 118
Author (year) No. of trials (N) No. of trials included in analysis (N)a
Aprotinin No aprotinin Pooled risk estimate
Stroke
n/N (%) RR (95%CI) Henry (2007)(66) 16 trials (N=2298)
14 trials (N=2158) 16/1458 (1.1) 14/840 (1.7) All trials
0.78 (0.38, 1.62) P=0.51 (Phet=0.71)
Henry (2007)(66) 11 trials (N=1303) 9 trials (N=1163)
10/773 (1.3) 10/530 (1.9) Cardiac surgery 0.76 (0.30, 1.93) P=0.57 (Phet=0.40)
Deep vein thrombosis
n/N (%) RR (95%CI) Henry (2007)(66) 15 trials (N=1104)
11 trials (N=986) 36/679 (5.3) 23/425 (5.4) All trials
0.79 (0.46, 1.34) P=0.38 (Phet=0.80)
Henry (2007)(66) 2 trials (N=272)
4/170 (2.4) 1/102 (1.0) Cardiac surgery 2.52 (0.41, 15.45) P=0.32 (Phet=0.71)
Pulmonary embolism
n/N (%) RR (95%CI) Henry (2007)(66) 3 trials (N=233)
2 trials (N=175) 4/129 (3.1) 2/104 (1.9) All trials
1.98 (0.38, 10.46) P=0.42 (Phet=0.95)
Other thrombosis
n/N (%) RR (95%CI) Henry (2007)(66) 9 trials (N=736)
7 trials (N=583) 5/402 (1.2) 8/334 (2.4) All trials
0.73 (0.25, 2.15) P=0.57 (Phet=0.64)
Henry (2007)(66) 4 trials (N=426) 3 trials (N=370)
2/245 (0.8) 4/181 (2.2) Cardiac surgery 0.62 (0.11, 3.36) P=0.58 (Phet=0.50)
Coronary artery graft occlusion
n/N (%) RR (95%CI) Henry (2007)(66) 2 trials (N=728)
54/369 (14.6) 39/359 (10.9) Cardiac surgery
0.76 (0.10, 5.67) P=0.79 (Phet=0.13)
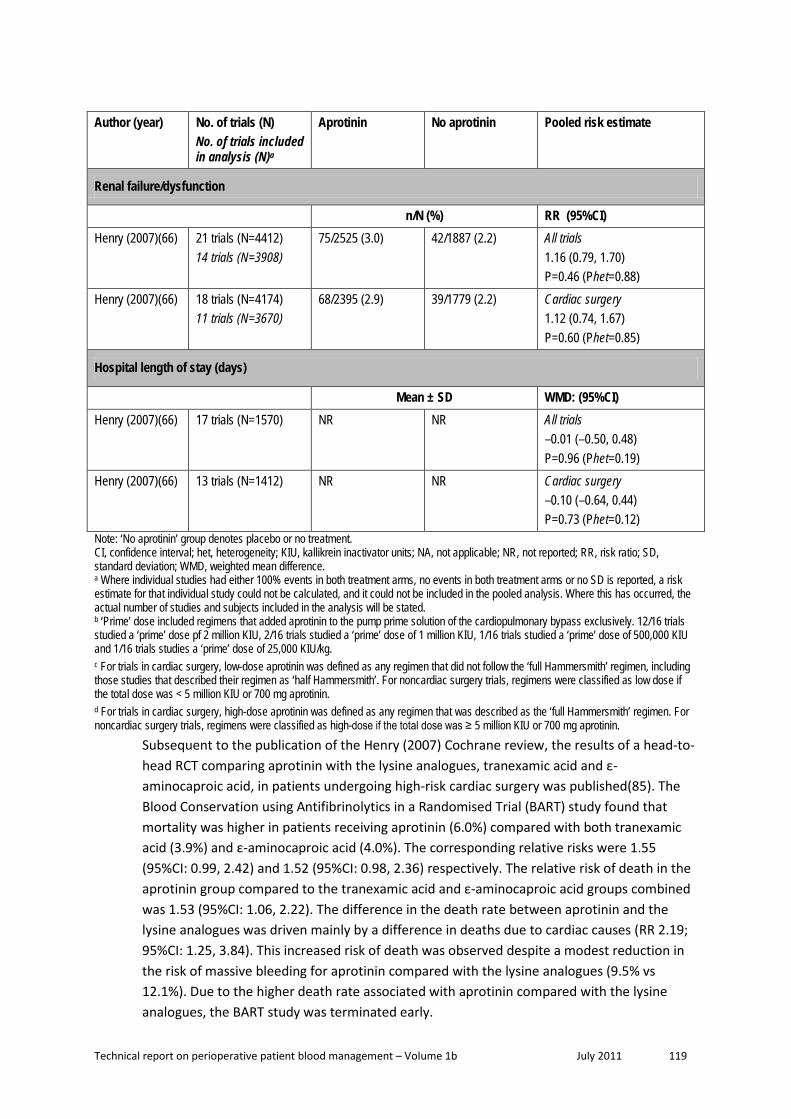
Technical report on perioperative patient blood management – Volume 1b July 2011 119
Author (year) No. of trials (N) No. of trials included in analysis (N)a
Aprotinin No aprotinin Pooled risk estimate
Renal failure/dysfunction
n/N (%) RR (95%CI) Henry (2007)(66) 21 trials (N=4412)
14 trials (N=3908) 75/2525 (3.0) 42/1887 (2.2) All trials
1.16 (0.79, 1.70) P=0.46 (Phet=0.88)
Henry (2007)(66) 18 trials (N=4174) 11 trials (N=3670)
68/2395 (2.9) 39/1779 (2.2) Cardiac surgery 1.12 (0.74, 1.67) P=0.60 (Phet=0.85)
Hospital length of stay (days)
Mean ± SD WMD: (95%CI) Henry (2007)(66) 17 trials (N=1570) NR NR All trials
–0.01 (–0.50, 0.48) P=0.96 (Phet=0.19)
Henry (2007)(66) 13 trials (N=1412) NR NR Cardiac surgery –0.10 (–0.64, 0.44) P=0.73 (Phet=0.12)
Note: ‘No aprotinin’ group denotes placebo or no treatment. CI, confidence interval; het, heterogeneity; KIU, kallikrein inactivator units; NA, not applicable; NR, not reported; RR, risk ratio; SD, standard deviation; WMD, weighted mean difference. a Where individual studies had either 100% events in both treatment arms, no events in both treatment arms or no SD is reported, a risk estimate for that individual study could not be calculated, and it could not be included in the pooled analysis. Where this has occurred, the actual number of studies and subjects included in the analysis will be stated. b ‘Prime’ dose included regimens that added aprotinin to the pump prime solution of the cardiopulmonary bypass exclusively. 12/16 trials studied a ‘prime’ dose pf 2 million KIU, 2/16 trials studied a ‘prime’ dose of 1 million KIU, 1/16 trials studied a ‘prime’ dose of 500,000 KIU and 1/16 trials studies a ‘prime’ dose of 25,000 KIU/kg. c For trials in cardiac surgery, low-dose aprotinin was defined as any regimen that did not follow the ‘full Hammersmith’ regimen, including those studies that described their regimen as ‘half Hammersmith’. For noncardiac surgery trials, regimens were classified as low dose if the total dose was < 5 million KIU or 700 mg aprotinin. d For trials in cardiac surgery, high-dose aprotinin was defined as any regimen that was described as the ‘full Hammersmith’ regimen. For noncardiac surgery trials, regimens were classified as high-dose if the total dose was ≥ 5 million KIU or 700 mg aprotinin.
Subsequent to the publication of the Henry (2007) Cochrane review, the results of a head-to-head RCT comparing aprotinin with the lysine analogues, tranexamic acid and ε-aminocaproic acid, in patients undergoing high-risk cardiac surgery was published(85). The Blood Conservation using Antifibrinolytics in a Randomised Trial (BART) study found that mortality was higher in patients receiving aprotinin (6.0%) compared with both tranexamic acid (3.9%) and ε-aminocaproic acid (4.0%). The corresponding relative risks were 1.55 (95%CI: 0.99, 2.42) and 1.52 (95%CI: 0.98, 2.36) respectively. The relative risk of death in the aprotinin group compared to the tranexamic acid and ε-aminocaproic acid groups combined was 1.53 (95%CI: 1.06, 2.22). The difference in the death rate between aprotinin and the lysine analogues was driven mainly by a difference in deaths due to cardiac causes (RR 2.19; 95%CI: 1.25, 3.84). This increased risk of death was observed despite a modest reduction in the risk of massive bleeding for aprotinin compared with the lysine analogues (9.5% vs 12.1%). Due to the higher death rate associated with aprotinin compared with the lysine analogues, the BART study was terminated early.

Technical report on perioperative patient blood management – Volume 1b July 2011 120
In light of the publication of the BART study(85), Henry and associates subsequently updated their meta-analysis of aprotinin, tranexamic acid and ε-aminocaproic acid in cardiac surgery with eight additional aprotinin versus placebo/no treatment-controlled RCTs(71). While there was no significant difference in MI and mortality when comparing aprotinin therapy with no therapy, as shown in Table 8.3, the updated head-to-head analyses reported in the Henry (2009)(71) review showed an increased (although not statistically significant) risk of mortality with aprotinin compared with tranexamic acid and ε-aminocaproic acid, which was largely driven by the inclusion of the BART study. The pooled risk of death for aprotinin compared with tranexamic acid in 13 head-to-head trials (N=3537) was RR 1.43 (0.98, 2.08), while the pooled risk of death for aprotinin compared with ε-aminocaproic acid in four head-to-head trials (N=1840) was RR 1.49 (0.98, 2.28).
Table 8.3 Results for supportive Level I evidence: aprotinin versus no aprotinin in adult cardiac surgery patients (Henry, 2009)
Author (year)
No. trials (N) No. of trials included in analysis (N)a
Aprotinin No aprotinin Pooled risk estimate
Henry (2007)(66) pooled risk estimate
Exposure to allogeneic blood transfusion
n/N (%) RR (95%CI) RR (95%CI)
Henry (2009)(71) 81 trials (N=9139) NR
NR NR 0.66 (0.61, 0.72) P=NR Phet=NR
0.66 (0.61, 0.72) P<0.001 Phet<0.001
Mortality
n/N (%) RR (95%CI) RR (95%CI)
Henry (2009)(71) 49 trials (N=7439) 32 trials (N=6279)
101/4086 (2.5) 81/3353 (2.4) 0.93 (0.69, 1.25) P=NR Phet=NR
0.95 (0.70, 1.28) P=0.72 Phet=0.93
Reoperation due to bleeding
n/N (%) RR (95%CI) RR (95%CI)
Henry (2009)(71) NRb NR
NR NR 0.48 (0.34, 0.67) P=NR Phet=NR
0.49 (0.34, 0.70) P<0.001 Phet=0.41
Myocardial infarction
n/N (%) RR (95%CI) RR (95%CI)
Henry (2009)(71) 42 trials (N=5884) 34 trials (N=5441)
153/3329 (4.6) 115/2555 (4.5) 0.94 (0.73, 1.21) P=NR Phet=NR
0.95 (0.74, 1.22) P=0.69 Phet=0.92
CI, confidence interval; het, heterogeneity; NR, not reported; RR, risk ratio; SD, standard deviation. a Where individual studies had either 100% events in both treatment arms, no events in both treatment arms or no SD is reported, a risk estimate for that individual study could not be calculated, and it could not be included in the pooled analysis. Where this has occurred, the actual number of studies and subjects included in the analysis will be stated.

Technical report on perioperative patient blood management – Volume 1b July 2011 121
b Not specifically reported in text of publication.
A number of additional systematic reviews of aprotinin have been published since the Henry (2007) review and provide supportive evidence. These reviews provide supportive data in cardiac surgery(70;75), orthopaedic surgery(74), liver resection(69) and liver transplant(72). Each of these will be described in detail below. The results of these reviews are generally consistent with the results of the Henry (2007) review, showing that aprotinin results in a reduction in the number of surgical patients requiring transfusion and/or reducing the volume of transfusion/blood loss.
The review by Brown (2007)(75) was conducted in patients undergoing cardiac surgery. While it was conducted at a similar time to the Henry (2007) review, and is not as up-to-date as the Henry (2009)(71) review, it is included here as supportive evidence because it includes a number of studies not included in the pivotal Henry (2007)(66) review and provides information on the dose effect of aprotinin for all included outcomes.
The review by Brown (2007)(75) was considered to be of fair methodology quality. The individual study data and forest plots are not provided with the publication, which makes verification of data difficult. In addition, investigation of the studies which were included in the Brown (2007) review and not the Henry (2007) review has revealed that some of the additional included studies investigated aprotinin in combination with other therapies and not aprotinin alone. The authors note that they investigated heterogeneity using the I2 statistic; however, this is not reported for each of the analyses. The random effects method was used for all analyses to control for heterogeneity.
The results of the Brown (2007)(75) review are summarised in Table 8.4. The analysis of aprotinin was carried out for two dose groups: high dose and low dose. For the Brown (2007) review, high-dose aprotinin was defined as a 2 million KIU IV loading dose, 2 million KIU pump-priming dose and 0.5 million KIU IV/hour dose. Low dose was defined as 1 million KIU loading IV dose, I million KIU pump-priming dose and 0.25 million KIU IV/hour maintenance dose. Pump-only administration of aprotinin was excluded due to the small number of trials using this mode of administration (8 studies).
Similar to the Henry (2007)(66) review, the Brown (2007)(75) review found that aprotinin therapy reduced the incidence of transfusion in cardiac surgery patients. The results were consistent for high-dose aprotinin (RR 0.60; 95%CI: 0.53, 0.67) and low-dose aprotinin (RR 0.76; 95%CI: 0.66, 0.86). The authors further stratified these results by specific types of cardiac surgery and found consistent results. For high-dose aprotinin, the RR of transfusion was 0.62 (95%CI: 0.55, 0.70) for coronary artery bypass graft (CABG), 0.44 (95%CI: 0.34, 0.59) for CABG with valve surgery, and 0.41 (95%CI: 0.21, 0.80) for valve surgery only. For low-dose aprotinin, the RR of transfusion was 0.75 (95%CI: 0.64, 0.88) for CABG, 0.87 (95%CI: 0.78, 0.97) for CABG with valve surgery, and 0.89 (95%CI: 0.58, 1.37) for valve surgery only. No details on the number of included trials and patients are included for these subgroup analyses, and the data cannot be easily verified due to the absence of individual trial data or forest plots.

Technical report on perioperative patient blood management – Volume 1b July 2011 122
The results for blood loss differed slightly for the Henry (2007)(66) and Brown (2007)(75) reviews, with the difference in total blood loss between aprotinin therapy and no therapy in the Henry review reported as –489 mL and in the Brown review reported as –348 mL and –226 mL for high and low-dose aprotinin, respectively. The Henry (2007)(66) analysis of total blood loss included data from only five trials, whereas the analysis from Brown (2007)(75) included 22 high-dose trials and 6 low-dose trials. This may be a result of how ‘total dose’ was defined in the two reviews; in the Henry (2007)(66) review, only trials combining intraoperative and postoperative blood loss were included in this category, while in the Brown review, it appears that where intraoperative and operative blood loss has been reported, this has been combined for the review.
While there was no statistically significant difference in mortality between aprotinin therapy and no therapy for either high or low dose, the risk estimate for low dose was substantially higher than one (unity). Based on data from 14 trials, the RR of mortality was 1.37 (95%CI: 0.72, 2.59) for low-dose aprotinin, while based on data from 43 trials was 0.89 (95%CI: 0.65, 1.21) for high-dose aprotinin. The approximate incidence of mortality in this cardiac surgical population is 2.4% (placebo arms of the Henry [2007] analysis) and the mortality difference seen between treatment arms is 0.1% (Henry [2007] review). Therefore, it is likely that the analyses presented in the Henry and Brown reviews are insufficiently powered to detect a difference in mortality between aprotinin therapy and no aprotinin therapy. Given that little information on individual trial data is included in the Brown (2007) review, it is difficult to determine whether the potentially increased risk in mortality for low-dose aprotinin is an anomaly, or whether it is a real risk that failed to reach statistical significance due to a lack of statistical power.
The results of the other morbidity outcomes including MI, stroke and renal failure/dysfunction were reasonably similar to the results of the Henry (2007)(66) review and reasonably consistent between the high and low-dose groups in the Brown (2007)(75) review. It is particularly important to note the results of the analysis of renal function in the Brown review. In the Henry review, renal failure and dysfunction were combined into one category, while Brown separated out renal failure (which was defined as new onset dialysis; or in one study, a ≥ 2.0 mg/dL increase in creatinine) from renal dysfunction (defined as a ≥ 0.5 mg/dL increase in creatinine). This is important because renal failure and dysfunction have been identified as issues relating to aprotinin use in observational studies. Based on data from 27 trials (N=4681), there was no significant difference in renal failure between high-dose aprotinin therapy and no therapy (RR 1.09; 95%CI: 0.68, 1.77; P=0.72). Based on data from seven trials (N=786), there was no significant difference in renal failure between low-dose aprotinin therapy and no therapy (RR 1.86; 95%CI: 0.07, 49.3; P=0.71). However, as for mortality, this is a low incidence event and it is important to keep in mind that the analysis may not have been sufficiently powered to detect this outcome and find a statistically significant difference. The Brown (2007) review found a significant difference in renal dysfunction between high-dose aprotinin therapy and no therapy (19 trials; RR 1.47; 95%CI: 1.12, 1.94; P=0.006) but no significant difference between low-dose aprotinin therapy and no therapy (9 trials; RR 1.01; 95%CI: 0.69, 1.49; P=0.96). Brown (2007)(75) note that
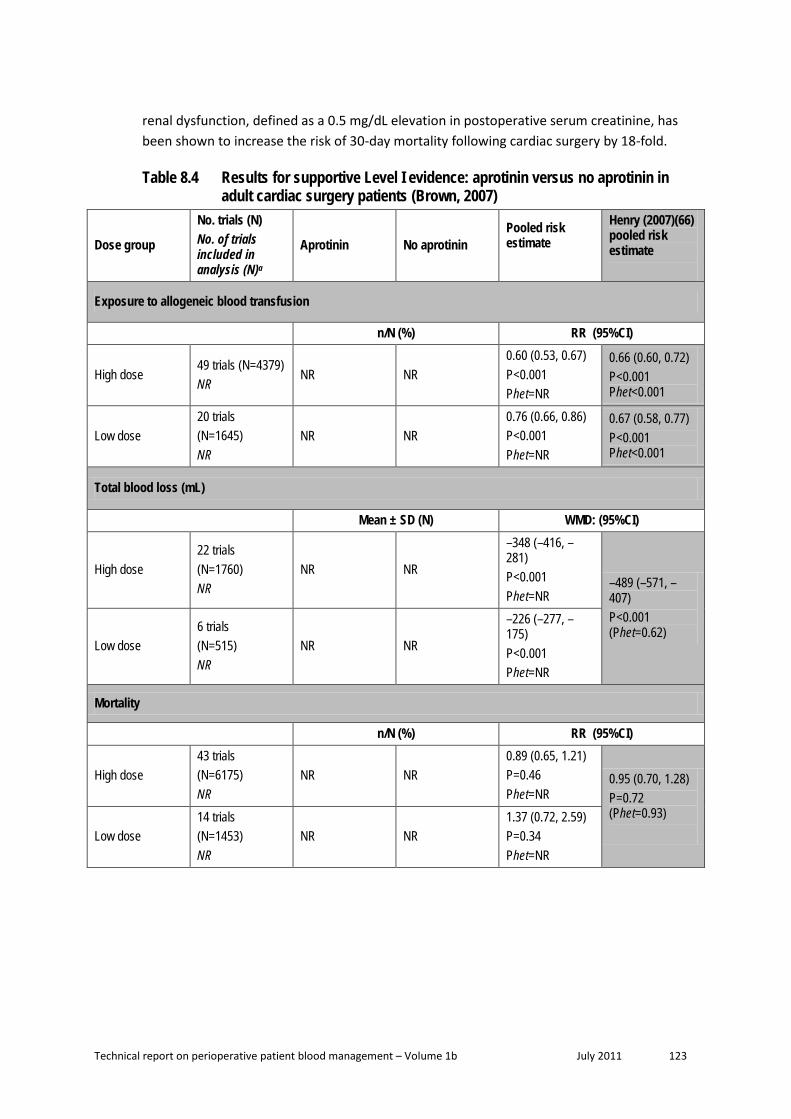
Technical report on perioperative patient blood management – Volume 1b July 2011 123
renal dysfunction, defined as a 0.5 mg/dL elevation in postoperative serum creatinine, has been shown to increase the risk of 30-day mortality following cardiac surgery by 18-fold.
Table 8.4 Results for supportive Level I evidence: aprotinin versus no aprotinin in adult cardiac surgery patients (Brown, 2007)
Dose group
No. trials (N) No. of trials included in analysis (N)a
Aprotinin No aprotinin Pooled risk estimate
Henry (2007)(66) pooled risk estimate
Exposure to allogeneic blood transfusion
n/N (%) RR (95%CI)
High dose 49 trials (N=4379) NR
NR NR 0.60 (0.53, 0.67) P<0.001 Phet=NR
0.66 (0.60, 0.72) P<0.001 Phet<0.001
Low dose 20 trials (N=1645) NR
NR NR 0.76 (0.66, 0.86) P<0.001 Phet=NR
0.67 (0.58, 0.77) P<0.001 Phet<0.001
Total blood loss (mL)
Mean ± SD (N) WMD: (95%CI)
High dose 22 trials (N=1760) NR
NR NR
–348 (–416, –281) P<0.001 Phet=NR
–489 (–571, –407) P<0.001 (Phet=0.62)
Low dose 6 trials (N=515) NR
NR NR
–226 (–277, –175) P<0.001 Phet=NR
Mortality
n/N (%) RR (95%CI)
High dose 43 trials (N=6175) NR
NR NR 0.89 (0.65, 1.21) P=0.46 Phet=NR
0.95 (0.70, 1.28) P=0.72 (Phet=0.93) Low dose
14 trials (N=1453) NR
NR NR 1.37 (0.72, 2.59) P=0.34 Phet=NR

Technical report on perioperative patient blood management – Volume 1b July 2011 124
Dose group
No. trials (N) No. of trials included in analysis (N)a
Aprotinin No aprotinin Pooled risk estimate
Henry (2007)(66) pooled risk estimate
Return to operating room
n/N (%) RR (95%CI)
High dose 40 trials (N=3912) NR
NR NR 0.47 (0.32, 0.69) P<0.001 Phet=NR
Re-operation for bleeding 0.49 (0.34, 0.70) P<0.001 Phet=0.41 Low dose
20 trials (N=1623) NR
NR NR 0.69 (0.41, 1.18) P=0.18 Phet=NR
Myocardial infarction
n/N (%) RR (95%CI)
High dose 31 trials (N=3315) NR
NR NR 1.10 (0.83, 1.45) P=0.52 Phet=NR 0.95 (0.74, 1.22)
P=0.69 Phet=0.92 Low dose
16 trials (N=1585) NR
NR NR 0.94 (0.58, 1.54) P=0.82 Phet=NR
Stroke
n/N (%) RR (95%CI)
High dose 22 trials (N=1737) NR
NR NR 0.67 (0.30, 1.47) P=0.32 Phet=NR 0.76 (0.30, 1.93)
P=0.57 (Phet=0.40)
Low dose 10 trials (N=1049) NR
NR NR 0.47 (0.09, 2.36) P=0.36 Phet=NR
Renal failureb
n/N (%) RR (95%CI)
High dose 27 trials (N=4681) NR
NR NR 1.09 (0.68, 1.77) P=0.71 Phet=NR
Renal failure/ dysfunction 1.12 (0.74, 1.67) P=0.60 (Phet=0.85) Low dose
7 trials (N=786) NR
NR NR 1.86 (0.07, 49.3) P=0.71 Phet=NR
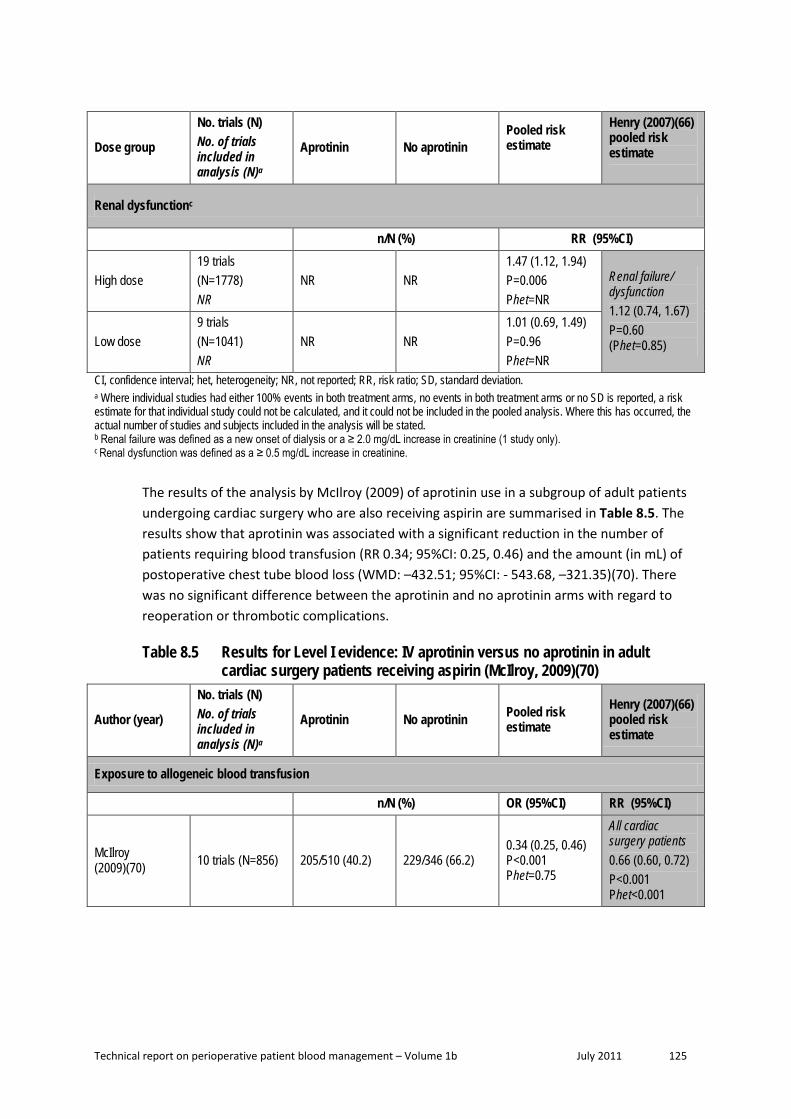
Technical report on perioperative patient blood management – Volume 1b July 2011 125
Dose group
No. trials (N) No. of trials included in analysis (N)a
Aprotinin No aprotinin Pooled risk estimate
Henry (2007)(66) pooled risk estimate
Renal dysfunctionc
n/N (%) RR (95%CI)
High dose 19 trials (N=1778) NR
NR NR 1.47 (1.12, 1.94) P=0.006 Phet=NR
Renal failure/ dysfunction 1.12 (0.74, 1.67) P=0.60 (Phet=0.85) Low dose
9 trials (N=1041) NR
NR NR 1.01 (0.69, 1.49) P=0.96 Phet=NR
CI, confidence interval; het, heterogeneity; NR, not reported; RR, risk ratio; SD, standard deviation. a Where individual studies had either 100% events in both treatment arms, no events in both treatment arms or no SD is reported, a risk estimate for that individual study could not be calculated, and it could not be included in the pooled analysis. Where this has occurred, the actual number of studies and subjects included in the analysis will be stated. b Renal failure was defined as a new onset of dialysis or a ≥ 2.0 mg/dL increase in creatinine (1 study only). c Renal dysfunction was defined as a ≥ 0.5 mg/dL increase in creatinine.
The results of the analysis by McIlroy (2009) of aprotinin use in a subgroup of adult patients undergoing cardiac surgery who are also receiving aspirin are summarised in Table 8.5. The results show that aprotinin was associated with a significant reduction in the number of patients requiring blood transfusion (RR 0.34; 95%CI: 0.25, 0.46) and the amount (in mL) of postoperative chest tube blood loss (WMD: –432.51; 95%CI: - 543.68, –321.35)(70). There was no significant difference between the aprotinin and no aprotinin arms with regard to reoperation or thrombotic complications.
Table 8.5 Results for Level I evidence: IV aprotinin versus no aprotinin in adult cardiac surgery patients receiving aspirin (McIlroy, 2009)(70)
Author (year)
No. trials (N) No. of trials included in analysis (N)a
Aprotinin No aprotinin Pooled risk estimate
Henry (2007)(66) pooled risk estimate
Exposure to allogeneic blood transfusion
n/N (%) OR (95%CI) RR (95%CI)
McIlroy (2009)(70) 10 trials (N=856) 205/510 (40.2) 229/346 (66.2)
0.34 (0.25, 0.46) P<0.001 Phet=0.75
All cardiac surgery patients 0.66 (0.60, 0.72) P<0.001 Phet<0.001

Technical report on perioperative patient blood management – Volume 1b July 2011 126
Author (year)
No. trials (N) No. of trials included in analysis (N)a
Aprotinin No aprotinin Pooled risk estimate
Henry (2007)(66) pooled risk estimate
Postoperative chest tube drainage (mL)
Mean ± SD WMD: (95%CI) WMD: (95%CI)
McIlroy (2009)(70) 12 trials (N=992) NR NR
–433 (–544, –321) P<0.001 Phet<0.001
All cardiac surgery patients; postoperative blood loss –385 (–432, –339) P<0.001 (Phet<0.001)
Reoperation
n/N (%) OR (95%CI) RR (95%CI)
McIlroy (2009)(70)
7 trials (N=352) 4 trials (N=198)
5/186 (2.7) 10/166 (6.0) 0.42 (0.13, 1.36) P=0.15 Phet=0.61
Re-operation for bleeding 0.49 (0.34, 0.70) P<0.001 Phet=0.41
Thrombotic complication
n/N (%) OR (95%CI) RR (95%CI)
McIlroy (2009)(70)
8 trials (N=527) 3 trials (N=174)
10/269 (3.7) 17/258 (6.6) 0.51 (0.21, 1.20) P=0.12 Phet=0.76
All cardiac surgery patients: MI 0.95 (0.74, 1.22) P=0.69 Phet=0.92 Stroke 0.76 (0.30, 1.93) P=0.57 Phet=0.40 DVT 2.52 (0.41, 15.5) P=0.32 Phet=0.71
CI, confidence interval; DVT, deep vein thrombosis; het, heterogeneity; MI, myocardial infarction; NR, not reported; OR, odds ratio; SD, standard deviation; WMD, weighted mean difference. a Where individual studies had either 100% events in both treatment arms, no events in both treatment arms or no SD is reported, a risk estimate for that individual study could not be calculated, and it could not be included in the pooled analysis. Where this has occurred, the actual number of studies and subjects included in the analysis will be stated.
The review by Kagoma (2009)(74) examined the use of antifibrinolytic therapy (aprotinin, tranexamic acid and ε-aminocaproic acid) in adult patients undergoing total hip and total knee replacement. While the primary analysis compared the antifibrinolytic group as a whole to placebo, separate results for aprotinin, tranexamic acid and ε-aminocaproic acid are available for some outcomes. Details of the included studies for each analysis could be determined from the forest plots.

Technical report on perioperative patient blood management – Volume 1b July 2011 127
The analysis of incidence of transfusion was similar between the Kagoma (2009) and Henry (2007) reviews. Only one additional study not included in Henry (2007) was included in the Kagoma (2009) review. This study provided data for the blood loss outcome and showed a large reduction in blood loss between the aprotinin therapy and no therapy groups (~ 1000 mL), which may explain the difference in magnitude of blood loss between the Kagoma and Henry analyses.
It is difficult to compare the results of the Kagoma (2009) and Henry (2007) studies with regard to VTE complications because the Kagoma study used a different risk measure (risk difference) and a combined VTE category rather than separate categories for different VTE events. However, the results of both reviews show no significant difference in risk of VTE between aprotinin therapy and no therapy, although it is likely that both reviews are underpowered to detect these rare events.
Table 8.6 Results for supportive Level I evidence: aprotinin versus no aprotinin in adult hip and knee replacement surgery patients (Kagoma 2009)(74)
Treatment
No. trials (N) No. of trials included in analysis (N)a
Aprotinin No aprotinin Pooled risk estimate
Henry (2007)(66) pooled risk estimate
Exposure to allogeneic blood transfusion
n/N (%) RR (95%CI) RR (95%CI)
Aprotinin 3 trials (N=347)
84/245 (34.3) 63/102 (61.8) 0.63 (0.50, 0.80) P=NR Phet=NR
0.69 (0.56, 0.85) P<0.001 (Phet=0.23)
Total blood loss (mL)
Mean ± SD (N) WMD: (95%CI) WMD: (95%CI)
Aprotinin
4 trials (N=230) 4 trials (N=230)
NR NR
Hip replacement surgery –639 (–725, –536) P=NR Phet=NR
Orthopaedic surgery –399 (–563, –235) P<0.001 (Phet=0.01)
VTE complications
n/N (%) RD (95%CI) RR (95%CI)
Aprotinin
4 trials (N=147) 3 trials (N=97)
1/48 (2.1) 5/49 (10.2)
–0.04 (–0.09, 0.02) P=NR Phet=NR
All surgery types; DVT 0.79 (0.46, 1.34) P=0.38 Phet=0.80 All surgery types; PE 1.98 (0.38, 10.46) P=0.42 Phet=0.95

Technical report on perioperative patient blood management – Volume 1b July 2011 128
CI, confidence interval; DVT, deep vein thrombosis; het, heterogeneity; NR, not reported; PE, pulmonary embolism; RR, risk ratio; SD, standard deviation; VTE, venous thromboembolism. a Where individual studies had either 100% events in both treatment arms, no events in both treatment arms or no SD is reported, a risk estimate for that individual study could not be calculated, and it could not be included in the pooled analysis. Where this has occurred, the actual number of studies and subjects included in the analysis will be stated.
Two recent reviews – Gurusamy (2009)(69) and Liu (2008)(72) – provide data specifically on liver resection and orthotopic liver transplant, respectively. The review by Gurusamy (2009)(69) identified only one relevant aprotinin study, which was already included in the Henry review. While it will not be presented in detail here, the results of this study showed that the use of aprotinin therapy to prevent blood loss associated with liver resection results in a significantly decreased risk of transfusion compared with no therapy (RR 0.43; 95%CI: 0.21, 0.89; P=0.02), a substantial (although not significant) decrease in operative blood loss (WMD: –436 mL; 95%CI: –874, 1.7; P=0.05) and no difference in mortality (RR 1.18; 95%CI: 0.18, 7.48; P=0.86).
The review by Liu (2008)(72) included a total of seven studies, including one additional study not included in Henry (2007); however, one of these was a non-randomised trial and another compared aprotinin to tranexamic acid. For this reason, only the analysis of thrombotic events that included data from two placebo-controlled RCTs is included here (both of these RCTs were included in the Henry [2007] review). This analysis showed no significant difference in the risk of thrombotic events between aprotinin therapy and no therapy (2.5% versus 6.4%, respectively; OR 0.38; 95%CI: 0.09, 1.64; P>0.05).
During the literature search for this research question, a systematic review of epidemiological studies assessing the safety of aprotinin was identified (Level III evidence)(86). While it was initially excluded from consideration as it is not a systematic review of RCTs, in light of the findings of the BART study, it provides additional supportive data and has been described here.
The Gagne (2009)(86) review included data from 11 epidemiological studies that included between 369 and 78,199 subjects (mean 10,847 subjects). Four of the included studies compared aprotinin with no therapy. The remaining seven studies compared aprotinin with tranexamic acid (1 study), ε-aminocaproic acid (3 studies) or no aprotinin (a mix of comparators; 3 studies). The results of the meta-analysis of epidemiological studies are shown in Table 8.7. These results show that aprotinin is associated with an increased risk of renal dysfunction and long-term death, compared with no treatment, no aprotinin or one of the lysine analogues (RR 1.42; 95%CI: 1.13, 1.78; and RR 1.22; 95%CI: 1.08, 1.39). A consistently increased risk of renal dysfunction was seen when results were stratified by comparison drug, renal dysfunction definition, and adjustment for red cell transfusion and for other intraoperative variables.

Technical report on perioperative patient blood management – Volume 1b July 2011 129
Table 8.7 Results for additional supportive Level III evidence: safety of aprotinin in epidemiological studies (Gagne, 2009)(86)
Author (year) No. trials (N) Aprotinin Comparatora Pooled risk estimate
Renal dysfunction
n/N (%) RR (95%CI) Gagne (2009)(86) 10 trials (N=116,643)
NR NR 1.42 (1.13, 1.79)
P=NR (I2=73%)
Need for dialysis
n/N (%) RR (95%CI) Gagne (2009)(86) 5 trials (N=106,250) NR NR 1.17 (0.99, 1.38)
P=NR (I2=0%)
Death: Short-term
n/N (%) RR (95%CI) Gagne (2009)(86) 6 trials (N=93,606) NR NR 1.16 (0.84, 1.58)
P=NR (I2=72%)
Death: Long-term
n/N (%) RR (95%CI) Gagne (2009)(86) 3 trials (N=18,264) NR NR 1.22 (1.08, 1.39)
P=NR (I2=38%) CI, confidence interval; NR, not reported; RR, risk ratio. a The comparator arm for this study includes no therapy, tranexamic acid, ε-aminocaproic acid or no aprotinin (a mix of comparators).
Topical aprotinin One systematic review provides pivotal evidence for topical aprotinin in the adult population, specifically in adult patients undergoing on-pump cardiac surgery(67). The results of this review are summarised in Table 8.8. The results suggest that while topical aprotinin may not significantly reduce the need for blood transfusion during on-pump cardiac surgery (RR 0.72; 95%CI: 0.47, 1.08), it is associated with significant reductions in the number of units of blood required for transfusion (WMD: –0.83; 95%CI: –1.21, –0.44) and the amount of chest tube blood loss (mL) following surgery (WMD: –204; 95%CI: –276, –132). Mortality and morbidity were not assessed in this review.

Technical report on perioperative patient blood management – Volume 1b July 2011 130
Table 8.8 Results for Level I evidence: topical aprotinin versus no aprotinin in adult on-pump cardiac surgery (Abrishami, 2009) (67)
Author (year) No. trials (N) Aprotinin No aprotinin Pooled risk estimate
Exposure to allogeneic blood transfusion
n/N (%) RR (95%CI) Abrishami (2009)(67) 3 trials (N=341) 97/179 (54.2) 108/162 (66.7) 0.72 (0.47, 1.08)
P=0.11 (Phet=0.008)
Units of allogeneic blood transfused
n/N (%) WMD: (95%CI) Abrishami (2009) (67) 4 trials (N=229) NR NR –0.83 (–1.21, –0.44)
P=<0.001 (Phet=0.34)
24-hour chest tube blood loss (mL)
Mean ± SD WMD: (95%CI) Abrishami (2009) (67) 5 trials (N=324) NR NR –204 (–276, –132)
P<0.001 (Phet=0.04) CI, confidence interval; het, heterogeneity; NR, not reported; RR, risk ratio; SD, standard deviation; WMD, weighted mean difference.
Paediatric population This population will not be assessed in the same detail as the adult population because it will be the subject of a detailed review in a subsequent module.
Intravenous aprotinin The results of the Schouten (2009)(68) systematic review of the use of aprotinin in children undergoing cardiac or scoliosis surgery, which provides pivotal evidence for this population, are summarised in Table 8.9. Due to significant heterogeneity, the results of a number of analyses were not reported in the publication. A significantly smaller volume of red blood cells and plasma were transfused in children undergoing cardiac surgery who received aprotinin compared with no aprotinin (–4 mL/kg for red blood cells and –5 mL/kg for plasma). There was significantly less blood loss associated with aprotinin compared with no aprotinin in children undergoing scoliosis surgery (–385 mL). No safety data was available for this population.

Technical report on perioperative patient blood management – Volume 1b July 2011 131
Table 8.9 Results for Level I evidence: IV aprotinin versus no aprotinin in paediatric cardiac and scoliosis surgery patients (Schouten, 2009)
Author (year) No. trials (N) Aprotinin No aprotinin Pooled risk estimate
Exposure to allogeneic blood transfusion (packed red cells)a
Mean ± SD WMD: (95%CI) Schouten 2009(68) 3 trials (N=250) NR NR Cardiac surgery
–4 mL/kg (–7, –2) P=NR (I2=0%)
Exposure to allogeneic blood transfusion (plasma)a
Mean ± SD WMD: (95%CI) Schouten 2009(68) 2 trials (N=228) NR NR Cardiac surgery
–5 mL/kg (–8, –2) P=NR (I2=0%)
Exposure to allogeneic blood transfusion (thrombo)a
Mean ± SD WMD: (95%CI) Schouten 2009(68) NR (N=180) NR NR Cardiac surgery
NR due to heterogeneity
Exposure to blood lossa
Mean ± SD WMD: (95%CI) Schouten 2009(68) 16 trials (N=594) NR NR Cardiac surgery
NR due to heterogeneity Schouten 2009(68) 1 trial (N=44) NR NR Scoliosis surgery
–385 mL (–727, –42) P=NR (I2=NA)
CI, confidence interval; NA, not applicable; NR, not reported; SD, standard deviation; WMD, weighted mean difference. a Volume of blood transfused and blood loss reported as mL/kg for cardiac surgery and mL for scoliosis surgery.
One systematic review that specifically examined a paediatric population had a more up-to-date literature search than the Schouten review and has been included as supportive evidence. This review, by Tzortzopoulou (2008)(73), examined the use of aprotinin in children undergoing scoliosis surgery only. This included the same two studies included in the Schouten review and similarly concluded that aprotinin significantly reduced the volume of blood transfused and volume of blood loss. A summary of the results of this supportive study is shown in Table 8.10.

Technical report on perioperative patient blood management – Volume 1b July 2011 132
Table 8.10 Results for Level I evidence: aprotinin versus no aprotinin – comparison between Schouten (2009) review and more recent reviews
Updated review Population Surgery
Findings Risk estimate (95%CI)
Tzortzopoulou (2008)(73)
Paediatric Spine
Includes 2 trials (both included in Schouten [2009](68)) Incidence transfusion: RR 0.75 (0.44, 1.27) Blood transfused (mL): WMD: –361.42 (–583.88, –138.96) Blood loss (mL): WMD: –450.32 (–726.35, –174.29)
Level II evidence The search for Level II evidence was only conducted for the adult surgical population. An additional search was not carried out for the paediatric population.
The literature search for the pivotal Henry (2007)(66) review (which assessed the use of aprotinin in adults) was only updated to June 2006. Thus, a search was conducted to identify any Level II studies published after this date. This search identified seven additional Level II studies relevant to this module. An additional search for evidence specifically relating to quality of life was also conducted. This search found no relevant Level II evidence.
The characteristics and quality of each of the additional included RCTs was assessed and is presented in Table 8.11. One of the seven identified studies assessed the use of topical aprotinin; the remaining studies assessed IV aprotinin. All studies compared aprotinin with placebo.
Table 8.11 Characteristics of Level II evidence for aprotinin Author (Year) Study quality
Study type Location
Population Surgery
Treatment No. of included subjects
Outcomes
Apostolakis (2008)(87) Fair
SB RCT Greece
Adult Thoracic surgery
AP (IV) Placebo (IV)
29 30
Transfusion volume Blood loss Mortality Morbidity
Colwell (2007)(88) Good
DB RCT US/Canada
Adult Total hip arthroplasty
AP (IV) Placebo (IV)
175 177
Transfusion incidence Transfusion volume Blood loss Mortality Morbidity
Grant (2008)(89) Fair
DB RCT US
Adult Off-pump coronary artery bypass surgery
AP (IV) Placebo (IV)
59 61
Blood loss Mortality Morbidity

Technical report on perioperative patient blood management – Volume 1b July 2011 133
Author (Year) Study quality
Study type Location
Population Surgery
Treatment No. of included subjects
Outcomes
Later (2009)(90) Good
DB RCT The Netherlands
Adult Low and intermediate-risk cardiac surgery
AP (IV) TXA (IV) Placebo (IV)
96 99 103
Transfusion incidence Transfusion volume Blood loss Mortality Morbidity Length of hospital stay
Leijdekkers (2006)(91) Fair
DB RCT The Netherlands
Adult Infrarenal abdominal aneurysm surgery
AP (IV) Placebo (IV)
16 19
Transfusion volume Blood loss Mortality Morbidity
Mehraein (2009)(92) Good
DB RCT Iran
Adult First-time CABG
AP (topical) Placebo (topical)
64 64
Transfusion volume Blood loss Length of hospital stay
Nurözler (2008)(93) Fair
DB RCT Turkey
Adults undergoing off-pump CABG surgery who received clopidogrel within 5 days of surgery
AP (IV) Placebo (IV)
25 26
Transfusion incidence Transfusion volume Blood loss Mortality Morbidity Length of hospital stay
ACA, ε-aminocaproic acid; CABG, coronary artery bypass graft; DB, double-blind; IV, intravenous; OL, open label; RCT, randomised controlled trial; SB, single blind; TXA, tranexamic acid.
Adult population Intravenous aprotinin The results of the six additional RCTs that examined the use of IV aprotinin and were published subsequent to the Henry (2007) review (and are not included in any of the supportive evidence) are described below. Only outcomes similar to those already included for the Level I evidence are shown here. The effect of aprotinin on each outcome will be discussed separately.
Transfusion incidence
Three additional RCTs examined the incidence of transfusion in surgical patients who had received aprotinin or placebo(88;90;93). The results of these studies are summarised in Table 8.12. In these studies, the use of aprotinin compared with placebo resulted in a significant decrease in the proportion of subjects requiring perioperative blood transfusion. The results were similar for cardiac surgery and orthopaedic surgery.

Technical report on perioperative patient blood management – Volume 1b July 2011 134
Table 8.12 Results for Level II evidence for transfusion incidence: IV aprotinin acid versus placebo in adults
Author (year) Specific outcome Aprotinin Placebo/no treatment
Statistical significance
n/N (%) P-value Cardiac surgery Later (2009)(90) PRBC transfusion 48/96 (50.0) 73/103 (70.9) 0.004
Blood products transfusion
59/96 (61.5) 81/103 (78.6) 0.009
Nurözler (2008)(93) Transfusion incidence (RBCs)
17/25 (68) 23/26 (88) 0.014
Transfusion incidence (blood products)
7/25 (28) 14/26 (53) 0.002
Orthopaedic surgery (includes hip, knee and spine surgery) Colwell (2007)(88) Whole blood or RBCs 30/175 (17) 57/177 (32) 0.0009
Allogeneic blood 19/175 (11) 39/177 (22) 0.006 Whole blood or RBCs without donation
18/138 (13) 33/140 (24) 0.02
Whole blood or RBCs with donation
12/37 (32) 23/37 (62) ND (small sample size)
AWB, autologous whole blood; ND, not determined; RBC, red blood cell.
Transfusion volume
Five RCTs assessing four surgery types provided data on transfusion volume in patients receiving aprotinin or placebo(87;88;90;91;93). As shown in Table 8.13, aprotinin either significantly reduced the volume of transfusion in patients undergoing cardiac or orthopaedic surgery, or resulted in no difference in patients undergoing thoracic surgery and surgery for infrarenal abdominal aneurysm; however, the RCTs for these specific surgery types were small. For all five studies, transfusion volume was averaged across all patients and not just transfused patients. As such, the results take into account transfusion incidence as well.
Table 8.13 Results for Level II evidence for transfusion volume: IV aprotinin acid versus placebo in adults
Author (year) Specific outcome Aprotinin Placebo/no treatment
Statistical significance
Mean ± SD [IQR] (N) P-value Cardiac surgery Later (2009)(90) Total units pRBCs
transfused (all patients; units)
0.5 [1.0] (96) 2.0 [3.0] (103) <0.001
Nurözler (2008)(93) Transfusion volume (all patients; pRBCs; units)
1.7 ± 1.4 (25) 2.9 ± 1.8 (26) 0.014
Transfusion volume (all patients; platelets; units)
0.4 ± 0.6 (25) 2.3 ± 1.2 (26) 0.002
Transfusion volume (all patients; FFP; units)
0.6 ± 0.3 (25) 1.4 ± 0.6 (26) 0.008

Technical report on perioperative patient blood management – Volume 1b July 2011 135
Author (year) Specific outcome Aprotinin Placebo/no treatment
Statistical significance
Orthopaedic surgery (includes hip, knee and spine surgery) Colwell (2007)(88) Whole blood or RBCs (all
patients) 0.27a (175) 0.63 a (177) 0.0003
Allogeneic blood (all patients)
0.17 a (175) 0.42 a (177) 0.004
Whole blood or RBCs without donation (all patients)
0.21 a (138) 0.46 a (140) 0.0153
Whole blood or RBCs with donation (all patients)
0.52 a (37) 1.21 a (37) ND (small sample size)
Thoracic surgery Apostolakis (2008)(87)
Intraoperative pRBCs (all patients; units)
0.17 ± 0.539 (29) 0.17 ± 0.531 (30) 0.967
Postoperative pRBCs (all patients; units)
0.00 ± 0.00 (29) 0.03 ± 0.183 (30) 0.970
Intraoperative FFP (all patients; units)
0.21 ± 0.620 (29) 0.20 ± 0.761 (30) 0.330
Postoperative FFP (all patients; units)
0.21 ± 0.620 (29) 0.87 ± 1.525 (30) 0.035
Infra-renal abdominal aneurysm surgery Leijdekkers (2006)(91)
Mean total infusion (all patients; mL)
7845 ± 4888 (16) 7835 ± 4776 (19) 0.99
Mean packed cells (all patients; units)
4.1 ± 3.1 (16) 4.1 ± 2.9 (19) 0.95
Mean FFP (all patients; units)
0.5 ± 0.9 (16) 0.3 ± 0.8 (19) 0.35
FFP, fresh frozen plasma; IQR, inter-quartile range; ND, not determined; pRBCs, packed red blood cells; RBC, red blood cell; SD, standard deviation. a Calculated post-hoc. Approximation based on the proportion of patients who received 1, 2, 3 or 4 units of transfusion.
Blood loss
Six RCTs provided data on blood loss, as shown in Table 8.14. Different measures of blood loss were provided in different studies and included intraoperative, postoperative and total blood loss/drainage. In the majority of included studies and analyses, blood loss was significantly reduced for patients on aprotinin compared with placebo. The only exception was surgery for infrarenal abdominal aneurysm(91).

Technical report on perioperative patient blood management – Volume 1b July 2011 136
Table 8.14 Results for Level II evidence for blood loss: IV aprotinin acid versus placebo in adults
Author (year) Specific outcome Aprotinin Placebo/no treatment
Statistical significance
Mean ± SD [IQR] (N) P-value Cardiac surgery Grant (2008)(89) Intraoperative blood loss
(mL) 867 ± 413 KIU/mL >271 870 ± 383 KIU/mL <271 (59)
1252 ± 380 (61) <0.02
Postoperative blood loss (mL/24 hour)
415 ± 330 KIU/mL >271 427 ± 171 KIU/mL <271 (59)
716 ± 336 (61) <0.003
Later (2008)(90) Total mediastinal chest tube loss (mL)
546 [405] (96) 860 [740] (103) <0.001
Nurözler (2008)(93) Drainage (mL/24 hour) 423 ± 178 (25) 748 ± 212 (26) 0.005 Orthopaedic surgery (includes hip, knee and spine surgery) Colwell (2007)(88) Intraoperative blood loss
(mL) 331 (95%CI: 297, 368) (175)
385 (95%CI: 346, 429) (177)
0.0217
0–6 hour drainage (mL) 96 (95%CI: 72, 129) (175)
177 (95%CI: 133, 235) (177)
0.0003
Total drainage (mL) 276 (95%CI: 216, 353) (175)
390 (95%CI: 307, 494) (177)
0.0141
Total fluid loss (mL) 709 (95%CI: 618, 813) (175)
957 (95%CI: 839, 1092) (177)
0.0002
Thoracic surgery Apostolakis (2008)(87)
Day 1 postoperative thoracic drainage (mL)
412.6 ± 199.2 (29) 764.3 ± 213.9 (30) <0.001
Day 2 postoperative thoracic drainage (mL)
248.3 ± 178.5 (29) 455.0 ± 274.6 (30) 0.001
Infra-renal abdominal aneurysm surgery Leijdekkers (2006)(91)
Mean blood loss (mL) 2362 ± 1340 (16) 2466 ± 1370 (19) 0.88
IQR, inter-quartile range; KIU, kallikrein inactivation unit; SD, standard deviation.
Mortality
Five studies provided data on mortality, although all were likely underpowered to detect a difference in mortality between aprotinin and placebo (Table 8.15). Although in-hospital mortality occurred in very few patients, one study assessed 1-year mortality and found more than twice as many deaths in the placebo arm compared with the aprotinin arm (13.1% vs 5.1%)(89). However, this was a small study and the difference did not reach statistical significance.

Technical report on perioperative patient blood management – Volume 1b July 2011 137
Table 8.15 Results for Level II evidence for mortality: IV aprotinin acid versus placebo in adults
Author (year) Specific outcome Aprotinin Placebo/no treatment
Statistical significance
n/N (%) P-value Cardiac surgery Grant (2008)(89) 1-year mortality 3/59 (5.1) 8/61 (13.1) NS Later (2009)(90) In-hospital mortality 2/96 (2.1) 1/103 (1.0) 0.61 Orthopaedic surgery (includes hip, knee and spine surgery) Colwell (2007)(88) Mortality 0/175 (0) 1/177 (0.6) NS Thoracic surgery Apostolakis (2008)(87)
Mortality 0/29 (0) 0/30 (0) NA
Infra-renal abdominal aneurysm surgery Leijdekkers (2006)(91)
Mortality 1/16 (6.3) 1/19 (5.3) 1.00
NA, not applicable; NS, not significant.
Re-operation
Four studies provided data on reoperation(87;90;91;93), with three specifically assessing reoperation for bleeding, as shown in Table 8.16. There was no significant difference in reoperation for bleeding rates between aprotinin and placebo treatment arms; however, all included studies were small. In one larger cardiac surgery study(90), reoperation for any reason occurred in significantly fewer patients on aprotinin (5.2%) compared with placebo (13.6%).
Table 8.16 Results for Level II evidence for reoperation: IV aprotinin acid versus placebo in adults
Author (year) Specific outcome Aprotinin Placebo/no treatment
Statistical significance
n/N (%) P-value Cardiac surgery Later (2009)(90) Re-operation for any
reason 5/96 (5.2) 14/103 (13.6) 0.054
Re-operation due to surgical bleeding
4/96 (4.2) 3/103 (2.9) 0.71
Re-operation due to non-surgical bleeding
0/96 (0) 4/103 (3.9) 0.12
Nurözler (2008)(93) Re-operation 0/25 (0) 2/26 (7.7) 0.157 Thoracic surgery Apostolakis (2008)(87)
Reoperation for bleeding 0/29 (0) 0/30 (0) NA

Technical report on perioperative patient blood management – Volume 1b July 2011 138
Author (year) Specific outcome Aprotinin Placebo/no treatment
Statistical significance
Infra-renal abdominal aneurysm surgery Leijdekkers (2006)(91)
Reoperation for bleeding 1/16 (6.3) 2/19 (10.5) 0.65
NA, not applicable.
Thromboembolic events (including MI, stroke and other thromboses)
Four studies provided data on thromboembolic events including MI, stroke and other thromboses(88-90;93), as shown in Table 8.17. Due to the relatively small size of the identified RCTs, it is likely that all were significantly underpowered to detect a difference in the rate of thromboembolic events between treatment arms.
In three of four studies that assessed MI (three following cardiac surgery(89;90;93) and one following orthopaedic surgery(88)), there were few events and no significant difference between aprotinin and placebo. In one study in cardiac surgery(90), eight cases of MI occurred in the placebo arm compared with just one case in the aprotinin arm.
The risk of stroke was assessed in three RCTs, all of which were conducted in cardiac surgery(89;90;93). There were no differences in risk of stroke between patients that received aprotinin or placebo.
Only one trial, in orthopaedic surgery, assessed deep vein thrombosis and pulmonary embolism(88). Few events were seen in either arm and there was no significant difference between arms.
Table 8.17 Results for Level II evidence for thromboembolic events: IV aprotinin acid versus placebo in adults
Author (year) Specific outcome Aprotinin Placebo/no treatment
Statistical significance
n/N (%) P-value Cardiac surgery Grant (2008)(89) MACCE 7/59 (11.8) 21/61 (34.4) <0.005
6-month acute occlusion 3/80 SVG (3.8) 8/90 SVG (8.9) NS In-hospital stroke 0/59 (0) 1/61 (1.6) NS In-hospital myocardial infarction
1/59 (1.7) 4/61 (6.6) NS
Later (2009)(90) Perioperative myocardial infarction
1/96 (1.0) 8/103 (7.8) 0.023
Stroke 1/96 (1.0) 1/103 (1.0) 1.00 Nurözler (2008)(93) In-hospital myocardial
infarction 0/25 (0) 0/26 (0) NA
In-hospital stroke 1/25 (4.0) 0/26 (0) 0.317 Orthopaedic surgery (includes hip, knee and spine surgery) Colwell (2007)(88) Deep vein thrombosis 2/175 (1.1) 3/177 (1.7) NS

Technical report on perioperative patient blood management – Volume 1b July 2011 139
Author (year) Specific outcome Aprotinin Placebo/no treatment
Statistical significance
Pulmonary embolism 2/175 (1.1) 2/177 (1.1) NS Myocardial infarction 1/175 (0.6) 1/177 (0.6) NS
MACCE, major adverse cardiac and cerebrovascular events; NA, not applicable; NS, not significant; SVG, saphenous vein graft
Renal dysfunction/failure
As shown in Table 8.18, renal effects were examined in three RCTs, two of which were in patients undergoing cardiac surgery(89;90) and one in patients undergoing orthopaedic surgery(88). While there was no statistically significant difference in renal failure between aprotinin and placebo in these three studies, one study did show greater renal dysfunction associated with the use of aprotinin; postoperative acute kidney injury occurred in 45.8% versus 24.6%, respectively(89). In the study by Later (2009)(90), a greater proportion of subjects receiving placebo, compared with aprotinin, suffered renal complications (10.4% vs 17.5%).
Table 8.18 Results for Level II evidence for renal effects: IV aprotinin acid versus placebo in adults
Author (year) Specific outcome Aprotinin Placebo/no treatment
Statistical significance
n/N (%) P-value Cardiac surgery Grant (2008)(89) Postoperative acute
kidney injurya 27/59 (45.8) 15/61 (24.6) <0.03
Acute renal failure within 6 monthsa
2/59 (3.4) 2/61 (3.3) NS
Later (2009)(90) Renal failureb 3/96 (3.1) 3/103 (2.9) 1.0 Renal complicationb 10/96 (10.4) 18/103 (17.5) 0.011
Orthopaedic surgery Colwell (2007)(88)
Renal failurec 2/175 (1.1) 2/177 (1.1) NS
NS, not significant. a Kidney injury was defined as a 2 times increase in perioperative creatinine plasma concentration or a urine output < 0.5 mL/kg/hour in 12 hours, whilst renal failure was defined as a 3 times increase in perioperative creatinine plasma concentration or a urine output < 0.3 mL/kg/hour in 24 hours. b Renal failure required a postoperative serum creatinine of at least 2.0 mg/dL with an increase over the preoperative baseline level of at least 0.7 mg/dL. Risk of renal dysfunction defined as a 1.5 times increase in perioperative creatinine plasma concentration or a urine output < 0.5 mL/kg/hour in 6 hours. c Not defined.
ICU length of stay
Two studies(90;93), conducted in patients undergoing cardiac surgery, assessed the length of ICU stay associated with aprotinin and placebo (Table 8.19). Both studies showed no difference between the two groups.

Technical report on perioperative patient blood management – Volume 1b July 2011 140
Table 8.19 Results for Level II evidence for ICU length of stay: IV aprotinin acid versus placebo in adults
Author (year) Specific outcome Aprotinin Placebo/no treatment
Statistical significance
Mean ± SD (N) P-value Cardiac surgery Later (2009)(90) ICU length of stay (hours) 55.4 ± 134.2 (96) 60.1 ± 116.6 (103) 0.79 Nurözler (2008)(93) ICU length of stay (hours) 28 ± 11 (25) 33 ± 10 (26) 0.153 ICU, intensive care unit; SD, standard deviation.
Hospital length of stay
Hospital length of stay was assessed in two studies which were conducted in patients undergoing cardiac surgery(90;93), as shown in Table 8.20. Both studies showed no difference in hospital length of stay between aprotinin and placebo.
Table 8.20 Results for Level II evidence for hospital length of stay: IV aprotinin acid versus placebo in adults
Author (year) Specific outcome Aprotinin Placebo/no treatment
Statistical significance
Mean ± SD (N) P-value Cardiac surgery Later (2009)(90) Hospital length of stay
(days) 7.8 ± 6.7 (96) 8.5 ± 7.4 (103) 0.49
Nurözler (2008)(93) Hospital length of stay (days)
5.3 ± 1.6 (25) 5.5 ± 1.4 (26) 0.660
SD, standard deviation.
Topical aprotinin The results of the single study which examined the use of topical aprotinin in cardiac surgery are summarised in Table 8.21. The study by Mehraien (2009)(92) showed that the use of topical aprotinin resulted in a statistically significant reduction in transfusion volume (~1.2 less units of packed cells; P=0.002), blood loss (~250 mL less; P=0.003) and ICU length of stay (~20 hours less; P=0.001) in adult patients undergoing first-time coronary artery bypass surgery.

Technical report on perioperative patient blood management – Volume 1b July 2011 141
Table 8.21 Results for Level II evidence: topical aprotinin versus placebo in adults Author (year) Specific outcome Aprotinin Placebo/no
treatment Statistical significance
Transfusion volume
Mean ± SD (N) P-value Cardiac surgery Mehraien (2009)(92)
Mean packed cells (units) 0.5 ± 0.7 (64) 1.7 ± 1.0 (64) 0.002
Blood loss
Mean ± SD (N) P-value Cardiac surgery Mehraien (2009) (92)
24-hour chest tube loss (mL)
451 ± 218 (64) 707 ± 269 (64) 0.003
ICU length of stay
Mean ± SD (N) P-value Cardiac surgery Mehraien (2009) (92)
ICU length of stay (hours) 48.8 ± 13.6 (64) 69.4 ± 16.6 (64) 0.001
ICU, intensive care unit; SD, standard deviation.
Level III evidence Due to the extensive amount of Level I evidence available for the majority of primary outcomes for this intervention, a search for Level III evidence was not conducted. However, one highly relevant systematic review of Level III evidence was identified during the evaluation of the Level I evidence(86). This was described with the Level I evidence.
A search for evidence specifically relating to quality of life was conducted. This search found no relevant Level III evidence.
Level IV evidence Due to the extensive amount of Level I evidence available for the majority of the primary outcomes for this intervention, a search for Level IV evidence was not conducted.
A search for evidence specifically relating to quality of life was conducted. This search found no relevant Level IV evidence.

Technical report on perioperative patient blood management – Volume 1b July 2011 142
B. TRANEXAMIC ACID Tranexamic acid is a synthetic derivative of the amino acid lysine that acts as an antifibrinolytic by competitively inhibiting the activation of plasminogen to plasmin, a molecule responsible for the degradation of fibrin. The Advisory Committee on Prescription Medicines (ACPM) has recently recommended approval of tranexamic acid injection:
for the reduction of peri- and postoperative blood loss and of the need for blood transfusion in adult patients undergoing cardiac surgery or total knee or hip arthroplasty; and paediatric patients undergoing cardiac surgery.
Tranexamic acid tablets are approved in Australia for a number of indications including haemostatic, hereditary angioedema, short-term treatment of traumatic hyphaema, patients with coagulopathies undergoing minor surgery, and menorrhagia.
Methods
The systematic review process identified 30 Level I studies that assessed the effect of aprotinin, tranexamic acid, ε-aminocaproic acid or desmopressin for minimising perioperative blood loss on morbidity, mortality and transfusion. Level I studies were only included if they formally pooled the relevant outcome data; this resulted in the exclusion of only three potentially relevant Level I studies.
Of the 30 Level I studies identified, 19 studies provided data specifically on tranexamic acid. As 19 studies meeting the requirements of Level I evidence were identified, lower levels of evidence were not comprehensively searched. However, the most comprehensive and highest quality Level I evidence available for tranexamic acid, Henry (2007)(66), was updated only to June 2006. Therefore, a search of Level II (RCT) evidence was conducted to identify any additional studies published after this time. This search identified 16 RCTs relevant to this review.
The search for evidence of the effectiveness and safety of tranexamic acid was limited to the comparison between tranexamic acid therapy and no therapy (i.e. no treatment or placebo). Thus, a formal systematic review comparing tranexamic acid with the other agents (aprotinin, ε-aminocaproic acid and desmopressin) was not conducted. However, where appropriate, evidence relating to the comparison between tranexamic acid and ε-aminocaproic acid and aprotinin has been discussed.
No socioeconomic literature pertaining to Australia’s Indigenous population was identified in the literature search for this research question.
One published cost-effectiveness analysis on the use of cell salvage compared with alternative transfusion strategies (including antifibrinolytics as a group) was identified in the literature search for this question. A brief summary of the findings of this report were presented after the review of the clinical evidence for intraoperative cell salvage (see Section 2).

Technical report on perioperative patient blood management – Volume 1b July 2011 143
Level I evidence Nineteen systematic reviews that included formal meta-analysis of data were identified in the literature search. All reviews compared tranexamic acid with no tranexamic acid (placebo or no treatment). A summary of the key features of the 19 identified systematic reviews is provided in Table 8.22. Studies have been arranged in order of literature search date to show which of the systematic reviews provide the most up-to-date and comprehensive data.
There is substantial overlap between many of the systematic reviews. As such, a decision was made to limit the evaluation of evidence to the most up-to-date and comprehensive reviews for each population and surgery type. For these reasons, the following reviews were chosen to form the basis of the guideline evaluation (pivotal reviews; shown in dark shading in Table 8.22):
• Henry (2007)(66) – provides a comprehensive analysis of intravenous (IV) tranexamic acid in adults undergoing all surgery types.
• Abrishami (2009)(67) – provides an analysis of the use of topical tranexamic acid in adults undergoing cardiac surgery.
• Schouten (2009)(68) – provides a comprehensive analysis of IV tranexamic acid in children undergoing major surgery (cardiac and scoliosis).
Most other reviews were either superseded by one of the included reviews, or were limited to specific surgery types. Reviews published after the pivotal reviews have been included as supportive evidence. Reviews published prior to the pivotal reviews are considered to have been superseded and have not been formally assessed in this review.
The quality of each of the included systematic reviews was assessed using NHMRC criteria and is presented in Table 8.22.
Table 8.22 Characteristics of Level I evidence for tranexamic acid Author (Year) Study quality
Date of search
Population Surgery
Treatment No. of included RCTs
Relevant outcomes
Gurusamy (2009)(69) Cochrane review Good
Nov 2008 Adult Liver resection
TXA (oral) AP (IV) ACA (IV)
1 1 1
Transfusion incidence Transfusion volume Blood loss Mortality Morbidity
Kongnyuy (2009)(94) Cochrane review Gooda
Sep 2008 Adult Myomectomy
TXA (IV) 1 Transfusion incidence Blood loss Morbidity
Abrishami (2009)(67) Good
Jul 2008 Adult Cardiac
TXA (topical) AP (topical)
4 5
Transfusion incidence Transfusion volume Blood loss

Technical report on perioperative patient blood management – Volume 1b July 2011 144
Author (Year) Study quality
Date of search
Population Surgery
Treatment No. of included RCTs
Relevant outcomes
McIlroy (2009)(70) Good
Jul 2008 Adult + aspirin Cardiac
TXA/ACA (IV) AP (IV)
3 13
Transfusion incidence Transfusion volume Blood loss Mortality Reoperation Morbidity
Henry (2009)(66) Good
Jan 2008 Adult Cardiac
TXA (IV) AP (IV) ACA (IV)
81 23 6
Mortality Morbidity
Tzortzopoulou (2008)(73) Cochrane review Good
Jul 2007 Children Scoliosis
TXA (IV) AP (IV) ACA (IV)
2 2 2
Transfusion incidence Transfusion volume Blood loss
Kagoma (2009)(74) Good
May 2007 Adult Orthopaedic
AP/TXA/ACA (IV)b
29 Transfusion incidence Blood loss Morbidity
Schouten (2009)(68) Fair
Oct 2006 Children Cardiac and scoliosis
AP (IV) TXA (IV) ACA (IV)
18 7 4
Transfusion volume Blood loss
Brown (2007)(75) Fair
Jul 2006 Adult Cardiac
TXA (IV) AP (IV) ACA (IV)
31 110 18
Transfusion incidence Blood loss Mortality Reoperation Morbidity
Henry (2007)(66) Cochrane review Good
Jul 2006 Adult Any
TXA (IV) AP (IV) ACA (IV)
45 116 11
Transfusion incidence Transfusion volume Blood loss Mortality Reoperation Morbidity
Murphy (2006)(95) Nov 2004 Adult Off-pump CABG
TXA (IV) 4 Transfusion incidence
Zufferey (2006)(76) Jul 2005 Adult Orthopaedic
TXA (IV) AP (IV) ACA (IV)
20 23 4
Transfusion incidence Morbidity
Cid (2005)(96) Oct 2004 Adult Knee replacement
TXA (IV) 9 Transfusion incidence
Hanif (2004)(97) Jun 2004 Adult Cardiac
TXA (topical) 1 Transfusion incidence Blood loss

Technical report on perioperative patient blood management – Volume 1b July 2011 145
Author (Year) Study quality
Date of search
Population Surgery
Treatment No. of included RCTs
Relevant outcomes
Ho (2003)(98) Dec 2002 Adult Hip and knee replacement
TXA (IV) 12 Transfusion incidence Transfusion volume Blood loss Morbidity
Levi (1999)(81) Dec 1999 Adult Cardiac
TXA/ACA (IV) AP (IV) DP (IV)
17 45 16
Transfusion incidence Transfusion volume Blood loss Mortality Reoperation Morbidity
Martin-Hirsch (1999)(99) Cochrane review
Jul 1997 Adult Cervical intraepithelial neoplasia
TXA (IV/oral) 4 Blood loss Morbidity
Laupacis (1997)(83) Mar 1997 Adult Cardiac
TXA (IV) AP (IV) ACA (IV) DP (IV)
12 45 3 12
Transfusion incidence
Fremes (1994)(84) Jun 1993 Adult Cardiac
TXA (IV) AP (IV) ACA (IV) DP (IV)
2 14 2 13
Transfusion incidence Transfusion volume Blood loss Mortality Reoperation
Note: Systematic reviews which form the basis of this evaluation are shown in dark shading (pivotal reviews). Systematic reviews which have literature searches which are more up-to-date than the core reviews are shown in light shading (supportive reviews). Only treatments relevant to this module are shown here. Relevant treatments not assessed in this section of the report are shown in italics. Treatments were assumed to be given intravenously if the mode of administration was not specifically stated as IV, topical or oral. ACA, ε-aminocaproic acid; AP, aprotinin; CABG, coronary artery bypass graft; DP, desmopressin; IV, intravenous; TXA, tranexamic acid. a This was a good quality systematic review including one good quality RCT for tranexamic acid. b All treatments were administered intravenously except for some oral use of TXA in one included study.
The results of the included reviews will be presented according to population group: that is, adults, adults using aspirin and paediatric. In addition, three different formulations of tranexamic acid will be assessed in the adult population: IV, topical and oral.
Adult population Intravenous tranexamic acid The results of the systematic review by Henry (2007)(66), which assessed the use of IV tranexamic acid in adults, are summarised in Table 8.23. This review was a comprehensive Cochrane review considered to be of good methodological quality.
The authors note that the dose regimens for tranexamic acid varied significantly between trials. In the cardiac trials, the loading or bolus dose ranged from 2.5 mg/kg to 100 mg/kg,

Technical report on perioperative patient blood management – Volume 1b July 2011 146
while the maintenance dose ranged from 0.25 mg/kg/hour to 4.0 mg/kg/hour delivered over 1–12 hours. Similar dosing variations were observed in trials assessing other surgery types.
The results of the analysis show that tranexamic acid is effective at reducing the proportion of surgical patients who require transfusion (RR 0.61; 95%CI: 0.54, 0.70; P<0.001) and blood loss (WMD: –444 mL; 95%CI: –572, –315; P<0.001). There was no significant difference in the units of blood transfused in patients who required transfusion (WMD: –0.51; 95%CI: –1.06, 0.04; P=0.07). The effectiveness of tranexamic acid was generally consistent across different surgery types and, in particular, the most commonly studied surgery types: cardiac and orthopaedic. While many of the analyses and subgroup analyses showed substantial heterogeneity, this appears to be the result of differing magnitudes of effect, possibly related to the different surgical types being assessed, rather than different directions of effect.
The proportion of surgical patients who required transfusion was consistent regardless of study quality (RR 0.60; 95%CI: 0.49, 0.72 for Cochrane Scale A [highest quality]; RR 0.55; 95%CI: 0.42, 0.73 for Cochrane Scale B and; RR 0.69; 95%CI: 0.56, 0.86 for Cochrane Scale C [lowest quality]).
Treatment with tranexamic acid therapy did not result in increased mortality compared with no therapy (RR 0.60; 95%CI: 0.32, 1.12; P=0.11). In addition, tranexamic acid was generally not associated with increased morbidity, with the exception of non-statistically significant increases in stroke (RR 1.25; 95%CI: 0.47, 3.31; P=0.65) and other thrombosis (RR 2.10; 95%CI: 0.49, 8.99; P=0.32). However, it is important to note that the analyses of mortality and morbidity are not likely to be sufficiently powered to detect a statistically significant difference between tranexamic acid therapy and no therapy.
Table 8.23 Results for Level I evidence: tranexamic acid versus no tranexamic acid in adults (Henry, 2007)
Author (year) No. trials (N) No. of trials included in analysis (N)a
Tranexamic acid No tranexamic acid
Pooled risk estimate
Exposure to allogeneic blood transfusion
n/N (%) RR (95%CI) Henry (2007)(66) 53 trials (N=3836)
51 trials (N=3751) 546/2020 (27.0) 796/1816 (43.8) All studies
0.61 (0.54, 0.70) P<0.001 (Phet<0.001)
By surgery type
Henry (2007)(66) 29 trials (N=2488) 28 trials (N=2443)
367/1322 (27.8) 476/1166 (40.8) Cardiac surgery 0.69 (0.60, 0.79) P<0.001 (Phet=0.03)
Henry (2007)(66) 21 trials (N=993) 20 trials (N=953)
139/520 (26.7) 247/473 (52.2) Orthopaedic surgery 0.44 (0.33, 0.60) P<0.001 (Phet<0.001)
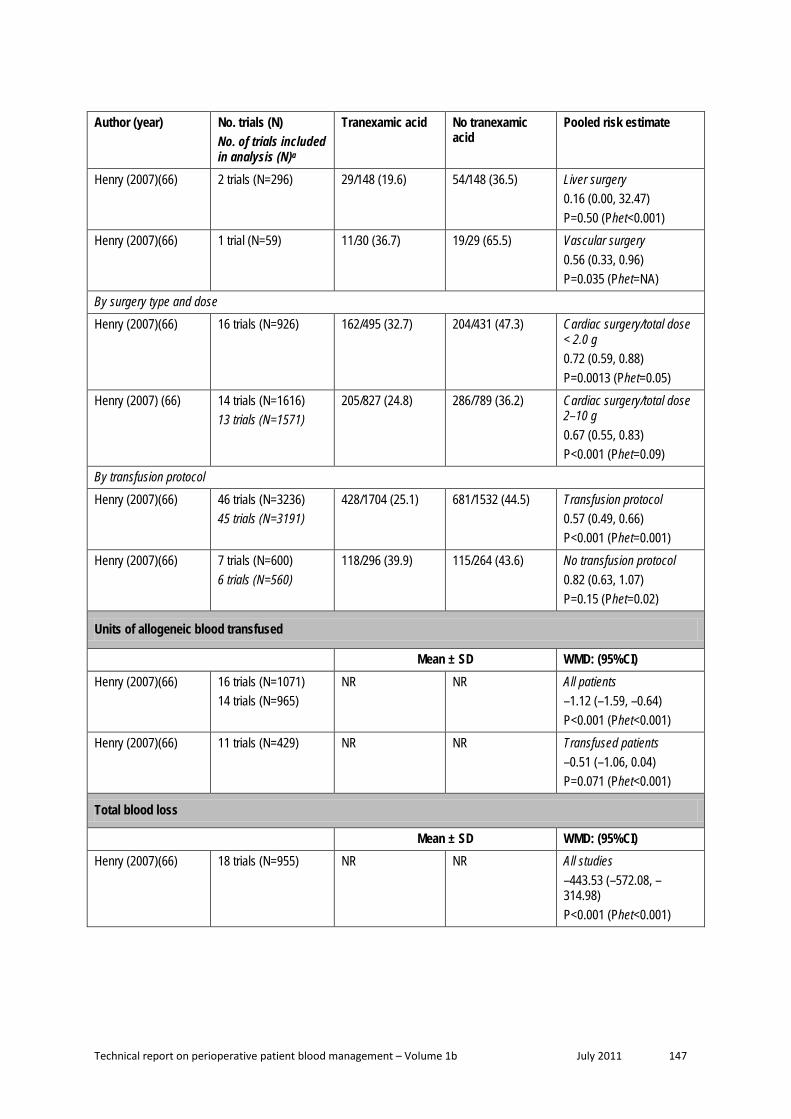
Technical report on perioperative patient blood management – Volume 1b July 2011 147
Author (year) No. trials (N) No. of trials included in analysis (N)a
Tranexamic acid No tranexamic acid
Pooled risk estimate
Henry (2007)(66) 2 trials (N=296)
29/148 (19.6) 54/148 (36.5) Liver surgery 0.16 (0.00, 32.47) P=0.50 (Phet<0.001)
Henry (2007)(66) 1 trial (N=59) 11/30 (36.7) 19/29 (65.5) Vascular surgery 0.56 (0.33, 0.96) P=0.035 (Phet=NA)
By surgery type and dose
Henry (2007)(66) 16 trials (N=926) 162/495 (32.7) 204/431 (47.3) Cardiac surgery/total dose < 2.0 g 0.72 (0.59, 0.88) P=0.0013 (Phet=0.05)
Henry (2007) (66) 14 trials (N=1616) 13 trials (N=1571)
205/827 (24.8) 286/789 (36.2) Cardiac surgery/total dose 2–10 g 0.67 (0.55, 0.83) P<0.001 (Phet=0.09)
By transfusion protocol
Henry (2007)(66) 46 trials (N=3236) 45 trials (N=3191)
428/1704 (25.1) 681/1532 (44.5) Transfusion protocol 0.57 (0.49, 0.66) P<0.001 (Phet=0.001)
Henry (2007)(66) 7 trials (N=600) 6 trials (N=560)
118/296 (39.9) 115/264 (43.6) No transfusion protocol 0.82 (0.63, 1.07) P=0.15 (Phet=0.02)
Units of allogeneic blood transfused
Mean ± SD WMD: (95%CI) Henry (2007)(66) 16 trials (N=1071)
14 trials (N=965) NR NR All patients
–1.12 (–1.59, –0.64) P<0.001 (Phet<0.001)
Henry (2007)(66) 11 trials (N=429) NR NR Transfused patients –0.51 (–1.06, 0.04) P=0.071 (Phet<0.001)
Total blood loss
Mean ± SD WMD: (95%CI) Henry (2007)(66) 18 trials (N=955) NR NR All studies
–443.53 (–572.08, –314.98) P<0.001 (Phet<0.001)

Technical report on perioperative patient blood management – Volume 1b July 2011 148
Author (year) No. trials (N) No. of trials included in analysis (N)a
Tranexamic acid No tranexamic acid
Pooled risk estimate
By surgery type
Henry (2007)(66) 3 trials (N=245) NR NR Cardiac surgery –439.82 (–606.50, –273.15) P<0.001 (Phet=0.82)
Henry (2007)(66) 14 trials (N=690) NR NR Orthopaedic surgery –439.51 (–590.93, –288.09) P<0.001 (Phet<0.001)
Henry (2007)(66) 1 trial (N=20) NR NR Liver surgery –6552.0 (–14329.54, 1225.54) P=0.099 (Phet=NA)
Intraoperative blood loss
Mean ± SD WMD: (95%CI) Henry (2007)(66) 10 trials (N=553) NR NR All studies
–54.89 (–105.31, –4.48) P=0.033 (Phet=0.26)
By surgery type
Henry (2007)(66) 3 trials (N=144) NR NR Cardiac surgery –287.16 (–481.57, –92.75) P=0.0038 (Phet=0.66)
Henry (2007)(66) 7 trials (N=409) NR NR Orthopaedic surgery –29.52 (–69.17, 10.14) P=0.14 (Phet=0.69)
Postoperative blood loss
Mean ± SD WMD: (95%CI) Henry (2007)(66) 23 trials (N=1423) NR NR All studies
–247.90 (–313.07, –182.73) P<0.001 (Phet<0.001)
By surgery type
Henry (2007)(66) 17 trials (N=1130) NR NR Cardiac surgery –262.60 (–318.62, –206.59) P<0.001 (Phet=0.01)
Henry (2007)(66) 6 trials (N=293) NR NR Orthopaedic surgery –209.72 (–384.28, –35.16) P=0.019 (Phet<0.001)

Technical report on perioperative patient blood management – Volume 1b July 2011 149
Author (year) No. trials (N) No. of trials included in analysis (N)a
Tranexamic acid No tranexamic acid
Pooled risk estimate
By surgery type and dose
Henry (2007) (66) 9 trials (N=302) NR NR Cardiac surgery/total dose < 2.0 g –251.77 (–352.27, –151.26) P<0.001 (Phet=0.07)
Henry (2007)(66) 8 trials (N=828) NR NR Cardiac surgery/total dose 2.0–10.0 g –272.85 (–340.79, –204.90) P<0.001 (Phet=0.03)
Reoperation for bleeding
n/N (%) RR (95%CI) Henry (2007)(66) 20 trials (N=1676)
18 trials (N=1598) 25/872 (2.9) 40/804 (5.0) All studies
0.67 (0.41, 1.09) P=0.11 (Phet=0.92)
Henry (2007)(66) 19 trials (N=1618) 17 trials (N=1540)
23/843 (2.7) 38/775 (4.9) Cardiac surgery 0.65 (0.39, 1.08) P=0.097 (Phet=0.90)
Mortality
n/N (%) RR (95%CI) Henry (2007)(66) 24 trials (N=2210)
16 trials (N=1684) 14/1129 (1.2) 26/1081 (2.4) All studies
0.60 (0.32, 1.12) P=0.11 (Phet=0.84)
Henry (2007)(66) 18 trials (N=1702) 11 trials (N=1390)
8/872 (0.9) 16/830 (1.9) Cardiac surgery 0.55 (0.24, 1.25) P=0.15 (Phet=0.73)
Myocardial infarction
n/N (%) RR (95%CI) Henry (2007)(66) 17 trials (N=1718)
12 trials (N=1344) 15/885 (1.7) 16/833 (1.9) All studies
0.96 (0.48, 1.90) P=0.91 (Phet=0.96)
Henry (2007)(66) 15 trials (N=1632) 9 trials (N=1048)
13/841 (1.5) 15/791 (1.9) Cardiac surgery 0.91 (0.44, 1.88) P=0.79 (Phet=0.91)

Technical report on perioperative patient blood management – Volume 1b July 2011 150
Author (year) No. trials (N) No. of trials included in analysis (N)a
Tranexamic acid No tranexamic acid
Pooled risk estimate
Stroke
n/N (%) RR (95%CI) Henry (2007)(66) 14 trials (N=1403)
7 trials (N=937) 10/740 (1.4) 7/663 (1.1) All studies
1.25 (0.47, 3.31) P=0.65 (Phet=0.79)
Henry (2007)(66) 13 trials (N=1345) 5 trials (N=841)
9/711 (1.3) 5/634 (0.8) Cardiac surgery 1.52 (0.52, 4.41) P=0.44 (Phet=0.78)
Deep vein thrombosis
n/N (%) RR (95%CI) Henry (2007)(66) 18 trials (N=1109)
10 trials (N=681) 11/565 (1.9) 16/544 (2.9) All studies
0.77 (0.37, 1.61) P=0.49 (Phet=0.81)
Henry (2007)(66) 4 trials (N=442) 2 trials (N=291)
0/221 (0) 2/201 (1.0) Cardiac surgery 0.37 (0.04, 3.47) P=0.38 (Phet=0.95)
Pulmonary embolism
n/N (%) RR (95%CI) Henry (2007)(66) 13 trials (N=946)
7 trials (N=568) 2/487 (0.4) 6/459 (1.3) All studies
0.55 (0.17, 1.76) P=0.31 (Phet=0.93)
Henry (2007)(66) 6 trials (N=569) 2 trials (N=289)
0/298 (0) 2/271 (0.7) Cardiac surgery 0.33 (0.04, 3.15) P=0.34 (Phet=0.98)
Other thrombosis
n/N (%) RR (95%CI) Henry (2007)(66) 7 trials (N=289)
2 trials (N=114) 5/148 (3.4) 2/141 (1.4) All studies
2.10 (0.49, 8.99) P=0.32 (Phet=0.80)
Renal failure/dysfunction
n/N (%) RR (95%CI) Henry (2007)(66) 5 trials (N=444)
4 trials (N=400) 2/222 (0.9) 3/222 (1.4) Cardiac studies
0.73 (0.16, 3.32) P=0.68 (Phet=0.69)

Technical report on perioperative patient blood management – Volume 1b July 2011 151
Author (year) No. trials (N) No. of trials included in analysis (N)a
Tranexamic acid No tranexamic acid
Pooled risk estimate
Hospital length of stay
Mean ± SD WMD: (95%CI) Henry (2007)(66) 4 trials (N=176)
NR NR All studies
–0.30 (–0.71, 0.10) P=0.14 (Phet=0.66)
Henry (2007)(66) 2 trials (N=116)
NR NR Cardiac surgery –0.23 (–0.67, 0.21) P=0.31 (Phet=0.64)
Note: ‘No tranexamic acid’ group denotes placebo or no treatment. CI, confidence interval; het, heterogeneity; NA, not applicable; NR, not reported; RR, risk ratio; SD, standard deviation; WMD, weighted mean difference. a Where individual studies had either 100% events in both treatment arms, no events in both treatment arms or no SD is reported, a risk estimate for that individual study could not be calculated, and it could not be included in the pooled analysis. Where this has occurred, the actual number of studies and subjects included in the analysis will be stated.
Subsequent to the publication of the Henry (2007) Cochrane review, a head-to-head RCT was completed comparing aprotinin with the lysine analogues (tranexamic acid and aminocaproic acid) in patients undergoing high-risk cardiac surgery(85). The BART study found that mortality was higher in patients receiving aprotinin (6.0%) compared with both tranexamic acid (3.9%) and ε-aminocaproic acid (4.0%)(85). The corresponding relative risks were 1.55 (95%CI: 0.99, 2.42) and 1.52 (95%CI: 0.98, 2.36) respectively. The relative risk of death in the aprotinin group compared to the tranexamic acid and aminocaproic acid groups combined was 1.53 (95%CI: 1.06, 2.22). The difference in the death rate between aprotinin and the lysine analogues was driven mainly by a difference in deaths due to cardiac causes (RR 2.19; 95%CI: 1.25, 3.84). This increased risk of death was seen despite a modest reduction in the risk of massive bleeding for aprotinin compared with the lysine analogues (9.5% vs 12.1%). Due to the higher death rate associated with aprotinin compared with the lysine analogues, the BART study was terminated early.
In light of the publication of the BART study, Henry and colleagues subsequently updated their meta-analysis of aprotinin, tranexamic acid and aminocaproic acid in cardiac surgery (71). The results of the updated analyses relating to tranexamic acid are summarised in Table 8.24. There is no significant difference in MI and mortality when comparing tranexamic acid therapy with no therapy (RR 0.86; 95%CI: 0.43, 1.75 and RR 0.55; 95%CI: 0.24, 1.25, respectively).
However, the updated head-to-head analyses reported in Henry (2009)(71) showed an increased risk of mortality with aprotinin compared with tranexamic acid and ε-aminocaproic acid, which was largely driven by the inclusion of the BART study. The pooled risk of death for aprotinin compared with tranexamic acid in head-to-head trials was RR 1.43 (0.98, 2.08), while the pooled risk of death for aprotinin compared with ε-aminocaproic acid in head-to-head trials was RR 1.49 (0.98, 2.28).

Technical report on perioperative patient blood management – Volume 1b July 2011 152
Table 8.24 Results for Level I evidence: tranexamic acid versus no tranexamic acid in adult cardiac surgery patients (Henry, 2009)
Author (year) No. trials (N) No. of trials included in analysis (N)a
Tranexamic acid No tranexamic acid
Pooled risk estimate
Henry (2007) Pooled risk estimate
Exposure to allogeneic blood transfusion
n/N (%) RR (95%CI) Henry (2009)(71) N trials NR
(N=NR) NR NR 0.70 (0.61, 0.80)
P=NR (Phet=NR)
0.69 (0.60, 0.79) P<0.001 (Phet=0.03)
Reoperation due to bleeding
n/N (%) RR (95%CI) Henry (2009)(71) NR NR NR 0.67 (0.41, 1.12)
P=NR (Phet=NR)
0.65 (0.39, 1.08) P=0.097 (Phet=0.90)
Myocardial infarction
n/N (%) RR (95%CI) Henry (2009)(71) 16 trials (N=1732)
10 trials (N=1148) 13/891 (1.5) 16/841 (1.9) 0.86 (0.43, 1.75)
P=NR (Phet=NR)
0.91 (0.44, 1.88) P=0.79 (Phet=0.91)
Mortality
n/N (%) RR (95%CI) Henry (2009)(71) 19 trials (N=1802)
11 trials (N=1390) 8/922 (0.9) 16/880 (1.8) 0.55 (0.24, 1.25)
P=NR (Phet=NR)
0.55 (0.24, 1.25) P=0.15 (Phet=0.73)
Note: ‘No tranexamic acid’ group denotes placebo or no treatment. CI, confidence interval; het, heterogeneity; NR, not reported; RR, risk ratio; SD, standard deviation. a Where individual studies had either 100% events in both treatment arms, no events in both treatment arms or no SD is reported, a risk estimate for that individual study could not be calculated, and it could not be included in the pooled analysis. Where this has occurred, the actual number of studies and subjects included in the analysis will be stated.
A number of additional systematic reviews of aprotinin have been published since the Henry (2007) review and provide supportive evidence. These reviews provide additional evidence in cardiac surgery(70;75), orthopaedic surgery(74) and liver resection(69). Each of these will be described in detail below. The results of these reviews are generally consistent with the results of the Henry (2007) review, showing that tranexamic acid results in a reduction in the number of surgical patients requiring transfusion and/or reducing the volume of transfusion/blood loss.
The review by Brown (2007) was conducted in patients undergoing cardiac surgery and compared tranexamic acid, ε-aminocaproic acid and aprotinin with placebo, and each other.

Technical report on perioperative patient blood management – Volume 1b July 2011 153
While it was conducted at a similar time to the Henry (2007) review, and is not as up-to-date as the Henry (2009) review, it is included here because it includes a greater number of studies.
The review by Brown (2007) was considered to be of fair methodology quality. The individual study data and forest plots are not provided with the publication which makes verification of data difficult. In addition, investigation of a number of studies that were included in the Brown review and not the Henry (2007) review has revealed that some of the additional included studies investigated an active therapy in combination with other therapies (rather than active therapy alone). Finally, a possible data error was identified for a subgroup analysis for the tranexamic acid versus placebo comparison. The authors note that they investigated heterogeneity using the I2 statistic; however, this is not reported for each of the analyses. The random effects method was used for all analyses to control for heterogeneity.
The results of the Brown (2007) review are summarised in Table 8.25. The authors note that while tranexamic acid dosing differed between trials, there was no difference in effect between high dose and low dose(75). As such, the results are reported for all doses together.
Similar to the Henry (2007) review, the Brown review found that tranexamic acid therapy reduced the incidence of transfusion in cardiac surgery patients (RR 0.75; 95%CI: 0.60, 0.92)(75). The authors further stratified these results by specific types of cardiac surgery and found largely consistent results; the RR of transfusion was 0.75 (95%CI: 0.57, 0.98) for coronary artery bypass graft (CABG), and 0.69 (95%CI: 0.48, 0.98) for CABG with valve surgery. Brown (2007) report a significantly increased risk of transfusion incidence for valve-only surgery (RR 1.40; 95%CI: 1.17, 1.69). While no details on the number of included trials and patients are included within the publication for these subgroup analyses, and the data cannot be easily verified due to the absence of individual trial data or forest plots, further investigation has called this result into question. According to the supplemental appendix associated with this article, there are potentially nine studies that provide valve surgery data for this outcome. One of these included studies has been listed as placebo-controlled but in fact contains no placebo group, while a number of other studies do not appear to present data for a valve-only surgery subgroup. The only study for which data could be found showed that patients on tranexamic acid had a lower risk of transfusion than patients on placebo (24.5% vs 45%, respectively)(100). It appears that the results of this study may have been misinterpreted in the Brown review, with the data for no transfusions being interpreted as number of transfusions.
While both the Henry (2007) and Brown (2007) reviews showed a significant decrease in blood loss associated with tranexamic acid therapy, the magnitude of this effect differed slightly, with the difference in total blood loss between tranexamic acid therapy and no therapy being –440 mL and –285 mL, respectively. The Henry (2007) analysis of total blood loss included data from only three trials, while the analysis from Brown included 11 trials. This may be a result of how ‘total dose’ was defined in the two reviews; in the Henry review, only trials combining intra- and postoperative blood loss were included in this category,

Technical report on perioperative patient blood management – Volume 1b July 2011 154
while in the Brown review, it appears that where intra- and operative blood loss has been reported, this has been combined for the review.
The results for mortality and most morbidity outcomes were similar between the Brown (2007) and Henry (2007) reviews. There was no significant difference between tranexamic acid therapy and no therapy in the Brown (2007)(75) review for mortality (RR 0.67; 95%CI: 0.33, 1.37), return to operating room (RR 0.70; 95%CI: 0.44, 1.11) and MI (RR 0.94; 95%CI: 0.51, 1.74). While there was no significant difference in risk of stroke between tranexamic acid therapy and no therapy, the risk estimate suggested a potentially higher risk (RR 1.31; 0.59, 2.93). It is important to note that due to the low rate of these events (in particular mortality, MI and stroke), the analyses are unlikely to be sufficiently powered to detect a statistically significant difference.
It is particularly important to note the results of the analysis of renal function in the Brown review. In the Henry review, renal failure and dysfunction were combined into one category, while Brown separated out renal failure (which was defined as new onset dialysis; or in one study, a ≥ 2.0 mg/dL increase in creatinine) from renal dysfunction (a ≥ 0.5 mg/dL increase in creatinine). Based on data from three trials (N=840), there was no significant difference in renal failure between tranexamic acid therapy and no therapy (RR 1.43; 95%CI: 0.30, 6.85; P=0.66). However, as for mortality, MI and stroke, this is a low incidence event and it is important to keep in mind that the analysis may not have been sufficiently powered to detect this outcome and find a statistically significant difference. There was no significant difference in renal dysfunction between tranexamic acid therapy and no therapy (four trials; RR 2.02; 95%CI: 0.73, 5.60; P=0.178)(75). These risk estimates are both higher than the RR of 0.73 for combined renal failure and renal dysfunction from the Henry (2007)(75) review. Brown et al. note that renal dysfunction, defined as a 0.5 mg/dL elevation in postoperative serum creatinine, has been shown to increase the risk of 30-day mortality following cardiac surgery by 18-fold.
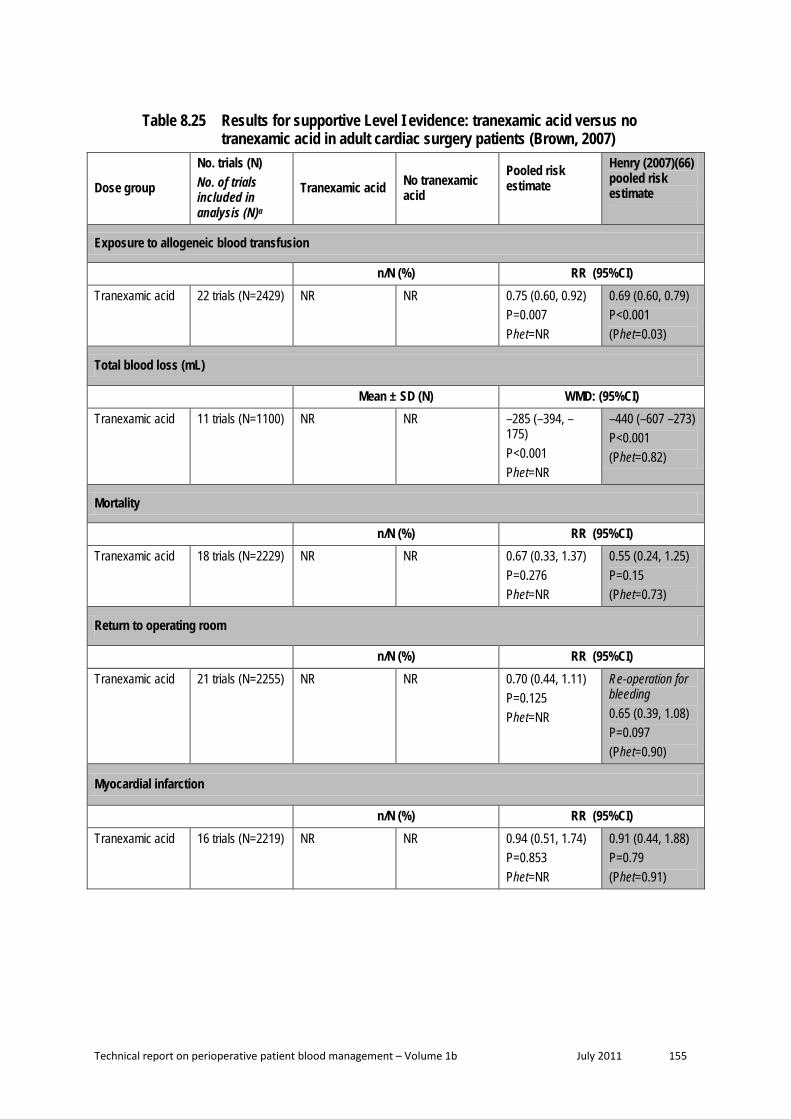
Technical report on perioperative patient blood management – Volume 1b July 2011 155
Table 8.25 Results for supportive Level I evidence: tranexamic acid versus no tranexamic acid in adult cardiac surgery patients (Brown, 2007)
Dose group
No. trials (N) No. of trials included in analysis (N)a
Tranexamic acid No tranexamic acid
Pooled risk estimate
Henry (2007)(66) pooled risk estimate
Exposure to allogeneic blood transfusion
n/N (%) RR (95%CI) Tranexamic acid 22 trials (N=2429) NR NR 0.75 (0.60, 0.92)
P=0.007 Phet=NR
0.69 (0.60, 0.79) P<0.001 (Phet=0.03)
Total blood loss (mL)
Mean ± SD (N) WMD: (95%CI) Tranexamic acid 11 trials (N=1100) NR NR –285 (–394, –
175) P<0.001 Phet=NR
–440 (–607 –273) P<0.001 (Phet=0.82)
Mortality
n/N (%) RR (95%CI) Tranexamic acid 18 trials (N=2229) NR NR 0.67 (0.33, 1.37)
P=0.276 Phet=NR
0.55 (0.24, 1.25) P=0.15 (Phet=0.73)
Return to operating room
n/N (%) RR (95%CI) Tranexamic acid 21 trials (N=2255) NR NR 0.70 (0.44, 1.11)
P=0.125 Phet=NR
Re-operation for bleeding 0.65 (0.39, 1.08) P=0.097 (Phet=0.90)
Myocardial infarction
n/N (%) RR (95%CI) Tranexamic acid 16 trials (N=2219) NR NR 0.94 (0.51, 1.74)
P=0.853 Phet=NR
0.91 (0.44, 1.88) P=0.79 (Phet=0.91)

Technical report on perioperative patient blood management – Volume 1b July 2011 156
Dose group
No. trials (N) No. of trials included in analysis (N)a
Tranexamic acid No tranexamic acid
Pooled risk estimate
Henry (2007)(66) pooled risk estimate
Stroke
n/N (%) RR (95%CI) Tranexamic acid 15 trials (N=2098) NR NR 1.31 (0.59, 2.93)
P=0.510 Phet=NR
1.52 (0.52, 4.41) P=0.44 (Phet=0.78)
Renal failureb
n/N (%) RR (95%CI) Tranexamic acid 3 trials (N=840) NR NR 1.43 (0.30, 6.85)
P=0.656 Phet=NR
Renal failure dysfunction 0.73 (0.16, 3.32) P=0.68 (Phet=0.69)
Renal dysfunctionc
n/N (%) RR (95%CI) Tranexamic acid 4 trials (N=684) NR NR 2.02 (0.73, 5.60)
P=0.178 Phet=NR
Renal failure dysfunction 0.73 (0.16, 3.32) P=0.68 (Phet=0.69)
CI, confidence interval; het, heterogeneity; NR, not reported; RR, risk ratio; SD, standard deviation; WMD, weighted mean difference. a Where individual studies had either 100% events in both treatment arms, no events in both treatment arms or no SD is reported, a risk estimate for that individual study could not be calculated, and it could not be included in the pooled analysis. Where this has occurred, the actual number of studies and subjects included in the analysis will be stated. b Renal failure was defined as a new onset of dialysis or a ≥ 2.0 mg/dL increase in creatinine (1 study only). c Renal dysfunction was defined as a ≥ 0.5 mg/dL increase in creatinine.
The results of the analysis of ε-aminocaproic/tranexamic acid (combined as lysine analogue) use in adult patients undergoing cardiac surgery who were also receiving aspirin (reported in McIlroy (2009)(70)) are summarised in Table 8.26. In some cases, data were available from a single RCT for tranexamic acid alone. The results show that the use of tranexamic acid was associated with a significant reduction in the amount of postoperative blood loss (WMD: –189 mL; 95%CI: –287, –91). There was also no significant difference between the lysine analogue and no lysine analogue arms with regards to reoperation (OR 0.30; 95%CI: 0.01, 8.02). Data for transfusion incidence and thrombotic complications was available for only one trial that assessed tranexamic acid. The results of these analyses also showed no significant difference between tranexamic acid therapy and no therapy. However, for the thrombotic complications outcome, this analysis would be substantially underpowered.
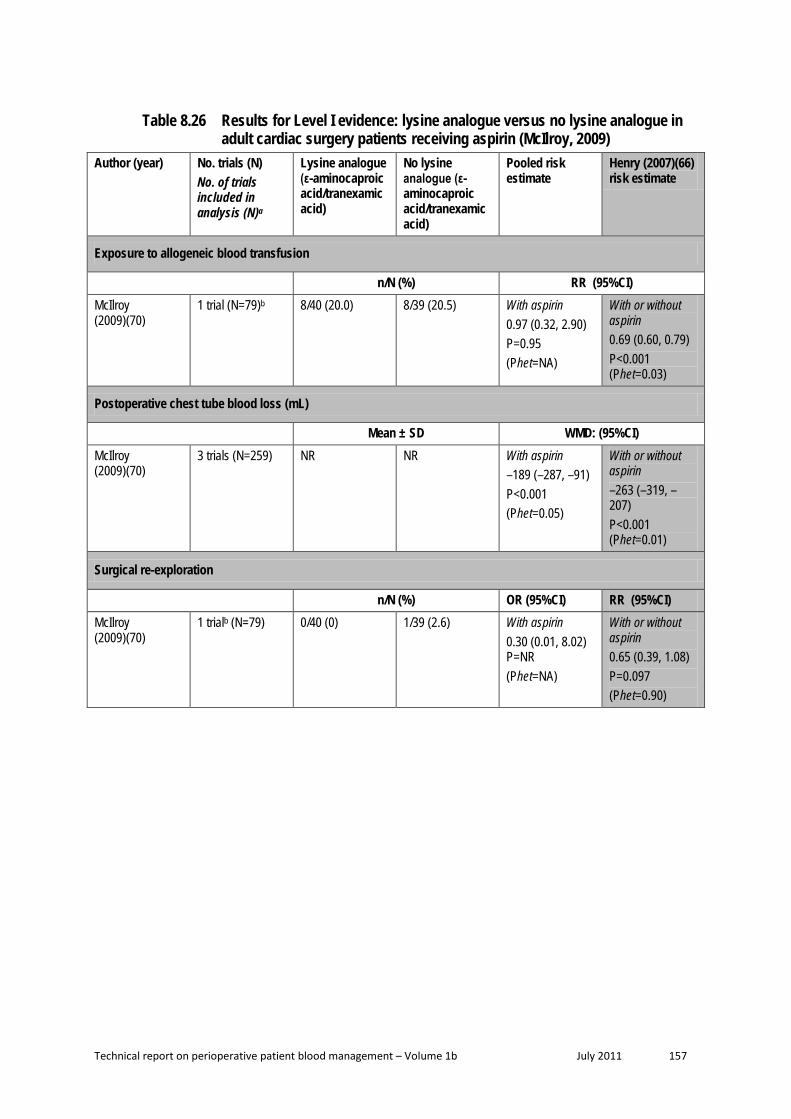
Technical report on perioperative patient blood management – Volume 1b July 2011 157
Table 8.26 Results for Level I evidence: lysine analogue versus no lysine analogue in adult cardiac surgery patients receiving aspirin (McIlroy, 2009)
Author (year) No. trials (N) No. of trials included in analysis (N)a
Lysine analogue (ε-aminocaproic acid/tranexamic acid)
No lysine analogue (ε-aminocaproic acid/tranexamic acid)
Pooled risk estimate
Henry (2007)(66) risk estimate
Exposure to allogeneic blood transfusion
n/N (%) RR (95%CI) McIlroy (2009)(70)
1 trial (N=79)b 8/40 (20.0) 8/39 (20.5) With aspirin 0.97 (0.32, 2.90) P=0.95 (Phet=NA)
With or without aspirin 0.69 (0.60, 0.79) P<0.001 (Phet=0.03)
Postoperative chest tube blood loss (mL)
Mean ± SD WMD: (95%CI) McIlroy (2009)(70)
3 trials (N=259) NR NR With aspirin –189 (–287, –91) P<0.001 (Phet=0.05)
With or without aspirin –263 (–319, –207) P<0.001 (Phet=0.01)
Surgical re-exploration
n/N (%) OR (95%CI) RR (95%CI) McIlroy (2009)(70)
1 trialb (N=79) 0/40 (0) 1/39 (2.6) With aspirin 0.30 (0.01, 8.02) P=NR (Phet=NA)
With or without aspirin 0.65 (0.39, 1.08) P=0.097 (Phet=0.90)

Technical report on perioperative patient blood management – Volume 1b July 2011 158
Author (year) No. trials (N) No. of trials included in analysis (N)a
Lysine analogue (ε-aminocaproic acid/tranexamic acid)
No lysine analogue (ε-aminocaproic acid/tranexamic acid)
Pooled risk estimate
Henry (2007)(66) risk estimate
Thrombotic complications
n/N (%) OR (95%CI) RR (95%CI) McIlroy (2009)(70)
1 trialb (N=79) 0/40 (0) 1/39 (2.6) With aspirin 0.32 (0.01, 8.02) P=0.49 (Phet=NA)
With or without aspirin MI 0.91 (0.44, 1.88) P=0.79 (Phet=0.91) Stroke 1.52 (0.52, 4.41) P=0.44 (Phet=0.78) DVT 0.37 (0.04, 3.47) P=0.38 (Phet=0.95) PE 0.33 (0.04, 3.15) P=0.34 (Phet=0.98)
Note: ‘No lysine analogue’ group denotes placebo or no treatment. CI, confidence interval; DVT, deep vein thrombosis; het, heterogeneity; MI, myocardial infarction; NA, not applicable; NR, not reported; OR, odds ratio; PE, pulmonary embolism; RR, risk ratio; SD, standard deviation; WMD, weighted mean difference. a Where individual studies had either 100% events in both treatment arms, no events in both treatment arms or no SD is reported, a risk estimate for that individual study could not be calculated, and it could not be included in the pooled analysis. Where this has occurred, the actual number of studies and subjects included in the analysis will be stated. b Tranexamic acid only.
The review by Kagoma (2009)(74) examined the use of antifibrinolytic therapy (aprotinin, tranexamic acid and ε-aminocaproic acid) in adult patients undergoing total hip and total knee replacement. While the primary analysis compared the antifibrinolytic group as a whole to placebo, separate results for aprotinin, tranexamic acid and ε-aminocaproic acid are available for some outcomes. Details of the included studies for each analysis could be determined from the forest plots.
Only one additional study not included in Henry (2007) was included in the Kagoma (2009) review. The analysis of incidence of transfusion was similar between the two reviews (RR 0.47; 95%CI: 0.40, 0.55 and 0.44; 95%CI: 0.33, 0.60 in the Kagoma and Henry reviews, respectively). The results for total blood loss were also similar for the Kagoma (2009) and Henry (2007) reviews, with the mean difference in total blood loss being –393 mL and –440 mL, respectively. It is difficult to easily compare the results of the Kagoma and Henry trials with regards to VTE complications as the Kagoma trial used a different risk measure (risk difference) and used a combined VTE category rather than separate categories for

Technical report on perioperative patient blood management – Volume 1b July 2011 159
different VTE events. However, the results of both reviews show no significant difference in VTE between aprotinin therapy and no therapy, although it is likely that both reviews are underpowered to detect these rare events.
Table 8.27 Results for supportive Level I evidence: tranexamic acid versus no tranexamic acid in adult hip and knee replacement surgery patients (Kagoma, 2009)
Treatment
No. trials (N) No. of trials included in analysis (N)a
Tranexamic acid No tranexamic acid
Pooled risk estimate
Henry (2007)(66) pooled risk estimate
Exposure to allogeneic blood transfusion
n/N (%) RR (95%CI) Tranexamic acid 18 trials (N=943) NR NR 0.47 (0.40, 0.55)
P=NR Phet=NR
Orthopaedic surgery 0.44 (0.33, 0.60) P<0.001 (Phet<0.001)
Total blood loss (mL)
Mean ± SD (N) WMD: (95%CI) Tranexamic acid 15 trials (N=778) NR NR –393 (–442, –
345) P=NR Phet=NR
Orthopaedic surgery –440 (–591, –288) P<0.001 (Phet<0.001)
VTE complications
n/N (%) RD (95%CI) RR (95%CI) Tranexamic acid 19 trials (N=945)
10 trials (N=459) NR NR –0.01 (–0.04,
0.02) P=NR Phet=NR
Any surgeryb DVT 0.77 (0.37, 1.61) P=0.49 (Phet=0.81) PE 0.55 (0.17, 1.76) P=0.31 (Phet=0.93)
CI, confidence interval; DVT, deep vein thrombosis; het, heterogeneity; NR, not reported; PE, pulmonary embolism; RD, risk difference; RR, risk ratio; SD, standard deviation; VTE, venous thromboembolism. a Where individual studies had either 100% events in both treatment arms, no events in both treatment arms or no SD is reported, a risk estimate for that individual study could not be calculated, and it could not be included in the pooled analysis. Where this has occurred, the actual number of studies and subjects included in the analysis will be stated. b Mostly includes studies examining orthopaedic surgery.
Finally, a review by Kongnyuy (2009)(94) examined the use of tranexamic in myomectomy. The review found only one relevant RCT (N=100), which was considered to be of good

Technical report on perioperative patient blood management – Volume 1b July 2011 160
methodological quality. Due to the restricted surgical population assessed in this review, it is not possible to directly compare its results with those of the Henry (2007) review. However, the single RCT included in the review showed that in myomectomy, tranexamic acid therapy was associated with a significant decrease in blood loss compared with no therapy (MD: –243 mL; 95%CI: –460, –26), while there was an increased (although not statistically significant) risk in the incidence of transfusion between the two treatment arms (odds ratio 1.71; 95%CI: 0.68, 4.30).
Topical tranexamic acid One systematic review assessed the use of topical tranexamic acid, specifically in adult patients undergoing on-pump cardiac surgery(67). The results of this review are summarised in Table 8.28. The results suggest that while topical tranexamic acid may not significantly reduce the need for blood transfusion during on-pump cardiac surgery (RR 0.98; 95%CI: 0.75, 1.27), it is associated with significant reductions in the volume of blood required for transfusion (WMD: –1.58; 95%CI: –2.26, –0.90) and the amount of blood loss following surgery (–250 mL; 95%CI: –465, –35)(67). Mortality and morbidity were not assessed in this review.
Table 8.28 Results for Level I evidence: topical tranexamic acid versus no tranexamic acid in adult on-pump cardiac surgery (Abrishami, 2009)
Author (year) No. trials (N) Tranexamic acid No tranexamic acid
Pooled risk estimate
Exposure to allogeneic RBC blood transfusion n/N (%) RR (95%CI) Abrishami (2009)(67) 2 trials (N=233) 54/117 (46.2) 55/116 (47.4) 0.98 (0.75, 1.27)
P=0.88 (Phet=0.69) Units of allogeneic RBC transfusion Mean ± SD WMD: (95%CI) Abrishami (2009)(67) 3 trials (N=229) NR NR –1.58 (–2.26, –0.90)
P=<0.001 (Phet=0.29) Blood loss (mL) Mean ± SD WMD: (95%CI) Abrishami (2009)(67) 4 trials (N=269) NR NR –250 (–465, –35)
P=0.02 (Phet<0.001) Note: ‘No tranexamic acid’ group denotes placebo or no treatment. CI, confidence interval; het, heterogeneity; NR, not reported; RBC, red blood cell; RR, risk ratio; SD, standard deviation; WMD, weighted mean difference.
Oral tranexamic acid One Cochrane review, considered to be of good methodological quality, assessed the use of tranexamic acid (as well as a number of other interventions) specifically in adult patients undergoing liver resection(69). Only one study assessing tranexamic acid was included in this review, and in this study tranexamic acid was taken orally. The results of this review are summarised in Table 8.29. The results, based on only one study, suggest that oral tranexamic acid is effective at reducing the requirement for transfusion (RR 0.03; 95%CI: 0.00, 0.46),

Technical report on perioperative patient blood management – Volume 1b July 2011 161
volume of blood transfusion (MD: –260 mL; 95%CI: –435, –85) and volume of blood loss (MD: –300 mL; 95%CI: –502, –98). No deaths were reported in either treatment arm.
Table 8.29 Results for Level I evidence: oral tranexamic acid versus no tranexamic acid in adult liver resection (Gurusamy, 2009)
Author (year) No. trials (N) Tranexamic acid No tranexamic acid
Pooled risk estimate
Exposure to allogeneic RBC blood transfusion
n/N (%) RR (95%CI) Gurusamy (2009)(69) 1 trial (N=214) 0/108 (0) 17/106 (16.0) 0.03 (0.00, 0.46)
P=0.012 (Phet=NA)
Transection blood loss (mL)
Mean ± SD MD: (95%CI) Gurusamy (2009)(69) 1 trial (N=214) 190 ± 653 450 ± 653 –260 (–435, –85)
P=0.0036 (Phet=NA)
Operative blood loss (mL)
Mean ± SD MD: (95%CI) Gurusamy (2009)(69) 1 trial (N=214) 300 ± 754 600 ± 754 –300 (–502, –98)
P=0.0036 (Phet=NA)
Mortality
n/N (%) MD: (95%CI) Gurusamy (2009)(69) 1 trial (N=214) 0/109 (0) 0/108 (0) Not estimable
Note: ‘No tranexamic acid’ group denotes placebo or no treatment. CI, confidence interval; het, heterogeneity; MD, mean difference; NA, not applicable; RBC, red blood cell; RR, risk ratio; SD, standard deviation.
Paediatric population Intravenous tranexamic acid The results of the systematic review of the use of tranexamic acid in children undergoing cardiac or scoliosis surgery by Schouten (2009)(68) are summarised in Table 8.30. The results show a significant reduction in the volume of blood transfusion with both packed RBCs (WMD: –7 mL/kg; 95%CI: –10, –5) and plasma (WMD: –7 mL/kg; 95%CI: –9, –4) for cardiac surgery and a significant reduction in transfusion with packed RBCs (WMD: –349 mL; 95%CI: –620, –77), but not plasma (WMD: –15 mL; 95%CI: –127, 98), for scoliosis surgery. Significant reductions in blood loss were also seen for both cardiac surgery (WMD: –11 mL/kg; 95%CI: –13, –8) and scoliosis surgery (–682 mL; 95%CI: –1149, –214).
Schouten et al. carried out a meta-regression analysis of the cardiac surgery studies to assess the effect of age and weight on blood loss. They found no significant relationship between

Technical report on perioperative patient blood management – Volume 1b July 2011 162
age or weight with respect to the difference in blood loss between patients on tranexamic acid versus no tranexamic acid.
Table 8.30 Results for Level I evidence: IV tranexamic acid versus no tranexamic acid in paediatric cardiac and scoliosis surgery patients (Schouten, 2009)
Author (year) No. trials (N) Tranexamic acid No tranexamic acid
Pooled risk estimate
Volume of allogeneic blood transfusion (packed red cells)
Mean ± SD WMD: (95%CI) Schouten 2009(68) NR (N=460) NR NR Cardiac surgery
–7 mL/kg (–10, –5) P=NR (I2=6%)
Schouten 2009(68) 2 trials (N=84) NR NR Scoliosis surgery –349 mL (–620, –77) P=NR (I2=0%)
Volume of allogeneic blood transfusion (plasma)
Mean ± SD WMD: (95%CI) Schouten 2009(68) NR (N=419) NR NR Cardiac surgery
–7 mL/kg (–9, –4) P=NR (I2=0%)
Schouten 2009(68) 2 trials (N=84) NR NR Scoliosis surgery –15 mL (–127, 98) P=NR (I2=24%)
Volume of allogeneic blood transfusion (thrombo)
Mean ± SD WMD: (95%CI) Schouten 2009(68) NR (N=370) NR NR Cardiac surgery
–5 mL/kg (–7, –3) P=NR (I2=0%)
Volume of blood loss
Mean ± SD WMD: (95%CI) Schouten 2009(68) NR (N=542) NR NR Cardiac surgery
–11 mL/kg (–13, –8) P=NR (I2=31%)
Schouten 2009(68) 2 trials (N=84) NR NR Scoliosis surgery –682 mL (–1149, –214) P=NR (I2=24%)
Note: ‘No tranexamic acid’ group denotes placebo or no treatment. CI, confidence interval; NR, not reported; SD, standard deviation; WMD, weighted mean difference. a Volume of blood transfused and blood loss reported as mL/kg for cardiac surgery and mL for scoliosis surgery.
One Cochrane review, which was considered to be of good methodological quality and specifically examined a paediatric population, had a more up-to-date literature search than the Schouten review. This review, by Tzortzopoulou (2008)(73), examined the use of

Technical report on perioperative patient blood management – Volume 1b July 2011 163
tranexamic acid in children undergoing scoliosis surgery. The Tzortzopoulou review included two different studies to those included in the Schouten review but similarly concluded that tranexamic acid significantly reduced the volume of blood transfused (WMD: –395 mL; 95%CI: –688, –103) and volume of blood loss (WMD: –682 mL; 95%CI: –1149, –214). A summary of the results of this additional study is shown in Table 8.31.
Table 8.31 Results for Level I evidence: tranexamic acid versus no tranexamic acid – comparison between Schouten review and the Tzortzopoulou review
Updated review
Population Surgery
Recent review results Risk estimate (95%CI)
Schouten (2009)(68) Risk estimate (95%CI)
Tzortzopoulou (2008)(73)
Paediatric Spine
Includes 2 trials (both not included in Schouten (2009)(68))
Incidence transfusion Blood transfused (mL) Blood loss (mL)
RR 0.84 (0.56, 1.27) WMD: –395.14 (–687.55, –102.73) WMD: –681.81 (–1149.12, –214.49)
No comparable data WMD: –349 mL (–620, –77) – RBC WMD: –682 mL (–1149, –214)
CI, confidence interval; RBC, red blood cells; RR, relative risk; WMD, weighted mean difference.
Level II evidence Due to the up-to-date Level I evidence available for this intervention for the paediatric population, a search for Level II evidence in the paediatric population was not conducted. However, as the literature search for the Henry (2007) review (which assessed the use of tranexamic acid in adults) was only updated to June 2006, a search was conducted for Level II studies published after this date. This search identified 16 additional Level II studies relevant to this module. An additional search for evidence specifically relating to quality of life was also conducted. This search found no relevant Level II evidence.
The characteristics and quality of each of the additional included RCTs was assessed and is presented in Table 8.32. Two of the 16 identified studies assessed the use of topical tranexamic acid; the remaining studies assessed IV tranexamic acid. All studies compared tranexamic acid with placebo.
Table 8.32 Characteristics of Level II evidence for tranexamic acid Author (Year) Study quality
Study type Location
Population Surgery
Treatment No. of included subjects
Relevant outcomes
Alvarez (2008)(101) Fair
DB RCT Spain
Adult Total knee arthroplasty
TXA (IV) Placebo (IV)
46 49
Transfusion incidence Transfusion volume Blood loss Morbidity Haemoglobin
Athanasiadis (2007)(102) Fair
DB RCT Australia
Adult Endoscopic sinus surgery
TXA (topical) ACA (topical) Placebo (topical)
20 10 30a
Blood loss (graded)
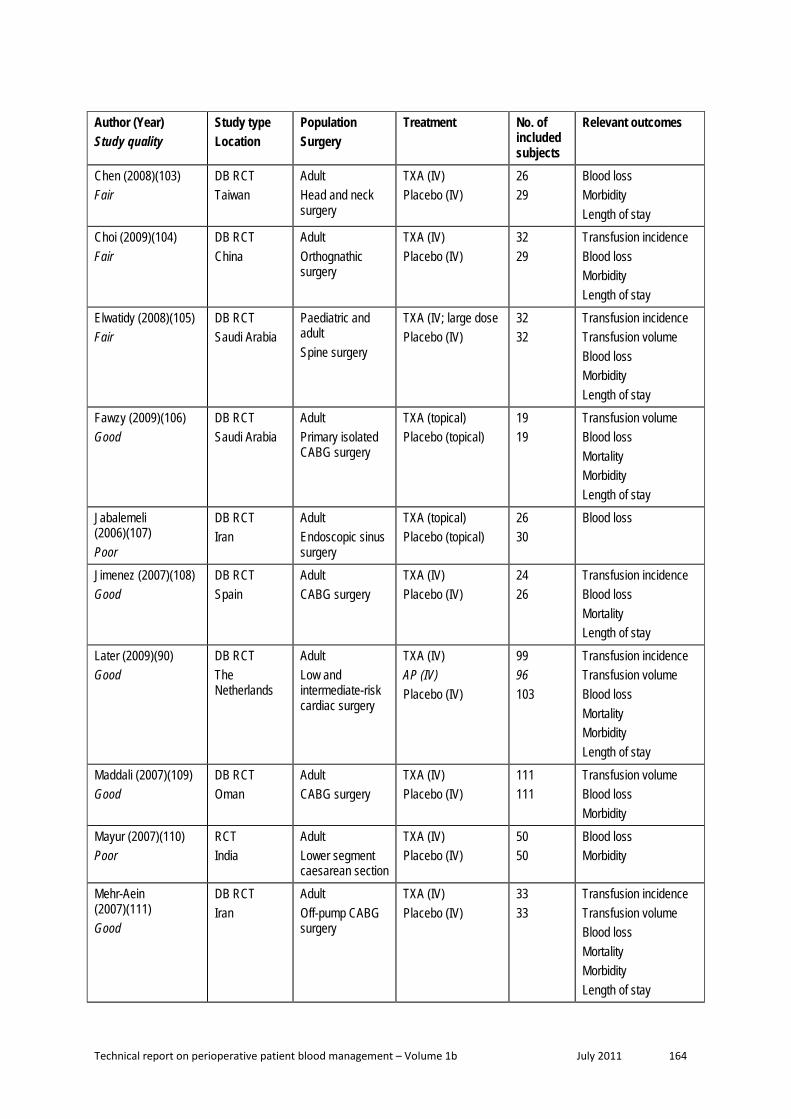
Technical report on perioperative patient blood management – Volume 1b July 2011 164
Author (Year) Study quality
Study type Location
Population Surgery
Treatment No. of included subjects
Relevant outcomes
Chen (2008)(103) Fair
DB RCT Taiwan
Adult Head and neck surgery
TXA (IV) Placebo (IV)
26 29
Blood loss Morbidity Length of stay
Choi (2009)(104) Fair
DB RCT China
Adult Orthognathic surgery
TXA (IV) Placebo (IV)
32 29
Transfusion incidence Blood loss Morbidity Length of stay
Elwatidy (2008)(105) Fair
DB RCT Saudi Arabia
Paediatric and adult Spine surgery
TXA (IV; large dose Placebo (IV)
32 32
Transfusion incidence Transfusion volume Blood loss Morbidity Length of stay
Fawzy (2009)(106) Good
DB RCT Saudi Arabia
Adult Primary isolated CABG surgery
TXA (topical) Placebo (topical)
19 19
Transfusion volume Blood loss Mortality Morbidity Length of stay
Jabalemeli (2006)(107) Poor
DB RCT Iran
Adult Endoscopic sinus surgery
TXA (topical) Placebo (topical)
26 30
Blood loss
Jimenez (2007)(108) Good
DB RCT Spain
Adult CABG surgery
TXA (IV) Placebo (IV)
24 26
Transfusion incidence Blood loss Mortality Length of stay
Later (2009)(90) Good
DB RCT The Netherlands
Adult Low and intermediate-risk cardiac surgery
TXA (IV) AP (IV) Placebo (IV)
99 96 103
Transfusion incidence Transfusion volume Blood loss Mortality Morbidity Length of stay
Maddali (2007)(109) Good
DB RCT Oman
Adult CABG surgery
TXA (IV) Placebo (IV)
111 111
Transfusion volume Blood loss Morbidity
Mayur (2007)(110) Poor
RCT India
Adult Lower segment caesarean section
TXA (IV) Placebo (IV)
50 50
Blood loss Morbidity
Mehr-Aein (2007)(111) Good
DB RCT Iran
Adult Off-pump CABG surgery
TXA (IV) Placebo (IV)
33 33
Transfusion incidence Transfusion volume Blood loss Mortality Morbidity Length of stay

Technical report on perioperative patient blood management – Volume 1b July 2011 165
Author (Year) Study quality
Study type Location
Population Surgery
Treatment No. of included subjects
Relevant outcomes
Sadeghi (2007)(112) Good
DB RCT Iran
Adult Hip fracture surgery
TXA (IV) Placebo (IV)
32 35
Transfusion incidence Transfusion volume Blood loss Mortality Length of stay
Sekhavat (2009)(113) Poor
OL RCT Iran
Adult Caesarean section
TXA (IV) Placebo (IV)
45 45
Blood loss Morbidity
Taghaddomi (2009)(114) Fair
DB RCT Iran
Adult CABG surgery
TXA (IV) Placebo (IV)
50 50
Transfusion incidence Transfusion volume Blood loss Morbidity
Wong (2008)(115) Good
DB RCT Canada
Adult Spinal fusion surgery
TXA (IV) Placebo (IV)
73 74
Transfusion incidence Transfusion volume Blood loss Morbidity Length of stay
ACA, ε-aminocaproic acid; CABG, coronary artery bypass graft; DB, double-blind; IV, intravenous; OL, open label; RCT, randomised controlled trial; TXA, tranexamic acid.
Adult population Intravenous tranexamic acid The results of the 16 studies that examined the use of IV tranexamic acid are summarised below. Only outcomes similar to those already included for the Level I evidence are shown here. The effect of tranexamic acid on each outcome will be discussed separately.
Transfusion incidence
In the majority of studies and analyses, the use of tranexamic acid compared with placebo did not result in a significant difference in the proportion of subjects requiring perioperative blood transfusion (Table 8.33). This result was similar for all surgery types including cardiac surgery, orthopaedic surgery and other surgery (orthognathic surgery). However, in all cases, the incidence of transfusion in the tranexamic treatment arm was similar or lower than the incidence in the placebo arm. A statistically significantly lower incidence of transfusion was seen in some analyses (P<0.05), as was a non-statistically significant trend (P<0.1). A higher incidence of transfusion was never seen for tranexamic acid compared with placebo.
Table 8.33 Results for Level II evidence for transfusion incidence: intravenous tranexamic acid versus placebo in adults
Author (year) Specific outcome Tranexamic acid
Placebo/no treatment
Statistical significance
n/N (%) P-value Cardiac surgery

Technical report on perioperative patient blood management – Volume 1b July 2011 166
Author (year) Specific outcome Tranexamic acid
Placebo/no treatment
Statistical significance
Jimenez (2007)(108)
Incidence of RBC and plasma transfusion in first 4 hours
1/24 (4.2) 2/26 (7.6) 0.39
Incidence of RBC and plasma transfusion until chest tube withdrawal
9/24 (37.5) 19/26 (73.1) 0.01
Incidence of plasma transfusion until chest tube withdrawal
1/24 (4.2) 8/26 (30.8) 0.02
Later (2009)(90) PRBC transfusion 57/99 (57.6) 73/103 (70.9) 0.057 (post-hoc) Blood products transfusion 69/99 (69.7) 81/103 (78.6) 0.15 (post-hoc)
Mehr-Aein (2007)(111)
Whole blood or pRBC transfused 5/33 (15.2) 8/33 (24.2) 0.07 FFP transfused 0/33 (0) 6/33 (18.2) 0.05 Platelets transfused 0/33 (0) 0/33 (0) NA Total patients transfused 5/33 (15.2) 12/33 (36.4) 0.09 (post-hoc)
Taghaddomi (2009)(114)
Patients transfused with pRBCs (intraoperative)
0/50 (0) 3/50 (6.0) 0.24
Patients transfused with pRBCs (0–4 hrs) 0/50 (0) 15/50 (30.0) <0.001 Patients transfused with pRBCs (4–24 hrs)
8/50 (16.0) 9/50 (18.0) 1.00
Patients transfused with FFP (0–4 hrs) 2/50 (4.0) 2/50 (4.0) 1.00 Patients transfused with FFP (4–24 hrs) 0/50 (0) 0/50 (0) NA Total number of transfused patients 8/50 (16.0) 27/50 (54.0) <0.001
Orthopaedic surgery (includes hip, knee and spine surgery) Alvarez (2008)(101) Allogeneic and autologous blood 1/46 (2.2) 6/49 (12.2) 0.11 (post-hoc)
Recovered blood 2/46 (4.3) 36/49 (73.5) <0.001 (post-hoc) Elwatidy (2008)(105)
Transfusion incidence 4/32 (12.5) 12/32 (37.5) 0.021
Sadeghi (2007)(112)
Whole blood or pRBC transfused 12/32 (37.5) 20/35 (57.1) 0.04 FFP transfused 1/32 (3.1) 0/35 (0) NS Platelets transfused 0/33 (0) 0/33 (0) NA Total patients transfused 12/32 (37.5) 20/35 (57.1) 0.04
Wong (2008)(115) Patients transfused with pRBCs (perioperative)
23/73 (31) 30/74 (40) 0.25
Patients transfused with AWB (perioperative)
24/73 (32) 27/74 (36) 0.65
Patients transfused with cell-saver blood (perioperative)
33/73 (45) 47/74 (63) 0.026
Patients transfused with FFP (perioperative)
5/73 (7) 9/74 (12) 0.27
Patients transfused with platelets (perioperative)
2/73 (3) 2/74 (3) 0.99
Patients transfused with pRBCs (intraoperative)
14/73 (19) 17/74 (23) 0.57
Patients transfused with AWB (intraoperative)
18/73 (25) 21/74 (28) 0.61
Patients transfused with cell-saver blood (intraoperative)
33/73 (45) 46/74 (62) 0.039
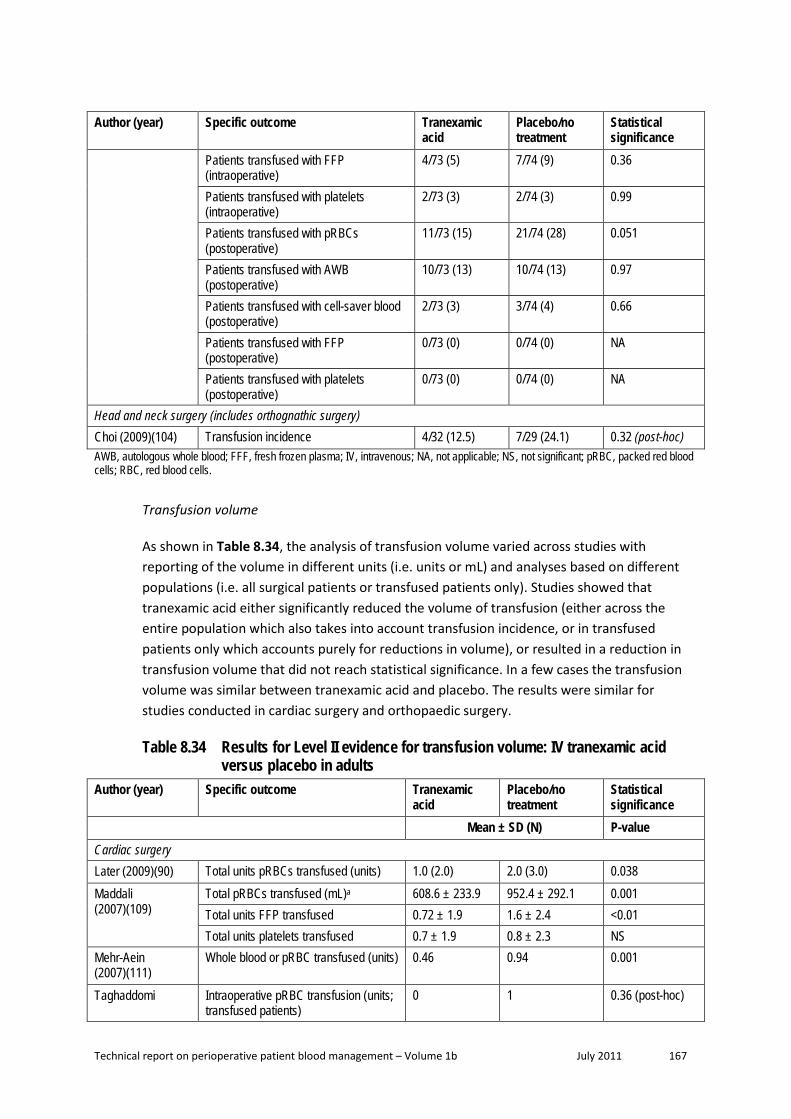
Technical report on perioperative patient blood management – Volume 1b July 2011 167
Author (year) Specific outcome Tranexamic acid
Placebo/no treatment
Statistical significance
Patients transfused with FFP (intraoperative)
4/73 (5) 7/74 (9) 0.36
Patients transfused with platelets (intraoperative)
2/73 (3) 2/74 (3) 0.99
Patients transfused with pRBCs (postoperative)
11/73 (15) 21/74 (28) 0.051
Patients transfused with AWB (postoperative)
10/73 (13) 10/74 (13) 0.97
Patients transfused with cell-saver blood (postoperative)
2/73 (3) 3/74 (4) 0.66
Patients transfused with FFP (postoperative)
0/73 (0) 0/74 (0) NA
Patients transfused with platelets (postoperative)
0/73 (0) 0/74 (0) NA
Head and neck surgery (includes orthognathic surgery) Choi (2009)(104) Transfusion incidence 4/32 (12.5) 7/29 (24.1) 0.32 (post-hoc) AWB, autologous whole blood; FFF, fresh frozen plasma; IV, intravenous; NA, not applicable; NS, not significant; pRBC, packed red blood cells; RBC, red blood cells.
Transfusion volume
As shown in Table 8.34, the analysis of transfusion volume varied across studies with reporting of the volume in different units (i.e. units or mL) and analyses based on different populations (i.e. all surgical patients or transfused patients only). Studies showed that tranexamic acid either significantly reduced the volume of transfusion (either across the entire population which also takes into account transfusion incidence, or in transfused patients only which accounts purely for reductions in volume), or resulted in a reduction in transfusion volume that did not reach statistical significance. In a few cases the transfusion volume was similar between tranexamic acid and placebo. The results were similar for studies conducted in cardiac surgery and orthopaedic surgery.
Table 8.34 Results for Level II evidence for transfusion volume: IV tranexamic acid versus placebo in adults
Author (year) Specific outcome Tranexamic acid
Placebo/no treatment
Statistical significance
Mean ± SD (N) P-value Cardiac surgery Later (2009)(90) Total units pRBCs transfused (units) 1.0 (2.0) 2.0 (3.0) 0.038 Maddali (2007)(109)
Total pRBCs transfused (mL)a 608.6 ± 233.9 952.4 ± 292.1 0.001 Total units FFP transfused 0.72 ± 1.9 1.6 ± 2.4 <0.01 Total units platelets transfused 0.7 ± 1.9 0.8 ± 2.3 NS
Mehr-Aein (2007)(111)
Whole blood or pRBC transfused (units) 0.46 0.94 0.001
Taghaddomi Intraoperative pRBC transfusion (units; transfused patients)
0 1 0.36 (post-hoc)

Technical report on perioperative patient blood management – Volume 1b July 2011 168
Author (year) Specific outcome Tranexamic acid
Placebo/no treatment
Statistical significance
(2009)(114) Postoperative pRBC transfusion 0–4 hrs (units; transfused patients)
0 1.3 <0.001 (post-hoc)
Postoperative pRBC transfusion 4–24 hrs (units; transfused patients)
1 1 0.5 (post-hoc)
Postoperative FFP transfusion 0–4 hrs (units; transfused patients)
3 2.5 0.8 (post-hoc)
Postoperative FFP transfusion 4–24 hrs (units; transfused patients)
0 0 NA
Total transfusion (units; transfused patients)
1 1.1 NA
Orthopaedic surgery (includes hip, knee and spine surgery) Elwatidy (2008)(105)
Amount of transfusion (mL) 93.75 ± 267.53 531.25 ± 1275.94 0.008 Units transfused (transfused patients only)
1.5 (4) 2.8a (12) NA
Sadeghi (2007)(112)
Whole blood or pRBC transfused (units) 1.25 1.95 0.001
Wong (2008)(115) Patients transfused with pRBCs (perioperative; mL)
266 ± 541 406 ± 649 0.16
Patients transfused with AWB (perioperative; mL)
222 ± 343 315 ± 672 0.30
Patients transfused with cell-saver blood (perioperative; mL)
218 ± 347 334 ± 450 0.083
Patients transfused with pRBCs (intraoperative; mL)
169 ± 486 208 ± 436 0.61
Patients transfused with AWB (intraoperative; mL)
150 ± 278 249 ± 656 0.24
Patients transfused with cell-saver blood (intraoperative; mL)
210 ± 343 323 ± 443 0.086
Patients transfused with pRBCs (postoperative; mL)
97 ± 239 198 ± 384 0.057
Patients transfused with AWB (postoperative; mL)
72 ± 200 66 ± 198.2 0.85
Patients transfused with cell-saver blood (postoperative; mL)
8 ± 49 11 ± 64 0.73
AWB, autologous whole blood; FFF, fresh frozen plasma; IV, intravenous; NA, not applicable; NS, not significant; pRBC, packed red blood cells; RBC, red blood cells; SD, standard deviation.
Blood loss
In the majority of studies and analyses, blood loss was significant reduced for patients on tranexamic acid compared with placebo, as shown in Table 8.35. The reduction in blood loss generally occurred during the early postoperative period. The results were consistent across different surgical specialties including cardiac, orthopaedic, head and neck, and obstetric surgery.

Technical report on perioperative patient blood management – Volume 1b July 2011 169
Table 8.35 Results for Level II evidence for blood loss: IV tranexamic acid versus placebo in adults
Author (year) Specific outcome Tranexamic acid Placebo/no treatment
Statistical significance
Mean ± SD (N) P-value Cardiac surgery Jimenez (2007)(108)
24-hour blood loss (mL) 464 (308, 620)b 1037 (771, 1303)b <0.01 Total blood loss (mL) 835 (407, 1263) 1466 (1116, 1818) <0.01
Later (2008)(90) Total mediastinal chest tube loss (mL) 760 (IQR 540) 860 (IQR 740) 0.034 Maddali (2007)(109)
Total drainage (mL) 633.0 ± 183.2 980.9 ± 267.2 0.001
Mehr-Aein (2007)(111)
Postoperative blood loss 0–2 hour (mL) 90 ± 25 180 ± 37 <0.001 Postoperative blood loss 2–6 hour (mL) 190 ± 41 290 ± 78 0.001 Total postoperative blood loss (mL) 320 ± 38 480 ± 75 0.001
Taghaddomi (2009)(114)
Intraoperative bleeding (mL) 467 ± 170 531 ± 164 0.62 Postoperative bleeding (0–4 hrs; mL) 87 ± 62 210 ± 195 0.005 Postoperative bleeding (4–24 hrs; mL) 462 ± 118 570 ± 184 0.07 Total bleeding within 24 hrs (mL) 471 ± 182 844 ± 363 <0.001
Orthopaedic surgery (includes hip, knee and spine surgery) Alvarez (2008)(101) Chest tube blood loss at 0–6 hour
postoperative (mL) 159 ± 110 534 ± 351 <0.001
Chest tube blood loss at 6 hour - 4 day postoperative (mL)
132 ± 151 132 ± 150 0.98
Total chest tube blood loss (mL) 170 ± 109 551 ± 352 <0.001 Elwatidy (2008)(105)
Intraoperative blood loss (mL) 311.25 ± 412.49 584.69 ± 797.30 0.03 Wound drain blood loss (mL) 97.94 ± 136.28 215.31 ± 276.04 0.004 Total blood loss (mL) 406.13 ± 495.31 800.00 ± 1034.25 0.007
Sadeghi (2007)(112)
Perioperative blood loss (mL) 652 ± 228 1108 ± 372 0.003 Postoperative blood loss 1 hour (mL) 111 ± 76 139 ± 100 0.39 Postoperative blood loss 2 hour (mL) 192 ± 78 246 ± 113 0.28 Postoperative blood loss 5 hour (mL) 255 ± 59 323 ± 54 0.31 Postoperative blood loss 12 hour (mL) 296 ± 40 375 ± 30 0.20 Postoperative blood loss 24 hour (mL) 300 ± 54 390 ± 65 0.11 Total blood loss (mL) 960 ± 284 1484 ± 374 0.001
Wong (2008)(115) Estimated blood loss (perioperative; mL)
1592 ± 1315 2138 ± 1607 0.026
Calculated blood loss (perioperative; mL)
3079 ± 2558 4363 ± 3030 0.017
Calculated RBC loss (perioperative; mL)
1078 ± 895 1527 ± 1060 0.017
Estimated blood loss (intraoperative; mL)
1203 ± 1060 1600 ± 1301 0.044
Estimated blood loss (postoperative; mL)
536 ± 471 737 ± 524 0.039
Head and neck surgery (includes orthognathic surgery)

Technical report on perioperative patient blood management – Volume 1b July 2011 170
Author (year) Specific outcome Tranexamic acid Placebo/no treatment
Statistical significance
Chen (2008)(103) Perioperative bleeding (mL) 86.5 ± 128.5 115.5 ± 120.3 0.392 Drainage amount (mL) 49.7 ± 32.6 88.8 ± 89.9 0.041
Choi (2009)(104) Intraoperative blood loss during anterior mandibular surgery (mL)
277.0 ± 211.7 (21)
415.9 ± 314.2 (23)
NS
Intraoperative blood loss during maxillary surgery (mL)
428.0 ± 233.3 (32)
643.8 ± 430.0 (29)
<0.05
Intraoperative blood loss during ramus surgery (mL)
287.0 ± 216.3 (24)
329.3 ± 233.4 (17)
NS
Total intraoperative blood loss (mL) 878.6 ± 577.7 (32)
1257 ± 817.8 (29) <0.05
Gynaecologic/obstetric surgery Mayur (2007)(110) Placental delivery to end of surgery
(mL) 299.21 ± 31.44 339.76 ± 28.86 0.056
End of surgery to 2 hours post partum (mL)
75.71 ± 20.02 133.03 ± 14.68 0.001
Placental delivery to 2 hours post-partum (mL)
374.92 ± 51.46 472.79 ± 43.54 0.003
Sekhavat (2009)(113)
Blood loss up to 2 hours postoperative (mL)
28.0 ± 5.5 37.1 ± 9.0 <0.001
IV, intravenous; NS, not significant; SD, standard deviation.
Mortality
Four studies provided data on mortality (three in cardiac surgery(90;108;111) and one in orthopaedic surgery(112); Table 8.36). Two studies in cardiac surgery showed no deaths following the use of tranexamic acid or placebo(108;111). One study showed one death following cardiac surgery in each treatment arm (1% vs 1%)(90) and the remaining study showed one death in the placebo arm following orthopaedic surgery (0% vs 3%)(112).
Table 8.36 Results for Level II evidence for mortality: intravenous tranexamic acid versus placebo in adults
Author (year) Specific outcome Tranexamic acid Placebo/no treatment
Statistical significance
n/N (%) P-value Cardiac surgery Jimenez (2007)(108)
In-hospital mortality 0/24 (0) 0/26 (0) NA
Later (2009)(90) In-hospital mortality 1/99 (1.0) 1/103 (1.0) 1.00 Mehr-Aein (2007)(111)
Mortality 0/33 0/33 NA
Orthopaedic surgery (includes hip, knee and spine surgery) Sadeghi (2007)(112)
Mortality 0/32 (0) 1/35 (2.9) 1.00 (post-hoc)
IV, intravenous; NA, not applicable.

Technical report on perioperative patient blood management – Volume 1b July 2011 171
Re-operation
As shown in Table 8.37, three studies provided data on reoperation, all of which were conducted in patients undergoing cardiac surgery(90;109;111). There was no significant difference in reoperation rates between tranexamic acid and placebo treatment arms. Re-operation due to bleeding occurred in approximately 0–4% across the three studies.
Table 8.37 Results for Level II evidence for reoperation: IV tranexamic acid versus placebo in adults
Author (year) Specific outcome Tranexamic acid
Placebo/no treatment
Statistical significance
n/N (%) P-value Cardiac surgery Later (2009)(90) Re-operation for any reason 14/99 (14.1) 14/103 (13.6) 1.00
Re-operation due to surgical bleeding 3/99 (3.0) 3/103 (2.9) 1.00 Re-operation due to non-surgical bleeding
2/99 (2.0) 4/103 (3.9) 0.68
Maddali (2007)(109)
Re-operation due to bleeding 3/111 (2.7) 3/111 (2.7) NS
Mehr-Aein (2007)(111)
Surgical re-exploration for bleeding 0/33 (0) 1/33 (3.0) >0.05
IV, intravenous; NS, not significant.
Thromboembolic events
A summary of the results for thromboembolic events including MI, stroke and other thromboses is presented in Table 8.38. In four studies that assessed MI (three following cardiac surgery(90;111;114) and one following orthopaedic surgery(115)), only one MI occurred in a patient taking tranexamic acid(115). However, this was an asymptomatic event, diagnosed due to an elevation in cardiac enzymes.
The risk of stroke was assessed in only one RCT(90). This study, in patients undergoing low or intermediate-risk cardiac surgery, showed no difference in stoke between patients on tranexamic acid or placebo (1% vs 1%).
No increased risk of thrombosis was seen following cardiac, orthopaedic, head and neck or obstetric surgery in any of the eight included studies. Only 1 case of thrombosis (1.4%) was seen in the placebo arm of an orthopaedic surgery trial(115).
Table 8.38 Results for Level II evidence for thromboembolic events: intravenous tranexamic acid versus placebo in adults
Author (year) Specific outcome Tranexamic acid
Placebo/no treatment
Statistical significance
n/N (%) P-value Cardiac surgery Later (2009)(90) Perioperative myocardial infarction 0/99 (0) 8/103 (7.8) 0.007
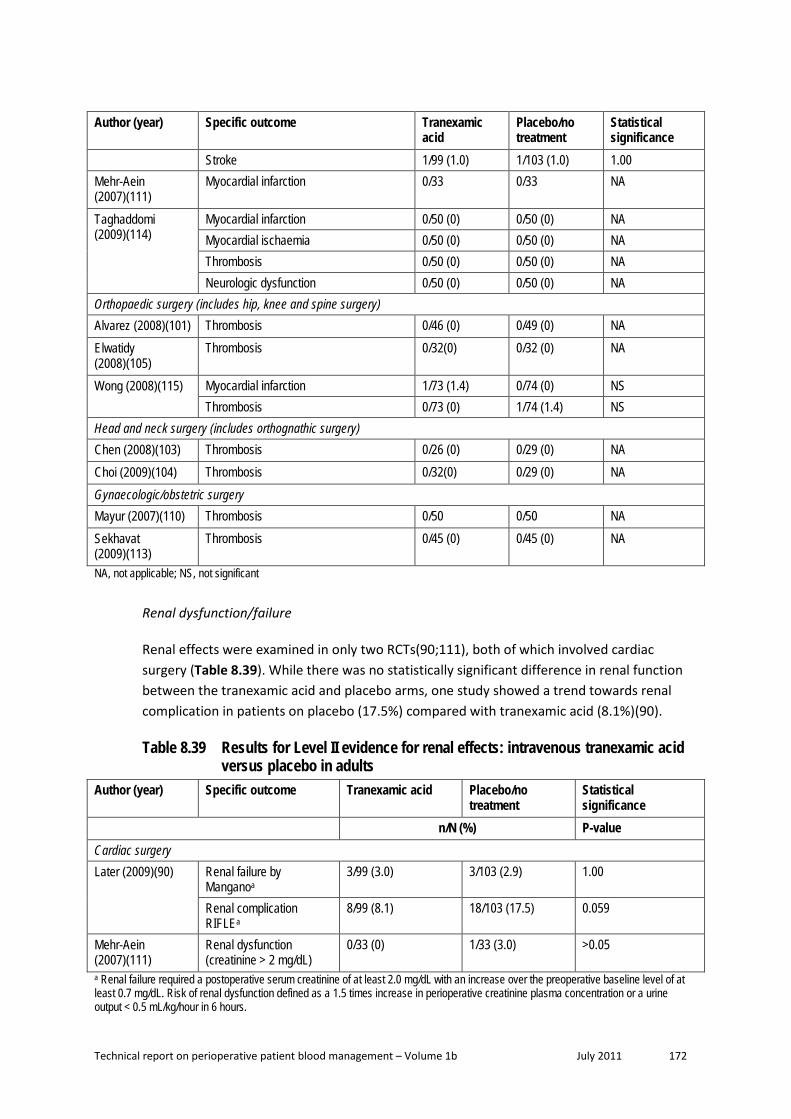
Technical report on perioperative patient blood management – Volume 1b July 2011 172
Author (year) Specific outcome Tranexamic acid
Placebo/no treatment
Statistical significance
Stroke 1/99 (1.0) 1/103 (1.0) 1.00 Mehr-Aein (2007)(111)
Myocardial infarction 0/33 0/33 NA
Taghaddomi (2009)(114)
Myocardial infarction 0/50 (0) 0/50 (0) NA Myocardial ischaemia 0/50 (0) 0/50 (0) NA Thrombosis 0/50 (0) 0/50 (0) NA Neurologic dysfunction 0/50 (0) 0/50 (0) NA
Orthopaedic surgery (includes hip, knee and spine surgery) Alvarez (2008)(101) Thrombosis 0/46 (0) 0/49 (0) NA Elwatidy (2008)(105)
Thrombosis 0/32(0) 0/32 (0) NA
Wong (2008)(115) Myocardial infarction 1/73 (1.4) 0/74 (0) NS Thrombosis 0/73 (0) 1/74 (1.4) NS
Head and neck surgery (includes orthognathic surgery) Chen (2008)(103) Thrombosis 0/26 (0) 0/29 (0) NA Choi (2009)(104) Thrombosis 0/32(0) 0/29 (0) NA Gynaecologic/obstetric surgery Mayur (2007)(110) Thrombosis 0/50 0/50 NA Sekhavat (2009)(113)
Thrombosis 0/45 (0) 0/45 (0) NA
NA, not applicable; NS, not significant
Renal dysfunction/failure
Renal effects were examined in only two RCTs(90;111), both of which involved cardiac surgery (Table 8.39). While there was no statistically significant difference in renal function between the tranexamic acid and placebo arms, one study showed a trend towards renal complication in patients on placebo (17.5%) compared with tranexamic acid (8.1%)(90).
Table 8.39 Results for Level II evidence for renal effects: intravenous tranexamic acid versus placebo in adults
Author (year) Specific outcome Tranexamic acid Placebo/no treatment
Statistical significance
n/N (%) P-value Cardiac surgery Later (2009)(90) Renal failure by
Manganoa 3/99 (3.0) 3/103 (2.9) 1.00
Renal complication RIFLEa
8/99 (8.1) 18/103 (17.5) 0.059
Mehr-Aein (2007)(111)
Renal dysfunction (creatinine > 2 mg/dL)
0/33 (0) 1/33 (3.0) >0.05
a Renal failure required a postoperative serum creatinine of at least 2.0 mg/dL with an increase over the preoperative baseline level of at least 0.7 mg/dL. Risk of renal dysfunction defined as a 1.5 times increase in perioperative creatinine plasma concentration or a urine output < 0.5 mL/kg/hour in 6 hours.
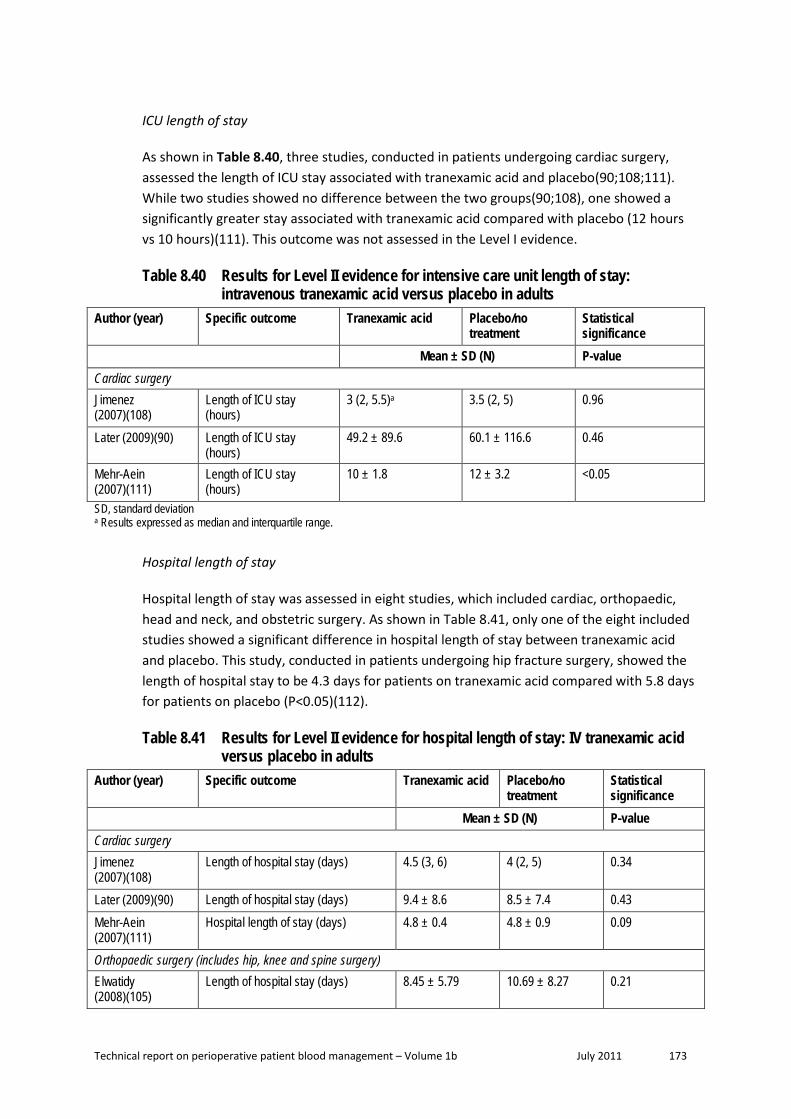
Technical report on perioperative patient blood management – Volume 1b July 2011 173
ICU length of stay
As shown in Table 8.40, three studies, conducted in patients undergoing cardiac surgery, assessed the length of ICU stay associated with tranexamic acid and placebo(90;108;111). While two studies showed no difference between the two groups(90;108), one showed a significantly greater stay associated with tranexamic acid compared with placebo (12 hours vs 10 hours)(111). This outcome was not assessed in the Level I evidence.
Table 8.40 Results for Level II evidence for intensive care unit length of stay: intravenous tranexamic acid versus placebo in adults
Author (year) Specific outcome Tranexamic acid Placebo/no treatment
Statistical significance
Mean ± SD (N) P-value Cardiac surgery Jimenez (2007)(108)
Length of ICU stay (hours)
3 (2, 5.5)a 3.5 (2, 5) 0.96
Later (2009)(90) Length of ICU stay (hours)
49.2 ± 89.6 60.1 ± 116.6 0.46
Mehr-Aein (2007)(111)
Length of ICU stay (hours)
10 ± 1.8 12 ± 3.2 <0.05
SD, standard deviation a Results expressed as median and interquartile range.
Hospital length of stay
Hospital length of stay was assessed in eight studies, which included cardiac, orthopaedic, head and neck, and obstetric surgery. As shown in Table 8.41, only one of the eight included studies showed a significant difference in hospital length of stay between tranexamic acid and placebo. This study, conducted in patients undergoing hip fracture surgery, showed the length of hospital stay to be 4.3 days for patients on tranexamic acid compared with 5.8 days for patients on placebo (P<0.05)(112).
Table 8.41 Results for Level II evidence for hospital length of stay: IV tranexamic acid versus placebo in adults
Author (year) Specific outcome Tranexamic acid Placebo/no treatment
Statistical significance
Mean ± SD (N) P-value Cardiac surgery Jimenez (2007)(108)
Length of hospital stay (days) 4.5 (3, 6) 4 (2, 5) 0.34
Later (2009)(90) Length of hospital stay (days) 9.4 ± 8.6 8.5 ± 7.4 0.43 Mehr-Aein (2007)(111)
Hospital length of stay (days) 4.8 ± 0.4 4.8 ± 0.9 0.09
Orthopaedic surgery (includes hip, knee and spine surgery) Elwatidy (2008)(105)
Length of hospital stay (days) 8.45 ± 5.79 10.69 ± 8.27 0.21

Technical report on perioperative patient blood management – Volume 1b July 2011 174
Author (year) Specific outcome Tranexamic acid Placebo/no treatment
Statistical significance
Sadeghi (2007)(112)
Hospital length of stay (days) 4.3 ± 1.6 5.8 ± 1.5 <0.05
Wong (2008)(115) Hospital length of stay (days) 9.19 ± 5.48 8.47 ± 4.12 0.38 Head and neck surgery Chen (2008)(103) Length of hospital stay (days) 4.81 ± 0.80 5.31 ± 1.26 0.087 Choi (2009)(104) Length of hospital stay (days) 7.2 ± 2.1 (32) 7.5 ± 2.3 (29) 0.32 IV, intravenous; SD, standard deviation.
Topical tranexamic acid
The results of the three studies which examined the use of topical tranexamic surgery are summarised below; however, the majority of outcome data came from one study by Fawzy (2009)(106), conducted in Saudi Arabia. Two of the three studies were conducted in patients undergoing cardiac surgery(106;107), while the remaining study was conducted in patients undergoing endoscopic sinus surgery(102).
Transfusion incidence
None of the three identified studies examining topical tranexamic acid assessed its effect on transfusion incidence.
Transfusion volume
Only the study by Fawzy (2009)(106) reported data on transfusion volume (Table 8.42). The results showed no significant difference between tranexamic acid and placebo in terms of postoperative transfusion of packed red blood cells (pRBCs; P=0.82), and transfusion of pRBCs and plasma until chest tube withdrawal (P=0.42). There was significantly less transfusion with plasma until chest tube withdrawal (P=0.03).
Table 8.42 Results for Level II evidence for transfusion volume: topical tranexamic acid versus placebo in adults
Author (year) Specific outcome Tranexamic acid
Placebo/no treatment
Statistical significance
Median P-value Cardiac surgery Fawzy (2009)(106) Transfusion volume (units;
pRBC/postoperative) 1 1 0.82
Incidence of RBC and plasma transfusion until chest tube withdrawal
0 2 0.42
Incidence of plasma transfusion until chest tube withdrawal
0 2 0.03
pRBC, packed red blood cells; RBC, red blood cell.
Blood loss

Technical report on perioperative patient blood management – Volume 1b July 2011 175
Blood loss was assessed in all three studies that examined topical application of tranexamic acid during cardiac surgery or endoscopic sinus surgery (Table 8.43). The studies by Fawzy (2009)(106) and Jabalameli (2006)(107) both showed significantly less blood loss with tranexamic acid compared with placebo in cardiac surgery (P=0.04 and P<0.05, respectively). The study by Athanasiadis (2007)(102) showed significantly less blood loss (based on two bleeding grading scales) within a short timeframe (up to 10 minutes) following endoscopic sinus surgery for two doses of tranexamic acid, 100 mg and 1 g.
Table 8.43 Results for Level II evidence for blood loss: topical tranexamic acid versus placebo in adults
Author (year) Specific outcome Tranexamic acid Placebo/no treatment
Statistical significance
Mean P-value Cardiac surgery Fawzy (2008)(106) 24-hour chest tube loss (mL) Median 626 Median 1040 0.04
Total chest tube loss (mL) Median 656 Median 1056 NR Jabalameli (2006)(107)
Intraoperative blood loss (mL) 174 ± 10.6 229 ± 23.8 <0.05
Other surgery (endoscopic sinus surgery) Athanasiadis (2007)(102)
Bleeding grading scales at 0, 2, 4, 6, 8 and 10 mins
NR NR
100 mg TXA <0.05 1 g TXA <0.05
NR, not reported; TXA, tranexamic acid.
Mortality, reoperation, morbidity and length of stay
Only the study by Fawzy (2009)(106) provided data for mortality, morbidity and ICU and hospital length of stay (Table 8.44). However, this study included only 19 patients in each treatment arm. There were no cases of in-hospital mortality or MI, one case of reoperation for bleeding in the tranexamic acid arm (P=1.00), no difference in hospital length of stay (7.5 vs 7.8 days; P=0.68), and a significantly shorter duration of ICU stay for tranexamic acid compared with placebo (29 hours vs 49 hours; P=0.02).
Table 8.44 Results for Level II evidence for mortality, reoperation, myocardial infarction, length of stay: topical tranexamic acid versus placebo in adults
Author (year) Specific outcome Tranexamic acid Placebo/no treatment
Statistical significance
Mortality
n/N (%) P-value Cardiac surgery Fawzy (2009)(106) In-hospital mortality 0/19 (0) 0/19 (0) NA
Re-operation

Technical report on perioperative patient blood management – Volume 1b July 2011 176
Author (year) Specific outcome Tranexamic acid Placebo/no treatment
Statistical significance
n/N (%) P-value Cardiac surgery Fawzy (2009)(106) Re-operation for bleeding 1/19 (5) 0/19 (0) 1.00
Myocardial infarction
n/N (%) P-value Cardiac surgery Fawzy (2009)(106) Myocardial infarction 0/19 (0) 0/19 (0) NA
ICU length of stay (hours)
Mean ± SD P-value Cardiac surgery Fawzy (2009)(106) ICU length of stay 29 ± 26 49 ± 20 0.02
Hospital length of stay (days)
Mean ± SD P-value Cardiac surgery Fawzy (2009)(106) Hospital length of stay 7.5 ± 3 7.8 ± 2.0 0.68 ICU, intensive care unit; NA, not applicable; SD, standard deviation.
Level III evidence Due to the extensive amount of Level I and Level II evidence available for this intervention, a search for Level III evidence was not conducted.
A search for evidence specifically relating to quality of life was conducted. This search found no relevant Level III evidence.
Level IV evidence Due to the extensive amount of Level I and II evidence available for this intervention, a search for Level IV evidence was not conducted.
A search for evidence specifically relating to quality of life was conducted. This search found no relevant Level IV evidence.

Technical report on perioperative patient blood management – Volume 1b July 2011 177
C. Ε-AMINOCAPROIC ACID Epsilon (ε)-aminocaproic acid is a synthetic derivative of the amino acid lysine. It acts as an antifibrinolytic by competitively inhibiting the activation of plasminogen to plasmin, a molecule responsible for the degradation of fibrin. The following summary of evidence should be read while keeping in mind that ε-aminocaproic acid injection is not currently registered in Australia.
Methods
The systematic review process identified 30 studies that assessed the effect of aprotinin, tranexamic acid, ε-aminocaproic acid or desmopressin for minimising perioperative blood loss on morbidity, mortality and transfusion. Due to the large amount of available evidence, Level I studies were only included if they formally pooled the relevant outcome data; this resulted in the exclusion of only three potentially relevant Level I studies.
Of the 30 Level I studies identified, 12 studies provided data on ε-aminocaproic acid. As 12 studies meeting the requirements of Level I evidence were identified, lower levels of evidence were not comprehensively searched. However, the most comprehensive and highest quality Level I evidence available for ε-aminocaproic acid, Henry (2007)(66), was updated only to June 2006. Therefore, a search of Level II (RCT) evidence was conducted to identify additional studies published after this time. This search identified three RCTs relevant to this review.
The search for evidence of the effectiveness and safety of ε-aminocaproic acid was limited to the comparison between ε-aminocaproic acid and no ε-aminocaproic acid (i.e. no treatment or placebo). Thus, a formal systematic review comparing ε-aminocaproic acid with the other lysine analogue tranexamic acid, and aprotinin, was not conducted. However, where appropriate, evidence relating to the comparison between ε-aminocaproic acid and tranexamic acid and aprotinin has been discussed.
No socioeconomic literature pertaining to Australia’s Indigenous population was identified in the literature search for this research question.
One published cost-effectiveness analysis on the use of cell salvage compared with alternative transfusion strategies (including antifibrinolytics as a group) was identified in the literature search for this question. A brief summary of the findings of this report were presented after the review of the clinical evidence for intraoperative cell salvage (see Section 2).
Level I evidence Twelve systematic reviews that included formal meta-analysis of data were identified. All compared ε-aminocaproic acid with no ε-aminocaproic acid (placebo or no treatment). A summary of the key features of the 12 identified systematic reviews is provided in Table 8.45. Studies have been arranged in order of literature search date to show which of the systematic reviews provide the most up-to-date and comprehensive data.

Technical report on perioperative patient blood management – Volume 1b July 2011 178
There is substantial overlap between many of the systematic reviews. As such, a decision was made to limit the evaluation of evidence to the most up-to-date and comprehensive reviews for each population and surgery type. For these reasons, the following reviews provide pivotal evidence and were chosen to form the basis of the guideline evaluation (shown in dark shading in Table 8.45):
• Henry (2007)(66) – provides a comprehensive analysis of intravenous (IV) ε-aminocaproic acid in adults undergoing all surgery types.
• Schouten 2009(68) – provides a comprehensive analysis of IV ε-aminocaproic acid in children undergoing major surgery (cardiac and scoliosis).
The majority of other reviews were either superseded by one of the included reviews, or were limited to specific surgery types. Reviews published after the pivotal reviews have been included as supportive evidence. Reviews published prior to the pivotal reviews are considered to have been superseded and have not been formally assessed in this review.
The quality of each of the included pivotal and supportive systematic reviews was assessed using NHMRC criteria and is presented in Table 8.45.
Table 8.45 Characteristics of Level I evidence for ε-aminocaproic acid Author (Year) Study quality
Date of search
Population Surgery
Treatment No. of included studies
Relevant outcomes
McIlroy (2009)(70) Good
Jul 2008 Adult + aspirin Cardiac
ACA /TXA (IV) AP (IV)
3 13
Transfusion incidence Transfusion volume Blood loss Mortality Reoperation Morbidity
Henry (2009)(71) Good
Jan 2008 Adult Cardiac
ACA (IV) TXA (IV) AP (IV)
6 23 81
Mortality Morbidity
Tzortzopoulou (2008)(73) Cochrane review Good
Jul 2007 Children Scoliosis
ACA (IV) TXA (IV) AP (IV)
2 2 2
Transfusion incidence Transfusion volume Blood loss
Kagoma (2009)(74) Good
May 2007 Adult Orthopaedic
AP/TXA/ACA (IV)a
29 Transfusion incidence Blood loss Morbidity
Schouten (2009)(68) Fair
Oct 2006 Children Cardiac and scoliosis
ACA (IV) TXA (IV) AP (IV)
4 7 18
Transfusion volume Blood loss

Technical report on perioperative patient blood management – Volume 1b July 2011 179
Author (Year) Study quality
Date of search
Population Surgery
Treatment No. of included studies
Relevant outcomes
Brown (2007)(75) Fair
Jul 2006 Adult Cardiac
ACA (IV) TXA (IV) AP (IV)
18 31 110
Transfusion incidence Blood loss Mortality Reoperation Morbidity
Henry (2007)(66) Cochrane review Good
Jul 2006 Adult Any
ACA (IV) TXA (IV) AP (IV)
11 45 116
Transfusion incidence Transfusion volume Blood loss Mortality Reoperation Morbidity
fthe fZufferey (2006)(76)
Jul 2005 Adult Orthopaedic
ACA (IV) TXA (IV) AP (IV)
4 20 23
Transfusion incidence Morbidity
Levi (1999)(81) Dec 1999 Adult Cardiac
ACA/TXA (IV) AP (IV) DP (IV)
17 45 16
Transfusion incidence Transfusion volume Blood loss Mortality Reoperation Morbidity
Munoz (1999)(116) 1998 Adult Cardiac
ACA (IV) 9 Transfusion incidence Blood loss Mortality Reoperation Morbidity
Laupacis (1997)(83) Mar 1997 Adult Cardiac
ACA (IV) TXA (IV) AP (IV) DP (IV)
3 12 45 12
Transfusion incidence
Fremes (1994)(84) Jun 1993 Adult Cardiac
ACA (IV) TXA (IV) AP (IV) DP (IV)
2 2 14 13
Transfusion incidence Transfusion volume Blood loss Mortality Reoperation
Note: Systematic reviews which form the basis of this evaluation are shown in dark shading (pivotal reviews). Systematic reviews which have literature searches which are more up-to-date than the pivotal reviews are shown in light shading (supportive reviews). Only treatments relevant to this guideline are shown here. Relevant treatments not assessed in this section of the report are shown in italics. Treatments were assumed to be given intravenously if the mode of administration was not specifically stated as IV, topical or oral. ACA, ε-aminocaproic acid; AP, aprotinin; CABG, coronary artery bypass graft; DP, desmopressin; IV, intravenous; TXA, tranexamic acid. a All treatments were administered intravenously except for some oral use of TXA in one included study.
The results of the included reviews will be presented according to population group: that is, adults and paediatric.
Technical report on perioperative patient blood management – Volume 1b July 2011 180
Adult population Intravenous ε-aminocaproic acid The results of the systematic review by Henry (2007)(66), which assessed the use of IV ε-aminocaproic acid in adults, are summarised in Table 8.46. This review was a comprehensive Cochrane review and was considered to be of good methodological quality.
The authors note that the dose regimens for ε-aminocaproic acid varied significantly between trials. The loading dose ranged from 80 mg to 15 g or 75–150 mg/kg, while the maintenance dose ranged from 1–2 g/hour or 12.5–30 mg/kg/hour infused over varying time periods.
The results of the analysis show that ε-aminocaproic acid is effective at reducing the proportion of subjects requiring transfusion (RR 0.75; 95%CI: 0.58, 0.96). This result was consistent for patients undergoing cardiac surgery (RR 0.65; 95%CI: 0.47, 0.91; 10 RCTs) but not orthopaedic surgery (RR 0.96; 95%CI: 0.61, 1.50; 3 RCTs) or liver surgery (RR 0.93; 95%CI: 0.80, 1.08; 1 RCT); however, this may be due to the smaller amount of evidence available for these surgeries compared with cardiac surgery.
In the subgroup of RCTs in which a transfusion protocol was used (13/14 RCTs), the risk of being transfused was significantly lower for patients on ε-aminocaproic acid compared with no ε-aminocaproic acid (RR 0.73; 95%CI: 0.56, 0.95). The difference in proportion of surgical patients who required transfusion between treatment arms was relatively consistent regardless of study quality (RR 0.68; 95%CI: 0.44, 1.04 for Cochrane Scale A; RR 0.68; 95%CI: 0.46, 1.03 for Cochrane Scale B and; RR 0.93; 95%CI: 0.81, 1.08 for Cochrane Scale C), although none of these reached statistical significance.
The volume of blood transfused was significantly lower for ε-aminocaproic acid in studies that included all patients (WMD: –1.77 units; 95%CI: –2.59, –0.95; 4 RCTs), but not in studies that included only transfused patients (WMD: 0.22 units; 95%CI: –0.34, 0.79; 3 RCTs).
Only two studies (both conducted in patients undergoing orthopaedic surgery) assessed the effectiveness of ε-aminocaproic acid in reducing total blood loss. These studies showed a significant reduction in total blood loss in favour of ε-aminocaproic acid (WMD: –300 mL; 95%CI: –523, –77). Statistically significant differences in blood loss were also seen for intraoperative blood loss for cardiac surgery (WMD: –214 mL; 95%CI: –310, –117; 2 RCTs) and postoperative blood loss for any surgery (WMD: –202 mL: 95%CI: –274, –131; 12 RCTs), cardiac surgery (WMD: –196 mL; 95%CI: –272, –121; 11 RCTs) and orthopaedic surgery (MD: –276 mL; 95%CI: –449, –103; 1 RCT). Differences in intraoperative blood loss were not significantly different for any surgery (WMD: –142 mL; 95%CI: –285, 0.92; 4 RCTs) and orthopaedic surgery (WMD: 10.9 mL; 95%CI: –260, 282; 2 RCTs).
Treatment with ε-aminocaproic acid did not result in significantly increased mortality compared with no treatment with ε-aminocaproic acid (RR 1.17; 95%CI: 0.47, 2.93). In addition, ε-aminocaproic acid was generally not associated with increased morbidity. The one RCT that reported hospital length of stay found a non-statistically significant increase in

Technical report on perioperative patient blood management – Volume 1b July 2011 181
length of hospital stay for ε-aminocaproic acid therapy compared with no ε-aminocaproic acid therapy following liver transplantation (MD: 2.90 days; 95%CI: –0.96, 6.76; 1 RCT).
Table 8.46 Results for Level I evidence: ε-aminocaproic acid versus no ε-aminocaproic acid in adults (Henry, 2007)
Author (year) No. trials (N) No. trials included in analysisa
ε-aminocaproic acid
No ε-aminocaproic acid
Pooled risk estimate
Exposure to allogeneic blood transfusion
n/N (%) RR (95%CI) Henry (2007)(66) 14 trials (N=801) 138/414 (33.3) 173/384 (45.1) All studies
0.75 (0.58, 0.96) P=0.023 (Phet=0.03)
By surgery type
Henry (2007)(66) 10 trials (N=597) 82/313 (26.2) 113/284 (39.8) Cardiac surgery 0.65 (0.47, 0.91) P=0.011 (Phet=0.11)
Henry (2007)(66) 3 trials (N=122) 20/59 (33.9) 23/63 (36.5) Orthopaedic surgery 0.96 (0.61, 1.50) P=0.85 (Phet=0.64)
Henry (2007)(66) 1 trial (N=82) 36/42 (85.7) 37/40 (92.5) Liver surgery 0.93 (0.80, 1.08) P=0.33 (Phet=NA)
By transfusion protocol
Henry (2007)(66) 13 trials (N=771) 134/399 (33.6) 170/372 (45.7) Transfusion protocol 0.73 (0.56, 0.95) P=0.019 (Phet=0.02)
Henry (2007)(66) 1 trial (N=30) 4/15 (26.7) 3/15 (20.0) No transfusion protocol 1.33 (0.36, 4.97) P=0.67 (Phet=NA)
Units of allogeneic blood transfused
Mean ± SD WMD(95%CI) Henry (2007)(66) 4 trials (N=198) NR NR All patients
–1.77 (–2.59, –0.95) P<0.001 (Phet=0.02)
Henry (2007)(66) 3 trials (N=119) NR NR Transfused patients 0.22 (–0.34, 0.79) P=0.44 (Phet=0.76)

Technical report on perioperative patient blood management – Volume 1b July 2011 182
Author (year) No. trials (N) No. trials included in analysisa
ε-aminocaproic acid
No ε-aminocaproic acid
Pooled risk estimate
Total blood loss (mL)
Mean ± SD WMD: (95%CI) Henry (2007)(66) 2 trials (N=92) NR NR Orthopaedic surgery
–299.69 (–522.54, –76.84) P=0.0084 (Phet=0.39)
Intraoperative blood loss (mL)
Mean ± SD WMD: (95%CI) Henry (2007)(66) 4 trials (N=171) NR NR All studies
–142.02 (–284.95, 0.92) P=0.051 (Phet=0.19)
By surgery type
Henry (2007)(66) 2 trials (N=79) NR NR Cardiac surgery –213.58 (–310.03, –117.13) P<0.001 (Phet=0.73)
Henry (2007)(66) 2 trials (N=92) NR NR Orthopaedic surgery 10.94 (–259.66, 281.54) P=0.94 (Phet=0.26)
Postoperative blood loss (mL)
Mean ± SD WMD: (95%CI) Henry (2007)(66) 12 trials (N=940) NR NR All studies
–202.08 (–273.64, –130.53) P<0.001 (Phet<0.001)
By surgery type
Henry (2007)(66) 11 trials (N=894) NR NR Cardiac surgery –196.27 (–271.75, –120.79) P<0.001 (Phet<0.001)
Henry (2007)(66) 1 trial (N=46) NR NR Orthopaedic surgery –276.00 (–448.83, –103.17) P=0.0017 (Phet=NA)
Re-operation for bleeding
n/N (%) RR (95%CI) Henry (2007)(66) 7 trials (N=740)
5 trials (N=662) 3/379 (0.8) 12/361 (3.3) Cardiac surgery
0.35 (0.11, 1.17) P=0.087 (Phet=0.78)

Technical report on perioperative patient blood management – Volume 1b July 2011 183
Author (year) No. trials (N) No. trials included in analysisa
ε-aminocaproic acid
No ε-aminocaproic acid
Pooled risk estimate
Mortality
n/N (%) RR (95%CI) Henry (2007)(66) 6 trials (N=754)
5 trials (N=714) 10/388 (2.6) 7/366 (1.9) All studies
1.17 (0.47, 2.93) P=0.73 (Phet=0.78)
Henry (2007)(66) 5 trials (N=672) 4 trials (N=632)
7/346 (2.0) 3/326 (0.9) Cardiac surgery 1.65 (0.50, 5.43) P=0.41 (Phet=0.81)
Myocardial infarction
n/N (%) RR (95%CI) Henry (2007)(66) 5 trials (N=662)
4 trials (N=632) 12/340 (3.5) 14/322 (4.3) Cardiac surgery
0.89 (0.37, 2.18) P=0.80 (Phet=0.33)
Stroke
n/N (%) RR (95%CI) Henry (2007)(66) 6 trials (N=702)
3 trials (N=541) 2/361 (0.6) 3/341 (0.9) Cardiac surgery
0.59 (0.10, 3.44) P=0.55 (Phet=0.47)
Deep vein thrombosis
n/N (%) RR (95%CI) Henry (2007)(66) 3 trials (N=122)
1 trial (N=46) 3/59 (5.1) 3/63 (4.8) All studies
1.09 (0.25, 4.85) P=0.91 (Phet=NA)
Pulmonary embolism
n/N (%) RR (95%CI) Henry (2007)(66) 2 trials (N=92)
1 trial (N=46) 0/44 (0) 1/48 (2.1) All studies
0.36 (0.02, 8.46) P=0.53 (Phet=NA)
Other thrombosis
n/N (%) RR (95%CI) Henry (2007)(66) 1 trial (N=82)
2/42 (4.8) 2/40 (5.0) All studies
0.95 (0.14, 6.44) P=0.96 (Phet=NA)

Technical report on perioperative patient blood management – Volume 1b July 2011 184
Author (year) No. trials (N) No. trials included in analysisa
ε-aminocaproic acid
No ε-aminocaproic acid
Pooled risk estimate
Hospital length of stay (days)
Mean ± SD WMD(95%CI) Henry (2007)(66) 1 trial (N=46) 11.9 ± 7.3 9 ± 5.9 Orthopaedic surgery
2.90 (–0.96, 6.76) P=0.14 (Phet=NA)
CI, confidence interval; NA, not applicable; NR, not reported; RR, risk ratio; SD, standard deviation; WMD, weighted mean difference. a Where individual studies had either 100% events in both treatment arms, no events in both treatment arms or no SD is reported, a risk estimate for that individual study could not be calculated, and it could not be included in the pooled analysis. Where this has occurred, the actual number of studies and subjects included in the analysis will be stated.
Subsequent to the publication of the Henry (2007) Cochrane review, the results of a head-to-head RCT comparing aprotinin with the lysine analogues, tranexamic acid and ε-aminocaproic acid, in patients undergoing high-risk cardiac surgery were published(85). The BART study (85) found that mortality was higher in patients receiving aprotinin (6.0%) compared with both ε-aminocaproic acid (4.0%) and tranexamic acid (3.9%). The corresponding relative risks were 1.52 (95%CI: 0.98, 2.36) and 1.55 (95%CI: 0.99, 2.42), respectively. The relative risk of death in the aprotinin group compared to the ε-aminocaproic acid and tranexamic acid groups combined was 1.53 (95%CI: 1.06, 2.22). The difference in the death rate between aprotinin and the lysine analogues was driven mainly by a difference in deaths due to cardiac causes (RR 2.19; 95%CI: 1.25, 3.84). This increased risk of death was seen despite a modest reduction in the risk of massive bleeding for aprotinin compared with the lysine analogues (9.5% vs 12.1%). Due to the higher death rate associated with aprotinin compared with the lysine analogues, the BART study was terminated early.
In light of the publication of the BART study, Henry (2009)(71) subsequently updated their meta-analysis of aprotinin, tranexamic acid and ε-aminocaproic acid in cardiac surgery. This update found no additional ε-aminocaproic acid versus no ε-aminocaproic acid studies and so will not be presented in detail here. However, the updated head-to-head analyses reported in the Henry (2009)(71) review showed an increased risk of mortality with aprotinin compared with the lysine analogues, which was largely driven by the inclusion of the BART study. The pooled risk of death for aprotinin compared with ε-aminocaproic acid in head-to-head trials was RR 1.49 (0.98, 2.28), while the pooled risk of death for aprotinin compared with tranexamic acid in head-to-head trials was RR 1.43 (0.98, 2.08).
A number of systematic reviews of ε-aminocaproic acid have been published since the Henry (2007) review and provide supportive evidence. These reviews provide supportive data in cardiac surgery(70;75) and orthopaedic surgery(74). Each of these will be described in detail below. The results of these reviews are generally consistent with the results of the Henry (2007) review, showing that ε-aminocaproic acid results in a reduction in the number of surgical patients requiring transfusion and/or reducing the volume of transfusion/blood loss.

Technical report on perioperative patient blood management – Volume 1b July 2011 185
The results of the Brown (2007) review are summarised in Table 8.47. The Brown review was rated as a fair quality review as it did not provide individual study results or forest plots of the analysis. In addition, manual checking of some characteristics and results of individual included studies identified data errors.
According to Brown (2007), ε-aminocaproic acid dosing varied between trials but was consistent within trials. While they initially stratified into high and low-dose categories, they found no significantly different effects for these doses. Thus, they presented results for both dosing categories combined.
Similar to the Henry (2007) review, the Brown (2007)(75) review found that ε-aminocaproic acid therapy reduced the incidence of transfusion in cardiac surgery patients (RR 0.65; 95%CI: 0.47, 0.91). The authors stratified these results by specific types of cardiac surgery and found consistent results: the RR of transfusion was 0.60 (95%CI: 0.39, 0.91) for coronary artery bypass graft (CABG), and 0.77 (95%CI: 0.35, 1.70) for CABG with valve surgery; there was no data available for valve only surgery. No details on the number of included trials and patients are included for these subgroup analyses, and the data cannot be easily verified due to the absence of individual trial data or forest plots.
The results for blood loss differed for the Henry (2007) and Brown (2007) reviews; the Brown review analysed total blood loss only, while data from Henry (2007) for cardiac surgery was available for intraoperative and postoperative blood loss separately. The difference in total blood loss between ε-aminocaproic acid therapy and no therapy in the Brown review was –240 mL, while in the Henry review it was –214 mL during the intraoperative period and –196 mL during the postoperative period.
While there was no statistically significant difference in mortality between ε-aminocaproic acid therapy and no therapy, the risk estimate was substantially higher than one (unity). Based on data from 6 trials, the RR of mortality was 1.82 (95%CI: 0.55, 5.98). Due to the approximate incidence of mortality in this cardiac surgical population (0.9% in the placebo arm (66)) and the small difference seen between treatment arms (1.1%(66)), it is likely that the analyses presented in the Henry and Brown reviews are insufficiently powered to detect a difference in mortality between ε-aminocaproic acid therapy and no therapy. Given that little information on individual trial data is included in the Brown review, it is difficult to determine whether the potentially increased risk in mortality for low-dose aprotinin is an anomaly, or whether it is a real risk that failed to reach statistical significance due to a lack of statistical power.
The results of the analysis of MI differed slightly between the Brown (2007) and Henry (2007) reviews, with both showing no significant difference; however, the RRs in the two reviews are in different directions (1.14 and 0.89, respectively). Manual checking of the study characteristics list included as a supplement appendix in the Brown (2007) review revealed that one study included in the Henry review was not included in the Brown review, while three studies included in the Brown review were not included in the Henry reviews; one of these studies is not placebo-controlled.

Technical report on perioperative patient blood management – Volume 1b July 2011 186
The risk of stroke for ε-aminocaproic acid therapy compared with no therapy in the Brown (2007) review was similar to the risk of stroke in Henry (2007) (RR 0.60; 95%CI: 0.13, 2.81 and 0.59; 95%CI: 0.10, 3.44, respectively). The results for reoperation are not directly comparable between the reviews as the outcomes appear to be defined slightly differently. In the Brown review the outcome is described as return to operating room, whereas the Henry review is more specific, specifying reoperation for bleeding. Despite slightly different definitions, the results are similar (RR 0.51; 95%CI: 0.15, 1.82 and 0.35; 95%CI: 0.11, 1.17, respectively), although the reduction for reoperation for bleeding in the Henry (2007) review may have failed to reach statistical significance due to underpowering (P=0.09).
Table 8.47 Results for supportive Level I evidence: ε-aminocaproic acid versus no ε-aminocaproic acid in adult cardiac surgery patients (Brown, 2007)
Dose group
No. trials (N) No. of trials included in analysis (N)a
Ε-aminocaproic acid
No ε-aminocaproic acid
Pooled risk estimate
Henry (2007)(66) pooled risk estimate
Exposure to allogeneic blood transfusion
n/N (%) RR (95%CI) Brown 2007(75) 10 trials (N=628) NR NR 0.63 (0.44, 0.90)
P=0.01 (Phet=NR)
0.65 (0.47, 0.91) P=0.011 (Phet=0.11)
Total blood loss (mL)
Mean ± SD (N) WMD: (95%CI) Brown 2007(75) 3 trials (N=144) NR NR –240 (–341, –
140) P<0.001 (Phet=NR)
Intraoperative blood loss –214 (–310, –117) P<0.001 (Phet=0.73) Postoperative blood loss –196 (–272, –121) P<0.001 (Phet<0.001)
Mortality n/N (%) RR (95%CI) Brown 2007(75) 6 trials (N=735) NR NR 1.82 (0.55, 5.98)
P=0.32 (Phet=NR)
1.65 (0.50, 5.43) P=0.41 (Phet=0.81)
Return to operating room n/N (%) RR (95%CI)

Technical report on perioperative patient blood management – Volume 1b July 2011 187
Dose group
No. trials (N) No. of trials included in analysis (N)a
Ε-aminocaproic acid
No ε-aminocaproic acid
Pooled risk estimate
Henry (2007)(66) pooled risk estimate
Brown 2007(75) 9 trials (N=851) NR NR 0.51 (0.15, 1.82) P=0.30 (Phet=NR)
Re-operation for bleeding 0.35 (0.11, 1.17) P=0.087 (Phet=0.78)
Myocardial infarction n/N (%) RR (95%CI) Brown 2007(75) 8 trials (N=839) NR NR 1.14 (0.50, 2.60)
P=0.76 (Phet=NR)
0.89 (0.37, 2.18) P=0.80 (Phet=0.33)
Stroke n/N (%) RR (95%CI) Brown 2007(75) 8 trials (N=833) NR NR 0.60 (0.13, 2.81)
P=0.52 (Phet=NR)
0.59 (0.10, 3.44) P=0.55 (Phet=0.47)
CI, confidence interval; het, heterogeneity; NR, not reported; RR, risk ratio; SD, standard deviation; WMD, weighted mean difference. a Where individual studies had either 100% events in both treatment arms, no events in both treatment arms or no SD is reported, a risk estimate for that individual study could not be calculated, and it could not be included in the pooled analysis. Where this has occurred, or is reported, the actual number of studies and subjects included in the analysis will be stated.
The results of the analysis of ε-aminocaproic/tranexamic acid (combined as lysine analogue) use in adult patients undergoing cardiac surgery who were also receiving aspirin (reported in McIlroy (2009)(70)) are summarised in Table 8.48. The results show that the use of lysine analogues (ε-aminocaproic acid /tranexamic acid) was associated with a significant reduction in the amount of postoperative blood loss (WMD: –189.35 mL; 95%CI: –287.24, –91.46). There was no significant difference between the lysine analogue and no lysine analogue arms with regard to reoperation (OR 0.31; 95%CI: 0.03, 3.14) or thrombotic complications (OR 0.32; 95%CI: 0.01, 8.02). The results were generally comparable to those of the cardiac subgroup analyses from the Henry (2007) review, keeping in mind that subjects included in the Henry review may or may not have received aspirin.

Technical report on perioperative patient blood management – Volume 1b July 2011 188
Table 8.48 Results for Level I evidence: lysine analogue versus no lysine analogue in adult cardiac surgery patients receiving aspirin (McIlroy, 2009)
Author (year) No. trials (N) No. of trials included in analysis (N)a
Lysine analogue (ε-aminocaproic acid/tranexamic acid)
No lysine analogue (ε-aminocaproic acid/tranexamic acid)
Pooled risk estimate
Henry (2007)(66) risk estimate
Postoperative chest tube blood loss (mL)
Mean ± SD WMD: (95%CI) McIlroy (2009)(70)
3 trials (N=259) NR NR With aspirin –189 (–287, –91) P<0.001 (Phet=0.05)
With or without aspirin/postoperative blood loss –196 (–272, –121) P<0.001 (Phet<0.001)
Reoperation
n/N (%) OR (95%CI) RR (95%CI) McIlroy (2009)(70)
1 trialb (N=30) 0/15 (0) 1/15 (6.7) With aspirin 0.31 (0.01, 8.28) P=NR (Phet=NA)
With or without aspirin/reoperation for bleeding 0.35 (0.11, 1.17) P=0.087 (Phet=0.78)
Note: ‘No lysine analogue’ group denotes placebo or no treatment. CI, confidence interval; het, heterogeneity; NA, not applicable; NR, not reported; OR, odds ratio; SD, standard deviation; WMD, weighted mean difference. a Where individual studies had either 100% events in both treatment arms, no events in both treatment arms or no SD is reported, a risk estimate for that individual study could not be calculated, and it could not be included in the pooled analysis. Where this has occurred, the actual number of studies and subjects included in the analysis will be stated. b Ε-aminocaproic acid only.
The review by Kagoma (2009)(74) examined the use of antifibrinolytic therapy (aprotinin, tranexamic acid and ε-aminocaproic acid) in adult patients undergoing total hip and total knee replacement. While the primary analysis compared the antifibrinolytic group as a whole to placebo, separate results for aprotinin, tranexamic acid and ε-aminocaproic acid are available for some outcomes. Details of the included studies for each analysis could be determined from the forest plots.
A comparison between the results of the Kagoma (2009)(74) and Henry (2007) reviews is shown in Table 8.49. All studies included in the Kagoma (2009) review were included in the Henry (2007) review; however, there were some differences in studies included for each outcome, which explains some of the differences in results. For transfusion incidence, each review included three studies, with two of these being included in both. The additional RCT included in the Henry review has a high rate of transfusion in both treatment arms (approximately 50%) compared to the other studies, which explains the higher risk estimate (RR 0.96) compared to that seen in the Kagoma review (RR 0.64). For total blood loss, the Kagoma and Henry reviews each included two RCTs, one of which was common to both.

Technical report on perioperative patient blood management – Volume 1b July 2011 189
Despite the different studies included in each, the difference in total blood loss was similar between the two reviews (–331 mL and –300 mL, respectively).
It is difficult to easily compare the results of the Kagoma and Henry reviews with regard to VTE complications as the Kagoma review used a different risk measure (risk difference) and used a combined VTE category rather than separate categories for different VTE events. The results of both reviews show no significant difference in VTE between aprotinin therapy and no therapy, although both reviews are substantially underpowered to detect these rare events.
Table 8.49 Results for supportive Level I evidence: ε-aminocaproic acid versus no ε-aminocaproic acid in adult hip and knee replacement surgery patients (Kagoma, 2009)
Treatment
No. trials (N) No. of trials included in analysis (N)a
Ε-aminocaproic acid
No ε-aminocaproic acid
Pooled risk estimate
Henry (2007)(66) pooled risk estimate
Exposure to allogeneic blood transfusion
n/N (%) RR (95%CI) Kagoma 2009(74) 3 trials (N=180) NR NR 0.64 (0.21, 1.93)
P=NR (Phet=NR)
Orthopaedic surgery 0.96 (0.61, 1.50) P=0.85 (Phet=0.64)
Total blood loss (mL)
Mean ± SD (N) WMD: (95%CI) Kagoma 2009(74) 2 trials (N=141) NR NR –331 (–544, –
118) P=NR (Phet=NR)
Orthopaedic surgery –300 (–523, –77) P=0.0084 (Phet=0.39)
Venous thromboembolism
n/N (%) RD (95%CI) RR (95%CI) Kagoma 2009(74) 3 trials (N=180) 0/76 (0) 0/104 (0) 0.00 (–0.07, 0.07)
P<0.05 (Phet=NR)
DVT 1.09 (0.25, 4.85) P=0.91 (Phet=NA) PE 0.36 (0.02, 8.46) P=0.53 (Phet=NA)

Technical report on perioperative patient blood management – Volume 1b July 2011 190
CI, confidence interval; DVT, deep vein thrombosis; het, heterogeneity; NR, not reported; PE, pulmonary embolism; RR, risk ratio; SD, standard deviation; VTE, venous thromboembolism. a Where individual studies had either 100% events in both treatment arms, no events in both treatment arms or no SD is reported, a risk estimate for that individual study could not be calculated, and it could not be included in the pooled analysis. Where this has occurred, the actual number of studies and subjects included in the analysis will be stated.
Paediatric population Intravenous ε-aminocaproic acid The results of the systematic review of the use of ε-aminocaproic acid in children undergoing cardiac or scoliosis surgery reported in Schouten (2009)(68) are summarised in Table 8.50. Due to substantial heterogeneity between cardiac surgery trials in the analyses of blood loss, packed red cell transfusion and platelet transfusion (I2=84%, 84% and 95%, respectively), only the results for the analysis of plasma transfusion are reported. This analysis showed that the use of ε-aminocaproic acid in children undergoing cardiac surgery resulted in significantly less transfusion with plasma compared with no ε-aminocaproic acid (WMD: –3 mL/kg; 95%CI: –5, –1). For scoliosis surgery, data were available for only one trial reporting blood loss. This analysis showed no significant difference in blood loss in children undergoing scoliosis surgery for ε-aminocaproic acid compared with no ε-aminocaproic acid (WMD: –59 mL; 95%CI: –262, 144).
Table 8.50 Results for Level I evidence: IV ε-aminocaproic acid versus no ε-aminocaproic acid in paediatric cardiac and scoliosis surgery patients (Schouten, 2009)
Author (year) No. trials (N) ε-aminocaproic acid
No ε-aminocaproic acid
Pooled risk estimate
Volume of allogeneic blood transfusion (plasma)
Mean ± SD WMD: (95%CI) Schouten (2009)(68) 3 trials (N=410) NR NR Cardiac surgery
–3 mL/kg (–5, –1) P=NR (I2=20%)
Volume of blood loss
Mean ± SD WMD: (95%CI) Schouten (2009)(68) 1 trial (N=36) NR NR Scoliosis surgery
–59 mL (–262, 144) P=NR (I2=NA)
Note: ‘No lysine analogue’ group denotes placebo or no treatment. CI, confidence interval; het, heterogeneity; MD, mean difference; NA, not applicable; NR, not reported; standard deviation; WMD, weighted mean difference; SD, standard deviation.
One systematic review was identified which specifically examined a paediatric population and had a more up-to-date literature search than the Schouten review. This Cochrane review, by Tzortzopoulou (2008)(73), examined the use of ε-aminocaproic acid in children undergoing scoliosis surgery. This review included one study not included in the Schouten review, and concluded that ε-aminocaproic acid significantly reduced the volume of blood loss (WMD: –325.00 mL; 95%CI: –586.83, –63.17) compared with no ε-aminocaproic acid. In
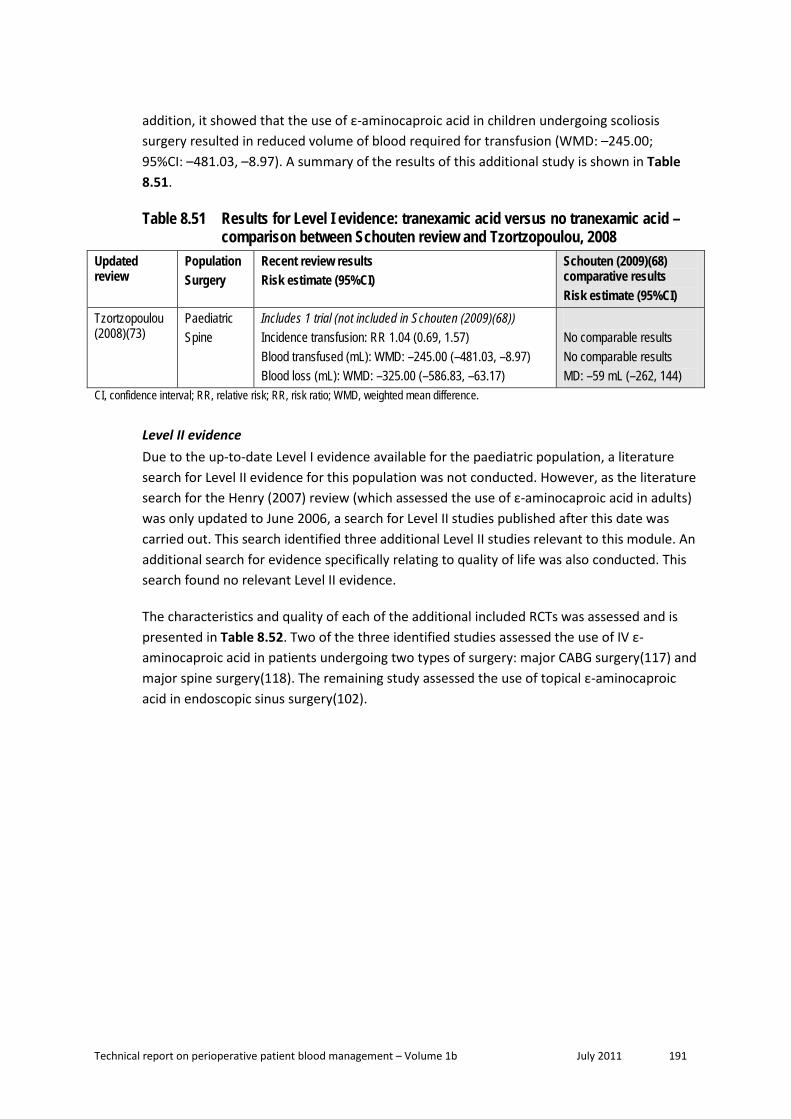
Technical report on perioperative patient blood management – Volume 1b July 2011 191
addition, it showed that the use of ε-aminocaproic acid in children undergoing scoliosis surgery resulted in reduced volume of blood required for transfusion (WMD: –245.00; 95%CI: –481.03, –8.97). A summary of the results of this additional study is shown in Table 8.51.
Table 8.51 Results for Level I evidence: tranexamic acid versus no tranexamic acid – comparison between Schouten review and Tzortzopoulou, 2008
Updated review
Population Surgery
Recent review results Risk estimate (95%CI)
Schouten (2009)(68) comparative results Risk estimate (95%CI)
Tzortzopoulou (2008)(73)
Paediatric Spine
Includes 1 trial (not included in Schouten (2009)(68)) Incidence transfusion: RR 1.04 (0.69, 1.57) Blood transfused (mL): WMD: –245.00 (–481.03, –8.97) Blood loss (mL): WMD: –325.00 (–586.83, –63.17)
No comparable results No comparable results MD: –59 mL (–262, 144)
CI, confidence interval; RR, relative risk; RR, risk ratio; WMD, weighted mean difference.
Level II evidence Due to the up-to-date Level I evidence available for the paediatric population, a literature search for Level II evidence for this population was not conducted. However, as the literature search for the Henry (2007) review (which assessed the use of ε-aminocaproic acid in adults) was only updated to June 2006, a search for Level II studies published after this date was carried out. This search identified three additional Level II studies relevant to this module. An additional search for evidence specifically relating to quality of life was also conducted. This search found no relevant Level II evidence.
The characteristics and quality of each of the additional included RCTs was assessed and is presented in Table 8.52. Two of the three identified studies assessed the use of IV ε-aminocaproic acid in patients undergoing two types of surgery: major CABG surgery(117) and major spine surgery(118). The remaining study assessed the use of topical ε-aminocaproic acid in endoscopic sinus surgery(102).

Technical report on perioperative patient blood management – Volume 1b July 2011 192
Table 8.52 Characteristics of Level II evidence for ε-aminocaproic acid Author (Year) Study quality
Study type Location
Population Surgery
Treatment No. of included subjects
Relevant outcomes
Gharebaghian (2006)(117) Fair
DB RCT Iran
Adult Major CABG surgery
ACA (IV) Placebo (IV)
40 20
Blood loss
Athanasiadis (2007)(102) Fair
DB RCT Australia
Adult Endoscopic sinus surgery
ACA (topical) TXA (topical) Placebo (topical)
10 20 30a
Blood loss (graded)
Berenholtz (2009)(118) Good
DB RCT US
Adult Major spine surgery
ACA (IV) Placebo (IV)
91 91
Transfusion volume Blood loss Mortality Morbidity Otherb
ACA, ε-aminocaproic acid; AP, aprotinin; CABG, coronary artery bypass graft; DB, double-blind; DP, desmopressin; IV, intravenous; RCT, randomised controlled trial; TXA, tranexamic acid. a 30 patients in total included in the study. All patients were undergoing bilateral sinus surgery – the contralateral side received placebo. b Includes hospital costs.
Adult population Intravenous ε-aminocaproic acid The results of the Berenholtz (2009)(118) study, which assessed the use of IV ε-aminocaproic acid in adults undergoing major spine surgery, are summarised in Table 8.53. Only outcomes similar to those already included for the Level I evidence are shown here.
While the results of this study suggest that ε-aminocaproic acid is associated with a statistically significant 30% reduction in postoperative RBC transfusion (2.0 units vs 2.8 units; P=0.03) and a 1-day reduction in ICU length of stay (1.8 days vs 2.8 days; P=0.04), other outcomes including total allogeneic RBC transfusion, total fresh frozen plasma transfusion, total platelet transfusion and total blood product transfusion were not statistically significantly different from placebo. The authors note the variability between transfusion requirements, which resulted in large standard deviations. They state that based on the variability seen, a sample size in the order of > 1000 patients would have been required to detect a 1-unit reduction in total RBC transfusion. They also note that their institution did not have a uniform transfusion policy and that differences between surgeons may have contributed to the variability.

Technical report on perioperative patient blood management – Volume 1b July 2011 193
Table 8.53 Results for Level II evidence: IV ε-aminocaproic acid versus placebo in adults (Berenholtz, 2009)
Author (year) Specific outcome ε-aminocaproic acid
Placebo Statistical significance
Transfusion volume (units)
Mean ± SD (N) P-value Berenholtz (2009)(118)
Total allogeneic RBC 5.9 ± 4.7 (91) 6.9 ± 5.4 (91) 0.18
Berenholtz (2009)(118)
Postoperative RBC 2.0 ± 1.8 (91) 2.8 ± 2.8 (91) 0.03
Berenholtz (2009)(118)
Total FFP 2.8 ± 3.9 (91) 3.5 ± 6.0 (91) 0.37
Berenholtz (2009)(118)
Total platelets 1.2 ± 3.1 (91) 1.2 ± 4.8 (91) 0.23
Berenholtz (2009)(118)
Total blood products 10.4 ± 10.8 (91) 13.0 ± 14.9 (91) 0.17
Blood loss (mL)
Mean ± SD (N) P-value Berenholtz (2009)(118)
Intraoperative blood loss 2938 ± 2315 (91) 3273 ± 2195 (91) 0.32
Berenholtz (2009)(118)
Post-surgery to POD 1 blood loss 3265 ± 2416 (91) 3695 ± 2341 (91) 0.23
Mortality
n/N (%) P-value Berenholtz (2009)(118)
In-hospital mortality 0/91 (0) 1/91 (1.1) 0.32
Morbidity
n/N (%) P-value Berenholtz (2009)(118)
Re-operation due to bleeding 0/91 (0) 2/91 (2.2) 0.16
Berenholtz (2009)(118)
Deep vein thrombosis 0/91 (0) 2/91 (2.2) 0.16
Berenholtz (2009)(118)
Cerebral infarction/transient ischaemic attack
0/91 (0) 1/91 (1.1) 0.32
Berenholtz (2009)(118)
Myocardial infarction 0/91 (0) 0/91 (0) NA
Berenholtz (2009)(118)
Pulmonary embolism 1/91 (1.1) 3/91 (3.3) 0.31
Berenholtz (2009)(118)
Acute renal failure 1/91 (1.1) 1/91 (1.1) 1.0
Berenholtz (2009)(118)
Any thrombotic complication 2/91 (2.2) 6/91 (6.6) 0.15

Technical report on perioperative patient blood management – Volume 1b July 2011 194
Author (year) Specific outcome ε-aminocaproic acid
Placebo Statistical significance
Mean ± SD (N) P-value Berenholtz (2009)(118)
ICU length of stay (days) 1.8 ± 1.6 (91) 2.8 ± 4.6 (91) 0.04
Berenholtz (2009)(118)
Hospital length of stay (days) 8.5 ± 3.9 (91) 9.5 ± 8.6 (91) 0.32
Other
Mean ± SD (N) P-value Berenholtz (2009)(118)
Total hospital charges (US$) 62,344 ± 27,497 (91)
68,670 ± 32,141 (91)
0.16
FFP, fresh frozen plasma; ICU, intensive care unit; NA, not applicable; POD, postoperative day; RBC, red blood cell; SD, standard deviation.
The Gharebaghian (2006)(117) study was conducted at a single centre in Iran and included only 60 subjects: 20 each receiving two different regimens of ε-aminocaproic acid (a post-heparin regimen and a pre-incision regimen) and 20 receiving placebo. The results of this study showed that there was a statistically significant difference in chest tube blood loss following major CABG surgery in adults receiving either regimen of ε-aminocaproic acid at 6 hours asurgery and at the time of removing the chest tube (approximately 300 mL and 900 mL, respectively) compared with placebo (approximately 600 mL and 2000 mL, respectively). The authors also state that there was no difference in chest tube blood loss between the two different ε-aminocaproic acid regimens.
Topical ε-aminocaproic acid One study, conducted in Australia, assessed the use of topical ε-aminocaproic acid in adults undergoing bilateral endoscopic sinus surgery(102). This study enrolled 30 subjects who each received active treatment unilaterally (10 who received topical ε-aminocaproic acid and 20 who received topical tranexamic acid); all 30 subjects received topical placebo on the contralateral side. In this study, blood loss was measured indirectly using two scales: the Wormald grading scale and the Boezaart grading scale. Both scales are not yet validated and grade the level of bleeding (ooze) from 1–10 and 1–5, respectively, at two-minute intervals from 0 to 10 minutes. The results of the analysis of ε-aminocaproic acid versus placebo showed no difference between treatments.
Level III evidence Due to the extensive amount of Level I and II evidence available for this intervention, a search for Level III evidence was not conducted.
A search for evidence specifically relating to quality of life was conducted. This search found no relevant Level III evidence.
Level IV evidence Due to the extensive amount of Level I and II evidence available for this intervention, a search for Level IV evidence was not conducted.

Technical report on perioperative patient blood management – Volume 1b July 2011 195
A search for evidence specifically relating to quality of life was conducted. This search found no relevant Level IV evidence.

Technical report on perioperative patient blood management – Volume 1b July 2011 196
D. DESMOPRESSIN Desmopressin is a synthetic form of vasopressin that is available in injectable, tablet, nasal spray, nasal solution and wafer form in Australia. Desmopressin acts by decreasing urine production. It is registered in Australia for use in the following indications: as an antidiuretic; diabetes insipidus; mild-mod haemophilia A; von Willebrand's disease (excluding type IIB) (pre-dental/ minor surgery); and excessive bleeding associated with platelet disorders. With regards to the use of desmopressin to minimise bleeding and transfusion, the product information states desmopressin is indicated for:
patients undergoing cardiac surgery with cardiopulmonary bypass for prosthetic valve replacement or aortocoronary bypass grafting, especially when it is complicated by platelet function defects sufficient to prolong bleeding time despite relatively normal platelet cover. Desmopressin acetate offers no benefit as routine therapy in patients having an uncomplicated (simple) cardiopulmonary bypass procedure.
Methods
The systematic review process identified 30 studies that assessed the effect of aprotinin, tranexamic acid, ε-aminocaproic acid and desmopressin for minimising perioperative blood loss on morbidity, mortality and transfusion. Due to the large amount of available evidence, Level I studies were only included if they formally pooled the relevant outcome data; this resulted in the exclusion of only three potentially relevant Level I studies.
Of the 30 Level I studies identified, seven studies provided data on desmopressin. As seven studies meeting the requirements of Level I evidence were identified, lower levels of evidence were not comprehensively searched. However, the most comprehensive and recent Level I evidence available for desmopressin was updated only to May 2008(119). Therefore, a search of Level II (RCT) evidence was conducted to identify additional studies published after that date. This search identified no additional RCTs relevant to this review.
The search for evidence of the effectiveness and safety of desmopressin was limited to the comparison between desmopressin and no desmopressin (i.e. no treatment or placebo). Thus, a formal systematic review comparing desmopressin with other active therapies was not conducted.
No socioeconomic literature pertaining to Australia’s Indigenous population was identified in the literature search for this research question.
No published economic evaluations on the use of desmopressin for minimising blood loss were identified in the literature search for this research question.
Level I evidence Seven systematic reviews that included formal meta-analysis of data were identified. All compared desmopressin with no desmopressin (placebo or no treatment). A summary of the key features of the seven identified systematic reviews is provided in Table 8.54. Studies

Technical report on perioperative patient blood management – Volume 1b July 2011 197
have been arranged in order of literature search date to show which of the systematic reviews provide the most up-to-date and comprehensive data.
There is substantial overlap between many of the systematic reviews. As such, a decision was made to limit the consideration of evidence to the most up-to-date and comprehensive reviews for each population and surgery type. For these reasons, the following review provides pivotal evidence and was chosen to form the basis of the guidelines evaluation (shown in shading in Table 8.54):
• Crescenzi (2008)(119) – provides a comprehensive analysis of desmopressin in adults undergoing any type of surgery.
Most other reviews were superseded by the Crescenzi review. The results of the Carless (2008) Cochrane review will be compared with the results of the Crescenzi (2008)(119) review as it has been updated to within a few months of the Crescenzi review. In addition, the results of the recent Gurusamy (2009) review, which assessed the use of desmopressin in adult patients specifically undergoing liver resection, will also be described. As such, these additional reviews are considered to provide supportive evidence.
Table 8.54 Characteristics of Level I evidence for desmopressin Author (Year) Study quality
Date of search
Population Surgery
Treatment No.of included studies
Relevant outcomes
Gurusamy (2009)(69) Cochrane review Fair a
Nov 2008 Adult Liver
DP (IV) AP (IV) TXA (Oral)
1 1 1
Transfusion incidence Transfusion volume Blood loss Mortality Morbidity
Crescenzi (2008)(119) Fair
May 2008 Adult Any
DP (IV) 42 Transfusion incidence Transfusion volume Blood loss Mortality Reoperation Morbidity
Carless (2008)(1) Cochrane review Good
March 2008 Adult Any
DP (IV) 29 Transfusion incidence Transfusion volume Blood loss Mortality Reoperation Morbidity
Levi (1999)(81) Dec 1999 Adult Cardiac
DP (IV) AP (IV) TXA/ACA (IV)
16 45 17
Transfusion incidence Transfusion volume Blood loss Mortality Reoperation Morbidity

Technical report on perioperative patient blood management – Volume 1b July 2011 198
Author (Year) Study quality
Date of search
Population Surgery
Treatment No.of included studies
Relevant outcomes
Laupacis (1997)(83) Mar 1997 Adult Cardiac
DP (IV) AP (IV) TXA (IV) ACA (IV)
12 45 12 3
Transfusion incidence
Cattaneo (1995)(120) Nov 1993 Adult Cardiac
DP (IV) 17 Transfusion volume Blood loss
Fremes (1994)(84) Jun 1993 Adult Cardiac
DP (IV) AP (IV) TXA (IV) ACA (IV)
13 14 2 2
Transfusion incidence Transfusion volume Blood loss Mortality Reoperation
Note: Systematic reviews which form the basis of this evaluation are shown in dark shading (pivotal review). Systematic reviews which include literature searches which are similarly up-to-date compared with the core review are shown in light shading (supportive review). Only treatments relevant to this guideline are shown here. Relevant treatments not assessed in this section of the report are shown in italics. Treatments were assumed to be given intravenously if the mode of administration was not specifically stated as intravenous, topical or oral. ACA, ε-aminocaproic acid; AP, aprotinin; CABG, coronary artery bypass graft; DP, desmopressin; IV, intravenous; TXA, tranexamic acid. a This was a good quality systematic review including data from one fair quality RCT for desmopressin.
The results of the comprehensive systematic review by Crescenzi (2008)(119), which assessed the use of IV desmopressin in adults, are summarised in Table 8.55. This review was considered to be of fair methodological quality due to a lack of formal quality assessment or investigation of heterogeneity (although a random effects model was used in cases where there was statistically significant heterogeneity; P<0.1).
The dose of desmopressin varied slightly across the 42 studies included in the Crescenzi review, being mostly a single 0.3 μg/kg dose administered over 15–30 minutes during surgical haemostasis(119). In six studies the dose was repeated and in 8 studies it was administered immediately before surgery.
The results of the analyses suggest that while desmopressin does not reduce the number of patients requiring transfusion, transfusion volume and blood loss are significantly reduced in some cases, although this is not consistent between different surgical types, as described below:
• The results of the analysis show that desmopressin does not significantly reduce the requirement for transfusion of blood products (including red blood cells [RBCs], fresh frozen plasma [FFP] and platelets) for cardiac surgery or noncardiac surgery (odds ratio [OR] 0.87; 95%CI: 0.68, 1.11 and OR 0.93; 95%CI: 0.48, 1.79, respectively). Similarly, there was no reduction in the number of patients requiring transfusion with platelets only for desmopressin compared with no desmopressin (OR 0.64; 95%CI: 0.41, 1.01).
• Significantly less blood was transfused in patients on desmopressin compared with no desmopressin following any surgery (standardised mean difference [SMD] –0.29; 95%CI: –0.52, –0.06) and the subgroup undergoing noncardiac surgery (SMD: –0.45; 95%CI: –0.77,

Technical report on perioperative patient blood management – Volume 1b July 2011 199
–0.13). There was no significant difference following cardiac surgery (SMD: –0.22; 95%CI: –0.52, 0.08).
• The volume of blood loss was significantly reduced in patients on desmopressin compared with no desmopressin following any surgery (SMD: –0.20; 95%CI: –0.34, –0.06) and cardiac surgery (SMD: –0.23; 95%CI: –0.40, –0.05). There was no significant difference in blood loss following noncardiac surgery (SMD: –0.10; 95%CI: –0.28, 0.07).
The authors state in the abstract that the statistically significant differences in blood loss and transfusion volume for ‘any surgery’ equate to a 79 mL reduction in blood loss and a reduction in transfusion volume of 0.3 units(119). Analyses using these units (rather than SMDs) are not presented in the publication.
Treatment with desmopressin did not result in a statistically significantly increased rate of mortality compared with no treatment with desmopressin (OR 1.25; 95%CI: 0.51, 3.04) although the OR was ≥ 1 for noncardiac surgery (based on the results of one trial only) and cardiac surgery (OR 5.84; 95%CI: 0.27, 125.19 and OR 1.00; 95%CI: 0.38, 2.62, respectively).
Desmopressin use resulted in a large and statistically significantly increased risk of post-administration hypotension (OR 8.92; 95%CI: 2.54, 31.37 for cardiac surgery and OR 3.04; 95%CI: 1.18, 7.87 for noncardiac surgery) (119). Crescenzi et al. note that hypotension was transient and not related to any other side effect. There was no statistically significant effect of desmopressin on the rate of reoperation for bleeding, MI or other thromboses.
Table 8.55 Results for Level I evidence: desmopressin versus no desmopressin in adults (Crescenzi, 2008)
Author (year) No. trials (N) No. trials included in analysis (N)a
Desmopressin No desmopressin
Pooled risk estimate
Transfusion incidence: blood products (RBCs, FFP, platelets)
n/N (%) OR (95%CI) Crescenzi (2008)(119) 22 trials (N=1488)
21 trials (N=1429) 411/746 (55.1) 430/743 (57.9) All studies
0.88 (0.70, 1.10) P=0.26 (Phet=0.19)
By surgery type
Crescenzi (2008)(119) 17 trials (N=1272)
16 trials (N=1213) 350/638 (54.9) 367/634 (57.9) Cardiac surgery
0.87 (0.68, 1.11) P=0.26 (Phet=0.07)
Crescenzi (2008)(119) 5 trials (N=216) 61/108 (56.5) 63/108 (58.3) Noncardiac surgery 0.93 (0.48, 1.79) P=0.83 (Phet=0.81)

Technical report on perioperative patient blood management – Volume 1b July 2011 200
Author (year) No. trials (N) No. trials included in analysis (N)a
Desmopressin No desmopressin
Pooled risk estimate
Transfusion incidence: platelets
n/N (%) OR (95%CI) Crescenzi (2008)(119) 11 trials (N=769) 37/386 (9.6) 53/383 (13.8) Cardiac surgery
0.64 (0.41, 1.01) P=0.06 (Phet=0.22)
Transfusion volume (units)
Mean ± SD SMD: (95%CI) Crescenzi (2008)(119) 34 trials (N=2065) NR NR All studies
–0.29 (–0.52, –0.06) P=0.01 (Phet<0.001)
By surgery type
Crescenzi (2008)(119) 23 trials (N=1607) NR NR Cardiac surgery –0.22 (–0.52, 0.08) P=0.14 (Phet<0.001)
Crescenzi (2008)(119) 11 trials (N=458) NR NR Noncardiac surgery –0.45 (–0.77, –0.13) P=0.006 (Phet=0.003)
Blood loss (mL)
Mean ± SD SMD: (95%CI) Crescenzi (2008)(119) 40 trials (N=2445) NR NR All studies
–0.20 (–0.34, –0.06) P=0.004 (Phet<0.001)
By surgery type
Crescenzi (2008)(119) 29 trials (N=1928) NR NR Cardiac surgery –0.23 (–0.40, –0.05) P=0.01 (Phet<0.001)
Crescenzi (2008)(119) 11 trials (N=517) NR NR Noncardiac surgery –0.10 (–0.28, 0.07) P=0.25 (Phet=0.45)
Reoperation for bleeding
n/N (%) OR (95%CI) Crescenzi (2008)(119) 25 trials (N=1542)
15 trials (N=1186) 21/763 (2.8) 34/779 (4.4) All studies
0.65 (0.39, 1.09) P=0.11 (Phet=0.50)

Technical report on perioperative patient blood management – Volume 1b July 2011 201
Author (year) No. trials (N) No. trials included in analysis (N)a
Desmopressin No desmopressin
Pooled risk estimate
By surgery type
Crescenzi (2008)(119) 18 trials (N=1304)
14 trials (N=1136) 18/647 (2.8) 31/657 (4.7) Cardiac surgery
0.63 (0.36, 1.08) P=0.09 (Phet=0.44)
Crescenzi (2008)(119) 7 trials (N=238) 1 trial (N=50)
3/116 (2.6) 3/122 (2.5) Noncardiac surgery 1.00 (0.18, 5.51) P=1.0 (Phet=NA)
Mortality
n/N (%) OR (95%CI) Crescenzi (2008)(119) 23 trials (N=1539)
8 trials (N=673) 9/771 (1.2) 7/768 (0.9) All studies
1.25 (0.51, 3.04) P=0.63 (Phet=0.76)
By surgery type
Crescenzi (2008)(119) 19 trials (N=1334) 7 trials (N=582)
7/674 (1.0) 7/660 (1.1) Cardiac surgery 1.00 (0.38, 2.62) P=1.00 (Phet=0.81)
Crescenzi (2008)(119) 4 trials (N=205)
1 trial (N=91) 2/97 (2.1) 0/108 (0) Noncardiac surgery
5.84 (0.27, 125.19) P=0.26 (Phet=NA)
Hypotension
n/N (%) OR (95%CI) Crescenzi (2008)(119) 18 trials (N=882)
7 trials (N=320) 37/450 (8.2) 9/432 (2.1) All studies
4.84 (2.31, 10.13) P<0.001 (Phet=0.85)
By surgery type Crescenzi (2008)(119) 13 trials (N=717)
5 trials (N=221) 19/368 (5.2) 1/349 (0.3) Cardiac surgery
8.92 (2.54, 31.37) P<0.001 (Phet=0.94)
Crescenzi (2008)(119) 5 trials (N=165) 2 trials (N=99)
18/82 (22.0) 8/83 (9.6) Noncardiac surgery 3.04 (1.18, 7.87) P=0.02 (Phet=0.64)
Myocardial infarction
n/N (%) OR (95%CI) Crescenzi (2008)(119) 27 trials (N=1609)
13 trials (N=916) 31/816 (3.8) 23/793 (2.9) All studies
1.27 (0.73, 2.20) P=0.40 (Phet=0.88)

Technical report on perioperative patient blood management – Volume 1b July 2011 202
Author (year) No. trials (N) No. trials included in analysis (N)a
Desmopressin No desmopressin
Pooled risk estimate
By surgery type
Crescenzi (2008)(119) 19 trials (N=1262)
11 trials (N=775) 28/648 (4.3) 19/614 (3.1) Cardiac surgery
1.36 (0.75, 2.48) P=0.31 (Phet=0.86)
Crescenzi (2008)(119) 8 trials (N=347) 2 trials (N=141)
3/168 (1.8) 4/179 (2.2) Noncardiac surgery 0.84 (0.20, 3.53) P=0.81 (Phet=0.35)
Thromboses (other than myocardial infarction)
n/N (%) OR (95%CI) Crescenzi (2008)(119) 26 trials (N=1776)
14 trials (N=1151) 26/899 (2.9) 22/877 (2.5) All studies
1.20 (0.68, 2.09) P=0.53 (Phet=0.82)
By surgery type
Crescenzi (2008)(119) 18 trials (N=1400) 11 trials (N=931)
18/717 (2.5) 14/683 (2.0) Cardiac surgery 1.27 (0.64, 2.50) P=0.49 (Phet=0.86)
Crescenzi (2008)(119) 8 trials (N=376) 3 trials (N=220)
8/182 (4.4) 8/194 (4.1) Noncardiac surgery 1.06 (0.39, 2.84) P=0.92 (Phet=0.24)
CI, confidence interval; het, heterogeneity; NA, not applicable; NR, not reported; OR, odds ratio; SD, standard deviation; SMD, standardised mean difference. a Where individual studies had either 100% events in both treatment arms, no events in both treatment arms or no SD was reported, a risk estimate for that individual study could not be calculated, and it could not be included in the pooled analysis. Where this has occurred, the actual number of studies and subjects included in the analysis will be stated.
One Cochrane Review(1), considered to be of good methodological quality, included a literature search updated to within a few months of the Crescenzi (2008) review and is included here as supportive evidence. The Carless review included only 29 studies, compared with the 42 studies included in the Crescenzi review. All studies included in the Carless review were included in the Crescenzi review. The difference in the number of included studies is likely to be at least partly due to the slightly different inclusion criteria used in the two reviews: in the Crescenzi review, any type of surgery was eligible for inclusion while in the Carless review, only elective or non-urgent surgery was eligible for inclusion.
A comparison of the findings of the Carless and Crescenzi reviews is presented in Table 8.56. The results of these reviews are generally consistent, showing no difference between treatment arms in the risk of requiring a transfusion for any surgery or the subgroup undergoing cardiac surgery. Due to the difference in risk estimates reported by Crescenzi and Carless for continuous outcomes (SMD: and weighted mean difference [WMD], respectively), it is difficult to directly compare the results for transfusion volume and blood loss. However, while there were some results which were statistically significant in one study and not statistically significant in the other, the results were generally of similar magnitude.

Technical report on perioperative patient blood management – Volume 1b July 2011 203
Similar results were seen between the Carless (2008) and Crescenzi (2008)(119) reviews for mortality and morbidity outcomes, with the majority not being statistically significant. However, the risk point estimates were generally higher in the Carless study than in the Crescenzi study, as shown by the results for mortality (RR 1.72; 95%CI: 0.68, 4.33 vs OR 1.25; 95%CI: 0.51, 3.04, in Carless and Crescenzi, respectively), reoperation (RR 0.69; 95%CI: 0.26, 1.83 vs OR 0.65; 95%CI: 0.39, 1.09, respectively), MI (RR 1.38; 95%CI: 0.77, 2.50 vs OR 1.27; 95%CI: 0.73, 2.20, respectively) and any thrombosis (RR 1.46; 95%CI: 0.64, 3.35 vs OR 1.20; 95%CI: 0.68, 2.09). A statistically significant increase in risk of hypotension was seen in both reviews (RR 2.81; 95%CI: 1.50, 5.27 for Carless [2008] vs OR 4.84; 95%CI: 2.31, 10.13 for Crescenzi [2008]).
The direction and magnitude of the risks of mortality, MI and thrombosis associated with desmopressin in the Carless review suggest that desmopressin may potentially be associated with an increased risk for these outcomes. The lack of a statistically significant difference may be because the number of subjects included in these analyses is not sufficient to detect a difference between desmopressin and no desmopressin for these relatively rare outcomes.
The risk of stroke was examined in the Carless (2008) review but not the Crescenzi (2008)(119) review. The risk of stroke was more than twice as great for patients receiving desmopressin compared with no desmopressin (RR 2.40; 95%CI: 0.68, 8.43). While this result did not reach statistical significance, this is possibly due to a lack of statistical power rather than a lack of risk associated with desmopressin.
Extensive additional subgroup analyses were conducted in the Carless (2008) review, including analysis of transfusion incidence by (i) type of cardiac surgery (primary CABG vs CABG + valve surgery ± combination/redo surgery); (ii) cardiac surgery ± acetylsalicylic acid use; (iii) ± transfusion protocol; and (iv) ± autologous techniques used. The results of these analyses were consistent with the analyses of all surgery, cardiac surgery and miscellaneous surgery, with the exception of a statistically significant reduction in the incidence of transfusion in patients receiving desmopressin compared with no desmopressin in the subgroup of patients undergoing primary CABG (RR 0.80; 95%CI: 0.73, 0.99).
Table 8.56 Results for Level I evidence: desmopressin versus no desmopressin in adults (Carless, 2008)
Author (year) No. trials (N) No. trials included in analysis (N)a
Desmopressin No desmopressin
Pooled risk estimate
Pooled risk estimate Crescenzi (2008)(119)
Transfusion incidence: allogeneic blood
n/N (%) RR (95%CI) OR (95%CI) Carless (2008)(1) 19 trials (N=1387)
17 trials (N=1308) 383/703 (54.5) 377/684 (55.1) All studies
0.96 (0.87, 1.06) P=0.42 (Phet=0.19)
All studies/blood products 0.88 (0.70, 1.10) P=0.26 (Phet=0.19)
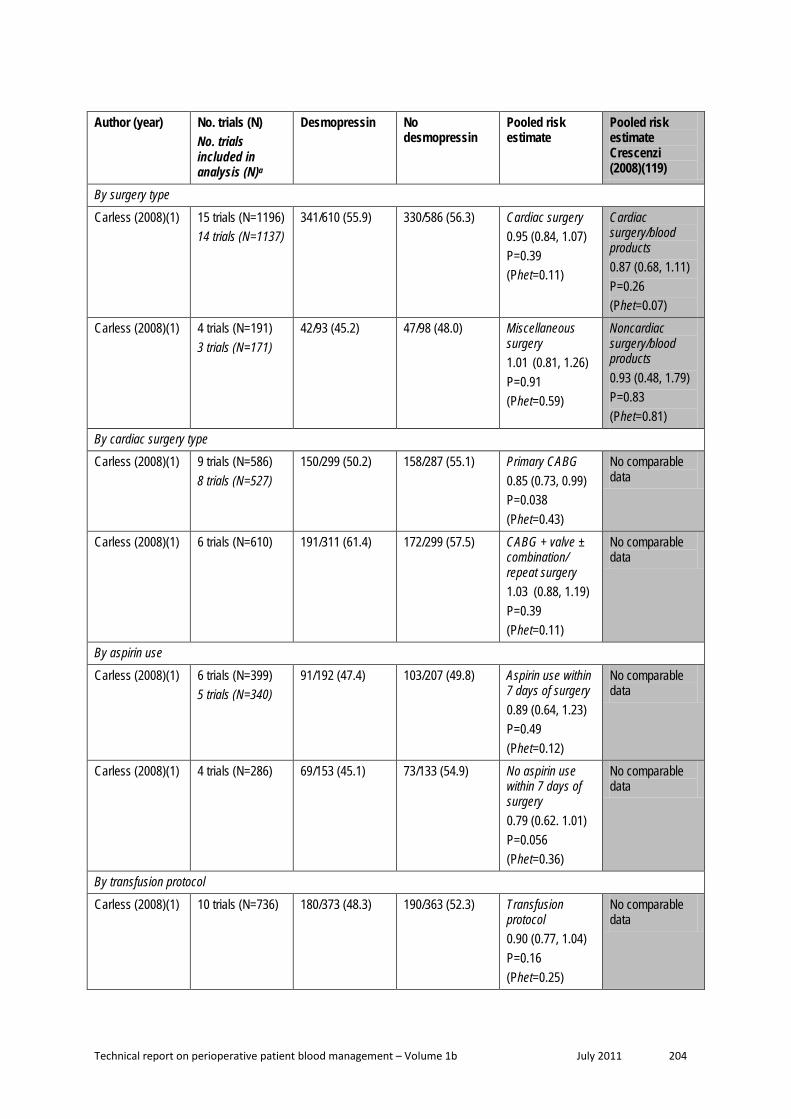
Technical report on perioperative patient blood management – Volume 1b July 2011 204
Author (year) No. trials (N) No. trials included in analysis (N)a
Desmopressin No desmopressin
Pooled risk estimate
Pooled risk estimate Crescenzi (2008)(119)
By surgery type
Carless (2008)(1) 15 trials (N=1196) 14 trials (N=1137)
341/610 (55.9) 330/586 (56.3) Cardiac surgery 0.95 (0.84, 1.07) P=0.39 (Phet=0.11)
Cardiac surgery/blood products 0.87 (0.68, 1.11) P=0.26 (Phet=0.07)
Carless (2008)(1) 4 trials (N=191) 3 trials (N=171)
42/93 (45.2) 47/98 (48.0) Miscellaneous surgery 1.01 (0.81, 1.26) P=0.91 (Phet=0.59)
Noncardiac surgery/blood products 0.93 (0.48, 1.79) P=0.83 (Phet=0.81)
By cardiac surgery type
Carless (2008)(1) 9 trials (N=586) 8 trials (N=527)
150/299 (50.2) 158/287 (55.1) Primary CABG 0.85 (0.73, 0.99) P=0.038 (Phet=0.43)
No comparable data
Carless (2008)(1) 6 trials (N=610)
191/311 (61.4) 172/299 (57.5) CABG + valve ± combination/ repeat surgery 1.03 (0.88, 1.19) P=0.39 (Phet=0.11)
No comparable data
By aspirin use
Carless (2008)(1) 6 trials (N=399) 5 trials (N=340)
91/192 (47.4) 103/207 (49.8) Aspirin use within 7 days of surgery 0.89 (0.64, 1.23) P=0.49 (Phet=0.12)
No comparable data
Carless (2008)(1) 4 trials (N=286)
69/153 (45.1) 73/133 (54.9) No aspirin use within 7 days of surgery 0.79 (0.62. 1.01) P=0.056 (Phet=0.36)
No comparable data
By transfusion protocol
Carless (2008)(1) 10 trials (N=736)
180/373 (48.3) 190/363 (52.3) Transfusion protocol 0.90 (0.77, 1.04) P=0.16 (Phet=0.25)
No comparable data

Technical report on perioperative patient blood management – Volume 1b July 2011 205
Author (year) No. trials (N) No. trials included in analysis (N)a
Desmopressin No desmopressin
Pooled risk estimate
Pooled risk estimate Crescenzi (2008)(119)
Carless (2008)(1) 9 trials (N=651) 7 trials (N=572)
203/330 (61.5) 73/133 (58.3) No transfusion protocol 1.03 (0.93, 1.14) P=0.60 (Phet=0.40)
No comparable data
By autologous technique
Carless (2008)(1) 10 trials (N=732) 9 trials (N=673)
242/382 (63.4) 237/350 (67.7) No autologous techniques used 0.91 (0.78, 1.07) P=0.25 (Phet=0.04)
No comparable data
Carless (2008)(1) 9 trials (N=655) 8 trials (N=635)
141/321 (43.9) 140/334 (41.9) Autologous techniques used (ANH, PAD, CS) 1.00 (0.84. 1.19) P=0.97 (Phet=0.31)
No comparable data
By study qualityb
Carless (2008) (1) 3 trials (N=249) 2 trials (N=190)
73/124 (58.9) 74/125 (59.2) Quality A 0.97 (0.75, 1.24) P=0.80 (Phet=0.50)
No comparable data
Carless (2008)(1) 11 trials (N=766) 10 trials (N=746)
219/400 (54.8) 215/366 (58.7) Quality B 0.88 (0.75, 1.03) P=0.12 (Phet=0.04)
No comparable data
Carless (2008)(1) 5 trials (N=372) 91/179 (50.8) 88/193 (45.6) Quality C 1.11 (0.94, 1.33) P=0.22 (Phet=0.75)
No comparable data
Transfusion volume (units)
Mean ± SD WMD: (95%CI) SMD: (95%CI) Carless (2008)(1) 14 trials (N=885) NR NR All surgery/all
patients –0.30 (–0.60, –0.01) P=0.042 (Phet=0.07)
All surgery/all patients –0.29 (–0.52, –0.06) P=0.01 (Phet<0.001)

Technical report on perioperative patient blood management – Volume 1b July 2011 206
Author (year) No. trials (N) No. trials included in analysis (N)a
Desmopressin No desmopressin
Pooled risk estimate
Pooled risk estimate Crescenzi (2008)(119)
Carless (2008)(1) 5 trials (N=211) NR NR All surgery/ transfused patients –0.49 (–0.94, –0.04) P=0.033 (Phet=0.49)
No comparable data
By surgery type
Carless (2008)(1) 10 trials (N=621) NR NR Cardiac surgery/all patients –0.39 (–0.77, –0.01) P=0.047 (Phet=0.03)
Cardiac surgery/all patients –0.22 (–0.52, 0.08) P=0.14 (Phet<0.001)
Carless (2008)(1) 2 trials (N=129) NR NR Orthopaedic surgery/all patients –0.15 (–0.64, 0.33) P=0.54 (Phet=0.43)
Noncardiac surgery/all patients –0.45 (–0.77, –0.13) P=0.006 (Phet=0.003)
Carless (2008)(1) 2 trials (N=135) NR NR Vascular surgery/all patients 0.06 (–0.89, 1.02) P=0.90 (Phet=0.40)
By autologous technique
Carless (2008)(1) 10 trials (N=734) NR NR No autologous techniques used –0.22 (–0.55, 0.10) P=0.18 (Phet=0.19)
No comparable data
Carless (2008)(1) 4 trials (N=151) NR NR Autologous techniques used (ANH, PAD, CS) –0.47 (–1.15. 0.20) P=0.17 (Phet=0.08)
No comparable data
Blood loss (mL)
Mean ± SD WMD: (95%CI) SMD: (95%CI)

Technical report on perioperative patient blood management – Volume 1b July 2011 207
Author (year) No. trials (N) No. trials included in analysis (N)a
Desmopressin No desmopressin
Pooled risk estimate
Pooled risk estimate Crescenzi (2008)(119)
Carless (2008)(1) 7 trials (N=493) NR NR All surgery/intraoperative blood loss –90 (–200, 19) P=0.11 (Phet=0.17)
No comparable data
Carless (2008)(1) 18 trials (N=1201) NR NR All surgery/postoperative blood loss –93 (–150, –36) P=0.0014 (Phet=0.001)
No comparable data
Carless (2008)(1) 10 trials (N=669) NR NR All surgery/total blood loss –242 (–388, –96) P=0.0012 (Phet=0.002)
All studies/total blood loss –0.20 (–0.34, –0.06) P=0.004 (Phet<0.001)
By time-period (postoperative)
Carless (2008) 1 trial (N=59) NR NR All surgery/0–6 hrs –98 (–305, 109) P=0.35 (Phet=NA)
No comparable data
Carless (2008)(1) 3 trials (N=333) NR NR All surgery/0–12 hrs –114 (–269, 41) P=0.15 (Phet=0.004)
No comparable data
Carless (2008)(1) 2 trials (N=122) NR NR All surgery/0–16 hrs –18 (–113, 77) P=0.71 (Phet=0.42)
No comparable data
Carless (2008)(1) 12 trials (N=787) NR NR All surgery/0–24 hrs –100 (–176, –24) P=0.0097 (Phet=0.004)
No comparable data
By surgery type

Technical report on perioperative patient blood management – Volume 1b July 2011 208
Author (year) No. trials (N) No. trials included in analysis (N)a
Desmopressin No desmopressin
Pooled risk estimate
Pooled risk estimate Crescenzi (2008)(119)
Carless (2008)(1) 3 trials (N=229) NR NR Cardiac surgery/intraoperative blood loss –120 (–315, 75) P=0.23 (Phet=0.06)
No comparable data
Carless (2008)(1) 16 trials (N=1107) NR NR Cardiac surgery/postoperative blood loss –97 (–163, –30) P=0.0044 (Phet<0.001)
No comparable data
Carless (2008)(1) 7 trials (N=496) NR NR Cardiac surgery/total blood loss –238 (–413, –62) P=0.0079 (Phet<0.001)
Cardiac surgery/total blood loss –0.23 (–0.40, –0.05) P=0.01 (Phet<0.001)
Reoperation for bleeding
n/N (%) RR (95%CI) OR (95%CI) Carless (2008)(1) 11 trials (N=778)
13 trials (N=693) 7/383 (1.8) 14/395 (3.5) All surgery
0.69 (0.26, 1.83) P=0.45 (Phet=0.39)
All studies 0.65 (0.39,1.09) P=0.11 (Phet=0.50)
Mortality
n/N (%) RR (95%CI) OR (95%CI) Carless (2008)(1) 12 trials (N=1061)
8 trials (N=774) 13/534 (2.4) 7/527 (1.3) All surgery
1.72 (0.68, 4.33) P=0.25 (Phet=0.80)
All studies 1.25 (0.51, 3.04) P=0.63 (Phet=0.76)
Hypotension
n/N (%) RR (95%CI) OR (95%CI) Carless (2008)(1) 5 trials (N=183) 34/92 (37.0) 9/91 (9.9) All surgery/hypo-
tension requiring treatment 2.81 (1.50, 5.27) P=0.0013 (Phet=0.50)
All surgery 4.84 (2.31, 10.13) P<0.001 (Phet=0.85)
Myocardial infarction
n/N (%) RR (95%CI) OR (95%CI)

Technical report on perioperative patient blood management – Volume 1b July 2011 209
Author (year) No. trials (N) No. trials included in analysis (N)a
Desmopressin No desmopressin
Pooled risk estimate
Pooled risk estimate Crescenzi (2008)(119)
Carless (2008)(1) 12 trials N=876) 9 trials (N=731)
28/441 (6.3) 18/435 (4.1) All surgery 1.38 (0.77, 2.50) P=0.28 (Phet=0.87)
All studies 1.27 (0.73, 2.20) P=0.40 (Phet=0.88)
Any thrombosis
n/N (%) RR (95%CI) OR (95%CI) Carless (2008)(1) 9 trials (N=691)
7 trials (N=591) 14/361 (3.9) 10/330 (3.0) All surgery
1.46 (0.64, 3.35) P=0.37 (Phet=0.78)
All studies/ thromboses other than MI 1.20 (0.68, 2.09) P=0.53 (Phet=0.82)
ANH, acute normovolaemic haemodilution; CI, confidence interval; CS, cell salvage; het, heterogeneity; NA, not applicable; NR, not reported; OR, odds ratio; PAD, preoperative autologous donation; SD, standard deviation; SMD, standardised mean difference. a Where individual studies had either 100% events in both treatment arms, no events in both treatment arms or no SD was reported, a risk estimate for that individual study could not be calculated, and it could not be included in the pooled analysis. Where this has occurred, the actual number of studies and subjects included in the analysis will be stated. b Study quality based on a rating of allocation concealment where ‘A’ denotes adequate concealment, ‘B’ denotes uncertain allocation concealment and ‘C’ denotes inadequate allocation concealment.
One additional recent review provides data specifically on liver resection(69). This review identified only one relevant desmopressin study, which was already included in the Crescenzi review. While it will not be presented in detail here, the results of this study showed that the use of desmopressin therapy to prevent blood loss associated with liver resection does not appear to reduce the requirement for transfusion (RR 0.58; 95%CI: 0.15, 2.21), or reduce transection blood loss (MD: –45 mL; 95%CI: –627, 537) or operative blood loss (MD: 33 mL; 95%CI: –696, –761). However, this study was very small (N=59).
Level II evidence The literature search for the pivotal Crescenzi (2008) review was only updated to May 2008. Thus, a search for Level II studies published after this date was carried out. No additional Level II studies were identified.
A search for evidence specifically relating to quality of life was conducted and was not restricted by study type. This search found no relevant Level II evidence.
Level III evidence Due to the amount of Level I evidence available for this intervention, a search for Level III evidence was not conducted, except for quality-of-life data. No relevant studies were identified.

Technical report on perioperative patient blood management – Volume 1b July 2011 210
Level IV evidence Due to the amount of Level I evidence available for this intervention, a search for Level IV evidence was not conducted, except for quality-of-life data. No relevant studies were identified.

Technical report on perioperative patient blood management – Volume 1b July 2011 211
9 Appropriate pat ient posit ioning
Methods
The systematic review process identified no Level I evidence relevant to this research question. A literature search for Level II evidence identified six relevant RCTs examining the effect of appropriate patient positioning during surgery.
No socioeconomic literature pertaining to Australia’s Indigenous population was identified in the literature search for this research question.
No published economic evaluations analysis on the use of appropriate patient positioning for minimising blood loss were identified in the literature search for this research question.
Level I evidence No Level I evidence examining the effect of appropriate patient positioning during surgery on morbidity, mortality and blood transfusion were identified by the literature search.
Level II evidence A literature search for Level II evidence identified six relevant RCTs examining the effect of appropriate patient positioning during surgery(121-126). The studies examined the use of alternative patient positions during a variety of surgical procedures. The main characteristics of these studies are summarised in Table 9.1.
Table 9.57 Characteristics and quality of Level II evidence for appropriate patient positioning during surgery
Author (Year)
Study type Study quality
Sample size
Patient population / Setting Relevant outcomes
De Sio (2008)(121)
RCT Good
N=75 Patients undergoing nephrolithotomy. Medical institutions in Italy.
Morbidity Haemoglobin concentration Hospital stay Surgery duration
Ko (2008)(122)
RCT Fair
N=60 Patients undergoing endoscopic sinus surgery. Hospital in Taiwan.
Blood loss Surgery duration
Pace (2008)(123)
RCT Fair
N=101 Patients undergoing hip arthroplasty. Hospital in United Kingdom.
Transfusion volume Blood loss Morbidity Haemoglobin concentration
Ong (2003)(124)
RCT Fair
N=60 Patients undergoing primary unilateral total knee replacement for osteoarthritis. Hospital in United Kingdom.
Transfusion volume Haemoglobin concentration

Technical report on perioperative patient blood management – Volume 1b July 2011 212
Author (Year)
Study type Study quality
Sample size
Patient population / Setting Relevant outcomes
Widman (2001)(125)
RCT Fair
N=74 Patients undergoing hip replacement surgery. Hospital in Sweden.
Transfusion incidence Transfusion volume Blood loss Surgery duration
Park (2000)(126)
RCT Good
N=40 ASA class I and II patients undergoing posterior lumbar spinal surgery. Hospital in South Korea.
Transfusion incidence Transfusion volume Blood loss Haemoglobin concentration Surgery duration
ASA, American Society of Anaesthesiologists; RCT, randomised controlled trial.
Of the six included RCTs, two were considered to be of good quality(121;126), while the remaining four were of fair quality(122-125). The results from the included Level II studies are summarised in Table 9.2.
Table 9.58 Results for Level II evidence: appropriate patient positioning during surgery versus usual positioning
Author Surgical procedure Patient position: Intervention / Comparator
Intervention Comparator Statistical significance
Incidence of transfusion
n/N (%)
Pace (2008)(123)
Hip arthroplasty Lateral position / Supine position
5/51 (9.8) 8/50 (16) P=0.65
Ong (2003)(124)
Knee replacement for osteoarthritis
Intervention A: Leg elevated with knee flexed Intervention B: Leg elevated with knee extended Comparator: Knee extended and level with bed
A B 11/20 (55) P=0.3
7/20 (35) 7/20 (35)
Widman (2001)(125)
Hip replacement surgery Lateral position / Supine position
17/30 (57) 30/44 (68) P=0.336
Park (2000)(126)
Lumbar spinal surgery Narrow pad width on support / Wide pad width on spinal support
5/20 (25) 1/20 (5) NS
Volume of transfusion
Blood transfusion volume (units) Median (range)
Ong (2003)(124)
Knee replacement for osteoarthritis
Intervention A: Leg elevated with knee flexed Intervention B: Leg elevated with knee extended Comparator: Knee extended and level with bed
A B
2 (0, 3.5) P=0.3 0 (0, 2) 0 (0, 2)

Technical report on perioperative patient blood management – Volume 1b July 2011 213
Author Surgical procedure Patient position: Intervention / Comparator
Intervention Comparator Statistical significance
Blood transfusion volume (units) Mean (SD)
Park (2000)(126)
Lumbar spinal surgery Narrow pad width on support / Wide pad width on spinal support
2.2 (NR) 2 (NR) NS
Blood transfusion volume (mL) Mean (SD)
Widman (2001)(125)
Hip replacement surgery Lateral position / Supine position
321 (341) 407 (362) P=0.307
Blood loss
Blood loss (mL) Mean (SD)
Ko (2008)(122)
Endoscopic sinus surgery Reverse Trendelenburg position / Supine position
126.0 (85.8) 251.7 (139.1) P<0.001
Widman (2001)(125)
Hip replacement surgery Lateral position / Supine position
Intraoperative: 508 (316) After 24 hour: 1273 (407)
723 (316) 1374 (458)
P=0.001 P=0.043
Park (2000)(126)
Lumbar spinal surgery Narrow pad width on support / Wide pad width on spinal support
878 (521) 436 (159) P<0.05
Blood loss (mL) Mean (95%CI)
Pace (2008)(123)
Hip arthroplasty Lateral position / Supine position
1129 (989, 1310)
1156 (954, 1265) P=0.41
Morbidity
Major complications a n/N (%)
De Sio (2008)(121)
Nephrolithotomy Modified supine position b / Prone position
1/39 (2.6) 0/36 (0) P=0.2
Minor complications c n/N (%)
De Sio (2008)(121)
Nephrolithotomy Modified supine position b / Prone position
7/39 (18) 5/36 (14) P=0.16
Incidence of DVT n/N (%)
Ong (2003)(124)
Knee replacement for osteoarthritis
Intervention A: Leg elevated with knee flexed Intervention B: Leg elevated with knee extended Comparator: Knee extended and level with bed
A B 0/20 (0) NR
1/20 (5) 1/20 (5)

Technical report on perioperative patient blood management – Volume 1b July 2011 214
Author Surgical procedure Patient position: Intervention / Comparator
Intervention Comparator Statistical significance
Pace (2008)(123)
Hip arthroplasty Lateral position / Supine position
1/51 (1.9) 0/50 (0) NS
Knee Swelling (cm) Mean (range)
Ong (2003)(124)
Knee replacement for osteoarthritis
Intervention A: Leg elevated with knee flexed Intervention B: Leg elevated with knee extended Comparator: Knee extended and level with bed
A B 3.8
(1.5, 8.0) P=0.6 3.4
(1.0, 7.0) 3.3
(1.5, 8.0)
Wound infection n/N (%)
Pace (2008)(123)
Hip arthroplasty Lateral position / Supine position
0/51 (0) 2/50 (4) NS
Length of hospital stay
Hospital stay (days)
Mean (range)
De Sio (2008)(121)
Nephrolithotomy Modified supine position b / Prone position
4.3 (2.2, 8.4) 4.1 (2.4, 7.8) P=0.18
Haemoglobin concentration
Change in haemoglobin levels (g/dL) Mean (range)
De Sio (2008)(121)
Nephrolithotomy Modified supine position b / Prone position
–2.3 (–3.5, –0.4)
–2.2 (–3.3, –0.5) P=0.23
Ong (2003)(124)
Knee replacement for osteoarthritis
Intervention A: Leg elevated with knee flexed Intervention B: Leg elevated with knee extended Comparator: Knee extended and level with bed
A B –4.8
(–9.8, –2.2) P=0.018 –3.6 (–5.6, –
1.1) –3.8
(–5.5, –1.5)
Change in haemoglobin levels (g/dL) Mean (95%CI)
Pace (2008)(123)
Hip arthroplasty Lateral position / Supine position
3.6 (2.9, 5.0)
3.9 (2.5, 4.6) P=0.24
Park (2000)(126)
Lumbar spinal surgery Narrow pad width on support / Wide pad width on spinal support
–2.5 (NR) –1.8 (NR) NS
Duration of surgery
Length of surgery (minutes) Mean (SD)
Ko (2008)(122)
Endoscopic sinus surgery Reverse Trendelenburg position / Supine position
138.5 (50.8) 165.5 (56.1) P=0.056

Technical report on perioperative patient blood management – Volume 1b July 2011 215
Author Surgical procedure Patient position: Intervention / Comparator
Intervention Comparator Statistical significance
Widman (2001)(125)
Hip replacement surgery Lateral position / Supine position
70 (11) 77 (19) NR
Park (2000)(126)
Lumbar spinal surgery Narrow pad width on support / Wide pad width on spinal support
136.8 (23.7) 134 (27.8) NS
Length of surgery (minutes) Mean (95%CI)
Pace (2008)(123)
Hip arthroplasty Lateral position / Supine position
74 (63, 89) 69 (55, 79) P=0.31
Length of surgery (minutes) Mean (range)
De Sio (2008)(121)
Nephrolithotomy Modified supine position b / Prone position
43 (25, 120) 68 (55, 140) P<0.001
CI, confidence interval; DVT, deep vein thrombosis; NR, not reported; NS, not significant; SD, standard deviation. a Major complications include septicaemia, haemorrhaging requiring transfusion, thoracic or abdominal organ injury, acute pancreatitis. b The authors described a modified supine position with a 3L water bag or smaller cushion under the flank, depending on patient body mass. c Minor complications include fever, insignificant bleeding, urinary tract infection, colic.
Incidence of transfusion Four RCTs examined the incidence of blood transfusion. None of these studies observed a significant effect of appropriate patient position on transfusion incidence.
Lateral versus supine position Pace (2008)(123) reported that the lateral position during hip arthroplasty does not have a significant effect on the incidence of blood transfusion compared with the supine position (9.8% vs 16%; P=0.65). Similarly, Widman (2001)(125) did not observe a significant difference in transfusion incidence between patients in the lateral position compared to patients in the supine position during hip replacement surgery (57% vs 68%; P=0.336).
Leg elevated with knee flexed or knee extended versus knee extended and level with bed Ong (2003)(124) investigated the effect of leg–knee position following knee replacement surgery. The use of different positions did not result in a significant change in transfusion incidence (P=0.3).
Narrow pad width versus wide pad width on spinal support The study by Park (2000)(126) reported that pad width on the Wilson spinal supporting frame did not have a significant effect on transfusion incidence during posterior lumbar spinal surgery (25% vs 5%; P>0.05).

Technical report on perioperative patient blood management – Volume 1b July 2011 216
Volume of transfusion Three RCTs examined the effect of patient positioning on the volume of transfusion during surgery(124-126). None of these studies observed a significant effect.
Lateral versus supine position Widman (2001)(125) examined patients undergoing hip replacement surgery. The study found no significant difference in transfusion volume between patients in the lateral or supine position (321 mL vs 407 mL; P=0.307).
Leg elevated with knee flexed or knee extended versus knee extended and level with bed Ong (2003)(124) investigated the effect of leg–knee position following knee replacement surgery. Two alternative positions were examined (leg elevated 35° at the hip with knee flexed to 70° or leg elevated 35° at the hip with knee extended) and compared to usual positioning (knee extended and level with the bed). The volume of blood transfused did not differ significantly between any of the patient groups (P=0.3).
Narrow pad width versus wide pad width on spinal support The study by Park (2000)(126) examined the effect of pad width of the spinal support during posterior lumbar spinal surgery. Pad width did not have a significant effect on transfusion volume (2.2 units vs 2 units; P>0.05).
Blood loss Four RCTs examined the effect of patient positioning during surgery(122;123;125;126). Three of the four studies showed that lateral, reverse Trendelenberg, or appropriate prone positioning reduced blood loss.
Lateral versus supine position Widman (2001)(125) compared the lateral position to the supine position during hip replacement surgery. Patients in the lateral position group had significantly lower intraoperative blood loss (508 mL vs 723 mL; P=0.001) and total blood loss over 24 hours (1273 mL vs 1374 mL, P=0.043).
Pace (2008)(123) also compared the lateral position with the supine position during hip arthroplasty. According to the authors, patient positioning did not appear to have a significant effect on blood loss (1129 mL vs 1156mL; P=0.41).
Reverse Trendelenburg versus supine position Ko (2008)(122) examined the reverse Trendelenburg position compared to the supine position during endoscopic sinus surgery. The authors reported that blood loss was significantly lower when the reverse Trendelenburg position was used (126.0 mL vs 251.7 mL; P<0.001).
Narrow pad width versus wide pad width on spinal support The study by Park (2000)(126) examined the effect of pad width on the Wilson spinal supporting frame during posterior lumbar spinal surgery. The use of a narrow pad width was associated with significantly higher blood loss (878 mL vs 436 mL; P<0.05).

Technical report on perioperative patient blood management – Volume 1b July 2011 217
Mortality Mortality was not reported in any of the identified RCTs.
Morbidity None of the included RCTs reported a significant effect of patient positioning on the rate of adverse events.
Lateral versus supine position Pace (2008)(123) compared the lateral position to the supine position during hip arthroplasty. No significant difference in the rate of wound infection (0% vs 4%; P>0.05) or DVT (1.9% vs 0%; P>0.05) was observed between study arms.
Supine versus prone position De Sio (2008) compared a modified supine position to the prone position during nephrolithotomy(121). No significant difference in the rates of major complications (2.6% vs 0%; P=0.2) or minor complications (18% vs 14%; P=0.16) was observed between the different positions.
Leg elevated with knee flexed or knee extended versus knee extended and level with bed Ong (2003)(124) investigated the effect of leg–knee position following knee replacement surgery on morbidity outcomes. The rate of DVT did not differ significant between any of the study arms. Similarly, there was no significant difference between the treatment arms in knee swelling following surgery (P=0.6).
Haemoglobin concentration Four RCTs examined the effect of patient positioning on haemoglobin concentration after surgery.
Ong (2003)(124) investigated the effect of leg–knee position following knee replacement surgery for osteoarthritis. The reduction in haemoglobin concentration was significantly lower in patients whose leg was elevated with knee flexed or extended following surgery, compared to patients whose knee was extended and level with the bed (–3.6 g/dL, –3.8 g/dL vs –4.8 g/dL; P=0.018).
In contrast, the studies by De Sio (2008)(121), Pace (2008)(123) and Park (2000)(126) did not find a significant effect of patient positioning on haemoglobin levels.
Length of hospital stay De Sio (2008)(121). reported that, compared to the prone position, a modified supine position during nephrolithotomy did not significantly reduce length of hospital stay (4.3 days vs 4.1 days; P=0.18).
Duration of surgery Five studies examined the effect of patient position on surgery duration. De Sio (2008)(121). reported that the supine position during nephrolithotomy significantly reduced surgery duration compared with the prone position (43 minutes vs 68 minutes; P<0.001). In contrast,

Technical report on perioperative patient blood management – Volume 1b July 2011 218
the four studies by Ko (2008)(122), Pace (2008)(123), Widman (2001)(125) and Park (2000)(126) did not find a significant effect of patient position on duration of surgery.
Level III evidence As the Level II evidence addressed the majority of outcomes for this intervention, a literature search for Level III evidence was not conducted. A search for evidence specifically relating to quality of life outcomes was conducted. This search found no relevant Level III evidence.
Level IV evidence As the Level II evidence studies addressed the majority of outcomes for this intervention, a literature search for Level IV evidence was not conducted. A search for evidence specifically relating to quality of life outcomes was conducted. This search found no relevant Level IV evidence.

Technical report on perioperative patient blood management – Volume 1b July 2011 219
10 Preoperat ive autologous donat ion
Methods
The systematic review process identified nine relevant Level I studies which assessed the effect of PAD in patients undergoing surgery. An additional literature search was conducted to identify Level II studies that were published after the literature search dates of key Level I evidence. Two relevant RCTs were identified.
Level I evidence There were eight systematic reviews and one systematic update examining whether PAD reduces morbidity, mortality and the need for allogeneic blood transfusion in patients undergoing surgery. The main characteristics of these reviews are summarised in Table 10.1.
There is substantial overlap between many of the systematic reviews. As such, a decision was made to limit the assessment of evidence to the most up-to-date and comprehensive reviews for each population and surgery type. For these reasons, the following Cochrane review was chosen to form the basis of the evidence review:
Henry (2001)(127) – provides a comprehensive analysis of PAD in adults undergoing any surgery type.
Table 10.59 Characteristics and quality of Level I evidence for preoperative autologous donation
Author (Year) Study quality
Date of literature search
Population Surgery
No. of included studies assessing PAD
Relevant outcomes
Gurusamy (2009)(3) Good
Nov 2008 Adult Liver resection
1 trial (see Hashimoto 2007, Level II Evidence)
Transfusion incidence (%) Blood loss Mortality Morbidity
Henry (2001)(127) Good
Jan 2004 Adult Any elective non-urgent
12 trials Transfusion incidence (%) Haemoglobin concentration Mortality Morbidity
Davies (2006)(22)
Good
Jan 2004 Adult Any elective non-urgent
12 trials Transfusion incidence (%) Haemoglobin concentration
Carless (2004)(5) Good
Jul 2002 Adult Any
10 trials Transfusion incidence (%) Haemoglobin concentration Mortality Morbidity
Vamvakas (2002)(128) Poor
Jan 2002 Adult Any
5 trials Morbidity (infection)
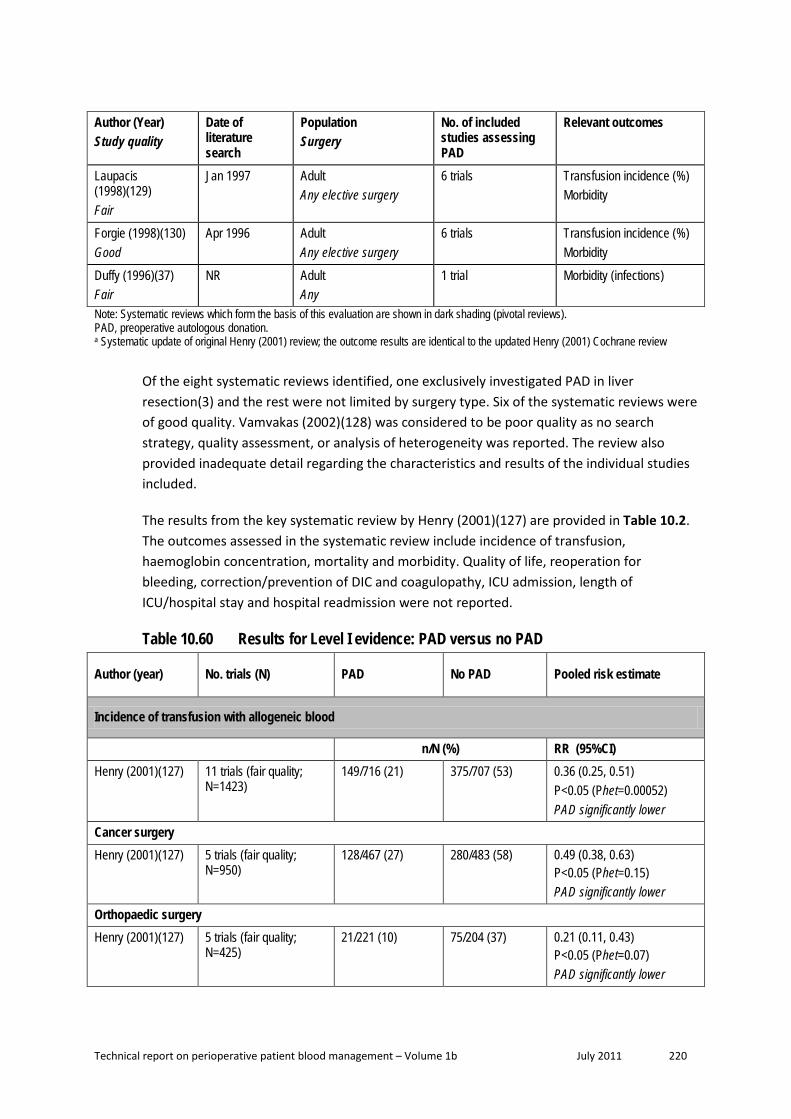
Technical report on perioperative patient blood management – Volume 1b July 2011 220
Author (Year) Study quality
Date of literature search
Population Surgery
No. of included studies assessing PAD
Relevant outcomes
Laupacis (1998)(129) Fair
Jan 1997 Adult Any elective surgery
6 trials Transfusion incidence (%) Morbidity
Forgie (1998)(130) Good
Apr 1996 Adult Any elective surgery
6 trials Transfusion incidence (%) Morbidity
Duffy (1996)(37) Fair
NR Adult Any
1 trial Morbidity (infections)
Note: Systematic reviews which form the basis of this evaluation are shown in dark shading (pivotal reviews). PAD, preoperative autologous donation. a Systematic update of original Henry (2001) review; the outcome results are identical to the updated Henry (2001) Cochrane review
Of the eight systematic reviews identified, one exclusively investigated PAD in liver resection(3) and the rest were not limited by surgery type. Six of the systematic reviews were of good quality. Vamvakas (2002)(128) was considered to be poor quality as no search strategy, quality assessment, or analysis of heterogeneity was reported. The review also provided inadequate detail regarding the characteristics and results of the individual studies included.
The results from the key systematic review by Henry (2001)(127) are provided in Table 10.2. The outcomes assessed in the systematic review include incidence of transfusion, haemoglobin concentration, mortality and morbidity. Quality of life, reoperation for bleeding, correction/prevention of DIC and coagulopathy, ICU admission, length of ICU/hospital stay and hospital readmission were not reported.
Table 10.60 Results for Level I evidence: PAD versus no PAD
Author (year) No. trials (N) PAD No PAD Pooled risk estimate
Incidence of transfusion with allogeneic blood
n/N (%) RR (95%CI) Henry (2001)(127) 11 trials (fair quality;
N=1423) 149/716 (21) 375/707 (53) 0.36 (0.25, 0.51)
P<0.05 (Phet=0.00052) PAD significantly lower
Cancer surgery Henry (2001)(127) 5 trials (fair quality;
N=950) 128/467 (27) 280/483 (58) 0.49 (0.38, 0.63)
P<0.05 (Phet=0.15) PAD significantly lower
Orthopaedic surgery Henry (2001)(127) 5 trials (fair quality;
N=425) 21/221 (10) 75/204 (37) 0.21 (0.11, 0.43)
P<0.05 (Phet=0.07) PAD significantly lower

Technical report on perioperative patient blood management – Volume 1b July 2011 221
Author (year) No. trials (N) PAD No PAD Pooled risk estimate
Maxillofacial surgery Henry (2001)(127) 1 trial (fair quality; N=48) 0/28 (0) 20/20 (100) 0.02 (0.00, 0.28)
P<0.05 (Phet=NA) PAD significantly lower
Studies with a transfusion protocol Henry (2001)(127) 7 trials (fair quality;
N=1206) 138/595 (23) 299/611 (49) 0.48 (0.38, 0.60)
P<0.05 (Phet=0.18) PAD significantly lower
Studies without a transfusion protocol Henry (2001)(127) 4 trials (fair quality;
N=217) 11/121 (9) 76/96 (79) 0.12 (0.04, 0.33)
P<0.05 (Phet=0.08) PAD significantly lower
Incidence of transfusion with allogeneic and/or autologous blood
n/N (%) RR (95%CI) Henry (2001)(127) 9 trials (fair quality;
N=1232) 496/620 (80) 343/612 (56) 1.33 (1.10, 1.61)
P<0.05 (Phet<0.000001) PAD significantly higher
Cancer surgery Henry (2001)(127) 5 trials (fair quality;
N=950) 363/467 (78) 260/483 (58) 1.38 (1.20, 1.58)
P<0.05 (Phet=0.13) PAD significantly higher
Orthopaedic surgery Henry (2001)(127) 3 trials (fair quality;
N=234) 105/125 (84) 43/109 (39) 1.78 (0.61, 5.20)
P>0.05 (Phet<0.00001) No significant difference
Maxillofacial surgery Henry (2001)(127) 1 trial (fair quality; N=48) 28/28 (100) 20/20 (100) 0 (0, 0)
(Phet=NA) No significant difference
Studies with a transfusion protocol Henry (2001)(127) 5 trials (fair quality;
N=1015) 384/499 (77) 267/516 (52) 1.48 (1.16, 1.89)
P<0.05 (Phet=0.001) PAD significantly higher
Studies without a transfusion protocol Henry (2001)(127) 4 trials (fair quality;
N=217) 112/121 (100) 76/96 (79) 1.10 (0.95, 1.29)
P>0.05 (Phet<0.00001) No significant difference

Technical report on perioperative patient blood management – Volume 1b July 2011 222
Author (year) No. trials (N) PAD No PAD Pooled risk estimate
Haemoglobin concentration
Preoperative Hb concentration (g/dL) Mean (SD) Mean (95%CI) Henry (2001)(127) 5 trials a (fair quality;
N=534; 267 PAD, 267 control)
NR NR –1.16 (–1.60, –0.73) P< 0.05 (Phet=0.004) PAD significantly lower
Volume of transfusion
Units of blood transfused Mean (SD) SMD: (95%CI) Henry (2001) (127) NR NR NR Insufficient evidence b
Mortality
n/N (%) RR (95%CI) Henry (2001)(127) NR NR NR Insufficient evidence
Morbidity
n/N (%) RR (95%CI) Infection Henry (2001)(127) 3 trials (fair quality;
N=621) 74/309 (24) 81/312 (26) 0.70 (0.34, 1.43)
P>0.05 (Phet=0.07) No significant difference
Thrombosis Henry (2001)(127) 3 trials (fair quality;
N=250) 6/140 (4) 3/110 (3) 0.82 (0.21, 3.13)
P>0.05 (Phet=0.53) No significant difference
Other Henry (2001)(127) NR NR NR Insufficient data for stroke,
DVP and pulmonary embolus AAA, abdominal aortic aneurysm; CI, confidence interval; DVT, deep vein thrombosis; Hb, haemoglobin; MI, myocardial infarction; NA, not applicable; NR, not reported; PAD, preoperative autologous donation; RCT, randomised controlled trial; RR, relative risk; SD, standard deviation. a Two in orthopaedic surgery and three in cancer surgery. b None of the included RCTs provided sufficient detail to conduct a meta-analysis for this outcome.
Transfusion requirements Henry (2001)(127) found that significantly fewer PAD patients required allogeneic blood transfusion compared with those who did not receive PAD (11 trials; 21% vs 53%; RR 0.36; 95%CI: 0.25, 0.51). This effect was consistent for orthopaedic surgery (5 trials; 10% vs 37%; RR 0.21; 95%CI: 0.11, 0.43), surgery for cancer (5 trials; 27% vs 58%; RR 0.49; 95%CI: 0.38, 0.63) and maxillofacial surgery (1 trial; 0% vs 100%; RR 0.02; 95%CI: 0.00, 0.28). The relative decrease in incidence of allogeneic blood transfusion for PAD patients compared with control was higher in studies without a transfusion protocol (7 trials; 23% vs 49%; RR 0.12;

Technical report on perioperative patient blood management – Volume 1b July 2011 223
95%CI: 0.04, 0.33), than in studies with a transfusion protocol (4 trials; 9% vs 79%; RR 0.48; 95%CI: 0.38, 0.60)(127).
Henry (2001)(127) also reported the transfusion requirements of autologous and allogeneic blood combined. Use of PAD was associated with a significant increase in combined autologous and allogeneic blood transfusion (9 trials; 80% vs 56%; RR 1.33; 95%CI: 1.10, 1.61). The higher incidence of transfusion for PAD patients was significant in cancer surgery (5 trials; 78% vs 58%; RR 1.38; 95%CI: 1.20, 1.58) but not orthopaedic surgery (3 trials; 84% vs 39%; RR 1.78; 95%CI: 0.61, 5.20). Similarly the incidence was significantly higher for PAD patients in studies with a transfusion protocol (5 trials; 77% vs 52%; RR 1.48; 95%CI: 1.16, 1.89) but not studies that did not have (or did not report) a transfusion protocol (4 trials; 100% vs 79%; RR 1.10; 95%CI: 0.95, 1.29).
Haemoglobin concentration Henry (2001)(127) found that patients who underwent PAD had significantly lower preoperative haemoglobin concentration than patients who did not pre-donate blood (WMD: –1.16g/dL; 95%CI: –1.60, –0.73).
Mortality Although Henry (2001)(127) assessed mortality as a primary outcome, the review did not find sufficient evidence to draw any conclusions.
Morbidity Henry (2001)(127) found no significant differences in the rates of infection between PAD patients and those who did not receive PAD (3 trials; 24% vs 26%; RR 0.70; 95%CI: 0.34, 1.43) and thrombosis (3 trials; 4% vs 3%; RR 0.82; 95%CI: 0.21, 3.13).
Level II evidence A literature search was conducted to identify Level II studies published after the search date conducted in the Henry (2001)(127) systematic review. Two RCTs were identified and the main characteristics of these studies are summarised in Table 10.3.
Table 10.61 Characteristics and quality of Level II evidence for preoperative autologous donation
Author Study type Study quality
Population Setting
Relevant outcomes
Bouchard (2008)(131)
RCT Fair
Elective cardiac surgery. Canadian hospital setting. (N=48; 25 PAD, 23 control)
Transfusion incidence (%) Blood loss Haemoglobin concentration Coagulation parameters Length of hospital stay Length of ICU stay
Hashimoto (2007)(132)
RCT Poor
Liver graft procurement. Japanese hospital setting. (N=79; 40 PAD, 39 control)
Transfusion incidence (%) Blood loss Morbidity

Technical report on perioperative patient blood management – Volume 1b July 2011 224
Author Study type Study quality
Population Setting
Relevant outcomes
Length of hospital stay Length of ICU stay
ICU, intensive care unit; PAD, preoperative autologous donation; RCT, randomised controlled trial.
The results from the two included RCTs are summarised in Table 10.4. The RCT by Hashimoto (2007)(132) was the only Level II study identified in the Cochrane review by Gurusamy (2009)(3), which specifically evaluated cardiopulmonary interventions to decrease blood loss and allogeneic blood transfusion requirements in patients undergoing liver resection.
Table 10.62 Results for Level II evidence: PAD versus no PAD Author (year)
Surgical procedure
Outcome PAD No PAD Statistical significance
Bouchard (2008)(131) Cardiac surgery
Intraoperative blood loss (mean [SD]), mL 416 (190) 450 (281)
Mean difference (95% CI): –34 (–171, 102);
P=0.62
Postoperative blood loss (mean [SD]), (mL) 936 (583) 909.5 (576)
Mean difference (95% CI): 27 (–302, 355);
P=0.88 Patients transfused with
autologous blood (n/N [%]) 6/25 (24%) NA NA
Units of autologous blood transfused (mean [SD]) 2 (1.2) NA NA
Patients transfused with allogeneic blood products (n/N
[%]) 4/25 (16%) 9/23 (39%)
RR (95%CI): 0.41 (0.15, 1.15)
P=0.09
Patients transfused with allogeneic blood (n/N [%]) 0/25 (0%) 7/23 (30%)
RR (95%CI): 0.06 (0.00, 1.02)
P=0.05 Units of allogeneic blood transfused a (mean [SD]) 0 (0) 2 (1.2) Not estimable
Patients transfused with FFP (n/N [%]) 1/25 (4%) 5/23 (22%)
RR (95%CI): 0.18 (0.02, 1.46)
P=0.11 Units of FFP transfused a (mean
[SD]) 4 (0) 2.8 (1) Not estimable
Patients transfused with platelets (n/N [%]) 3/25 (12%) 4/23 (17%)
RR (95%CI): 0.69 (0.17, 2.76)
P=0.60 Units of platelets transfused a
(mean [SD]) 4.3 (2.9) 6 (0) Not estimable
Patients transfused with cryoprecipitate (n/N [%]) 0/25 (0%) 1/23 (4%)
RR (95%CI): 0.31 (0.01, 7.20)
P=0.46 Units of cryoprecipitate
transfused 0 (0) 10 (0) Not estimable
Patients transfused with allogeneic and/or autologous
blood products (n/N [%]) 11/25 (44%) 9/23 (39%)
RR (95%CI): 1.12 (0.57, 2.21)
P=0.073

Technical report on perioperative patient blood management – Volume 1b July 2011 225
Author (year) Surgical
procedure Outcome PAD No PAD Statistical
significance
Preoperative Hb concentration (mean [SD]), g/dL 12.9 (1.4) 13.5 (1.3)
Mean difference (95% CI): –0.60 (–1.36,
0.16) P=0.12
Hb concentration 24 hours after surgery (mean [SD]), g/dL 8.2 (1.2) 8.6 (1.3)
Mean difference (95% CI): –0.40 (–1.11,
0.31) P=0.27
Hb concentration 5 days after surgery (mean [SD]), g/dL 10.3 (1.2) 10.8 (1.2)
Mean difference (95% CI): –0.50 (–1.18,
0.18) P=0.15
Preoperative prothrombin time (mean [SD]), seconds 9.7 (2.8) 9.4 (1.1)
Mean difference (95% CI): 0.30 (–0.89, 1.49)
P=0.62
Prothrombin time 30 minutes after surgery (mean [SD]),
seconds 13.2 (3.9) 13.5 (2.2)
Mean difference (95% CI): –0.30 (–2.07,
1.47) P=0.74
Prothrombin time 24 hours after surgery (mean [SD]), seconds 10.3 (1.3) 10.9 (1.7)
Mean difference (95% CI): –0.60 (–1.46,
0.26) P=0.17
Preoperative fibrinogen concentration (mean [SD]), g/L 4.3 (1.5) 3.1 (0.9)
Mean difference (95% CI): 1.20 (0.51, 1.89)
P=0.0007 Fibrinogen concentration 30 minutes after surgery (mean
[SD]), g/L 3.0 (0.9) 2.6 (0.7)
Mean difference (95% CI): 0.40 (–0.05, 0.85)
P=0.08 Fibrinogen concentration
24 hours after surgery (mean [SD]), g/L
6.2 (1.3) 5.1 (1.2) Mean difference (95% CI): 1.10 (0.39, 1.81)
P=0.002
Length of hospital stay (mean [SD]), days 5.4 (0.9) 5.4 (0.9)
Mean difference (95% CI): 0.00 (–0.51, 0.51)
P=1.00
Length of ICU stay (mean [SD]), days 1.5 (0.6) 1.5 (0.6)
Mean difference (95% CI): 0.00 (–0.34, 0.34)
P=1.00
Duration of surgery (mean [SD]), minutes 174.7 (44.9) 177.6 (62.3)
Mean difference (95% CI): –2.90 (–33.85,
28.05) P=0.85
Hashimoto (2007)(132) Liver graft procurement
Incidence of transfusion with allogeneic blood (n/N [%])
0/40 (0) 0/39 (0) P=NS
Operative blood loss (mean [SD]), mL
403 (144) 440 (144) Mean difference (95% CI): –37.0
(–100.51, 26.51) P=NS

Technical report on perioperative patient blood management – Volume 1b July 2011 226
Author (year) Surgical
procedure Outcome PAD No PAD Statistical
significance
Transection blood loss (mean [SD]), mL
140 (185) 230 (185) Mean difference (95% CI): –90.0
(–171.60, –8.40) P=NS
Mortality (n/N [%]) 0/40 (0) 0/39 (0) P=NS
Morbidity – bile leak (n/N [%]) 0/40 (0) 1/39 (3) RR (95%CI): 0.33
(0.01, 7.75) P=NS
Morbidity – intra-abdominal bleeding (n/N [%])
0/40 (0) 1/39 (3) RR (95%CI): 0.33 (0.01, 7.75)
P=NS Preoperative Hb concentration
(median [IQR]), g/dL 13.0 (11.0 to 15.7) 13.6 (11.6 to 15.9) Mean difference: NR P=0.455
Prothrombin time 24 hours after surgery (median [IQR]),
seconds 12.3 (9.6 to 15.9) 12.5 (10.5 to 15.0) Mean difference: NR
P=0.280
Preoperative PT-INR (median [IQR]) 1.11 (0.95 to 1.34) 1.10 (0.91 to 1.31) Mean difference: NR
P=0.350 PT-INR 24 hours postoperative
(median [IQR]) 1.76 (1.30 to 2.37) 1.77 (1.29 to 2.32) Mean difference: NR P=0.456
Length of hospital stay (median [IQR]), days 14 (10 to 36) 14 (11 to 46) Mean difference: NR
P=0.476 Duration of surgery (median
[IQR]), minutes 473 (385 to 640) 470 (380 to 730) Mean difference: NR
P=0.883 CI, confidence interval; FFP, fresh frozen plasma; Hb, haemoglobin; ICU, intensive care unit; IQR, interquartile range; NR, not reported; NS, not significant; PAD, preoperative autologous donation; PT-INR, prothrombin time international normalisation ratio; RR, relative risk; SD, standard deviation. a Mean value is calculated for the patients who received transfusion.
Incidence of transfusion Bouchard (2008)(131) found that PAD did not significantly reduce the proportion of patients undergoing cardiac surgery requiring allogeneic blood products compared with control (16% vs 39%; RR 0.41; 95%CI: 0.15, 1.15). However, PAD did significantly reduce the proportion of patients requiring allogeneic blood (0% vs 30%; RR 0.06; 95%CI: 0.00, 1.02).
Blood loss The RCT by Bouchard (2008)(131) found that PAD did no significantly decrease blood loss in patients undergoing cardiac surgery, either intraoperatively (MD: –34 mL; 95%CI: –171, 102), or postoperatively (MD: 27 mL; 95%CI: –302, 355). In the RCT by Hashimoto (2007) blood loss during operation for liver resection was not significantly different between PAD patients and the control group (MD: –37.0; 95%CI: –100.5, 26.5); however, blood loss during the transection period of the operation was significantly lower for patients who pre-donated blood (MD: –90.0 mL; 95%CI: –172, –8.40)(132).

Technical report on perioperative patient blood management – Volume 1b July 2011 227
Morbidity and mortality Bouchard (2008)(131) did not report on mortality or adverse events. In the RCT by Hashimoto (2007)(132) there were no deaths reported in either study group. There were no significant differences between PAD patients and the control group in the morbidity outcomes reported, namely bile leak (0% vs 3%) and intra-abdominal bleeding (0% vs 3%).
Haemoglobin concentration and coagulation characteristics Bouchard (2008)(131) found no significant difference in haemoglobin concentration between PAD patients and control, preoperatively (MD: –0.60 g/dL; 95%CI: –1.36, 0.16), 24 hours after surgery (MD: –0.40 g/dL; 95%CI: –1.11, 0.31), or 5 days after surgery (MD: –0.50 g/dL; 95%CI: –1.18, 0.18). Similarly, there was no difference in prothrombin time between treatments arms preoperatively (MD: –0.30 sec; 95%CI: –0.89, 1.49), 30 minutes after surgery (MD: –0.30 sec; 95%CI: –2.07, 1.47), or 24 hours after surgery (MD: –0.60 sec; 95%CI: –1.46, 0.26). The PAD patients did have a significantly higher fibrinogen concentration 24 hours after surgery (MD: 1.10 g/L; 95%CI: 0.39, 1.81), with no significant difference between treatments arms in preoperative concentration (MD: 1.20 g/L; 95%CI: 0.51, 1.89), or 30 minutes after surgery (MD: 0.40 g/L; 95%CI: –0.05, 0.85).
Hashimoto (2007)(132)found no significant difference between PAD and standard care in preoperative haemoglobin concentration (median [IQR], g/dL: 13.0 [11.0 to 15.7] vs 13.6 [11.6 to 15.9]; P=0.46), prothrombin time 24 hours after surgery (median [IQR], seconds: 12.3 [9.6 to 15.9] vs 12.5 [10.5 to 15.0]; P=0.28), preoperative international normalised ratio (PR-INR) (median [IQR]: 1.11 [0.95 to 1.34] vs 1.10 [0.91 to 1.31]; P=0.35) and 24 hours postoperative PT-INR (median [IQR]: 1.76 [1.30 to 2.37] vs 1.77 [1.29 to 2.32]; P=0.46).
Length of hospital and ICU stay In Bouchard (2008)(131) there was no significant difference between PAD and standard care in length of hospital stay (MD: 0.0 days; 95%CI: –0.51, 0.51) and length of ICU stay (MD: 0.00 days; 95%CI: –0.34, 0.34). Similarly, Hashimoto (2007)(132) found no significant difference between treatment arms in length of hospital stay (median [IQR], days: 14 [10 to 36] vs 14 [11 to 46]; P=0.476).
Duration of surgery No significant difference between PAD and standard care was observed for duration of surgery in either Bouchard (2008)(131) (MD: –2.90 min; 95%CI: –33.85, 28.05) or Hashimoto (2007)(132) (median [IQR], min: 473 [385 to 640] vs 470 [380 to 730]; P=0.883).
Level III evidence As no evidence for quality of life was captured in the Level I or II evidence, a specific quality-of-life search for Level III evidence for PAD was conducted. No relevant Level III studies were identified.

Technical report on perioperative patient blood management – Volume 1b July 2011 228
Level IV evidence As no evidence for quality of life was captured in the Level I or II evidence, a specific quality-of-life search for Level IV evidence for PAD was conducted. No relevant Level IV studies were identified.

Technical report on perioperative patient blood management – Volume 1b July 2011 229
References
Reference List
(1) Carless PA, Henry DA, Moxey AJ, O'Connell D, McClelland B, Henderson KM, et al. Desmopressin use for minimising perioperative allogeneic blood transfusion. Cochrane Database Syst Rev 2004;(1):CD001884.
(2) Bryson GL, Laupacis A, Wells GA. Does acute normovolemic hemodilution reduce perioperative allogeneic transfusion? A meta-analysis. Anesth Analg 1998;86(1):9-15.
(3) Gurusamy KS, Li J, Sharma D, Davidson BR. Cardiopulmonary interventions to decrease blood loss and blood transfusion requirements for liver resection. Cochrane Database of Systematic Reviews 2009;(4).
(4) Segal JB, Blasco-Colmenares E, Norris EJ, Guallar E. Preoperative acute normovolemic hemodilution: A meta-analysis. Transfusion 2004;44(5):632-44.
(5) Carless P, Moxey A, O'Connell D, Henry D. Autologous transfusion techniques: A systematic review of their efficacy. Transfus Med 2004;14(2):123-44.
(6) Akhlagh SH, Chohedri AH, Bazojoo A, Nemati MH. A comparison of total amount of blood needed in patients taking autologous or homologous blood transfusion in coronary artery bypass grafting: A clinical randomized case-control trial. Pak J Med Sci 2007;23(4):542-5.
(7) Bennett J, Haynes S, Torella F, Grainger H, McCollum C. Acute normovolemic hemodilution in moderate blood loss surgery: A randomized controlled trial. Transfusion 2006;46(7):1097-103.
(8) Casati V, Speziali G, D'Alessandro C, Cianchi C, Antonietta Grasso M, Spagnolo S, et al. Intraoperative low-volume acute normovolemic hemodilution in adult open-heart surgery. Anesthesiology 2002;97(2):367-73.
(9) Casati V, Benussi S, Sandrelli L, Grasso MA, Spagnolo S, D'Angelo A. Intraoperative Moderate Acute Norvolemic Hemodilution Associated with a Comprehensive Blood-Sparing Protocol in Off-Pump Coronary Surgery. Anesth Analg 2004;98(5):1217-23.
(10) Friesen RH, Perryman KM, Weigers KR, Mitchell MB, Friesen RM. A trial of fresh autologous whole blood to treat dilutional coagulopathy following cardiopulmonary bypass in infants. Paediatr Anaesth 2006;16(4):429-35.
(11) Hohn L, Schweizer A, Licker M, Morel DR. Absence of beneficial effect of acute normovolemic hemodilution combined with aprotinin on allogeneic blood transfusion requirements in cardiac surgery. Anesthesiology 2002;96(2):276-82.
(12) Jarnagin WR, Gonen M, Maithel SK, Fong Y, DAngelica MI, Dematteo RP, et al. A prospective randomized trial of acute normovolemic hemodilution compared to standard

Technical report on perioperative patient blood management – Volume 1b July 2011 230
intraoperative management in patients undergoing major hepatic resection. Annals of surgery 2008;248(3):360-8.
(13) Juelsgaard P, Moller MB, Larsen UT. Preoperative acute normovolaemic hemodilution (ANH) in combination with hypotensive epidural anaesthesia (HEA) during knee arthroplasty surgery. No effect on transfusion rate. A randomized controlled trial [ISRCTN87597684]. BMC Anesthesiol 2002;2.
(14) Lim YJ, Kim CS, Bahk JH, Ham BM, Do SH. Clinical trial of esmolol-induced controlled hypotension with or without acute normovolemic hemodilution in spinal surgery. Acta Anaesthesiol Scand 2003;47(1):74-8.
(15) Matot I, Scheinin O, Jurim O, Eid A. Effectiveness of acute normovolemic hemodilution to minimize allogeneic blood transfusion in major liver resections. Anesthesiology 2002;97(4):794-800.
(16) Obasi C, Arendt J, Antoszewski Z. An assessment of the efficacy of preoperative controlled haemodilution in the perioperative management of patients including the elderly. Chir Pol 2006;8(2):111-24.
(17) Sanders G, Mellor N, Rickards K, Rushton A, Christie I, Nicholl J, et al. Prospective randomized controlled trial of acute normovolaemic haemodilution in major gastrointestinal surgery. Br J Anaesth 2004;93(6):775-81.
(18) Saricaoglu F, Akinci SB, Aypar U. The effect of acute normovolemic hemodilution and acute hypervolemic hemodilution on coagulation and allogeneic transfusion. Saudi Med J 2005;26(5):792-8.
(19) Wolowczyk L, Nevin M, Smith FCT, Baird RN, Lamont PM. Haemodilutional effect of standard fluid management limits the effectiveness of acute normovolaemic haemodilution in AAA surgery - Results of a pilot trial. European Journal of Vascular and Endovascular Surgery 2003;26(4):405-11.
(20) Carless PA, Henry DA, Moxey AJ, O'connell DL, Brown T, Fergusson DA. Cell salvage for minimising perioperative allogeneic blood transfusion. Cochrane Database Syst Rev 2006;(4):CD001888.
(21) Takagi H, Sekino S, Kato T, Matsuno Y, Umemoto T. Intraoperative autotransfusion in abdominal aortic aneurysm surgery: meta-analysis of randomized controlled trials (Structured abstract). Archives of Surgery 2007;142:1098-101.
(22) Davies L, Brown TJ, Haynes S, Payne K, Elliott RA, McCollum C. Cost-effectiveness of cell salvage and alternative methods of minimising perioperative allogeneic blood transfusion: A systematic review and economic model. Health Technol Assess 2006;10(44):1-114.
(23) Huet C, Salmi R, Fergusson D, Koopman-Van Gemert AWMM, Rubens F, Laupacis A. A meta-analysis of the effectiveness of cell salvage to minimize perioperative allogeneic blood transfusion in cardiac and orthopedic surgery. Anesth Analg 1999;89(4):861-9.
(24) Bowley DM, Barker P, Boffard KD. Intraoperative blood salvage in penetrating abdominal trauma: A randomised, controlled trial. World Journal of Surgery 2006;30(6):1074-80.

Technical report on perioperative patient blood management – Volume 1b July 2011 231
(25) Damgaard S, Steinbruchel DA. Autotransfusion with cell saver for off-pump coronary artery bypass surgery: A randomized trial. Scand Cardiovasc J 2006;40(3):194-8.
(26) Goel P, Pannu H, Mohan D, Arora R. Efficacy of cell saver in reducing homologous blood transfusions during OPCAB surgery: A prospective randomized trial. Transfus Med 2007;17(4):285-9.
(27) Mercer KG, Spark JI, Berridge DC, Kent PJ, Scott DJA. Randomized clinical trial of intraoperative autotransfusion in surgery for abdominal aortic aneurysm. British Journal of Surgery 2004;91(11):1443-8.
(28) Murphy GJ, Rogers CS, Lansdowne WB, Channon I, Alwair H, Cohen A, et al. Safety, efficacy, and cost of intraoperative cell salvage and autotransfusion after off-pump coronary artery bypass surgery: A randomized trial. J Thorac Cardiovasc Surg 2005;130(1):20-8.
(29) Niranjan G, Asimakopoulos G, Karagounis A, Cockerill G, Thompson M, Chandrasekaran V. Effects of cell saver autologous blood transfusion on blood loss and homologous blood transfusion requirements in patients undergoing cardiac surgery on- versus off-cardiopulmonary bypass: a randomised trial. European Journal of Cardio-thoracic Surgery 2006;30(2):271-7.
(30) Selo-Ojeme DO, Feyi-Waboso PA. Salvage autotransfusion versus homologous blood transfusion for ruptured ectopic pregnancy. Int J Gynecol Obstet 2007;96(2):108-11.
(31) Wiefferink A, Weerwind PW, van Heerde W, Teerenstra S, Noyez L, de Pauw BE, et al. Autotransfusion management during and after cardiopulmonary bypass alters fibrin degradation and transfusion requirements. J Extra Corpor Technol 2007;39(2):66-70.
(32) Zhang XL, Qian BH, Luo QF. Effects of blood transfusion modes during perioperative period on prognosis of patients with scoliosis. Chin J Clin Rehab 2004;8(32):7308-10.
(33) Murphy GJ, Allen SM, Unsworth-White J, Lewis CT, Dalrymple-Hay MJR. Safety and efficacy of perioperative cell salvage and autotransfusion after coronary artery bypass grafting: A randomized trial. Annals of Thoracic Surgery 2004;77(5):1553-9.
(34) Haynes SL, Torella F, Wong JCL, Dalrymple K, James M, McCollum CN. Economic evaluation of a randomized clinical trial of haemodilution with cell salvage in aortic surgery. British Journal of Surgery 2002;89(6):731-6.
(35) McGill N, O'Shaughnessy D, Pickering R, Herbertson M, Gill R. Mechanical methods of reducing blood transfusion in cardiac surgery: Randomised controlled trial. Br Med J 2002;324(7349):1299-302.
(36) Wong JC, Torella F, Haynes SL, Dalrymple K, Mortimer AJ, McCollum CN, et al. Autologous versus allogeneic transfusion in aortic surgery: a multicenter randomized clinical trial. Annals of surgery 2002;235:145-51.
(37) Duffy G, Neal KR. Differences in post-operative infection rates between patients receiving autologous and allogeneic blood transfusion: a meta-analysis of published randomized and nonrandomized studies (Structured abstract). Transfus Med 1996;6:325-8.
Technical report on perioperative patient blood management – Volume 1b July 2011 232
(38) Amin A, Watson A, Mangwani J, Nawabi D, Ahluwalia R, Loeffler M. A prospective randomised controlled trial of autologous retransfusion in total knee replacement. J Bone Jt Surg Ser B 2008;90(4):451-4.
(39) Cheng SC, Hung TS, Tse PY. Investigation of the use of drained blood reinfusion after total knee arthroplasty: a prospective randomised controlled study. Journal of Orthopaedic Surgery (Hong Kong) 2005;13(2):120-4.
(40) Zacharopoulos A, Apostolopoulos A, Kyriakidis A. The effectiveness of reinfusion after total knee replacement. A prospective randomised controlled study. Int Orthop 2007;31(3):303-8.
(41) Paul JE, Ling E, Lalonde C, Thabane L. Deliberate hypotension in orthopedic surgery reduces blood loss and transfusion requirements: A meta-analysis of randomized controlled trials. Can J Anesth 2007;54(10):799-810.
(42) Kop EC, Spauwen PHM, Kouwenberg PPGM, Heymans FJM, van Beem HBH. Influence of controlled hypotension versus normotension on amount of blood loss during breast reduction. Journal of Plastic, Reconstructive and Aesthetic Surgery 2009;62(2):200-5.
(43) Elsharnouby NM, Elsharnouby MM. Magnesium sulphate as a technique of hypotensive anaesthesia. Br J Anaesth 2006;96(6):727-31.
(44) O'Connor PJ, Hanson J, Finucane BT. Induced hypotension with epidural/general anesthesia reduces transfusion in radical prostate surgery. Can J Anesth 2006;53(9):873-80.
(45) Piper SN, Suttner SW, Maleck WH, Kumle B, Haisch G, Boldt J. Effects of sodium nitroprusside-induced controlled hypotension on pancreatic function assessed by pancreatitis-associated protein in patients undergoing radical prostatectomy. Eur J Anaesthesiol 2002;19(8):609-13.
(46) Suttner SW, Piper SN, Lang K, Huttner I, Kumle B, Boldt J. Cerebral effects and blood sparing efficiency of sodium nitroprusside-induced hypotension alone and in combination with acute normovolaemic haemodilution. Br J Anaesth 2001;87(5):699-705.
(47) Jacobi KE, Bohm BE, Rickauer AJ, Jacobi C. Moderate controlled hypotension with sodium nitroprusside does not improve surgical conditions or decrease blood loss in endoscopic sinus surgery. J Clin Anesth 2000;12(3):202-7.
(48) Boldt J, Weber A, Mailer K, Papsdorf M, Schuster P. Acute normovolaemic haemodilution vs controlled hypotension for reducing the use of allogeneic blood in patients undergoing radical prostatectomy. Br J Anaesth 1999;82(2):170-4.
(49) Karakaya D, Ustun E, Tur A, Baris S, Sarihasan B, Sahinoglu H, et al. Acute normovolemic hemodilution and nitroglycerin-induced hypotension: Comparative effects on tissue oxygenation and allogeneic blood transfusion requirement in total hip arthroplasty. J Clin Anesth 1999;11(5):368-74.
(50) Sood S, Jayalaxmi TS, Vijayaraghavan S, Nundy S. Use of sodium nitroprusside induced hypotensive anaesthesia for reducing blood loss in patients undergoing lienorenal shunts for portal hypertension. British Journal of Surgery 1987;74(11):1036-8.

Technical report on perioperative patient blood management – Volume 1b July 2011 233
(51) Fredin H, Gustafson C, Rosberg B. Hypotensive anesthesia, thromboprophylaxis and postoperative thromboembolism in total hip arthroplasty. Acta Anaesthesiol Scand 1984;28(5):503-7.
(52) Rajagopalan S, Mascha E, Na J, Sessler DI. The effects of mild perioperative hypothermia on blood loss and transfusion requirement. Anesthesiology 2008;108(1):71-7.
(53) Scott EM, Buckland R. A systematic review of intraoperative warming to prevent postoperative complications (Structured abstract). AORN Journal 2006;83:1090-104.
(54) Mahoney CB, Odom J. Maintaining intraoperative normothermia: a meta-analysis of outcomes with costs (Structured abstract). AANA J 1999;67:155-64.
(55) Kim YS, Lee JY, Yang SC, Song JH, Koh HS, Park WK. Comparative Study of the Influence of Room-Temperature and Warmed Fluid Irrigation on Body Temperature in Arthroscopic Shoulder Surgery. Arthroscopy - Journal of Arthroscopic and Related Surgery 2009;25(1):24-9.
(56) Jeong SM, Hahm KD, Jeong YB, Yang HS, Choi IC. Warming of intravenous fluids prevents hypothermia during off-pump coronary artery bypass graft surgery. Journal of cardiothoracic and vascular anesthesia 2008;22:67-70.
(57) Zhao J, Luo AL, Xu L, Huang YG. Forced-air warming and fluid warming minimize core hypothermia during abdominal surgery. Chinese Medical Sciences Journal 2005;20:261-4.
(58) Melling AC, Ali B, Scott EM, Leaper DJ. Effects of preoperative warming on the incidence of wound infection after clean surgery: A randomised controlled trial. Lancet 2001;358(9285):876-80.
(59) Yau TM, Carson S, Weisel RD, Ivanov J, Sun Z, Yu R, et al. The effect of warm heart surgery on postoperative bleeding. Journal of Thoracic and Cardiovascular Surgery 1992;103:1155-62.
(60) Ak K, Isbir CS, Tetik S, Atalan N, Tekeli A, Aljodi M, et al. Thromboelastography-based transfusion algorithm reduces blood product use after elective CABG: a prospective randomized study. Journal of cardiac surgery 2009;24:404-10.
(61) Avidan MS, Alcock EL, Da Fonseca J, Ponte J, Desai JB, Despotis GJ, et al. Comparison of structured use of routine laboratory tests or near-patient asessment with clinical judgement in the management of bleeding after cardiac surgery. Br J Anaesth 2004;92(2):178-86.
(62) Shore-Lesserson L, Manspeizer HE, DePerio M, Francis S, Vela-Cantos F, Ergin MA. Thromboelastography-guided transfusion algorithm reduces transfusions in complex cardiac surgery. Anesth Analg 1999;88(2):312-9.
(63) Westbrook AJ, Olsen J, Bailey M, Bates J, Scully M, Salamonsen RF. Protocol based on thromboelastograph (TEG) out-performs physician preference using laboratory coagulation tests to guide blood replacement during and after cardiac surgery: a pilot study. Heart, lung & circulation 2009;18:277-88.

Technical report on perioperative patient blood management – Volume 1b July 2011 234
(64) Royston D, von Kier S. Reduced haemostatic factor transfusion using heparinase-modified thrombelastography during cardiopulmonary bypass. Br J Anaesth 2001;86(4):575-8.
(65) Spalding GJ, Hartrumpf M, Sierig T, Oesberg N, Kirschke CG, Albes JM. Cost reduction of perioperative coagulation management in cardiac surgery: value of 'bedside' thrombelastography (ROTEM). European Journal of Cardio-thoracic Surgery 2007;31(6):1052-7.
(66) Henry DA, Carless PA, Moxey AJ, O'Connell D, Stokes BJ, McClelland B, et al. Anti-fibrinolytic use for minimising perioperative allogeneic blood transfusion. Cochrane Database Syst Rev 2007;(4):CD001886.
(67) Abrishami A, Chung F, Wong J. Topical application of antifibrinolytic drugs for on-pump cardiac surgery: A systematic review and meta-analysis. Can J Anesth 2009;56(3):202-12.
(68) Schouten ES, van de Pol AC, Schouten ANJ, Turner NM, Jansen NJG, Bollen CW. The effect of aprotinin, tranexamic acid, and aminocaproic acid on blood loss and use of blood products in major pediatric surgery: A meta-analysis. Pediatric Critical Care Medicine 2009;10(2):182-90.
(69) Gurusamy KS, Li J, Sharma D, Davidson BR. Pharmacological interventions to decrease blood loss and blood transfusion requirements for liver resection. Cochrane Database of Systematic Reviews 2009;(4).
(70) McIlroy DR, Myles PS, Phillips LE, Smith JA. Antifibrinolytics in cardiac surgical patients receiving aspirin: A systematic review and meta-analysis. Br J Anaesth 2009;102(2):168-78.
(71) Henry D, Carless P, Fergusson D, Laupacis A. The safety of aprotinin and lysine-derived antifibrinolytic drugs in cardiac surgery: A meta-analysis. Can Med Assoc J 2009;180(2):183-93.
(72) Liu CM, Chen J, Wang XH. Requirements for transfusion and postoperative outcomes in orthotopic liver transplantation: A meta-analysis on aprotinin. World J Gastroenterol 2008;14(9):1425-9.
(73) Tzortzopoulou A, Cepeda MS, Schumann R, Carr DB. Antifibrinolytic agents for reducing blood loss in scoliosis surgery in children. Cochrane Database Syst Rev 2008;(3):CD006883.
(74) Kagoma YK, Crowther MA, Douketis J, Bhandari M, Eikelboom J, Lim W. Use of antifibrinolytic therapy to reduce transfusion in patients undergoing orthopedic surgery: A systematic review of randomized trials. Thromb Res 2009;123(5):687-96.
(75) Brown JR, Birkmeyer NJO, O'Connor GT. Meta-analysis comparing the effectiveness and adverse outcomes of antifibrinolytic agents in cardiac surgery. Circulation 2007;115(22):2801-13.
(76) Zufferey P, Merquiol F, Laporte S, Decousus H, Mismetti P, Auboyer C, et al. Do antifibrinolytics reduce allogeneic blood transfusion in orthopedic surgery? Anesthesiology 2006;105(5):1034-46.

Technical report on perioperative patient blood management – Volume 1b July 2011 235
(77) Arnold DM, Fergusson DA, Chan AKC, Cook RJ, Fraser GA, Lim W, et al. Avoiding transfusions in children undergoing cardiac surgery: A meta-analysis of randomized trials of aprotinin. Anesth Analg 2006;102(3):731-7.
(78) Gill JB, Rosenstein A. The Use of Antifibrinolytic Agents in Total Hip Arthroplasty. A Meta-analysis. J Arthroplasty 2006;21(6):869-73.
(79) Shiga T, Wajima Z, Inoue T, Sakamoto A. Aprotinin in major orthopedic surgery: A systematic review of randomized controlled trials. Anesth Analg 2005;101(6):1602-7.
(80) Sedrakyan A, Treasure T, Elefteriades JA. Effect of aprotinin on clinical outcomes in coronary artery bypass graft surgery: A systematic review and meta-analysis of randomized clinical trials. Journal of Thoracic and Cardiovascular Surgery 2004;128(3):442-8.
(81) Levi M, Cromheecke ME, Jonge ED, Prins MH, De Mol BJM, Briet E, et al. Pharmacological strategies to decrease excessive blood loss in cardiac surgery: A meta-analysis of clinically relevant endpoints. Lancet 1999;354(9194):1940-7.
(82) Fergusson D, Glass KC, Hutton B, Shapiro S. Randomized controlled trials of aprotinin in cardiac surgery: Could clinical equipoise have stopped the bleeding? Clin Trials 2005;2(3):218-29.
(83) Laupacis A, Fergusson D. Drugs to minimize perioperative blood loss in cardiac surgery: Meta- analyses using perioperative blood transfusion as the outcome. Anesth Analg 1997;85(6):1258-67.
(84) Fremes SE, Wong BI, Lee E, Mai R, Christakis GT, McLean RF, et al. Metaanalysis of prophylactic drug treatment in the prevention of postoperative bleeding. Annals of Thoracic Surgery 1994;58(6):1580-8.
(85) Fergusson DA, Hebert PC, Mazer CD, Fremes S, MacAdams C, Murkin JM, et al. A comparison of aprotinin and lysine analogues in high-risk cardiac surgery. New Engl J Med 2008;358(22):2319-31.
(86) Gagne JJ, Griesdale DE, Schneeweiss S. Aprotinin and the risk of death and renal dysfunction in patients undergoing cardiac surgery: a meta-analysis of epidemiologic studies. Pharmacoepidemiol Drug Saf 2009;18(4):259-68.
(87) Apostolakis E, Panagopoulos N, Koletsis EN, Crockett J, Stamou KH, Sourgiadaki E, et al. Influence of ultra-low-dose aprotinin on thoracic surgical operations: a prospective randomized trial. Journal of cardiothoracic surgery 2008;3:14.
(88) Colwell J, Chelly JE, Murkin JM, Stevens D, O'Keefe TJ, Hall R, et al. Randomized study of aprotinin effect on transfusions and blood loss in primary THA. Clin Orthop Relat Res 2007;(465):189-95.
(89) Grant MC, Kon Z, Joshi A, Christenson E, Kallam S, Burris N, et al. Is Aprotinin Safe to Use in a Cohort at Increased Risk for Thrombotic Events: Results From a Randomized, Prospective Trial in Off-Pump Coronary Artery Bypass. Annals of Thoracic Surgery 2008;86(3):815-22.

Technical report on perioperative patient blood management – Volume 1b July 2011 236
(90) Later AF, Maas JJ, Engbers FH, Versteegh MI, Bruggemans EF, Dion RA, et al. Tranexamic acid and aprotinin in low- and intermediate-risk cardiac surgery: a non-sponsored, double-blind, randomised, placebo-controlled trial. European Journal of Cardio-thoracic Surgery 2009;36:322-9.
(91) Leijdekkers VJ, Vahl AC, Mackaay AJC, Huijgens PC, Rauwerda JA. Aprotinin does not diminish blood loss in elective operations for infrarenal abdominal aneurysms: A randomized double-blind controlled trial. Annals of Vascular Surgery 2006;20(3):322-9.
(92) Mehraien A, Ghafari A, Mohammadi SS. Effect of topical aprotinin on early postoperative bleeding and ICU stay after coronary artery bypass graft surgeries. Pakistan Journal of Biological Sciences 2009;12:813-6.
(93) Nurozler F, Kutlu T, Kucuk G. Aprotinin for patients exposed to clopidogrel before Off-Pump coronary bypass. Asian Cardiovasc Thorac Ann 2008;16(6):483-7.
(94) Kongnyuy EJ, Wiysonge CS. Interventions to reduce haemorrhage during myomectomy for fibroids. Cochrane Database of Systematic Reviews 2009;(3).
(95) Murphy GJ, Mango E, Lucchetti V, Battaglia F, Catapano D, Rogers CA, et al. A randomized trial of tranexamic acid in combination with cell salvage plus a meta-analysis of randomized trials evaluating tranexamic acid in off-pump coronary artery bypass grafting. Journal of Thoracic and Cardiovascular Surgery 2006;132(3):475-80.
(96) Cid J, Lozano M. Tranexamic acid reduces allogeneic red cell transfusions in patients undergoing total knee arthroplasty: Results of a meta-analysis of randomized controlled trials. Transfusion 2005;45(8):1302-7.
(97) Hanif M, Nourei SM, Dunning J. Does the use of topical tranexamic acid in cardiac surgery reduce the incidence of post-operative mediastinal bleeding? Interact Cardiovasc Thorac Surg 2004;3(4):603-5.
(98) Ho KM, Ismail H. Use of intravenous tranexamic acid to reduce allogeneic blood transfusion in total hip and knee arthroplasty: A meta-analysis. Anaesth Intensive Care 2003;31(5):529-37.
(99) Martin-Hirsch PL, Kitchener H. Interventions for preventing blood loss during the treatment of cervical intraepithelial neoplasia. Cochrane Database Syst Rev 1999;(2):CD001421.
(100) Armellin G, Casella S, Guzzinati S, Pasini L, Marcassa A, Giron G. Tranexamic acid in aortic valve replacement. Journal of cardiothoracic and vascular anesthesia 2001;15(3):331-5.
(101) Alvarez JC, Santiveri FX, Ramos I, Vela E, Puig L, Escolano F. Tranexamic acid reduces blood transfusion in total knee arthroplasty even when a blood conservation program is applied. Transfusion 2008;48(3):519-25.
(102) Athanasiadis T, Beule AG, Wormald PJ. Effects of topical antifibrinolytics in endoscopic sinus surgery: a pilot randomized controlled trial. American journal of rhinology 2007;21:737-42.

Technical report on perioperative patient blood management – Volume 1b July 2011 237
(103) Chen CC, Wang CC, Wang CP, Lin TH, Lin WD, Liu SA. Prospective, randomized, controlled trial of tranexamic acid in patients who undergo head and neck procedures. Otolaryngology head and neck surgery : official journal of American Academy of Otolaryngology Head and Neck Surgery 2008;138:762-7.
(104) Choi WS, Irwin MG, Samman N. The effect of tranexamic acid on blood loss during orthognathic surgery: a randomized controlled trial. Journal of Oral and Maxillofacial Surgery 2009;67:125-33.
(105) Elwatidy S, Jamjoom Z, Elgamal E, Zakaria A, Turkistani A, El Dawlatly A. Efficacy and safety of prophylactic large dose of tranexamic acid in spine surgery: a prospective, randomized, double-blind, placebo-controlled study. Spine 2008;33:2577-80.
(106) Fawzy H, Elmistekawy E, Bonneau D, Latter D, Errett L. Can local application of Tranexamic acid reduce post-coronary bypass surgery blood loss? A randomized controlled trial. Journal of cardiothoracic surgery 2009;4:25.
(107) Jabalameli M, Zakeri K. Evaluation of topical tranexamic acid on intraoperative bleeding in endoscopic sinus surgery. Iranian Journal of Medical Sciences 2006;31:221-3.
(108) Jimenez JJ, Iribarren JL, Lorente L, Rodriguez JM, Hernandez D, Nassar I, et al. Tranexamic acid attenuates inflammatory response in cardiopulmonary bypass surgery through blockade of fibrinolysis: a case control study followed by a randomized double-blind controlled trial. Critical Care 2007;11:R117.
(109) Maddali MM, Rajakumar MC. Tranexamic acid and primary coronary artery bypass surgery: a prospective study. Asian Cardiovasc Thorac Ann 2007;15:313-9.
(110) Mayur G, Patel P, Gupta A, Desai P. Efficacy of tranexamic acid in decreasing blood loss during and after cesarean section: a randomized case controlled prospective study. Journal of Obstetrics and Gynaecology of India 2007;57:228-30.
(111) Mehr AA, Sadeghi M, Madani cM. Does tranexamic acid reduce blood loss in off-pump coronary artery bypass? Asian Cardiovasc Thorac Ann 2007;15:285-9.
(112) Sadeghi M, Mehr AA. Does a single bolus dose of tranexamic acid reduce blood loss and transfusion requirements during hip fracture surgery? A prospective randomized double blind study in 67 patients. Acta Medica Iranica 2007;45:437-42.
(113) Sekhavat L, Tabatabaii A, Dalili M, Farajkhoda T, Tafti AD. Efficacy of tranexamic acid in reducing blood loss after cesarean section. The journal of Maternal Fetal & Neonatal Medicine 2009;22:72-5.
(114) Taghaddomi RJ, Mirzaee A, Attar AS, Shirdel A. Tranexamic Acid Reduces Blood Loss in Off-Pump Coronary Artery Bypass Surgery. Journal of cardiothoracic and vascular anesthesia 2009;23(3):312-5.
(115) Wong J, El Beheiry H, Rampersaud YR, Lewis S, Ahn H, De Silva Y, et al. Tranexamic Acid reduces perioperative blood loss in adult patients having spinal fusion surgery. Anesth Analg 2008;107:1479-86.

Technical report on perioperative patient blood management – Volume 1b July 2011 238
(116) Munoz JJ, Birkmeyer NJ, Birkmeyer JD, O'Connor GT, Dacey LJ. Is epsilon-aminocaproic acid as effective as aprotinin in reducing bleeding with cardiac surgery?: a meta-analysis. Circulation 1999;99(1):81-9.
(117) Gharebaghian M, Eghtesadi AP. The efficacy of epsilon-aminocaproic acid and its timing in reducing blood loss in major cardiac coronary bypass surgery: A randomized double-blinded placebo-controlled study. International Journal of Pharmacology 2006;2:131-5.
(118) Berenholtz SM, Pham JC, Garrett ME, Atchison CW, Kostuik JP, Cohen DB, et al. Effect of epsilon aminocaproic acid on red-cell transfusion requirements in major spinal surgery. Spine 2009;34:2096-103.
(119) Crescenzi G, Landoni G, Biondi-Zoccai G, Pappalardo F, Nuzzi M, Bignami E, et al. Desmopressin reduces transfusion needs after surgery: A meta-analysis of randomized clinical trials. Anesthesiology 2008;109(6):1063-76.
(120) Cattaneo M, Harris AS, Stromberg U, Mannucci PM. The effect of desmopressin on reducing blood loss in cardiac surgery - A meta-analysis of double-blind, placebo-controlled trials. THROMB HAEMOST 1995;74(4):1064-70.
(121) De Sio M, Autorino R, Quarto G, Calabro F, Damiano R, Giugliano F, et al. Modified Supine versus Prone Position in Percutaneous Nephrolithotomy for Renal Stones Treatable with a Single Percutaneous Access: A Prospective Randomized Trial. Eur Urol 2008;54(1):196-203.
(122) Ko MT, Chuang KC, Su CY. Multiple analyses of factors related to intraoperative blood loss and the role of reverse Trendelenburg position in endoscopic sinus surgery. Laryngoscope 2008;118(9):1687-91.
(123) Pace A, Yousef A. The effect of patient position on blood loss in primary cemented total hip arthroplasty. Archives of Orthopaedic and Trauma Surgery 2008;128(10):1209-12.
(124) Ong SM, Taylor GJSC. Can knee position save blood following total knee replacement? Knee Surgery 2003;10(1):81-5.
(125) Widman J, Isacson J. Lateral position reduces blood loss in hip replacement surgery: A prospective randomized study of 74 patients. Int Orthop 2001;25(4):226-7.
(126) Park CK. The effect of patient positioning on intraabdominal pressure and blood loss in spinal surgery. Anesth Analg 2000;91(3):552-7.
(127) Henry DA, Carless PA, Moxey AJ, O'Connell D, Forgie MA, Wells P, et al. Pre-operative autologous donation for minimising perioperative allogeneic blood transfusion. Cochrane Database of Systematic Reviews 2001.
(128) Vamvakas EC. Meta-analysis of randomized controlled trials comparing the risk of postoperative infection between recipients of allogeneic and autologous blood transfusion. Vox Sang 2002;83(4):339-46.
(129) Laupacis A, Fergusson D. The efficacy of technologies to minimise peri-operative allogeneic transfusion. In: Smith Sibinga CTh, Das PC, Fratantoni JC, editors. Alternative

Technical report on perioperative patient blood management – Volume 1b July 2011 239
approaches to human blood resources in clinical practice.Dordrecht, The Netherlands: Kluwer Academic Publishers; 1998. p. 17-36.
(130) Forgie MA, Wells PS, Laupacis A, Fergusson D. Preoperative autologous donation decreases allogeneic transfusion but increases exposure to all red blood cell transfusion: Results of a meta- analysis. Arch Intern Med 1998;158(6):610-6.
(131) Bouchard D, Marcheix B, Al Shamary S, Vanden Eynden F, Demers P, Robitaille D, et al. Preoperative autologous blood donation reduces the need for allogeneic blood products: A prospective randomized study. Canadian Journal of Surgery 2008;51(6):422-7.
(132) Hashimoto T, Kokudo N, Orii R, Seyama Y, Sano K, Imamura H, et al. Intraoperative blood salvage during liver resection: A randomized controlled trial. Annals of surgery 2007;245(5):686-91.