patient-based abdominal aortic aneurysm rupture …einav/pdf/ccv no.120.pdf · 2010-10-20 ·...
TRANSCRIPT

Patient-Based Abdominal Aortic Aneurysm Rupture Risk Prediction
with Fluid Structure Interaction Modeling
MICHALIS XENOS,1 SURAJ H. RAMBHIA,1 YARED ALEMU,1 SHMUEL EINAV,1 NICOS LABROPOULOS,3
APOSTOLOS TASSIOPOULOS,3 JOHN J. RICOTTA,2,3 and DANNY BLUESTEIN1
1Department of Biomedical Engineering, Stony Brook University, HSC T18-030, Stony Brook, NY 11794-8181, USA;2Department of Surgery, Washington Hospital Center, Washington, DC, USA; and 3Department of Surgery, Stony Brook
University Hospital, Stony Brook, NY, USA
(Received 11 November 2009; accepted 1 June 2010; published online 15 June 2010)
Associate Editor Peter E. McHugh oversaw the review of this article.
Abstract—Elective repair of abdominal aortic aneurysm(AAA) is warranted when the risk of rupture exceeds thatof surgery, and is mostly based on the AAA size as a cruderupture predictor. A methodology based on biomechanicalconsiderations for a reliable patient-specific prediction ofAAA risk of rupture is presented. Fluid–structure interaction(FSI) simulations conducted in models reconstructed fromCT scans of patients who had contained ruptured AAA(rAAA) predicted the rupture location based on mapping ofthe stresses developing within the aneurysmal wall, addition-ally showing that a smaller rAAA presented a higher rupturerisk. By providing refined means to estimate the risk ofrupture, the methodology may have a major impact ondiagnostics and treatment of AAA patients.
Keywords—Ruptured abdominal aortic aneurysm, Aneurys-
mal strength, Rupture potential index, Fluid–structure inter-
action, Reconstruction of patient based geometry.
INTRODUCTION
Pathophysiology of the Aorta
Abdominal aortic aneurysms (AAAs) are irrevers-ible dilations of the abdominal aortic wall due togradual weakening and remodeling, which alter bloodflow patterns. As the aneurysm grows, elevated walltension may cause rupture. The disease risk isincreased in patients who have coronary, carotid, orperipheral vascular diseases, history of smoking, orfamily history of aneurysmal disease.67 Progression ofthe disease can ultimately result in rupture of the
abdominal aorta, which has mortality rates of 50–75%.2 Current recommendations, based on prospec-tive studies, indicate AAA should be repaired when themaximal diameter exceeds 5.0–5.5 cm.31,38 However,the risk of rupture is multifactorial involving otherculprits in addition to aneurysmal size.30 These factorsinclude the AAA configuration (fusiform vs. saccular)vessel tortuosity, and the presence of thrombus andcalcifications (Ca). Several clinical studies emphasizedthe elevated rupture risk of larger aneurysms; however,small diameter aneurysms are known to rupture.7,10,38
Accordingly, physicians monitor patients having smalldiameter AAAs (4.0–5.5 cm) through serial imagingstudies to document growth rate and absolute size todetermine the need for intervention. It is generallyaccepted that even small aneurysms that show rapidgrowth (more than 5 mm in a 6-month period) shouldbe operated on due to imputed increased rupture risk.
Biomechanical Properties
Larger AAAs have higher risk of rupture,1,32 sug-gesting that strength degrades with increasing AAAsize.55 There is a significant reduction in AAAs walltensile strength as compared to non-aneurysmal tis-sue.40 Recent ex-vivo studies of AAA biomechanicalproperties focused on the extracellular matrix structureand basic properties related to wall stiffness. Currently,only limited means are available for estimating theaneurysmal wall stress and strength in vivo, necessi-tating ex-vivo specimen testing. Uniaxial stretch testsshowed AAA specimen to be stiffer, less distensible,with decreased wall strength than healthy aortic tissue,attributed to their lower elastin content.21,41,62 Ini-tially, uniaxial testing of abdominal aortic tissue
Address correspondence to Danny Bluestein, Department of Bio-
medical Engineering, Stony Brook University, HSC T18-030, Stony
Brook, NY 11794-8181, USA. Electronic mail: danny.bluestein@
sunysb.edu
Annals of Biomedical Engineering, Vol. 38, No. 11, November 2010 (� 2010) pp. 3323–3337
DOI: 10.1007/s10439-010-0094-3
0090-6964/10/1100-3323/0 � 2010 Biomedical Engineering Society
3323

specimens was used to characterize the mechanicalbehavior of the tissue by using nonlinear hyperelasticmaterial models of the isotropic Mooney-Rivlin for-mulation.33,39 However, biaxial testing of AAA speci-mens that was used to characterize the directionalstress–strain properties of the tissue,56 indicated thatAAA tissue is better characterized by hyperelasticmaterial models with anisotropic properties, e.g.,orthotropic material models.24,25 The intraluminalthrombus (ILT) is heterogeneous material composedof three distinct layers with different mechanicalproperties. Recent studies have shown that the luminallayer of ILT behaves as an isotropic material.13,54,63
Non-invasive Imaging Modalities
Advances in image reconstruction techniques withanatomical surface rendering, increases the amount ofuseful information these studies can provide. Dataobtained from imaging modalities, such as CT, can bereconstructed accurately visualizing the 3D morphol-ogy of AAAs. While imaging modalities provide aqualitative tool for diagnosing patient conditions,there is still a need to accurately quantify the param-eters that predict the rupture risk. Wall stress com-puted from 3D rendering of patient-specific AAAprovide assessment of rupture risk specific to theindividual patient rather than AAA diameter or otherpreviously proposed clinical indices.
Computational Simulations and Fluid–StructureInteraction Models
The improving resolution of clinical imagingmodalities and advanced 3D reconstruction techniquesprovide qualitative and partially quantitative tech-niques for diagnosing vascular pathologies. However,they do not provide quantitative information of theluminal blood flow patterns and their complex inter-action with the vessel wall. Owing to the inherentlimitations of measuring directly or estimating indi-rectly the wall stresses or tissue strength of AAAsin vivo, computational models offer a robust alterna-tive. The luminal hemodynamics and the resultingpressure distribution induce wall shear stresses (WSSs)and contribute to the stresses developing within theaneurysmal wall, thus increasing the risk of rupture.Computational models map and quantify the stressesdeveloping within the aneurysmal wall and can helpclinicians determine the need for surgical intervention.A proper model for accurate prediction of stressesdeveloping within the AAA wall requires patient-spe-cific AAA geometries, blood flow parameters, dynamicflow patterns, appropriate material models thatdescribe the mechanical response of AAA tissue, and
information about the local wall thickness and itsvariability where available.
Fillinger et al.18 have shown that computationalmodels using static uniform internal pressure can be12% more accurate and 13% more sensitive than usingmaximum diameter as sole rupture risk predictor.Furthermore, the impact of wall stress as related todiameter on aneurysm rupture and progression hasbeen studied.16,52 Di Martino et al. have shown thatthe presence of ILT can significantly reduce wallstresses.12–15 Fluid–structure interaction (FSI) simula-tions, in which a fully coupled dynamic interactionbetween the AAA hemodynamics and wall deforma-tions is modeled, were conducted by our group andothers to simulate the biomechanical behavior of theAAA wall.3,14,18,36,48,60
Most previous FSI studies were based on isotropicmaterial models that exclude the directional responseof abdominal aortic tissue to stresses. Our group per-formed FSI studies in patient-specific geometriesreconstructed from CT scans in AAAs of differingconfigurations, both with and without ILT.3,44 Com-plex flow trajectories within the AAA lumen indicateda putative mechanism for the formation and growth ofthe ILT. The resulting magnitude and location of thepeak wall stresses were dependent on the shape of theAAA. Our data suggest that thrombus reduce stresseson the aneurysmal wall without significantly changinglocation of maximal stress.
Our group has recently performed FSI simula-tions44,61 wherein experimental data of AAA of biaxialstress measurements56 were fitted to an orthotropicmaterial model which models vessel tissue as fiber-reinforced composite material.22–29 In this study, wetest our methodology for assessing AAA rupture riskusing cases of ruptured AAA (rAAA). We furthercompare rAAAs to normal abdominal aortas (numberof subjects studied: two normal subjects, one non-ruptured AAA, and two rAAAs), and characterizebiomechanical features of AAA and the role of ILTand Ca.
METHODS
The main aim of this study was to test whether themethodology developed would be able to predict anactual rupture of AAA on a patient-specific basis. Wehave carefully studied two patients who arrived at theStony Brook University Hospital ER with containedruptured aneurysms (where the AAA shape remainedintact—rAAA). We then analyzed whether regions ofthe highest wall stress concentrations predicted byadvanced numerical simulations in the reconstructedgeometries overlap with the actual rupture locations.
XENOS et al.3324

We further studied and compared the results to casesof normal aortas and cases of AAAs that did notrupture.
Acquisition of CT Data
Abdominal computed tomography (CT) scans wereacquired with intravenous contrast, which is the stan-dard of care for AAA disease patients, from patientswho arrived at the Stony Brook University HospitalER with contained rAAA, retrospectively. CT scans ofnormal aortas were also obtained to be used as controlcases. Informed consent was obtained retrospectively.The protocol was approved by Stony Brook UniversityInstitutional Review Boards (IRB) Committees onResearch Involving Human Subjects.
Patient-Specific Approach for Fluid–StructureInteraction
The coordinate points and dimensions of patient-specific AAA geometry were extracted from the CTscans, including anatomical details of the vessel wall,lumen, ILT, and Ca. For both the normal and path-ological abdominal aortas, boundaries of the recon-structions were established from just below the renalarteries branching until 4.0 cm distal to the iliacbifurcation (except for rAAA2 where the reconstructedgeometry ends just above the iliac bifurcation). Othersmaller arteries, such as the gonadal and lumbar/spinalarteries, the inferior mesenteric artery and the mediansacral artery were neglected due to lack of informationabout the blood flow exiting these arteries and theirmarginal effect on AAA hemodynamics. A uniformthickness of 2 mm was assigned to the AAA wall, asused in previous studies of patient-specific geome-tries.11,36,56,65 The parallel plane scans were translatedinto 3D images using Mimics (Mimics, Materialise,Leuven, Belgium) and converted into numerical me-shes using a grid generation package Gambit (AnsysInc., Canonsburg, PA). The 3D geometries were fur-ther discretized into triangular elements for FSI sim-ulations using the software package ADINA (ADINAR&D, Inc., Watertown, MA).
Description of the Two rAAAs
Reconstructed geometries of the two rAAA casescan be seen in Fig. 1 and are classified as fusiformaneurysms. The abdominal aorta descends normallyslightly to the left of the midline in both cases untilapproximately L2 vertebra, after which the aneurysmalbulge can be observed. Aneurysmal rupture of the firstpatient is located at the iliac bifurcation superior to theleft common iliac artery and inferior to the aneurysmal
bulge and ILT. The first patient has several Caembedded circumferentially below the ILT at theregion of rupture. The second patient exhibited rupturesuperior to the ILT along the widening neck inlet ofthe aneurysmal bulge. The second patient has a singlemicrocalcification found at the region of rupture.Larger calcified plaques were observed in the secondpatient, surrounding the aneurysmal bulge and iliacarteries. The ILT of the first patient was posterior tothe luminal aneurysmal bulge while ILT of the secondpatient was anterior to the luminal aneurysmal bulge.Table 1 shows various geometrical features of normaland AAA geometries.
Material Properties of the Aortic Wall
Isotropic and orthotropic material model formula-tions have been used in this study. The orthotropicmaterial formulation models the arterial wall as acomposite deformable structure that exhibits nonlinearstress–strain relationship with exponential stiffening athigh stresses. This stiffening effect results from theembedded mesh of collagen fibers which lead to the
FIGURE 1. Structure and components of ruptured AAA(rAAA) used for the numerical simulations, reconstructedfrom patients CT scans, (A) Rendering of rAAA1 where a lat-eral rupture occurred at the AAA bottom, from left of centerabove the iliac bifurcation till above the left iliac; (B) Ren-dering of rAAA2 where a lateral rupture occurred superior tothe ILT across the widening inlet of the aneurysmal neck. Thecomposite of the AAA components depicts the (a) lumen ofthe AAA (red) relative to the skeletal bone structure, (b)intraluminal thrombus added (ILT—blue), and (c) calcifica-tions (green) and the outer wall (transparent) added.
Patient-Based AAA Rupture Risk Prediction with FSI Modeling 3325
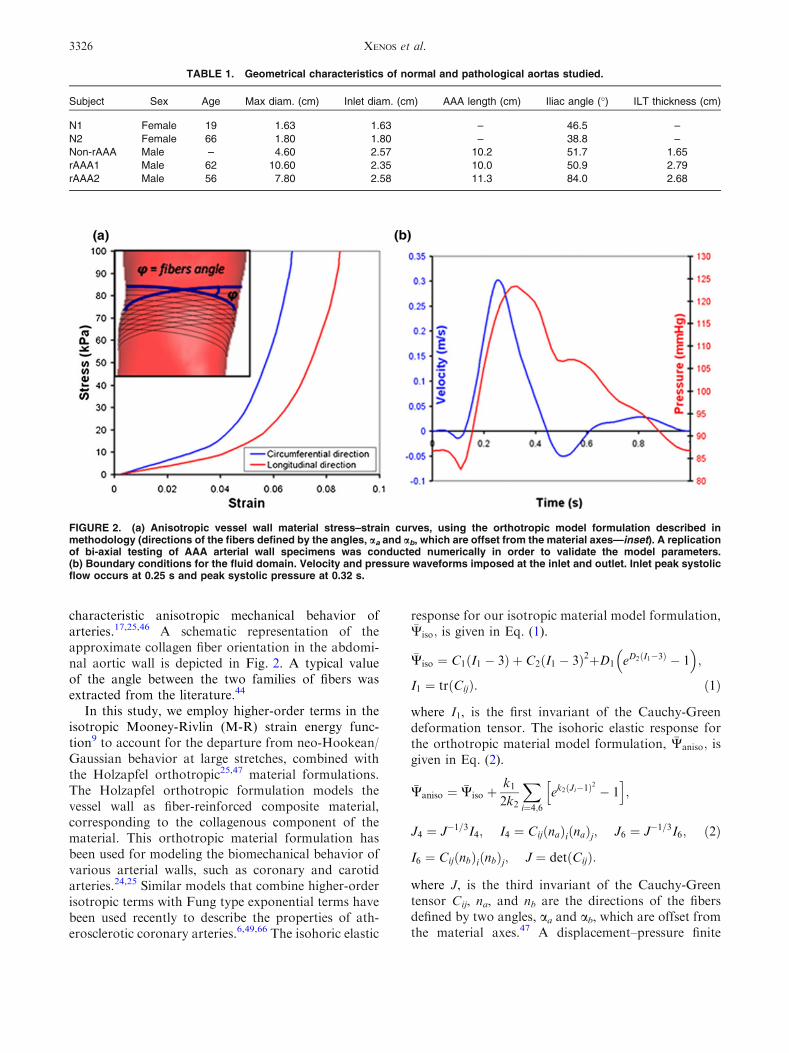
characteristic anisotropic mechanical behavior ofarteries.17,25,46 A schematic representation of theapproximate collagen fiber orientation in the abdomi-nal aortic wall is depicted in Fig. 2. A typical valueof the angle between the two families of fibers wasextracted from the literature.44
In this study, we employ higher-order terms in theisotropic Mooney-Rivlin (M-R) strain energy func-tion9 to account for the departure from neo-Hookean/Gaussian behavior at large stretches, combined withthe Holzapfel orthotropic25,47 material formulations.The Holzapfel orthotropic formulation models thevessel wall as fiber-reinforced composite material,corresponding to the collagenous component of thematerial. This orthotropic material formulation hasbeen used for modeling the biomechanical behavior ofvarious arterial walls, such as coronary and carotidarteries.24,25 Similar models that combine higher-orderisotropic terms with Fung type exponential terms havebeen used recently to describe the properties of ath-erosclerotic coronary arteries.6,49,66 The isohoric elastic
response for our isotropic material model formulation,�Wiso; is given in Eq. (1).
�Wiso ¼ C1 I1 � 3ð Þ þ C2 I1 � 3ð Þ2þD1 eD2ðI1�3Þ � 1� �
;
I1 ¼ trðCijÞ: ð1Þ
where I1, is the first invariant of the Cauchy-Greendeformation tensor. The isohoric elastic response forthe orthotropic material model formulation, �Waniso; isgiven in Eq. (2).
�Waniso ¼ �Wiso þk12k2
Xi¼4;6
ek2ðJi�1Þ2
� 1h i
;
J4 ¼ J�1=3I4; I4 ¼ CijðnaÞiðnaÞj; J6 ¼ J�1=3I6; ð2Þ
I6 ¼ CijðnbÞiðnbÞj; J ¼ detðCijÞ:
where J, is the third invariant of the Cauchy-Greentensor Cij, na, and nb are the directions of the fibersdefined by two angles, aa and ab, which are offset fromthe material axes.47 A displacement–pressure finite
TABLE 1. Geometrical characteristics of normal and pathological aortas studied.
Subject Sex Age Max diam. (cm) Inlet diam. (cm) AAA length (cm) Iliac angle (�) ILT thickness (cm)
N1 Female 19 1.63 1.63 – 46.5 –
N2 Female 66 1.80 1.80 – 38.8 –
Non-rAAA Male – 4.60 2.57 10.2 51.7 1.65
rAAA1 Male 62 10.60 2.35 10.0 50.9 2.79
rAAA2 Male 56 7.80 2.58 11.3 84.0 2.68
FIGURE 2. (a) Anisotropic vessel wall material stress–strain curves, using the orthotropic model formulation described inmethodology (directions of the fibers defined by the angles, aa and ab, which are offset from the material axes—inset). A replicationof bi-axial testing of AAA arterial wall specimens was conducted numerically in order to validate the model parameters.(b) Boundary conditions for the fluid domain. Velocity and pressure waveforms imposed at the inlet and outlet. Inlet peak systolicflow occurs at 0.25 s and peak systolic pressure at 0.32 s.
XENOS et al.3326

element formulation was used where the pressure is nota part of the potential function, �W; and is separatelyinterpolated.49 The combined strain energy formula-tion above44 produced excellent fit to previously pub-lished biaxial stretching experimental data with AAAspecimens.56 The parameters that best fit the model areshown in Table 2 (R2 = 0.99). The ILT material wasmodeled as linear elastic with a Young’s modulus of0.11 MPa and a Poisson ratio of 0.45.13,36 Microcal-cifications were assumed to behave as a stiff isotropicmaterial with properties summarized in Table 2.4,59
Adjustment of the Material Modelto Experimental Data
The combined strain energy formulation describedabove produced excellent fit44 to previously publishedAAA arterial wall specimens that were tested bybiaxial stretching.56,61 The stress–strain relationship inthe circumferential and longitudinal directions wasmatched against the experimental results44 to producethe stress–strain curves in Fig. 2 that were employed inthe FSI simulations.
FSI Methodology
The fluid domain is governed by the Navier–Stokes and the continuity equations. The ArbitraryLagrangian Eulerian moving mesh approach is utilizedfor re-meshing the fluid domain at each time step. Thenumerical simulations utilize direct coupling betweenthe blood, and the solid, vessel wall. Large strains andlarge deformations are considered. The dynamics ofthe flexible wall are calculated using a linear dynamicsresponse.45 A finite-element scheme is used to solve theset of motion and fluid equations using the ADINAsoftware package. For the fluid domain, time-depen-dent flow and pressure conditions measured by Olufsenet al.35 are prescribed as boundary conditions at theoutlet and inlet of the AAA geometry, Fig. 2. At theinlet, velocity waveform covers the complete cardiaccycle with velocity range from 0.3 m/s to 20.05 m/s.At the outlet, a physiological pressure waveformboundary condition ranging between 123 and83 mmHg is employed. Blood is modeled as ahomogenous Newtonian fluid, with a density of
1035 kg/m3 and a viscosity of 3.5 cP,44 and the flowwas considered laminar. All the models are assumed tobe initially at zero stress state, and the residual stressfield in the unloaded configurations was not consid-ered. An initial stress loading is achieved by pressur-izing the AAA from 0 to 90 mmHg with zero flow for1 s, before the FSI waveforms are applied. For thesolid domain, all degrees of freedom are fixed at theinlet and outlets.
FSI Interface Conditions
For the FSI interface, the following conditions wereapplied: (i) displacements of the fluid and solid domainare compatible, (ii) stresses at this boundary are atequilibrium, and (iii) no-slip condition for the fluid.These interface conditions are given in the followingequations:
ds ¼ df ð3Þ
rs � n ¼ rf � n ð4Þ
qs ¼ qf ð5Þ
where d, r, q, and n are the vector of displacement, thestress tensor, the velocity vector, and the normal vectoron the boundary, respectively. The subscripts s, and findicate the solid and the fluid, respectively.53
Wall Strength and Rupture Potential Index
A statistical model of non-invasive means to calcu-late in vivo wall strength distribution was employed.55
It lumps together significant clinical and geometricpredictors to yield a local value of the wall strength,Eq. (6):
Strength ¼ 71:9� 37:9 ILT1=2 � 0:81� �
� 15:6 NORD� 2:46ð Þ � 21:3HIST
þ 19:3 SEX: ð6Þ
where ILT is the local attached ILT thickness in cm;NORD is the local diameter normalized to the diam-eter of non-aneurysmal aorta (infrarenal) estimatedfrom the patient’s age and sex39; HIST is the family
TABLE 2. Material properties for the fibrous wall used in the FSI simulations.
Material coefficients
Isotropic coefficients Anisotropic coefficients
C1 (Pa) C2 (Pa) D1 (Pa) D2 k1 (Pa) k2 aao ab
o
Wall 8,888 164,900 48.7 53.46 1,886 94.75 50 2650
Calcification 92,000 – 36,000 2.0 – – – –
Patient-Based AAA Rupture Risk Prediction with FSI Modeling 3327
history (½ with history, 2½ without history); andSEX is patient’s gender (½ male, 2½ female). Moredetails about the model can be found elsewhere.55
This model is used to generate 3D mapping of thewall strength, which is then compared to the localstress distribution, to generate a map of a rupturepotential index (RPI), defined as the ratio between thelocally acting wall stress (calculated by FSI) and thelocal wall strength:
RPI ¼ Local wall stress obtained from FSI ðN=cm2ÞLocal wall strength ðN=cm2Þ :
ð7Þ
Each global predictor variable, e.g., family history andAAA size, were obtained from each patient’s hospitalchart, while spatially varying predictor variables, localdiameter and ILT thickness, were measured from CTimages.
RESULTS
Five geometries of normal to pathological andruptured abdominal aortas are presented, generallyrepresenting aneurysmal characterization during dis-ease progression (two normal subjects, one non-rup-tured AAA, and two rAAAs). The non-ruptured AAAcase that is included here for comparison was previ-ously studied by our group.44 Results obtained fromthe FSI simulations are presented in Figs. 3 and 4 (von
Mises stress distributions are a product of the isotropicmodel formulation simulations, whereas the principalaxis stress distributions are of the anisotropic materialmodel formulations).
Blood Flow Through Aneurysmal and Normal Aortas
Velocity vector fields for all cases are presented inFig. 4a, 0.15 s after peak systole of the cardiac cycle.This specific time was chosen because distinct flowpatterns that are relevant to aneurysmal disease areprominent at this phase of the cardiac cycle. Duringpeak systole, flow patterns in normal aortas showsimilar characteristic velocity profiles, with peak valuesreaching vN1 = 0.36 m/s and vN2 = 0.37 m/s respec-tively in the abdominal aorta region. At end diastole,peak velocities decrease to vN1 = 0.03 m/s andvN2 = 0.023 m/s. The FSI simulation of normal sub-ject 1, a 19-year-old female, does not show any visiblerecirculation zones during diastole. On the other hand,the FSI simulation predicts a distinct recirculationzone in the abdominal aorta during diastole for normalsubject 2, a 66-year-old female, due to slight wideningof the lumen superior to the iliac bifurcation as com-pared to the vessel inlet.
For all aneurysmal cases, the flow patterns duringpeak systole change dramatically as compared tohealthy aortas. The abrupt expansion from the aneu-rysm neck to the dilated AAA lumen, typical of AAAdisease induces a rapid decrease in the velocities cou-pled with the formation of complex flow patterns. Peak
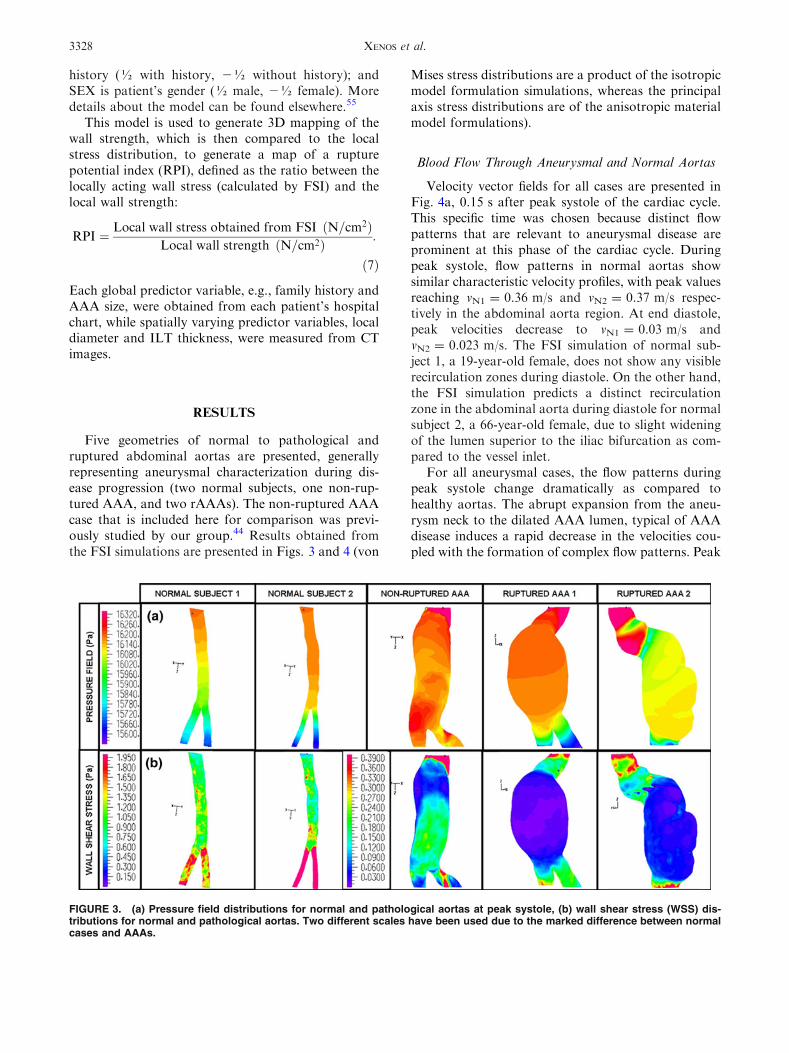
FIGURE 3. (a) Pressure field distributions for normal and pathological aortas at peak systole, (b) wall shear stress (WSS) dis-tributions for normal and pathological aortas. Two different scales have been used due to the marked difference between normalcases and AAAs.
XENOS et al.3328

velocities for the rAAA simulations reduce to vrAAA1 =
0.04 m/s in the aneurysmal area (0.36 m/s at the neckof the aneurysm) and vrAAA2 = 0.07 m/s in the aneu-rysmal area (0.34 m/s at the neck of the aneurysm).During diastole, large, diffuse, recirculation zones areformed in both rAAAs models. These large recircula-tion zones span almost the entire diameter of theaneurysmal bulge. In both pathological cases, smallerrecirculation zones can be observed in the flow field,occurring either at the inlet of the aneurysm or close tothe stagnation area of the iliac bifurcation duringdiastole, producing highly complex flow patterns.Maximum velocity during diastole is vrAAA1 =
0.015 m/s and vrAAA2 = 0.023 m/s, respectively.The abrupt changes in the velocity field within the
aneurysm and the apparent changes in the flow patternsresult also in significant changes in the luminal pressuredistribution as compared to the normal aortas. As de-picted in Fig. 3a at peak systole. At peak systole, thetypical blood pressure acting on the wall at the normalaortas 1 cm above the iliacs was 120.4 mmHg, whereas
in the pathological cases it was, 122.5 mmHg for rAAA1(2.1 mmHg higher) and 122.8 mmHg for rAAA2(2.4 mmHg higher). The blood pressure during diastolewas also higher in the pathological cases as compared tothe normal cases. For instance at 60% of the cardiaccycle (early diastole), the pressure in the normal aorta1 cm above the iliacs was 104.5 mmHg whereas thepressure at the same location was 104.9 mmHg(0.4 mmHg higher) for both rAAAs. The pressure in therAAAs also remained almost constant throughout theaneurysm and dropped abruptly in the iliacs, in contrastto the normal cases where the pressure was droppinglinearly downstream.This indicates that, inAAAs, thereis an increase in the pressure acting on the aortic wall,which is not compensated by the expected downstreampressure drop.
Wall shear stress distributions during peak systoleindicate that rAAA have significantly lower overallWSS (peak values WSSrAAA1 = 0.3 Pa, WSSrAAA2 =
0.27 Pa) as compared to normal aortas (peak valuesWSSN1 = 1.87 Pa, WSSN2 = 2.4 Pa), as shown in
FIGURE 4. (a) Coronal cross-sectional view of velocity vector fields 0.15 s after peak systole depicting aneurysmal diseasecharacterization. Marked differences are evident in the flow patterns and the velocities of normal to pathological aortas, (b) vonMises stress in the aortic wall for the isotropic material model formulation, and (c) Principal axis stress, p1 in the aortic wall for theanisotropic material model formulation.
Patient-Based AAA Rupture Risk Prediction with FSI Modeling 3329

Fig. 3b at peak systole. However, there are small localregions in rAAAs close to the aneurysmal necks andsuperior to the ILT locations where the WSS levelsremain high throughout the cardiac cycle.
Wall Stress Distributions Within the AbdominalAortic Wall
Results of FSI simulations during peak systole withisotropic and anisotropicwall formulations are presentedin Table 3 and Figs. 4b, 4c, with von-Mises stressesreported for the isotropic simulations and principal axis(p1) wall stresses reported for the anisotropic simulations,correspondingly. There is a general trend of rising wallstresses fromnormal aortas to non-ruptured and rAAAs.Isotropic simulations for normal aortas reach a maxi-mum peak systolic von-Mises stress of 0.35 and0.44 MPa, correspondingly. rAAA cases produce muchhigher wall stresses, with maximum von Mises stressesreaching rvM rAAA1 = 1.09 MPa and rvM rAAA2 =
2.1 MPa during peak systole, correspondingly. The FSIanisotropic material simulations (Fig. 4c) follow thesame trend with principal axis stress, p1, significantlyincreasing from normal to pathological cases. Normalsubject models predict peak values of p1N1 = 0.37 MPaand p1N2 = 0.54 MPa, correspondingly. rAAA casesreachpeakvalues of p1rAAA1 = 1.37 MPaand p1rAAA2 =
2.17 MPa, correspondingly. It should be noted that themodel of the smaller ruptured aneurysm (rAAA2 =
7.8 cm) exhibited much higher peak stress (58% higher)than the larger one (rAAA1 = 10.6 cm).
All anisotropic simulations showed higher peak wallstresses as compared to the isotropic material modelformulation. Specifically, in the normal aortas, therewas a stress increase of 6% for the first case and 22.7%for the second case when applying the anisotropicmaterial model formulation. For the pathologicalcases, this increase was 25.7% for the first rAAA, and3.3% for the second rAAA. On average, there was a378% increase in peak wall stress when comparing thefirst normal case to the two rAAA cases (for theanisotropic material formulation). Both von Mises
distribution for the isotropic material formulation andprincipal axis stresses distribution for the anisotropicmaterial formulation became highly non-uniform asthe vessel wall progressed from a normal to an aneu-rysmal pathology.
The FSI simulations performed in both patients withrAAA indicated highest stresses along the actual ruptureline (Fig. 5, rAAA1), with excellent agreement betweenthe two. In these simulations, the highest stressesoccurred on the anterior side of the AAA (opposite tothe ILT). For the first patient with rAAA configuration(rAAA1), the ILT seemed to offer a significant protec-tive effect by reducing the stresses in the surroundingwall region (Fig. 5, purple). Two major locations ofstress concentrations were predicted from the FSI sim-ulations, one at the location of the actual rupture andone close to the neck of the aneurysm (Fig. 5, inset). TheCa (green) embedded along the rupture line create stressconcentration (unlike the bigger Ca that appear depos-ited (not embedded) on the wall). While indicating thatthe neck area could have been a potential location for asecondary rupture, the peak stress values (1.37 MPa forthe anisotropic formulation, occurring at peak systole at305 ms from the start of the cardiac cycle) were promi-nent in the rupture area. For the second patient withrAAA (rAAA2, Fig. 4), the FSI simulations predictedmultiple locations of stress concentrations. One of thelocations of stress concentration close to the neck of theaneurysm coincided with the rupture line and had thehighest values (2.17 MPa for the anisotropic formula-tion, occurring at peak systole at 305 ms from the startof the cardiac cycle). The other stress concentrationlocations were predicted on the anterior side of theAAA(opposite to the ILT) indicating that the ILT seemed tooffer a protective effect for this patient.
Role of Calcifications in AAA
As described above, our FSI simulations predicteddistinct regions of elevated stresses along the actualrupture line, also coinciding with the location ofseveral calcification spots that were observed in this
TABLE 3. Summary of the von Mises and principal axis, p1, stresses for the normal and pathological aortas.
Subject Max diam. (cm)
Peak wall stress
(isotropic, von Mises, MPa)
Peak wall stress
(anisotropic, p1 stress, MPa) RPI
N1 1.63 0.35 0.37 –
N2 1.80 0.44 0.54 –
Non-rAAA 4.60 0.50 wILT 0.65 wILT –
– wILT & 1 Ca 0.70 wILT & 1 Ca –
rAAA1 10.6 1.09 wILT 1.37 wILT 0.8
1.23 wILT & 3 Ca 1.54 wILT & 3 Ca –
rAAA2 7.8 2.10 wILT 2.17 wILT 0.95
2.16 wILT & plaque Ca 2.18 wILT & plaque Ca –
XENOS et al.3330

specific patient CT scans (Fig. 5, left inset). In order tostudy the effect of Ca in AAAs, we divided the calcifiedspots into two broad categories. The first type of Ca isdefined as small calcified spots (small-Ca)—such asthose appearing near the location of rupture, with amaximum diameter smaller than 4.0 mm. The secondtype of Ca is the large plaque-like calcified (plaque-likeCa) spots.
The FSI simulations were performed for the non-ruptured and rAAA with and without the presence ofsmall or plaque-like Ca spots for comparison purposes.In the non-ruptured AAA, a small-Ca embedded in thewall, distal to the ILT location, increased the localstress within the wall by 36.8% as compared to the FSIsimulation without the small-Ca for the anisotropicmaterial wall model formulation. In the case of the firstrAAA, a series of three small-Cas in close proximity tothe rupture location (based on the CT images) alsoincreased the peak stresses by 12.8% as compared tothe FSI simulation without the small-Ca for the iso-tropic material model wall formulation and by 12.4%as compared to the FSI simulation without the small-Ca for the anisotropic formulation, correspondingly.An additional FSI simulation performed for a larger,plaque-like Ca, reconstructed from CT data for thesecond rAAA, indicated a reduction of the local wallstresses near the Ca by 21% as compared to the FSIsimulation without the plaque-like Ca (for bothmaterial model formulations). Results for the effect ofcalcified spots in rAAAs at the location of rupture aresummarized in Table 3.
Wall Strength and Rupture Potential Index
The wall strength estimation for the rAAA and theresulting rupture potential index (RPI—the ratiobetween the locally acting wall stress from the FSI
simulations and the local wall strength) for these casesare shown in Fig. 6. The rupture potential index (RPI)calculations are based on stress distribution derivedfrom FSI simulations without the effect of the Ca. Therange of strength for rAAA1 was from 50 to 109.2 N/cm2, and for rAAA2 from 68.7 to 131.6 N/cm2. Themapping of the RPI indicated several distinct regionsof high RPI, with at least one coinciding with theactual location of rupture. The RPI for both rAAA
FIGURE 5. FSI simulation of a rAAA: the location of the maximal wall stresses overlaps the actual rupture region. The inner toppanel (left) shows the lumen with calcifications above the bifurcation and the left iliac branch. The actual rupture line (dashed) issuperimposed on the wall surrounding it (yellow). The right panel shows the wall stress contours, with stress concentration alongand around the rupture line.
FIGURE 6. Wall strength mapping (from the heuristic for-mulation of Eq. (6)) and the corresponding rupture potentialindex (RPI)—representing the local wall stress to wall strengthratio, for the ruptured AAA cases. Multiple distinct regions ofhigh RPI are observed, with at least one that coincides withthe actual location of rupture. The RPI for both cases is closeto unity indicating a very high risk of rupture, with a higherRPI (0.95) for the smaller rAAA.
Patient-Based AAA Rupture Risk Prediction with FSI Modeling 3331

cases was close to unity, indicating a very high riskof rupture for both rAAAs (Table 3, RPIrAAA1 = 0.8,RPIrAAA2 = 0.95). Similar to the results reportedabove for the peak wall stresses, it is remarkable thatthe smaller ruptured aneurysm (rAAA2) reached muchhigher peak RPI values.
DISCUSSION
A novel methodology for the estimation of rupturerisk in AAAs is presented. The approach is based onpatient-specific reconstructed geometries of normaland pathological aortas, including two cases of con-tained ruptured aneurysms that were specificallystudied to test the ability of the methodology to predictthe rupture location. Isotropic and anisotropic mate-rial model formulations were used to characterize thebiomechanical response of the aortic wall, and FSIsimulations were performed using physiological bloodflow conditions.
Blood flow in aneurysmal aortas exhibit complexflow patterns that completely deviate from those of thenormal aortas, highlighting the importance of analyz-ing the AAA hemodynamics and their interaction withthe aortic wall when studying AAA risk of rupture.The peak velocities during systole are lower in patho-logical aortas as compared to normal aortas, andmanifest itself with increased pressure on the wall anddecreased WSS. This is a result of large and secondarysmaller recirculation zones characterizing AAA flowfields, mostly during the diastolic phase, that in turnalter the pressure and the WSS distributions during thecardiac cycle. It is well established in the literature thatappropriate levels of WSS promote endothelial cellviability, alignment to the direction of flow andsecretion of substances that promote vasodilatationand anticoagulation. However, abnormally high or lowWSS, especially patterns of high followed by low WSS,could lead to endothelial proliferation and apoptosis.37
Abnormally low WSS is a known causative factor ofvasoconstriction, coagulation and platelet aggregationand deposition,5,37,42 and is likely to promote ILTformation.3
Simulations with isotropic and anisotropic materialmodel formulations indicated a consistent pattern ofincreasing peak wall stresses from normal aortas tonon-ruptured and rAAAs. A normal aortic wall modelof the youngest subject (female, 19 years) exhibited thelowest peak stresses. In the model of the second normalsubject (female, 66 years), the peak wall stressincreased. Our conclusion is based only on the differ-ences that we have observed in the aortic wall geom-etry and the resultant altered hemodynamics(geometric differences from young normal to old
normal and the FSI simulations performed thatrevealed amore disturbed flow field for the older normalsubject). The non-ruptured AAAmodel exhibited muchhigher peak wall stresses, and the corresponding highestpeak wall stresses were reached for the two rAAAssubjects. This trend of increasing wall stresses demon-strates the capability of themethodology to characterizebiomechanical determinants in different stages of theaortic wall (normal aorta, non ruptured AAA, rAAA).The values ofwall stresses predicted by ourmodels are inagreement with those of previously published rupturedand non-ruptured AAA studies, albeit based on sim-plified models of the aortic wall.60
The FSI simulations with reconstructed rAAAdemonstrate that the location of the maximal wallstresses overlaps the actual rupture region (Fig. 5).These results suggest that our methodology can predictthe potential location of the rupture by depicting andquantifying regions of high wall stresses. For the firstrAAA, two potential locations of stress concentrationswere predicted from the FSI simulations, one at thelocation of the actual rupture and one close to the neckof the aneurysm. While indicating that the neck areacould have been a potential location for a secondaryrupture, the peak stress values occurring at peak sys-tole, 305 ms from the start of the cardiac cycle, wereprominent in the rupture area. Calcifications embed-ded along the rupture line appear to have contributedto the risk of rupture at this location by creating stressconcentration propagating around them (unlike thebigger calcification plaques in other regions of the wallthat appeared to reduce local stresses). For the secondpatient with rAAA (rAAA2, Fig. 4), the FSI simula-tions predicted multiple locations of stress concentra-tions. One of the locations of stress concentration closeto the neck of the aneurysm coincided with the ruptureline and had the highest values, 305 ms from the startof the cardiac cycle. The other stress concentrationlocations were predicted on the anterior side of theAAA (opposite to the ILT) indicating that the ILTseemed to offer a protective effect for this patient.Owing to the advanced disease state, multiple regionsof high stress are prominent in both rAAAs.
The comparison between the isotropic and theanisotropic simulations consistently showed higherpeak stresses for the latter (Table 3), in completeagreement with our previous studies43,44 and recentstudies by other groups.57,60 This strongly suggests thatisotropic wall material models may underestimate therisk of rupture, and that anisotropic material modelsshould be employed for a more accurate prediction ofrupture risk. The ILT in all simulations appeared tohave provided a cushioning effect. Small-Ca contrib-uted to increase in stresses within the aortic wall(comparison of FSI simulations with and without Ca),
XENOS et al.3332

while larger plaque-like Ca appeared to locally reducethese stresses.4 At the interface between the rigidembedded Ca and the much softer wall material therewas a strong stress gradient that propagated aroundthe calcification. This stress gradient may offer a sig-nificant contribution to the rupture potential. How-ever, a more detailed analysis with multiple Ca isrequired to establish how wall stress concentrations areaffected by the size and number of Ca.
Ultimately, an accurate prediction of the AAA riskof rupture entails the ability to predict whether the wallwill actually fail. This requires weighing the local wallstress against the local wall strength. The latterinvolves information that is not readily available, butcan be indirectly estimated by factoring in biome-chanical and clinical parameters, as well as the medicalhistory of the specific patient. The RPI55 that wasincorporated in our methodology is a first step towardachieving such an estimate. The strength mapping thatwe have conducted clearly indicated that wall strengthwas significantly reduced at the aneurysmal bulge,compromising the integrity of the aortic wall (Fig. 6).The RPI mapping depicted distinct locations moreprone to rupture. For both rAAA cases, the location ofmaximum RPI overlapped the location of the actualrupture (indicated by a dashed line). The strength andRPI calculations were performed without Ca for all thecases studied.
It is remarkable that both the peak wall stress valueand the peak RPI value were much higher for the caseof the smaller ruptured aneurysm, which had a max.transverse size of 7.8 cm (2.17 MPa, RPI = 0.95) ascompared to the much bigger aneurysm of 10.6 cm(1.37 MPa, RPI = 0.8). While based on comparingonly a pair of ruptured aneurysms, the fact that thesmaller one exhibited much larger stresses challengesthe common wisdom of basing the decision whether tooperate the aneurysm almost solely on the size of theaneurysm. Our study indicates that a new approachthat is quantitatively based on stress and RPI distri-butions may offer a refined alternative to the currentdecision for AAA treatment. However, it is clear thatat least a moderate number of comparative cases forsmall and large-size AAA patient group is needed tofurther establish the clinical validity of this approach.There are currently different thresholds for interven-tion accepted in the United States (5 cm) compared toEurope (5.5 cm). While the two ruptured aneurysmswere larger than these threshold values, it highlightsthe fact that maximal aneurysm diameter is a crudepredictor of rupture risk, since some smaller aneu-rysms do rupture and some larger ones remain intact.Current decision models clearly require more specific-ity. Refinement of our ability to predict AAA rupturerisk is vital to provide appropriate therapies to the
maximal number of patients. It is clear that biome-chanical considerations can both improve ourunderstanding of aneurysmal disease characterizationand refine our ability to predict the risk of rupture.
A patient-specific modeling aimed at AAA diag-nostics should incorporate additional patient-specificdata beyond geometry. Similar to other recent studiesthat used routinely acquired CT scans of AAA patients,the results presented are based on the assumption of auniform 2-mm wall thickness, which may distort thestress values and their distribution. This assumption isnecessary due to limitations in the imaging and recon-struction techniques, but bears only minimal effects onthe comparison between the two material models andthe effects of the ILT as previously demonstrated byour group.44 Part of these data will become availableand incorporated in our future studies (e.g., using non-invasive methods such as patient-specific hemodynamicparameters and local wall thickness measured byechocardiography) although not in this type of retro-spective study which was mostly based on dataobtained from patients who arrived at the ER withAAAs that have already ruptured. Other pertainingdata are not always readily available, if at all. Forexample, while we have incorporated sophisticatedanisotropic material properties that were tailored toexperimental results measured in AAA patients’ speci-men (obtained either post mortem or during surgicalprocedures), those were not specific to the patients wehave studied. However, our study goes a step beyondthe most sophisticated current modeling efforts thatmostly incorporate isotropic hyperelastic materialmodels, or anisotropic material models but employstatic simulations. This is a first demonstration of theability of FSI simulations employing more accuratecharacterization of the aneurysmal wall biomechanicalproperties, to predict the location of potential ruptureand to compare it to its local strength.
It should be acknowledged that while our method-ology demonstrates the ability to characterize aneu-rysmal disease, in this specific study, we havecompared normal and pathological aortas of differentpatients (retrospective study). In future studies, weplan to conduct longitudinal studies in which AAAprogression will be monitored and analyzed in thesame patients during the disease progression (pro-spective study). In such future studies, intermediateresults from the FSI calculations could be experimen-tally verified. Those include flow field development,fluid pressure, and WSS. The residual stress field in theunloaded configurations was not considered due to thecomplexities involved, which could lead to a less uni-form transmural stress field in the simulated configu-rations. However, this simplification was partiallyrectified by pressurizing the AAA configurations from
Patient-Based AAA Rupture Risk Prediction with FSI Modeling 3333

an initial zero stress condition to 90 mmHg with zeroflow for 1 s, before the FSI waveforms were applied.
The most consistent approach for studying aneu-rysmal disease progression would be to include thepatient-specific hemodynamic characteristics (actualflow rate and pressure waveforms measured at the timeof the CT scan). However, the current study was ret-rospective, meaning that the boundary conditions atthe time of the CT scans were not available. Whether avolumetric flow rate or a velocity boundary conditionshould be applied at the inlet of normal and patho-logical aortas is a subject that should be further inves-tigated. In future studies, we will use the patient-specifichemodynamic characteristics (actual flow rate andpressure waveforms measured at the time of the CTscan) as inlet and outlet boundary conditions. How-ever, the inlet velocity boundary condition used in thisstudy leads to physiological flow rates for all cases(normal and pathological aortas). In vivomeasurementsshow flow rates to up 300 mL/s leading to peak veloc-ities of 100 cm/s.34 In our study, peak velocities of30 cm/s give rise to a peak flow rate of 158 mL/s for thepathological aortas—a value very close to the peak flowrate reported by Cheng et al.8 for the normal aortas atrest (166 mL/s) and in the vicinity of the peak flow ratereported by Greve et al.20 Flow rates do differ betweennormal and pathological aortas.19 However, the majorcontribution to the elevated wall stresses that are rou-tinely observed in AAAs are not necessarily a result ofhigher flow rates- rather, the pathological flow patternsthat are generated within the AAA cavity (and aremostly absent in normal aortas), e.g., the formation oflarge recirculation zones that significantly contribute tothe lateral pressures acting on the wall (and eventuallykeep ‘ballooning’ the AAA). This could lead to anincrease of the aortic diameter and this effect is moreevident to elderly subjects.64 It has been shown that theone-fifth of normal aortas expands with age. Otherhemodynamic parameters like hypertension whichincreases the risk of having an aortic aneurysm by 30–40%58 could also elevate patients’ blood flow rates.
Another consideration for applying the same inletvelocity for the normal subjects in our study who hadsmaller aorta diameter stems from the fact that thosewere female subjects who are expected to have lowerflow rates—as compared to the pathological AAAcases that were all male subjects. This difference in flowrate could be substantial, of the order of 25% ormore.8 Given these limitations, we consider that themost consistent approach to yield valid comparativeresults across the subjects was the one that applies thesame inlet velocity waveform for all the cases studied.
Another possible effect in AAA hemodynamics isthe pressure wave reflection.50 The combined effect ofelasticity reduction because of ageing and the ‘water
hammer’ effect in AAA, when the reflected pressurewave collides with the forward moving pressure waveof the next heartbeat, results in larger lateral pressureon the aortic wall.51 Wave reflections are possible inour simulations due to the fact that there is no mech-anism to prevent them, but we would expect thesereflections to provide fluctuations in the pressure fieldrather than increasing the pressure because of theformation of complex flow patterns. We have demon-strated in our previous AAA studies3,44 that hemody-namics within the AAA cavity (recirculation zones,vortices etc.) readily affect the pressure distribution.
It should also be noted that certain clinical scenariosare beyond the scope of the methodology presentedherein. Intramural leakage, for example, has beenshown to double the stress concentrations and is ahallmark of imminent rupture, and decisions whetherto operate an AAA are made based on this alone. Atthis stage, our diagnostics methodology is not aimed atsimulating such a complex clinical scenario. Owing tothe complexity of the current simulations, we also donot incorporate models that attempt to simulate theintricate physiological and biochemical mechanismsinvolved in AAA wall degradation. In a sense, thisstudy shows that even when employing many simpli-fying assumptions, a methodology that is based onpure biomechanical considerations demonstrates apowerful predictive capability that could vastlyimprove the diagnostics of patients with AAA disease.The methodology challenges current clinical practice,where a risky elective repair of the AAA based on itssize alone is warranted rather than looking ata patient-specific stresses developing within the aneu-rysmal wall as a result of the complex interactionbetween the AAA geometry, hemodynamics, and thewall mechanical response.
CONCLUSIONS
This study deals with characterization of the wallstress as a case study in a long-term effort to establish apatient-specific diagnostic methodology that integratesmedical imaging with biomechanical simulations. Thebasic aim of the methodology is to complement thecurrent clinical practice by predicting more accuratelythe risk of rupture in AAAs, by augmenting the AAAdiagnostics with a quantitative and more reliable rup-ture risk indicator. We have demonstrated that ourmethodology was able to predict the location of rup-ture for the two rAAA cases studied. Such diagnosticcapabilities are essential for improved clinical out-comes of procedures in which intervention is directedat those lesions most likely to become symptomatic.We plan to extend our study with a variety of AAA
XENOS et al.3334

cases to establish the statistical significance based on asufficient number of unruptured and ruptured cases.The proposed methodology may provide clinicians andsurgeons with a refined diagnostic and decision toolkitfor establishing the need for a risky surgical interven-tion, by providing a fully dynamic and quantitativedepiction of the AAA biomechanics under hemody-namic conditions, and predicting its risk of rupture.
FSI simulations with advanced material modelsshowed an increasing peak wall stress pattern at pro-gressing stages of the disease, demonstrating thecapability of the methodology to characterize aneu-rysmal disease. The anisotropic wall simulationsshowed higher peak wall stresses as compared to iso-tropic material models, clearly indicating that the lattermay underestimate the AAA risk of rupture. The ILTappeared to provide a cushioning effect reducing thestresses, while small Ca appeared to weaken the walland contribute to the rupture risk. FSI simulationswith reconstructed rAAA demonstrated that the loca-tion of the maximal wall stresses overlaps the actualrupture region. The estimated wall strength wasreduced at distinct regions of the AAA, and the max-imum Rupture Potential Index (RPI) also overlappedthe location of the actual rupture.
These results clearly indicate that the methodologycan predict the potential location of the rupture, andthat when specific geometric and biomechanical char-acteristics of the AAA are incorporated, it can indicatethe rupture potential of smaller aneurysms that wouldotherwise not be considered prone to rupture. Themethodology will be readily applicable for analyzingand diagnosing other cardiovascular pathologies inwhich rupture may be imminent, such as intracranialaneurysms and vulnerable plaques in coronary andcarotid artery disease. We plan to validate the pro-posed methodology by establishing its statistical sig-nificance with enough number of AAA cases. Oncevalidated, the clinical endpoint could be improvedsurgical outcomes, reduced mortality rates, and con-siderable savings in healthcare costs.
REFERENCES
1Bengtsson, H., and D. Bergqvist. Ruptured abdominalaortic aneurysm: a population-based study. J. Vasc. Surg.18:74–80, 1993.2Bettermann, K., J. F. Toole. Diagnostic evaluationand medical management of patients with ischemiccerebrovascular disease. In: Vascular Surgery, edited byR. Rutherford. Philadelphia: Elsevier, 2005, pp. 1904–1905.3Bluestein, D., K. Dumont, M. De Beule, J. Ricotta,P. Impellizzeri, B. Verhegghe, and P. Verdonck. Intralu-minal thrombus and risk of rupture in patient specific
abdominal aortic aneurysm—FSI modelling. Comput.Methods Biomech. Biomed. Eng. 12:73–81, 2008.4Bluestein, D., Y. Alemu, I. Avrahami, M. Gharib,K. Dumont, J. J. Ricotta, and S. Einav. Influence of mic-rocalcifications on vulnerable plaque mechanics using FSImodeling. J. Biomech. 41:1111–1118, 2008.5Bonert, M., R. L. Leask, J. Butany, C. R. Ethier, J. G.Myers, K. W. Johnston, and M. Ojha. The relationshipbetween wall shear stress distributions and intimal thick-ening in the human abdominal aorta. Biomed. Eng. Online2:18, 2003.6Boyce, M. C., and E. M. Arruda. Constitutive models ofrubber elasticity: a review. Rubber Chem. Technol. 73:504–523, 2000.7Brown, L. C., and J. T. Powell. Risk factors for aneurysmrupture in patients kept under ultrasound surveillance. UKsmall aneurysm trial participants. Ann. Surg. 230:289–296,1999.8Cheng, C. P., R. J. Herfkens, and C. A. Taylor. Compar-ison of abdominal aortic hemodynamics between men andwomen at rest and during lower limb exercise. J. Vasc.Surg. 37:118–123, 2003.9Chuong, C. J., and Y. C. Fung. On residual stresses inarteries. J. Biomech. Eng. 108:189–192, 1986.
10Cronenwett, J. L., T. F. Murphy, G. B. Zelenock, W. M.Whitehouse, S. M. Lindenauer, L. M. Graham, L. E.Quint, T. M. Silver, and J. C. Stanley. Actuarial analysis ofvariables associated with rupture of small abdominal aor-tic-aneurysms. Surgery 98:472–483, 1985.
11de Putter, S., B. J. Wolters, M. C. Rutten, M. Breeuwer,F. A. Gerritsen, and F. N. van de Vosse. Patient-specificinitial wall stress in abdominal aortic aneurysms with abackward incremental method. J. Biomech. 40:1081–1090,2006.
12Di Martino, E. S., and D. A. Vorp. Effect of variation inintraluminal thrombus constitutive properties on abdomi-nal aortic aneurysm wall stress. Ann. Biomed. Eng. 31:804–809, 2003.
13Di Martino, E., S. Mantero, F. Inzoli, G. Melissano,D. Astore, R. Chiesa, and R. Fumero. Biomechanics ofabdominal aortic aneurysm in the presence of endoluminalthrombus: experimental characterisation and structuralstatic computational analysis. Eur. J. Vasc. Endovasc. Surg.15:290–299, 1998.
14Di Martino, E. S., G. Guadagni, A. Fumero, G. Ballerini,R. Spirito, P. Biglioli, and A. Redaelli. Fluid-structureinteraction within realistic three-dimensional models of theaneurysmatic aorta as a guidance to assess the risk ofrupture of the aneurysm. Med. Eng. Phys. 23:647–655,2001.
15Di Martino, E. S., A. Bohra, J. P. Vande Geest, N. Gupta,M. S. Makaroun, and D. A. Vorp. Biomechanical prop-erties of ruptured versus electively repaired abdominalaortic aneurysm wall tissue. J. Vasc. Surg. 43:570–576,2006.
16Fillinger, M. The long-term relationship of wall stress tothe natural history of abdominal aortic aneurysms (finiteelement analysis and other methods). Ann. N. Y. Acad. Sci.1085:22–28, 2006.
17Fillinger, M. F., M. L. Raghavan, S. P. Marra, J. L.Cronenwett, and F. E. Kennedy. In vivo analysis ofmechanical wall stress and abdominal aortic aneurysmrupture risk. J. Vasc. Surg. 36:589–597, 2002.
18Fillinger, M. F., S. P. Marra, M. L. Raghavan, and F. E.Kennedy. Prediction of rupture risk in abdominal aortic
Patient-Based AAA Rupture Risk Prediction with FSI Modeling 3335

aneurysm during observation: wall stress versus diameter.J. Vasc. Surg. 37:724–732, 2003.
19Finol, E. A., and C. H. Amon. Flow dynamics in ana-tomical models of abdominal aortic aneurysms: computa-tional analysis of pulsatile flow. Acta Cient. Venez. 54:43–49, 2003.
20Greve, J. M., A. S. Les, B. T. Tang, M. T. Draney Blomme,N. M. Wilson, R. L. Dalman, N. J. Pelc, and C. A. Taylor.Allometric scaling of wall shear stress from mice tohumans: quantification using cine phase-contrast MRI andcomputational fluid dynamics. Am. J. Physiol. Heart Circ.Physiol. 291:H1700–H1708, 2006.
21He, C. M., and M. R. Roach. The compositionand mechanical properties of abdominal aortic aneurysms.J. Vasc. Surg. 20:6–13, 1994.
22Holzapfel, G. A., and T. C. Gasser. A viscoelastic modelfor fiber-reinforced composites at finite strains: continuumbasis, computational aspects and applications. Comput.Method Appl. Mech. 190:4379–4403, 2001.
23Holzapfel, G. A., and T. C. Gasser. Computational stress-deformation analysis of arterial walls including high-pres-sure response. Int. J. Cardiol. 116:78–85, 2007.
24Holzapfel, G. A., and H. W. Weizsacker. Biomechanicalbehavior of the arterial wall and its numerical character-ization. Comput. Biol. Med. 28:377–392, 1998.
25Holzapfel, G. A., T. C. Gasser, and R. W. Ogden. A newconstitutive framework for arterial wall mechanics and acomparative study of material models. J. Elast. 61:1–48,2000.
26Holzapfel, G. A., T. C. Gasser, and M. Stadler. A struc-tural model for the viscoelastic behavior of arterial walls:continuum formulation and finite element analysis. Eur. J.Mech. A Solid. 21:441–463, 2002.
27Holzapfel, G. A., T. C. Gasser, and R. W. Ogden. Com-parison of a multi-layer structural model for arterial wallswith a fung-type model, and issues of material stability.J. Biomech. Eng. Trans. ASME 126:264–275, 2004.
28Holzapfel, G., M. Stadler, and T. C. Gasser. Changes in themechanical environment of stenotic arteries during inter-action with stents: computational assessment of parametricstent designs. J Biomech. Eng. Trans. ASME 127:166–180,2005.
29Holzapfel, G. A., G. Sommer, C. T. Gasser, and P. Regitnig.Determination of layer-specific mechanical properties ofhuman coronary arteries with nonatherosclerotic intimalthickening and related constitutivemodeling.Am. J. Physiol.Heart Circ. Physiol. 289:H2048–H2058, 2005.
30Hua, J., and W. R. Mower. Simple geometric characteris-tics fail to reliably predict abdominal aortic aneurysm wallstresses. J. Vasc. Surg. 34:308–315, 2001.
31Lederle, F. A., S. E. Wilson, G. R. Johnson, D. B. Reinke,F. N. Littooy, C. W. Acher, D. J. Ballard, L. M. Messina,I. L. Gordon, E. P. Chute, W. C. Krupski, D. Bandyk, andA. D. M. Vet. Immediate repair compared with surveillanceof small abdominal aortic aneurysms. N. Eng. J. Med.346:1437–1444, 2002.
32Limet, R., N. Sakalihassan, and A. Albert. Determinationof the expansion rate and incidence of rupture of abdom-inal aortic aneurysms. J. Vasc. Surg. 14:540–548, 1991.
33Mooney, M. A theory of large elastic deformation. J. Appl.Phys. 11:582–592, 1940.
34Moore, Jr., J. E., S. E. Maier, D. N. Ku, and P. Boesiger.Hemodynamics in the abdominal aorta: a comparison ofin vitro and in vivo measurements. J. Appl. Physiol.76:1520–1527, 1994.
35Olufsen, M. S., C. S. Peskin, W. Y. Kim, E. M. Pedersen,A. Nadim, and J. Larsen. Numerical simulation andexperimental validation of blood flow in arteries withstructured-tree outflow conditions. Ann. Biomed. Eng. 28:1281–1299, 2000.
36Papaharilaou, Y., J. A. Ekaterinaris, E. Manousaki, andA. N. Katsamouris. A decoupled fluid structure approachfor estimating wall stress in abdominal aortic aneurysms.J. Biomech. 40:367–377, 2007.
37Paszkowiak, J. J., and A. Dardik. Arterial wall shear stress:observations from the bench to the bedside. Vasc. Endo-vascular Surg. 37:47–57, 2003.
38Powell, J. T., A. R. Brady, L. C. Brown, J. F. Forbes, F. G.R. Fowkes, R. M. Greenhalgh, C. V. Ruckley, S. G.Thompson, and U. S. A. T. Participants. Mortality resultsfor randomised controlled trial of early elective surgery orultrasonographic surveillance for small abdominal aorticaneurysms. Lancet 352:1649–1655, 1998.
39Raghavan, M. L., and D. A. Vorp. Toward a biomechan-ical tool to evaluate rupture potential of abdominal aorticaneurysm: identification of a finite strain constitutive modeland evaluation of its applicability. J. Biomech. 33:475–482,2000.
40Raghavan, M. L., M. W. Webster, and D. A. Vorp. Ex vivobiomechanical behavior of abdominal aortic aneurysm:assessment using a new mathematical model. Ann. Biomed.Eng. 24:573–582, 1996.
41Raghavan, M. L., J. Kratzberg, E. M. C. de Tolosa, M. M.Hanaoka, P. Walker, and E. S. da Silva. Regional distri-bution of wall thickness and failure properties of humanabdominal aortic aneurysm. J. Biomech. 39:3010–3016,2006.
42Reneman, R. S., T. Arts, and A. P. Hoeks. Wall shearstress—an important determinant of endothelial cell func-tion and structure—in the arterial system in vivo. Dis-crepancies with theory. J. Vasc. Res. 43:251–269, 2006.
43Ricotta, J. J., J. Pagan, M. Xenos, Y. Alemu, S. Einav, andD. Bluestein. Cardiovascular disease management: the needfor better diagnostics. Med. Biol. Eng. Comput. 46:1059–1068, 2008.
44Rissland, P., Y. Alemu, S. Einav, J. Ricotta, andD. Bluestein. Abdominal aortic aneurysm risk of rup-ture—patient specific FSI simulations using anisotropicmodel. J. Biomech. Eng. 13:031001–031010, 2009.
45Rivlin, R. S. Large elastic deformations of isotropicmaterials. 1. Fundamental concepts. Philos. Trans. R. Soc.Lond. A Math. Phys. Sci. 240:459–508, 1948.
46Roach, M. R., and A. C. Burton. The reason for the shapeof the distensibility curves of arteries. Can. J. Biochem.Physiol. 35:681–690, 1957.
47Rodriguez, J. F., C. Ruiz, M. Doblare, and G. A.Holzapfel. Mechanical stresses in abdominal aortic aneu-rysms: influence of diameter, asymmetry, and materialanisotropy. J. Biomech. Eng. 130:021023, 2008.
48Scotti, C., A. Shkolnik, S. Muluk, and E. Finol. Fluid-structure interaction in abdominal aortic aneurysms: effectsof asymmetry and wall thickness. Biomed. Eng. Online 4:64,2005.
49Sussman, T., and K. J. Bathe. A finite-element formulationfor nonlinear incompressible elastic and inelastic analysis.Comput. Struct. 26:357–409, 1987.
50Swillens, A., L. Lanoye, J. De Backer, N. Stergiopulos,P. R. Verdonck, F. Vermassen, and P. Segers. Effect of anabdominal aortic aneurysm on wave reflection in the aorta.IEEE Trans. Biomed. Eng. 55:1602–1611, 2008.
XENOS et al.3336

51Thubrikar, M. Vascular Mechanics and Pathology. NewYork: Springer, 436 pp., 2007.
52Truijers, M., J. A. Pol, L. J. Schultzekool, S. M. vanSterkenburg, M. F. Fillinger, and J. D. Blankensteijn. Wallstress analysis in small asymptomatic, symptomatic andruptured abdominal aortic aneurysms. Eur. J. Vasc.Endovasc. Surg. 33:401–407, 2007.
53Valencia, A., H. Morales, R. Rivera, E. Bravo, andM. Galvez. Blood flow dynamics in patient-specific cerebralaneurysm models: the relationship between wall shear stressand aneurysmarea index.Med. Eng. Phys. 30:329–340, 2008.
54Vande Geest, J. P., M. S. Sacks, and D. A. Vorp. Agedependency of the biaxial biomechanical behavior of humanabdominal aorta. J. Biomech. Eng. 126:815–822, 2004.
55Vande Geest, J. P., D. H. Wang, S. R. Wisniewski, M. S.Makaroun, and D. A. Vorp. Towards a noninvasivemethod for determination of patient-specific wall strengthdistribution in abdominal aortic aneurysms. Ann. Biomed.Eng. 34:1098–1106, 2006.
56Vande Geest, J. P., M. S. Sacks, and D. A. Vorp. Theeffects of aneurysm on the biaxial mechanical behavior ofhuman abdominal aorta. J. Biomech. 39:1324–1334, 2006.
57Vande Geest, J. P., D. E. Schmidt, M. S. Sacks, and D. A.Vorp. The effects of anisotropy on the stress analyses ofpatient-specific abdominal aortic aneurysms. Ann. Biomed.Eng. 36:921–932, 2008.
58Vardulaki, K. A., N. M. Walker, N. E. Day, S. W. Duffy,H. A. Ashton, and R. A. Scott. Quantifying the risks ofhypertension, age, sex and smoking in patients withabdominal aortic aneurysm. Br. J. Surg. 87:195–200, 2000.
59Vengrenyuk, Y., L. Cardoso, and S. Weinbaum. Micro-CTbased analysis of a new paradigm for vulnerable plaquerupture: cellular microcalcifications in fibrous caps. Mol.Cell. Biomech. 5:37–47, 2008.
60Venkatasubramaniam, A. K., M. J. Fagan, T. Mehta, K. J.Mylankal, B. Ray, G. Kuhan, I. C. Chetter, and P. T.
McCollum. A comparative study of aortic wall stress usingfinite element analysis for ruptured and non-rupturedabdominal aortic aneurysms. Eur. J. Vasc. Endovasc. Surg.28:168–176, 2004.
61Vito, R. P., and J. Hickey. The mechanical propertiesof soft tissues-II: the elastic response of arterial segments.J. Biomech. 13:951–957, 1980.
62Vorp, D. A., M. L. Raghavan, S. C. Muluk, M. S.Makaroun, D. L. Steed, R. Shapiro, and M. W. Webster.Wall strength and stiffness of aneurysmal and nonaneurys-mal abdominal aorta. Ann. N. Y. Acad. Sci. 800:274–276,1996.
63Wang, D. H., M. Makaroun, M. W. Webster, and D. A.Vorp. Mechanical properties and microstructure of intra-luminal thrombus from abdominal aortic aneurysm.J. Biomech. Eng. 123:536–539, 2001.
64Wilmink, A. B., C. S. Hubbard, N. E. Day, and C. R.Quick. The incidence of small abdominal aortic aneurysmsand the change in normal infrarenal aortic diameter:implications for screening. Eur. J. Vasc. Endovasc. Surg.21:165–170, 2001.
65Wolters, B. J., M. C. Rutten, G. W. Schurink, U. Kose,J. de Hart, and F. N. van de Vosse. A patient-specificcomputational model of fluid-structure interaction inabdominal aortic aneurysms. Med. Eng. Phys. 27:871–883,2005.
66Yang, C., R. G. Bach, J. Zheng, I. E. Naqa, P. K.Woodard, Z. Teng, K. Billiar, and D. Tang. In vivoIVUS-based 3-D fluid-structure interaction models withcyclic bending and anisotropic vessel properties for humanatherosclerotic coronary plaque mechanical analysis. IEEETrans. Biomed. Eng. 56:2420–2428, 2009.
67Zankl, A. R., H. Schumacher, U. Krumsdorf, H. A. Katus,L. Jahn, and C. P. Tiefenbacher. Pathology, natural historyand treatment of abdominal aortic aneurysms. Clin. Res.Cardiol. 96:140–151, 2007.
Patient-Based AAA Rupture Risk Prediction with FSI Modeling 3337