patience is a virtue -- in value investing
TRANSCRIPT

The University of Manchester Research
Patience is a virtue -- in value investing
DOI:10.1111/irfi.12251
Document VersionAccepted author manuscript
Link to publication record in Manchester Research Explorer
Citation for published version (APA):Schenk-Hoppê, K. R., & Hens, T. (2018). Patience is a virtue -- in value investing. International Review of Finance.https://doi.org/10.1111/irfi.12251
Published in:International Review of Finance
Citing this paperPlease note that where the full-text provided on Manchester Research Explorer is the Author Accepted Manuscriptor Proof version this may differ from the final Published version. If citing, it is advised that you check and use thepublisher's definitive version.
General rightsCopyright and moral rights for the publications made accessible in the Research Explorer are retained by theauthors and/or other copyright owners and it is a condition of accessing publications that users recognise andabide by the legal requirements associated with these rights.
Takedown policyIf you believe that this document breaches copyright please refer to the University of Manchester’s TakedownProcedures [http://man.ac.uk/04Y6Bo] or contact [email protected] providingrelevant details, so we can investigate your claim.
Download date:19. Dec. 2021

Patience is a virtue — in value investing∗
Thorsten Hens a and Klaus Reiner Schenk-Hoppe b
October 27, 2018
Abstract
This note illustrates a simple but important insight for financial investment. In
a heterogeneous agent-based evolutionary finance market model with long-lived
assets, markets are stable if clients of fundamental (‘value’) investment funds are
more patient than clients of other funds.
Keywords: Financial market stability; delegated fund management; investor patience;
agent-based modeling; evolutionary finance.
1 Introduction
Recent stock market crashes have made market stability a central topic of investors and
policy-makers alike, asking for advice from academia. However, academic research is di-
vided about the cause of these severe mispricings. In particular the importance of the
heterogeneity of investors is debated. While Franke and Luders (2010) show that in tradi-
tional rational expectations models heterogeneity of investor preferences decreases market
stability, behavioral finance models like those outlined in Shiller (1999) and Shleifer (2000)
show that irrational investors (e.g., trend chasers or noise traders) cause instability and
mispricing. This diversity–stability debate in finance is akin to biological models of in-
teracting species (McCann, 2000). In this note we show that in a standard heterogeneous
agent financial market model mispricing is smaller if fundamental investors are more pa-
tient than other investors. Thus within this model the diversity–stability debate comes
to the same conclusion as the behavioral financial market models.
Patience is widely praised as one of the keys to investment success (and impatience
as the main source of failure) in investment books such as Burton G. Malkiel’s (2016) A
Random Walk down Wall Street: The Time-tested Strategy for Successful Investing (first
published in 1973 and currently in its 11th edition) or The Little Book of Common Sense
Investing by John C. Bogle (2007), the father of index-investing.
Heterogeneous agent models of financial markets (HAMs) however build on the premise
that all investors are equally patient (or impatient). Their willingness to move their capi-
tal between investment styles depends only on differences in realized performance; see the
∗Financial support by the URPP Finreg of the University of Zurich is gratefully acknowledged.aSwiss Finance Institute, Department of Banking and Finance, University of Zurich and Faculty of
Economics and Management, University of Lucerne, Switzerland and Department of Finance, NHH–Norwegian School of Economics, Norway. E-mail: [email protected].
bDepartment of Economics, School of Social Sciences, University of Manchester, United Kingdom,and Department of Finance, NHH–Norwegian School of Economics, Norway. E-mail: [email protected].
1

seminal work on theoretical modeling by Hommes (2013); Hommes and Wagener (2009),
and recent applied studies, e.g., Grazzini et al. (2017); Kukacka and Barunik (2017),
Coqueret (2017), and Assenza et al. (2017).
Evolutionary finance models (Evstigneev et al., 2006, 2009, 2016) in contrast are
populated by investors who are infinitely patient; they never move any money between
funds. In these models, value investment dominates the market in the long-run and prices
are equal to fundamental values. Here we ask how the market dynamics changes when
investors’ choice of style and their degree of patience correlates. We are particularly
interested in the case when fundamental value investors have the greatest patience of all.
The motivation for this line of inquiry is two-fold. First, there is evidence that in
practice average holding periods depend on the type of fund investors are invested in.
Shareholders in Berkshire-Hathaway (a self-declared value investor) are astonishingly
patient: According to NYSE data, the annual turnover of this stock is around 10% p.a.
compared to about 80% for the average stock. Roberge et al. (2013) report that holding
periods of investment managers of equity mutual funds also vary considerably across
Morningstar’s equity categories: For instance the average holding period of large value
stocks is 2-3 times longer than that of technology stocks. Our paper analyzes whether
such differences in investor patience matter.
Second, value investors are commonly seen as making markets more resilient as buyers
(and sellers) of last resort (Harris, 2015, p. 8). However, the interplay between different
styles can potentially weaken this argument. Noise traders can generate, by chance, short-
term momentum which might be amplified by trend-chasers. With a sufficient inflow on
capital, fundamental traders can be overwhelmed. In this sense fundamental traders
can do poorly whilst noise traders ‘create their own space’ simply through differences in
investor patience. We seek to answer how patient value investors have to be in order to
perform the moderating, last-resort function well.
The model analyzed in this note captures the impact of investor patience (or impa-
tience) on the flow of funds between different styles in the simplest possible way. Our aim
is not to produce the most ‘realistic’ model but a parsimonious one in which the main
point can be made most succinctly.
2 Model
We consider a heterogeneous agent financial market model that is based on Palczewski
et al. (2016) but permits clients of funds to differ with respect to their degree of patience.
This feature is implemented as a fund-specific flow participation. The flow participation is
the percentage amount of capital that leaves a specific fund (relative to the value of total
assets under management). The total gross outflow of capital is re-allocated according
to performance using a discrete-choice model as in the standard HAM. When the flow
participation of a fund is high, investors in this style are inherently less patient than
2
investors in a fund with a low flow participation.
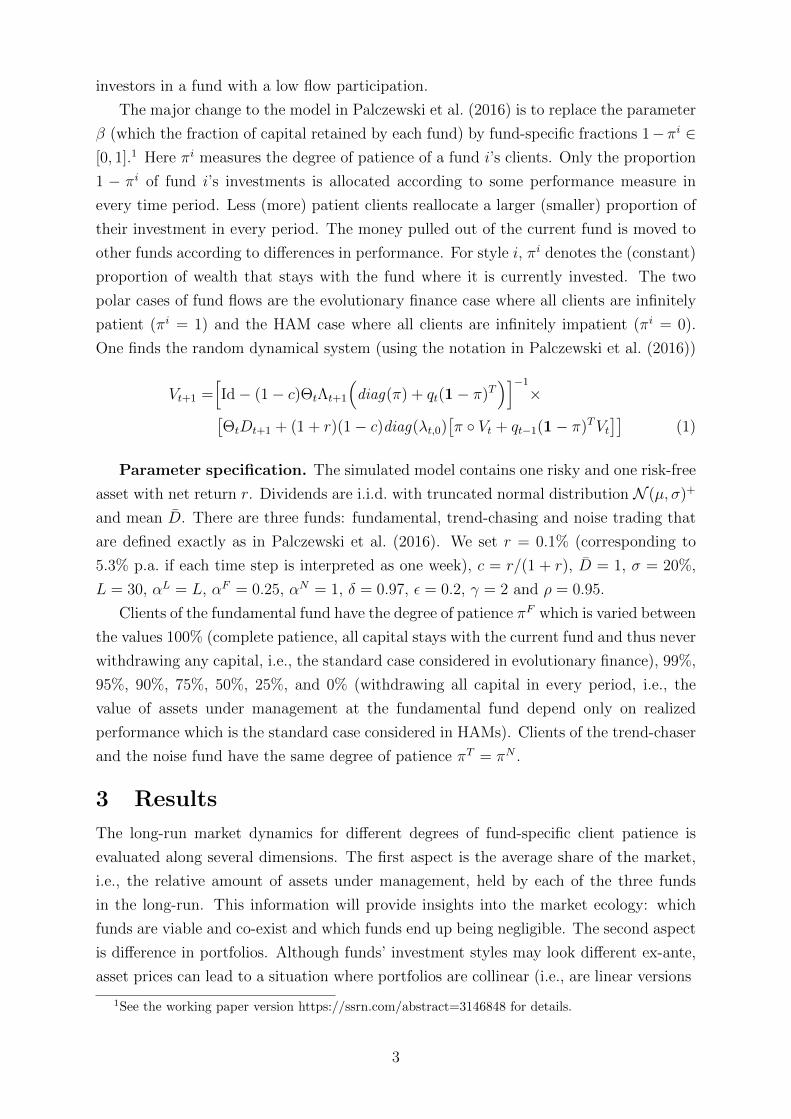
The major change to the model in Palczewski et al. (2016) is to replace the parameter
β (which the fraction of capital retained by each fund) by fund-specific fractions 1−πi ∈[0, 1].1 Here πi measures the degree of patience of a fund i’s clients. Only the proportion
1 − πi of fund i’s investments is allocated according to some performance measure in
every time period. Less (more) patient clients reallocate a larger (smaller) proportion of
their investment in every period. The money pulled out of the current fund is moved to
other funds according to differences in performance. For style i, πi denotes the (constant)
proportion of wealth that stays with the fund where it is currently invested. The two
polar cases of fund flows are the evolutionary finance case where all clients are infinitely
patient (πi = 1) and the HAM case where all clients are infinitely impatient (πi = 0).
One finds the random dynamical system (using the notation in Palczewski et al. (2016))
Vt+1 =[Id− (1− c)ΘtΛt+1
(diag(π) + qt(1− π)T
)]−1
×[ΘtDt+1 + (1 + r)(1− c)diag(λt,0)
[π ◦ Vt + qt−1(1− π)TVt
]](1)
Parameter specification. The simulated model contains one risky and one risk-free
asset with net return r. Dividends are i.i.d. with truncated normal distribution N (µ, σ)+
and mean D. There are three funds: fundamental, trend-chasing and noise trading that
are defined exactly as in Palczewski et al. (2016). We set r = 0.1% (corresponding to
5.3% p.a. if each time step is interpreted as one week), c = r/(1 + r), D = 1, σ = 20%,
L = 30, αL = L, αF = 0.25, αN = 1, δ = 0.97, ε = 0.2, γ = 2 and ρ = 0.95.
Clients of the fundamental fund have the degree of patience πF which is varied between
the values 100% (complete patience, all capital stays with the current fund and thus never
withdrawing any capital, i.e., the standard case considered in evolutionary finance), 99%,
95%, 90%, 75%, 50%, 25%, and 0% (withdrawing all capital in every period, i.e., the
value of assets under management at the fundamental fund depend only on realized
performance which is the standard case considered in HAMs). Clients of the trend-chaser
and the noise fund have the same degree of patience πT = πN .
3 Results
The long-run market dynamics for different degrees of fund-specific client patience is
evaluated along several dimensions. The first aspect is the average share of the market,
i.e., the relative amount of assets under management, held by each of the three funds
in the long-run. This information will provide insights into the market ecology: which
funds are viable and co-exist and which funds end up being negligible. The second aspect
is difference in portfolios. Although funds’ investment styles may look different ex-ante,
asset prices can lead to a situation where portfolios are collinear (i.e., are linear versions
1See the working paper version https://ssrn.com/abstract=3146848 for details.
3

Pat
ien
ceof
fun
dam
enta
lfu
nd
’scl
ients
,πF
Patienceoftrend/noisefund’sclients,πT
=πN
100%
99%
95%
90%
75%
50%
25%
0%
100%
75.5
(33.
3)24.3,0.2
99%
99.5
(33.
3)0.3,0.3
37.4
(33.
3)
31.9,30.7
11.0
(9.1
)40.9,48.1
5.8
(4.8
)42.0,52.2
2.4
(2.0
)42.6,55.1
1.2
(1.0
)42.7,56.1
0.8
(0.7
)42.
8,56.4
0.6
(0.5
)42.8,56.6
95%
99.5
(33.
3)0.3,0.2
72.1
(71.
4)
14.2,13.7
35.2
(33.
3)
32.6,32.2
21.8
(20.
0)
38.5,39.7
10.3
(9.1
)43.1,46.7
5.5
(4.8
)44.
8,49.7
3.8
(3.2
)45.4,50.9
2.9
(2.4
)45.6,51.5
90%
99.5
(33.
3)0.3,0.2
83.6
(83.
3)
8.3,8.1
51.2
(50.
0)24.8,24.0
34.9
(33.
3)
32.7,32.4
18.2
(16.
7)
40.1,41.7
10.2
(9.1
)43.
3,46.5
7.1
(6.2
)44.5,48.4
5.5
(4.8
)45.1,49.4
75%
99.5
(33.
3)0.3,0.2
92.6
(92.
6)
3.7,3.7
71.9
(71.
4)14.3,13.9
56.4
(55.
6)
22.1,21.5
34.7
(33.
3)
32.8,32.5
21.4
(20.
0)
38.
8,39.8
15.6
(14.
3)
41.2,43.1
12.3
(11.
1)
42.6,45.1
50%
99.5
(33.
3)0.3,0.2
96.2
(96.
2)
1.9,1.9
83.5
(83.
3)8.
3,8.2
71.8
(71.
4)
14.3,13.9
50.9
(50.
0)
24.9,24.2
34.6
(33.
3)
32.
8,32.6
26.4
(25.
0)
36.
6,37.0
21.4
(20.
0)
38.7,39.8
25%
99.5
(33.
3)0.3,0.2
97.4
(97.
4)
1.3,1.3
88.3
(88.
2)5.
9,5.8
79.2
(78.
9)
10.5,10.3
60.6
(60.
0)
20.0,19.4
43.9
(42.
9)
28.
3,27.8
34.6
(33.
3)
32.
8,32.6
28.6
(27.
3)
35.5,35.8
0%99.5
(33.
3)0.3,0.2
98.0
(98.
0)
1.0,1.0
91.0
(90.
9)4.
5,4.5
83.5
(83.
3)
8.3,
8.2
67.1
(66.
7)
16.7,16.2
50.9
(50.
0)
24.
9,24.2
41.1
(40.
0)
29.
7,29.2
34.6
(33.3
)32.8,32.6
Tab
le1:
Val
ue
ofas
sets
under
man
agem
ent
afte
r1
million
iter
atio
ns
(in
%of
tota
l).
Top
entr
ies:
funda-
men
tal
fund’s
actu
alva
lue
in%
ofto
tal
(bol
dfa
ce)
and
ben
chm
ark
–w
eigh
tunder
inva
rian
tdis
trib
uti
onco
rres
pon
din
gtoπ
(in
bra
cket
s).
Bot
tom
entr
ies:
tren
d-c
has
ing
fund’s
(rom
an)
and
noi
setr
adin
gfu
nd’s
(ita
lic)
actu
alva
lues
in%
ofto
tal.
of each other). The third aspect relates to mis-pricing where we ask how far (if at all)
the risky asset’s price deviates from its fundamental value. This provides insights into
the efficiency of the market.
Performance. The long-run distribution of wealth under management across the
three style for varying degrees of patience is provided in Table 1. Each entry consists
of four numbers; two numbers in each of the two lines that constitute the entry: In the
first line, the long-run proportion of wealth held by the fundamental fund (boldface)
and its benchmark, the weight under the invariant distribution corresponding to π’s (in
4

brackets). The invariant distribution gives equal weight to the trend-chasing fund and the
noise trading fund as both funds’ clients are equally (im)patient (calculated as half of the
residual weight). The second line contains the trend-chasing fund’s (roman) and the noise
trading fund’s proportion of total wealth (italic). The benchmark for the fundamental
fund is the percentage of assets that would prevail on average if there were no systematic
gains from or losses to the rival styles. The data are collected after 1 million periods and
show virtually no variation across runs, hence confidence intervals are not reported.
The first row contains only one entry as all the other cases in this row are identical
to the evolutionary finance model without performance-driven flow of assets (πF = πT =
πN = 1) because only funds with patience less than 1 participate in the flow of money.
Hence there is no outflow from the fundamental fund as long as πT = πN = 1.
The most striking observation is that the fundamental fund does not have fewer
assets under management than under the benchmark in any of the cases analyzed. When
fundamental fund investors are infinitely patient (first column), they make considerable
gains at the expense of the other funds. It does not matter how impatient are the clients
of the trend-chasing and the noise trading fund: they lose 99% or more of their initial
wealth to the fundamental fund. Only when all investors are infinitely patient, the trend-
chasing fund loses merely a third of its initial wealth to the fundamental fund while the
noise trading fund loses more than 99% of its initial wealth.
When fundamental fund investors are very patient but not infinitely so (second column
where the fundamental fund’s clients reallocate 1% of their assets according to realized
performance), the gains over the benchmark can be extremely small. However in these
cases the benchmark is high with proportions between 83.3% and 98.0% of the market
wealth which makes it harder to exceed than the 33.3% benchmark in first column.
Lower degrees of patience are detrimental to investment success. This is true for all
styles. Fix any degree of the fundamental fund’s style (i.e., pick any column), then the
assets under management of trend-chasing and noise trading fund decrease when their
impatience increases. The same is true along rows. The more impatient are clients of the
fundamental fund, the lower the fund’s assets.
The main lessons from Table 1 are that fundamental investors do the better the
more patient they are, fundamental investors do better the more impatient are the other
investors, and trend-chasing and noise trading funds perform quite similar.
A different perspective is to look at the data in terms of survival/extinction and co-
existence of funds. Extinction of the noise trading fund is observed when the fundamental
fund is perfectly patient. If, in addition, the trend-chasing fund is not perfectly patient,
then it also becomes extinct. The market selects for the patient fundamentalists. If all
funds’ clients exhibit impatience, then all of the investment styles co-exist.
All clients being perfectly patient (the case studied in the evolutionary models cited
above) gives rise to a very slow process of market selection which eventually will see the
fundamental fund prevailing. After 1 million time periods, noise trading is almost extinct
5

but the trend-chasing fund still commands 24.3% of all wealth invested. This amount
decreases over time but at a decreasing rate. The conjecture is that the trend-chasing
fund ‘imitates’ the portfolio choice of the fundamental fund (which happens, for instance,
when asset prices are constant). This issue will be studied later. The observation that
noise trading is doing well, except when the fundamental fund’s clients are very patient,
gives rise to the conjecture that the market can be inefficient. A point that will also be
explored in detail later.
The combination of impatient clients and different investment styles enables the noise
trading fund to survive. The fund’s allocation creates noise that, by chance, can generate
a small amount of momentum. This momentum is then amplified by the trend-chasing
fund which, in turn, benefits the performance of the noise trading fund as it is overweight
in the asset that experiences price momentum. The finding highlights that momentum,
randomly initiated by noise traders, can ensure the survival of noise traders. Since the
three funds in the model do not have a notion of risk, noise traders have to ‘create their
own space’ differently to the mean-variance world.
Asset allocation. Since the investment styles are dynamic through their dependence
on past prices - and thus look quite different ex ante - it is of interest to ask whether they
are distinct ex post, i.e., whether funds’ actual portfolio holdings differ.
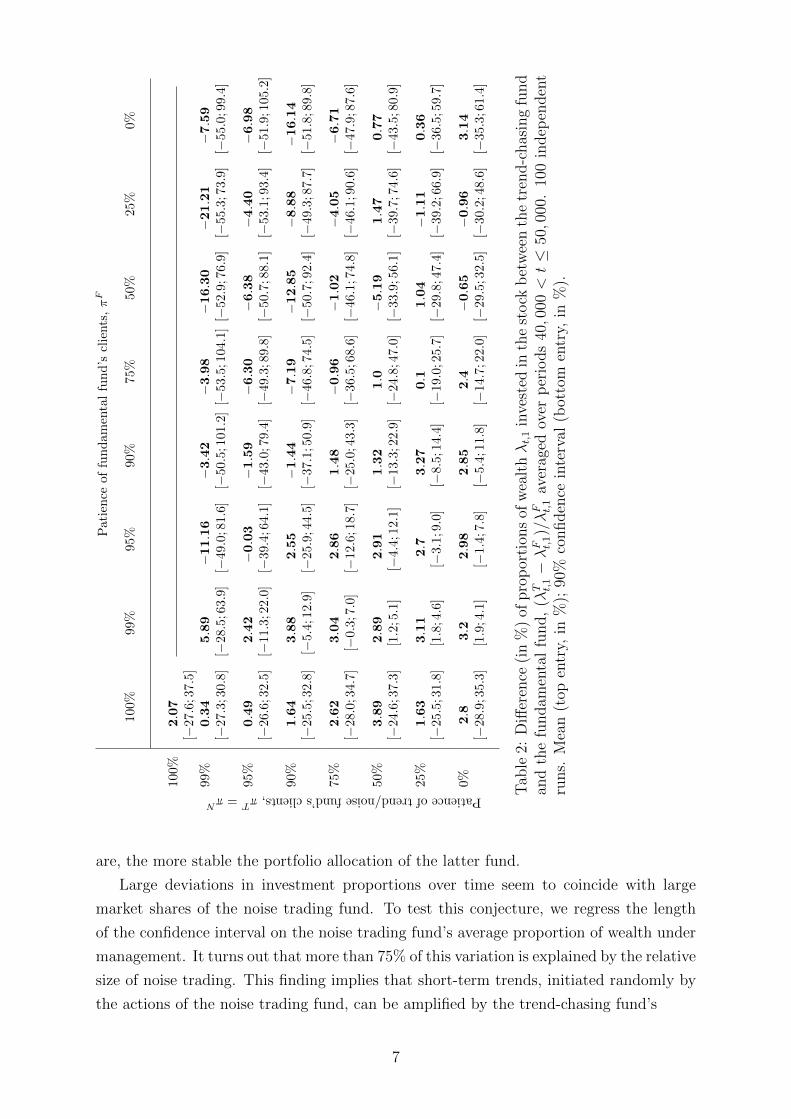
We measure the difference between the portfolios of two funds as the relative difference
of the proportion of the funds’ investments in the risky asset. If this difference is small
then the funds’ portfolios are approximately collinear and funds effectively make the same
investments. Table 2 reports this measure for the trend-chasing fund vs the fundamental
fund. The top entry in each cell is an average of (λTt,1−λFt,1)/λFt,1 (reported in percentages)
over 10,000 time periods and 100 independent runs. The bottom entry in each cell is the
90% confidence interval (also in %).
The first observation is that the portfolios of the trend-chasing and the fundamental
fund are quite similar when averaged over time. When the fundamental fund’s clients are
more patient, the trend-chasing fund tends to be overweight (on average) in the risky asset
(lower left corner of Table 2). If, on the other hand, the clients of the trend-chasing fund
are more patient (but not infinitely patient), its exposure to the risky asset is typically
lower than that of the fundamental fund (upper right corner, excluding top row).
There is considerable variation across samples. The 90% confidence intervals (bottom
entries in each cell) show that the trend-chasing funds exposure to the risky asset is
changing considerably over time. For instance, when all clients are equally (im)patient
(which corresponds to the down diagonal of the table), the trend-chasing fund’s exposure
to the risky assets with 10% probability will either be 30% less or 60% higher than that
of the fundamental fund.
The most stable portfolio allocations (i.e., least cross-sectional variation) are observed
when the fundamental fund’s clients are extremely patient (πF = 99%) and the other
funds’ clients are less patient. In fact the more impatient noise and trend-chasing clients
6
Pat
ien
ceof
fun
dam
enta
lfu
nd
’scl
ients
,πF
Patienceoftrend/noisefund’sclients,πT
=πN
100%
99%
95%
90%
75%
50%
25%
0%
100%
2.07
[−27.6
;37.
5]
99%
0.34
[−27.3
;30.
8]
5.89
[−28.5
;63.
9]−11.16
[−49.
0;81.6
]−3.42
[−50.
5;101.
2]−3.98
[−53.5
;104.
1]−16.30
[−52.9
;76.
9]−21.21
[−55.3
;73.
9]
−7.59
[−55.
0;9
9.4]
95%
0.49
[−26.6
;32.
5]
2.42
[−11.3
;22.
0]
−0.03
[−39.
4;64.1
]−1.59
[−43.
0;79.
4]
−6.30
[−49.3
;89.
8]
−6.38
[−50.7
;88.
1]
−4.40
[−53.1
;93.
4]
−6.98
[−51.
9;1
05.
2]
90%
1.64
[−25.5
;32.
8]
3.88
[−5.4
;12.
9]
2.55
[−25.
9;44.5
]−1.44
[−37.
1;50.
9]
−7.19
[−46.8
;74.
5]−12.85
[−50.7
;92.
4]
−8.88
[−49.3
;87.
7]−16.14
[−51.
8;8
9.8]
75%
2.62
[−28.0
;34.
7]
3.04
[−0.
3;7.0
]2.86
[−12.6
;18.
7]
1.48
[−25.0
;43.
3]
−0.96
[−36.5
;68.
6]
−1.02
[−46.1
;74.
8]
−4.05
[−46.1
;90.
6]
−6.71
[−47.9
;87.
6]
50%
3.89
[−24.6
;37.
3]
2.89
[1.2
;5.1
]2.91
[−4.
4;1
2.1]
1.32
[−13.3
;22.
9]
1.0
[−24.8
;47.
0]
−5.19
[−33.9
;56.
1]
1.47
[−39.7
;74.
6]
0.77
[−43.
5;8
0.9]
25%
1.63
[−25.5
;31.
8]
3.11
[1.8
;4.6
]2.7
[−3.
1;9.
0]
3.27
[−8.
5;1
4.4]
0.1
[−19.0
;25.
7]
1.04
[−29.8
;47.
4]
−1.11
[−39.2
;66.
9]
0.36
[−36.
5;5
9.7]
0%2.8
[−28.9
;35.
3]
3.2
[1.9
;4.1
]2.98
[−1.
4;7.
8]
2.85
[−5.
4;1
1.8]
2.4
[−14.7
;22.
0]
−0.65
[−29.5
;32.
5]
−0.96
[−30.2
;48.
6]
3.14
[−35.
3;6
1.4]
Tab
le2:
Diff
eren
ce(i
n%
)of
pro
por
tion
sof
wea
lthλt,1
inve
sted
inth
est
ock
bet
wee
nth
etr
end-c
has
ing
fund
and
the
fundam
enta
lfu
nd,
(λT t,1−λF t,1)/λF t,1
aver
aged
over
per
iods
40,0
00<t≤
50,0
00.
100
indep
enden
tru
ns.
Mea
n(t
open
try,
in%
);90
%co
nfiden
cein
terv
al(b
otto
men
try,
in%
).
are, the more stable the portfolio allocation of the latter fund.
Large deviations in investment proportions over time seem to coincide with large
market shares of the noise trading fund. To test this conjecture, we regress the length
of the confidence interval on the noise trading fund’s average proportion of wealth under
management. It turns out that more than 75% of this variation is explained by the relative
size of noise trading. This finding implies that short-term trends, initiated randomly by
the actions of the noise trading fund, can be amplified by the trend-chasing fund’s
7

Pat
ien
ceof
fun
dam
enta
lfu
nd
’scl
ients
,πF
Patienceoftrend/noisefund’sclients,πT
=πN
100%
99%
95%
90%
75%
50%
25%
0%
100%
0.46
[0.0
;1.0
]0.44
[0.0
;1.0
]0.42
[0.0
;1.1
]0.50
[0.0
;1.2
]0.47
[0.0
;1.2
]0.50
[0.0
;1.1
]0.47
[0.1
;1.0
]0.46
[0.0
;1.1
]
99%
0.45
[0.1
;1.1
]26.45
[1.1
;66.
3]52.46
[12.
9;1
31.9
]61.74
[7.0
;165.
1]
67.09
[5.1
;240.
0]
45.01
[4.0
;84.
2]
46.06
[4.0
;93.
0]
63.83
[7.0
;165.
7]
95%
0.45
[0.0
;0.9
]8.89
[1.9
;17.
8]28.75
[5.1
;67.
1]37.90
[3.9
;96.
2]
49.30
[7.1
;133.
3]
58.19
[4.6
;199.
5]
59.25
[6.5
;136.
9]
62.91
[6.3
;167.
5]
90%
0.42
[0.0
;1.0
]5.12
[0.4
;9.7
]18.10
[1.7
;42.
4]
27.48
[2.3
;65.
4]
43.08
[4.4
;124.
6]
47.68
[6.5
;111.
2]
51.96
[2.6
;133.
5]
48.09
[4.6
;122.
5]
75%
0.48
[0.0
;1.0
]1.95
[0.3
;4.2
]8.77
[1.1
;16.
6]
15.45
[1.1
;37.
1]
31.47
[4.3
;81.
2]
38.96
[7.2
;96.
4]
43.55
[2.5
;125.
7]
52.62
[4.4
;143.
1]
50%
0.45
[0.1
;1.0
]1.00
[0.1
;2.1
]4.34
[0.2
;9.6
]9.52
[2.3
;18.
3]
19.59
[2.6
;45.
3]
28.03
[2.6
;60.
1]
37.26
[4.2
;85.
5]
45.67
[4.1
;124.
4]
25%
0.42
[0.0
;0.9
]0.73
[0.1
;1.5
]3.28
[0.4
;6.1
]5.36
[0.6
;11.
4]
12.20
[1.1
;24.
8]
24.11
[3.5
;59.
6]
30.65
[2.7
;65.
1]
29.23
[2.2
;60.
7]
0%0.47
[0.0
;1.0
]0.52
[0.0
;1.2
]2.33
[0.3
;4.6
]4.64
[0.4
;9.3
]9.95
[1.1
;21.
1]
17.98
[2.2
;39.
8]
25.59
[2.0
;66.
2]
29.32
[3.3
;71.
9]
Tab
le3:
Mis
-pri
cing
ofri
sky
asse
t.M
is-p
rici
ng
isca
lcula
ted
asth
eav
erag
eof
abso
lute
valu
esof
rela
tive
dev
iati
ons
(Pt−FV
)/FV
(wit
hFV
=1,
000)
over
the
last
10,0
00p
erio
ds
of10
0sa
mple
s,ea
chof
lengt
h50,0
00.
Mea
n(t
op,
bol
dfa
ced
entr
y,in
%),
90%
confiden
cein
terv
alof
rela
tive
dev
iati
ons
(bot
tom
entr
y,in
%).
strategy. In the medium term the trend is maintained by luring clients of other funds
into transfering wealth due to the (unrealized) excess returns through capital gains. In
the longer term, the momentum fades and clients desert the fund.
Interestingly, the trend-chasing fund’s position can be the more extreme, the more
patient are the trend-chasing and noise trading funds’ clients. (Range of the confidence
intervals are increasing along rows.) By attracting capital from more impatient clients of
the fundamental fund, outperformance can last the longer.
Mispricing. We finally ask to what extent the funds’ portfolio choices impact asset
8

prices. The actual price dynamics is related to these decisions through the value of assets
under management. Extreme allocations only lead to an inefficient market, if the fund is
sufficiently large.
Table 3 reports the difference between the market price of the risky asset and its fun-
damental value relative to the latter. Mispricing is formally defined as |(Pt,1−FV )/FV |with the fundamental value FV = 1, 000. To capture systematic rather than short-term
mispricing, we average realizations of this variable over the last 10, 000 time periods of
runs of length 50, 000. The table reports both the mean over 100 independent runs and
the 90% confidence interval for each combination of degrees of patience.
Asset prices are close to their fundamental value as long as the clients of the funda-
mental fund are more patient than those of the other funds. Mean mis-pricing in the
lower-left corner of Table 3 is less than 10% in almost all cases. There is however some
variation between samples. If the fundamental fund’s clients degree of patience is 95%
but that of the other funds’ only 75%, then the risky asset is mis-valued by at least
16.6% for 5% of the time. The most extreme mis-pricing and the most volatile prices are
observed when πF = 0.
The mean of the noise trading fund’s market share explains about 92% of the size of the
confidence interval and thus the likely range of mis-pricing observed. Thus the existence
of the noise generated by the noise trading fund is the primary source of mispricing.
However, time series volatility of the risky asset’s price is (averaged across all cases) more
than twice that of the noise trading fund’s contribution (λNt,1WNt ). The second source is
the amplification of small price movements caused by the trend-chasing fund.
Figure 1 illustrates these findings. It shows a simulation run for varying degrees of
the fundamental fund clients’ patience πF = 99%, 75%, and 25% with the patience of
the other two fund’s clients fixed at πT = πN = 25%. For reference, the investment
strategy of the noise trading fund and the dividend payments are identical across the
three scenarios.
When the fundamental fund’s clients are very patient, panel (a), price volatility is
negligible despite the noise trading fund varying its exposure to the risky asset over time.
The reason is provided in the Table 1 which shows that the fundamental fund owns
97.4% of all assets. Hence neither the noise trading nor the trend-chasing fund have any
market impact. As reported in Table 2, the trend-chasing fund effectively imitates the
fundamental fund’s asset allocation.
Lower patience, πF = 75%, panel (b), leads to higher price volatility. This volatility is
caused by both the noise trading and the trend-chasing fund. We observe that the noise
trading fund leads and the trend-chasing fund follows after the price has moved away from
the risky asset’s fundamental value. In this scenario the fundamental fund still holds
60.6% of the market wealth on average while the remainder is almost identically split
between the other two funds. Table 2 finds that the trend-chasing fund is underweight
in the risky asset by 19.0% or overweight by 25.7 or more (relative to the fundamental
9

200 400 600 800 10000.0
0.2
0.4
0.6
0.8
1.0
200 400 600 800 1000500
1000
1500
2000
2500
(a) πF = 99% and πT = πN = 25%
200 400 600 800 10000.0
0.2
0.4
0.6
0.8
1.0
200 400 600 800 1000500
1000
1500
2000
2500
(b) πF = 75% and πT = πN = 25%
200 400 600 800 10000.0
0.2
0.4
0.6
0.8
1.0
200 400 600 800 1000500
1000
1500
2000
2500
(c) πF = 25% and πT = πN = 25%
Figure 1: Simulation run of 1,000 time periods. Left panels: Proportion of wealth investedin the risky asset, fundamental fund (blue), trend-chasing fund (red), and noise tradingfund (green). Right panels: Price of the risky asset. The degree of patience of trend-chasing and noise trading fund are fixed at πT = πN = 25%. In all graphs, the samerandom path for noise trading fund’s strategy (which is independent of price) is used.
10

fund) for 10% of the time.
Impatience of the fundamental fund’s clients, πF = 25%, panel (c), entails extreme
mis-pricing. According to Table 3, 5% of the time the asset is mispriced by at least 65.1%.
In conjunction with price movements, we observe pronounced (pro-cyclical) changes in the
trend-chasing fund’s asset allocation. The fundamental fund is acting counter-cyclically,
thus functioning as a moderating force. The fund though has limited success as its average
share of assets under management are, on average, only 34.6% of the total wealth.
Average turnovers of the fundamental, trend-chaser, noise trading fund are as follows
(in % of wealth under management, annualized): (a) 3.93, 4.79, 300.8; (b) 68.58, 27.56,
249.4; (c) 140.3, 36.74, 198.6. The noise trading fund indeed trades the most, followed
by the fundamental fund which has a higher turnover than the trend-chasing fund due
to its counter-cyclical behavior. Only in the extremely quiet market (a) is the turnover
of the fundamental fund the lowest. These numbers show that being a fund investing
according to fundamentals can require substantial trading volumes, mostly in building
up or reducing positions to due increasing or decreasing degrees of mis-pricing. However,
the turnover is only indirectly linked to the patience of clients of the fundamental fund.
The main lesson is that price volatility and severe mis-pricing are related to the degree
of the fundamental fund clients’ patience. As long as they are patient, noise trading
has no price impact and trend-chasing funds are effectively mimicking the fundamental
fund’s asset allocation. Being impatient as a client of a fundamental fund makes the
market vulnerable to the amplification of minor, short-term mis-pricing which leads to
longer-term mis-pricing and high volatility. These market movements are caused by
fundamental fund’s clients moving their capital to the two pro-cyclical funds which have
a better performance record over the last few periods.
4 Conclusion
The note illustrates that the degree of patience and its heterogeneity across investment
styles matter for the market dynamics. If clients of fundamental funds are more pa-
tient than those of trend-chasing or noise trading funds, then the market is (on average)
well behaved with little mis-pricing and most wealth invested according to fundamen-
tals. However, if fundamental funds’ clients are more impatient than other funds’ clients,
the market experiences high price volatility as well as short- and long-term mis-pricing.
When fundamental investors lose trust in their asset managers when market dislocation
increases (Shleifer, 2000), our results imply that their loss of patience contributes to
market instability. We believe that the heterogeneous agent-based evolutionary finance
market model with long-lived assets and fund-specific degrees of investors’ patience pre-
sented in this note might serve as a basis for further empirical studies along the lines
pursued by the applied agent-based papers referred to in the introduction.
11

References
Assenza, T., Brock, W., and Hommes, C. (2017). Animal spirits, expectations, and theamplification and duration of crises. Economic Inquiry, 55:542–564.
Bogle, J. C. (2007). The Little Book of Common Sense Investing. Wiley.
Coqueret, G. (2017). Empirical properties of a heterogeneous agent model in large di-mensions. Journal of Economic Dynamics and Control, 77:180–201.
Evstigneev, I., Hens, T., and Schenk-Hoppe, K. (2006). Evolutionary stable stock mar-kets. Economic Theory, 27(2):449–468.
Evstigneev, I., Hens, T., and Schenk-Hoppe, K. R. (2009). Evolutionary finance. InHens, T. and Schenk-Hoppe, K., editors, Handbook of Financial Markets: Dynamicsand Evolution, chapter 9, pages 507–566. North Holland, Amsterdam.
Evstigneev, I. V., Hens, T., and Schenk-Hoppe, K. R. (2016). Evolutionary behaviouralfinance. In Haven, E., Molyneux, P., Wilson, J., Fedotov, S., and Duygun, M., editors,The Handbook of Post Crisis Financial Modelling, chapter 9, pages 214–234. PalgraveMacMillan.
Franke, G. and Luders, E. (2010). Instability of financial markets and preference hetero-geneity. Advances in Decision Sciences, Article ID 791025.
Grazzini, J., Richiardi, M. G., and Tsionas, M. (2017). Bayesian estimation of agent-based models. Journal of Economic Dynamics and Control, 77:26–47.
Harris, L. E. (2015). Trading and Electronic Markets: What Investment ProfessionalsNeed to Know. CFA Institute.
Hommes, C. (2013). Behavioral Rationality and Heterogeneous Expectations in ComplexEconomic Systems. Cambridge University Press.
Hommes, C. and Wagener, F. (2009). Complex evolutionary systems in behavioral fi-nance. In Hens, T. and Schenk-Hoppe, K., editors, Handbook of Financial Markets:Dynamics and Evolution, chapter 4, pages 217–276. North Holland, Amsterdam.
Kukacka, J. and Barunik, J. (2017). Estimation of financial agent-based models withsimulated maximum likelihood. Journal of Economic Dynamics & Control, 85:21–45.
Malkiel, B. G. (2016). A Random Walk down Wall Street: The Time-tested Strategy forSuccessful Investing. Norton.
McCann, K. S. (2000). The diversity-stability debate. Nature, 405:228–233.
Palczewski, J., Schenk-Hoppe, K. R., and Wang, T. (2016). Itchy feet vs cool heads:Flow of funds in an agent-based financial market. Journal of Economic Dynamics andControl, 63:53–68.
Roberge, M. W., Flaherty, J. C., Almeida, R. M., and Boyd, A. C. (2013). Lengtheningthe investment horizon. MFS Institutional Advisors, White Paper, November.
Shiller, R. (1999). Irrational Excuberance. Princeton University Press.
Shleifer, A. (2000). Inefficient Markets: An Introduction to Behavioral Finance. OxfordUniversity Press.
12