pathophysiological relationships between lower urinary tract symptoms and the prostate do not...
TRANSCRIPT

Pathophysiological Relationships Between LowerUrinary Tract Symptoms and the Prostate Do
Not Strengthen Over Time
Amanda J. Lee,1* W. Michael Garraway,2 and Richard J. Simpson3
1Department of Public Health Sciences, The University of Edinburgh Medical School,Edinburgh, Scotland
2Druim Mhor, by Loch Alvie, Inverness-shire, Scotland3Bridge of Allan Health Centre, Bridge of Allan, Scotland
BACKGROUND. The aim of this survey was to examine the relationships among baselineprostate gland volume and changes in urinary symptomatology 3 years later.METHODS. A Scottish community-based cohort of 193 men aged 40–79 years who hadprostate volume measured by transrectal ultrasound (TRUS) were followed-up at 3 years.RESULTS. Only baseline nocturia correlated with prostate volume (r = 0.202, P = 0.0057),although some relationships existed for the antero-posterior dimension of the prostate gland.More statistically significant relationships were evident for adenoma volume rather thanprostate volume, but they still had relatively low correlations (range, 0.19–0.31).CONCLUSIONS. This study demonstrates the lack of relationships between prostate glandvariables and lower urinary tract symptoms (LUTS). Those relationships that are statisticallysignificant (at the P < 0.01 level) are weak, and only explain at most 9% of the total variationof prostate or adenoma volume or their dimensions. Prostate 37:5–9, 1998.© 1998 Wiley-Liss, Inc.
KEY WORDS: American Urological Association symptom index; benign prostatic dis-ease; benign prostatic hyperplasia; cohort longitudinal study; lower uri-nary tract symptoms
INTRODUCTION
Urinary symptoms are common in both elderlymen [1] and women [2,3]. Men are often labelled ashaving lower urinary tract symptoms (LUTS) sugges-tive of benign prostatic obstruction and may evenhave a prostatectomy without histological evidence ofbenign prostatic hyperplasia (BPH) [4,5]. This is de-spite the fact that the Amercian Urological Association(AUA) symptom index is recommended only forquantifying symptoms of BPH, not for diagnosingBPH. Studies have failed to show a relationship be-tween urinary symptoms, prostate size, uroflowmetry,and urodynamic measures [6–9]. This study describesthe relationships between baseline prostate and ade-noma volumes and their dimensions, and subsequentchanges in urinary symptomatology over a 3-year pe-riod in a community-based cohort [10].
MATERIALS AND METHODS
Subjects
Details of this survey have been described else-where [10,11]. Briefly, all men aged 40–79 years onJanuary 1, 1991, who were registered with the healthcenters serving the villages of Cowie, Plean, and Airthin Central Scotland, were considered for participationin the survey. After medical exclusions, 597 men wereeligible for the study, and 367 (61%) of these com-pleted a short, previously validated urinary symptom
Contract grant sponsor: Merck Sharp and Dohme.*Correspondence to: A.J. Lee, Department of Public Health Sciences,The University of Edinburgh Medical School, Teviot Place, Edin-burgh EH8 9AG, United Kingdom. E-mail: [email protected] 2 September 1997; Accepted 31 March 1998
The Prostate 37:5–9 (1998)
© 1998 Wiley-Liss, Inc.

questionnaire in the community [12]. Details of thesymptom questions are given elsewhere [11]. Uro-flowmetry was performed using a Dantec Urodyn1000 uroflowmeter and was repeated until a voidedvolume of ù150 ml was obtained or uroflowmetry hadbeen completed three times. Three hundred of thesemen attended a prostate clinic at Stirling Royal Infir-mary. A further 26 registered men were referred bytheir general practitioner. The same symptom ques-tions were administered, and uroflowmetry was re-peated. Prostate and adenoma dimensions were mea-sured by transrectal ultrasound (TRUS), and their vol-umes were determined by using the formula for thevolume of an ellipsoid:
V = p/6 × (d1 × d2 × d3),
where d1 and d2 are the maximum transverse andantero-posterior diameters and d3 is the horizontallength of the gland in centimeters.
At 3-year follow-up, 45 men were found to be in-eligible because of death (n = 9), prostatectomy (n =18), prostate cancer (n = 8), drug treatment for LUTS (n= 2), or other specified medical reasons which mighthave interfered with urinary function (n = 8). Onehundred and ninety-three (69%) men agreed to par-ticipate and recorded responses to the same questionsabout symptoms and bothersomeness, and to sevenquestions relating to the degree of interference in dailyliving activities caused by urinary symptoms, thatwere also asked at baseline. Responses to the Interna-tional Prostate Symptom Score (IPSS) quality of lifequestionnaire were also recorded [13]. Uroflowmetrywas repeated. Initial prostate and adenoma volumeswere available for 185 of these men (5 men could nottolerate TRUS and an additional 3 men had anal ste-nosis).
Statistical Methods
The AUA symptom and bother indices and inter-ference index were calculated using methods previ-ously described [14]. Mild, moderate, and severesymptoms were classified as an AUA symptom indexof 0–7, 8–19, and 20–35, respectively. Mild, moderate,and severe bothersomeness equated to an AUA botherindex of 0–3, 4–18, and 19–28, respectively.
Spearman’s rank correlation was used to assess therelationship between different variables. Due to mul-tiple testing, correlations are quoted as statistically sig-nificant where P < 0.01. Multiple stepwise regressionwas used to determine if age, baseline maximum flowrate, prostate or adenoma volumes, or their dimen-sions had an independent effect on the baseline and3-year AUA symptom index. Multiple stepwise re-gression also determined which variables were pre-dictive of adenoma and prostate volumes and the ratio
of adenoma to prostate volume. The variables consid-ered for entry into the models were age, baseline lev-els of urinary symptoms, their bothersomeness andinterference, urinary maximum flow rates, the AUAsymptom and bother indices, and the interference in-dex. Further models were examined that only consid-ered age and the changes in levels of symptoms, both-ersomeness, interference, and the three indices for en-try into the models. Variables were added to orremoved from the regression models at the 5% signifi-cance level. Uroflowmetry analyses used the observa-tion which recorded the highest voided volume.
RESULTS
Urinary Symptoms at Baseline and at Three Years
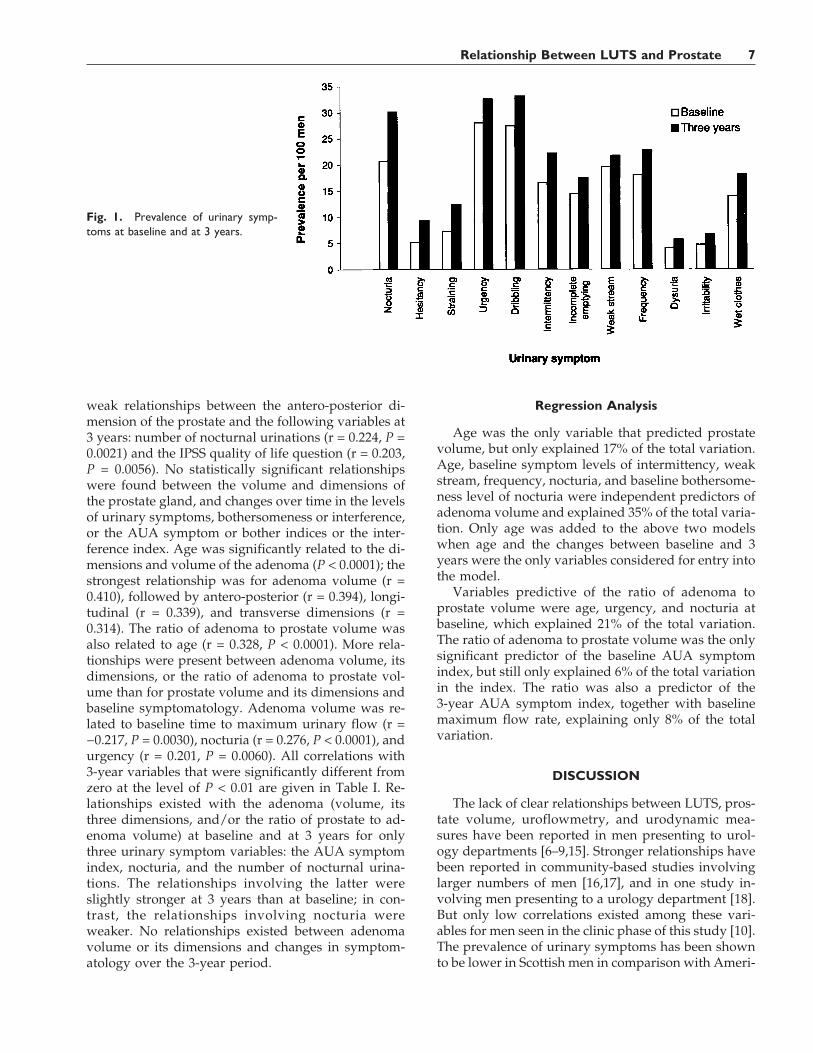
The prevalence rates of urinary symptoms (scoreù2) at baseline and 3 years are given in Figure 1. Al-most all men had mild (80%) or moderate (19%) symp-toms based on the AUA symptom index; 31 (16%) menhad an AUA symptom index of zero. The proportionsof men with mild and moderate symptoms changed at3 years to 70% and 27%, respectively. Only 16 (8%)men had an AUA symptom index of zero at 3 years.The mean AUA symptom index increased signifi-cantly (Wilcoxon signed rank test, P < 0.0001) betweenbaseline (mean 4.5, SE 0.34) and 3 years (mean 5.8, SE0.37), as did the mean AUA bother index (n = 177,means 1.7 (SE 0.22) and 3.4 (SE 0.35), respectively). Theproportions of men with mild and moderate bother-someness changed from 83% and 17%, respectively, atbaseline to 67% and 32%, respectively, at 3 years.However, the mean interference index (n = 162)changed little between baseline (mean 2.1, SE 0.32)and 3 years (mean 2.4, SE 0.36).
Prostate and Adenoma Volumes and TheirDimensions
The mean prostate and adenoma volumes were 25.3cm3 (SE 0.54) and 8.4 cm3 (SE 0.46), respectively. Theratio of adenoma volume to total prostate gland vol-ume varied from 0.10–0.84; the mean ratio was 0.31(SE 0.0099). Relatively strong relationships existed be-tween age and prostate volume and its dimensions;prostate volume had the highest correlation (r = 0.366,P < 0.0001), followed by transverse (r = 0.319, P <0.0001), antero-posterior (r = 0.274, P = 0.0002), andlongitudinal dimensions (r = 0.268, P = 0.0002). Noc-turia was the only baseline variable related to any ofthe prostate variables, i.e., prostate volume (r = 0.202,P = 0.0057) and antero-posterior dimension (r = 0.208,P = 0.0046). No relationship existed between prostatevolume and baseline AUA symptom index (r = 0.092,P = 0.21), or between prostate volume and baselinemaximum flow rate (r = −0.041, P = 0.58). There were
6 Lee et al.
weak relationships between the antero-posterior di-mension of the prostate and the following variables at3 years: number of nocturnal urinations (r = 0.224, P =0.0021) and the IPSS quality of life question (r = 0.203,P = 0.0056). No statistically significant relationshipswere found between the volume and dimensions ofthe prostate gland, and changes over time in the levelsof urinary symptoms, bothersomeness or interference,or the AUA symptom or bother indices or the inter-ference index. Age was significantly related to the di-mensions and volume of the adenoma (P < 0.0001); thestrongest relationship was for adenoma volume (r =0.410), followed by antero-posterior (r = 0.394), longi-tudinal (r = 0.339), and transverse dimensions (r =0.314). The ratio of adenoma to prostate volume wasalso related to age (r = 0.328, P < 0.0001). More rela-tionships were present between adenoma volume, itsdimensions, or the ratio of adenoma to prostate vol-ume than for prostate volume and its dimensions andbaseline symptomatology. Adenoma volume was re-lated to baseline time to maximum urinary flow (r =−0.217, P = 0.0030), nocturia (r = 0.276, P < 0.0001), andurgency (r = 0.201, P = 0.0060). All correlations with3-year variables that were significantly different fromzero at the level of P < 0.01 are given in Table I. Re-lationships existed with the adenoma (volume, itsthree dimensions, and/or the ratio of prostate to ad-enoma volume) at baseline and at 3 years for onlythree urinary symptom variables: the AUA symptomindex, nocturia, and the number of nocturnal urina-tions. The relationships involving the latter wereslightly stronger at 3 years than at baseline; in con-trast, the relationships involving nocturia wereweaker. No relationships existed between adenomavolume or its dimensions and changes in symptom-atology over the 3-year period.
Regression Analysis
Age was the only variable that predicted prostatevolume, but only explained 17% of the total variation.Age, baseline symptom levels of intermittency, weakstream, frequency, nocturia, and baseline bothersome-ness level of nocturia were independent predictors ofadenoma volume and explained 35% of the total varia-tion. Only age was added to the above two modelswhen age and the changes between baseline and 3years were the only variables considered for entry intothe model.
Variables predictive of the ratio of adenoma toprostate volume were age, urgency, and nocturia atbaseline, which explained 21% of the total variation.The ratio of adenoma to prostate volume was the onlysignificant predictor of the baseline AUA symptomindex, but still only explained 6% of the total variationin the index. The ratio was also a predictor of the3-year AUA symptom index, together with baselinemaximum flow rate, explaining only 8% of the totalvariation.
DISCUSSION
The lack of clear relationships between LUTS, pros-tate volume, uroflowmetry, and urodynamic mea-sures have been reported in men presenting to urol-ogy departments [6–9,15]. Stronger relationships havebeen reported in community-based studies involvinglarger numbers of men [16,17], and in one study in-volving men presenting to a urology department [18].But only low correlations existed among these vari-ables for men seen in the clinic phase of this study [10].The prevalence of urinary symptoms has been shownto be lower in Scottish men in comparison with Ameri-
Fig. 1. Prevalence of urinary symp-toms at baseline and at 3 years.
Relationship Between LUTS and Prostate 7
can men [19]. This could imply a narrower diseasespectrum in this Scottish cohort, which could reducethe strength of the relationships. However, even thestrongest relationships between LUTS and prostatevolume explain less than 4% of the total variation ofprostate volume [16,17], and this study followed thecohort of men for 3 years and failed to detect anystrong relationships.
The relationship between increasing age and pros-tate volume has been reported [20]. Since histologicalBPH mainly develops in the transitional zone of theprostate gland, the antero-posterior dimension may bemore likely to be affected by enlargement than thetransverse or longitudinal dimensions. Thus the ratioof adenoma to prostate volume may be more relevantthan the individual volumes and dimensions of eitherthe adenoma or the prostate [21]. The only variableswhich correlated with adenoma volume at baselineand at 3 years were the AUA symptom index, noctu-ria, and the number of nocturnal urinations. Whythese relationships should exist for the adenoma, butnot for the entire prostate gland, is not clear. Nocturiais one of the most prevalent symptoms [19] and isrelated to age. But from the regression analyses, theseare both independent predictors of adenoma volumeand the ratio of adenoma to prostate volume. Somerelationships could have occurred by chance becauseof multiple testing.
More surprising is the lack of any relationships be-
tween prostate or adenoma volumes and their dimen-sions, and changes in symptomatology over the 3-yearperiod, although the correlations may have beenweakened by an increased variation associated withchange. Even so, those with deteriorating symptoms,bothersomeness, or levels of interference in daily liv-ing activities do not have larger prostates or adenomasat the initial assessment. It is possible that the prostateglands of those men with a deteriorating urinary func-tion may have increased in size over this period.
The lack of a relationship between prostate volumeand the AUA symptom index in the present study andthe weak relationships reported in other community-based studies (n = 466, r = 0.19, P < 0.001 [16], and n =502, r = 0.19, P < 0.001 [17]) could be partly due to theway in which the AUA symptom index was validated.The seven AUA symptom questions were selectedfrom 17 urinary symptom questions, based on theirability to differentiate between ‘‘BPH’’ patients andcontrols. However, the ‘‘BPH’’ patients were classifiedas having ‘‘BPH’’ based on the presence of LUTS andphysical findings which were consistent with ‘‘BPH’’;the controls were also younger than the ‘‘BPH’’ pa-tients. Thus the AUA symptom index differentiatedwell between the two groups [22]. Other studies haveshown that the index cannot differentiate between thedifferent sites of obstruction [23] or severity of ob-struction [7].
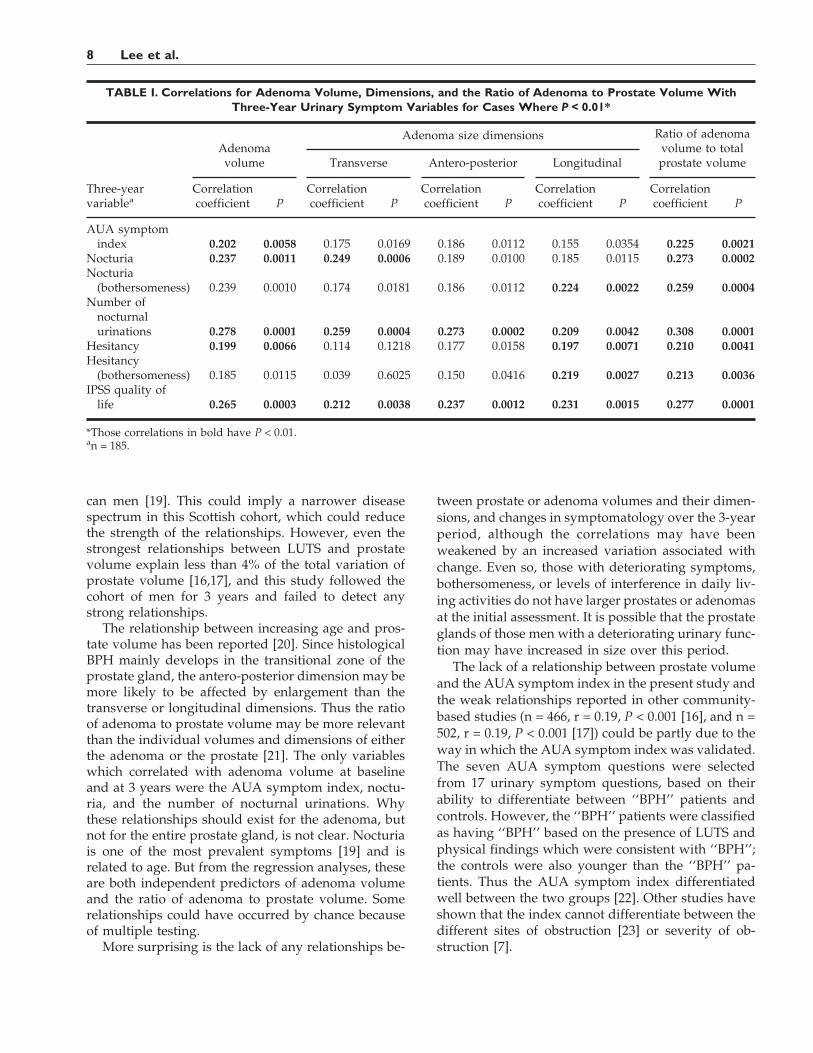
TABLE I. Correlations for Adenoma Volume, Dimensions, and the Ratio of Adenoma to Prostate Volume WithThree-Year Urinary Symptom Variables for Cases Where P < 0.01*
Three-yearvariablea
Adenomavolume
Adenoma size dimensions Ratio of adenomavolume to totalprostate volumeTransverse Antero-posterior Longitudinal
Correlationcoefficient P
Correlationcoefficient P
Correlationcoefficient P
Correlationcoefficient P
Correlationcoefficient P
AUA symptomindex 0.202 0.0058 0.175 0.0169 0.186 0.0112 0.155 0.0354 0.225 0.0021
Nocturia 0.237 0.0011 0.249 0.0006 0.189 0.0100 0.185 0.0115 0.273 0.0002Nocturia
(bothersomeness) 0.239 0.0010 0.174 0.0181 0.186 0.0112 0.224 0.0022 0.259 0.0004Number of
nocturnalurinations 0.278 0.0001 0.259 0.0004 0.273 0.0002 0.209 0.0042 0.308 0.0001
Hesitancy 0.199 0.0066 0.114 0.1218 0.177 0.0158 0.197 0.0071 0.210 0.0041Hesitancy
(bothersomeness) 0.185 0.0115 0.039 0.6025 0.150 0.0416 0.219 0.0027 0.213 0.0036IPSS quality of
life 0.265 0.0003 0.212 0.0038 0.237 0.0012 0.231 0.0015 0.277 0.0001
*Those correlations in bold have P < 0.01.an = 185.
8 Lee et al.

CONCLUSIONS
This study demonstrates the lack of relationshipsbetween prostate gland variables and LUTS in a com-munity-based cohort of men followed up over a 3-yearperiod. Few relationships were statistically significantat the 0.01 level; however, stronger relationships wereevident for the adenoma, rather than for the prostate,and LUTS, although the strongest of these relation-ships only explained 9% of the total variation in theadenoma variable. No relationships at all were foundbetween the change in LUTS levels over the 3-yearperiod, and prostate or adenoma volumes or their di-mensions.
ACKNOWLEDGMENTS
We thank all the general practitioners and theirstaff at the health centers serving the villages ofCowie, Plean, and Airth; Mr. G. McKelvie, Mr. A. Rog-ers, and Mr. M. Hehir, Department of Urology,Stirling Royal Infirmary; Mr. A. Yates, Department ofUrology, Stobhill General Hospital, Glasgow; CatrionaArmstrong and Sandra Auld, the research nurses; andDrs. B. Russell, S. Shepherd, and C. Girman for com-ments on earlier drafts.
REFERENCES
1. Garraway WM, Collins GN, Lee RJ: High prevalence of benignprostatic hypertrophy in the community. Lancet 1991;338:469–471.
2. Lepor H, Machi G: Comparison of AUA symptom index in un-selected males and females between the ages of 55 and 79 years.Urology 1993;42:36–40.
3. Chai TC, Belville WD, McGuire EJ, Nyguist L: Specificity of theAmerican Urological Association voiding symptom index:Comparison of unselected and selected samples of both sexes. JUrol 1993;150:1710–1713.
4. Abrams PH: New words for old: Lower urinary tract symptomsfor ‘‘prostatism’’ avoids spurious suggestion of diagnostic ac-curacy. Br Med J [Clin Res] 1994;308:929–930.
5. McLoughlin J, Gill KP, Abel PD, Williams G: Symptoms versusflow rates versus urodynamics in the selection of patients forprostatectomy. Br J Urol 1990;66:303–305.
6. van Venrooij GEPM, Boon TA, de Gier RPE: International Pros-tate Symptom Score and quality of life assessment versus uro-dynamic parameters in men with benign prostatic hyperplasiasymptoms. J Urol 1995;153:1516–1519.
7. Yalla SV, Sullivan MP, Lecamwasam HS, DuBeau CE, VickersMA, Cravalho EG: Correlation of American Urological Associa-tion symptom index with obstructive and nonobstructive pros-tatism. J Urol 1995;153:674–680.
8. Barry MJ, Cockett ATK, Holtgrewe HL, McConnell JD, SihelnikSA, Winfield HN: Relationship of symptoms of prostatism tocommonly used physiological and anatomical measures of theseverity of benign prostatic hyperplasia. J Urol 1993;150:351–358.
9. Herbison AE, Fraundorfer MR, Walton JK: Association between
symptomatology and uroflowmetry in benign prostatic hyper-trophy. Br J Urol 1988;62:427–430.
10. Simpson RJ, Fisher W, Lee AJ, Russell EBAW, Garraway WM:Benign prostatic hyperplasia in an unselected community-basedpopulation—A survey of urinary symptoms, bothersomenessand prostatic enlargement. Br J Urol 1996;77:186–191.
11. Russell EBAW, Lee AJ, Garraway WM, Prescott RJ: Use of a7-day diary for urinary symptom recording. Eur Urol 1994;26:227–232.
12. Epstein RS, Deverka PA, Chute CG, Panser LA, Oesterling JE,Lieber MM, Schwartz S, Patrick D: Validation of a new qualityof life questionnaire for benign prostatic hyperplasia. J Clin Epi-demiol 1992;45:1431–1445.
13. Cockett AT, Aso Y, Denis L, Murphy G, Khoury S, Abrams P,Barry M, Carlton GE, Fitzpatrick J, Gibbons R, Griffiths K, HaldT, Holtgrewe L, Jardin A, McConnell J, Mebut W, Roehrborn C,Smith P, Steg A, Walsh P, and Members of the Committees: TheInternational Prostate Symptom Score and quality of life assess-ment. In Cockett ATK, Khoury S, Aso Y, Chatelain C, Denis L,Griffiths K, Murphy G (eds): ‘‘The Second International Con-sultation on Benign Prostatic Hyperplasia.’’ Channel Islands:Scientific Communication International Ltd., 1993:553–555.
14. Jacobsen SJ, Guess HA, Panser L, Girman CJ, Chute CG, Oster-ling JE, Lieber MM: A population-based study of health care-seeking behavior for treatment of urinary symptoms. The Olm-stead County Study of urinary symptoms and health statusamong men. Arch Fam Med 1993;2:729–735.
15. Lepor H, Nieder A, Feser J, O’Connell C, Dixon C: Total prostateand transition zone volumes, and transition zone index arepoorly correlated with objective measures of clinical benignprostatic hyperplasia. J Urol 1997;158:85–88.
16. Girman CJ, Jacobsen SJ, Guess HA, Oesterling JE, Chute CG,Panser LA, Lieber MM: Natural history of prostatism: Relation-ship among symptoms, prostate volume and peak urinary flowrate. J Urol 1995;153:1510–1515.
17. Bosch JLHR, Hop WCJ, Kirkels WJ, Schroder FH: The Interna-tional Prostate Symptom Score in a community-based sample ofmen between 55 and 74 years of age: Prevalence and correlationof symptoms with age, prostate volume, flow rate and residualurine volume. Br J Urol 1995;75:622–630.
18. Kaplan SA, Te AE, Pressler LB, Olsson CA: Transition zoneindex as a method of assessing benign prostatic hyperplasia:Correlation with symptoms, urine flow and detrusor pressure. JUrol 1995;154:1764–1769.
19. Guess HA, Chute CG, Garraway WM, Girman CJ, Panser LA,Lee RJ, Jacobsen SJ, McKelvie GB, Oesterling JE, Lieber MM:Similar levels of urological symptoms have similar impact onScottish and American men—although Scots report less symp-toms. J Urol 1993;150:1701–1705.
20. Berry SJ, Coffey DS, Walsh PC, Ewing LL: The development ofhuman benign prostatic hyperplasia with age. J Urol 1984;132:474–479.
21. Collins GN, Lee RJ, Russell EBAW, Raab GM, Hehir M: Ultra-sonically determined patterns of enlargement in benign pros-tatic hyperplasia. Br J Urol 1993;71:451–456.
22. Barry MJ, Fowler FJ, O’Leary MP, Bruskewitz RC, HoltgreweHL, Mebust WK, Cockett ATK, and Measurement Committee ofthe American Urological Association: The American UrologicalAssociation Symptom Index for benign prostatic hyperplasia. JUrol 1992;148:1549–1557.
23. Chancellor MB, Rivas DA, Keeley FX, Lotfi MA, Gomella LG:Similarity of the American Urological Association Symptom In-dex among men with benign prostatic hyperplasia (BPH), ure-thral obstruction not due to BPH and detrusor hyperreflexiawithout outlet obstruction. Br J Urol 1994;74:200–203.
Relationship Between LUTS and Prostate 9