pathay research private market environment · 2019-03-05 · the final quarter of 2018 brought to...
TRANSCRIPT
Pathway Research
Private Market Environment
CONTENTS2018 Year in Review..............................2Global IPO and M&A Exit Markets ......4U.S. Buyout Markets .............................5European Buyout Markets ...................6Asia Private Equity ...............................7U.S. Venture Capital ............................8Private Credit .......................................9Infrastructure ...................................... 10Fundraising Market ............................ 11
4TH QUARTER 2018
2
The final quarter of 2018 brought to the surface simmering concerns and unease in the financial markets over the global mac-
roeconomic outlook, the ongoing reduction in monetary stimulus by global central banks, late-cycle valuations, and an esca-
lating trade war between the world’s two largest economies. Early in the fourth quarter, volatility spiked as investors weighed
still-strong corporate earnings and economic data, particularly in the United States, against growing unease over rising inter-
est rates and the potential knock-on effects of China’s slowing economy. Sentiment grew increasingly bearish as the quarter
progressed—further fueled by a government shutdown in the United States—which led to the worst quarterly performance for
global equities since the third quarter of 2011. The MSCI All Country World Index fell by 12.7% in the fourth quarter, which
brought the index’s annual return to –8.9%—its worst showing since 2008. It is unclear whether equity markets are foreshadow-
ing an impending global economic slowdown, but most investors are bracing for continued volatility in 2019.
Record M&A Exit Activity for PE-Backed Companies
Notwithstanding the recent volatility in financial markets, the private market industry enjoyed another productive year in 2018,
marked by record-high M&A exit market activity for PE-backed companies, attractive overall performance, and a dynamic in-
vestment environment that presented both opportunities and challenges for private market firms. In 2018, global M&A exit
activity for PE-backed companies totaled $417 billion—a 15% increase over the prior year and 8% higher than the prior annual
record set in 2014, according to Mergermarket. M&A activity was buoyed by strong demand for high-quality assets from both
strategic and financial acquirers, healthy balance sheets, and accommodative credit markets during most of the year. The robust
pace of M&A exit activity has been a key driver of private equity’s strong performance and high level of distributions over the
past several years. Notable M&A exits during the year include the sale of survey software company Qualtrics to SAP for $8.0
billion and the sale of aircraft maintenance provider StandardAero for $5.0 billion (see table 1).
Venture Capital Investment Activity Reaches 18-Year High
Venture capital experienced a standout year in 2018, driven by a rapid pace of innovation and technological advancement
across multiple disciplines and by a healthy exit environment for venture-backed companies. Capital flows during the year
were robust: both investment and fundraising activity reached their highest levels since 2000. Non-traditional investors, such
2018 Year in Review
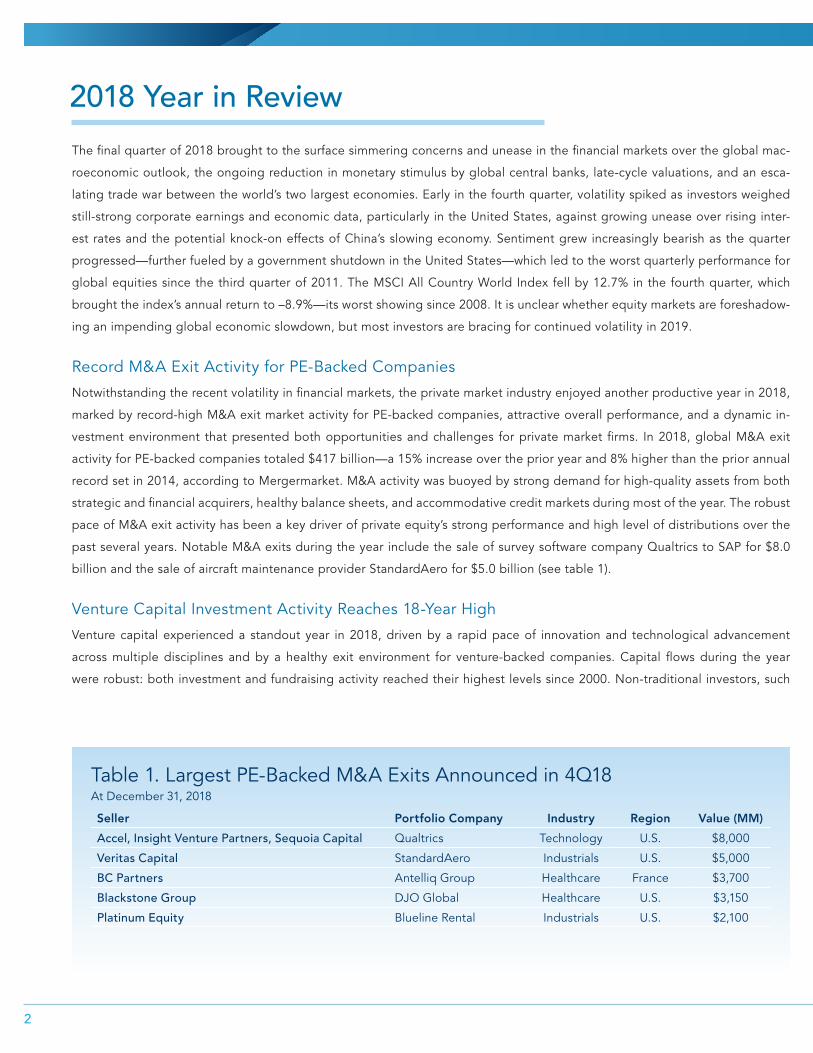
Table 1. Largest PE-Backed M&A Exits Announced in 4Q18At December 31, 2018
Seller Portfolio Company Industry Region Value (MM)
Accel, Insight Venture Partners, Sequoia Capital Qualtrics Technology U.S. $8,000
Veritas Capital StandardAero Industrials U.S. $5,000
BC Partners Antelliq Group Healthcare France $3,700
Blackstone Group DJO Global Healthcare U.S. $3,150
Platinum Equity Blueline Rental Industrials U.S. $2,100
3
PATHWAY RESEARCH
PATHWAY RESEARCH
as sovereign wealth funds and SoftBank’s Vision Fund, participated in over half of all financing rounds during the year, help-
ing to boost overall investment activity. The trend of fewer but larger financing rounds continued in 2018: there were a record
184 mega-round financings (financing rounds greater than $100 million in size) during the year, which accounted for over 40%
of invested capital. Despite a marked slowdown in new offerings in the fourth quarter, venture-backed IPO activity increased
significantly in 2018 over the prior year, which contributed to a strong increase in exit activity for the asset class. Fundraising
activity for U.S. venture capital funds in 2018 reached $42.2 billion, an increase of 30% over the prior year but still well below
the record-high of $100 billion raised by the sector in 2000.
Global Buyout Investment Activity Increased Moderately in 2018
Buyout firms maintained a healthy dose of skepticism and caution in 2018, wary of the relatively high level of valuations in the
marketplace, strong competition from both strategic and financial buyers, and uncertainty over the global macroeconomic out-
look. Global buyout investment activity increased moderately in 2018 over the prior year, and overall transaction value remains
well below the prior cycle high set in 2007. General partners deployed their capital across a multitude of sectors and transaction
structures. In particular, public-to-private buyouts and corporate carve-outs accounted for a significant proportion of buyout
activity during the year. Average purchase-price multiples were flat in 2018 from the prior year but remain at relatively high lev-
els. General partners have responded by focusing on opportunities with strong competitive positioning and valuation-creation
theses that can withstand potential multiple compression or a slowdown in economic growth. Additionally, general partners are
continuing to structure their transactions prudently overall: the average equity contribution rate and interest coverage ratio for
buyout transactions in 2018 remain well above the prior-cycle peak highs.
Looking ahead, the market environment appears likely to remain dynamic and uncertain in 2019, which should create oppor-
tunities as well as challenges for the private market industry. General partners will seek to navigate late-cycle dynamics and
an uncertain global macroeconomic outlook while continuing to drive value across their portfolios. Pathway believes that the
most-talented and most-experienced general partners will continue to perform well in the prospective market environment.
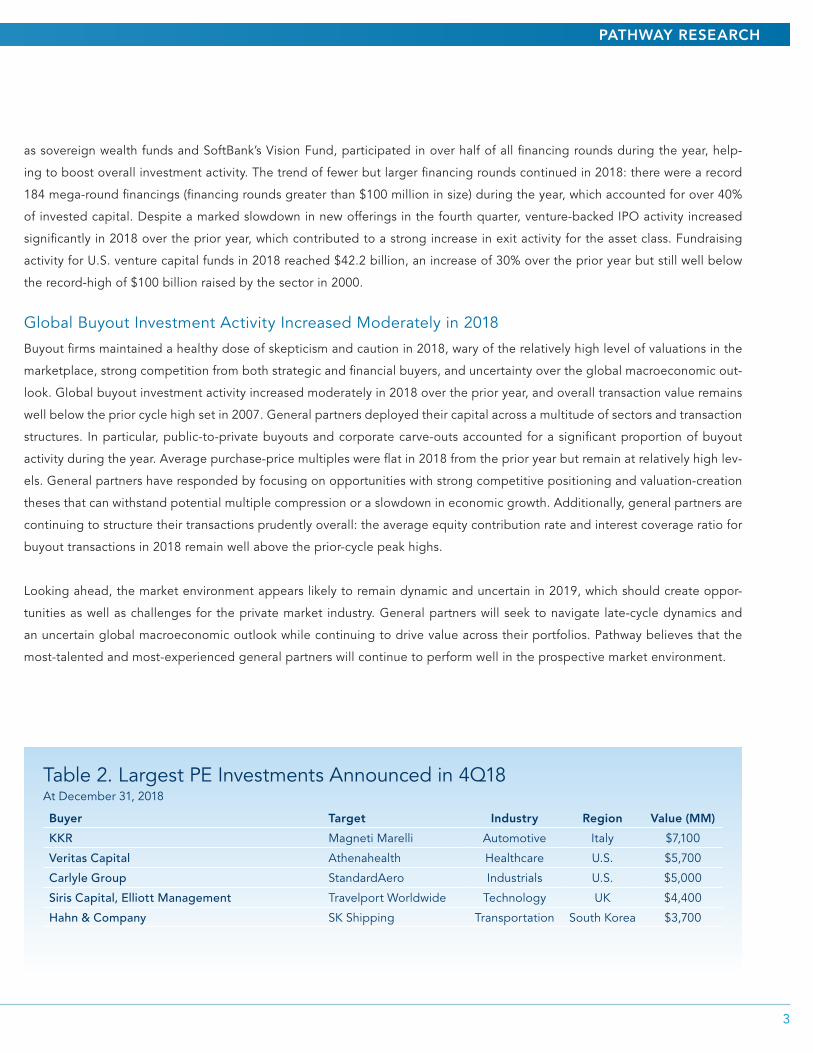
Table 2. Largest PE Investments Announced in 4Q18At December 31, 2018
Buyer Target Industry Region Value (MM)
KKR Magneti Marelli Automotive Italy $7,100
Veritas Capital Athenahealth Healthcare U.S. $5,700
Carlyle Group StandardAero Industrials U.S. $5,000
Siris Capital, Elliott Management Travelport Worldwide Technology UK $4,400
Hahn & Company SK Shipping Transportation South Korea $3,700

4
Global exit market activity remained robust during 2018, driven by continued strength in the M&A markets and an increase in overall
IPO activity, notwithstanding a slowdown in new offerings in the fourth quarter. M&A activity has been buoyed over the past several
years by strong demand for high-quality assets, healthy corporate balance sheets, and generally accommodative credit markets.
Private equity firms took advantage of these conditions, selling their portfolio companies at a brisk pace and returning capital to in-
vestors. Global M&A exit value for PE-backed companies totaled $417 billion during 2018, according to Mergermarket, an increase of
15% from the prior year and the largest annual total on record (see figure 1). The strong annual figure was led by sharp increases in ac-
tivity in Asia and in the technology sector, which both more than doubled their 2017 totals. Technology-related buyouts accounted for
30% of global PE-backed exit value, including the $8.0 billion sale of Qualtrics to SAP and the $7.5 billion sale of Github to Microsoft.
Global IPO activity increased overall in 2018, although trends among regions differed significantly and investor sentiment continued
to be impacted by volatility and uncertainty. In the United States, 2018 exhibited the strongest IPO market for both proceeds and
number of issuances since 2014, with 190 total IPOs and $43.3 billion raised during the year. Activity was underpinned by buyout-
backed and venture capital–backed IPOs, which collectively accounted for 66% of total IPOs and included several notable listings,
including Pinduoduo ($1.6 billion) and ADT ($1.2 billion). Performance among new listings remained strong for much of the year until
a global sell-off in the fourth quarter led the average IPO return to drop to –2% by year-end.
IPO activity in Europe experienced a revival in the fourth quarter after three consecutive quarters of decline, posting aggregate pro-
ceeds of €9.7 billion. The quarter brought total proceeds for the year to €35.4 billion, a decline of 22% from 2017. In Asia, however,
IPO markets remained active in 2018, raising $94.2 billion in total proceeds—an increase of 22% over the prior year. Fourth-quarter
activity included the $23.5 billion IPO in Tokyo of SoftBank Corp., the mobile business unit of SoftBank Group, which represented the
second-largest global IPO ever. The largest private equity–backed IPO during the fourth quarter was the €1.2 billion offering from
carmaker Aston Martin Lagonda. Quarterly IPO activity through December 31, 2018, is illustrated in figure 2.
Global IPO and M&A Exit Markets
Figure 2. Quarterly Global IPO ActivityAt December 31, 2018
01020304050607080
4Q183Q182Q181Q184Q173Q172Q171Q174Q163Q162Q161Q164Q153Q152Q151Q1510
20
30
40
50
60
70
80
38.6
58.2
19.8
68.0
12.6
31.035.6
47.9
28.9
49.834.8
51.439.4
39.5
53.147.451
70
54
3730
4854
45
61
4739
4732
75
49
17
Europe IPO Proceedsa Asia IPO ProceedsU.S. IPO Proceeds % PE-Backed
Proceeds($ billions)
%PE-Backed
Source: Bloomberg, Renaissance Capital, PwC, and Pathway Research.aProceeds have been converted using the quarter-end exchange rate.
Figure 1. Global PE-Backed M&A Exit Value & VolumeAt December 31, 2018
Value Number of Transactions
0
100
200
300
400
500
20182017201620152014201320122011201020092008
18592
211265 230 209
388 367 352 364417
0
500
1,000
1,500
2,000
20182017201620152014201320122011201020092008
822660
1,0151,168 1,135
1,263
1,610 1,660 1,6681,802 1,705
Number ofTransactions
Value($ billions)
Source: Mergermarket.

5
PATHWAY RESEARCH
PATHWAY RESEARCH
U.S. buyout investment activity totaled $59.4 billion during the fourth quarter, finishing 6% below the average during the first three
quarters of the year, according to data from Thomson Reuters. Following a decline in the public markets, fourth-quarter activity was
driven by a string of take-private transactions announced late in the quarter that included four of the quarter’s eight largest deals.
Among these were Thoma Bravo’s $2.1 billion acquisition of Imperva and Vista Equity’s $1.9 billion acquisitions of Apptio and
Mindbody.
The fourth quarter brought annual U.S. buyout activity for 2018 to $249 billion, an increase of 9% from the prior year (see figure 3).
Although the 2018 total represents the largest annual figure since the Global Financial Crisis (GFC), it remains meaningfully below
the $460 billion in deal value recorded in 2007 at the height of the prior market peak. The year-over-year increase in transaction value
in 2018 was driven by several large deals, most notably Blackstone’s carve-out of Thomson Reuters’ Financial & Risk division (now
Refinitiv) for $17.0 billion. The deal is the largest buyout transaction since the GFC; however, it remains below the size of the largest
pre-crisis mega-buyouts and would have ranked just seventh-largest in 2007 alone. The transaction also contributed to an active year
for technology-related buyouts, which accounted for 30% of the annual total with $73.5 billion in deal value, up 67% from the prior
year.
Despite a small decline in valuations during the fourth quarter (10.3x EBITDA), average purchase-price multiples during the year re-
mained even with the 2017 average of 10.6x EBITDA, according to S&P LCD. As a result, general partners have been forced to focus
on opportunities with strong competitive positioning and valuation-creation theses that can withstand potential multiple compression
or a slowdown in economic growth. For example, many firms have increasingly pursued a buy-and-build approach, allowing them to
buy down all-in entry multiples through add-on acquisitions of smaller companies that often come at lower prices and can provide
cost savings and synergies. According to Murray & Devine, add-on acquisitions accounted for 65% of all deals during 2018—their
highest percentage ever. General partners have additionally continued to structure transactions prudently, as seen in table 3. In 2018,
the average equity contribution rate for buyout transactions was 40.1%, while the average interest coverage ratio was 2.7x; both
figures represent meaningful improvements from the corresponding figures during 2007.
U.S. Buyout Markets
Figure 3. U.S. Buyout Investment ActivityAt December 31, 2018
0
50
100
150
200
250
2018201720162015201420132012201120102009200832
41
6469 65
7186
90
611829
51
69
50
81 104 113 125 145
57
142 1597346
112 120144 173
178196
202228 249
0
2
4
6
8
10
12
9.17.7
8.5 8.8 8.7 8.89.7
10.3 10.010.6 10.6
Purchase-PriceMultiple
Value($ billions)
Purchase-Price MultipleaEV≥$1b EV<$1b
x
Source: Thomson Reuters, S&P LCD, and Pathway Research.NoteS: Amounts may not foot due to rounding.EV=Enterprise Value.aAverage PPM (as a multiple of trailing EBITDA) of all LBOs.
Table 3. U.S. Buyout Investment StatisticsAt December 31, 2018
2007 2017 2018
Purchase Price/EBITDA 9.7x 10.6x 10.6x
Equity Contribution % 30.9% 41.3% 40.1%
Debt/EBITDA 6.0x 5.7x 5.8x
EBITDA/Cash Interest 2.1x 3.1x 2.7x
Source: S&P LCD.
6
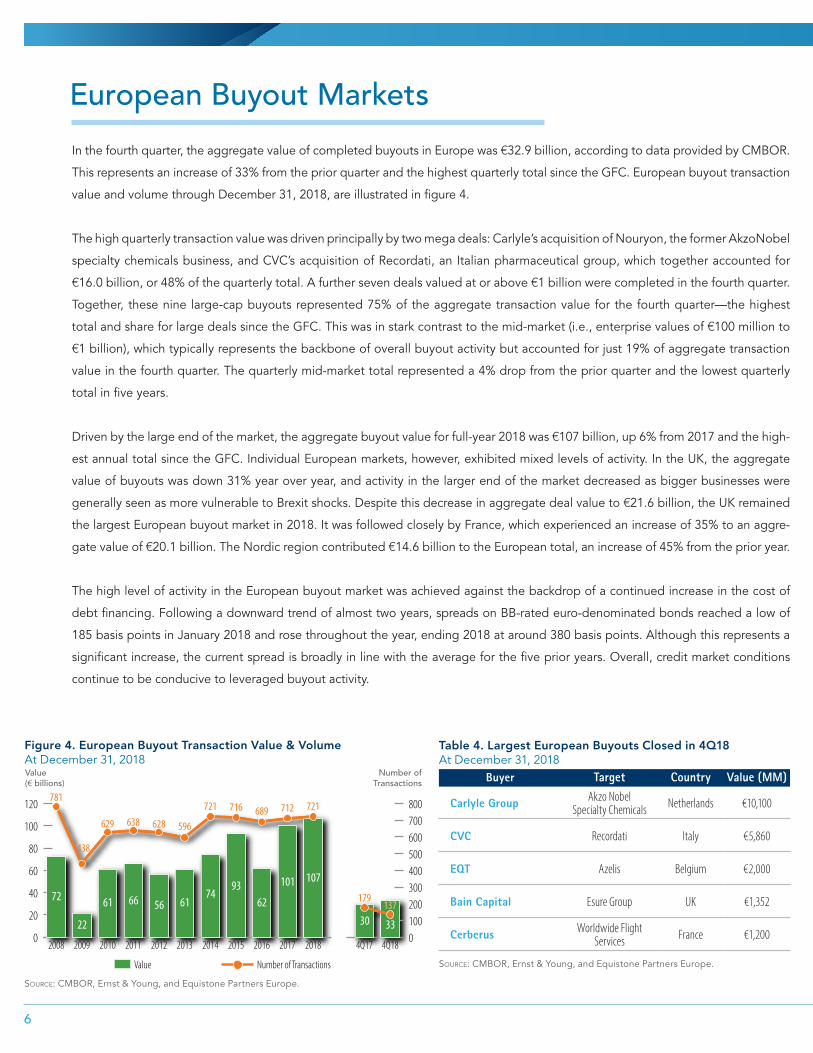
In the fourth quarter, the aggregate value of completed buyouts in Europe was €32.9 billion, according to data provided by CMBOR.
This represents an increase of 33% from the prior quarter and the highest quarterly total since the GFC. European buyout transaction
value and volume through December 31, 2018, are illustrated in figure 4.
The high quarterly transaction value was driven principally by two mega deals: Carlyle’s acquisition of Nouryon, the former AkzoNobel
specialty chemicals business, and CVC’s acquisition of Recordati, an Italian pharmaceutical group, which together accounted for
€16.0 billion, or 48% of the quarterly total. A further seven deals valued at or above €1 billion were completed in the fourth quarter.
Together, these nine large-cap buyouts represented 75% of the aggregate transaction value for the fourth quarter—the highest
total and share for large deals since the GFC. This was in stark contrast to the mid-market (i.e., enterprise values of €100 million to
€1 billion), which typically represents the backbone of overall buyout activity but accounted for just 19% of aggregate transaction
value in the fourth quarter. The quarterly mid-market total represented a 4% drop from the prior quarter and the lowest quarterly
total in five years.
Driven by the large end of the market, the aggregate buyout value for full-year 2018 was €107 billion, up 6% from 2017 and the high-
est annual total since the GFC. Individual European markets, however, exhibited mixed levels of activity. In the UK, the aggregate
value of buyouts was down 31% year over year, and activity in the larger end of the market decreased as bigger businesses were
generally seen as more vulnerable to Brexit shocks. Despite this decrease in aggregate deal value to €21.6 billion, the UK remained
the largest European buyout market in 2018. It was followed closely by France, which experienced an increase of 35% to an aggre-
gate value of €20.1 billion. The Nordic region contributed €14.6 billion to the European total, an increase of 45% from the prior year.
The high level of activity in the European buyout market was achieved against the backdrop of a continued increase in the cost of
debt financing. Following a downward trend of almost two years, spreads on BB-rated euro-denominated bonds reached a low of
185 basis points in January 2018 and rose throughout the year, ending 2018 at around 380 basis points. Although this represents a
significant increase, the current spread is broadly in line with the average for the five prior years. Overall, credit market conditions
continue to be conducive to leveraged buyout activity.
European Buyout Markets
Figure 4. European Buyout Transaction Value & VolumeAt December 31, 2018
0
20
40
60
80
100
120
4Q184Q1720182017201620152014201320122011201020092008
72
22
61 66 56 6174
9362
101 107
30 330100200300400500600700800781
438
629 638 628 596
721 716 689 712 721
179137
Number ofTransactions
Value(€ billions)
Number of TransactionsValue
Source: CMBOR, Ernst & Young, and Equistone Partners Europe.
Table 4. Largest European Buyouts Closed in 4Q18At December 31, 2018
Buyer Target Country Value (MM)
Carlyle Group Akzo Nobel Specialty Chemicals Netherlands €10,100
CVC Recordati Italy €5,860
EQT Azelis Belgium €2,000
Bain Capital Esure Group UK €1,352
Cerberus Worldwide Flight Services France €1,200
Source: CMBOR, Ernst & Young, and Equistone Partners Europe.
7
PATHWAY RESEARCH
PATHWAY RESEARCH
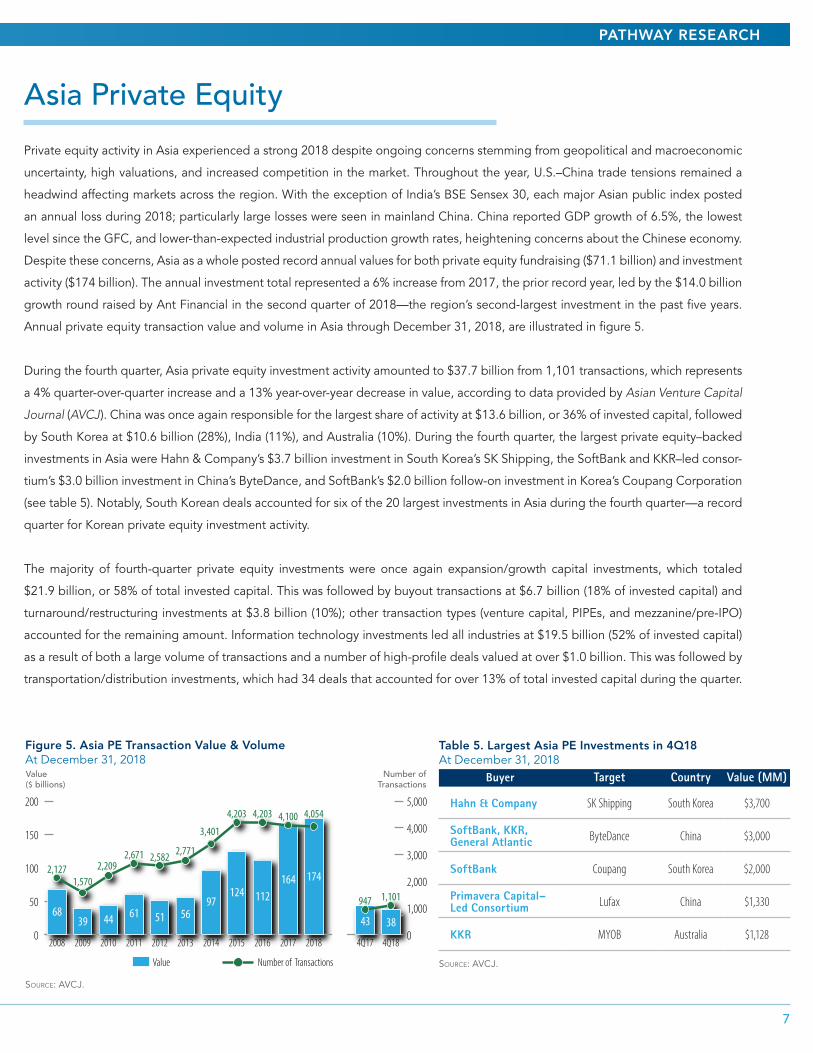
Private equity activity in Asia experienced a strong 2018 despite ongoing concerns stemming from geopolitical and macroeconomic
uncertainty, high valuations, and increased competition in the market. Throughout the year, U.S.–China trade tensions remained a
headwind affecting markets across the region. With the exception of India’s BSE Sensex 30, each major Asian public index posted
an annual loss during 2018; particularly large losses were seen in mainland China. China reported GDP growth of 6.5%, the lowest
level since the GFC, and lower-than-expected industrial production growth rates, heightening concerns about the Chinese economy.
Despite these concerns, Asia as a whole posted record annual values for both private equity fundraising ($71.1 billion) and investment
activity ($174 billion). The annual investment total represented a 6% increase from 2017, the prior record year, led by the $14.0 billion
growth round raised by Ant Financial in the second quarter of 2018—the region’s second-largest investment in the past five years.
Annual private equity transaction value and volume in Asia through December 31, 2018, are illustrated in figure 5.
During the fourth quarter, Asia private equity investment activity amounted to $37.7 billion from 1,101 transactions, which represents
a 4% quarter-over-quarter increase and a 13% year-over-year decrease in value, according to data provided by Asian Venture Capital
Journal (AVCJ ). China was once again responsible for the largest share of activity at $13.6 billion, or 36% of invested capital, followed
by South Korea at $10.6 billion (28%), India (11%), and Australia (10%). During the fourth quarter, the largest private equity–backed
investments in Asia were Hahn & Company’s $3.7 billion investment in South Korea’s SK Shipping, the SoftBank and KKR–led consor-
tium’s $3.0 billion investment in China’s ByteDance, and SoftBank’s $2.0 billion follow-on investment in Korea’s Coupang Corporation
(see table 5). Notably, South Korean deals accounted for six of the 20 largest investments in Asia during the fourth quarter—a record
quarter for Korean private equity investment activity.
The majority of fourth-quarter private equity investments were once again expansion/growth capital investments, which totaled
$21.9 billion, or 58% of total invested capital. This was followed by buyout transactions at $6.7 billion (18% of invested capital) and
turnaround/restructuring investments at $3.8 billion (10%); other transaction types (venture capital, PIPEs, and mezzanine/pre-IPO)
accounted for the remaining amount. Information technology investments led all industries at $19.5 billion (52% of invested capital)
as a result of both a large volume of transactions and a number of high-profile deals valued at over $1.0 billion. This was followed by
transportation/distribution investments, which had 34 deals that accounted for over 13% of total invested capital during the quarter.
Asia Private Equity
Table 5. Largest Asia PE Investments in 4Q18At December 31, 2018
Buyer Target Country Value (MM)
Hahn & Company SK Shipping South Korea $3,700
SoftBank, KKR, General Atlantic ByteDance China $3,000
SoftBank Coupang South Korea $2,000
Primavera Capital–Led Consortium Lufax China $1,330
KKR MYOB Australia $1,128
Source: AVCJ.
Figure 5. Asia PE Transaction Value & VolumeAt December 31, 2018
Value Number of Transactions
0
50
100
150
200
4Q184Q1720182017201620152014201320122011201020092008
6839 44 61 51 56
97124 112
164 174
43 380
1,000
2,000
3,000
4,000
5,000
2,1271,570
2,2092,671 2,582 2,771
3,401
4,203 4,203 4,100 4,054
947 1,101
Number ofTransactions
Value($ billions)
Source: AVCJ.

8
The U.S. venture capital industry experienced a strong and active year during 2018,
driven by rising valuations for late- and growth-stage companies and increased invest-
ment interest from both traditional- and non-traditional venture capital investors. During
the year, venture capital investment activity totaled $99.5 billion, according to the PwC/
CB Insights MoneyTreeTM Report, an increase of 30% over the prior year and the largest
annual figure since the dot-com boom peak of $120 billion in 2000. The fourth quar-
ter represented the sixth-consecutive quarter that venture capital investment exceeded
$20.0 billion, despite a continued decline in the number of deals completed. The 5,536
transactions during 2018 represented the lowest total in five years and finished 33%
below the corresponding figure during 2000. U.S. venture capital transaction value and
volume through December 31, 2018, are illustrated in figure 6.
The strong annual investment total during 2018 was driven largely by the high number of mega-rounds (i.e., financing rounds of
greater than $100 million), which reached 184 and accounted for 42% of invested capital. The 184 mega-rounds represented the
second-consecutive record-setting year for the industry and an increase of 53% from the 120 raised in 2017. The fourth quarter alone
saw 49 such rounds, led by the $1.25 billion financing of Epic Games by a consortium of venture capital firms and the $1.1 billion fi-
nancing of View by SoftBank’s Vision Fund (see table 6). The quarter also saw 21 new companies achieve unicorn status (privately held
venture-backed companies valued at greater than $1.0 billion), which brought the full-year total to 53 new unicorns and the aggregate
valuation of all U.S.-based unicorns to a record-setting $526 billion.
The venture capital industry also benefited from strong exit market activity during 2018. According to Pitchbook, venture-backed exit
value totaled $122 billion in 2018, up 33% from 2017. Notable exits during the year included the $8.0 billion sale of Accel– and Insight
Venture Partners–backed Qualtrics to SAP, the $7.5 billion sale of Andreessen Horowitz– and Sequoia Capital–backed Github to Microsoft,
and the $756 million IPO of Dropbox, which valued the company at just over $9.0 billion. Despite a sell-off late in the year that hurt annual
performance and fourth-quarter IPO activity, the U.S. IPO market was receptive overall to venture-backed IPOs during the year. Venture-
backed companies accounted for 87 listings in 2018 (46% of total IPOs) and raised $14.6 billion, an increase of 26% relative to 2017.
U.S. Venture Capital
Figure 6. U.S. Venture Capital Transaction Value & VolumeAt December 31, 2018
0
20
40
60
80
100
4Q184Q1720182017201620152014201320122011201020092008
29 22 2636 33 36
6078
64 7699
20 250
1,000
2,000
3,000
4,000
5,000
6,000
7,000
2,873 2,7363,417
4,2344,680
5,1765,998 6,098
5,679 5,824 5,536
1,379 1,211
Number ofTransactions
Value($ billions)
Number of TransactionsValue
Source: PwC & CB Insights MoneyTree™ Report.
Table 6. Largest U.S. Venture Capital Deals in 4Q18At December 31, 2018
Company Select Investors Value (MM)
Epic Games ICONIQ Capital, KPCB, KKR, Lightspeed Venture Partners $1,250
View SoftBank Group $1,100
Instacart D1 Capital Partners $600
Snowflake Computing Altimeter Capital, Madrona Venture Group, Meritech Capital $450
Zymergen SoftBank Group, True Ventures $400
Source: PwC & CB Insights MoneyTree™ Report.
$99.5 billion Invested in Venture-Backed Companies
$41.8 billion Invested in Mega-Rounds
87 Venture Backed IPOs on U.S. Exchanges
30%YOY
42% of total
24%YOY
9
PATHWAY RESEARCH
PATHWAY RESEARCH
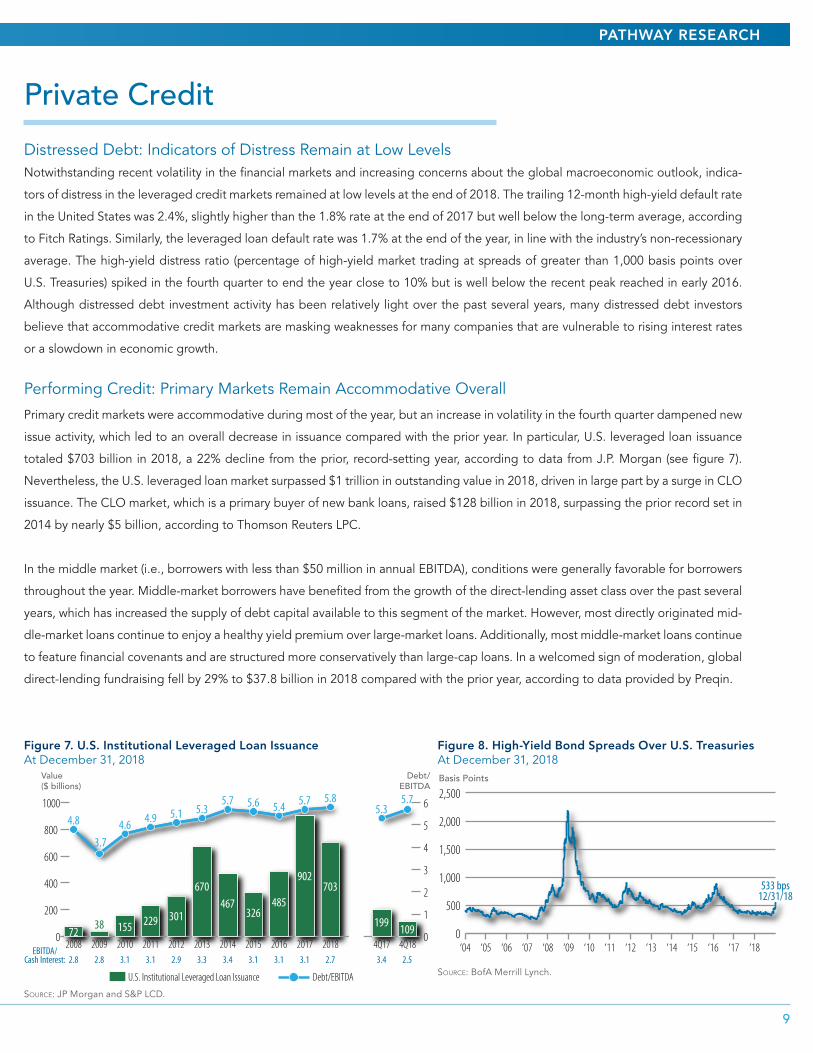
Distressed Debt: Indicators of Distress Remain at Low LevelsNotwithstanding recent volatility in the financial markets and increasing concerns about the global macroeconomic outlook, indica-
tors of distress in the leveraged credit markets remained at low levels at the end of 2018. The trailing 12-month high-yield default rate
in the United States was 2.4%, slightly higher than the 1.8% rate at the end of 2017 but well below the long-term average, according
to Fitch Ratings. Similarly, the leveraged loan default rate was 1.7% at the end of the year, in line with the industry’s non-recessionary
average. The high-yield distress ratio (percentage of high-yield market trading at spreads of greater than 1,000 basis points over
U.S. Treasuries) spiked in the fourth quarter to end the year close to 10% but is well below the recent peak reached in early 2016.
Although distressed debt investment activity has been relatively light over the past several years, many distressed debt investors
believe that accommodative credit markets are masking weaknesses for many companies that are vulnerable to rising interest rates
or a slowdown in economic growth.
Performing Credit: Primary Markets Remain Accommodative Overall
Primary credit markets were accommodative during most of the year, but an increase in volatility in the fourth quarter dampened new
issue activity, which led to an overall decrease in issuance compared with the prior year. In particular, U.S. leveraged loan issuance
totaled $703 billion in 2018, a 22% decline from the prior, record-setting year, according to data from J.P. Morgan (see figure 7).
Nevertheless, the U.S. leveraged loan market surpassed $1 trillion in outstanding value in 2018, driven in large part by a surge in CLO
issuance. The CLO market, which is a primary buyer of new bank loans, raised $128 billion in 2018, surpassing the prior record set in
2014 by nearly $5 billion, according to Thomson Reuters LPC.
In the middle market (i.e., borrowers with less than $50 million in annual EBITDA), conditions were generally favorable for borrowers
throughout the year. Middle-market borrowers have benefited from the growth of the direct-lending asset class over the past several
years, which has increased the supply of debt capital available to this segment of the market. However, most directly originated mid-
dle-market loans continue to enjoy a healthy yield premium over large-market loans. Additionally, most middle-market loans continue
to feature financial covenants and are structured more conservatively than large-cap loans. In a welcomed sign of moderation, global
direct-lending fundraising fell by 29% to $37.8 billion in 2018 compared with the prior year, according to data provided by Preqin.
Private Credit
Figure 7. U.S. Institutional Leveraged Loan IssuanceAt December 31, 2018
0
200
400
600
800
1000
4Q184Q1720182017201620152014201320122011201020092008
1553872
229 301
670467
326485
902703
199 1090
1
2
3
4
5
64.8
3.74.6 4.9 5.1 5.3
5.7 5.6 5.4 5.7 5.85.3
5.7
Value($ billions)
Debt/EBITDA
U.S. Institutional Leveraged Loan Issuance Debt/EBITDA
2.53.42.73.13.13.13.43.32.93.13.12.82.8EBITDA/
Cash Interest:
Source: JP Morgan and S&P LCD.
Figure 8. High-Yield Bond Spreads Over U.S. TreasuriesAt December 31, 2018
0
500
1,000
1,500
2,000
2,500Basis Points
533 bps12/31/18
‘04 ‘05 ‘06 ‘07 ‘08 ‘09 ‘10 ‘11 ‘12 ‘13 ‘14 ‘15 ‘16 ‘17 ‘18
Source: BofA Merrill Lynch.

10
The infrastructure asset class continues to grow at a healthy pace, driven by a combination of factors, including an expanding universe
of investment opportunities and strong demand from institutions seeking to diversify their portfolios. During the fourth quarter, 13
infrastructure-focused funds closed on $22.6 billion of aggregate capital commitments according to data from Preqin and Pathway
Research; this raised total 2018 fundraising to $77.0 billion, a 36% increase over the total capital raised in 2017. The average unlisted
fund size raised during 2018 was $2.0 billion, which exceeded the average fund size raised in 2017 by 83% and represented an all-
time high for the asset class. This trend is expected to continue because of the number of large infrastructure funds currently in the
market that are expected to close early in 2019. Over the year, Europe-focused infrastructure funds received $32.3 billion across 25
funds; North America–focused funds raised $23.0 billion across 15 funds.
Global infrastructure deal flow moderated during the fourth quarter: the aggregate value of infrastructure deals amounted to $47.5
billion, a decline of 43% when compared with the $82.9 billion recorded during the prior quarter. The full-year 2018 aggregate
infrastructure deal value amounted to $322 billion, which represents a decline of 17% from the $387 billion aggregate deal value
reported for 2017. The total number of infrastructure deals completed during 2018 amounted to 2,454, compared with 3,165 in 2017,
predominantly as a result of a decline in the volume of natural resource and pipeline-related deals. Annual infrastructure transaction
value and volume through December 31, 2018, are illustrated in figure 9.
The year saw continued strong interest in renewable energy, which represented 57% of total infrastructure deal activity in 2018—an
increase from 50% in 2017 and from 45% in 2016. Renewable energy platforms have become increasingly cost competitive with tra-
ditional gas- and coal-fired power generation, even when excluding the benefit of government subsidies. This trend, combined with
increased pressure from regulators to have a greater percentage of power-generation capacity produced by clean energy produc-
tion, has led to a strong interest in the industry by private investors. Notably, the two largest infrastructure investments announced
in 2018, Innogy (€20.4 billion) and Direct Energie (€14.0 billion), were renewable energy platforms in France and Germany. Overall,
the largest deals during the year were completed in a wide variety of strategies, regions, and industries. Notable infrastructure deals
during the year are shown in table 7.
Infrastructure
Table 7. Notable Infrastructure Deals in 2018At December 31, 2018
Asset/Company Acquirer IndustryDeal Size
(MM)
WestConnex Motorway Abu Dhabi Inv. Authority Toll Roads A$9,260
Hornsea Project One GIP Wind Power £4,500
Techem Partners Group, CDPQ Power Distribution €4,600
SFR TowerCo KKR Telecommunications €1,800
Brazos Midstream North Haven Midstream Energy $1,750
Source: Preqin and Pathway Research.
Figure 9. Global Infrastructure Transaction Value & VolumeAt December 31, 2018
0
100
200
300
400
500
2018201720162015201420132012201120102009
190 202280 271 270
346430
495387
322
0
500
1,000
1,500
2,000
2,500
3,000
3,500
1,2991,627
1,980 2,0192,279
2,641
3,0962,714
3,165
2,454
Value($ billions)
Numberof Transactions
Value Number of Transactions
Source: Preqin.

11
PATHWAY RESEARCH
PATHWAY RESEARCH
Worldwide fundraising activity continued along its brisk pace during the fourth quarter,
totaling $138 billion in commitments, according to data from Thomson Reuters and
Pathway Research. The quarterly figure drove the annual fundraising total for 2018 to
$542 billion, an increase of 20% from the prior year and the largest annual total on re-
cord (see figure 10). Despite the top-line growth in fundraising, most core fundraising
strategies have seen more-moderate growth in the current market cycle than in prior
peaks; the increase in capital raised overall has instead stemmed from the continued
expansion of the asset class, both in terms of strategy and geographic focus. One pri-
mary example of this has been the continued emergence of the direct-lending and pri-
vate infrastructure asset classes as major components of the private market investment
landscape. These two categories accounted for $115 billion in capital raised during
2018 (21% of the total), which represents an increase of nearly 250% from the amount
raised in 2007. In comparison, buyout funds, which have traditionally accounted for the
majority of private equity capital raised, accounted for just 47% of the fundraising total
during 2018, down from a 61% share in 2007 (see figure 11).
In line with the global total, fundraising value in each major global region grew by at least 15% during 2018. In the United States, the
$346 billion raised during the year represented the largest annual total on record. The total was driven by year-over-year increases of
30% for venture capital and 111% for other private strategies (e.g., infrastructure, generalist, and special situations). Fundraising in
the Asia-Pacific region saw the largest annual increase in activity, rising 66% to a record $71.1 billion during 2018. This total includes
the $10.6 billion raised by Hillhouse Capital Fund IV in the third quarter, the largest Asia-focused fund on record. Similarly, in Europe,
fundraising activity increased to $110 billion during 2018, which falls just short of the record $113 billion raised in the region in 2008.
The growth in European fundraising was largely concentrated in the buyouts category, which accounted for 55% of capital raised
during the year and was driven by several mega-buyout fundraisings, including EQT VIII (€10.8 billion) and BC Capital X (€7.0 billion).
Fundraising Market
Figure 10. Global Fundraising by RegionAt December 31, 2018
0
100
200
300
400
500
600
20182017201620152014201320122011201020092008
14
13
113
61
7982 88 101
95110
2489224205
253215
496016
413421 26
21 4114
2914 35
29 437114
92 124 159 207 243 236 260 300 346
Amount Raised($ billions)
U.S. Europe Asia-Paci�c OtherSource: Thomson Reuters, Preqin, and Pathway Research.NoteS: Fundraising amounts are based on net amounts raised, which are adjusted for fund-size reductions. • Comprises buyout, venture capital, private credit, energy, infrastructure, and other fund strategies. • Data is continuously updated and is therefore subject to change. • Amounts may not foot due to rounding.
Table 8. Notable Funds Raised in 4Q18At December 31, 2018
Fund Strategy Region Amount (MM)
Brookfield Capital Partners V Special Situations
North America $6,500
PAG Asia III Buyout Asia $6,000
Bain Asia IV Buyout Asia $4,650
ICG Europe VII Mezzanine Europe €4,000
Tiger Global XI Venture Global $3,750
Figure 11. 2018 Fundraising By StrategyAs a % of Amount Raised
Buyouts47%
Venture Capital14%
Private Credita
15%
Energy4%
Otherb
20%
Source: Thomson Reuters, Preqin, and Pathway Research.NoteS: Percentages are based on net amounts raised, which are adjusted for fund-size reductions. • Data is continuously updated and is therefore subject to change. • aComprises distressed debt, subordinated debt, and senior direct lending strategies. • bComprises infrastructure, special situations, and other fund strategies not classified as buyout-, venture capital–, credit-, or energy-focused.

www.pathwaycapital.com
HONG KONGPathway Capital Management (HK) LimitedChampion Tower, Level 443 Garden Road, Central, Hong KongTel: +852-3798-2580
RHODE ISLANDPathway Capital Management, LP500 Exchange St.Suite 1100, 11th FloorProvidence, RI 02903Tel: 401-589-3400
CALIFORNIAPathway Capital Management, LP18575 Jamboree Road, 7th FloorIrvine, CA 92612Tel: 949-622-1000
LONDONPathway Capital Management (UK) Limited15 Bedford StreetLondon WC2E 9HETel: +44 (0) 20 7438 9700
©2019 Pathway Capital Management, LPAll rights reserved. Reproduction and/or distribution of these materials, in whole or in part, without the prior written permis-sion of Pathway Capital Management, LP, is prohibited. Pathway is an SEC-registered investment adviser, is regulated in the UK by the FCA, and is regulated in Hong Kong by the SFC.
Note: Information contained herein has been obtained from sources believed to be reliable, but Pathway accepts no responsibility or liability (including for indi-rect, consequential, or incidental damages) for any error, omission, or inaccuracy of such information. The projections shown are provided for informational pur-poses only and should not be construed as investment advice or as providing any assurance or guarantee of returns that may be realized in the future from your private equity commitments. Projections and expected returns are subject to high levels of uncertainty regarding future economic and market factors that may affect future performance. Accordingly, such projections/expectations should be viewed as only one possible outcome of a broad range of possible outcomes.
The information provided herein should not form a primary basis for any investment decision made by you or on your behalf, and neither Pathway nor any of its affiliates shall act as a fiduciary or adviser with respect to this matter.
About Pathway Capital Management, LP
Founded in 1991, Pathway provides private market fund solutions for institutional
investors worldwide. Pathway manages capital on behalf of some of the largest
corporate and public pension plans, government entities, and financial institu-
tions around the globe. Since its formation, the firm has committed more than
$80 billion to more than 650 private market investments.
Pathway is registered as an investment adviser with the SEC in the United States
and as a portfolio manager and exempt market dealer in Ontario, Quebec, and
Saskatchewan, Canada. Pathway’s wholly owned UK subsidiary is regulated in
the UK by the Financial Conduct Authority. Pathway’s wholly owned Hong Kong
subsidiary is regulated in Hong Kong by the Securities and Futures Commission.