patenting behaviour and the survival of newly-listed ... · patenting behaviour and the survival of...
TRANSCRIPT
Paper to be presented at the
35th DRUID Celebration Conference 2013, Barcelona, Spain, June 17-19
Patenting behaviour and the survival of newly-listed European software
firmsDiego Useche
University of BordeauxEconomics and [email protected]
AbstractThe aim of this empirical study is to test whether patenting impacts on the likelihood of software companies (USSIC 737)surviving after an IPO in 6 European markets. We examine the characteristics of software firms undertaking IPOs, usingfirm-level data from Bureau van Dijk's Zephyr database, the Questel-Orbit QPAT patent database, financial documentsavailable on the company?s websites and specialized websites. This study brings together all software-company-relatedIPO deals from the United Kingdom, Germany, France, Sweden, Italy and Spain from 1st January 1997 to 31stDecember 2005 in Bureau van Dijk's Zephyr database. To estimate the probability of survival, this study uses asemi-parametric approach, based on the stratified Cox competing risk model, controlling for other determinants ofsurvival. Results suggest that, taking into account other characteristics (experience, sales, profitability and solvencyratios, but also market conditions), patenting prior to an IPO is related to different modes of exit aftermarket. Researchfindings reflect the fact that additional patent applications before an IPO reduce the risk of exiting either by acquisition orby failure. In contrast, the quality of the patent portfolio increases the attractiveness of a European software company asan acquisition target while reducing the hazard rate of exit through business failure
Jelcodes:L21,L63
1
Patenting behaviour and the survival of newly-listed European software firms1
Diego USECHE2
GREThA UMR CNRS 5113, University of Montesquieu Bordeaux IV, Pessac, France
The 35th DRUID Celebration Conference 2013 Barcelona (Spain) June 17 – 19
Abstract
The aim of this empirical study is to test whether patenting impacts on the likelihood of software companies (USSIC 737) surviving after an IPO in 6 European markets. We examine the characteristics of software firms undertaking IPOs, using firm-level data from Bureau van Dijk's Zephyr database, the Questel-Orbit QPAT patent database, financial documents available on the company’s websites and specialized websites. This study brings together all software-company-related IPO deals from the United Kingdom, Germany, France, Sweden, Italy and Spain from 1st January 1997 to 31st December 2005 in Bureau van Dijk's Zephyr database. To estimate the probability of survival, this study uses a semi-parametric approach, based on the stratified Cox competing risk model, controlling for other determinants of survival. Results suggest that, taking into account other characteristics (experience, sales, profitability and solvency ratios, but also market conditions), patenting prior to an IPO is related to different modes of exit aftermarket. Research findings reflect the fact that additional patent applications before an IPO reduce the risk of exiting either by acquisition or by failure. In contrast, the quality of the patent portfolio increases the attractiveness of a European software company as an acquisition target while reducing the hazard rate of exit through business failure.
Keywords: European Software Firms, Patent Metrics, Initial Public Offering (IPO), Survival, Start-ups. 1. Introduction
Over the past few years, scholars, industrialists and policy makers have sought to improve the framework conditions that support the growth of European SMEs and European innovators. In this context, it is usually claimed that in the European software industry there are few success stories (NESSI, 2008; Syntec informatique, 2008). In fact, software companies founded in Europe have rarely become large global leaders. What is more, European SMEs generally have serious problems of growth and there are few medium-sized firms or large, young, leading innovators compared with the US (Veugelers and Cincera, 2010). For this reason, factors tending to improve the survival of software IPOs could be important in order to improve European software firms’ performance, growth and success.
This paper seeks to provide new evidence concerning the “value” of patents in the survival of newly-listed software firms in Europe while considering that firms face both a risk of acquisition and a risk of failure. The number of patent studies dealing with software companies is quite limited and particularly underdeveloped, primarily due to the paucity of data and because, historically, the software industry has had weak patent protection (Mann and Sager, 2007; Bessen,
1 Previous drafts of this paper has benefited from helpful discussion and comments of colleagues at MINES PARISTECH and University of Bordeaux. I would like to thank Valerio Sterzi for his econometric support and for his valuable comments. Special thanks also go to Laurent Berger, Philippe Gorry and Sébastien Rouillon for their helpful comments and suggestions to improve previous drafts of this paper. Financial support from GREThA-CNRS Bordeaux is gratefully acknowledged. All errors are mine. 2 Tel.: +33(0)6 42 97 43 46.
E-mail adresse : [email protected]

2
2003; Bessen and Hunt, 2007). This is particularly true for the European software industry because computer programs “as such” are excluded from patentability under Article 52(3) of the EPC. However a growing number of software companies in Europe are filing patents that include a large number of inventions in this field (Rentocchini, 2011).
In this study, we match software firms’ IPO information (USSIC737) from Bureau van Dijk's Zephyr database with patent information from the Questel-Orbit QPAT database. Then, we assess the fundamentals of software companies that went public in 6 European countries (United Kingdom, Germany, France, Sweden, Italy and Spain) from 1997 to 2005. During those years, new, highly risky firms with poor business plans had access to liquidities to support their business development through going public in Europe. European software companies going public were particularly risky, displaying signals of financial weakness and inexperience with IPOs. Thus, two thirds of the software companies going public were young (less than 10 years’ experience of IPOs) and half were small companies (with a turnover of less than 10 million euros). The large number of unprofitable software companies going public in European markets is also remarkable. 47% of the software companies undertaking IPOs declared losses in the year preceding an IPO. It would seem that this fragility exposed by European software companies at IPO is related to their aftermarket survival. Moreover, the influence of firms’ pre-IPO characteristics on their survival differs according to the type of exit. Software companies which are successful in terms of financial ratios also have lower failure rates in the short term. Similarly, patenting prior to IPO improves the likelihood of survival but a high-quality patent portfolio increases the risk of acquisition while reducing the risk of failure.
The paper is organised as follows: Section 2 reviews the theoretical and empirical studies on the factors that influence firms’ exit aftermarket through failure or further M&A activity. Section 3 briefly summarizes previous findings on patenting in the software industry, focusing on Europe. Section 4 describes the data used to construct our dataset. Section 5 presents the methodology applied to the estimation of survival probability; we present the empirical results in section 6. Finally, section 7 concludes and discusses some implications of our findings.
2. Firms’ characteristics, innovation and survival after IPO
Innovation and firm life-cycle literature have broadly contributed to the analysis of different processes influencing the growth and the failure of firms. Empirical evidence has shown that firms’ characteristics are related to market entry and exit rates. It is commonly argued that exit rates decline with firms’ age and size (Evans 1987; Dunne et. al., 1989; Audretsch, 1991; 1995) and increase with their financial fragility (Klepper, 1996; Cooley and Quadrini, 2001). Survival rates of new firms also vary systematically across industries and regions (Dunne et. al., 1989; Audretsch, 1995) and they are related to the firms’ ability to learn about their market environment (Gerosky, 1995).
The roles of different selection mechanisms of heterogeneous firms and learning processes have been also wildly analysed. Nelson and Winter (1982) postulate that through innovative and imitative investments, firms attempt to boost their relative position in the distribution of productivity levels and their chances of success in the competition process. Hall (1997) observes that the intensity of R&D expenditure increases firms’ survival. Similarly, Pakes and Ericson (1998) suggest that firms which actively invest in research improve their efficiency, profitability and their chances of survival. Christensen et al. (1998) show that, for the hard disk industry, architectural innovation reduces a firm’s likelihood of exit. Perez et al. (2004) suggest that carrying out R&D improves the competitive position and survival of Spanish manufacturing firms. Cefis and Marsili (2006) found that innovation has a positive and significant effect on the probability of survival for manufacturing firms in the Netherlands. They found that innovation is particularly important for the survival of younger and smaller firms. As far as patenting behaviour
3
is concerned, Audretsch and Lehmann (2004) found that the number of patents, the firm’s human capital (board of directors), and firm size improve the likelihood of survival of firms from various industries listed on the German Neuer Markt. Wagner and Cockburn (2010) have shown that patenting was positively associated with survival for US Internet-related IPOs at the height of the stock market bubble of the late 1990s. They argue that patents conferred competitive advantages that increased the probability of survival.
Financial and Managerial literature has also extensively contributed to the analysis of firm survival. The literature has shown important differences between M&A and other exit mechanisms. Thus, bankruptcy and voluntary liquidation are usually considered as forms of firm failure while the circumstances or characteristics that promote the acquisition of a company are different (Peel and Wilson, 1989; Schary, 1991). Through the analysis of different exit mechanisms, the literature has highlighted the fact that the relationship between innovation and survival is more complex than a simple positive effect. Thus, some recent empirical studies have shown that, through innovation, firms increase their stock of knowledge and capabilities and as a consequence their attractiveness as acquisition targets (Cefis and Marsili, 2007; Wagner and Cockburn, 2010). Indeed, firms’ knowledge and capabilities can be regarded as strategic assets which improve their performance (Nelson & Winter, 1982; Winter, 1987), reducing the risk of failure and increasing the risk of acquisition. This finding may be particularly important in a context in which large firms (but not only large ones) expand their own portfolios of patents in response to potential hold-up problems in markets for technology (Ziedonis, 2004). Thus, it can be expected that in the presence of markets for technology with highly fragmented ownerships, as in the software industry, the quality of the patent portfolio increases the attractiveness of a company as an acquisition target. A company with high-quality patents may be an attractive acquisition target for many companies who may be interested for several reasons related to those patents, for example the exploitation of cross-licensing agreements, reducing hold-up problems and improving their bargaining power.
Thus, there is little evidence concerning the mechanisms related to the survival of European software companies after the Dot.com Boom and the financial instability which characterised the last decade. Similarly, little is known about the relationship between patents and survival of software companies, especially in Europe. The value of patents in the software industry has been widely documented but there is little evidence related to firms’ survival. Indeed, software is a complex and cumulative technology characterised by very fast technical change and a short effective lifespan for innovations. In this context, patents may be characterized by lower effectiveness at preventing imitation but may have different potential effects on firms’ performance. The next section summarizes the controversies related to patenting in the software industry.
3. Patenting in the software industry
The software industry is a relatively young, highly innovative industry which has driven much of the innovation in other industries in recent decades. However, the role of patents in the software industry has been, historically, a highly controversial issue for academics, industrialists and policy makers.
At its origins in the mid-1960s (Campbell-Kelly, 2003), the software industry operated without patents, under a “weak Intellectual Property (IP) regime”3 (Dosi et al. 2006). At that time, the few companies producing software protected their IP mostly through copyrights, and US courts
3 This point is also controversial, Mann (2005) and Merges (1996) consider that “the United States has traditionally embraced strong protection for computer software” because copyright provided relatively strong protection for software until the late 1980s.

4
considered software as a “concatenation of unpatentable algorithms” (Cohen and Lemley, 2001). However, under pressure from some segments of the industry, a number of judicial and administrative decisions established a more “expansive approach to the breadth and strength of software patents” (Mann and Sager 2007). In particular, conditions for obtaining software patents were relaxed after the 1981 Supreme Court’s decision in “Diamond vs. Diehr” which considered patentable inventions with new and non-obvious aspects that did not entirely consist of software. Additionally, real differences in patentability of software and other inventions were eliminated after the appeals court decision “In re Alapat” in 1994 (Bessen and Hunt, 2004). Thereafter, companies interested in software patents needed only to define their claims in terms of computer programs implemented in a machine (Cohen and Lemley, 2001). After this decision, the number of software patents increased spectacularly. However, the vast majority of software patents do not come from the software industry but from the manufacturing sector (Bessen and Hunt, 2004).
The literature has shown that the effectiveness of patents, which varies across firms and industries, is related to the specificities of the technology and the R&D process, as well as to the nature of the market and to the patterns of competition (for a good description see: Orsenigo and Sterzi, 2010). Indeed, software is a complex and cumulative technology in which new products and processes are composed of several innovations from different firms. Complex technologies are naturally more difficult to replicate and consequently the value of a patent to prevent imitation is lower (Roycroft and Kash 1999; Kingston 2001). The software industry is also characterised by very fast technical change and a short effective lifespan for innovations. As a consequence, patents may not adequately reward innovators, especially if the granting procedure is long (Orsenigo and Sterzi, 2010). In the software industry, firms commonly use a combination of different mechanisms to obtain returns from their innovations, for example: copyright, trademark laws, trade secrets, lead times, learning curves, complementary assets, confidentiality procedures, and contractual provisions (Mansfield et al. 1981; Levin et al. 1987; Cohen et al. 2000). Thus, in the software industry, patents are usually considered as ineffective because rapid sequential innovation and fast technological progress may render a technology obsolete before a patent is obtained.
The literature also considers that in cumulative technologies, where research is sequential and builds upon previous discoveries, patents may impede rather than promote innovation. In such industries, the emergence of “thickets” of fragmented property rights may impede R&D activities by constraining the ability of firms to operate without extensive licensing of complementary technologies (Hall and Ziedonis, 2001; Noel and Schankerman, 2006). Bessen and Hunt (2007) suggest that software patents are used strategically, especially by established firms to build such “thickets” for anticompetitive reasons. Thus, some firms may accumulate patent “thickets” or set up patent pools in order to increase their market power and pose entry barriers or disincentives to others innovators (Bessen and Meurer, 2008). The strategic use of patents in cumulative and complex technologies may take different forms as for example cross-licensing, to increase bargaining power and to prevent hold-ups (defensive patenting). Critics also argue that any positive effect of stronger patents will be annulled by higher transaction costs and the increased threat of litigation entailed by several blocking patents (Jaffe and Lerner, 2004; Bessen and Meurer, 2008). Indeed, stronger patents may discourage subsequent research into valuable inventions which might potentially infringe those patents (Merges and Nelson, 1990; Scotchmer, 1991).
As a result, the reasons why software companies use patents and the estimation of their value for those companies continue to be unsolved problems for researchers. From our point of view, factors influencing patenting in software companies are related to competitive advantage which reduces the risk of failure and increases the risk of acquisition.
5
3.1 Patenting prior to IPO in the European software industry.
Despite the impressive growth in the economic literature on intellectually property rights over the past 30 years, there is still little empirical evidence concerning the role of patents in the European Software industry. Historically, at the European level, computer programs have been mainly protected under copyright as ‘literary works’4. A widely-established belief is that European Software companies cannot use patents because computer programs “as such” are excluded from patentability under Article 52(3), concerning patentable inventions, of the European Patent Convention5. Indeed, article 52 excludes several categories of inventions, among them scientific theories, mathematical methods, aesthetic creations, methods for performing mental acts, doing business or playing games, presentation of information and programs for computers “as such”. However, European patents shall be granted by the European Patent Office (EPO) or national patent offices, “for any inventions, in all fields of technology, provided that they are new, involve an inventive step and are susceptible of industrial application”. Additionally, an invention must also be “technical” in order to qualify for patent protection6. The literature has shown that the “technical” criterion is usually considered as the decisive factor for the patentability of a computer program in Europe (Bakels and Hugenholtz, 2002; Boon, 2009; Turle and Knight, 2008). Thus, a series of decisions of the Technical Boards of Appeal at the EPO have allowed a better distinction to be made between unpatentable inventions involving computer programs “as such” and patentable computer program-related inventions. For example, see the Vicom/Computer-related invention case in 1987 which considers a method of digitally processing an image to be sufficiently technical to render it patentable despite the fact that it is based on a mathematical method7. In the Koch & Sterzel decision in 1988 the EPO Board of Appeal considered that the software used to control X-ray equipment was sufficiently technical to qualify for patentability8. In the 1995 SOHEI case, it was established that even a business model with technical considerations would not become non-statutory because of the fact that a business method is involved9. However, the EPO indicates that the involvement of a machine is not sufficient by itself to give a business method-related invention a technical character10. In the same way, in the 1997 IBM/Computer Program Product cases the EPO Board of Appeal considered for the first time whether a computer program could be the subject of a patent per se. The EPO11 considered that “a computer program claimed by itself is not excluded from patentability if the program, when running on a computer or loaded into a computer, brings about, or is capable of bringing about, a technical effect which goes beyond the “normal” physical interactions between the program (software) and the computer (hardware) on which it is run.” Thus, the EPO Board indicated in the IBM case decisions that computer program products may obtain a patent. This decision implies that unauthorised sale of such a patented computer program amounts to direct patent infringement (Bakels and Hugenholtz, 2002). In the 2000 Pension Benefits System Partnership case12, the EPO Board refused a business method executed by a computer system but considered that the product’s claim was not excluded from patentability because the computer system did define technical features. However, the EPO Board considered that “the improvement envisaged by the
4 See: Council Directive 91/250/EEC of 14 May 1991 on the legal protection of computer programs, http://eur-lex.europa.eu/LexUriServ/LexUriServ.do?uri=CELEX:31991L0250:EN:HTML 5 http://www.epo.org/law-practice/legal-texts/epc.html 6 See European Patent Convention Rule 27 7 T208/84, Official Journal of the EPO 1987,14. 8 T26/86, Official Journal of the EPO 1988,19. 9 T769/92, Official Journal of the EPO 1995, 525. 10 T854/90, Official Journal of the EPO 1993, 669. 11 T935/97 and T1173/97, Official Journal of the EPO 1999, 609. 12 T931/95, Official Journal of the EPO 2000.
6
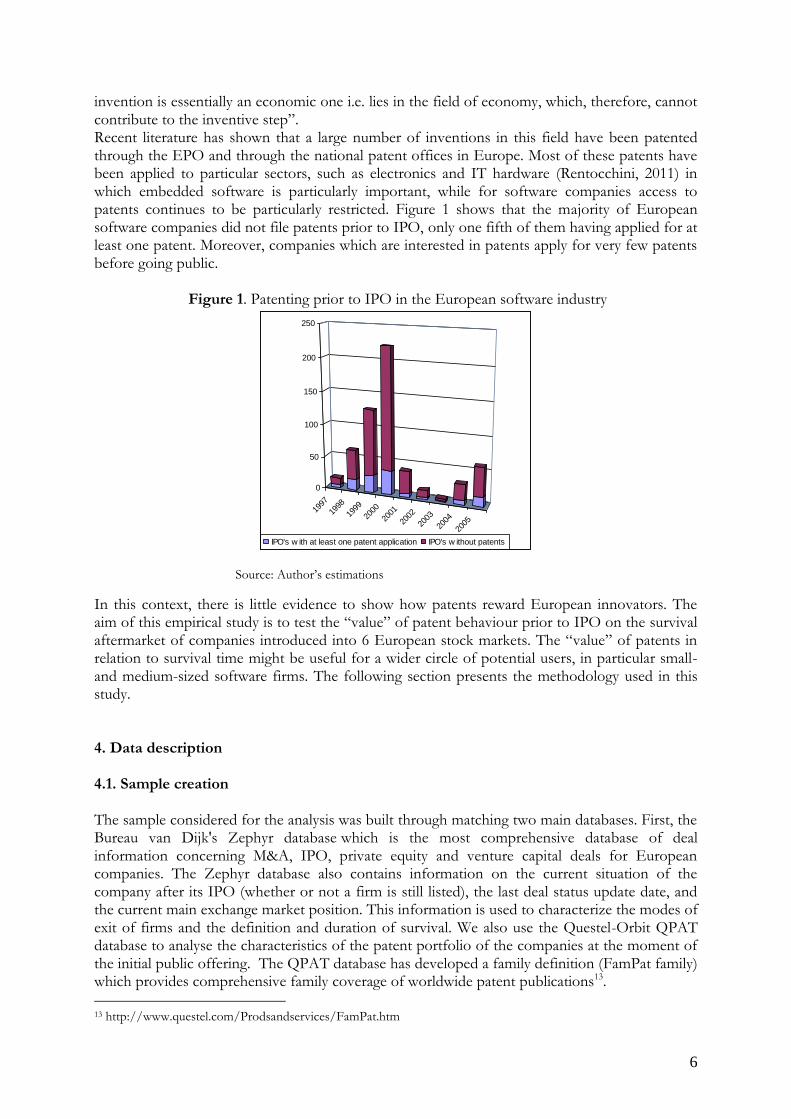
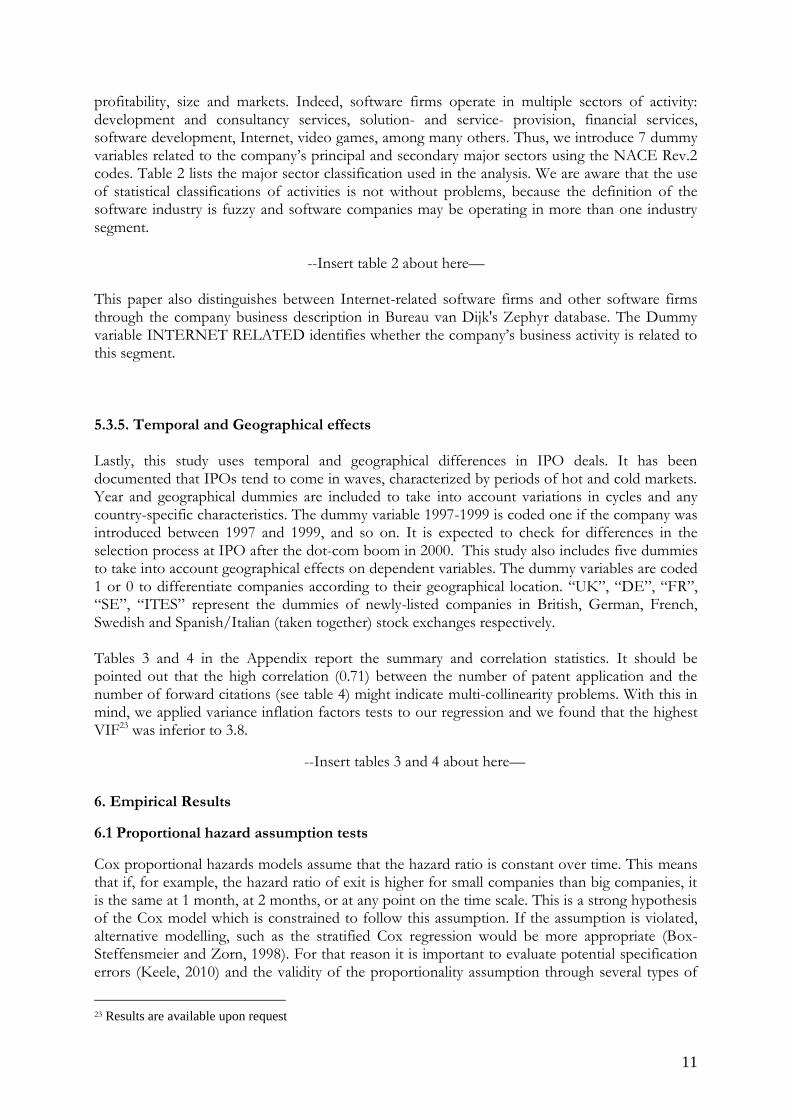
invention is essentially an economic one i.e. lies in the field of economy, which, therefore, cannot contribute to the inventive step”. Recent literature has shown that a large number of inventions in this field have been patented through the EPO and through the national patent offices in Europe. Most of these patents have been applied to particular sectors, such as electronics and IT hardware (Rentocchini, 2011) in which embedded software is particularly important, while for software companies access to patents continues to be particularly restricted. Figure 1 shows that the majority of European software companies did not file patents prior to IPO, only one fifth of them having applied for at least one patent. Moreover, companies which are interested in patents apply for very few patents before going public.
Figure 1. Patenting prior to IPO in the European software industry
1997
1998
1999
2000
2001
2002
2003
2004
2005
0
50
100
150
200
250
IPO's w ith at least one patent application IPO's w ithout patents
Source: Author’s estimations
In this context, there is little evidence to show how patents reward European innovators. The aim of this empirical study is to test the “value” of patent behaviour prior to IPO on the survival aftermarket of companies introduced into 6 European stock markets. The “value” of patents in relation to survival time might be useful for a wider circle of potential users, in particular small- and medium-sized software firms. The following section presents the methodology used in this study. 4. Data description 4.1. Sample creation The sample considered for the analysis was built through matching two main databases. First, the Bureau van Dijk's Zephyr database which is the most comprehensive database of deal information concerning M&A, IPO, private equity and venture capital deals for European companies. The Zephyr database also contains information on the current situation of the company after its IPO (whether or not a firm is still listed), the last deal status update date, and the current main exchange market position. This information is used to characterize the modes of exit of firms and the definition and duration of survival. We also use the Questel-Orbit QPAT database to analyse the characteristics of the patent portfolio of the companies at the moment of the initial public offering. The QPAT database has developed a family definition (FamPat family) which provides comprehensive family coverage of worldwide patent publications13. 13 http://www.questel.com/Prodsandservices/FamPat.htm
7
Basically, the sample was built in six steps. 1. We used the USSIC737 code (Computer programming, data processing, and other computer related services) to identify software firms in the ZEPHYR database. Then, we identified 991 software IPO deals from Germany, the United Kingdom, France, Sweden, Italy and Spain, between 1st January 1997 and 31st December 2005. Considering only companies with available information concerning pre-IPO characteristics, our sample is composed of 578 software IPOs. 2. We matched Bureau van Dijk's Zephyr database and the Questel-Orbit QPAT database by firm name. “Weak” matches were verified by looking at the content of the patents (the inventor names, address information, citations to other patents, and the content of abstracts). 3. We collected information on all the software company M&A deals from 1997 to 2011 (12848 deals). IPO information is matched with M&A deals to identify which companies were acquired after the IPO and the date of that acquisition. 4. Information concerning the current status of the company after its IPO (whether or not a firm is still listed) was used to identify companies delisted for another reason than M&A. 5. A significant effort was made to identify companies that underwent bankruptcy or voluntary liquidation processes after their IPO. Thus, Bureau van Dijk's Zephyr information was completed and verified with financial documents publicly available on the company’s websites and specialized websites such as Listofcompanies.co14, FE Investegate15 for UK companies, Bloomberg Business week, Nasdaqomx16, among others. We also searched the web for companies that had been acquired in order to obtain more detail on several business cases. This laborious process allowed us to better approach the complexity of exit processes and to identify many companies acquired while they were undergoing a liquidation process. 6. We also searched the web (on firm’s websites and specialized websites) for companies that survived, in order to verify whether they continue to operate in the financial markets. Considering only companies with available information concerning pre-IPO characteristics, our sample is composed of 578 newly-listed software firms from 6 European countries that went public between 1997 and 2005. 5. Empirical strategy
To estimate the relationship between firms’ pre-IPO quality metrics and their survival in the aftermarket, this study uses a cross-sectional Cox hazard regression model (Cox, 1972). A semi-parametric approach based on Cox’s regression is often used to describe the relation between the empirical exit rate and “background variables”. This model expresses the exit rate to a destination state as a rather simple function of observed and unobserved explanatory variables and the elapsed duration in the current state. Survival time is usually defined as a non-negative random T, the failure rate at time t and the hazard function h(T) is defined as the limit
14 http://listofcompanies.co.in/about-us/ 15 http://www.investegate.co.uk/About.aspx 16 http://nordic.nasdaqomxtrader.com/newsstatistics/corporateactions/Stockholm/Changes_to_the_List/
8
;)(
0)( t
tTttTtpLimh
tt
Thus, the different survival models are estimated using a vector of covariates iX for the firms’ characteristics at IPO and the regression coefficient k , which are to be estimated from the
data. Thus, the hazard function of a firm i is expressed as:
)exp()() x|( 0i ik Xthth
In this expression, )(0 th is an arbitrary and unspecified baseline hazard function reflecting the
probability of failure conditional on the firm having survived until time t after its IPO. The Cox regression uses the proportional hazard assumption, which assumes that all groups of firms face a hazard function of the same shape. The shape of the hazard function remains unspecified and it can take any form. The only difference between two groups, for example, is that the hazard function of one group can be some constant proportion higher or lower than the hazard function of the other group. In the presence of hazards that do not satisfy the proportional assumption the estimates can give biased and inefficient results for all the parameters. As a consequence, it is imperative to check for this assumption.
However, it is possible to deal with nonproportionality through the stratification of the covariate of interest. Under this alternative, the impact of the remaining independent variables (covariates) on the conditional hazard is assumed to be constant across the strata, but separate baseline hazards are estimated for the j different groups:
)exp()() x|( 0i ikj Xthth
In the stratified Cox regression, we assume that two groups of firms may have different risks of exiting. Additionally, we use a specification which includes time-invariant covariates like firm characteristics at the IPO (including patenting characteristics).
5.1. Definition of the dependent variables
It is usually accepted that a company has survived after an IPO if it is still listed on the stock market (Henseler, Rutherford and Springer 1997; Kauffman and Wang, 2003; Wagner and Cockburn, 2010). In this way, two kinds of dependent variables are used in our empirical model: the duration of the observations in the sample and a binary variable indicating the firm’s mode of exit. The duration is considered from an initial date (IPO date) until the date of the event (mode of exit) on a daily basis17. As noted above, we study the aftermarket survival of companies that went public from the 1st January 1997 to 31st December 2005. If the newly-listed software firm was not delisted by one of the modes of exit before December 31, 2011 it was considered as censored at that date. There are two modes of exit used in this study. The first mode is through M&A deals, which is also the main exit mechanism from stock markets in Europe (239 firms)18. As shown in the methodology, IPO information is matched with M&A deals information on the Bureau van Dijk's Zephyr database to identify the companies that were acquired after their IPO, and the date of the deal. The second mode of exit is through bankruptcy or voluntary liquidation (82
17 We also transform our duration variable on a monthly basis 18 The literature often quotes the diversity of causes and forms of M&A deals. A successful company can be a precious investment for another firm because it runs a profitable business, controls valuable technologies, assets or markets. Otherwise, a collapsed company might be purchased because of its assets but not because of its operations (Wagner and Cockburn, 2010). In our sample, companies that were acquired while they were in the process of liquidation were coded as acquired.

9
firms)19. Bankruptcy and voluntary liquidations are usually viewed as types of failure of firms (Buehler, Kaiser and Jaeger, 2005). Previous literature has highlighted different reasons for firms’ failure, such as the absence of profitability, stock price collapse, the firms’ debts or external business conditions (stock market uncertainty, economic crisis), among others (Henseler, Rutherford and Springer 1997; Kauffman and Wang, 2003; Peristiani and Hong, 2004; Wagner and Cockburn, 2010). 5.2 Patent information
As noted above, in our analysis, the IPO information for each firm is matched with the number of the patents filed by the firm with the priority date from the Qpad database in order to obtain several metrics characterising patent behaviour prior to IPO. The first variable AT LEAST ONE PATENT APPLICATION is a dummy variable coded if the company applied for at least one patent before IPO. The second variable PATENTAPPLIED is the number of patent applications with “priority date” prior to IPO. The number of patent applications reflects the total inventive output before IPO. In this paper, we did not evaluate “software patents” 20 whose definition can be arbitrary (Mann, 2005) but all the innovative input that might emerge in a complex innovation process with others firms, providers, and clients in the different business segments in which software companies operate. The third variable PATENTOBTAINED is the number of patents obtained prior to IPO21. The fourth variable FORWARD CITATIONS is the number of forward citations received within 3 years of the date of the IPO. The fifth variable INTERNATIONAL APPL (PCT) is the number of international applications (PCT applications). Table 1 summarizes the international characteristics of the patents filed by European software companies. It should be pointed out that 37.9% of the patent applications prior to IPO had a US extension while 31.5% were international applications. This shows the importance of the US market for growing European companies.
--Insert table 1 about here—
5.3. Controls and main determinants
This study incorporates 5 types of variable: firm’s patent portfolio characteristics (patent applied and obtained, forward citations, international applications), pre-IPO financial performance characteristics (sales, profitability and solvency ratios), other firm-related characteristics (age, size), firm’s industry-related segment and market conditions.
5.3.1. Financial ratios
19 A firm can be also delisted from a particular public stock exchange if it is taken private or if the company decides to change stock market. This was the case for some European companies in this sample. In such cases, companies in our sample who changed stock market but continued to operate in the new stock market until 31st December 2011 were coded as censored. 20 There are three methodologies to identify “software-related patents”. The first, as defined by Graham & Mowery (2003), is using the International Patent Classification (i.e. G06F; 3/; 5/; 7/; 9/; 11/; 12/; 13/; 15/; G06K; 9/; 15/and H04L9). The second, as proposed by Bessen and Meurer (2007) uses search query keywords such as: ((“software” in specification) OR (“computer” AND “program” in specification)) AND (utility patent excluding reissues) ANDNOT (“chip” OR “semiconductor” OR “bus” OR “circuit” OR “circuitry” in title) ANDNOT (“antigen” OR “antigenic” OR “chromatography” in specification). The last methodology is to combine the two techniques in order to minimise potential errors as proposed by Hall and MacGavie (2010). 21 We also include the variable SHARE OF PATENTS OBTAINED which is the number of patents obtained in proportion to the patents applied before IPO.
10
Here, we use common ratios of profitability and solvency which are used by investors to analyse the financial performance of firms, in order to check firm heterogeneity and financial performance. The variable RETURN ON SALES was created to compare the business's ability to generate earnings as compared to its expenses and other relevant costs incurred during the year preceding the filing of the IPO. The analyses also include a dummy variable called POSITIVE RETURN ON SALES which is equal to one if the quoted company has a positive profitability ratio and equal to zero otherwise. The model also includes the variable called EQUITY RATIO which is defined as the shareholders' funds in proportion to total assets. This ratio can produce a confidence factor for unsecured creditors. Generally speaking, the lower a company's equity ratio, the greater the probability that the company will default on its debt obligations. It is expected that the likelihood of survival of a firm is positively associated with its profitability and equity ratio performance. 5.3.2. Venture capital support Bureau van Dijk's Zephyr database also contains information on venture capital support. The dummy variable VCAP indicates whether the IPO was backed by one or more venture firms (=1) or not (=0). Jain and Kini (2000) and Wagner and Cockburn (2010), find that the presence of venture capitalists reduces the likelihood of exit of newly listed firms in the US. However, empirical literature on European countries has found that receiving VC does not improve the survival rate of newly listed firms in the German Neuer Market (Audretsch and Lehmann, 2004), or in France (Pommet, 2012). 5.2.3. Assets, revenues and age at IPO The analysis also checks for the size of the company including a log transformed variable of total assets and turnover in the year preceding IPO called LOG (ASSETS) and LOG (REVENUES), respectively. The survival rate of newly listed firms should be positively related to the size of the firm in terms of total assets and the company's revenue. The dummy variable SMALL SIZE indicates whether the software company quoted is introduced as a small company with sales inferior to €10 million in Europe.22 It is remarkable that 50.8% of the software companies quoted were small companies. The variable AGE AT IPO is calculated as the difference between the effective date of IPO and the date of legal incorporation. If the date of incorporation was not available from Bureau van Dijk's Zephyr database it was obtained from publicly-available financial documents on the company's website or through specialized magazines. The company’s age at IPO is expected to be a good proxy for financial soundness, thus reducing the risk of exit. It is expected that companies with more experience before going public have lower failure rates than young companies and the oldest firms have higher failure rates. 5.3.4. Firms’ related industrial segment The literature has shown that the likelihood of survival varies systematically from industry to industry (Dunne et. al., 1989; Audretsch, 1995). Intra-industrial differences might be important in aftermarket survival of new software firms because there is significant heterogeneity across industry segments related to their innovation capabilities, Intellectual Property appropriability,
22 See the EUROSTAT definition of SME for Europe: http://epp.eurostat.ec.europa.eu/cache/ITY_OFFPUB/KS-NP-06-024/EN/KS-NP-06-024-EN.PDF
11
profitability, size and markets. Indeed, software firms operate in multiple sectors of activity: development and consultancy services, solution- and service- provision, financial services, software development, Internet, video games, among many others. Thus, we introduce 7 dummy variables related to the company’s principal and secondary major sectors using the NACE Rev.2 codes. Table 2 lists the major sector classification used in the analysis. We are aware that the use of statistical classifications of activities is not without problems, because the definition of the software industry is fuzzy and software companies may be operating in more than one industry segment.
--Insert table 2 about here— This paper also distinguishes between Internet-related software firms and other software firms through the company business description in Bureau van Dijk's Zephyr database. The Dummy variable INTERNET RELATED identifies whether the company’s business activity is related to this segment. 5.3.5. Temporal and Geographical effects Lastly, this study uses temporal and geographical differences in IPO deals. It has been documented that IPOs tend to come in waves, characterized by periods of hot and cold markets. Year and geographical dummies are included to take into account variations in cycles and any country-specific characteristics. The dummy variable 1997-1999 is coded one if the company was introduced between 1997 and 1999, and so on. It is expected to check for differences in the selection process at IPO after the dot-com boom in 2000. This study also includes five dummies to take into account geographical effects on dependent variables. The dummy variables are coded 1 or 0 to differentiate companies according to their geographical location. “UK”, “DE”, “FR”, “SE”, “ITES” represent the dummies of newly-listed companies in British, German, French, Swedish and Spanish/Italian (taken together) stock exchanges respectively. Tables 3 and 4 in the Appendix report the summary and correlation statistics. It should be pointed out that the high correlation (0.71) between the number of patent application and the number of forward citations (see table 4) might indicate multi-collinearity problems. With this in mind, we applied variance inflation factors tests to our regression and we found that the highest VIF23 was inferior to 3.8.
--Insert tables 3 and 4 about here—
6. Empirical Results
6.1 Proportional hazard assumption tests
Cox proportional hazards models assume that the hazard ratio is constant over time. This means that if, for example, the hazard ratio of exit is higher for small companies than big companies, it is the same at 1 month, at 2 months, or at any point on the time scale. This is a strong hypothesis of the Cox model which is constrained to follow this assumption. If the assumption is violated, alternative modelling, such as the stratified Cox regression would be more appropriate (Box-Steffensmeier and Zorn, 1998). For that reason it is important to evaluate potential specification errors (Keele, 2010) and the validity of the proportionality assumption through several types of
23 Results are available upon request
12
test (Grambsch and Therneau, 1994). We implement 3 related types of test to detect the correct model specification and identify potential nonproportionality while considering that there are competing risks involved. We consider competing risks through fitting models separately for each type of failure and treating other failure as censored (Kay, 1986; Lunn and McNeil, 1995).
First, we implement a test for proportional hazard through a nonzero slope in a generalized linear regression of the scaled Schoenfeld residuals on time. In this test the null hypotheses of zero slope is equivalent to testing that the log hazard-ratio is constant across time (Grambsch and Therneau, 1994). Table 5 presents the results for this test while considering competing risk specifications. For these model configurations, the PH assumption has been violated. In the Cox proportional specification, SME and DE (Germany) violate the PH assumption for acquired (First event) while VENTURE BACKED (measure of “success” before IPO), LOG (ASSETS) (size specific covariate) and SE (Sweden) also violate the PH assumption for failure (Second event). Then, it is quite reasonable to stratify both models by country covariates, size and a measure of success before IPO and re-test the PH assumption.
A second way to detect a violation of the proportional hazard assumption in the Cox model is to estimate separate Cox regression models for log-time interactions with each of the potentially non-proportional variables. Table 6 presents the results for this test while considering competing risk specifications. Thus, through this test we confirm that is necessary to stratify both models by country covariates, size and at least one patent application and re-test the PH assumption.
--Insert tables 5 and 6 about here—
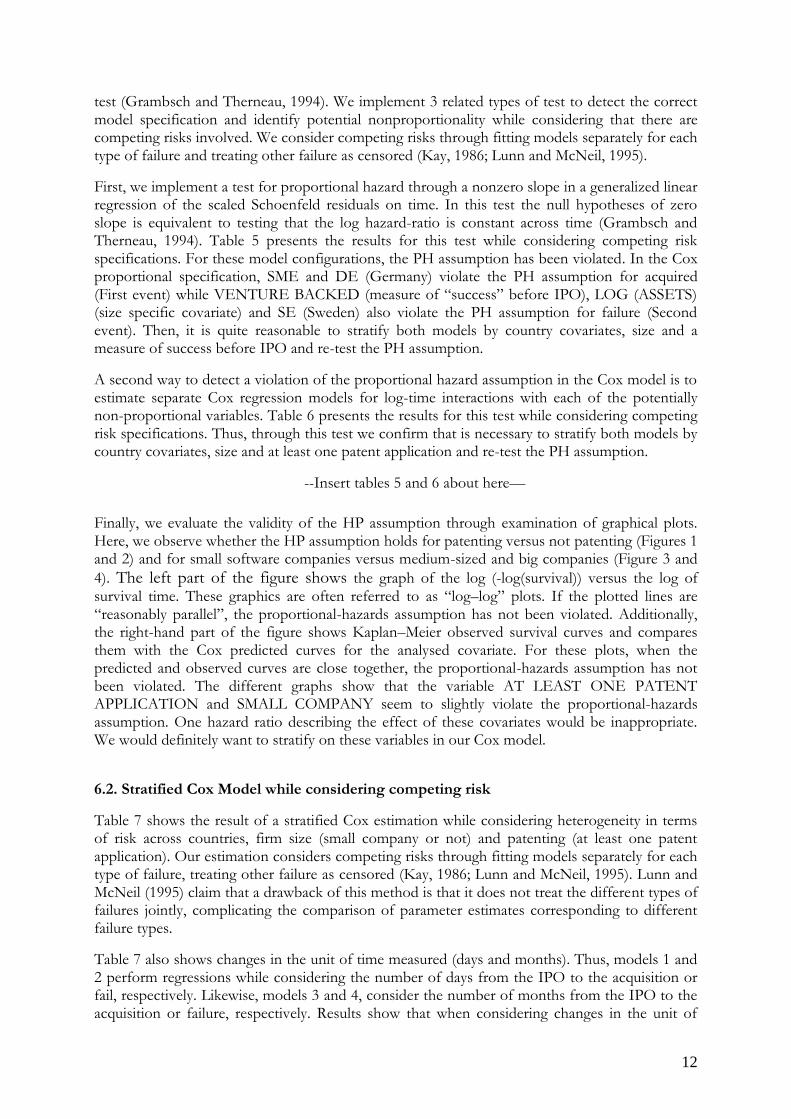
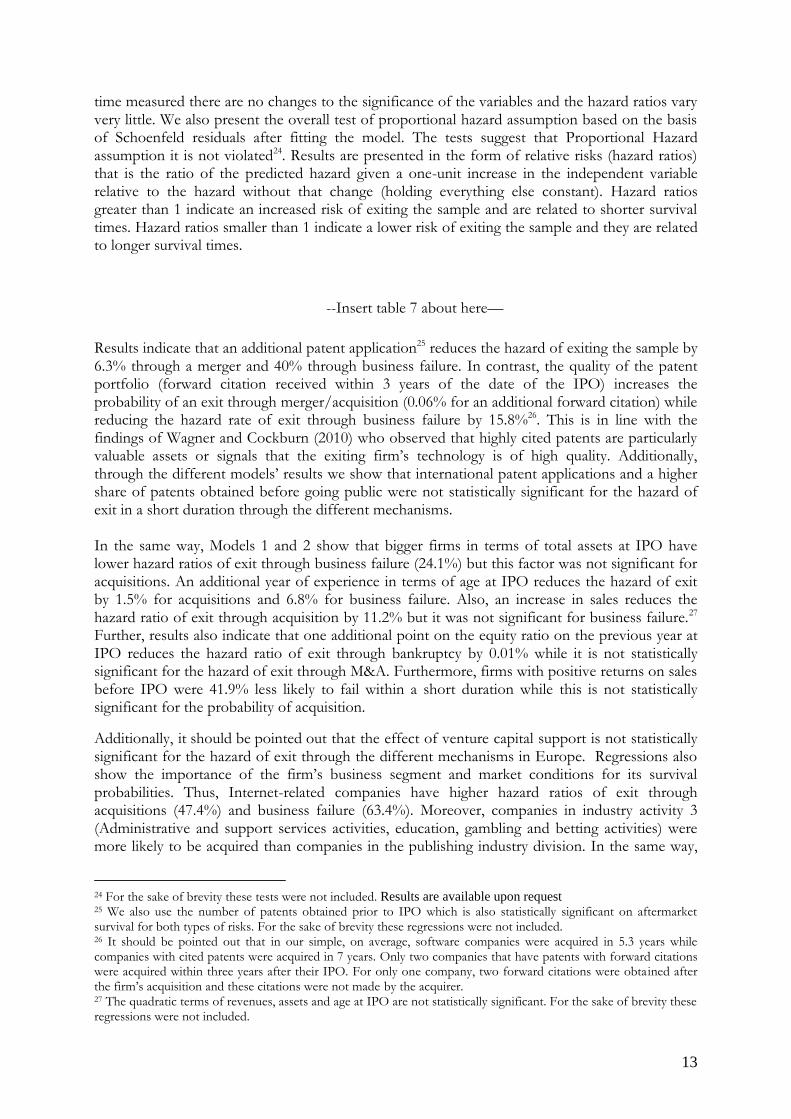
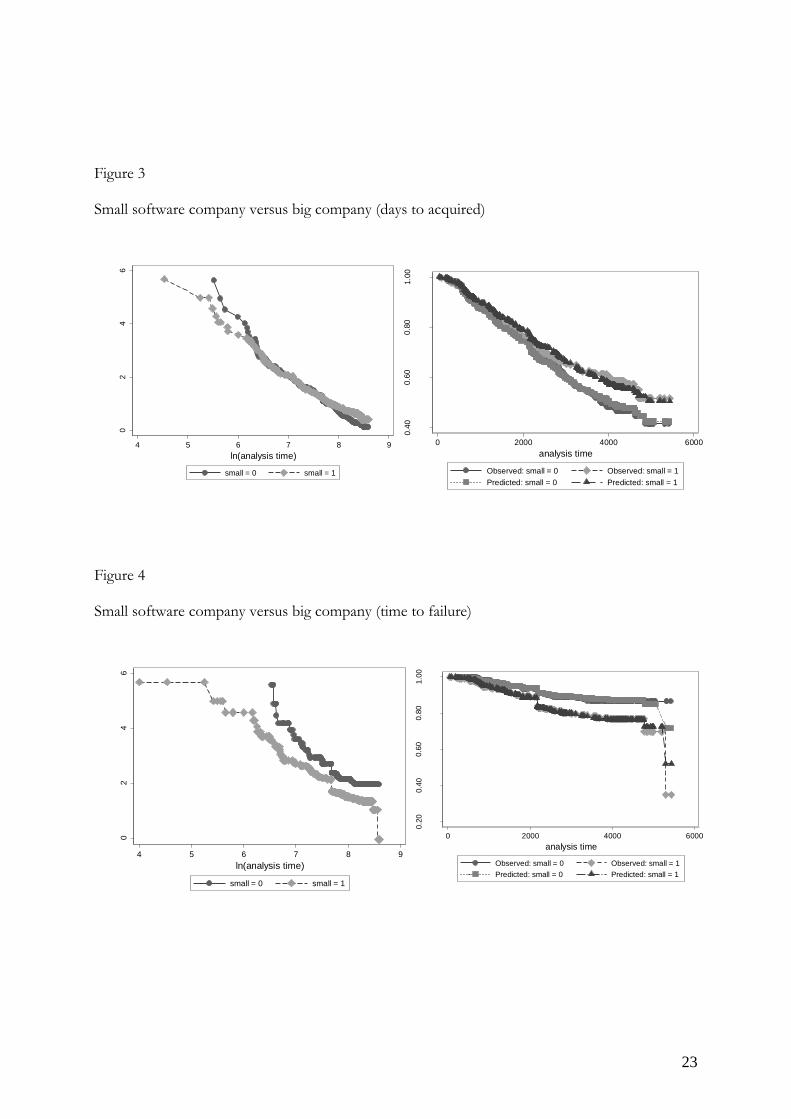
Finally, we evaluate the validity of the HP assumption through examination of graphical plots. Here, we observe whether the HP assumption holds for patenting versus not patenting (Figures 1 and 2) and for small software companies versus medium-sized and big companies (Figure 3 and
4). The left part of the figure shows the graph of the log (-log(survival)) versus the log of survival time. These graphics are often referred to as “log–log” plots. If the plotted lines are “reasonably parallel”, the proportional-hazards assumption has not been violated. Additionally, the right-hand part of the figure shows Kaplan–Meier observed survival curves and compares them with the Cox predicted curves for the analysed covariate. For these plots, when the predicted and observed curves are close together, the proportional-hazards assumption has not been violated. The different graphs show that the variable AT LEAST ONE PATENT APPLICATION and SMALL COMPANY seem to slightly violate the proportional-hazards assumption. One hazard ratio describing the effect of these covariates would be inappropriate. We would definitely want to stratify on these variables in our Cox model.
6.2. Stratified Cox Model while considering competing risk
Table 7 shows the result of a stratified Cox estimation while considering heterogeneity in terms of risk across countries, firm size (small company or not) and patenting (at least one patent application). Our estimation considers competing risks through fitting models separately for each type of failure, treating other failure as censored (Kay, 1986; Lunn and McNeil, 1995). Lunn and McNeil (1995) claim that a drawback of this method is that it does not treat the different types of failures jointly, complicating the comparison of parameter estimates corresponding to different failure types.
Table 7 also shows changes in the unit of time measured (days and months). Thus, models 1 and 2 perform regressions while considering the number of days from the IPO to the acquisition or fail, respectively. Likewise, models 3 and 4, consider the number of months from the IPO to the acquisition or failure, respectively. Results show that when considering changes in the unit of
13
time measured there are no changes to the significance of the variables and the hazard ratios vary very little. We also present the overall test of proportional hazard assumption based on the basis of Schoenfeld residuals after fitting the model. The tests suggest that Proportional Hazard assumption it is not violated24. Results are presented in the form of relative risks (hazard ratios) that is the ratio of the predicted hazard given a one-unit increase in the independent variable relative to the hazard without that change (holding everything else constant). Hazard ratios greater than 1 indicate an increased risk of exiting the sample and are related to shorter survival times. Hazard ratios smaller than 1 indicate a lower risk of exiting the sample and they are related to longer survival times.
--Insert table 7 about here—
Results indicate that an additional patent application25 reduces the hazard of exiting the sample by 6.3% through a merger and 40% through business failure. In contrast, the quality of the patent portfolio (forward citation received within 3 years of the date of the IPO) increases the probability of an exit through merger/acquisition (0.06% for an additional forward citation) while reducing the hazard rate of exit through business failure by 15.8%26. This is in line with the findings of Wagner and Cockburn (2010) who observed that highly cited patents are particularly valuable assets or signals that the exiting firm’s technology is of high quality. Additionally, through the different models’ results we show that international patent applications and a higher share of patents obtained before going public were not statistically significant for the hazard of exit in a short duration through the different mechanisms. In the same way, Models 1 and 2 show that bigger firms in terms of total assets at IPO have lower hazard ratios of exit through business failure (24.1%) but this factor was not significant for acquisitions. An additional year of experience in terms of age at IPO reduces the hazard of exit by 1.5% for acquisitions and 6.8% for business failure. Also, an increase in sales reduces the hazard ratio of exit through acquisition by 11.2% but it was not significant for business failure.27 Further, results also indicate that one additional point on the equity ratio on the previous year at IPO reduces the hazard ratio of exit through bankruptcy by 0.01% while it is not statistically significant for the hazard of exit through M&A. Furthermore, firms with positive returns on sales before IPO were 41.9% less likely to fail within a short duration while this is not statistically significant for the probability of acquisition.
Additionally, it should be pointed out that the effect of venture capital support is not statistically significant for the hazard of exit through the different mechanisms in Europe. Regressions also show the importance of the firm’s business segment and market conditions for its survival probabilities. Thus, Internet-related companies have higher hazard ratios of exit through acquisitions (47.4%) and business failure (63.4%). Moreover, companies in industry activity 3 (Administrative and support services activities, education, gambling and betting activities) were more likely to be acquired than companies in the publishing industry division. In the same way,
24 For the sake of brevity these tests were not included. Results are available upon request 25 We also use the number of patents obtained prior to IPO which is also statistically significant on aftermarket survival for both types of risks. For the sake of brevity these regressions were not included. 26 It should be pointed out that in our simple, on average, software companies were acquired in 5.3 years while companies with cited patents were acquired in 7 years. Only two companies that have patents with forward citations were acquired within three years after their IPO. For only one company, two forward citations were obtained after the firm’s acquisition and these citations were not made by the acquirer. 27 The quadratic terms of revenues, assets and age at IPO are not statistically significant. For the sake of brevity these regressions were not included.
14
industry activities 3 and 4 (manufacturing companies) were more likely to fail compared with publishers. In addition, companies that went public between 1997 and 1999 were 33.8% more likely to be acquired than companies introduced in 2000. 6.3. Competing risks-stratified Cox Model We also used another method to analyse competing risks while considering that firm’s face both a risk of acquisition and a risk of failure. The specific method that we use for the competing risks model follows Lunn and McNeil (1995). This approach involves data augmentation by duplicating the data for each failure type. Then, we estimate a Cox hazard regression stratified by type of failure28. This specification takes into account the fact that the hazard rate is now affected by both events. This means that we have a different hazard rate for each type of event. The competing risks-stratified Cox model explains heterogeneity in terms of different baseline hazards of different exit modes. Therefore, table 8 shows the results of the stratified Cox model which allows different baseline hazards across events. When we consider this configuration, the covariate effects are very similar to those of the previous models, in particular, the direction of the relative risk does not change. The main difference concerning patent behaviour is that the effect of additional patent applications is slightly greater reducing the hazard of exiting through failure within a short duration (40.2%). Finally, the covariate effects of firms’ business segments are also slightly stronger in this configuration.
--Insert table 8 about here—
7. Conclusion and discussion
This empirical study tests the impact of patents on the survival time of newly-listed software firms joining the stock market between 1997 and 2005 in Europe. We perform a cross-sectional competing-risk stratified Cox hazard model to test the effect on firms’ survival in relation to their patent portfolio characteristics (patent applications, forward citations, PTC patents) while paying attention to pre-IPO financial performance characteristics, other related characteristics of firms (age, size), the industry segment to which the firms are related and market conditions. Thus, this paper contributes in several dimensions to the literature on innovation and company performance. First, it is the first paper to analyse the value of patenting on the survival of newly-listed European software companies. From this point of view, patenting behaviour seems to be more than just a signal for investors. Thus, additional patent applications reduce the risk of exiting through merger/acquisition or business failure. Second, in line with previous literature on newly-listed firms’ survival, a high-quality patent portfolio makes a firm more attractive for acquisitions. Wagner and Cockburn (2010), who found a similar result for US Internet-related companies, pointed out that highly -cited patents are valuable assets that improve the competitive situation of firms. In addition, a higher-quality patent portfolio reduces the risk of failure. In the light of these results, we argue that in industries with complex technologies such as the software industry, high-quality patents increase the attractiveness of a company as an acquisition target because those patents might increase the
28 See methodological appendix A
15
competitive position of the acquirer as in the case, for example, of the exploitation of cross-licensing agreements, reduction of hold-up problems and improvement of their bargaining power. Third, the results support the idea that the financial characteristics of software companies at IPO are related to their likelihood of survival. Thus, companies with positive profitability ratios reduce the risk of failure within a short duration while less solvent companies have higher probabilities of failure. Thus, pre-IPO profitability and solvency are strong indicators of the ability of firms to operate prosperously aftermarket. In the same way, as expected, our analysis confirms that the influence of the pre-IPO characteristics is different according to the type of exit. Thus, bigger firms in terms of total assets at IPO have lower ratios for exit through business failure but the ratios were not statistically significant for acquisitions. On the other hand, the ability to generate revenue before IPO reduces the hazard ratio of exit through acquisition but the ratios were not significant for exit through business failure. In this paper, we are aware that the analysis of the effect of patent behaviour and firms’ characteristics at IPO (time invariant covariates) on the risk of experiencing an event provides considerable insights but also has some limitations. A higher or lower risk is interpreted as relative and proportional to the hazard rate. This means that the hazard rate is constant across time for some firms relative to others. However, the inclusion of time-variable parameters should lead to more complex modelling and interpretation. With time-variable parameters, the hazard risk is proportional across time until the covariate changes: as a consequence new insights can emerge concerning the nature of European software firms’ survival. Thus, future research into European firms’ survival should introduce time-variable covariates to analyse their impact on the hazard rate. References Audrestch, D.B., 1991. New-firm survival and the technological regime. Review of Economics and Statistics 73, 441-450. Audrestch, D.B., 1995. Innovation and industry evolution. MIT Press, Cambridge. Audretsch, D.B., Lehmann, E.E., 2004. The Effects of Experience, Ownership, and Knowledge on IPO Survival: Evidence from the Neuer Markt. Discussion Paper 04/10, Diskussionspa-pier der Forschergruppe (Nr. 3468269275) Heterogene Arbeit: Positive und Normative Aspekte der Qualifikationsstruktur der Arbeit, Konstanz. Bakels, R., and Hugenholtz P.B, 2002. The patentability of computer programmes Discussion of European-level legislation in the field of patents for software. EUROPEAN PARLIAMENT, Directorate-General for Research. Bessen, James. 2003. Patent Thickets: Strategic Patenting of Complex Technologies. ROI Working Paper. Bessen J., Hunt R., 2007. An Empirical Look at Software Patents. Journal of Economics and Management Strategy, 16(1), 157–189. Bessen J., Meurer M., 2008, Do patents perform like property?. Boston University school of law Working Paper Series, Law and Economics. No 08-08.

16
Buehler S., Kaiser C., Jaeger F., 2005, Merger or Fail? The determinants of Merger and Bankrupcies in Switzerland, 1995-2000. Socioeconomic Institute University of Zurich Working paper No. 0506 Boon., J, 2009, UK software patents – Get with the program, Computer Law & Security Review 25- 367-371 I Box-Steffensmeier, J., Zorn., C., 1998, Duration models and Proportional Hazards in Political Science. Annual Meeting of the Midwest Political Science Association, April 23-25, 1998, Chicago, Illinois. Campbell-Kelly, M., 2003. From airline reservations to sonic the hedgehog: A history of the software industry. MIT press, 89-199. Cefis, E., Marsili, O., 2006. Survivor: the role of innovations in firms’ survival. Research Policy 35, 626–641. Cefis, E., Marsili, O., 2007. Going, Going, Gone. Innovation and Exit in Manufacturing Firms. Erim Report Series Research in Management. http://hdl.handle.net/1765/9732 Christensen, C.M., Suarez, F.F., Utterback, J.M., 1998. Strategies for survival in fast-changing industries. Management Science 44 (12, Part 2 of 2), S207–S220. Cohen, J. and M.A. Lemley, 2001, « Patent Scope and Innovation in the Software Industry, » California Law Review, 89, 1–57. Cohen, W.M., Nelson, R.R. and Walsh, J.P. 2000, ‘Protecting their intellectual assets: appropriability conditions and why U.S. manufacturing firms patent (or not)’, NBER Working Paper 7552 Cooley, T.F., Quadrini, V., 2001. Financial markets and firm dynamics. American Economic Review 91 (5), 1286–1310. Cox, D. R., 1972, “Regression models and life tables”, Journal of Royal Statistical Society, 34, pp. 187-220. Dosi, G., Marengo, L. and Pasquali, C., 2006. ’How much should society fuel the greed of innovators? On the relations between appropriability, opportunities and rates of innovation‘, Research Policy, 35, 1110-1121
Dunne, T. Roberts, M.J and Samuelson, L., 1989. The growth and failure of U.S. manufacturing plants. Quarterly Journal of Economics 104. 671-698.
Evans, D.S., 1987, The relationship between firm growth, size and age: Estimates for 100 manufacturing industries, Journal of Industrial Economics 35, 567-581.
Geroski, P.A., 1995. What do we knowabout entry? International Journal of Industrial Organization 13 (4), 421–440.
Grambsch, P. M., and T. M. Therneau. 1994. Proportional hazards tests and diagnostics based on weighted residuals. Biometrika 81: 515–526.

17
Hall, B.H., 1987. The relationship between firm size and firm growth in the US manufacturing sector. The Journal of Industrial Economics 35 (4), 583–606.
Hall, B.H. and Ziedonis, R. H., 2001, “The Determinants of Patenting in the U.S. Semiconductor Industry, 1980-1994”, Rand Journal of Economics, 32, 101-28
Henseler, D., Rutherford, R., and Springer, T., 1997, The survival of initial public offerings in the aftermarket. The journal of Financial Research. Vol. XX No, 1 pp. 93-110.
Jaffe and Lerner, 2004. Innovation and its discontents. Princeton University Press
Jain, B.A., Kini, O., 2000. Does the presence of venture capitalists improve the survival profile of IPO firms? Journal of Business Finance & Accounting 27 (9–10), 1139–1183.
Kauffman, R., Wang, B., 2003. Duration in the digital economy. In: Sprague, R. (Ed.), Proceedings of the 36th Hawaii International Conference on Systems Science, IEEE Computing Society. Kay, R., 1986. Treatment effects in competing-risks analysis of prostate cancer data. Biometrics 42, 203-211 Keele, L., 2010. Proportionally Difficult: Testing for Nonproportional Hazard in Cox Models. Political Analysis 18: 189-50 Kingston, W. (2001), Innovation needs patent reform, Research Policy, 30(3), 403-423 Klepper, S., 1996. Entry, exit, growth, and innovation over the product life cycle. The American Economic Review 86 (3), 562–583. Levin, R. C., Klevorick, A. K., Nelson, R. R. and Winter, S. G, 1987, ‘Appropriating the Returns from Industrial Research and Development’, Brookings Papers on Economic Activity, 3, 783-832 Lunn, M., McNeil., 1995. Appling Cox Regression to competing risks. Biometrics, vol. 51, No. 2, pp. 524-532. Mann, R. 2005. Do patents facilitate financing in the software Industry? Texas Law Review. Volume 83(4), 961-1030. Mann, R., Sager T., 2007. Patents, venture capital, and software start-ups. Research Policy 36, 193–208 Mansfield, E. (1986), ‘Patents and Innovation: an empirical study’, Management Science, 32,173-181 Merges, R.,P. and Nelson., R.R., 1990. On the Complex Economics of Patent Scope. Columbia Law Review. 90:4, pp. 839–916. Merges, R. P., 1996. A Comparative Look at Intellectual Property Rights and the Software Industry. In D. C. Mowery, ed., The International Computer Software Industry: A Comparative Study of Industry Evolution and Structure. New York: Oxford University Press. Nelson, R. R., and S. G. Winter, 1982. An Evolutionary Theory of Economic Change. Cambridge, MA: Belknap Press of Harvard University Press.

18
NESSI (2008), «European Software Strategy a NESSI proposition paper ». The Networked European Software and Services Initiative, June 2008. Noel, M.D., Schankermann, M.A., 2006. Strategic Patenting and Software Innovation. CEPR Discussion Paper No. 5701. CEPR. Orsenigo L, and Sterzi, V., 2010. Comparative study if the use of patents in different industries. KITeS Working Paper, n.33 Pakes, A., and R. Ericson, 1998. Empirical Implications of Alternative Models of Firm Dynamics, Journal of Economic Theory 79: 1, 1-45.
Peristiani, S, and Hong, G., 2004. Pre-IPO Financial Performance and Aftermarket Survival. Current issues in economics and finance. Federal reserve bank of New york. Volume 10, Number 2. Peel, M.J., Wilson, N., 1989. The liquidation/ Merger Alternative, Managerial and Decisions Economics 10, 209-220. Perez, E.S., Sanchis LLopis, A., Sanchis LLops, J.A., 2004. The determinants of survival of Spanish manufacturing firms. Review of Industrial Organization 25 (3), 251–273. Pommet., Sophie, 2012. Capital- investissement et performances des firmes : le cas de la France. Vie & sciences de l'entreprise N°190, 30-45 Rentocchini., 2011, Sources and characteristics of software patents in the European Union: some empirical considerations. Information Economics and Policy, doi: 10.1016/j.infoecopol.2010.12.002 Roycroft, R.W. and Kash, D., 1999. The Complexity Challenge: Technological Innovation for the 21st Century, Francis Pinter, London Schary, MA., 1991, The probability of exit, RAND Journal of Economics 22, 339-353. Scotchmer, Suzanne. 1991. Standing on the Shoulders of Giants: Cumulative Research and the Patent Law. Journal of Economic Perspectives. Winter, 5:1, pp. 29–41. Syntec informatique, 2008, Position paper: Towards a European software strategy. Collection ThémaTic- Software Numéro 22. Turle, M., and Knight D., 2008, Recent developments in the patentability of software in the UK, Computer Law & Security Report 24. 461-464
Veugelers, R., and Cincera, M., 2010, Young leading innovators and EU's R&D intensity gap, Bruegel policy contribution, No. 2010/09
Wagner S., Cockburn I., 2010, Patents and the survival of Internet-related IPOs. Research policy 39 (214-228).
19
Winter, S. G., 1987, "Knowledge and Competence as Strategic Assets," in D. J. Teece (Ed.) The Competitive Challenge. Strategies for Industrial Innovation and Renewal. Cambridge, Mass.: Ballinger Publishing Company.
Ziedonis, R.H., 2004, “Don’t Fence Me In: Fragmented markets for technology and the Patent Acquisition Strategies of Firms”. Management Science. Vol. 50, No. 6, pp. 804-820.
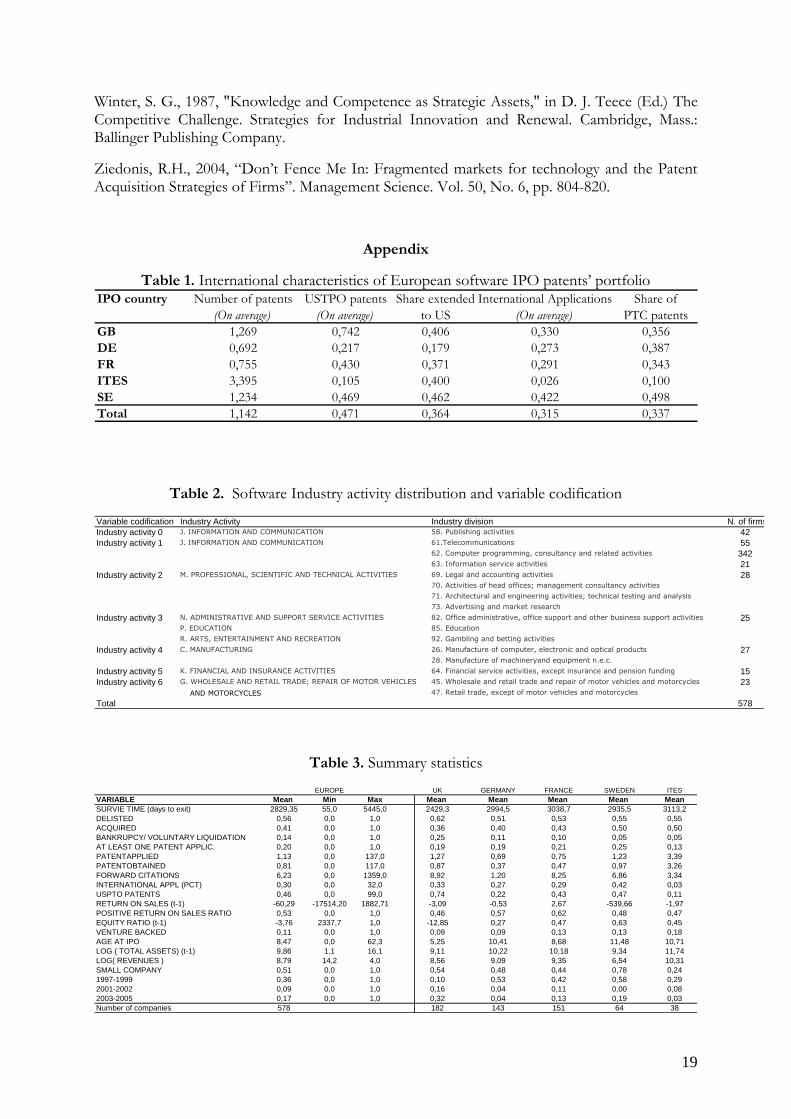
Appendix
Table 1. International characteristics of European software IPO patents’ portfolio IPO country Number of patents USTPO patents Share extended International Applications Share of
(On average) (On average) to US (On average) PTC patents
GB 1,269 0,742 0,406 0,330 0,356
DE 0,692 0,217 0,179 0,273 0,387
FR 0,755 0,430 0,371 0,291 0,343
ITES 3,395 0,105 0,400 0,026 0,100
SE 1,234 0,469 0,462 0,422 0,498
Total 1,142 0,471 0,364 0,315 0,337
Table 2. Software Industry activity distribution and variable codification
Variable codification Industry Activity Industry division N. of firmsIndustry activity 0 J. INFORMATION AND COMMUNICATION 58. Publishing activities 42Industry activity 1 J. INFORMATION AND COMMUNICATION 61.Telecommunications 55
62. Computer programming, consultancy and related activities 34263. Information service activities 21
Industry activity 2 M. PROFESSIONAL, SCIENTIFIC AND TECHNICAL ACTIVITIES 69. Legal and accounting activities 2870. Activities of head offices; management consultancy activities
71. Architectural and engineering activities; technical testing and analysis
73. Advertising and market research
Industry activity 3 N. ADMINISTRATIVE AND SUPPORT SERVICE ACTIVITIES 82. Office administrative, office support and other business support activities 25P. EDUCATION 85. Education
R. ARTS, ENTERTAINMENT AND RECREATION 92. Gambling and betting activities
Industry activity 4 C. MANUFACTURING 26. Manufacture of computer, electronic and optical products 2728. Manufacture of machineryand equipment n.e.c.
Industry activity 5 K. FINANCIAL AND INSURANCE ACTIVITIES 64. Financial service activities, except insurance and pension funding 15Industry activity 6 G. WHOLESALE AND RETAIL TRADE; REPAIR OF MOTOR VEHICLES 45. Wholesale and retail trade and repair of motor vehicles and motorcycles 23
AND MOTORCYCLES 47. Retail trade, except of motor vehicles and motorcycles
Total 578
Table 3. Summary statistics
UK GERMANY FRANCE SWEDEN ITESVARIABLE Mean Min Max Mean Mean Mean Mean MeanSURVIE TIME (days to exit) 2829,35 55,0 5445,0 2429,3 2994,5 3038,7 2935,5 3113,2DELISTED 0,56 0,0 1,0 0,62 0,51 0,53 0,55 0,55ACQUIRED 0,41 0,0 1,0 0,36 0,40 0,43 0,50 0,50BANKRUPCY/ VOLUNTARY LIQUIDATION 0,14 0,0 1,0 0,25 0,11 0,10 0,05 0,05AT LEAST ONE PATENT APPLIC. 0,20 0,0 1,0 0,19 0,19 0,21 0,25 0,13PATENTAPPLIED 1,13 0,0 137,0 1,27 0,69 0,75 1,23 3,39PATENTOBTAINED 0,81 0,0 117,0 0,87 0,37 0,47 0,97 3,26FORWARD CITATIONS 6,23 0,0 1359,0 8,92 1,20 8,25 6,86 3,34INTERNATIONAL APPL (PCT) 0,30 0,0 32,0 0,33 0,27 0,29 0,42 0,03USPTO PATENTS 0,46 0,0 99,0 0,74 0,22 0,43 0,47 0,11RETURN ON SALES (t-1) -60,29 -17514,20 1882,71 -3,09 -0,53 2,67 -539,66 -1,97POSITIVE RETURN ON SALES RATIO 0,53 0,0 1,0 0,46 0,57 0,62 0,48 0,47EQUITY RATIO (t-1) -3,76 2337,7 1,0 -12,85 0,27 0,47 0,63 0,45VENTURE BACKED 0,11 0,0 1,0 0,09 0,09 0,13 0,13 0,18AGE AT IPO 8,47 0,0 62,3 5,25 10,41 8,68 11,48 10,71LOG ( TOTAL ASSETS) (t-1) 9,86 1,1 16,1 9,11 10,22 10,18 9,34 11,74LOG( REVENUES ) 8,79 14,2 4,0 8,56 9,09 9,35 6,54 10,31SMALL COMPANY 0,51 0,0 1,0 0,54 0,48 0,44 0,78 0,241997-1999 0,36 0,0 1,0 0,10 0,53 0,42 0,58 0,292001-2002 0,09 0,0 1,0 0,16 0,04 0,11 0,00 0,082003-2005 0,17 0,0 1,0 0,32 0,04 0,13 0,19 0,03Number of companies 578 182 143 151 64 38
EUROPE

20
Table 4. Correlation matrix of the variables used in the regressions.
1 2 3 4 5 6 7 8 9 10 11 12 13 14 15 16 17 181 TIME TO EXIT 1,0002 ACQUIRED -0,515 1,0003 BANKRUPCY/ VOLUNTARY LIQUIDATION -0,289 -0,341 1,0004 AT LEAST ONE PATENT APPLIC. 0,072 0,057 -0,116 1,0005 PATENTAPPLIED 0,093 -0,039 -0,051 0,281 1,0006 FORWARD CITATIONS 0,053 0,001 -0,038 0,192 0,718 1,0007 INTERNATIONAL APPL (PCT) 0,089 -0,032 -0,057 0,318 0,688 0,742 1,0008 RETURN ON SALES 0,047 -0,066 0,022 0,029 0,009 0,006 0,009 1,0009 POSITIVE RETURN ON SALES RATIO 0,122 -0,014 -0,125 0,017 0,077 0,064 0,069 0,074 1,000
10 EQUITY RATIO 0,067 0,035 -0,103 0,018 0,006 0,004 0,006 0,008 0,047 1,00011 LOG ( ASSETS ) 0,114 0,160 -0,254 0,031 0,121 0,108 0,091 -0,026 0,247 0,182 1,00012 LOG ( REVENUES ) 0,103 0,046 -0,135 0,058 0,092 0,079 0,054 0,203 0,283 0,084 0,649 1,00013 AGE AT IPO 0,162 0,003 -0,171 0,121 0,037 0,020 -0,013 0,035 0,132 0,041 0,115 0,166 1,00014 VENTURE BACKED -0,031 -0,012 -0,031 0,062 0,061 -0,024 -0,002 -0,166 0,028 0,013 0,045 -0,032 -0,050 1,00015 SMALL -0,048 -0,116 0,122 -0,056 -0,063 -0,065 -0,026 -0,058 -0,265 -0,043 -0,536 -0,744 -0,136 -0,034 1,00016 1997-1999 0,181 0,160 -0,116 0,064 0,068 0,045 0,006 0,043 0,026 0,031 0,161 0,104 0,221 -0,098 -0,056 1,00017 2001-2002 0,031 -0,125 0,091 -0,041 -0,029 -0,029 -0,032 0,017 -0,044 -0,130 -0,159 -0,058 -0,088 -0,074 0,078 -0,239 1,00018 2003-2005 -0,270 -0,092 0,005 0,034 -0,039 -0,034 -0,018 0,025 -0,028 0,017 -0,146 -0,065 -0,053 0,127 0,076 -0,332 -0,143 1,000
Table 5. First test of HP Assumption: nonzero slope of the scaled Schoenfeld residuals on time
VARIABLES ACQUIRED PH (Prob>chi2) FAILURE PH (Prob>chi2)
AT LEAST ONE PATENT APPLIC. 1.014 0.5009 0.945 0.6812(0.308) (0.798)
PATENTAPPLIED 0.955** 0.7527 0.805 0.2018(0.0208) (0.399)
SHARE OF PATENTS OBTAINED 1.446 0.2030 1.313 0.6950(0.512) (1.202)
FORWARD CITATIONS 1.005*** 0.5452 0.888 0.2033(0.00156) (0.0864)
INTERNATIONAL APPL (PCT) 0.903 0.8571 0.989 0.1723(0.0731) (0.612)
POSITIVE RETURN ON SALES RATIO 0.837 0.5407 0.607* 0.1412(0.117) (0.157)
EQUITY RATIO 0.999 0.5168 0.999** 0.1803(0.0213) (0.000284)
LOG ( ASSETS ) 1.050 0.7581 0.794*** 0.0084(0.0502) (0.0595)
LOG ( REVENUES) 0.895*** 0.1394 1.024 0.2064(0.0383) (0.0805)
SME 0.543*** 0.0376 0.630 0.6513(0.118) (0.228)
AGE AT IPO 0.988 0.6328 0.938*** 0.7588(0.00855) (0.0216)
VENTURE BACKED 0.863 0.8838 0.880 0.0139(0.196) (0.349)
1997-1999 1.394* 0.2744 1.117 0.6238(0.240) (0.374)
2001-2002 0.611 0.8356 0.755 0.4789(0.187) (0.250)
2003-2005 1.172 0.9160 0.805 0.1656(0.275) (0.299)
INTERNET RELATED 1.490** 0.3530 1.620* 0.4349(0.238) (0.416)
Industry activity 1- NACE Rev.2 (61-63) 1.673 0.6970 1.614 0.7109(0.528) (0.827)
Industry activity 2- NACE Rev.2 (69-73) 1.632 0.5810 1.454 0.6665(0.714) (1.072)
Industry activity 3- NACE Rev.2 (82-92) 3.403*** 0.6984 3.913** 0.6785(1.492) (2.649)
Industry activity 4- NACE Rev.2 (26-28) 1.619 0.4230 4.687** 0.2915(0.743) (3.454)
Industry activity 5- NACE Rev.2 (64) 2.340* 0.7866 2.859 0.8609(1.189) (2.094)
Industry activity 6- NACE Rev.2 (45-47) 1.328 0.4876 0.691 0.4901(0.588) (0.560)
DE 0.707* 0.0215 0.617 0.7074(0.145) (0.209)
FR 0.744 0.8267 0.601 0.7074(0.143) (0.209)
SE 0.819 0.3895 0.313** 0.0268(0.211) (0.169)
ITES 0.815 0.6216 0.446 0.8572(0.209) (0.360)
Observations 496 339N_fail 239 82ll -1363 -415.8chi2 52.63 207.4risk 1485337 1167516GLOBAL HP TEST 0.8110 0.3892Robust seeform in parentheses*** p<0.01, ** p<0.05, * p<0.1
Competing risks specificationDays to exit
Notes: Covariate-specific tests shown in gray do not comply with the proportionality assumption at the 10% level.

21
Table 6. Second test of Proportional Assumption: time-varying covariates
VARIABLES main Xi * ln(time) main Xi * ln(time)
AT LEAST ONE PATENT APPLIC. 0.733 1.000 0.191 1.001**(0.346) (0.000139) (0.254) (0.000338)
PATENTAPPLIED 0.950** 0.750(0.0231) (0.484)
SHARE OF PATENTS OBTAINED 1.498 1.277(0.558) (1.246)
FORWARD CITATIONS 1.006*** 0.861(0.00187) (0.103)
INTERNATIONAL APPL (PCT) 0.901 1.096(0.0766) (0.766)
POSITIVE RETURN ON SALES RATIO 0.842 0.600**(0.120) (0.155)
EQUITY RATIO 0.997 0.999**(0.0214) (0.000317)
LOG ( ASSETS ) 1.044 0.800***(0.0496) (0.0607)
LOG ( REVENUES) 0.898** 1.001(0.0378) (0.0836)
SME 0.828 1.000* 0.416 1.000(0.284) (0.000127) (0.230) (0.000220)
AGE AT IPO 0.988 0.938***(0.00869) (0.0201)
VENTURE BACKED 0.858 0.889(0.197) (0.348)
1997-1999 1.373* 1.124(0.237) (0.380)
2001-2002 0.619 0.766(0.191) (0.255)
2003-2005 1.176 0.836(0.277) (0.314)
INTERNET RELATED 1.514** 1.595*(0.244) (0.413)
Industry activity 1- NACE Rev.2 (61-63) 1.680 1.574(0.532) (0.813)
Industry activity 2- NACE Rev.2 (69-73) 1.711 1.494(0.758) (1.105)
Industry activity 3- NACE Rev.2 (82-92) 3.211*** 4.262**(1.408) (2.939)
Industry activity 4- NACE Rev.2 (26-28) 1.635 4.878**(0.745) (3.597)
Industry activity 5- NACE Rev.2 (64) 2.364* 2.839(1.213) (2.099)
Industry activity 6- NACE Rev.2 (45-47) 1.332 0.683(0.595) (0.559)
DE 1.206 1.000* 1.110 1.000(0.424) (0.000162) (0.678) (0.000303)
FR 0.606 1.000 0.592 1.000(0.228) (0.000163) (0.430) (0.000316)
SE 0.779 1.000 0.0343** 1.001*(0.370) (0.000204) (0.0463) (0.000521)
ITES 0.449 1.000 0.588 1.000(0.227) (0.000206) (0.592) (0.000393)
Observations 496 496 339 339N_fail 239 239 82 82ll -1356 -1356 -411.4 -411.4chi2 70.54 70.54 226.8 226.8risk 1485337 1485337 1167516 1167516Robust seeform in parentheses*** p<0.01, ** p<0.05, * p<0.1
Competing risks specificationDays to exit
Notes: Covariate-specific tests shown in gray do not comply with the proportionality assumption at the 10% level

22
Graphically assess proportional-hazards assumption Figure 1 At least one patent application versus zero patents (days to acquired)
02
46
4 5 6 7 8 9
ln(analysis time)
ATLEASTONEPATENT = 0 ATLEASTONEPATENT = 1
Figure 2 At least one patent application versus zero patents (days to failure)
02
46
4 5 6 7 8 9
ln(analysis time)
ATLEASTONEPATENT = 0 ATLEASTONEPATENT = 1
0.60
0.70
0.80
0.90
1.00
0 2000 4000 6000
analysis time
Observed: ATLEASTONEPATENT = 0 Observed: ATLEASTONEPATENT = 1
Predicted: ATLEASTONEPATENT = 0 Predicted: ATLEASTONEPATENT = 1
0.40
0.60
0.80
1.00
0 2000 4000 6000
analysis time
Observed: ATLEASTONEPATENT = 0 Observed: ATLEASTONEPATENT = 1
Predicted: ATLEASTONEPATENT = 0 Predicted: ATLEASTONEPATENT = 1
23
Figure 3 Small software company versus big company (days to acquired)
02
46
4 5 6 7 8 9
ln(analysis time)
small = 0 small = 1
Figure 4 Small software company versus big company (time to failure)
02
46
4 5 6 7 8 9
ln(analysis time)
small = 0 small = 1
0.40
0.60
0.80
1.00
0 2000 4000 6000
analysis time
Observed: small = 0 Observed: small = 1
Predicted: small = 0 Predicted: small = 1
0.20
0.40
0.60
0.80
1.00
0 2000 4000 6000
analysis time
Observed: small = 0 Observed: small = 1
Predicted: small = 0 Predicted: small = 1

24
Table 7. Results from a stratified Cox Proportional Hazards Regression
(1) (2) (3) (4)
VARIABLES ACQUIRED FAILURE ACQUIRED FAILURE
PATENTAPPLIED 0.937** 0.600* 0.936** 0.602*(0.0252) (0.168) (0.0256) (0.169)
SHARE OF PATENTS OBTAINED 1.755 1.306 1.851 1.309(0.694) (1.398) (0.758) (1.402)
FORWARD CITATIONS 1.006*** 0.842* 1.006*** 0.843*(0.00177) (0.0856) (0.00175) (0.0855)
INTERNATIONAL APPL (PCT) 0.918 1.432 0.932 1.429(0.0974) (0.724) (0.0970) (0.721)
POSITIVE RETURN ON SALES RATIO 0.879 0.581** 0.892 0.584**(0.122) (0.143) (0.123) (0.144)
EQUITY RATIO 1.001 0.999* 1.002 0.999*(0.0217) (0.000325) (0.0213) (0.000324)
LOG ( ASSETS ) 1.041 0.810*** 1.040 0.811***(0.0487) (0.0644) (0.0482) (0.0643)
LOG ( REVENUES ) 0.888*** 0.943 0.889*** 0.943(0.0344) (0.0813) (0.0343) (0.0810)
AGE AT IPO 0.985* 0.932*** 0.986 0.932***(0.00855) (0.0230) (0.00852) (0.0230)
VENTURE BACKED 0.875 0.879 0.892 0.869(0.201) (0.336) (0.204) (0.332)
1997-1999 1.338* 0.966 1.364* 0.964(0.226) (0.327) (0.229) (0.326)
2001-2002 0.623 0.709 0.623 0.699(0.186) (0.231) (0.186) (0.227)
2003-2005 1.145 0.923 1.143 0.921(0.274) (0.337) (0.274) (0.336)
INTERNET RELATED 1.474** 1.634* 1.432** 1.635*(0.232) (0.414) (0.224) (0.413)
Industry activity 1- NACE Rev.2 (61-63) 1.639 1.475 1.613 1.470(0.514) (0.739) (0.503) (0.737)
Industry activity 2- NACE Rev.2 (69-73) 1.595 1.423 1.545 1.416(0.683) (1.026) (0.660) (1.016)
Industry activity 3- NACE Rev.2 (82-92) 3.126*** 4.357** 3.107*** 4.332**(1.321) (3.139) (1.312) (3.117)
Industry activity 4- NACE Rev.2 (26-28) 1.719 4.708** 1.747 4.685**(0.756) (3.707) (0.760) (3.687)
Industry activity 5- NACE Rev.2 (64) 2.236 2.850 2.271 2.788(1.158) (2.031) (1.172) (1.988)
Industry activity 6- NACE Rev.2 (45-47) 1.454 0.992 1.498 0.998(0.625) (0.720) (0.638) (0.724)
Firms 496 339 496 339Exits 239 82 239 82Log likelihood -728.3 -246.9 -728.3 -247.3Wald chi2 58.32 97.24 56.38 97.48Time at risk 1485337 1167516 48586 38233Test of proportional-hazards assumption (Prob>chi2) 0.9815 0.9248 0.9825 0.9298Robust standard errors in parentheses*** p<0.01, ** p<0.05, * p<0.1
Days to exit Months to exit

25
Table 8. Results based on the stratified Cox competing risk model.
(5) (6) (7) (8)
VARIABLES ACQUIRED FAILURE ACQUIRED FAILURE
PATENTAPPLIED 0.937** 0.598* 0.936** 0.600*(0.0253) (0.167) (0.0256) (0.167)
SHARE OF PATENTS OBTAINED 1.758 1.312 1.850 1.313(0.696) (1.414) (0.762) (1.418)
FORWARD CITATIONS 1.006*** 0.843* 1.006*** 0.843*(0.00177) (0.0854) (0.00176) (0.0853)
INTERNATIONAL APPL (PCT) 0.919 1.429 0.931 1.424(0.0975) (0.724) (0.0977) (0.721)
POSITIVE RETURN ON SALES RATIO 0.879 0.578** 0.894 0.580**(0.122) (0.143) (0.124) (0.143)
EQUITY RATIO 1.001 0.999 1.002 0.999*(0.0218) (0.000326) (0.0215) (0.000337)
LOG ( ASSETS ) 1.041 0.810*** 1.041 0.812***(0.0489) (0.0651) (0.0488) (0.0651)
LOG ( REVENUES ) 0.887*** 0.943 0.887*** 0.944(0.0344) (0.0824) (0.0346) (0.0823)
AGE AT IPO 0.985* 0.932*** 0.986 0.932***(0.00857) (0.0232) (0.00857) (0.0233)
VENTURE BACKED 0.870 0.908 0.887 0.901(0.201) (0.348) (0.205) (0.345)
1997-1999 1.339* 0.969 1.367* 0.967(0.226) (0.329) (0.231) (0.328)
2001-2002 0.623 0.745 0.626 0.738(0.187) (0.249) (0.188) (0.246)
2003-2005 1.145 0.910 1.148 0.912(0.275) (0.340) (0.277) (0.341)
INTERNET RELATED 1.479** 1.638* 1.444** 1.636*(0.234) (0.420) (0.229) (0.419)
Industry activity 1- NACE Rev.2 (61-63) 1.647 1.493 1.625 1.491(0.517) (0.747) (0.509) (0.747)
Industry activity 2- NACE Rev.2 (69-73) 1.594 1.433 1.554 1.427(0.684) (1.040) (0.668) (1.034)
Industry activity 3- NACE Rev.2 (82-92) 3.131*** 4.472** 3.116*** 4.453**(1.324) (3.240) (1.322) (3.225)
Industry activity 4- NACE Rev.2 (26-28) 1.723 4.823** 1.755 4.806**(0.758) (3.815) (0.768) (3.798)
Industry activity 5- NACE Rev.2 (64) 2.233 3.059 2.262 3.008(1.157) (2.171) (1.170) (2.133)
Industry activity 6- NACE Rev.2 (45-47) 1.461 0.973 1.514 0.977(0.630) (0.708) (0.649) (0.710)
Firms 578 578 578 578Exits 239 82 239 82Log likelihood -727.7 -245.5 -726.7 -245.6Wald chi2 58.46 96.09 56.27 95.75Time at risk 1633767 1633767 53439 53439Test of proportional-hazards assumption (Prob>chi2) 0.9809 0.9817 0.9205 0.9240Robust standard errors in parentheses*** p<0.01, ** p<0.05, * p<0.1
Days to exit Months to exit
Notes: Results are based on the stratified Cox competing risk model where the Efron method was employed for handling ties. All models were stratified by country, at least one patent application, SME and the competing risk.
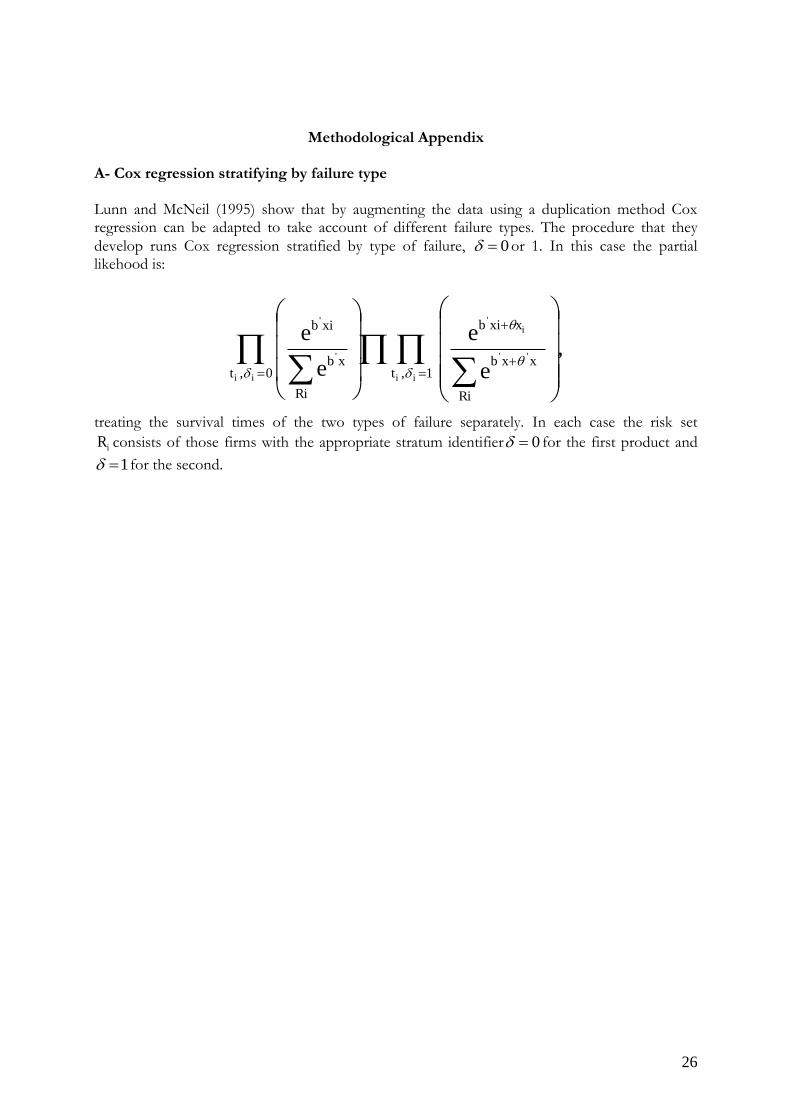
26
Methodological Appendix A- Cox regression stratifying by failure type Lunn and McNeil (1995) show that by augmenting the data using a duplication method Cox regression can be adapted to take account of different failure types. The procedure that they develop runs Cox regression stratified by type of failure, 0 or 1. In this case the partial likehood is:
,''
'
'
'
1,0,
Ri
xxb
xxib
tt
Ri
xb
xib
e
e
e
e i
iiii
treating the survival times of the two types of failure separately. In each case the risk set
iR consists of those firms with the appropriate stratum identifier 0 for the first product and
1 for the second.