pasture, rangeland, forage rainfall index plan of insurance
DESCRIPTION
Pasture, Rangeland, Forage Rainfall Index Plan of Insurance. This presentation does not replace or supersede any procedures or modify any provisions contained in the complete insurance policy. Introduction and Program Overview. Introduction and Overview Science Behind the Program - PowerPoint PPT PresentationTRANSCRIPT

1
Pasture, Rangeland, Forage Rainfall Index Plan of Insurance
This presentation does not replace or supersede any procedures or modify any provisions contained in the complete insurance policy.

2
Introduction and Program Overview
Introduction and OverviewScience Behind the Program
Program BasicsAdditional Tools and Information
Detailed Example

3
Introduction Beginning with the 2007 Crop Year

4
Challenges
Crop challenges Various plant species Timing of plant growth Crop continuously harvested via livestock Lack of individual/industry data Vast range of management practices across the industry Publicly announced prices not available

5
Crop Types Grazingland
Established acreage of perennial forage Intended for grazing by livestock Acreage must be suitable for grazing
Hayland Established acreage of perennial forage Intended for haying Acreage must be suitable for haying

6
Program Overview GRP program
Group plan Losses cover an area
No individual coverage Index – based on precipitation
Not measuring actual individual production
No loss adjustments, records, etc. Timely payments Does not reward poor management practices
7
Program Overview Index background
Lack of actual producer/industry production data No consistent and sound methodology for measuring
production for the crop The deviation from long-term normal precipitation is
used to establish the index SINGLE PERIL COVERAGE
Precipitation has a high degree of correlation to forage production

8
Program Overview Area of insurance = ~ 12 x 12 mile grids

9
Program Overview Index Intervals
Multiple Intervals offered – 6
Crop year divided into 6, 2-month Intervals for each grid
Ability for producers to manage appropriate timing risks Correlate to individual growth patterns and
production seasons
The 2-month Intervals provide for greater reaction to precipitation events vs. a yearly average

10
Program Overview Index Intervals
Intervals
Crop Year
12 months
6, 2-month
Begins February 1st
I II III IV V VI

11
Program Overview Index Intervals
Producers must select at least 2 Intervals The purpose of the program is to insure annual forage
production Total annual forage production is influenced by precipitation
in more than one 2-month Interval; therefore, producers are required to insure in more than one Interval
Maximum percentages are region specific Based on growing season (50 – 70%)

12
Program Overview Index Intervals
Minimizes dependency on subjective pre-determined forage growing seasons
Maintains consistency across the country
Allows for regional and local variances Allows individual freedom to select appropriate Intervals
Index Intervals are mutually exclusive One index does not effect the others All rated separately These Intervals act as ‘mini-insurance periods’

13
Index Intervals
INDEX INTERVALSINDEX INTERVALS START DATESTART DATE END DATEEND DATE(221) Index Interval I February 1 March 31(222) Index Interval II April 1 May 31(223) Index Interval III June 1 July 31(224) Index Interval IV August 1 September 30(225) Index Interval V October 1 November 30(226) Index Interval VI December 1 January 31
I II III IV V VI
14
Program Overview Coverage Levels
Percentages available: 90, 85, 80, 75, and 70 Consistent with other GRP programs Higher coverage levels reduce basis risk
Correlates closer to individual experience
Sales Closing Date and Acreage Reporting Date November 30th

15
Program Overview
Rating Each grid, Index Interval, and coverage level is
individually rated No economic advantage of insuring in one scenario vs.
another Encourages producers to select a scenario that best
mitigates their operation/production risks
16
Program Overview Not required to insure 100% of acreage
Forage utilized in the annual grazing or hay cycle can be insured without insuring all acreage
All acres within a property may not be productive, e.g., rocky areas, submerged areas
Provides additional flexibility for the insured to design the coverage to his specific needs
Because the program is a group program and other programs are not available, there is no opportunity to ‘move’ production

17
Program Overview Program supported via internet
Provides the most efficient and effective way to deliver the program
Allows access to the mapping tools Locate grazing areas and associated Grid ID
numbers
Provides access to the historical indices
Allows access to all relevant data, materials, and tools associated with the program

18
Science and Technology Behind Science and Technology Behind the Programthe Program

19
Crop Biology The program addresses forage-based production
systems on land areas producing primarily perennial vegetation
Comprised of diverse plant communities and
mixtures: Perennial and annual Warm season and cool season Different growth habits over extended time periods
Because of the nature of forage-based systems, the program is designed to insure annual production

20
Program Technology Precipitation is highly correlated with forage
production, but does not directly predict actual forage production
Index starts accumulating on the first day of the specified Interval through the last day of the same Interval Influence of extreme precipitation events is effectively
reduced At the end of each 2-month Interval the percent of normal is
calculated
21
Program Technology Daily historical data since 1948
Data updated daily
Data is interpolated by NOAA into weather grids nationwide ~ 12 x 12 miles in size (0.25o data), and used in many
other national programs

22
Grid Example for North Dakota

23
Program BasicsProgram Basics

24
Basic Definitions Insurable Acreage:Insurable Acreage: Hayland and grazingland
that is not planted annually Overseeding into acreage of existing forage crops
is acceptable Annually planted crops currently not insurable Insurable acres will consist of the total number of
acres suitable for insurance under these crop provisions Includes both insured acres and uninsured
acres

25
Basic Definitions Insured Acres:Insured Acres: The number of insurable acres
selected to be insured by a producer May choose to insure either Grazingland, Hayland, or
both
Not required to insure 100% of the crop type(s) If the insured chooses to insure the crop types under
this policy they cannot insure the same crop under any other FCIC subsidized program

26
Basic Definitions County Base Value:County Base Value: Established production value of
grazingland and hayland forage Only one value per county for each crop type
Productivity FactorProductivity Factor:: A percentage multiplier allowing the insured to individualize coverage based on their individual crop productivity Insured selects between 60% and 150%
Only one productivity factor may be selected per county and crop type

27
Basic Definitions Policy Protection per Unit: Dollar amount of protection per
acre, multiplied by the insured acres, multiplied by the producer’s share of the unit for each grid
EXAMPLE: $ Amount of Protection/ac = $18.00, Insured Acres = 1,000, Share = 100%, 50% Interval II, 50% Interval III
For: Index Interval II: $18.00 x 500 ac x 100% (share) = $9,000 Index Interval III: $18.00 x 500 ac x 100% (share) = $9,000
Policy Protection: The sum of the policy protection per units ($18,000)

28
Program Dates
08/31
Contract Change
11/30
Sales Closing / Acreage
Reporting
02/01
Start of Crop Year
10/01
Premium Billing
01/31
End of Crop Year

29
Index Definitions Expected Grid Index:Expected Grid Index: Based on the historical mean
accumulated precipitation by Index Interval, expressed as a percentage; EGI = 100
Final Grid Index:Final Grid Index: Based on the current accumulated precipitation data for each Index Interval If current data represents a 40% reduction, then FGI = 60
Trigger Grid Index:Trigger Grid Index: The selected coverage level multiplied by the Expected Grid Index i.e. - Coverage Level = 85; then Trigger Grid Index = 85 If the final grid index falls below the trigger grid index, the
insured may be due an indemnity

30
Rates and Premiums Premium Rate
Applied to cover risk Based on the level of risk with each scenario Each scenario independently rated
Not an application fee (ie., NAP) Subsidy
Premium is subsidized by USDACoverage Level Subsidy
70% 64%
75% 64%
80% 59%
85% 59%
90% 55%

31
Trigger and Indemnity ExampleEXAMPLE:EXAMPLE:
Trigger Grid Index (Coverage Level) = 85
Final Grid Index: Interval II = 90, Interval III = 60Payment Calculation Factor =
Index Interval II: (85 – 90)/85 = No indemnity due (90 > TGI)
Index Interval III: (85 – 60)/85 = 0.294
Total Indemnity = $2,646 Index Interval II = $0
Index Interval III = ($9,000 x 0.294) = $2,646
{$18.00 x 500 (acres in III) x 1.0 (share)} x 0.294 = $2,646

32
Grid ID Selection Grid ID: A specific code associated with each
grid
Point of Reference: A designated point, identifiable by longitude and latitude Selected by the insured Point that best represents the insured acreage This determines the Grid ID for insurance

33
Grid ID Selection Certify the points of reference are representative
of the acreage assigned to each Grid ID and the amount of acreage in each Grid ID(s) Example:Example: if the contiguous acreage is located in four
grids the acreage can be separated into two, three, or four grids – or left all in one grid
The same acres cannot be insured in more than one Grid ID or county
Determine the point of reference and corresponding Grid ID by Sales Closing Date

34
Examples of Determining Grid ID(s) Contiguous Acreage – One Grid The insured picks one point of reference on the property
Grid 1 Grid 2
Grid 3 Grid 4
50 Acres
+

35
Examples of Determining Grid ID(s) Contiguous Acreage – Multiple Grids, Counties, and/or States
(Combined) The insured picks one point of reference in the contiguous
acreage (could pick Grid 1 or Grid 2)
Grid 1 Grid 2
Grid 3 Grid 4
50 Acres
+

36
Examples of Determining Grid ID(s) Contiguous Acreage – Multiple Grids, Counties, and/or States (Separated) The insured selects one point of reference in each Grid and assigns the
number of acres
Grid 1 Grid 2
Grid 3 Grid 4
35 Acres+
+
15 Acres

37
Examples of Determining Grid ID(s) Determining the Grid ID (s) for Non-Contiguous
Acreage (multiple properties) A point of reference must be selected for each separate,
non-contiguous acreage The steps in determining the point of reference are similar
to the steps outlined for contiguous acreage, simply repeated for each non-contiguous acreage to be insured

38
Examples of Determining Grid ID(s) The insured has two separate acreage locations in two grids The insured picks a point of reference in Grid 1 and a point of
reference in Grid 4 and insures the two properties under two separate Grid ID’s
Grid 1 Grid 2
Grid 3 Grid 4
50 Acres+
50 Acres+

39
Examples of Determining Grid ID(s) The insured has two separate acreage locations in three grids First, the insured would pick a point of reference in Grid 4 The insured then has the option of combining his acreage in
Grid 1 and Grid 2, or insuring them separately by grid
Grid 1 Grid 2
Grid 3 Grid 4
35 Acres+
50 Acres+
+
15 Acres

40
Examples of Determining Grid ID(s) If the non-contiguous acreage is located in the same grid The non-contiguous acreage will be combined and given a
single Grid ID
Grid 1 Grid 2
Grid 3 Grid 4
25 Acres
25 Acres
+
+
41
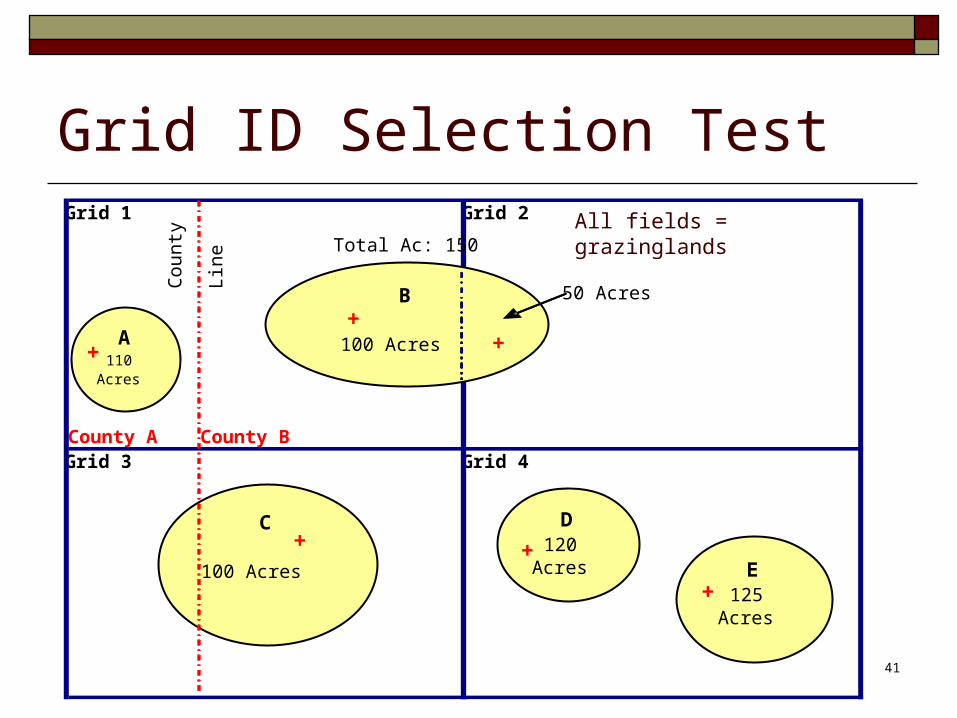
Grid ID Selection TestGrid 1 Grid 2
Cou
nty
Line
County A County BGrid 3 Grid 4
B
100 Acres+
D120
Acres+
+
50 Acres
C
100 Acres
+
A110
Acres
+
E125
Acres+
Total Ac: 150All fields = grazinglands

42
Grid ID Selection TestGrid 1 Grid 2
Cou
nty
Line
County A County BGrid 3 Grid 4
B
100 Acres+
D120
Acres+
+
50 Acres
C
100 Acres
+
A110
Acres
+
E125
Acres+
+
40 Acres Hayland
Total Ac: 150
Total Ac: 140

43
Use of the Website and Use of the Website and Information NeededInformation Needed

44
Topographical Map

45
Determining Grid ID(s) – Basic Steps Type in the city and/or county name where the property is located
Select the city or county from the possible matches, a topo map for the area will be displayed
Narrow the search by selecting an area near the actual location of the insured’s property
Once the applicant has located the general area, it is recommended they continue to refine the search by switching to the photo maps
Using the topo map, photo map, or combination of both, choose an appropriate resolution for proper identification of the property boundaries and corresponding Grid ID(s)

46
Photo Map

47
Determining Grid ID(s) – Additional Steps The insured then selects one point of reference on the property
by moving the cross marker (‘+’) to that location Grid ID is listed at the top of the screen (and on the map itself)
A Print Icon is in the lower right hand corner of the screen This printed map can be used as a record to verify the Grid ID Once printed, the property boundary can also be outlined and initialed
by the insured for verification purposes
The insured must certify the point of reference

48
Information Agents Need to Collect Insurable Acres per County Share Producer Selections (for each County/State combination):
Crop Type Grid IDs Coverage Level Productivity Factor Index Intervals Insured Acres Amount of Insurance per Index Interval

49
Worksheet Information - Completed
50
Additional Program Tools and Additional Program Tools and InformationInformation

51
PRF - Rainfall Index Decision Tool The calculator is not part of the program
Not required to buy insurance Provides estimates Values are based on current information to derive
historical estimates of indemnity, premium, and subsidy numbers
May not match the official figures released by FCIC in past years
Contact a qualified insurance agent for actual premium quotes

52
Decision Tool: Example
Base information provided
Input information in all the yellow fields

53
Decision Tool: Example
Insert the number of acres for each Index Interval (percentages allowed specified in the Special Provisions)
Results
Once information is entered, click Submit Query
(if any information is changed must resubmit query)

54
Additional Information Historical Index
Lookup values since 1948
Lookup Grid ID using Longitude/Latitude Must be submitted in the correct data format
RMA premium calculator
55
Summary A new program for a commodity with little or no history of
crop insurance GRP based program Losses determined by index (not individual production) Terminology differences Producer is allowed or required to make choices Can tailor the program to producer risk management needs

56
Joe Rancher Contacts His AgentJoe Rancher Contacts His Agent
A step-by-step example

57
Determining Grid ID’s Joe Rancher has 645
acres of insurable grazingland and hayland in two counties. His insurable acreage is contained in five non-contiguous properties: A, B, C, D, and E.
Note: Actual Grid IDs will have 5 digits.
Grid 1 Grid 2
Cou
nty
Line
County A County BGrid 3 Grid 4
B
100 Acres+
D120
Acres+
+
50 Acres
C
100 Acres
+
A110
Acres
+
E125
Acres+
+
40 Acres Hayland
Total Ac: 150
Total Ac: 140
50% share

58
Decision Joe Rancher decides to insure the four properties (535
insurable acres) located in County B and leave property A uninsured in County A
Had he chosen to insure Property A in County A, he would have had to insure that acreage separately because Property A is non-contiguous from his other properties and located in a different county

59
Decision Property B – Contiguous acreage located in more than one
grid Decides to separate the property into two Grid IDs, with 100
insured acreage in Grid 1 and 50 insured acreage in Grid 2. He picks a reference point in each grid
Grid 1 Grid 2
Cou
nty
Line
County A County BGrid 3 Grid 4
B
100 Acres+
D120
Acres+
+
50 Acres
C
100 Acres
+
A110
Acres
+
E125
Acres+
+
40 Acres Hayland
Total Ac: 150
Total Ac: 140
50% share
Grid 1 Grid 2
Cou
nty
Line
County A County BGrid 3 Grid 4
B
100 Acres+
D120
Acres+
+
50 Acres
C
100 Acres
+
A110
Acres
+
E125
Acres+
+
40 Acres Hayland
Total Ac: 150
Total Ac: 140
Grid 1 Grid 2
Cou
nty
Line
County A County BGrid 3 Grid 4
B
100 Acres+
D120
Acres+
+
50 Acres
C
100 Acres
+
A110
Acres
+
E125
Acres+
+
40 Acres Hayland
Grid 1 Grid 2
Cou
nty
Line
County A County BGrid 3 Grid 4
B
100 Acres+
D120
Acres+
+
50 Acres
C
100 Acres
+
A110
Acres
+
E125
Acres+
+
Grid 1 Grid 2
Cou
nty
Line
County A County BGrid 3 Grid 4
B
100 Acres+
D120
Acres+
+
50 Acres
C
100 Acres
+
A110
Acres
+
E125
Acres+
Grid 1 Grid 2
Cou
nty
Line
County A County BGrid 3 Grid 4
B
100 Acres+
D120
Acres+
+
50 Acres
C
100 Acres
+
A110
Acres
+
E125
Acres+
Grid 1 Grid 2
Cou
nty
Line
County A County BGrid 3 Grid 4
B
100 Acres+
D120
Acres+
+
50 Acres
C
100 Acres
+
A110
Acres
+
E125
Acres+
+
40 Acres Hayland40 Acres Hayland
Total Ac: 150
Total Ac: 140
50% share

60
Decision Property C – Contiguous acreage spread into more than one
county, which contains two crop types (both grazingland and hayland with 50% share) Decides to pick a point of reference in County B and use that
point of reference to represent all the contiguous insurable grazingland acreage (100 acres) in both County A and County B (decides not to insure haylands)
Grid 1 Grid 2
Cou
nty
Line
County A County BGrid 3 Grid 4
B
100 Acres+
D120
Acres+
+
50 Acres
C
100 Acres
+
A110
Acres
+
E125
Acres+
+
40 Acres Hayland
Total Ac: 150
Total Ac: 140
50% share
Grid 1 Grid 2
Cou
nty
Line
County A County BGrid 3 Grid 4
B
100 Acres+
D120
Acres+
+
50 Acres
C
100 Acres
+
A110
Acres
+
E125
Acres+
+
40 Acres Hayland
Total Ac: 150
Total Ac: 140
Grid 1 Grid 2
Cou
nty
Line
County A County BGrid 3 Grid 4
B
100 Acres+
D120
Acres+
+
50 Acres
C
100 Acres
+
A110
Acres
+
E125
Acres+
+
40 Acres Hayland
Grid 1 Grid 2
Cou
nty
Line
County A County BGrid 3 Grid 4
B
100 Acres+
D120
Acres+
+
50 Acres
C
100 Acres
+
A110
Acres
+
E125
Acres+
+
Grid 1 Grid 2
Cou
nty
Line
County A County BGrid 3 Grid 4
B
100 Acres+
D120
Acres+
+
50 Acres
C
100 Acres
+
A110
Acres
+
E125
Acres+
Grid 1 Grid 2
Cou
nty
Line
County A County BGrid 3 Grid 4
B
100 Acres+
D120
Acres+
+
50 Acres
C
100 Acres
+
A110
Acres
+
E125
Acres+
Grid 1 Grid 2
Cou
nty
Line
County A County BGrid 3 Grid 4
B
100 Acres+
D120
Acres+
+
50 Acres
C
100 Acres
+
A110
Acres
+
E125
Acres+
+
40 Acres Hayland40 Acres Hayland
Total Ac: 150
Total Ac: 140
50% share

61
Decision Property D and E – Non-Contiguous acreage located in a
single grid (both grazingland with 100% share) Joe Rancher combines Properties D and E and insures all 245
acres under Grid ID 4
Grid 1 Grid 2
Cou
nty
Lin
e
County A County BGrid 3 Grid 4
B
100 Acres+
D120
Acres+
+
50 Acres
C
100 Acres
+
A110
Acres
+
E125
Acres+
+
40 Acres Hayland
50% share
Grid 1 Grid 2
Cou
nty
Lin
e
County A County BGrid 3 Grid 4
B
100 Acres+
D120
Acres+
+
50 Acres
C
100 Acres
+
A110
Acres
+
E125
Acres+
+
40 Acres Hayland
Grid 1 Grid 2
Cou
nty
Lin
e
County A County BGrid 3 Grid 4
B
100 Acres+
D120
Acres+
+
50 Acres
C
100 Acres
+
A110
Acres
+
E125
Acres+
+
Grid 1 Grid 2
Cou
nty
Lin
e
County A County BGrid 3 Grid 4
B
100 Acres+
D120
Acres+
+
50 Acres
C
100 Acres
+
A110
Acres
+
E125
Acres+
Grid 1 Grid 2
Cou
nty
Lin
e
County A County BGrid 3 Grid 4
B
100 Acres+
D120
Acres+
+
50 Acres
C
100 Acres
+
A110
Acres
+
E125
Acres+
Grid 1 Grid 2
Cou
nty
Lin
e
County A County BGrid 3 Grid 4
B
100 Acres+
D120
Acres+
+
50 Acres
C
100 Acres
+
A110
Acres
+
E125
Acres+
+
40 Acres Hayland40 Acres Hayland
50% share

62
Summary
Joe Rancher selects for grazingland:Coverage Level = 85%Productivity Factor = 120%County Base Value = $17.65
Dollar Amount of Production per Acre= $17.65 x 0.85 x 1.20= $18.00 per Acre
Insured Acreage, Grid ID, Coverage Level, Productivity Factor, $ of Protection/AcGrid ID Property Insured Acreage Grid 1 (insert the actual Grid ID number for the insured, i.e. 37881)
B 100
Grid 2 (insert the actual Grid ID number for the insured, i.e. 37882)
B 50
Grid 3 (insert the actual Grid ID number for the insured, i.e. 38773)
C 100
Grid 4 (insert the actual Grid ID number for the insured, i.e. 38774)
D & E 245
Total 495

63
SummaryDesignates specific
percentage of the insured acreage to at least two of the Index Intervals for each Grid ID
He finds that he can place no more than 50% of his insured acreage to any one Index Interval
Note: Interval selections do not have to be contiguous

64
Policy Protection per Unit (10 Units)
65
Premium Joe Rancher and his agent look up the applicable
premium rates using the premium rate tables
Premium/unit (Index Interval) = $ amount of protection/acre x number of insured acres/unit x premium rate x adjustment factor of 0.01x share

66
Summary of Premium

67
Premium Subsidy Amount Joe Rancher and his agent refer to the GRP subsidy
tables For the coverage level of 85%, the applicable subsidy
percentage is 59%
Premium Subsidy/Unit = Premium/unit x subsidy percentage
Example: $108 x 0.59 = $64

68
Premium Due from Producer The Premium due from Producer is the result of the
Premium/unit minus the Subsidy/unit
Premium per unit – Premium subsidy per unit
Example: $108 - $64 = $44
They sum the Subsidy and Producer Premiums to determine the Totals

69
Summary of Premium, Subsidy, and Producer Premium

70
Worksheet with All Information

71
Final Grid Index and Final Grid Index and IndemnitiesIndemnities

72
Final and Trigger Grid Index Trigger Grid Index
is 85 for all grids and Index Intervals

73
Calculating Indemnities Payment calculation factorPayment calculation factor =
(trigger grid index – final grid index)
trigger grid index
Indemnity payment = Indemnity payment =
payment calculation factor
x Policy protection per unit

74
Example Calculations Grid 4 – 245 Acres Index Interval I: The final grid index of 120 is above the trigger grid index of
85. No indemnity is due
Index Interval II: The final grid index of 70 is below the trigger grid index of 85
Payment calculation factor = (85 – 70) / 85 = 0.176
Indemnity payment = 0.176 x $1,323 = $233
Index Interval III: The final grid index of 60 is below the trigger grid index of 85
Payment calculation factor = (85 – 60) / 85 = 0.294
Indemnity payment = 0.294 x $882 = $259
75
Summary of Yearly Policy in Example Joe Rancher insured 495 acres of grazingland
in Four separate Grid ID’s
Joe Rancher paid $437 in premium for $8,010 in protection
A total indemnity of $687 will be due to Joe Rancher for this County and Crop Year

76
QuestionsQuestions