partners in growth - toronto financial services … · contents i executive summary chapter 1 1...
TRANSCRIPT

REPORT NOVEMBER 2017
Partners in Growth.2017 Report Card on Canada and Toronto’s Financial Services Sector

Partners in Growth: 2017 Report Card on Canada and Toronto’s Financial Services Sector Michael Burt and Richard Forbes
Preface
Financial services are a critical component of the Canadian economy. The sector directly accounted for 4.5 per cent of Canadian employment and 7.2 per cent of GDP in 2016 and has been a source of growth for Canada in recent years. This report examines how the financial services sector supports small and medium-sized enterprises in Canada. The report also considers the sector’s international trade and investment performance. Finally, Toronto’s role in Canada’s financial services sector is assessed. This includes examining the sector’s importance to Toronto’s economy, as well as how Toronto compares with other international financial centres.
To cite this report: Burt, Michael, and Richard Forbes. Partners in Growth: 2017 Report Card on Canada and Toronto’s Financial Services Sector. Ottawa: The Conference Board of Canada, 2017.
©2017 The Conference Board of Canada* Published in Canada | All rights reserved | Agreement No. 40063028 | *Incorporated as AERIC Inc.
An accessible version of this document for the visually impaired is available upon request. Accessibility Officer, The Conference Board of Canada Tel.: 613-526-3280 or 1-866-711-2262 E-mail: [email protected]
®The Conference Board of Canada and the torch logo are registered trademarks of The Conference Board, Inc. Forecasts and research often involve numerous assumptions and data sources, and are subject to inherent risks and uncertainties. This information is not intended as specific investment, accounting, legal, or tax advice. The findings and conclusions of this report do not necessarily reflect the views of the external reviewers, advisors, or investors. Any errors or omissions in fact or interpretation remain the sole responsibility of The Conference Board of Canada.

CONTENTS
i EXECUTIVE SUMMARY
Chapter 1 1 Introduction
Chapter 2 4 Financial Services’ Role Among SMEs 6 Debt Financing 10 Equity Financing 13 Insurance 16 Additional Services
Chapter 3 21 Canada’s Financial Sector in a Global Context 22 Building a Global Presence Through Foreign Affiliates 26 Building a Global Presence Through Exports
Chapter 4 29 Toronto’s Role in Canada’s Financial Services Sector 30 Economic and Fiscal Impacts of the Sector in Toronto 42 Structure of Toronto’s Sector
Chapter 5 45 Toronto as a Global Financial Centre 50 Employment in Global Financial Centres
Chapter 6 54 Conclusion
Appendix A 58 Bibliography
Appendix B 63 Additional Data Tables

AcknowledgementsThis is the fifth annual report card on Toronto’s financial services sector. The Conference Board of Canada would like to thank the Toronto Financial Services Alliance (TFSA), whose funding and ongoing support has facilitated this report each year of its existence. In keeping with Conference Board guidelines for financed research, the design and method of research, as well as the content of this report, were determined solely by the Conference Board. The report was written by Michael Burt, and Richard Forbes.
About the Toronto Financial Services Alliance
The Toronto Financial Services Alliance (TFSA) is a unique, public-private partnership dedicated to growing Toronto region’s financial services cluster and building it as a global financial services centre. Established in 2001, TFSA is a collaboration involving three levels of government, the financial services industry, and academia.
Find Conference Board research at www.e-library.ca.
EXECUTIVE SUMMARY
Partners in Growth: 2017 Report Card on Canada and Toronto’s Financial Services Sector
At a Glance
• Small and medium-sized enterprises (SMEs) are the backbone of the Canadian economy and rely on financial institutions for an array of services. The financial services sector is a key part of SMEs fully realizing their potential.
• Financial services are a large and growing part of Canada’s international trade and investment profile. They are Canada’s largest and fastest-growing services export category and account for 48 per cent of Canada’s stock of outward foreign direct investment.
• Toronto is Canada’s leading financial centre and its relative importance in Canada has grown.
• Toronto ranks highly relative to other global financial centres. For example, the Global Financial Centres Index ranked Toronto’s financial sector seventh in the world.
PARTNERS IN GROwTh2017 Report Card on Canada and Toronto’s Financial Services Sector
Find Conference Board research at www.e-library.ca. ii
Financial services are a critical component of the Canadian economy. The sector directly accounted for 4.5 per cent of Canadian employment in 2016, at 808,100 jobs, and 7.2 per cent of Canadian GDP. What is more, the sector has been a source of growth for Canada in recent years. For example, sector employment has risen by 10.5 per cent since 2006; only a handful of sectors, such as mining, oil, and gas; health care; and professional services, have experienced stronger growth.
But the sector’s role goes well beyond the jobs it supports and the GDP
it generates. A well-functioning financial services sector is a critical
ingredient in a successful economy, as it links the economy together in
a unique way. Financial services are a necessary input for every single
business across the country and are used by essentially every adult
individual. Only a few other sectors, such as telecommunications and
transportation, have the same impact on the day-to-day functioning of
the economy.
Given the importance of the sector, the purpose of this report is
threefold. First, we examine the role of the sector in enabling the
growth and prosperity of SMEs. These businesses are core drivers of
employment and economic growth. Second, we consider the sector’s
international trade and investment performance. Finally, we assess
Toronto’s role in Canada’s financial services sector. This includes
examining the sector’s importance to Toronto’s economy, as well as how
Toronto compares to other international financial centres.
Financial Services’ Role Among SMEs
SMEs comprise 99.7 per cent of all businesses in Canada and are often
considered to be the backbone of the Canadian economy. Much of
Canada’s reputation as a global leader in innovation is attributed to the
opportunity that SMEs are given to prosper here. Financial institutions
Executive Summary | The Conference Board of Canada
Find Conference Board research at www.e-library.ca. iii
are often a key part of the successful exploitation of the opportunities
that Canadian SMEs represent.
First and foremost, financial firms play a critical role in helping SMEs
raise the capital they need for day-to-day operations and growth-oriented
investment. Debt is the most common way for SMEs to raise the capital
they need, with credit cards and lines of credit being the instruments
most commonly used to fund working capital and purchase needed
machinery and equipment. Available credit for SMEs has steadily
expanded in recent years, reaching $243 billion at the end of 2016.
Although equity financing is far less frequently sought by SMEs, the
amounts raised tend to be much larger. Financial institutions often play
a role in facilitating the transaction when firms seek to raise equity,
and they may themselves take equity stakes in firms. Combined,
private equity, the TSX venture exchange, and venture capital supplied
$21 billion in equity financing to Canadian SMEs in 2016. In addition,
although the values are much smaller, angel investing and crowdfunding
are other forms of equity financing for SMEs that are growing
in importance.
Insurance products are also important, as they help SMEs to assess
and mitigate their risks. Beyond standard property and liability products,
there are a variety of products, such as professional liability, crop, and
business continuity insurance, that are more likely to be used by SMEs.
As well, benefits provided by insurance firms, such as life and health
insurance, and group RRSPs assist SMEs in attracting and retaining the
workers they need.
Financial institutions also provide other services beyond the core
banking and insurance offerings. Transaction processing, trade
facilitation, hedging, and succession planning are examples of other
services that are important to SMEs. Ultimately, these activities are
about helping SMEs to be successful by expanding their markets,
reducing their volatility, and managing their costs.
Financial firms play a critical role in helping SMEs raise the capital they need.
PARTNERS IN GROwTh2017 Report Card on Canada and Toronto’s Financial Services Sector
Find Conference Board research at www.e-library.ca. iv
Trade and Investment Performance
Financial services are a large and growing part of Canada’s international
trade and investment profile. The principal means by which Canadian
financial institutions expand their international footprint is by undertaking
investments to establish foreign affiliates. In fact, 48 per cent of Canada’s
stock of outward foreign direct investment (FDI) is attributable to the
financial services sector. At $505 billion in 2016, Canada’s stock of
financial services outward FDI has more than doubled since 2006 and
is now more than twice as large as our inward stock. In other words,
Canada is a large and growing net exporter of financial services capital.
As a result of these investments, Canada’s financial services foreign
affiliate sales have steadily grown; they now account for 18 per cent of
Canada’s total foreign affiliate sales. At $95 billion in 2014—the most
recent year with available data—the sector’s foreign affiliate sales were
about 10 times the size of its exports. however, the sector’s exports
have also grown significantly, more than doubling in the past decade
and driven in large part by “other financial services,” which include
items such as securities issuance and trading and asset management
services. In fact, financial services are Canada’s largest and fastest-
growing services export category.
Toronto’s Role in Canada’s Financial Services Sector
Toronto is the major hub for financial services in Canada. For example,
the metro area accounts for 33.7 per cent of Canada’s financial services
employment. what is more, the sector has become more concentrated
in Toronto over the past decade. As a result, at 272,280 employees, the
sector directly accounts for 8.5 per cent of the metro area’s employment
and 13.8 per cent of its GDP. Only the public services sector has a larger
GDP footprint in Toronto.
In addition to the direct impacts that financial services have on Toronto’s
economy, the sector generates secondary (or indirect) and fiscal impacts.
For example, the sector supports another 226,940 indirect jobs, with
115,224 of those occurring in Toronto and the rest occurring elsewhere
Executive Summary | The Conference Board of Canada
Find Conference Board research at www.e-library.ca. v
in Canada. Key industries that indirectly benefit in Toronto include
consulting, accounting, legal services, and computer services. As well,
Toronto’s financial services sector generated a combined $18.1 billion
in fiscal benefits in 2016 for the Canadian, Ontario, and City of Toronto
governments.
Toronto’s role as Canada’s major financial services hub is reinforced
by the results of global rankings such as The Banker magazine’s list
of top global financial centres, which ranks Toronto eighth in the world,
and the Global Financial Centres Index, which ranks Toronto seventh.
Key strengths identified for Toronto include its reputational strength, its
human capital, and its government and regulatory components. Toronto
is also highly ranked among other major global financial centres in terms
of the number of people who work in financial services, the share of the
region’s employment that depends on financial services, and the growth
of the sector.
Toronto is highly ranked among other major global financial centres.

Find Conference Board research at www.e-library.ca.
CHAPTER 1
Introduction
Chapter Summary
• Canada’s financial services sector has been a source of growth for the economy over the past decade; it now directly accounts for 808,100 jobs and 7.2 per cent of GDP in Canada.
• In addition, a well-functioning financial services sector is a critical ingredient in a successful economy. It links the economy together in a unique way.
• Toronto is Canada’s largest and dominant financial centre. The metro area accounts for one-third of the sector’s employment and 37.8 per cent of its GDP.

PARTNERS IN GROwTh2017 Report Card on Canada and Toronto’s Financial Services Sector
Find Conference Board research at www.e-library.ca. 2
Financial services are a critical component of the Canadian economy. For example, the sector directly accounted for 4.5 per cent of Canadian employment in 2016, at 808,100 jobs,1 and 7.2 per cent of Canadian GDP.2 What is more, the sector has been a source of growth for Canada in recent years. For example, sector employment has risen by 10.5 per cent since 2006. In terms of GDP, the sector’s growth has been even stronger, rising by 28 per cent over the same period, nearly double the average for the Canadian economy.
But the sector’s role goes well beyond the jobs it supports and the GDP
it generates. A well-functioning financial services sector is a critical
ingredient in a successful economy. Key functions that the sector
provides that essentially all consumers and business require include
access to credit, transaction processing, and risk management services.
without these services, a modern, dynamic, and resilient economy
is impossible.
Thus, the financial services sector links the economy together in a
unique way. Financial services are a necessary input for every single
business across the country and are used by essentially every adult
individual. Only a handful of other sectors, such as telecommunications
and transportation, have the same impact on the day-to-day functioning
of the economy.
within Canada’s financial services sector, Toronto plays an important
role. This is reflected in the fact that the metro area accounts for
33.7 per cent of Canada’s financial services employment, and an even
larger share of the sector’s headquarters employment. Indeed, Toronto
comprised 43 per cent of Canada’s financial services headquarters
employment in 2012—the latest year with available data. For both
1 See Statistics Canada, CANSIM table 282-0008. In this report the financial services sector is defined as NAICS 52 unless otherwise noted.
2 See Statistics Canada, CANSIM table 379-0031.

Chapter 1 | The Conference Board of Canada
Find Conference Board research at www.e-library.ca. 3
measures, these shares are more than twice as large as the next metro
area in Canada. Financial services are also an integral part of Toronto’s
economy; the sector directly accounts for about one out of every 12 jobs
in the Toronto metro area. As well, the sector indirectly supports activity
in a variety of other sectors, locally and across Canada.
The depth and diversity of Toronto’s financial sector and its international
success are reflected in its high ranking on international league tables for
financial centres, such as those produced by The Banker and the Global
Financial Centres Index. As well, among all the industries that make up
the sector, Toronto accounts for an above-average share of Canada’s
total employment in that industry, except in the case of credit unions. As
such, Toronto remains Canada’s largest and dominant financial centre.
This is The Conference Board of Canada’s fifth annual report card about
Toronto’s financial sector.3 The purpose of the report is threefold. First,
we examine the role of the sector in enabling the growth and prosperity
of Canada’s small and medium-sized enterprises (SMEs). Second, we
consider the sector’s international trade and investment performance.
Finally, we update our annual scorecard on the performance of Toronto’s
financial services sector. The scorecard looks at the role of the sector
in Toronto’s economy as well as how Toronto compares to other
international financial centres.
To achieve these objectives, we consider information from a variety
of sources. Many of these are external data sets or surveys from
government or private organizations. however, in this report we also
reference the results of a survey conducted in the spring of 2016
as part of the report Stronger Together: The Strengths of Canada’s
Four Global Financial Centres.4 In this survey 112 individuals provided
input on the major strengths and significance of Canada’s four major
financial centres.
3 For the 2016 report, see Burt, An Engine for Growth.
4 Crawford and Renner, Stronger Together.
The depth and diversity of Toronto’s financial sector and its international success are reflected in its high ranking.
Find Conference Board research at www.e-library.ca.
CHAPTER 2
Financial Services’ Role Among SMEs
Chapter Summary
• The financial services sector provides many services to SMEs. In addition to the core services of banking and insurance, key services include transaction processing, trade facilitation, and asset management.
• Debt financing is one of the most common ways that financial institutions help SMEs. Available credit for SMEs has steadily expanded, reaching $243 billion in 2016.
• Although equity financing is less frequently sought by SMEs, private equity, the TSX venture exchange, and venture capital combined supplied $21 billion in equity financing to Canadian SMEs in 2016.
• Insurance is an essential way for SMEs to mitigate risks. Property and casualty insurance payments provide billions of dollars of benefits annually, and health and pension benefits provided by insurers are key to attracting and retaining employees.

Chapter 2 | The Conference Board of Canada
Find Conference Board research at www.e-library.ca. 5
The services that Canada’s financial services sector provides are a key part of allowing all businesses to grow and prosper. However, because of their limited scale, small and medium-sized enterprises often require additional services from the sector. Where SMEs are in their life cycle can also lead to further needs.
Defined as companies that have fewer than 500 employees, SMEs
comprise 99.7 per cent of all businesses in Canada and are often
considered to be the backbone of the Canadian economy. Much of
Canada’s reputation as a global leader in innovation is attributed to the
opportunity that SMEs have to prosper.1 however, financial institutions
are often a key part of the successful exploitation of the opportunities
that Canadian SMEs represent.
First and foremost, SMEs often use financing from the sector for a
variety of activities related to operating their business. This financing
can be broadly categorized into either debt or equity financing, and
financial institutions can play a role in providing private firms directly
with financing or facilitating the provision of capital from third parties.
Another key service that financial institutions provide to SMEs is
insurance. Insurance products allow firms to mitigate risk from damages
and loss of business while reducing liability. In addition to coverage for
property, benefits provided by insurance firms, such as medical coverage
and life insurance, often play an important role in attracting and retaining
employees, enabling SMEs to be competitive.
Beyond the core banking and insurance functions, the financial services
sector supports SMEs in other ways. These can range from mitigating
market risk by providing access to derivatives, to other employee benefits
like group RRSPs, to management mentoring from venture capitalists
1 Canada ranked 18th in the 2017 Global Innovation Index rankings and routinely ranks in the top 20. For more information, see globalinnovationindex.org.

PARTNERS IN GROwTh2017 Report Card on Canada and Toronto’s Financial Services Sector
Find Conference Board research at www.e-library.ca. 6
and succession planning for owner/operators who are looking to sell their
business or retire. The rest of this chapter discusses these issues in
more detail.
Debt Financing
Aside from simple services like bank accounts, which almost all
businesses need, debt financing is perhaps the most common way that
SMEs interact with their financial institutions. For example, Statistics
Canada’s most recent survey about SME financing found that 51.3 per
cent of SMEs requested some sort of external financing, and of those,
more than half requested debt financing.2 (See Chart 1.) high-growth
firms (hGFs)—those with sales growth of 20 per cent or more per
year—were particularly likely to request debt financing, at 43.3 per
cent. As such, access to sufficient credit is an important factor
supporting the growth of these firms, and consequently the broader
economy. One Canadian study found that hGFs were responsible for
nearly half of the net increase in employment from the mid-1980s to
the early 2000s.3
2 See Statistics Canada, Survey on Financing and Growth of Small and Medium Enterprises, 2014. This is the survey referred to throughout Chapter 2.
3 halabisky, Dreessen, and Parsley, “Growth in Firms in Canada, 1985–1999.”
Chart 1Trade and Debt Financing Are Common Financial Services Requested by SMEs(share of respondents requesting each service, 2014, per cent)
Sources: Statistics Canada, Survey on Financing and Growth of Small and Medium Enterprises; The Conference Board of Canada.
Equity financing
Government financing
Lease financing
Debt financing
Trade financing
0 5 10 15 20 25 30

Chapter 2 | The Conference Board of Canada
Find Conference Board research at www.e-library.ca. 7
There are several reasons why SMEs seek out debt financing. In most
cases, firms intend to increase their working capital for day-to-day
operations like inventory purchases and paying suppliers. (See Chart 2.)
The other key reason is to allow businesses to finance the purchase of
new machinery and equipment (M&E) or buildings. Additionally, some
SMEs use debt financing to expand the scope of their business. For
example, expansion into a new market or investing in research and
development are important ways that SMEs grow their business.
Financial institutions are the main source of debt financing for SMEs. For
example, although there are various programs in place for governments
to support the growth of SMEs, only 6.2 per cent of approved firms
claimed they used a government institution for debt financing. Among
financial institutions, banks are the most common way that SMEs secure
credit, but credit unions and finance companies are also significant
sources of capital. (See Chart 3.)
The amount of credit that financial institutions extend to SMEs has risen
steadily in recent years, climbing from $194 billion in the first half of 2011
to $243 billion by the end of 2016. however, essentially all of these gains
have occurred for mid-sized firms; the credit outstanding for accounts
with authorizations of less than $250,000 has actually declined modestly
over this period. (See Chart 4.) It is also worth noting that SMEs
Chart 2Working Capital Is Most Common Use of Debt Financing(share of respondents’ intended use of debt financing, 2014, per cent)
Sources: Statistics Canada, Survey on Financing and Growth of Small and Medium Enterprises; The Conference Board of Canada.
R&D
New market opportunities
Debt consolidations
Land and buildings
M&E
Working capital
0 10 20 30 40 50 60 70

PARTNERS IN GROwTh2017 Report Card on Canada and Toronto’s Financial Services Sector
Find Conference Board research at www.e-library.ca. 8
represent a significant source of business for financial institutions.
SMEs accounted for 31 per cent of total outstanding business credit at
Canadian financial institutions at the end of 2016. They are particularly
important to finance companies and credit unions, where they account
for half or more of the total business credit outstanding.
Chart 4Credit Growth Has Been Strongest for Medium-Sized Firms(credit outstanding by size of account, 2016, $ billions)
Sources: Statistics Canada, Biannual Survey of Suppliers of Business Financing; The Conference Board of Canada.
2011 2012 2013 2014 2015 2016
0
50
100
150
200
250
<$50,000 $50,000 to $99,999 $100,000 to $249,999
$250,000 to $999,999 $1,000,000 to $4,999,999
Chart 3Banks Are the Primary Source of Debt Financing for SMEs (share of SME credit outstanding by institution, 2016, per cent)
Note: "SME" is defined here as accounts with credit outstanding of less than $5 million. Sources: Statistics Canada, Biannual Survey of Suppliers of Business Financing; The Conference Board of Canada.
56.3
18.7
15.0
7.5 2.4Domestic banks
Credit unions
Finance companies
Other banks
Insurance companies andportfolio managers
Chapter 2 | The Conference Board of Canada
Find Conference Board research at www.e-library.ca. 9
while access to debt financing can be important to a business at any
stage of its development, it can be especially important during the
initial start-up phase. In fact, 44.9 per cent of small businesses report
that credit from financial institutions was a source of capital for the
start-up of their business. This was second only to personal financing
at 84.3 per cent. Thus, financial institutions are an important part of
supporting the creation of the more than half a million new businesses
that are started in Canada each year.4
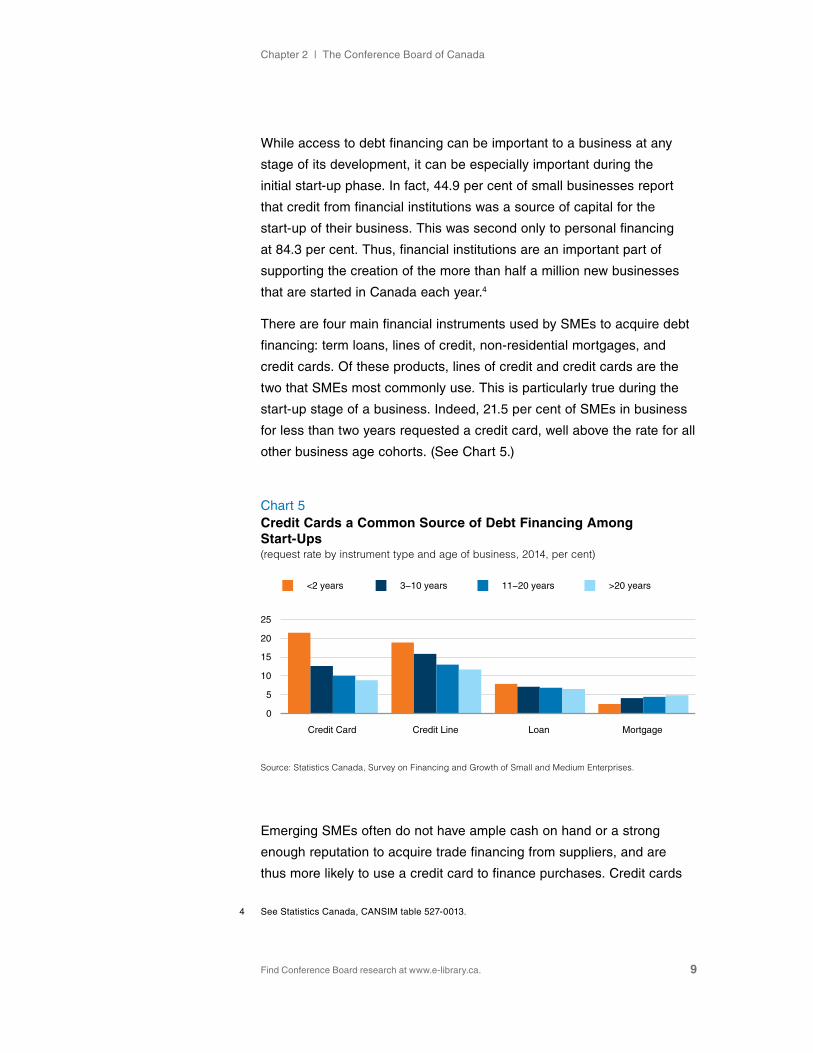
There are four main financial instruments used by SMEs to acquire debt
financing: term loans, lines of credit, non-residential mortgages, and
credit cards. Of these products, lines of credit and credit cards are the
two that SMEs most commonly use. This is particularly true during the
start-up stage of a business. Indeed, 21.5 per cent of SMEs in business
for less than two years requested a credit card, well above the rate for all
other business age cohorts. (See Chart 5.)
Emerging SMEs often do not have ample cash on hand or a strong
enough reputation to acquire trade financing from suppliers, and are
thus more likely to use a credit card to finance purchases. Credit cards
4 See Statistics Canada, CANSIM table 527-0013.
Chart 5Credit Cards a Common Source of Debt Financing Among Start-Ups(request rate by instrument type and age of business, 2014, per cent)
Source: Statistics Canada, Survey on Financing and Growth of Small and Medium Enterprises.
Credit Card Credit Line Loan Mortgage
0
5
10
15
20
25
<2 years 3−10 years 11−20 years >20 years
PARTNERS IN GROwTh2017 Report Card on Canada and Toronto’s Financial Services Sector
Find Conference Board research at www.e-library.ca. 10
are also attractive for emerging companies because the approval rate is
highest among the four debt products considered here. The result is that
credit cards can be an easy way for SMEs to finance their day-to-day
activities until they can acquire lower interest financing like credit lines
or loans.
Equity Financing
Another way in which SMEs can obtain financing is by acquiring equity,
which involves raising capital through the sale of partial ownership in the
company. SMEs are much less likely to seek equity than debt financing
in any given year. Reasons for this include the fact that equity financing
is generally more expensive than debt, and many business owners are
reluctant to dilute their ownership through the issuance of new shares.
however, equity financing does have benefits as well. For example, debt
financing imposes fixed costs on firms that can increase the chance of
bankruptcy; equity financing does not. As well, SMEs can generally raise
much more money through equity financing than they can with debt,
providing firms with more options for investment and expansion. In 2014,
the average amount that SMEs who sought equity financing acquired
was $571,354, nearly twice as much as mortgages and much more
than other types of debt financing. It is also worth noting that start-ups
and hGFs are more than twice as likely to seek equity financing. Thus,
this source of financing can play an important role in the growth and
innovation of SMEs and the economy.
Financial institutions often play a role in facilitating the transaction
when firms seek to raise equity, and may themselves take equity
stakes in firms. In fact, helping businesses to raise equity capital is a
key function of the underwriting process at investment banks. In some
cases, investment banks may bring together private investors, such
as angel investors, with firms that are seeking equity financing. For
example, according to the National Angel Capital Organization, angel
investors made 418 investments totalling $157 million in Canada in 2016.5
Crowdfunding is a fintech solution that is currently being used only
5 Mason and Tjahjakartana, 2016 Report on Angel Capital Investing.
SMEs are much less likely to seek equity than debt financing, but generally raise much more money with equity.

Chapter 2 | The Conference Board of Canada
Find Conference Board research at www.e-library.ca. 11
sparingly to raise equity in Canada—in 2015, only $8 million in business
equity was raised this way—but it has significant growth potential.6
In other situations, financial institutions may assist SMEs in going public.
The TSX Venture Exchange (TSXV) is the primary way that Canadian
SMEs raise equity capital in public markets. Although the number and
value of new listings on the TSXV has trended down in recent years,
it remains a significant source of capital for Canadian SMEs. In 2016,
47 new companies were listed on the TSXV (including 18 initial public
offerings) and companies (both new and those already listed) raised a total
of $4.6 billion on the TSXV. (See Chart 6.) As of year-end 2016, it had
1,658 listed companies with a quoted market value of $38.7 billion. Key
industries that list on the TSXV include energy, mining, and technology.
when financial institutions take an ownership stake in an existing firm,
this is referred to as venture capital (VC) or private equity (PE). VC
investments generally involve smaller sums and partial ownership and
target young firms, while PE tends to involve larger sums and total
ownership and target established firms. For example, the average
6 National Crowdfunding Association of Canada, 2016 Alternative Finance Crowdfunding.
Chart 6TSXV Plays an Important Role in Raising Equity Capital for SMEs(equity capital raised, $ billions [left]; new listings, number [right])
Source: TMX Group.
2011 12 13 14 15 16
0
2
4
6
8
10
12
0
50
100
150
200
250
300
Equity capital raised New listings

PARTNERS IN GROwTh2017 Report Card on Canada and Toronto’s Financial Services Sector
Find Conference Board research at www.e-library.ca. 12
value for a VC investment in Canada in 2016 was $6 million versus
$25.6 million for PE.7
Canadian VC experienced its strongest year since the turn of the century
in 2016, with $3.2 billion in investments being undertaken across
530 transactions. Information and communication technology (ICT) and
life sciences were the two key industries where VC investments took
place. The profile for PE was considerably different. A total of
$13.7 billion in investments was made in 536 organizations in 2016, with
energy, ICT, and cleantech being the leading destinations for these
investments. (See Chart 7.) It is also worth noting that Toronto was the
leading administrative centre for both VC (30 per cent of the total value)
and PE (34 per cent) deals.
In addition to the equity capital they provide, VC and PE investments
also generally include other forms of assistance. Perhaps most
importantly, external investors can bring managerial skills and access
to networks that will assist an SME to grow and improve its financial
performance. For financial institutions, an additional benefit beyond
7 Canadian Venture Capital and Private Equity Association, VC & PE Canadian Market Overview.
Chart 7VC and PE Are Other Important Sources of Equity Capital for SMEs($ billions, 2016)
Source: Canadian Venture Capital and Private Equity Association.
PE VC
0
2
4
6
8
10
12
14
Energy
ICT
Life sciences Cleantech Agri-forestry
Other
Chapter 2 | The Conference Board of Canada
Find Conference Board research at www.e-library.ca. 13
the potential returns on their investment is the potential for the sale of
ancillary services, such as subsequent loans.8
Insurance
Many insurance products are an integral part of SME business operations.
On the property and casualty (P&C) side, commercial property insurance
is designed to cover physical assets like machinery and equipment,
buildings, and inventory. Commercial liability insurance protects
businesses and employees from actions resulting in injury, property
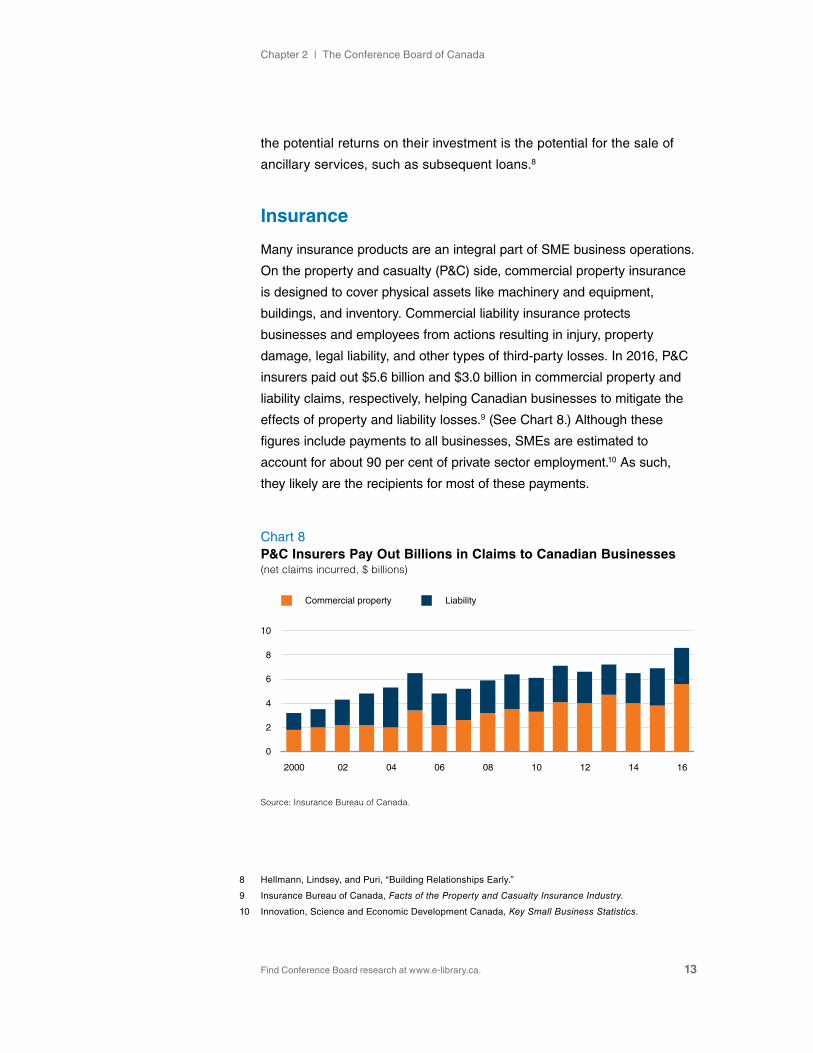
damage, legal liability, and other types of third-party losses. In 2016, P&C
insurers paid out $5.6 billion and $3.0 billion in commercial property and
liability claims, respectively, helping Canadian businesses to mitigate the
effects of property and liability losses.9 (See Chart 8.) Although these
figures include payments to all businesses, SMEs are estimated to
account for about 90 per cent of private sector employment.10 As such,
they likely are the recipients for most of these payments.
8 hellmann, Lindsey, and Puri, “Building Relationships Early.”
9 Insurance Bureau of Canada, Facts of the Property and Casualty Insurance Industry.
10 Innovation, Science and Economic Development Canada, Key Small Business Statistics.
Chart 8P&C Insurers Pay Out Billions in Claims to Canadian Businesses(net claims incurred, $ billions)
Source: Insurance Bureau of Canada.
2000 02 04 06 08 10 12 14 16
0
2
4
6
8
10
Commercial property Liability

PARTNERS IN GROwTh2017 Report Card on Canada and Toronto’s Financial Services Sector
Find Conference Board research at www.e-library.ca. 14
Life and health (L&h) insurance products are also critical to SMEs,
as they are generally an important part of a business attracting and
retaining its workforce. For example, according to Sanofi Canada’s
2015 health care survey, 77 per cent of respondents said they would not
move to a job that did not include health benefits, indicating that health
coverage is essential for firms to attract employees.11 Further, employers
are the main source of health coverage for individuals, as 90 per cent
of all health insurance is purchased through group plans provided
by employers.12
An interesting question is whether SMEs are more likely than larger firms
to purchase insurance. SMEs certainly have a major incentive to buy
insurance. Their limited financial resources mean that they are less able
to self-insure and that when an event occurs that requires an insurance
payment, their business’s survival is more likely to depend on timely
insurance payments. SMEs are also less likely to have sophisticated
risk management practices in place, which we would expect would
lead to an increased need for risk assessments from insurers and
insurance products.
In general, there does appear to be some correlation between the
prevalence of SMEs in an industry and the amount an industry spends
on insurance. For example, the Conference Board estimates that the
retail industry accounts for 11.5 per cent of all SMEs in Canada, and
for 10.2 per cent of all insurance payments made by businesses and
governments. (See Chart 9.) Other industries where there is a high
prevalence of SMEs and insurance payments include wholesale trade,
truck transportation, and the residential construction industry. Of course,
factors other than size will influence the amount and types of insurance
that companies buy. For example, use of accident- and sickness-related
insurance products is higher in industries where the risk of employee
injury is above average.
11 Sanofi, The Sanofi Canada Health Care Survey.
12 Canadian Life and health Insurance Association, Canadian Life and Health Insurance Facts.
There appears to be correlation between the prevalence of SMEs in an industry and the amount an industry spends on insurance.

Chapter 2 | The Conference Board of Canada
Find Conference Board research at www.e-library.ca. 15
In addition to the broad types of insurance coverage listed above,
there are many types of speciality insurance that may be of interest to
SMEs. Professional liability insurance, which protects individuals and
organizations that provide advice from client damage claims related to
inaccuracies, misrepresentations, and negligence, is one such example.
This type of insurance is common in the professional services sector,
which includes activities like legal services, accounting, engineering, and
consulting. SMEs account for 99.9 per cent of firms in this sector.13
Crop insurance would be another example of specialty insurance that
is particularly important for SMEs. This is an insurance product used
almost exclusively by the agriculture sector, where SMEs again account
for essentially all the firms. Crop insurance serves to protect farmers
from the loss of crops due to weather or other events or from the loss
of revenue due to pricing declines in their commodities. In 2016, crop
and hail insurance payments totalled about $1.3 billion, or 2.2 per cent
of farm receipts, suggesting that it is a significant source of revenue for
farmers. (See Chart 10.)
13 See Statistics Canada, CANSIM table 552-0005.
Chart 9Industries With More SMEs Are Often Significant Users of Insurance Products(for select industries where SMEs are more common, per cent)
Sources: The Conference Board of Canada; Statistics Canada.
Retail trade Professional services Wholesale trade Agriculture Truck transportation Residential construction
0
2
4
6
8
10
12
Share of insurance spending Share of SMEs

PARTNERS IN GROwTh2017 Report Card on Canada and Toronto’s Financial Services Sector
Find Conference Board research at www.e-library.ca. 16
Business interruption insurance, which insures against lost earnings
during periods of unforeseen shutdowns or unforeseen operational
costs, is another type of specialty insurance that would likely appeal
to SMEs. Although large enterprises often have this type of protection,
business interruption coverage serves as a safety net for small business
owners who rely on their day-to-day operations for their income. without
business interruption coverage, small enterprises would be much more
likely to fail in the event of a disaster, making them much riskier and
dampening their overall impact on the Canadian economy.
Finally, apart from insurance coverage, insurer carriers and brokers also
provide advisory services for SME clients. Firms may be unaware of
their risks and thus benefit from such services. This is especially true
for SMEs that are less likely to employ sophisticated risk management
practices or to be aware of the insurance products that could mitigate
their risks. Thus, the insurance industry helps to reduce the volatility of
businesses’ revenues and costs, ultimately improving survival rates and
the viability of SMEs.
Additional Services
Beyond the core banking and insurance services they provide, financial
institutions offer a variety of other services that facilitate the success
Chart 10Crop Insurance Represents a Significant Share of Farm Receipts(crop insurance payments, $ millions [left]; share of farm receipts, per cent [right])
Source: Statistics Canada, CANSIM table 002-0001.
2006 07 08 09 10 11 12 13 14 15 16
0
400
800
1,200
1,600
0
1
2
3
4
Payments Share

Chapter 2 | The Conference Board of Canada
Find Conference Board research at www.e-library.ca. 17
of SMEs. One example is transaction processing. The era of electronic
payments and fintech has revolutionized the business of transaction
processing, increasing the availability to SMEs of many services that
previously would have been available only to larger businesses.
For example, in addition to the traditional credit card networks, SMEs
can combine services like PayPal, Shopify, and Square with standard
smartphones and tablets to collect credit or debit card payments
essentially anywhere and anytime. Pay-by-text or e-mail, autopayments,
paperless billing, and customer payments data analysis are other
services that fintech companies are making readily available to SMEs.
Ultimately, more efficient billing and transaction processing can improve
performance metrics such as cash and working capital turnover ratios, as
well as reduce losses on accounts receivable. This may be a contributing
factor to the modest reduction in credit available to small businesses in
recent years. In essence, more efficient transaction processing may be
leading to a reduction in the need for working capital.
Facilitating trade is another way that financial institutions can play a key
role in supporting the growth of SMEs. There is a clear link between the
size of a firm and its propensity to export. Indeed, even among SMEs,
the larger a firm, the more likely it is to export. (See Chart 11.) The
complexity and risk associated with exporting are the main reasons for
this. Financial institutions can assist SMEs with navigating the logistical
and regulatory hurdles of exporting, while simultaneously mitigating at
Chart 11The Smaller a Firm, the Less Likely It Is to Export(share of firms that export, by firm size, per cent)
Source: Statistics Canada, Survey on Financing and Growth of Small and Medium Enterprises.
1−4 employees
5−19 employees
20−99 employees
100−499 employees
0 5 10 15 20 25 30
PARTNERS IN GROwTh2017 Report Card on Canada and Toronto’s Financial Services Sector
Find Conference Board research at www.e-library.ca. 18
least some of the risks. Indeed, previous Conference Board research
identified four key attributes that are required for SMEs to be successful
when exporting: market knowledge, international networks, skilled
executives, and innovation capabilities.14 Most of these factors can be
supported by “helping hands” from financial institutions.
The process of exporting begins with identifying potential markets and
customers; it continues with the potential need for more working capital
or trade finance for export customers, settling the required paperwork,
and ensuring payment. Financial institutions can potentially help at
all of these stages. For example, many of Canada’s largest financial
institutions have significant international operations that they can
leverage to provide market intelligence and to link SMEs to potential
international customers, suppliers, and local agents. As well, the
increased risk associated with exporting often means that contracts
require extra paperwork, such as surety bonds and letters of guarantee;
these are services that are commonly provided by financial institutions.
Finally, financial institutions provide risk mitigation tools like exchange
rate and interest rate derivatives, as well as insurance against political
risk and sales financing. All of these instruments help SMEs to ensure
that they will get paid.
More broadly, derivatives can be an effective tool for SMEs to manage
their risks, even when they are selling domestically. For example, farms
are often faced with fluctuating prices for their products and may use
futures contracts or options to lock in future prices for their products
today, reducing their market risk. There are a wide variety of derivative
products whose values are tied to commodity prices, interest rates,
and exchange rates. All of these products can potentially be used to
hedge the risks that some SMEs face in terms of volatility of input costs
and revenues.
Asset management is another key service that financial institutions
provide to SMEs. Many larger firms in Canada still offer their employees
pension plans, and the largest firms may administer these plans
themselves. however, smaller firms are more likely to make use of
14 Audet, Selling to the World.
Financial institutions provide risk mitigation tools to ensure that SMEs will get paid.

Chapter 2 | The Conference Board of Canada
Find Conference Board research at www.e-library.ca. 19
group registered retirement savings plans (RRSPs). For example, the
Canadian Life and health Insurance Association (CLhIA) reports that
life insurance firms managed $142 billion of pension assets at the end
of 2015, accounting for 70 per cent of SME pension plans.15 Like other
life and health benefits, providing group RRSPs can be an important tool
for SMEs to attract and retain the workers they need.
Finally, succession planning is another way that financial institutions
assist SMEs. Succession planning entails a firm creating a plan for
changes to key staff—such as ownership and management—in the
event that they pursue new opportunities, retire, or pass away. Since
smaller firms are generally privately owned and have lower profiles, it can
be much more difficult for them to effectively transition to new owners
when the original owners seek to exit the business. This is especially
important for family-owned SMEs, because these often fail after the first
generation due to inappropriate available replacements.16
The role of financial institutions in succession planning for SMEs is
apparent in a couple of ways. For example, in the SME financing survey,
60.7 per cent of survey respondents who purchased or acquired a
business reported using some amount of credit from financial institutions
to facilitate the transaction. This was second only to personal financing.
As well, financial institutions can assist sellers with finding buyers.
Although mega-deals tend to dominate the headlines about mergers
and acquisitions (M&A), the vast majority of transactions are for smaller
firms. For example, in the second quarter of 2017, deals valued at
less than $100 million accounted for 83 per cent of Canadian M&A
transactions where the value was disclosed.17 This is consistent with the
historical trends.
Due to Canada’s aging workforce, the number of deaths and retirements
among SME owners will rise in the coming years, suggesting that
succession planning is a growing need among firms. Further, it is likely
that some industries are exceptionally vulnerable. An example is the
agricultural sector, due to its high concentration of small family-owned
15 Canadian Life and health Insurance Association, Canadian Life and Health Insurance Facts.
16 Fernández-Aráoz, Iqbal, and Ritter, “Leadership Lessons.”
17 Crosbie & Company, Canadian M&A Report.

PARTNERS IN GROwTh2017 Report Card on Canada and Toronto’s Financial Services Sector
Find Conference Board research at www.e-library.ca. 20
farms. At the same time, the average age of farmers is well above
average, which would indicate that most farms should have some sort
of succession plan in place.18 however, Statistics Canada’s 2016 census
of agriculture found that only 8.4 per cent of farms reported having
a succession plan. Thus, the financial services sector will be a vital
component to ensuring the continuity of SMEs in the coming years.
18 Smith Cross, “Aging Farmers.”

Find Conference Board research at www.e-library.ca.
CHAPTER 3
Canada’s Financial Sector in a Global Context
Chapter Summary
• Foreign affiliates are the principal avenue by which Canadian financial institutions provide financial services to overseas customers. Foreign affiliate sales are about 10 times greater than exports.
• Outward foreign direct investment is key to establishing an overseas presence. Canada’s stock of direct investment abroad in the financial services sector reached $505 billion in 2016—nearly twice the amount of inward financial services’ FDI in Canada.
• Canadian exports of financial services have more than doubled since 2006. Growth has been driven largely by the significant increase in exports of “other financial services,” which include items such as securities issuance and trading and asset management services.

PARTNERS IN GROwTh2017 Report Card on Canada and Toronto’s Financial Services Sector
Find Conference Board research at www.e-library.ca. 22
Canadian financial institutions are serving the financial needs not only of Canadians, but also of international customers. In the past decade, Canada’s financial sector has significantly increased its footprint in global markets by selling directly to international customers from their Canadian offices and by establishing a physical presence in foreign countries. In fact, having a local presence in foreign markets is the principal avenue for Canadian financial institutions to provide financial services to international customers.
This chapter looks at the latest trends in Canada’s financial services
trade through foreign affiliate sales and exports—the two main
channels used to reach international customers. Exporting financial
services directly contributes to economic growth and job creation in
Canada; foreign affiliate sales raise the revenues and profits of the
parent companies, thus benefiting all Canadians holding shares in
those institutions. having a presence abroad also contributes to the
international reputation of Canadian financial institutions and of the
Canadian financial system.
Building a Global Presence Through Foreign Affiliates
Canadian financial firms have a significant out-of-country presence, as
measured by foreign affiliate sales data from Statistics Canada. Foreign
affiliates are the principal avenue for Canadian financial institutions
to provide financial services to overseas customers. As such, foreign
affiliate sales are much larger than financial services exports—financial
services exports are equivalent to 11 per cent of foreign affiliate sales.
In other words, the value of services supplied by affiliates abroad of
Canadian financial institutions has been, on average, about 10 times
greater than the value of financial services exports.
Chapter 3 | The Conference Board of Canada
Find Conference Board research at www.e-library.ca. 23
There are many benefits to doing business through foreign affiliates; for
example, profits generated through sales by foreign affiliates directly
benefit Canada by contributing to the gross national income. In addition,
by establishing a local presence abroad, Canadian firms can expand
market share, provide better service for their foreign customers, and
improve their competitiveness within global value chains.
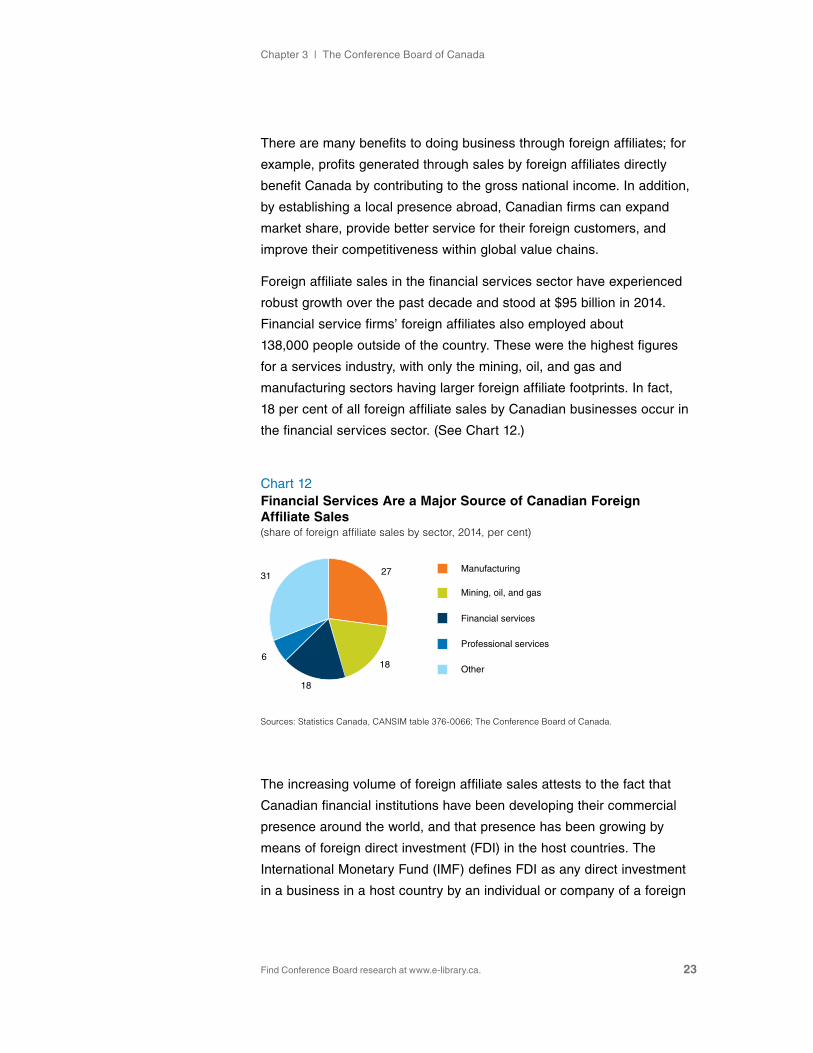
Foreign affiliate sales in the financial services sector have experienced
robust growth over the past decade and stood at $95 billion in 2014.
Financial service firms’ foreign affiliates also employed about
138,000 people outside of the country. These were the highest figures
for a services industry, with only the mining, oil, and gas and
manufacturing sectors having larger foreign affiliate footprints. In fact,
18 per cent of all foreign affiliate sales by Canadian businesses occur in
the financial services sector. (See Chart 12.)
The increasing volume of foreign affiliate sales attests to the fact that
Canadian financial institutions have been developing their commercial
presence around the world, and that presence has been growing by
means of foreign direct investment (FDI) in the host countries. The
International Monetary Fund (IMF) defines FDI as any direct investment
in a business in a host country by an individual or company of a foreign
Chart 12Financial Services Are a Major Source of Canadian Foreign Affiliate Sales(share of foreign affiliate sales by sector, 2014, per cent)
Sources: Statistics Canada, CANSIM table 376-0066; The Conference Board of Canada.
27
18
18
6
31Manufacturing
Mining, oil, and gas
Financial services
Professional services
Other

PARTNERS IN GROwTh2017 Report Card on Canada and Toronto’s Financial Services Sector
Find Conference Board research at www.e-library.ca. 24
country. Investors and companies can undertake FDI in two ways:
by establishing a new company in the host country or by investing in
an existing business through merger and acquisition. FDI enables an
investor to have a significant voice in the management of an enterprise
operating outside the investor’s home country. The phrase “significant
voice” usually means ownership of 10 per cent or more of the ordinary
shares, voting power, or the equivalent.
Canada is a large net exporter of financial services FDI.1 Over the last
decade, the stock of direct investment abroad in the financial services
sector has consistently been above the amount of foreign direct
investment in Canada, and the ratio is now more than 2 to 1. During this
period, Canadian financial services institutions’ stock of foreign direct
investment more than doubled, reaching a new high of $505 billion
in 2016. (See Chart 13.) The Canada Pension Plan Investment Board
(CPPIB) was a major contributor to the 2015 surge; it completed
US$60.4 billion in foreign acquisitions in 2015.2 In fact, growth in financial
services FDI has been so strong that the industry now accounts for
nearly half of Canada’s total stock of outward FDI.
1 For our purposes, we combine the data for the financial services (NAICS 52) and holding companies (NAICS 55) sectors and refer to them as the financial services sector. we do this since financial institutions often use holding companies to set up and operate their foreign affiliates.
2 Deveau, “Canadian Firms.”
Chart 13Financial Services Direct Investment Abroad More Than Doubled Over the Last Decade($ billions)
Sources: Statistics Canada, CANSIM table 376-0052; The Conference Board of Canada.
2006 07 08 09 10 11 12 13 14 15 16
0
100
200
300
400
500
600
United States Europe Other

Chapter 3 | The Conference Board of Canada
Find Conference Board research at www.e-library.ca. 25
The U.S. remains the primary destination for Canadian financial services
FDI, accounting for 44 per cent of the total outward stock of investments
in 2016. This is followed by “Other Americas” (30 per cent) and Europe
(21 per cent). These shares have changed little over the past 15 years.
Thus, Canadian financial institutions have taken a broad approach
to investing across a number of regions, instead of focusing on any
particular area.
The expansion of FDI has enabled Canadian financial institutions to
extend their international footprint. For example, in 2016, about 40 per cent
of the revenues from Canada’s four largest banks came from international
markets. And Toronto’s largest life insurance companies, Manulife
Financial and Sun Life Financial, generated 76 and 52 per cent of their
respective revenues from countries other than Canada. (See Chart 14.)
According to a 2014 Conference Board survey, the most common market
entry strategies used by Canadian financial institutions to build a presence
in foreign markets are making foreign acquisitions, establishing a
subsidiary, and setting up joint ventures or local partnerships.3
3 Burt and Ai, Going Abroad.
Chart 14Canadian Banks and Insurance Companies Generated a Large Share of Their Revenues From International Operations in 2016(share of revenues from U.S. and other countries, selected banks and insurance companies, per cent)
Note: The revenue breakdown for Sun Life Financial allocates the revenues for its Sun Life Financial Asset Management group to the “other” category. Sources: Banks’ and insurance companies’ 2016 financial reports; The Conference Board of Canada.
ManulifeFinancial
Sun LifeFinancial
Scotiabank TD BMO RBC CIBC
0
10
20
30
40
50
60
70
80
United States Other countries

PARTNERS IN GROwTh2017 Report Card on Canada and Toronto’s Financial Services Sector
Find Conference Board research at www.e-library.ca. 26
The international footprint for Canadian financial institutions other than
banks and insurance firms is also significant. For example, Canada
has some of the largest pension funds in the world, with the Canada
Pension Plan Investment Board (eighth) and Ontario Teachers’ Pension
Plan (18th) ranked among the top 50 largest pension funds in terms of
assets under management.4 Several others are among the 100 largest,
including the Ontario Municipal Employees Retirement System (54th),
Public Service Pension Plan (57th), healthcare of Ontario Pension Plan
(64th), and Caisse de dépôt et placement du Québec (74th).
Canada’s pension funds continue to expand their international presence
through the direct investments they undertake. Foreign investments
accounted for 31.7 per cent of the total portfolio in 2016, up from
18.9 per cent in 2000.5 Portfolio diversification by geography helps
to explain the investment strategy of large Canadian pension funds.
The strategy diversifies risk exposure beyond the relatively small
Canadian economy. As well, greater global diversification allows income
from foreign investments to flow back into Canada to support future
pension payments.
Canada’s largest exchange operator, TMX Group Limited, also has a
significant foreign presence, with about 29 per cent of revenues in 2016
coming from international business.6 Key factors driving these foreign
revenues include international listings of the TMX Group’s exchanges
and transactions originating from foreign-based brokers.
Building a Global Presence Through Exports
The second channel through which Canada’s financial institutions
can serve foreign customers is cross-border trade, also known as
exports. when a Canadian financial institution provides services
to non-residents through its Canadian operations, it is engaging in
an export activity, which is a source of income and job creation for
Canada. Exports of financial services can be split into three broad
4 willis Towers watson, Pensions and Investments.
5 See Statistics Canada, CANSIM table 280-0003.
6 TMX Group, Global Leaders.
Global diversification among Canadian pension funds allows income from foreign investments to support future pension payments.
Chapter 3 | The Conference Board of Canada
Find Conference Board research at www.e-library.ca. 27
categories: banking, insurance, and other financial services, which are
composed of items such as securities issuance and trading and asset
management services.
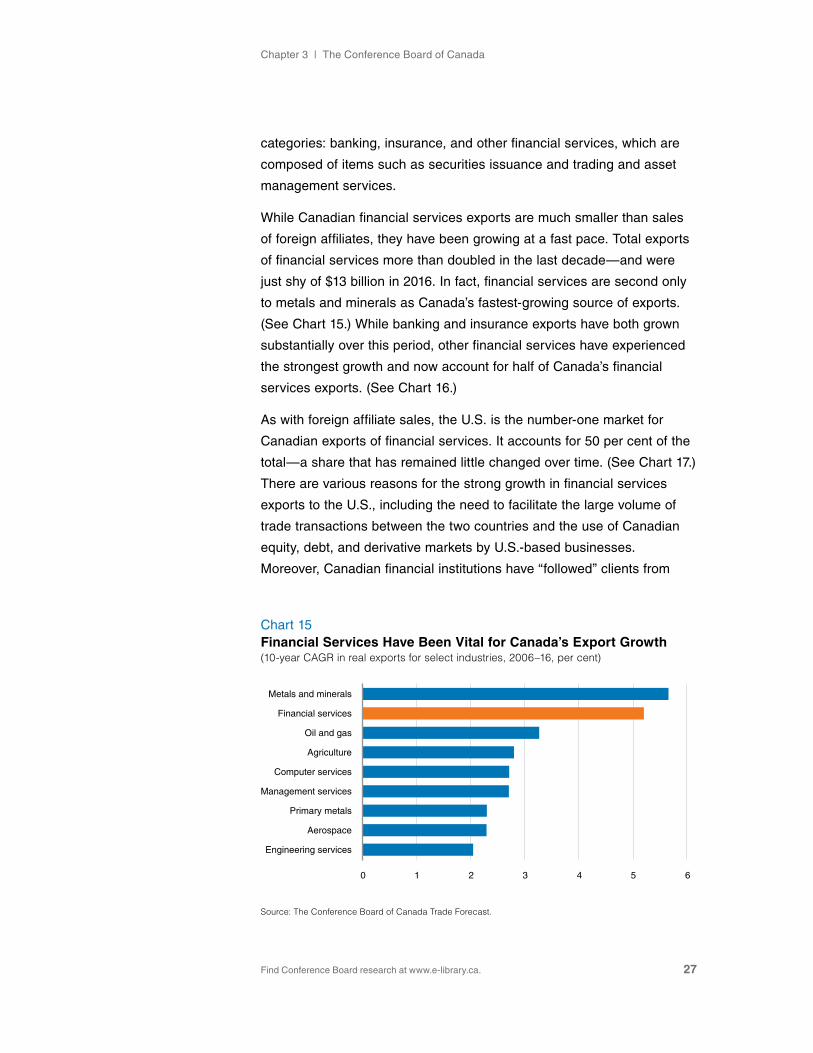
while Canadian financial services exports are much smaller than sales
of foreign affiliates, they have been growing at a fast pace. Total exports
of financial services more than doubled in the last decade—and were
just shy of $13 billion in 2016. In fact, financial services are second only
to metals and minerals as Canada’s fastest-growing source of exports.
(See Chart 15.) while banking and insurance exports have both grown
substantially over this period, other financial services have experienced
the strongest growth and now account for half of Canada’s financial
services exports. (See Chart 16.)
As with foreign affiliate sales, the U.S. is the number-one market for
Canadian exports of financial services. It accounts for 50 per cent of the
total—a share that has remained little changed over time. (See Chart 17.)
There are various reasons for the strong growth in financial services
exports to the U.S., including the need to facilitate the large volume of
trade transactions between the two countries and the use of Canadian
equity, debt, and derivative markets by U.S.-based businesses.
Moreover, Canadian financial institutions have “followed” clients from
Chart 15Financial Services Have Been Vital for Canada’s Export Growth(10-year CAGR in real exports for select industries, 2006–16, per cent)
Source: The Conference Board of Canada Trade Forecast.
Engineering services
Aerospace
Primary metals
Management services
Computer services
Agriculture
Oil and gas
Financial services
Metals and minerals
0 1 2 3 4 5 6

PARTNERS IN GROwTh2017 Report Card on Canada and Toronto’s Financial Services Sector
Find Conference Board research at www.e-library.ca. 28
Canada into the U.S. market to provide financing and other financial
products as their customers engaged in a growing volume of
international investment activities.
Chart 17The U.S. Is the Largest Market for Financial Services Exports(share of financial services exports by country, 2014, per cent)
Sources: Statistics Canada, CANSIM table 376-0033; The Conference Board of Canada.
53
18
29
United States
European Union
Other
Chart 16Growth in Financial Services Exports Driven by “Other Financial Services”($ billions)
Sources: Statistics Canada, CANSIM tables 376-0033 and 376-0108; The Conference Board of Canada.
2006 07 08 09 10 11 12 13 14 15 16
0
2
4
6
8
10
12
14
Insurance services Banking services Other financial services

Find Conference Board research at www.e-library.ca.
CHAPTER 4
Toronto’s Role in Canada’s Financial Services Sector
Chapter Summary
• Financial services directly employed 272,280 people in Toronto in 2016, 8.5 per cent of the metro area’s total employment, up from 7.9 per cent in 2006. In addition, the sector indirectly employed another 115,224 people in the metro area.
• Toronto accounts for a growing share of Canada’s financial services sector; its share of the sector’s employment rose from 29.8 per cent in 2006 to 33.7 per cent in 2016.
• The sector directly accounts for 13.8 per cent of metro Toronto’s GDP. Only the public services sector is larger.
• In total, Toronto’s financial services sector generated a combined $18.1 billion in fiscal benefits in 2016 for the Canadian, Ontario, and City of Toronto governments.

PARTNERS IN GROwTh2017 Report Card on Canada and Toronto’s Financial Services Sector
Find Conference Board research at www.e-library.ca. 30
The trends in the financial services sector that we have discussed thus far pertain broadly to Canada. We now turn our attention to Toronto’s role in the sector, as well as its contribution to the Canadian economy.
It is evident that Canada’s financial services sector is becoming more
concentrated in Toronto, as the share of the sector’s employment in
Toronto has risen over the past decade. In 2006, Toronto accounted for
29.8 per cent of Canadian financial services employment; this share had
risen to 33.7 per cent in 2016. By comparison, Toronto’s share of total
Canadian employment changed by a smaller amount over that period,
rising from 16.8 to 17.8 per cent. This indicates that Toronto has solidified
its position as Canada’s leading financial centre.
The growing importance of Toronto as a financial centre is also reflected
in a survey the Conference Board conducted in 2016 that assessed
the perceptions of financial professionals about Canada’s four global
financial centres. For example, 77 per cent of respondents felt that
Toronto had grown in importance over the past decade; only Calgary had
a higher share at 82 per cent. Key factors cited by respondents that have
contributed to the growing importance of Toronto include:
• the expanding international footprint of financial institutions
headquartered in Toronto;
• the stability and expansion of the sector in the post-2008 financial
crisis period;
• the growing presence of foreign financial institutions in the city;
• the growing presence of a fintech sector in the region.
Economic and Fiscal Impacts of the Sector in Toronto
when assessing the economic footprint of a sector, we can consider a
variety of effects. In this report we consider the following three economic
effects associated with Toronto’s financial sector:
Chapter 4 | The Conference Board of Canada
Find Conference Board research at www.e-library.ca. 31
• Direct effects. These are the economic effects directly associated
with the day-to-day operations of Toronto’s financial services sector.
Essentially, they include all of the economic activity of the sector itself
in Toronto.
• Indirect effects. The indirect, or supply chain, effects are the economic
effects associated with the financial services sector’s use of intermediate
inputs or other support services, both in Toronto and in the rest of
the country.
• Fiscal effects. Fiscal effects are the fiscal impact associated with
the direct and indirect economic effects at the federal, provincial, and
municipal levels.
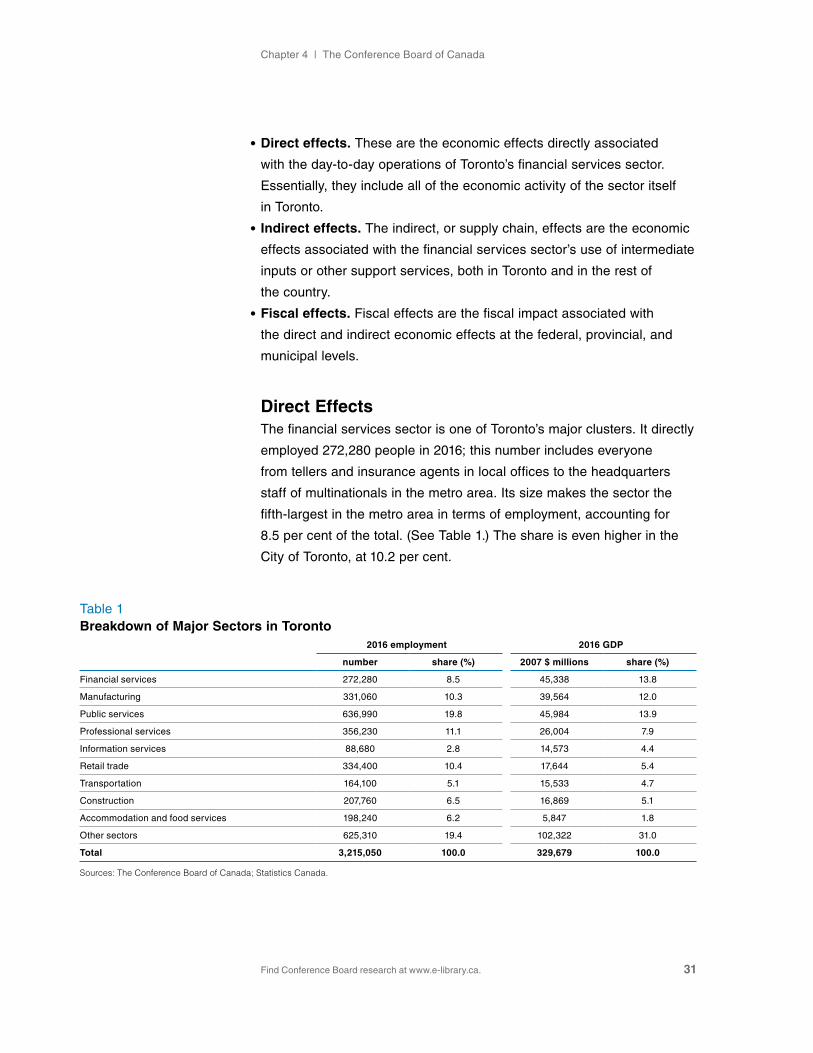
Direct EffectsThe financial services sector is one of Toronto’s major clusters. It directly
employed 272,280 people in 2016; this number includes everyone
from tellers and insurance agents in local offices to the headquarters
staff of multinationals in the metro area. Its size makes the sector the
fifth-largest in the metro area in terms of employment, accounting for
8.5 per cent of the total. (See Table 1.) The share is even higher in the
City of Toronto, at 10.2 per cent.
Table 1Breakdown of Major Sectors in Toronto
2016 employment 2016 GDP
number share (%) 2007 $ millions share (%)
Financial services 272,280 8.5 45,338 13.8
Manufacturing 331,060 10.3 39,564 12.0
Public services 636,990 19.8 45,984 13.9
Professional services 356,230 11.1 26,004 7.9
Information services 88,680 2.8 14,573 4.4
Retail trade 334,400 10.4 17,644 5.4
Transportation 164,100 5.1 15,533 4.7
Construction 207,760 6.5 16,869 5.1
Accommodation and food services 198,240 6.2 5,847 1.8
Other sectors 625,310 19.4 102,322 31.0
Total 3,215,050 100.0 329,679 100.0
Sources: The Conference Board of Canada; Statistics Canada.
PARTNERS IN GROwTh2017 Report Card on Canada and Toronto’s Financial Services Sector
Find Conference Board research at www.e-library.ca. 32
Toronto’s financial services sector has also been a significant source
of growth in recent years. In 2006, the sector employed 217,700 people
in Toronto. The increase in employment represents an average annual
growth of 2.3 per cent over the past decade, which compares favourably
with 1.5 per cent for all sectors in the Toronto metro area over the
same period.
Because employment growth in the sector has outpaced the average for
all sectors, financial services have increased as a share of Toronto’s
economy. Between 2006 and 2016, the sector’s share of the metro area’s
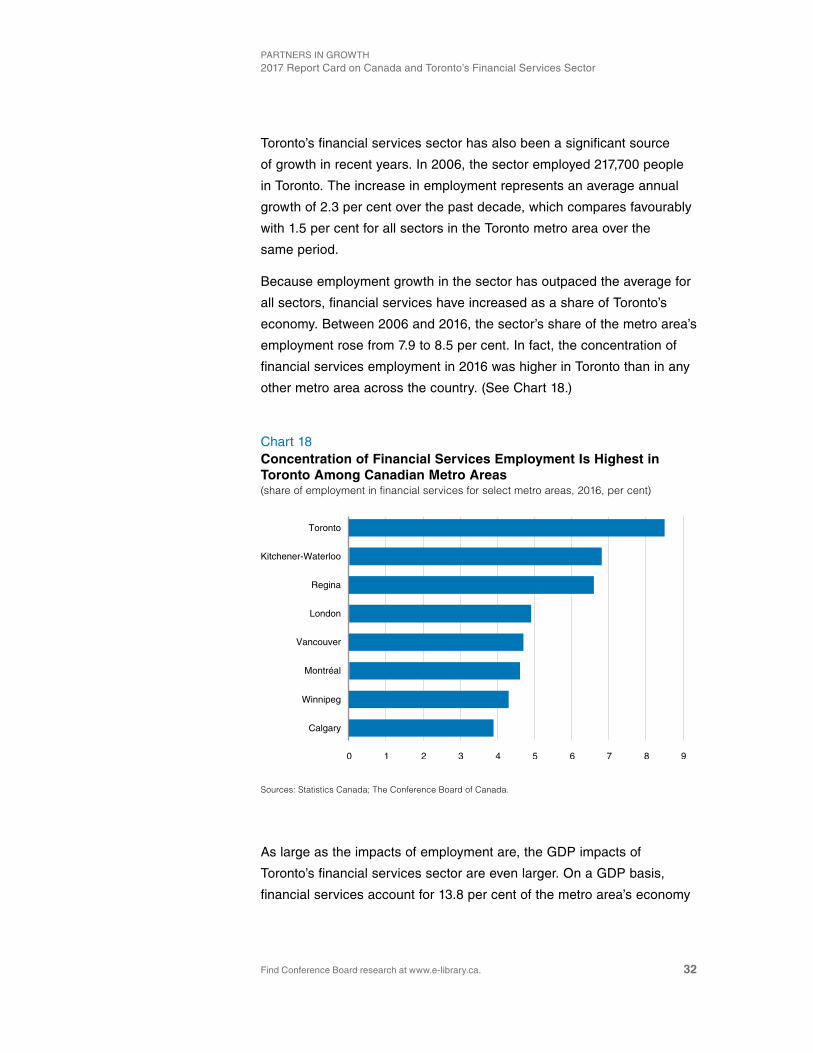
employment rose from 7.9 to 8.5 per cent. In fact, the concentration of
financial services employment in 2016 was higher in Toronto than in any
other metro area across the country. (See Chart 18.)
As large as the impacts of employment are, the GDP impacts of
Toronto’s financial services sector are even larger. On a GDP basis,
financial services account for 13.8 per cent of the metro area’s economy
Chart 18Concentration of Financial Services Employment Is Highest in Toronto Among Canadian Metro Areas(share of employment in financial services for select metro areas, 2016, per cent)
Sources: Statistics Canada; The Conference Board of Canada.
Toronto
Kitchener-Waterloo
Regina
London
Vancouver
Montréal
Winnipeg
Calgary
0 1 2 3 4 5 6 7 8 9

Chapter 4 | The Conference Board of Canada
Find Conference Board research at www.e-library.ca. 33
in 2016; this is second only to public services. Financial services account
for a larger share of Toronto’s GDP than its employment because GDP
per employee in the sector is significantly above average. Several
factors determine a sector’s GDP, including the wages and salaries that
it pays, the amount of depreciation of its assets, and the profits that it
earns. For all three factors, the financial services sector’s numbers are
above average.
For example, in Ontario, the sector’s average weekly earnings per
employee in 2016 were $1,323 versus the overall industrial average
of $973.1 As well, the sector’s depreciation expense per employee
in Canada was $13,381 versus $8,873 for all industries in 2016.2
Although the sector’s capital stock per employee is below average,
much of it consists of information technology equipment and software,
which depreciates quickly. The result is an ongoing need for a high
rate of investment per employee in the sector. Finally, nationally, the
sector’s profit margin was 24.6 per cent in 2016 versus 7.8 per cent for
all industries.3 Ultimately, the high level of GDP per employee in the
financial services sector reflects the fact that, in general, it generates a
high degree of value added for the economy.
Indirect EffectsIn addition to employing people directly, the financial services sector also
generates secondary or indirect effects in the economy. Indirect effects
measure the economic benefits associated with the financial services
sector’s use of intermediate inputs or other support services. In effect,
the indirect effects describe a sector’s supply chain, highlighting all of the
inputs necessary to conduct financial activity.
In aggregate, Toronto’s financial services sector supported an additional
226,940 jobs in 2016. Thus, the sector accounted for a total of
499,220 jobs once the direct effects are added to the indirect effects.
The indirect effects occurred largely in Toronto, but benefits did accrue
across the country. Of the 226,940 indirect jobs, 115,224 occurred in
1 Derived from Statistics Canada, CANSIM table 281-0026.
2 Derived from Statistics Canada, CANSIM table 187-0001, and the Labour Force Survey.
3 Derived from Statistics Canada, CANSIM table 187-0001.
In addition to employing people directly, the financial services sector also generates secondary or indirect effects in the economy.

PARTNERS IN GROwTh2017 Report Card on Canada and Toronto’s Financial Services Sector
Find Conference Board research at www.e-library.ca. 34
Toronto, 75,376 occurred in the rest of Ontario, and 36,340 occurred in
the rest of Canada. (See Table 2.)
Table 2Breakdown of Financial Services Employment and GDP Effects by Region
Toronto Rest of Ontario Rest of Canada
TotalDirect Indirect Indirect Indirect
ValueShare of
effects (%) ValueShare of
effects (%) ValueShare of
effects (%) ValueShare of
effects (%) ValueShare of
effects (%)
Employment (number) 272,280 54.5 115,224 23.1 75,376 15.1 36,340 7.3 499,220 100.0
GDP (2007 $ millions) 45,338 65.6 10,338 15.0 9,486 13.7 3,947 5.7 69,109 100.0
Sources: Statistics Canada; The Conference Board of Canada.
The indirect effects of a sector are often expressed as a multiplier,
which is the ratio of the combined direct and indirect effects to the
direct effects. In this case, the financial services sector had a multiplier
of 1.83, meaning that for every direct job in the sector, it supported
another 0.83 jobs through supply chain impacts. we can break those
results down further by region. Thus, every direct job in Toronto supports
another 0.42 indirect jobs in Toronto, 0.28 indirect jobs in the rest of
Ontario, and 0.13 indirect jobs in the rest of Canada.
The sector also has indirect GDP effects across Canada. In fact, for
every $100 of GDP the sector directly generated in Toronto, it indirectly
generated an additional $23 in Toronto, $21 in the rest of Ontario,
and $9 in the rest of Canada. This resulted in a total GDP multiplier
of 1.52 for the sector.
The GDP multiplier for the sector was lower than its employment
multiplier, because the sector has a high level of GDP per employee.
Essentially, since the sector’s direct GDP effects were above average,
a large denominator was used to calculate the multiplier. As a result,
the GDP multiplier was smaller than the employment multiplier. Other
sectors with high GDP per employee ratios, such as mining and utilities,
experience a similar effect.

Chapter 4 | The Conference Board of Canada
Find Conference Board research at www.e-library.ca. 35
Indirect Effects on Professional Services in TorontoIf we turn our focus to the indirect effects in Toronto, we can gain some
additional insights into which industries are supported by activity in the
financial services sector. In 2016, the single largest impact was in the
professional services industry, where financial services activity
supported 32,278 jobs. (See Chart 19.) Indeed, the relationship is so
strong that some professional services, such as legal and accounting
services, are sometimes considered to be part of the financial services
sector. In fact, if we add the direct effects of the financial services sector
and its indirect effects in the professional services sector, the total of
392,728 jobs equated to 12.2 per cent of Toronto’s total employment.
within the professional services sector, the consulting industry
experienced the largest impact; financial services activity supported
9,000 jobs in this industry. (See Chart 20.) Significantly, the financial
services sector also supported 6,481 legal services jobs (15.9 per cent of
Chart 19Professional Services Experienced the Largest Indirect Employment Effects in Toronto(indirect employment effects in Toronto by sector, 2016, 000s)
Sources: Statistics Canada; The Conference Board of Canada.
Other
Public sector
Holding companies
Wholesale trade
Accomodations & food services
Personal services
Real estate, rentals, & leasing
Information services
Transportation
Retail trade
Administrative services
Professional services
0 5 10 15 20 25 30 35
32.3
21.6
8.8
8.6
8.4
7.4
6.2
5.1
4.9
4.1
3.2
10.0

PARTNERS IN GROwTh2017 Report Card on Canada and Toronto’s Financial Services Sector
Find Conference Board research at www.e-library.ca. 36
local industry employment) and 4,321 accounting services jobs (9.3 per
cent of local industry employment).
The financial services sector also had a sizable effect on the computer
services industry, supporting 8,268 jobs, or 7.8 per cent of local industry
employment. This reflected the sector’s heavy use of information
technology. In fact, the Conference Board estimates that 47 per cent of
total financial sector investment in Canada was related to information
technology equipment and services in 2015.4 As well, IT-related
employment in Toronto’s financial services sector has effectively doubled
since 2010, reaching 40,400 in 2016. In short, IT positions now directly
account for 14.8 per cent of the sector’s employment in the metro area.
Indirect Effects on Administrative Services in TorontoProfessional services were not the only sector where financial
services activity had a major impact. The second-largest indirect
effects in Toronto occurred in the administrative services sector. This
sector is primarily engaged in activities that support the day-to-day
operations of other organizations. Financial services activity supported
21,555 administrative services jobs in Toronto in 2016.
4 Derived from Statistics Canada, CANSIM tables 031-0005 and 031-0006.
Chart 20Financial Services Support a Variety of Professional Services Industries(professional services employment effects in Toronto by industry, 2016, number)
Sources: Statistics Canada; The Conference Board of Canada.
9,000
8,2686,481
4,321
1,6262,619 Consulting
Computer services
Legal
Accounting
Advertising
Other professional services
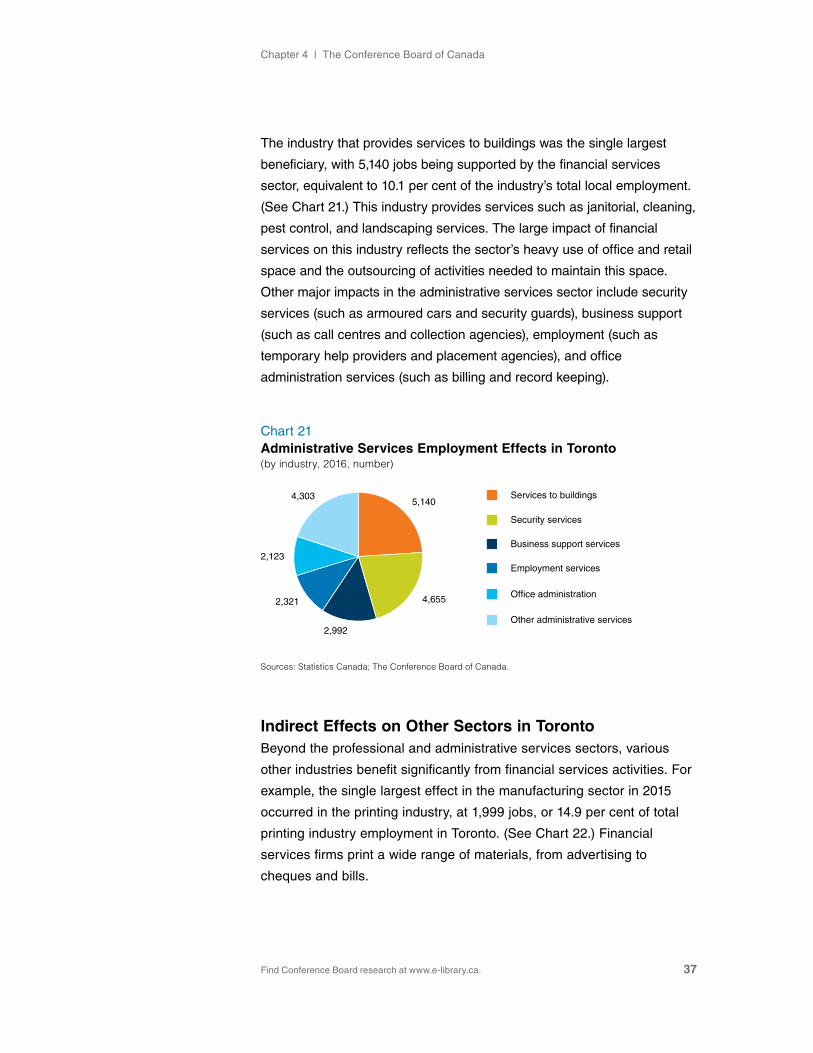
Chapter 4 | The Conference Board of Canada
Find Conference Board research at www.e-library.ca. 37
The industry that provides services to buildings was the single largest
beneficiary, with 5,140 jobs being supported by the financial services
sector, equivalent to 10.1 per cent of the industry’s total local employment.
(See Chart 21.) This industry provides services such as janitorial, cleaning,
pest control, and landscaping services. The large impact of financial
services on this industry reflects the sector’s heavy use of office and retail
space and the outsourcing of activities needed to maintain this space.
Other major impacts in the administrative services sector include security
services (such as armoured cars and security guards), business support
(such as call centres and collection agencies), employment (such as
temporary help providers and placement agencies), and office
administration services (such as billing and record keeping).
Indirect Effects on Other Sectors in TorontoBeyond the professional and administrative services sectors, various
other industries benefit significantly from financial services activities. For
example, the single largest effect in the manufacturing sector in 2015
occurred in the printing industry, at 1,999 jobs, or 14.9 per cent of total
printing industry employment in Toronto. (See Chart 22.) Financial
services firms print a wide range of materials, from advertising to
cheques and bills.
Chart 21Administrative Services Employment Effects in Toronto(by industry, 2016, number)
Sources: Statistics Canada; The Conference Board of Canada.
5,140
4,655
2,992
2,321
2,123
4,303 Services to buildings
Security services
Business support services
Employment services
Office administration
Other administrative services
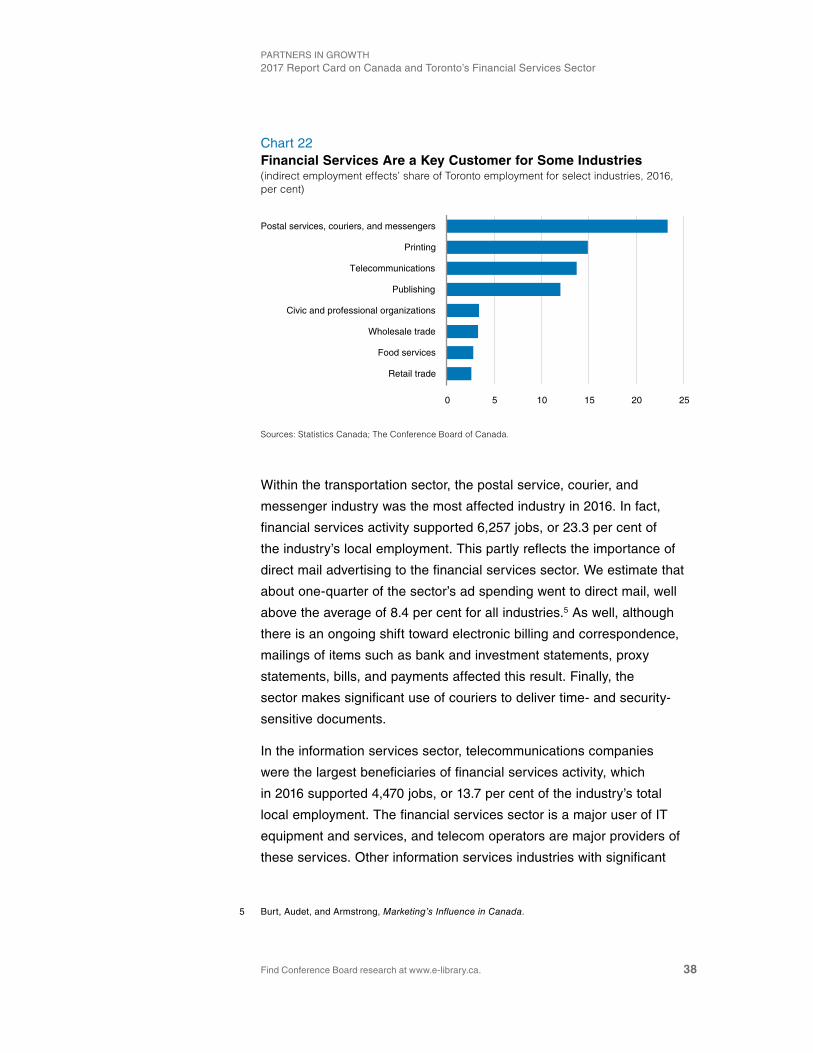
PARTNERS IN GROwTh2017 Report Card on Canada and Toronto’s Financial Services Sector
Find Conference Board research at www.e-library.ca. 38
within the transportation sector, the postal service, courier, and
messenger industry was the most affected industry in 2016. In fact,
financial services activity supported 6,257 jobs, or 23.3 per cent of
the industry’s local employment. This partly reflects the importance of
direct mail advertising to the financial services sector. we estimate that
about one-quarter of the sector’s ad spending went to direct mail, well
above the average of 8.4 per cent for all industries.5 As well, although
there is an ongoing shift toward electronic billing and correspondence,
mailings of items such as bank and investment statements, proxy
statements, bills, and payments affected this result. Finally, the
sector makes significant use of couriers to deliver time- and security-
sensitive documents.
In the information services sector, telecommunications companies
were the largest beneficiaries of financial services activity, which
in 2016 supported 4,470 jobs, or 13.7 per cent of the industry’s total
local employment. The financial services sector is a major user of IT
equipment and services, and telecom operators are major providers of
these services. Other information services industries with significant
5 Burt, Audet, and Armstrong, Marketing’s Influence in Canada.
Chart 22Financial Services Are a Key Customer for Some Industries (indirect employment effects’ share of Toronto employment for select industries, 2016, per cent)
Sources: Statistics Canada; The Conference Board of Canada.
Retail trade
Food services
Wholesale trade
Civic and professional organizations
Publishing
Telecommunications
Printing
Postal services, couriers, and messengers
0 5 10 15 20 25
23.3
14.9
13.7
12.0
3.4
3.3
2.8
2.6

Chapter 4 | The Conference Board of Canada
Find Conference Board research at www.e-library.ca. 39
effects include publishing (1,750 jobs) and data processing (1,713 jobs).
In publishing, this reflects the importance of information as an input in
sector activities such as asset management, investing, and trading. The
effects in the data processing industry reflect the data-intensive nature
of the financial services sector, particularly those segments that are
transaction-oriented, such as exchanges and banking.
Although the financial services sector accounted for a smaller share of
their total employment, sectors such as retail and wholesale trade also
experienced significant employment effects, at 8,802 and 4,879 jobs,
respectively. These industries experience economic impacts from activity
in most industries, because they connect businesses and consumers
across the economy.
Fiscal EffectsThe direct and indirect effects associated with Toronto’s financial
services sector also have significant fiscal implications for the
City of Toronto, for Ontario, and at the federal level. The sector affects
federal and provincial government revenues in several key areas,
including the personal income taxes that employees pay on their wages
and salaries; corporate taxes on the profits that financial services firms
generate; and indirect taxes, which include things such as sales taxes
and fuel taxes. At the municipal level, the employees of financial services
firms require office space, and property taxes are paid on this space.
In total, we estimate that Toronto’s financial services sector generated
a combined $17.5 billion in fiscal benefits in 2016 for the Canadian,
Ontario, and City of Toronto governments. (See Chart 23.)
Toronto’s financial services sector generated $17.5 billion in fiscal benefits in 2016 for the Canadian, Ontario, and City of Toronto governments.

PARTNERS IN GROwTh2017 Report Card on Canada and Toronto’s Financial Services Sector
Find Conference Board research at www.e-library.ca. 40
FederalAmong the different levels of government, Toronto’s financial services
sector had the largest impact on the federal government. The sector
generated $9.3 billion in revenue for the federal government in 2016. This
was equivalent to 3.2 per cent of the federal government’s $290.6 billion
in reported revenues for fiscal 2016–17.6 Personal income taxes were
the single largest source of these revenues, accounting for $3.6 billion,
or 38 per cent of the total. The second-largest source of federal tax
revenues—at $2.6 billion, or 27 per cent of the total—was the goods
and services tax on sales transactions in the financial services sector’s
supply chain. The third major source of federal government revenues
was corporate profits taxes, which came to $2.2 billion, or 23.3 per cent
of the total.
ProvincialThe fiscal impact of Toronto’s financial sector in Ontario was smaller
than the national impact, but it was more significant as a share of the
province’s budget. we estimate that the province received $7.9 billion
in revenues in 2016 as a result of economic activity supported by the
sector. This was equivalent to 6 per cent of the province’s total planned
6 Department of Finance Canada, The Fiscal Monitor.
Chart 23Toronto’s Financial Services Sector Generates Billions in Government Revenues(government revenues by level, $ billions)
Source: The Conference Board of Canada.
9.37.9
0.610.31
Federal
Ontario
Other provinces
City of Toronto
Chapter 4 | The Conference Board of Canada
Find Conference Board research at www.e-library.ca. 41
revenues of $130.6 billion in fiscal 2016–17.7 The single largest benefit
came from sales taxes ($3.9 billion), followed by personal income taxes
($2.2 billion) and corporate income taxes ($1.3 billion).
Although the vast majority of the economic effects associated with
Toronto’s financial sector occurred in Ontario, another $610 million in
fiscal effects accrued in other provinces. Quebec, garnering $283 million
in fiscal benefits, was the single largest beneficiary outside of Ontario,
followed by British Columbia and Alberta. As well, depending on how the
federal fiscal effects were spread across the country, the other provinces
would receive additional benefits associated with federal spending.
MunicipalThe final fiscal impact associated with the financial services sector
comes from the office space that its employees occupy. we found that
the sector supported 392,728 jobs in the Toronto metro area in 2016,
both directly and indirectly. however, not all of these jobs were in the
City of Toronto, nor did all of them require office space. In fact, we
estimate that 187,700 of those jobs were in the City of Toronto and
required some form of commercial space (office or retail). This was
equivalent to 20.7 per cent of the total employment in the City of Toronto
that used commercial space.
Using these employment figures and City of Toronto data on property
tax collections, we estimate that $307 million in municipal taxes in 2016
can be directly and indirectly linked to Toronto’s financial services sector.
That was equivalent to 7.9 per cent of Toronto’s total property taxes
and 2.5 per cent of the city’s total revenues of $12.2 billion in 2016.8 Of
course, the other municipalities that make up the Toronto metro area—
such as Mississauga, Oakville, and Markham—would have also received
fiscal benefits.
7 Government of Ontario, 2017 Ontario Budget, Chapter VI.
8 City of Toronto, 2016 Consolidated Financial Statements.
we estimate that $307 million in municipal taxes in 2016 can be linked to Toronto’s financial services sector.
PARTNERS IN GROwTh2017 Report Card on Canada and Toronto’s Financial Services Sector
Find Conference Board research at www.e-library.ca. 42
Structure of Toronto’s Sector
Toronto’s financial services sector is made up of many constituent
parts that offer a variety of services. The key industries within the
sector include:
• banking
• credit unions
• insurance
• asset management
• securities
• exchanges
• back office operations
however, the distinctions between these industries have blurred over
time. In 1991, regulatory changes ended the policy of separating the
sector into “four pillars” (banks, insurance, trusts, and investment
dealers). As a result, different industries in the sector offer many similar
products and services. For example, many of the largest banks in
Canada offer insurance and asset management services, and some
large insurance providers offer asset management or banking services.
Because of the way industry statistics are compiled, the blurring of the
lines between industries can make cross-industry comparisons difficult.
Employees of an organization that earns most of its revenues from
banking would generally be recorded as banking industry employees,
even if the services they provide might be better classified under a
different industry. This problem affects the asset management industry
the most. with this caveat in mind, it is still instructive to look at the
structure of the industries that make up the financial services sector. In
terms of employment, three industries—banking, insurance, and
securities—accounted for a combined total of 92 per cent of Toronto’s
financial services employment in 2016. (See Chart 24.) This share
declined modestly over the past decade. Although banking employment
experienced above-average growth, insurance and securities
employment did not. As a result, these two industries now account for a
smaller share of Toronto’s financial services sector. In their place, the
banking and back office operations industries now account for a larger
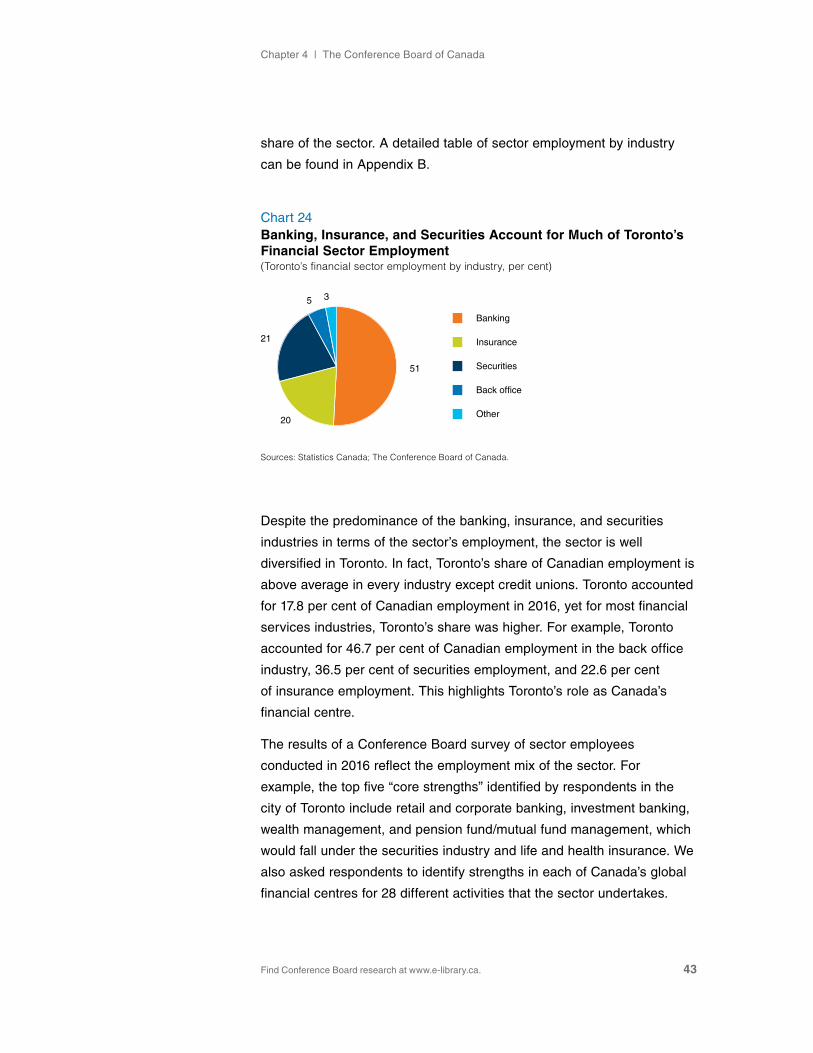
Chapter 4 | The Conference Board of Canada
Find Conference Board research at www.e-library.ca. 43
share of the sector. A detailed table of sector employment by industry
can be found in Appendix B.
Despite the predominance of the banking, insurance, and securities
industries in terms of the sector’s employment, the sector is well
diversified in Toronto. In fact, Toronto’s share of Canadian employment is
above average in every industry except credit unions. Toronto accounted
for 17.8 per cent of Canadian employment in 2016, yet for most financial
services industries, Toronto’s share was higher. For example, Toronto
accounted for 46.7 per cent of Canadian employment in the back office
industry, 36.5 per cent of securities employment, and 22.6 per cent
of insurance employment. This highlights Toronto’s role as Canada’s
financial centre.
The results of a Conference Board survey of sector employees
conducted in 2016 reflect the employment mix of the sector. For
example, the top five “core strengths” identified by respondents in the
city of Toronto include retail and corporate banking, investment banking,
wealth management, and pension fund/mutual fund management, which
would fall under the securities industry and life and health insurance. we
also asked respondents to identify strengths in each of Canada’s global
financial centres for 28 different activities that the sector undertakes.
Chart 24Banking, Insurance, and Securities Account for Much of Toronto’s Financial Sector Employment(Toronto’s financial sector employment by industry, per cent)
Sources: Statistics Canada; The Conference Board of Canada.
51
20
21
5 3
Banking
Insurance
Securities
Back office
Other

PARTNERS IN GROwTh2017 Report Card on Canada and Toronto’s Financial Services Sector
Find Conference Board research at www.e-library.ca. 44
Credit unions were the only activity that a majority of respondents did
not identify as a strength for Toronto, as well as the only activity where
respondents did not rank Toronto first among the four cities.
we see somewhat different patterns when we look at the number of
financial services businesses. According to Statistics Canada’s business
registry, 8,841 financial services businesses were operating in Toronto
as of June 2017. Nearly half of these were in the securities industry
(44.0 per cent), followed by insurance (24.4 per cent) and banking
(19.6 per cent). Because the securities industry is sizable and includes
many small businesses, it has a high share of the sector’s businesses.
In fact, in June 2017, 87 per cent of securities enterprises in Toronto
had fewer than 20 employees. A detailed table of financial services
establishments by employment can be found in Appendix B.
Small businesses are common in most of the industries that make
up Toronto’s financial sector. In 2017, 81.0 per cent of enterprises
had fewer than 20 employees, versus 87.3 per cent for all industries.
however, some segments have more large businesses than others. For
example, 10.8 per cent of property and casualty insurers had more than
200 employees. This may sound like a small share, but it is actually well
above average. In fact, only 1.1 per cent of all businesses across all
industries in Toronto had more than 200 employees.
within the financial services sector, large businesses are most common
in segments such as retail and commercial banking, insurance carriers,
credit card issuance, and exchanges, where larger businesses are
most likely to incur significant benefits. For example, capital-intensive
businesses can benefit from economies of scale. As well, size can
improve the perceived safety of a financial institution and lead to real
benefits, such as lower borrowing costs and reduced counterparty risk
premiums when dealing with other financial institutions. Finally, some
segments, such as retail banking, can benefit from the network effects
that come with scale. Larger banks generally have more locations
where customers can conduct transactions, thus improving customer
convenience and service.
Small businesses are common in most of the industries that make up Toronto’s financial sector.

Find Conference Board research at www.e-library.ca.
CHAPTER 5
Toronto as a Global Financial Centre
Chapter Summary
• Toronto is highly ranked among global financial centres; The Banker ranks it eighth and the Global Financial Centres Index (GFCI) places it seventh in its most recent survey, up six spots from a year ago.
• According to the GFCI, Toronto’s key assets include its human capital and reputation.
• According to The Banker, Toronto’s key areas of strength include high levels of outward foreign direct investment, international debt securities, pre-tax profits, cost factors, and total bank assets.
• with financial services accounting for 8.5 per cent of the metro area’s employment, Toronto’s proportional reliance on financial services is even higher than that of major global financial centres such as London and New York.
PARTNERS IN GROwTh2017 Report Card on Canada and Toronto’s Financial Services Sector
Find Conference Board research at www.e-library.ca. 46
Not only is Toronto the largest financial centre in Canada, it is a globally recognized financial hub and generally ranks well compared to other global financial centres. In a 2016 survey conducted by The Conference Board of Canada, 74 per cent of Canadian professionals who responded described Toronto’s financial services sector as “globally significant.” This was a much higher share than the other three cities in the survey, all of which had a share below 30 per cent.
Global rankings also recognize the importance of Toronto’s financial
sector. while the city consistently ranks behind London, New York,
Singapore, and hong Kong—the undisputed top four centres—it
is normally on par or better than other financial hubs. The Banker
magazine ranked Toronto eighth in its most recent survey,1 while the
most recent Global Financial Centres Index (GFCI) report ranked it
seventh—a rise of six positions compared to a year ago.2 The increase
appears to be mostly attributed to the poor performance of some U.S.
financial centres, as San Francisco, Boston, Chicago, and washington
all dropped below Toronto in the last year.
Toronto’s high ranking in the GFCI is complemented by the fact that
the report lists only 15 cities as having financial sectors that are both
broad and deep. (See Table 3.) It is also worth noting that both surveys
now rank Toronto as the second most important financial centre in
North America.
1 Pavoni, “Brexit-Bound London.”
2 Yeandle, The Global Financial Centres Index 22.

Chapter 5 | The Conference Board of Canada
Find Conference Board research at www.e-library.ca. 47
Table 3Rankings of Broad and Deep Global Financial Centres
London 1
New York 2
hong Kong 3
Singapore 4
Tokyo 5
Shanghai 6
Toronto 7
Sydney 8
Zurich 9
Beijing 10
Frankfurt 11
Geneva 15
Dubai 18
Abu Dhabi 25
Paris 26
Source: GFCI.
The GFCI uses a combination of “instrument-based factors” from other
reports and its own survey to generate its rankings. The categories
of instrumental factors include business environment, financial sector
development, infrastructure, human capital, and reputation. According
to the GFCI methodology, Toronto ranks in the top 10 among global
financial centres in terms of reputation (10th). while this is slightly below
what the quantitative data suggest, it substantiates the generally positive
opinions about Toronto’s financial sector.
The GFCI survey also presents sub-indices based on its surveys, where
rankings are created using the responses of professionals working in
the relevant industry sectors. These five industry sectors are investment
management, banking, government and regulatory, insurance, and
professional services. In both instrument- and survey-based rankings,
Toronto ranks in the top 15 in most categories (See Table 4.) As
expected, the large financial centres dominate the rankings.
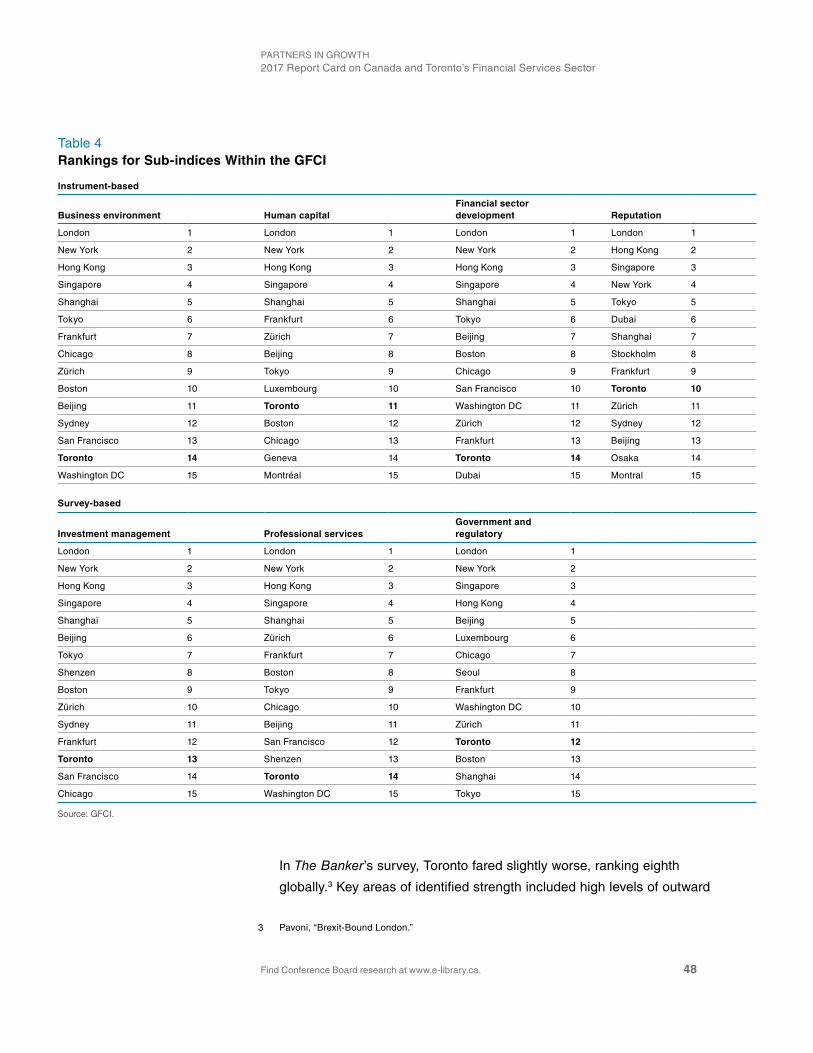
PARTNERS IN GROwTh2017 Report Card on Canada and Toronto’s Financial Services Sector
Find Conference Board research at www.e-library.ca. 48
Table 4Rankings for Sub-indices Within the GFCI
Instrument-based
Business environment Human capitalFinancial sector development Reputation
London 1 London 1 London 1 London 1
New York 2 New York 2 New York 2 hong Kong 2
hong Kong 3 hong Kong 3 hong Kong 3 Singapore 3
Singapore 4 Singapore 4 Singapore 4 New York 4
Shanghai 5 Shanghai 5 Shanghai 5 Tokyo 5
Tokyo 6 Frankfurt 6 Tokyo 6 Dubai 6
Frankfurt 7 Zürich 7 Beijing 7 Shanghai 7
Chicago 8 Beijing 8 Boston 8 Stockholm 8
Zürich 9 Tokyo 9 Chicago 9 Frankfurt 9
Boston 10 Luxembourg 10 San Francisco 10 Toronto 10
Beijing 11 Toronto 11 washington DC 11 Zürich 11
Sydney 12 Boston 12 Zürich 12 Sydney 12
San Francisco 13 Chicago 13 Frankfurt 13 Beijing 13
Toronto 14 Geneva 14 Toronto 14 Osaka 14
washington DC 15 Montréal 15 Dubai 15 Montral 15
Survey-based
Investment management Professional servicesGovernment and regulatory
London 1 London 1 London 1
New York 2 New York 2 New York 2
hong Kong 3 hong Kong 3 Singapore 3
Singapore 4 Singapore 4 hong Kong 4
Shanghai 5 Shanghai 5 Beijing 5
Beijing 6 Zürich 6 Luxembourg 6
Tokyo 7 Frankfurt 7 Chicago 7
Shenzen 8 Boston 8 Seoul 8
Boston 9 Tokyo 9 Frankfurt 9
Zürich 10 Chicago 10 washington DC 10
Sydney 11 Beijing 11 Zürich 11
Frankfurt 12 San Francisco 12 Toronto 12
Toronto 13 Shenzen 13 Boston 13
San Francisco 14 Toronto 14 Shanghai 14
Chicago 15 washington DC 15 Tokyo 15
Source: GFCI.
In The Banker’s survey, Toronto fared slightly worse, ranking eighth
globally.3 Key areas of identified strength included high levels of outward
3 Pavoni, “Brexit-Bound London.”
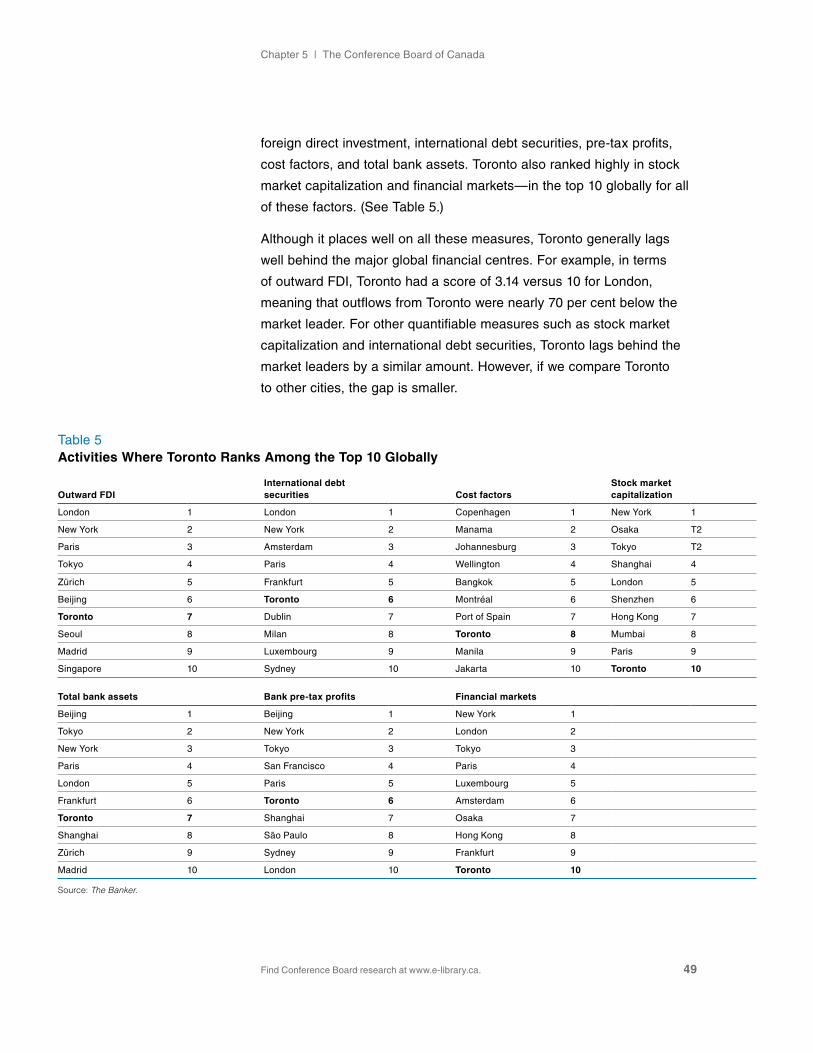
Chapter 5 | The Conference Board of Canada
Find Conference Board research at www.e-library.ca. 49
foreign direct investment, international debt securities, pre-tax profits,
cost factors, and total bank assets. Toronto also ranked highly in stock
market capitalization and financial markets—in the top 10 globally for all
of these factors. (See Table 5.)
Although it places well on all these measures, Toronto generally lags
well behind the major global financial centres. For example, in terms
of outward FDI, Toronto had a score of 3.14 versus 10 for London,
meaning that outflows from Toronto were nearly 70 per cent below the
market leader. For other quantifiable measures such as stock market
capitalization and international debt securities, Toronto lags behind the
market leaders by a similar amount. however, if we compare Toronto
to other cities, the gap is smaller.
Table 5Activities Where Toronto Ranks Among the Top 10 Globally
Outward FDIInternational debt securities Cost factors
Stock market capitalization
London 1 London 1 Copenhagen 1 New York 1
New York 2 New York 2 Manama 2 Osaka T2
Paris 3 Amsterdam 3 Johannesburg 3 Tokyo T2
Tokyo 4 Paris 4 wellington 4 Shanghai 4
Zürich 5 Frankfurt 5 Bangkok 5 London 5
Beijing 6 Toronto 6 Montréal 6 Shenzhen 6
Toronto 7 Dublin 7 Port of Spain 7 hong Kong 7
Seoul 8 Milan 8 Toronto 8 Mumbai 8
Madrid 9 Luxembourg 9 Manila 9 Paris 9
Singapore 10 Sydney 10 Jakarta 10 Toronto 10
Total bank assets Bank pre-tax profits Financial markets
Beijing 1 Beijing 1 New York 1
Tokyo 2 New York 2 London 2
New York 3 Tokyo 3 Tokyo 3
Paris 4 San Francisco 4 Paris 4
London 5 Paris 5 Luxembourg 5
Frankfurt 6 Toronto 6 Amsterdam 6
Toronto 7 Shanghai 7 Osaka 7
Shanghai 8 São Paulo 8 hong Kong 8
Zürich 9 Sydney 9 Frankfurt 9
Madrid 10 London 10 Toronto 10
Source: The Banker.
PARTNERS IN GROwTh2017 Report Card on Canada and Toronto’s Financial Services Sector
Find Conference Board research at www.e-library.ca. 50
In short, London and New York are clearly the largest global financial
centres. They remain in a league of their own, and consistently vie for first
or second place in the global rankings. Similarly, Singapore and hong
Kong generally compete for the third- and fourth-place rankings. Toronto is
part of a group of cities that compete below these four large centres.
That said, on the measures where Toronto ranked the highest, it often
does better than some of the larger centres. For instance, Toronto ranks
above Singapore and hong Kong when it comes to outward FDI, total
assets, and international debt security issuance. Toronto can even
compete with London and New York on some measures. It outranks
both cities in terms of cost factors and bests London in the case of
bank profitability.
Given the difference in the results, it is clear that The Banker and GFCI
rankings are not fully comparable. For instance, the GFCI combines
quantitative results in five broad categories with its own survey of global
finance industry professionals to create an overall ranking. Alternatively,
The Banker compiles financial data ranging from economic potential to
business environment.4 All in all, the rankings provided by The Banker
are more data-driven, while the GFCI’s also reflect survey responses.
Employment in Global Financial Centres
Beyond these surveys, Toronto ranked highly compared to other global
financial centres in terms of employment. Indeed, 272,280 people
were employed in Toronto’s financial services sector in 2016, meaning
the city ranked sixth among the global financial centres we consider
here. (See Chart 25.) what is more, Toronto is the most dependent of
these cities on the financial services sector and in a league of its own
along with Zürich. (See Chart 26.) with financial services accounting
for 8.5 per cent of the metro area’s employment, Toronto’s proportional
reliance on financial services is even higher than that of major global
financial centres such as London and New York, which have much
larger populations.
4 Ibid.
where Toronto ranked the highest, it often does better than some of the larger centres.

Chapter 5 | The Conference Board of Canada
Find Conference Board research at www.e-library.ca. 51
It is also interesting to note how Toronto’s financial services sector
has grown over the past decade in comparison with some of the other
financial centres. For example, while all major Canadian centres have
posted significant increases in employment in the last decade, Toronto’s
financial services sector increased by the most at 25.1 per cent,
generating 54,580 new financial services positions. (See Chart 27.)
Chart 25Toronto Has a Significant Number of Financial Services Employees(financial services employment, 2016 or most recent, 000s)
Sources: Various national statistical agencies.
Calgary
Geneva
Dubai
Vancouver
Zürich
Montréal
Washington
Frankfurt
Boston
Sydney
San Francisco
São Paulo
Chicago
Singapore
Hong Kong
Mumbai
Seoul
Toronto
Tokyo
Shanghai
London
New York
Beijing
0 50 100 150 200 250 300 350 400 450 500

PARTNERS IN GROwTh2017 Report Card on Canada and Toronto’s Financial Services Sector
Find Conference Board research at www.e-library.ca. 52
Chart 26The Importance of Financial Services to Toronto Is Higher Than in Other Financial Centres(financial services employment as a share of the total, per cent)
Sources: Various national statistical agencies.
Dubai
Washington
Calgary
Tokyo
São Paulo
Seoul
Montréal
Vancouver
Mumbai
Shanghai
Chicago
Hong Kong
Geneva
San Francisco
Beijing
Singapore
London
New York
Sydney
Boston
Frankfurt
Zürich
Toronto
0 1 2 3 4 5 6 7 8 9
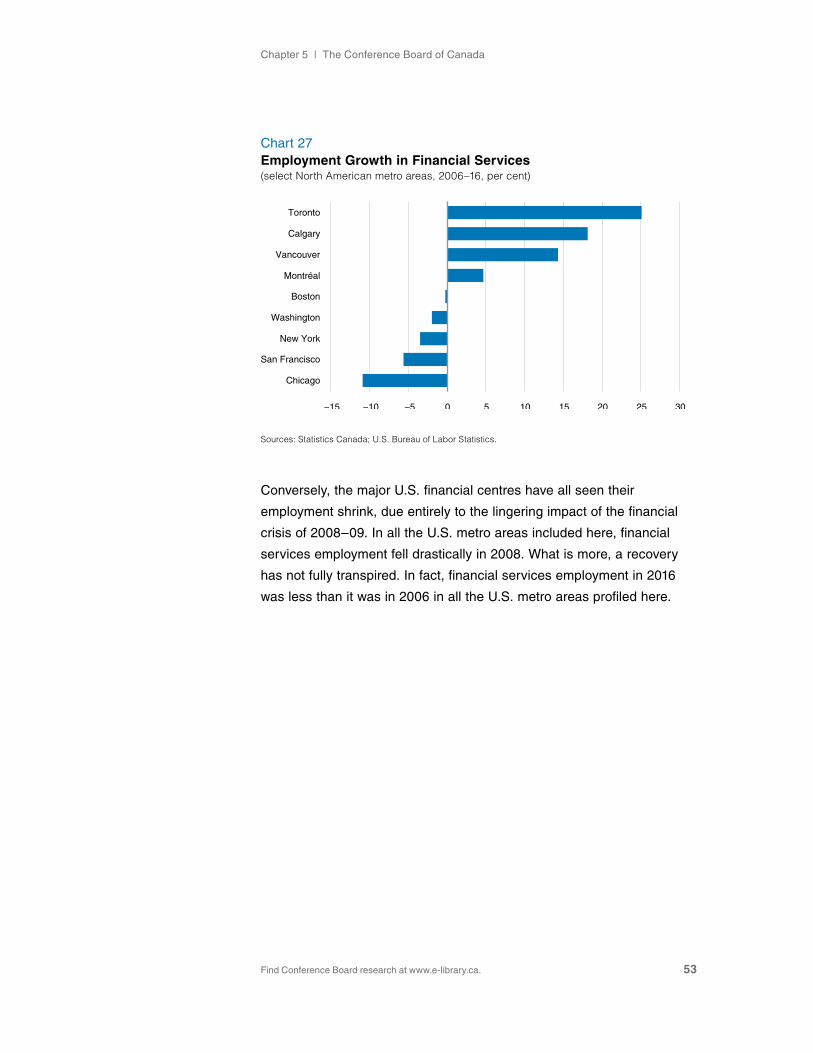
Chapter 5 | The Conference Board of Canada
Find Conference Board research at www.e-library.ca. 53
Conversely, the major U.S. financial centres have all seen their
employment shrink, due entirely to the lingering impact of the financial
crisis of 2008–09. In all the U.S. metro areas included here, financial
services employment fell drastically in 2008. what is more, a recovery
has not fully transpired. In fact, financial services employment in 2016
was less than it was in 2006 in all the U.S. metro areas profiled here.
Chart 27Employment Growth in Financial Services(select North American metro areas, 2006–16, per cent)
Sources: Statistics Canada; U.S. Bureau of Labor Statistics.
Chicago
San Francisco
New York
Washington
Boston
Montréal
Vancouver
Calgary
Toronto
−15 −10 −5 0 5 10 15 20 25 30

Find Conference Board research at www.e-library.ca.
CHAPTER 6
Conclusion
Chapter Summary
• Looking only at employment understates the importance of the financial services sector to Canada’s economy. For example, the sector accounts for 34 per cent of profits from all industries and 48 per cent of the stock of outward FDI.
• Financial services have been a major source of growth for the Canadian economy over the past decade, with the sector’s employment, GDP, and international trade and investment performance all outpacing the average for all sectors.
• Key areas of strength for the sector include its financial and international trade and investment performance, but its productivity performance has been more modest.
• Toronto’s role as Canada’s largest financial hub has grown as the region’s share of domestic activity has increased.

Chapter 6 | The Conference Board of Canada
Find Conference Board research at www.e-library.ca. 55
Our analysis has shown that the financial services sector is a critical part of the Canadian economy. This is apparent in a myriad of ways. For example, the sector directly accounts for 4.5 per cent of Canadian employment, but this figure understates the impact of the sector in many ways. At the same time it accounts for:
• 18 per cent of Canada’s foreign affiliate sales
• 34 per cent of the net profits generated by all industries
• 48 per cent of the stock of outward FDI undertaken by Canadian firms
what is more, the sector’s importance is growing. For most of the
indicators we looked at in this report, including employment, GDP,
profitability, and international trade and investment, the sector’s share of
Canadian activity has grown over the past decade.
Beyond its direct footprint, the financial services sector plays an important
role as a facilitator in the economy. It provides key functions that almost
all consumers and businesses require, including access to credit,
transaction processing, and risk management services. The sector plays a
particularly critical role in enabling the growth and innovation of Canada’s
SMEs. Canada routinely ranks in the top 20 countries in the world in The
Global Innovation Index, thanks largely to SMEs that collectively make
up 99.7 per cent of firms in Canada. There is also evidence that SMEs
account for most of Canada’s economic growth. without the support that
financial institutions provide, SMEs would not be the important drivers of
economic growth that they are.
Given the size and growing importance of the sector, as well as its role
as facilitator, assessing its performance is critical. In this report, we have
examined how financial services compares to other sectors domestically
and its peers internationally. Broadly speaking, the sector is a leader
among others when it comes to international trade and investment. Growth
in exports, investment, and foreign affiliate sales for Canadian financial
institutions has all been considerably stronger than average. For example,
the sector accounts for nearly one-fifth of Canadian foreign affiliate sales.
PARTNERS IN GROwTh2017 Report Card on Canada and Toronto’s Financial Services Sector
Find Conference Board research at www.e-library.ca. 56
It is in this environment that we focus on Toronto’s role in Canada’s
financial sector. Key findings about Toronto’s financial sector include
the following:
Financial services are a key cluster for Toronto. Financial services
are a major part of the metro area’s economy, in both direct and indirect
terms. Only a handful of other sectors, such as manufacturing and
government services, have a similar level of importance for the region.
As such, ensuring the continued health of the sector is critical to the
region’s performance.
The importance of the cluster in Toronto is growing. Toronto
accounts for a growing share of Canada’s financial services sector.
At the same time, the sector’s importance to Toronto’s economy is
increasing. Respondents to our survey identified several things that will
be necessary if the sector is to continue experiencing above-average
growth. These include attracting more inward FDI, better marketing of
the sector internationally, fostering further innovation, and ensuring the
availability of a workforce with the right skills.
Toronto’s financial sector is broad and deep. we have shown that
in nearly every major segment of the financial services sector, Toronto
has an above-average degree of concentration. Indeed, the GFCI
defines only 14 other financial centres globally as being both broad and
deep. This breadth provides the sector with some resiliency against
unforeseen events.
Toronto is ranked highly among the global financial centres.
Independent rankings, such as The Banker and the GFCI, and our
survey results place Toronto as the largest global financial centre in
Canada and one of the most important in the world. while the city
consistently ranks behind London, New York, Singapore, and hong
Kong—the undisputed top four centres—it is normally on par or better
than all other financial hubs.
The sector cannot rest on its laurels. Despite its success, Toronto’s
financial sector faces a highly competitive environment; thus, its future
The financial services sector is a leader among others when it comes to international trade and investment.

Chapter 6 | The Conference Board of Canada
Find Conference Board research at www.e-library.ca. 57
performance is not assured. For example, fintech has been developing
in the region and has the potential to cause significant disruptions to the
sector’s large incumbent firms. Ongoing innovation is critical if the sector
is to continue being a source of growth for both Toronto and Canada.
Rate this publication for a chance to win a prize!
www.conferenceboard.ca/e-Library/abstract.aspx?did=9264

PARTNERS IN GROwTh2017 Report Card on Canada and Toronto’s Financial Services Sector
Find Conference Board research at www.e-library.ca. 58
APPENDIX A
Bibliography
Audet, Kristelle. Selling to the World: The Keys to International Business
Success. Ottawa: The Conference Board of Canada, 2015.
Burt, Michael. An Engine for Growth: 2016 Report Card on Canada and
Toronto’s Financial Services Sector. Ottawa: The Conference Board of
Canada, 2016.
Burt, Michael, and Lin Ai. Going Abroad: Examining the International
Footprint of Canada’s Financial Services Sector. Ottawa: The
Conference Board of Canada, 2014.
Burt, Michael, Kristelle Audet, and Maxim Armstrong. Marketing’s
Influence in Canada: In an Evolving Digital Economy. Ottawa: The
Conference Board of Canada, 2012.
Canadian Life and health Insurance Association. Canadian Life and
Health Insurance Facts: 2016 Edition. Toronto: Canadian Life and health
Insurance Association, 2016.
Canadian Venture Capital and Private Equity Association. VC & PE
Canadian Market Overview: 2016. Toronto: Canadian Venture Capital
and Private Equity Association, 2017.
City of Toronto. 2016 Consolidated Financial Statements: December
31, 2016. Toronto: City of Toronto, 2017. http://www.toronto.ca/legdocs/
mmis/2017/au/bgrd/backgroundfile-105236.pdf.
Crawford, Todd, and Cory Renner. Stronger Together: The Strengths of
Canada’s Four Global Financial Centres. Ottawa: The Conference Board
of Canada, 2016.
Crosbie & Company. Canadian M&A Report Q2 2017. Toronto: Crosbie
& Company, 2017.

Find Conference Board research at www.e-library.ca. 59
Appendix A | The Conference Board of Canada
Department of Finance Canada. The Fiscal Monitor. Ottawa:
Government of Canada, 2017.
Deveau, Scott. “Canadian Firms went on a Buying Spree in 2015, As
Outbound Deals Reached an 8-Year high.” Bloomberg News. December
31, 2015. http://business.financialpost.com/news/fp-street/canadian-firms-
went-on-buying-spree-in-2015-as-outbound-deals-hits-8-year-high
Fernández-Aráoz, Claudio, Sonny Iqbal, and Jörg Ritter. “Leadership
Lessons From Great Family Businesses.” Harvard Business Review,
April 2015.
Government of Ontario. 2017 Ontario Budget, Chapter VI: “Responsible
Fiscal Management.” Toronto: Government of Ontario, 2017.
halabisky, David, Erwin Dreessen, and Chris Parsley. “Growth in Firms
in Canada, 1985–1999.” Journal of Small Business & Entrepreneurship
19, no. 3 (2006).
hellmann, Thomas, Laura Lindsey, and Manju Puri. “Building
Relationships Early: Banks in Venture Capital.” The Review of Financial
Studies 21, no. 2 (April 2008): 513–41.
Innovation, Science and Economic Development Canada. Key Small
Business Statistics. Ottawa: Innovation, Science and Economic
Development Canada, 2016. http://www.ic.gc.ca/eic/site/061.nsf/
eng/h_02689.html.
Insurance Bureau of Canada. Facts of the Property and Casualty
Insurance Industry in Canada 2017. Toronto: Insurance Bureau of
Canada, 2017.
Mason, Colin, and Timothy Tjahjakartana. 2016 Report on Angel Capital
Investing in Canada. Toronto: National Angel Capital Organization, 2017.
National Crowdfunding Association of Canada. 2016 Alternative Finance
Crowdfunding in Canada. Toronto: National Crowdfunding Association of
Canada, 2016.
Pavoni, Silvia. “Brexit-Bound London Retains Top Slot in 2017 IFC
Rankings.” The Banker, October 1, 2017.

PARTNERS IN GROwTh2017 Report Card on Canada and Toronto’s Financial Services Sector
Find Conference Board research at www.e-library.ca. 60
Sanofi. The Sanofi Canada Health Care Survey. Laval: Sanofi-Aventis
Canada, Inc., 2015.
Smith Cross, Jessica. “Aging Farmers with No Succession Plans Put
Future of Canadian Family Farms at Risk.” CBC News, July 16. 2017.
Statistics Canada. Biannual Survey of Suppliers of Business Financing.
http://www23.statcan.gc.ca/imdb/p2SV.pl?Function=getSurvey&S
DDS=2514.
—. Canadian Business Patterns. https://www.statcan.gc.ca/eng/start.
—. CANSIM table 002-0001. Farm Cash Receipts. http://www5.statcan.
gc.ca/cansim/a26?lang=eng&id=20001.
—. CANSIM table 031-0005. Flows and Stocks of Fixed Non-Residential
Capital, by Industry and Asset, Canada, Provinces and Territories.
http://www5.statcan.gc.ca/cansim/a26?lang=eng&id=310005.
—. CANSIM table 031-0006. Flows and Stocks of Fixed Non-Residential
Capital, by Industry and Asset, Canada. http://www5.statcan.gc.ca/
cansim/a26?lang=eng&id=310006.
—. CANSIM table 187-0001. Quarterly Balance Sheet and Income
Statement, by North American Industry Classification System (NAICS).
http://www5.statcan.gc.ca/cansim/a26?id=1870001.
—. CANSIM table 280-0003. Trusteed Pension Funds, Market and Book
Value of Assets, by Foreign and Domestic holdings. http://www5.statcan.
gc.ca/cansim/a26?lang=eng&id=2800003.
—. CANSIM table 281-0026. Survey of Employment, Payrolls and hours
(SEPh), Average weekly Earnings by Type of Employee, Overtime
Status and Detailed North American Industry Classification System
(NAICS), Unadjusted for Seasonality. http://www5.statcan.gc.ca/cansim/
a26?lang=eng&id=2810026.
—. CANSIM table 282-0008. Labour Force Survey Estimates (LFS), by
North American Industry Classification System (NAICS), Sex and Age
Group. http://www5.statcan.gc.ca/cansim/a26?lang=eng&id=2820008.

Find Conference Board research at www.e-library.ca. 61
Appendix A | The Conference Board of Canada
—. CANSIM table 376-0033. International Transactions in Services,
Commercial Services by Category. http://www5.statcan.gc.ca/cansim/
a26?lang=eng&id=3760033.
—. CANSIM table 376-0052. International Investment Position, Canadian
Direct Investment Abroad and Foreign Direct Investment in Canada, by
North American Industry Classification System (NAICS) and Region.
http://www5.statcan.gc.ca/cansim/a26?lang=eng&id=3760052.
—. CANSIM table 376-0066. Activities of Canadian Majority-Owned
Affiliates Abroad, by North American Industry Classification System
(NAICS). http://www5.statcan.gc.ca/cansim/a26?lang=eng&id=3760066.
—. CANSIM table 376-0108. International Transactions in Services, by
Category. http://www5.statcan.gc.ca/cansim/a26?lang=eng&id=3760108.
—. CANSIM table 379-0031. Gross Domestic Product (GDP) at Basic
Prices, by NAICS. http://www5.statcan.gc.ca/cansim/a20?VEC=6520171
8&id=3790031&action%3Aa20=Retrieve+now&emonth=5&eyear=2017&s
tByVal=2&retrLang=eng&smonth=1&lang=eng&syear=2017&mode=outp
utSeries.
—. CANSIM table 527-0013. Experimental Quarterly Estimates
of Business Entry and Exit. http://www5.statcan.gc.ca/cansim/
a26?lang=eng&id=5270013.
—. CANSIM table 552-0005. Canadian Business Counts,
Location Counts with Employees, by Employment Size and North
American Industry Classification System (NAICS), Canada and
Provinces, December 2016. http://www5.statcan.gc.ca/cansim/
a26?lang=eng&id=5520005.
—. Labour Force Survey (LFS). http://www23.statcan.gc.ca/imdb/p2SV.
pl?Function=getSurvey&SDDS=3701.
—. Survey on Financing and Growth of Small and Medium Enterprises,
2014. http://www.statcan.gc.ca/daily-quotidien/151127/dq151127d-eng.htm.
TMX Group. Global Leaders in Mining. 2016. Accessed August 31, 2016.
http://www.tsx.com/listings/listing-with-us/sector-and-product-
profiles/mining.

PARTNERS IN GROwTh2017 Report Card on Canada and Toronto’s Financial Services Sector
Find Conference Board research at www.e-library.ca. 62
willis Towers watson. Pensions and Investments/Willis Towers Watson
300 Analysis. London: willis Towers watson, 2017.
Yeandle, Mark. The Global Financial Centres Index 22. n.p.: Long
Finance, 2017.
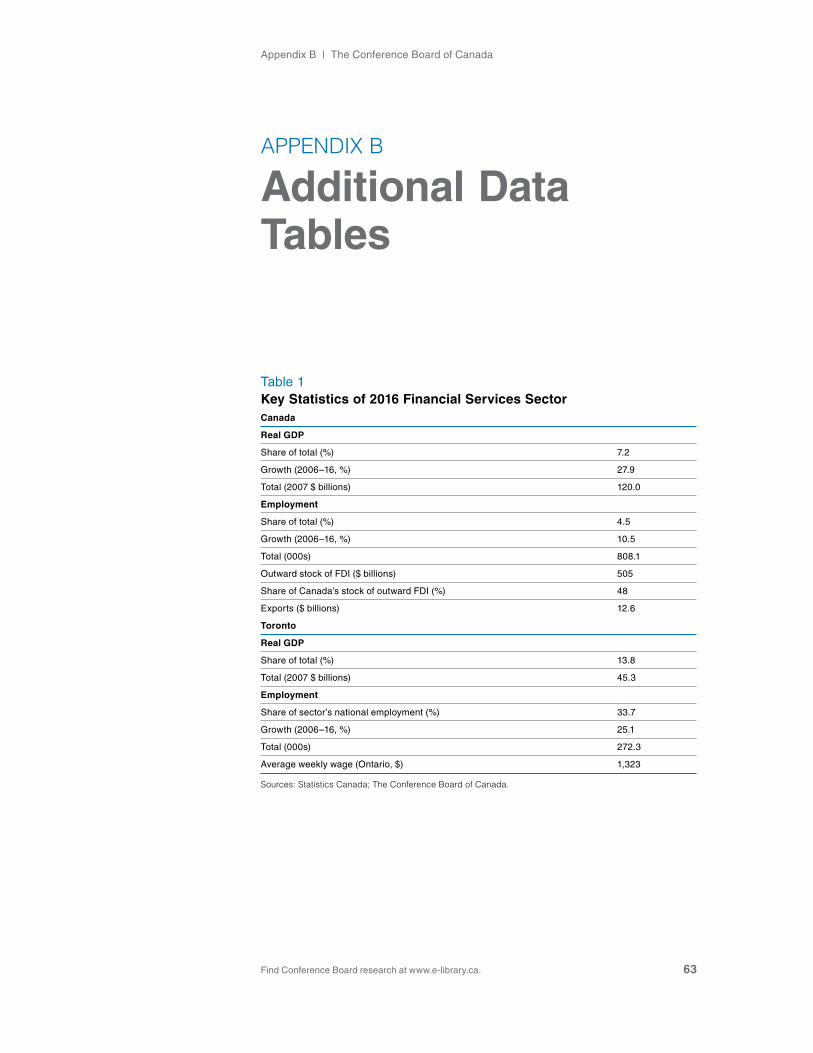
Appendix B | The Conference Board of Canada
Find Conference Board research at www.e-library.ca. 63
APPENDIX B
Additional Data Tables
Table 1 Key Statistics of 2016 Financial Services SectorCanada
Real GDP
Share of total (%) 7.2
Growth (2006–16, %) 27.9
Total (2007 $ billions) 120.0
Employment
Share of total (%) 4.5
Growth (2006–16, %) 10.5
Total (000s) 808.1
Outward stock of FDI ($ billions) 505
Share of Canada’s stock of outward FDI (%) 48
Exports ($ billions) 12.6
Toronto
Real GDP
Share of total (%) 13.8
Total (2007 $ billions) 45.3
Employment
Share of sector’s national employment (%) 33.7
Growth (2006–16, %) 25.1
Total (000s) 272.3
Average weekly wage (Ontario, $) 1,323
Sources: Statistics Canada; The Conference Board of Canada.

Partners in Growth2017 report Card on Canada and toronto’s Financial services sector
Find Conference Board research at www.e-library.ca. 64
table 2 Toronto Financial Services Employment, by Industry
Share of Toronto’s financial services employment (%)
2006 2007 2008 2009 2010 2011 2012 2013 2014 2015 2016Average annual
growth (2006–16, %) 2006 2016
all financial services 217,700 209,450 217,725 218,425 212,875 219,350 219,325 240,025 251,375 250,790 272,280 2.3 100.0 100.0
Banking 111,848 102,753 112,949 109,261 112,174 107,959 112,104 112,072 128,940 127,795 139,412 2.2 51.4 51.2
Credit unions 1,003 1,053 1,083 1,077 1,123 1,152 1,200 1,236 1,273 1,781 1,765 5.8 0.5 0.6
insurance 55,500 54,100 56,700 55,800 50,800 56,500 51,600 56,600 50,200 52,060 55,670 0.0 25.5 20.4
Property and casualty insurers 23,242 25,872 25,949 26,215 25,416 26,875 21,706 25,155 20,608 22,442 21,017 -1.0 10.7 7.7
Life and health insurers 9,898 11,018 11,051 11,165 10,824 11,445 9,244 10,713 8,777 9,558 11,993 1.9 4.5 4.4
other insurance 22,360 17,210 19,700 18,420 14,560 18,180 20,650 20,733 20,816 20,060 22,660 0.1 10.3 8.3
asset management 2,180 2,244 2,476 2,620 2,680 2,884 2,865 3,115 3,241 1,690 3,500 4.8 1.0 1.3
securities 39,131 41,336 35,474 40,519 36,436 41,166 40,832 55,598 54,204 49,542 55,550 3.8 18.0 20.4
securities intermediation and brokerage
17,923 18,256 15,069 16,510 14,195 15,280 14,909 19,964 19,134 16,210 14,004 -2.5 8.2 5.1
other financial investment activities
21,208 23,080 20,404 24,009 22,241 25,886 25,923 35,635 35,070 33,332 41,546 7.0 9.7 15.3
exchanges 569 664 626 781 764 934 868 1,102 996 1,308 1,550 10.5 0.3 0.6
Back office 7,469 7,300 8,417 8,367 8,898 8,755 9,856 10,302 12,521 16,614 14,833 7.1 3.4 5.4
Sources: Statistics Canada, Labour Force Survey; The Conference Board of Canada.

Find Conference Board research at www.e-library.ca. 65
Appendix B | The Conference Board of Canada
Table 3 Number of Financial Services Sector Firms Operating in Toronto, by Employment Size
Number of enterprises Share of enterprises (%)
Number of employees Total 1–9 10–19 20–99 100–199 200+ 1–9 10–19 20–99 100–199 200+
All industries 234,399 184,213 22,731 22,299 2,878 2,278 78.6 9.7 9.5 1.2 1.0
All financial services 8,841 6,154 1,007 1,337 141 202 69.6 11.4 15.1 1.6 2.3
Banking 1,737 532 462 680 30 33 30.6 26.6 39.1 1.7 1.9
Depository credit intermediation 1,249 175 417 623 16 18 14.0 33.4 49.9 1.3 1.4
Credit card issuers, sales financing, consumer lending 231 159 19 35 7 11 68.8 8.2 15.2 3.0 4.8
All other banking 257 198 26 22 7 4 77.0 10.1 8.6 2.7 1.6
Credit unions 82 33 25 22 - 2 40.2 30.5 26.8 0.0 2.4
Insurance 2,155 1,642 185 250 40 38 76.2 8.6 11.6 1.9 1.8
Life and health insurers 158 81 15 42 9 11 51.3 9.5 26.6 5.7 7.0
Property and casualty insurers 139 56 14 37 17 15 40.3 10.1 26.6 12.2 10.8
Other insurance 1,858 1,505 156 171 14 12 81.0 8.4 9.2 0.8 0.6
Asset management 219 180 14 15 4 6 82.2 6.4 6.8 1.8 2.7
Securities 3,887 3,117 273 337 59 101 80.2 7.0 8.7 1.5 2.6
Securities intermediation and brokerage 551 351 68 102 9 21 63.7 12.3 18.5 1.6 3.8
Other financial investment activities 3,336 2,766 205 235 50 80 82.9 6.1 7.0 1.5 2.4
Exchanges 19 9 2 4 1 3 47.4 10.5 21.1 5.3 15.8
Back office 742 641 46 29 7 19 86.4 6.2 3.9 0.9 2.6
Source: Statistics Canada, Canadian Business Patterns.

e-Library. Do you want to have access to expert thinking on the issues that really matter to you and your organization?
Our e-Library contains hundreds of Conference Board research studies in the areas of Organizational Performance, Economic Trends and Forecasts, and Public Policy.
www.e-library.ca
Insights. Understanding. Impact.

About The Conference Board of Canada
We are:
• The foremost independent, not-for-profit, applied research organization in Canada.
• Objective and non-partisan. We do not lobby for specific interests.• Funded exclusively through the fees we charge for services to the
private and public sectors.• Experts in running conferences but also at conducting, publishing,
and disseminating research; helping people network; developing individual leadership skills; and building organizational capacity.
• Specialists in economic trends, as well as organizational performance and public policy issues.
• Not a government department or agency, although we are often hired to provide services for all levels of government.
• Independent from, but affiliated with, The Conference Board, Inc. of New York, which serves nearly 2,000 companies in 60 nations and has offices in Brussels and Hong Kong.

Insights. Understanding. Impact.
255 Smyth Road, Ottawa ON
K1h 8M7 Canada
Tel. 613-526-3280
Fax 613-526-4857
Inquiries 1-866-711-2262
conferenceboard.ca
PUBLICATION 9264 | 9265
PRICE: Complimentary