partner report on support to … • press 2017 | partner report on support to statistics aaa accra...
TRANSCRIPT
PARTNER REPORT ON SUPPORT TO STATISTICS
PRESS 2017
PARTNERSHIP IN STATISTICS FOR DEVELOPMENT IN THE 21ST CENTURY
PRESS 2017 | Partner Report on Support to Statistics • 1
Partner Report on Support to Statistics
PRESS 2017

2 • PRESS 2017 | Partner Report on Support to Statistics
Acknowledgements: The report was prepared by the Secretariat of the Partnership in Statistics for Development in the 21st Century (PARIS21).This report would not have been possible without the help of reporters from donor countries and agencies.We are grateful to the following external reviewers for providing extensive comments: Carol Ann Munn and Benjamin Vigreux (Department of International Development, UK), Shaida Badiee and Open Data Watch, Graham Eele (Royal Statistical Society), Jessica Espey (UN Sustainable Development Solutions Network) and Zach Christensen (Development Initiatives).
For more details, including copies of PRESS reports:
Contact the PARIS21 Secretariat at [email protected] www.PARIS21.orgFollow PARIS21 on Facebook and @contactparis21 on Twitter
PRESS 2017 | Partner Report on Support to Statistics • 3
Table of ContentsList of Acronyms ......................................................................................................................................................................................................................................................................................4
PRESS 2017 Highlights ...............................................................................................................................................................................................................................................................6
I. Introduction .................................................................................................................................................................................................................................................................................................7
Overview ................................................................................................................................................................................................................................................................................................7
Methodology...................................................................................................................................................................................................................................................................................9
Use cases and best reporting practices.................................................................................................................................................................................. 11
II. Summary of the main findings from PRESS 2017................................................................................................................................................... 12
Trends in PRESS 2017 ............................................................................................................................................................................................................................................. 13
Key findings by recipient ..................................................................................................................................................................................................................................... 17
Key findings by provider of development co-operation .............................................................................................................................. 23
Concluding Remarks ................................................................................................................................................................................................................................................................. 24
References ...................................................................................................................................................................................................................................................................................................... 26
Methodology Annexes ............................................................................................................................................................................................................................................................ 27
Table of FiguresFigure 1. Global Commitments to Statistics. Total amount by data source ................................................................................ 13
Figure 2a. Global Commitments to Statistics as percentage of ODA .................................................................................................... 13
Figure 2b. Global Commitments to Statistics per capita .............................................................................................................................................. 13
Figure 3. Share of Sectors on ODA, 2015 ................................................................................................................................................................................................ 14
Figure 4. Alignment of Projects with NSDS ........................................................................................................................................................................................... 15
Figure 5. Allocation of Aid to Statistics .......................................................................................................................................................................................................... 16
Figure 6. Areas of Aid to Statistics ......................................................................................................................................................................................................................... 16
Figure 7a. Commitment in 2006-15 over rolling 3-year period, by geographical region...................................... 17
Figure 7b. Commitment in 2015, by geographical region............................................................................................................................................ 17
Figure 8. Areas of Aid to Statistics by Region in 2006-2015 .................................................................................................................................. 18
Figure 9. Top Five Recipients of Country-specific Aid ....................................................................................................................................................... 19
Figure 10. Average annual per capita commitment in 2013-2015................................................................................................................ 20
Figure 11a. Small Island Developing States with > USD 1 million of Commitments in 2013-2015 ......... 21
Figure 11b. Top 5 Donors that Committed to Small Island Developing States in 2013-2015 .................... 21
Figure 12a. Fragile States with > USD 10 million of Commitments in 2013-15 ................................................................... 22
Figure 12b. Top 5 Donors that Committed to Fragile States in 2013-2015 ................................................................................. 22
Figure 13. Methods of Financing Aid to Statistics ..................................................................................................................................................................... 23
Figure 14a. Top Ten Donors in 2015.................................................................................................................................................................................................................... 23
Figure 14b. Top Ten Donors, Country-specific Commitment in 2015 .................................................................................................... 24
Figure 14c. Top Ten Donors, Unallocated Commitment in 2015 ..................................................................................................................... 24
4 • PRESS 2017 | Partner Report on Support to Statistics
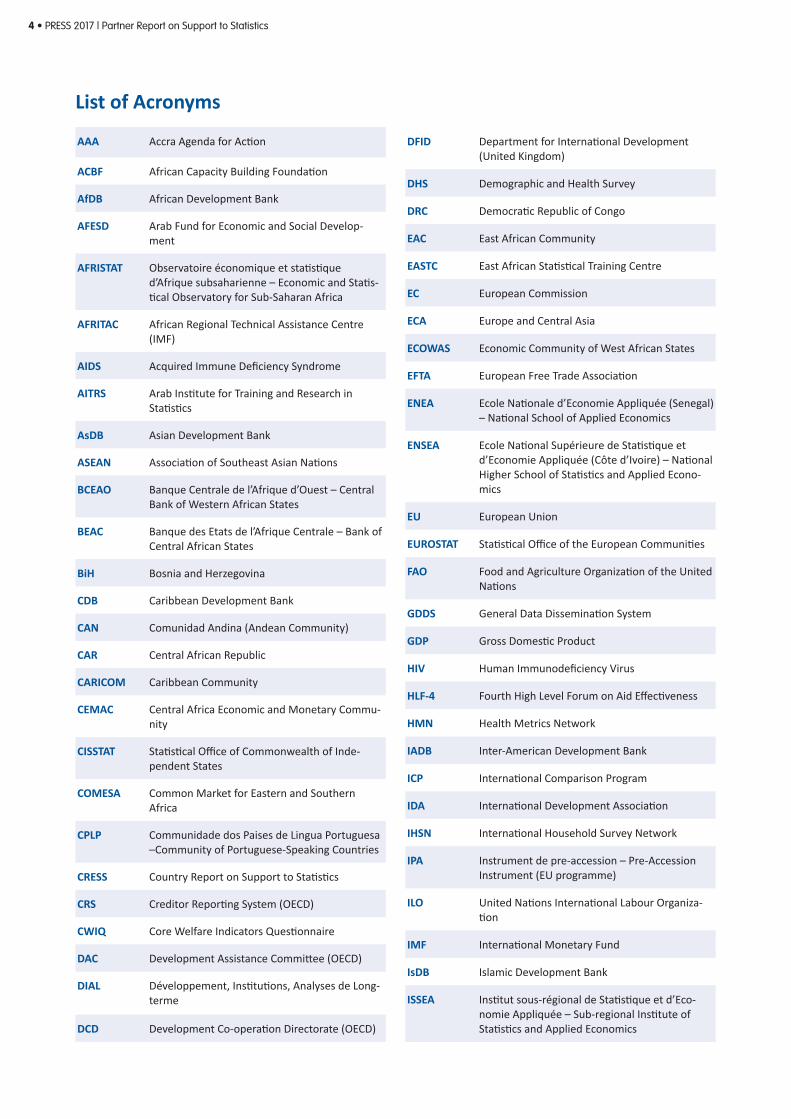
AAA Accra Agenda for Action
ACBF African Capacity Building Foundation
AfDB African Development Bank
AFESD Arab Fund for Economic and Social Develop-ment
AFRISTAT Observatoire économique et statistique d’Afrique subsaharienne – Economic and Statis-tical Observatory for Sub-Saharan Africa
AFRITAC African Regional Technical Assistance Centre (IMF)
AIDS Acquired Immune Deficiency Syndrome
AITRS Arab Institute for Training and Research in Statistics
AsDB Asian Development Bank
ASEAN Association of Southeast Asian Nations
BCEAO Banque Centrale de l’Afrique d’Ouest – Central Bank of Western African States
BEAC Banque des Etats de l’Afrique Centrale – Bank of Central African States
BiH Bosnia and Herzegovina
CDB Caribbean Development Bank
CAN Comunidad Andina (Andean Community)
CAR Central African Republic
CARICOM Caribbean Community
CEMAC Central Africa Economic and Monetary Commu-nity
CISSTAT Statistical Office of Commonwealth of Inde-pendent States
COMESA Common Market for Eastern and Southern Africa
CPLP Communidade dos Paises de Lingua Portuguesa –Community of Portuguese-Speaking Countries
CRESS Country Report on Support to Statistics
CRS Creditor Reporting System (OECD)
CWIQ Core Welfare Indicators Questionnaire
DAC Development Assistance Committee (OECD)
DIAL Développement, Institutions, Analyses de Long-terme
DCD Development Co-operation Directorate (OECD)
DFID Department for International Development (United Kingdom)
DHS Demographic and Health Survey
DRC Democratic Republic of Congo
EAC East African Community
EASTC East African Statistical Training Centre
EC European Commission
ECA Europe and Central Asia
ECOWAS Economic Community of West African States
EFTA European Free Trade Association
ENEA Ecole Nationale d’Economie Appliquée (Senegal) – National School of Applied Economics
ENSEA Ecole National Supérieure de Statistique et d’Economie Appliquée (Côte d’Ivoire) – National Higher School of Statistics and Applied Econo-mics
EU European Union
EUROSTAT Statistical Office of the European Communities
FAO Food and Agriculture Organization of the United Nations
GDDS General Data Dissemination System
GDP Gross Domestic Product
HIV Human Immunodeficiency Virus
HLF-4 Fourth High Level Forum on Aid Effectiveness
HMN Health Metrics Network
IADB Inter-American Development Bank
ICP International Comparison Program
IDA International Development Association
IHSN International Household Survey Network
IPA Instrument de pre-accession – Pre-Accession Instrument (EU programme)
ILO United Nations International Labour Organiza-tion
IMF International Monetary Fund
IsDB Islamic Development Bank
ISSEA Institut sous-régional de Statistique et d’Eco-nomie Appliquée – Sub-regional Institute of Statistics and Applied Economics
List of Acronyms

PRESS 2017 | Partner Report on Support to Statistics • 5
ISWGNA Inter-Secretariat Working Group on National Accounts
ITU International Telecommunication Union
LAC Latin America and Caribbean
LAS League of Arab States
LSMS Living Standards Measurement Survey
M&E Monitoring and Evaluation
MAPS Marrakech Action Plan for Statistics
MDG Millennium Development Goals
MECOVI Mejoramiento de la Encuestas de Hogares y la Medición de Condiciones de Vida (Program for the Improvement of Surveys and Measurement of Living Conditions in Latin America and the Caribbean)
MENA Middle East and North Africa
MERCOSUR Mercado Comun del Sur -- Southern Common Market (Argentina, Brazil, Paraguay, Uruguay)
MICS Multiple Indicator Cluster Survey
NSDS National Strategy for the Development of Statis-tics
NSO National Statistical Office
NSS National Statistical System
ODA Official Development Assistance
OECD Organisation for Economic Co-operation and Development
PALOP Países Africanos de Língua Oficial Portuguesa (African Portuguese-Speaking Countries)
PARIS21 Partnership in Statistics for Development in the 21st Century
PNG Papua New Guinea
PRESS Partner Report on Support to Statistics
PRSP Poverty Reduction Strategy Paper
PPP Purchasing Power Parity
SADC Southern African Development Community
SCB Statistical Capacity Building
SESRIC Statistical, Economic and Social Research and Training Centre for Islamic Countries
SIDS Small Island Developing States
SNA System of National Accounts
SPC Secretariat of the Pacific Community
SRF Statistics for Results Facility
SSA Sub-Saharan Africa
STATCAP Statistical Capacity Credit/Loan
TFSCB Trust Fund for Statistical Capacity Building
UK United Kingdom
UNAIDS Joint United Nations Programme on HIV/AIDS
UNCTAD United Nations Conference on Trade and Deve-lopment
UNDP United Nations Development Programme
UNECA United Nations Economic Commission for Africa
UNECE United Nations Economic Commission for Europe
UNECLAC United Nations Economic Commission for Latin America and the Caribbean
UNEP United Nations Environment Programme
UNESCAP United Nations Economic and Social Commission for Asia and Pacific
UNESCWA United Nations Economic and Social Commission for Western Asia
UNESCO-UIS United Nations Educational, Scientific, and Cultu-ral Organization – Institute for Statistics
UNFPA United Nations Population Fund
UNICEF United Nations Children’s Fund
UNIDO United Nations Industrial Development Organi-zation
UNSD United Nations Statistics Division
UNSIAP United Nations Statistical Institute for Asia and the Pacific
USA United States of America
USAID United States Agency for International Develop-ment
WAEMU /UEMOA
West Africa Economic and Monetary Union
WHO World Health Organization
6 • PRESS 2017 | Partner Report on Support to Statistics
PRESS 2017 Highlights
The Partner Report on Support to Statistics (PRESS) 2017 uses newly available data from an annual donor
survey and the 2015 Creditor Reporting System (CRS) to report on commitments to statistical capacity building
between 2006 and 2015. The 2015 figures are expected to be adjusted upwards as additional projects will be
reported this year.
$541M Support to statistics amounted to USD 541 million in 2015.
0.30% The share of Official Development Assistance (ODA) focused on data and statistics was 0.30% in 2015, a slight improvement on last decade’s average (0.27%).
40% General statistical items and methodology received the most support (40% of total commitments). With new priorities in the SDG agenda, donors should strike a balance in funding to social, environmental and multi-domain statistics.
75%The top 5 donors of development co-operation in statistics (Canada; AfDB; European Commission/Eurostat; UNFPA; World Bank) provided 75% of total commitments in 2015. This represents a shift in the key donors from previous years.
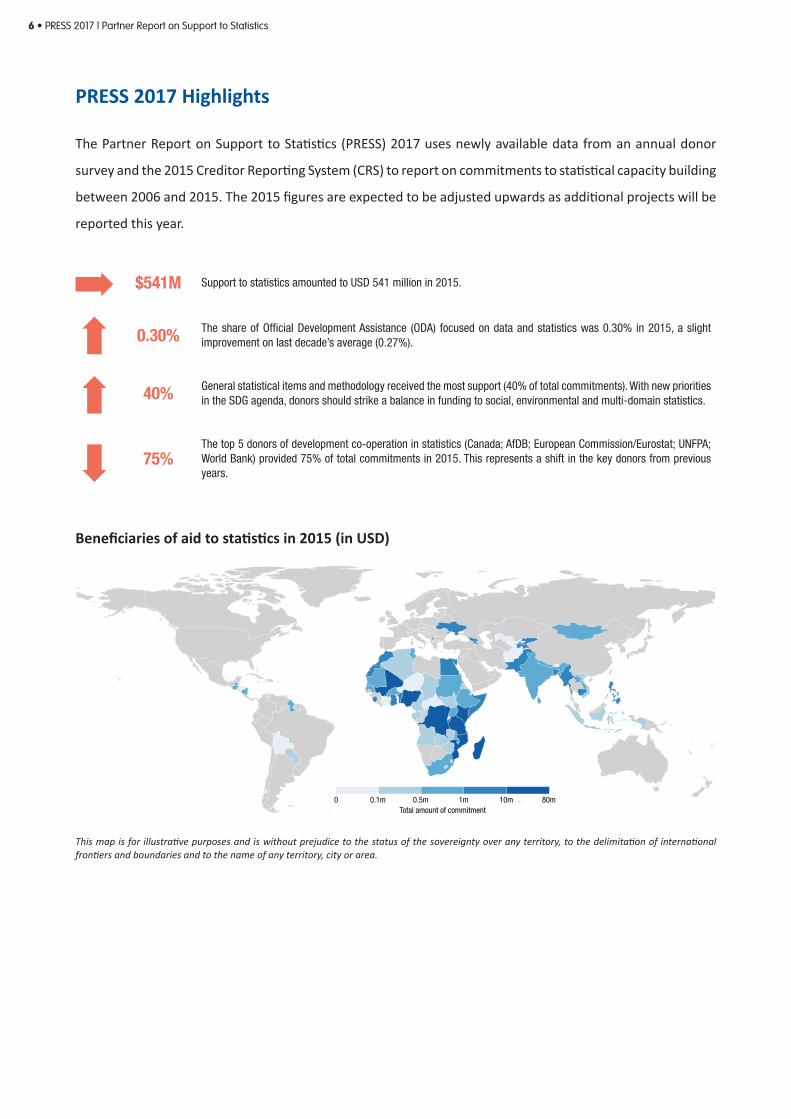
Beneficiaries of aid to statistics in 2015 (in USD)
0 0.1m 0.5m 1m 10mTotal amount of commitment
80m
This map is for illustrative purposes and is without prejudice to the status of the sovereignty over any territory, to the delimitation of international frontiers and boundaries and to the name of any territory, city or area.
PRESS 2017 | Partner Report on Support to Statistics • 7
I. Introduction
Overview
The 2017 PRESS report highlights two new positive trends in aid to data and
statistics: an increase in investments and a diversification of donors. First,
official development assistance (ODA) to data and statistics has increased
from 0.25% in 2014 to 0.30% in 2015. While current commitments indicate
a decrease in absolute terms (from USD 544 million in 2014 to USD 541
million in 2015), these figures do not reflect all 2015 commitments, which
are projected to be corrected upward.1 Second, 2015 saw the pool of donors supporting statistics expand and
diversify. New donors include foundations, which recognise the importance of improving data and statistics
as part of their overall commitment to poverty reduction and development. The Bill and Melinda Gates
Foundation and the William and Flora Hewlett Foundation are leading these efforts with commitments of,
respectively, USD 13.2 and 3 million in 2016 (SDDF, 2016; ODW 2016)2. Additional commitments from the Bill
and Melinda Gates Foundation to Sustainable Development Goal (SDG) priorities are estimated at around
40 USD million, which will be rolled out over the next three years.3 Further, increased funding is noted in
geo-spatial and satellite imagery development, such as Radiant’s technology platform. A growing number of
investments with large commitments are on the horizon, often matched by a commitment from governments
to allocate budgets for their national statistical systems (NSS).
Overall, recent trends are cause for optimism among the statistical
community. Ambitious data initiatives and the arrival of new donors
are injecting welcome dynamism into the sector, boosting efforts to
strengthen national statistical capacities and bridge chronic data gaps.
Yet, notwithstanding the progress in terms of funding and awareness,
both the quality and quantity of aid still falls short of what is needed.
First, the overall amount of funding for data and statistics remains low,
particularly given the estimated costs of SDG tracking and monitoring as well as the financial costs of building
and strengthening national statistical systems. Under the 2015 level of USD 541 million, there is currently an
annual funding gap of nearly USD 200 million for SDG data collection in least developed countries that should
be covered by development co-operation (GPSDD, 2016; UNSDSN, 2015).4 Increased funding will be needed to
1. The PRESS measures support provided by multilateral and bilateral donors on all areas of statistics, from national accounts to human resources and training (see Classification of Statistical Activities in the Methodological Annex for more details).
2. To avoid double counting, this does not include the Gates Foundation’s un-earmarked contributions to multi-lateral donors such as IMF, AfDB, World Bank and FAO.
3. These commitments, not yet reflected in the 2015 commitments reported in this report, will be captured in the 2018 edition. All commitments in 2016 will be reported in the 2018 PRESS report.
4. The estimated gap for SDG data collection that should be covered yearly by development co-operation is USD 685 million. Since aid for statistics is about USD 500 million, development co-operation should increase by USD 200 million.
Data and statistics are attracting more resources and new donors, but support remains insufficient
More and better-quality financial support to data and statistics will be vital to ensure robust SDG monitoring at the national level

8 • PRESS 2017 | Partner Report on Support to Statistics
support national statistical capacity to monitor and track progress on the SDGs; current levels of funding put
in doubt the robustness of SDG monitoring mechanisms. Second, while new actors have been drawn towards
new areas of data development, support has tended to be concentrated in specific sectors. Gender equality
and women’s empowerment, or new data sources, for example, have benefited from new donor attention.
A narrow focus risks overlooking the broader structural needs and capacity challenges of national statistical
systems, which also require more support to undertake other critical reforms.
Existing and emerging donor preferences for results-based mechanisms are also changing the landscape
of financial support for statistics. There is a growing trend among donors to measure, monitor and report
results that can be directly attributed to their interventions, and therefore tend to be based on short-term
achievements. This is in part fuelled by concerns over ‘value for money’, accountability and evidence of
change. Furthermore, financial support is not necessarily aligned with national priorities nor uses national-
level data for reporting. There is a need for support to be strongly aligned with country priorities. In 2015,
81% of new development co-operation interventions by Development Assistance Committee (DAC) members
were aligned to national priorities but only half intended to use countries’ data and monitoring systems,
preferring instead to establish parallel or alternative indicators (OECD, 2017). These two factors represent
a lost opportunity to mainstream and strengthen national statistical capacity-building in development co-
operation. Avoiding duplication and increasing focus on longer-term outcomes could be achieved by linking
project results frameworks to progress towards SDG priorities set at the country level.
Finally, increased recognition of the role of data for development is a
welcome change and it may help explain the increasing trend in statistical
funding captured in this report, a primary data source for SDG indicator
17.19.1 on the level of investment for statistical development. The SDG
agenda, the Busan Action Plan for Statistics and the first UN World
Data Forum in Cape Town, South Africa, have put data and statistics in
the spotlight. Making the most of it requires prioritising investments
in statistical capacity and better understanding the impact of data and statistics in development outcomes
(see Box 1). Donors should also continue improving their reporting systems on statistical support which will allow
more accurate measurement of support for statistical systems. Concrete steps could be taken today to achieve this.
To this end, introducing a marker for ODA to measure commitments towards the development of the data
sector and improve monitoring of aid to statistics can prove extremely useful (OECD, 2017). Indeed, multi-
sector projects, which comprise only a small statistics component, are currently not marked as support to
statistics in the OECD Creditor Reporting System (CRS) database. A marker would also help systems that build
on the CRS system to track aid data, such as the International Aid Transparency Initiative (IATI) and AidData.
Greater emphasis should be placed on providing more relevant and sustainable capacity development on
statistics, which better responds to the increasingly complex needs of the sector.
A marker for ODA to measure commitments to development data will be essential to accurately gauge sector funding
PRESS 2017 | Partner Report on Support to Statistics • 9
Methodology
The PRESS exercise is conducted annually5 to report on trends in support to statistics. This report updates the
PRESS 2016 results using calendar years 2006 to 2015. To ensure comparability over time, the methodology is
applied retrospectively for all years. This section reviews the main methodological features.6
The aim of the PRESS is to provide a full picture of international
support to statistics. To this end, the report draws on three distinct
data sources. The first source of data is the OECD Creditor Reporting
System (see Box 2), which records data from OECD Development
Assistance Committee (DAC) members and some non-DAC donors,
and provides a comprehensive accounting of ODA. Donors report
specific codes for the sector targeted by their aid activity. Statistical
capacity building (SCB) is designated by code 16062. Second, when
SCB is a component of a larger project, it is not identified by this code,
causing the CRS figures to underestimate actual levels of support
for international support for statistics. PARIS21 seeks to reduce this
downward bias by searching project descriptions in the CRS for
terms indicating a component of SCB. This data source is new and
the methodology is presented in Box 2. Third, and finally, the PARIS21 Secretariat supplements this data with
an online questionnaire completed by a global network of reporters. The questionnaire covers a subset of the
variables collected in the CRS and some additional variables specific to statistical capacity building. Reporting
to the questionnaire is voluntary, offering an opportunity to share information on statistical activities.
Reporters to this questionnaire are countries that do not report to the CRS, as well as multilateral institutions
with large portfolios of statistical projects that have requested to report to the PARIS21 Secretariat directly.
BOX 1. Measuring Statistical Literacy
The call for statistical literacy has recently been echoed
by the international community. The United Nations
Secretary General’s appointed Independent Expert
Advisory Group (IEAG) on the ‘Data Revolution for
Sustainable Development’ encouraged more work
to be done for increasing global data literacy.
A PARIS21-led Task Team has developed a first
composite indicator to measure global statistical
literacy based on newspaper articles. Evidence-based
journalism can be considered an example of a nation’s
demand for statistical facts and depth of critical
analysis. Newspaper articles are generally available,
which makes them representative of a country’s
literate population.
5. The PRESS exclusively reports on years where data from both the CRS and the PRESS questionnaire is available to facilitate comparisons over time. The use of the CRS, which reports 2015 commitments in January 2017, results in a two-year time lag for the PRESS reporting. The current issue published in 2017, therefore reports on commitments to statistics up to 2015.
6. The methodology used in compiling PRESS data is described in the 2009 PRESS methodology report at http://www.paris21.org/sites/default/files/2017-09/PRESS2009-methodology.pdf.
The PRESS methodology uses a text mining technique to identify statistics projects in the CRS database that are not currently labelled as support to statistics. This approach avoids double counting projects as CRS is the only data source used for DAC members.
10 • PRESS 2017 | Partner Report on Support to Statistics
BOX 1. Measuring Statistical Literacy (cont.)
Based on a selection of keywords (for data sources,
statistical indicators, and statistical capacity), the
index classifies articles by levels into literary levels (1
to 3). With this information and based on the share of
articles that match the classification, an aggregate
index of statistical literacy is built. To confirm the
external validity of the indicator, the literacy scores
have been correlated against another available
proxy, the Trends in International Mathematics and
Science Study (TIMSS). TIMSS is an international
assessment of student mathematical achievement,
evaluating at least 5,000 students per participating
educational system. The TIMSS module on Data
and Chance aims to capture some similar concepts
to this indicator and shows a strong correlation
(significant at the 10%-level) with the estimated
literacy score for a sample of 21 countries. The
statistical literacy score provides a relevant and
replicable measure of use of statistical concepts
among the population.
Source: An indicator for statistical literacy based on national newspaper archives (paris21.org/statistical-literacy).
The recipient countries covered7 in the PRESS exercise fall into four categories: those eligible to borrow from IDA,8
low-income countries, lower-middle-income countries as defined by OECD DAC,9 and all African countries. Although
PARIS21 activities and reporting focus on the least developed countries, African upper-middle-income countries
are included in this exercise because the 2006 Light Reporting Exercise (LRE) — the process that evolved into the
PRESS — reported on support to statistics across the entire African continent. By retaining all African countries
in the PRESS, users interested in statistical development in Africa can sketch trends back to the original LRE. The
complete list of countries is available in the Methodology Annex below. Support that is not country-specific is
shown in the tables below under the category “unallocated”.
BOX 2. The Creditor Reporting System and Identification of Commitments to Statistics
The Creditor Reporting System (CRS) is the official
source of information on aid commitments from OECD
member countries, as well as multilateral organisations.
It was established in 1967, jointly by the OECD and the
World Bank, with the aim of providing participants with a
regular flow of data on indebtedness and capital flows.
Calculating capital flows and debt stock remain key
functions of the System but others have evolved over
the years. The CRS aid activity database has become
the internationally recognised source of data on the
geographical and sectorial breakdown of aid and is widely
used by governments, organisations and researchers
in the development field. It is regularly updated in line
with relevant directives. The PRESS draws on the ODA
portion of the database, which includes both geographic
and sectorial information on projects, to identify those
targeting statistics. The CRS also includes data on Other
Official Flows and Official Export Credits.
The project descriptions in the CRS database are
searched for statistics components by applying two
filters: a set of 150 keyword sequences (and their
permutations) in three languages and 20 sector codes
to control for context. More than 90% of project
descriptions are in English, French and Spanish so these
languages have been selected as filters. For the selected
sectors, projects are considered to have a significant
statistical component if their project description contains
at least one keyword sequence per 50 words.
7. This document and all maps included herein are without prejudice to the status of or sovereignty over any territory, to the delimitation of interna-tional frontiers and boundaries and to the name of any territory, city or area.
8. The list of IDA borrower countries (http://www.worldbank.org/ida) is periodically updated. This report reflects countries with IDA borrowing status as of October 2014.
9. This report includes countries with LMIC status according to the October 2014 DAC list of Official Development Assistance recipients (http://www.oecd.org/dac/stats/daclist.htm), which is updated every three years.

PRESS 2017 | Partner Report on Support to Statistics • 11
BOX 2. The Creditor Reporting System and Identification of Commitments to Statistics (cont.)
Keyword sequences indicating a statistical component
are identified in three-stages. First, project descriptions
are split by language, common words such as ‘the’,
‘is’, and ‘at’ are removed and the remaining words are
reduced to their word stem. Second, for each language,
word sequences, such as ‘statist capac’ for statistical
capacity, are identified as related to statistics if these
sequences are at least four times more likely to appear
in projects that were labelled as support to statistics
(designated by purpose code 16062) than in those that
were not. Third, word sequences are verified manually
by analysing the corresponding sentences.
The limitation of the analysis to 20 sector codes allows
for further context specific control. For instance, projects
in the ‘mineral prospection and exploration’ sector
use ‘geospatial data’ from ‘field surveys’ but do not
contribute to a country’s statistical capacity. The analysis
therefore only considers sector codes that are frequently
reported together with sector code 16062 for statistics.
The most relevant sector, with 54% of projects identified,
is ‘Population policy and admin management’ which
includes support for census and civil registration, followed
by ‘Public sector policy and admin management’ (15%)
and ’Multi-sector aid’ (12%).
Moreover, as the current methodology cannot
differentiate the contribution of statistical activities
to larger projects, some commitments could be
overestimated. The introduction of a proper marker
could allow for better and more accurate monitoring
of statistical commitments.
Source: OECD (2007)
Use cases and best reporting practices
The figures reported in the PRESS provide estimates of support for statistics. This demonstrates that support
for statistics remains extremely low. The PARIS21 Secretariat has identified and implemented several best
practices in reporting. This section upholds these best practices using three recent use cases of the PRESS
data: (i) estimating funding gaps in statistics, (ii) monitoring SDG Target 17.19 and (iii) determining countries’
absorptive capacities.
A first use case of the PRESS comes from the Needs Assessment for
SDG monitoring (UNSDSN, 2015), co-ordinated by the United Nations
Sustainable Development Solutions Network (UNSDSN) in collaboration
with PARIS21, Open Data Watch and others in early 2015. This exercise
aimed to establish the funding gap to produce the data required to
monitor the SDGs in the 77 IDA/Blend countries.10 The PRESS headline
number of global commitments to statistics was a major input on the
supply side of funding. However, to ensure the global numbers are
accurate, it is necessary to correct the double counting of aid that
arises when donors and implementing agencies report the same project twice. To circumvent this, multilateral
reporters to the PRESS questionnaire indicate their role as “implementer” (vs. “donor”) when they manage or
implement a project financed by another donor. Such reporting allows the PARIS21 Secretariat to ensure that
these commitments appear only once in the global number, resulting in a more accurate estimate.
10. See http://data.worldbank.org/about/country-and-lending-groups
To provide an accurate picture of support to statistics, reporters to the PRESS questionnaire indicate their role in a project to flag duplicate reporting from donors and implementers.
12 • PRESS 2017 | Partner Report on Support to Statistics
Another use case of the PRESS headline number is monitoring the indicator for SDG Target 17.19: “Financial
and other resources made available to strengthen the statistical capacity in developing countries” at country
level. However, a limitation of the CRS is that it does not allow reporters to enter a list of recipients when
reporting on multi-recipient projects. It is thus unclear which share of the support goes to a specific country.
To solve this problem of identification, some CRS reporters already split their projects into sub-projects – one
per recipient country – with each carrying their respective share of the total project commitment. The same
reporting practice is followed to indicate what share of a multi-sector aid project goes to statistics. PARIS21
encourages this practice and has incorporated it into its methodology to ensure the successful measurement
of resources available to strengthen statistical capacity at the country level.
Finally, the PARIS21 Road Map for a Country-Led Data Revolution11, the Needs Assessment for SDG Monitoring
and Statistical Capacity Development, and others are now calling for a doubling of support to statistics. To
assess countries’ absorptive capacity to make effective use of such an increase in funding, the reporting needs
to go beyond commitments of international aid. Two measures for a country’s absorptive capacity are actual
disbursements (as opposed to commitments) of aid money and domestic resources already invested in support
to statistics. To give a clearer picture of these measures, the PARIS21 Secretariat provides technical support
to countries to produce a budget as part of the National Strategies for the Development of Statistics (NSDS)12
and to undertake Country Reports on Support to Statistics (CRESS).13 The NSDS are important components to
monitor the sustainable production of SDG indicators and a realistic costing process, depending on the specific
needs of countries. They also contribute to aligning statistical priorities with countries’ national development
plans. Likewise, the CRESS reports contribute to documenting financing of statistics at the country level at
various levels: providing information on the financing available to National Statistical Systems and future
requirements, analysing funding priorities for statistics, and promoting harmonisation of external support
(and financing) for statistics.
II. Summary of the main findings from PRESS 20171. The 2017 PRESS uses newly available data from an annual donor survey and the 2015 Creditor Reporting
System (CRS) to monitor figures on aid to statistics and report new figures for commitments in 2015. The 2015
figures are expected to be adjusted upwards to the levels of 2012-2014 as additional projects for 2015 will be
reported later this year.14 All findings should therefore be interpreted with this caveat in mind.
11. See http://datarevolution.paris21.org/12. See http://www.paris21.org/national-strategy-development-statistics-nsds13. See http://www.paris21.org/country-report-on-support-to-statistics-cress14. Each year’s PRESS will adjust previous years’ figures because some projects take longer to be reported, and some other projects will be modified
and updated later.
PRESS 2017 | Partner Report on Support to Statistics • 13
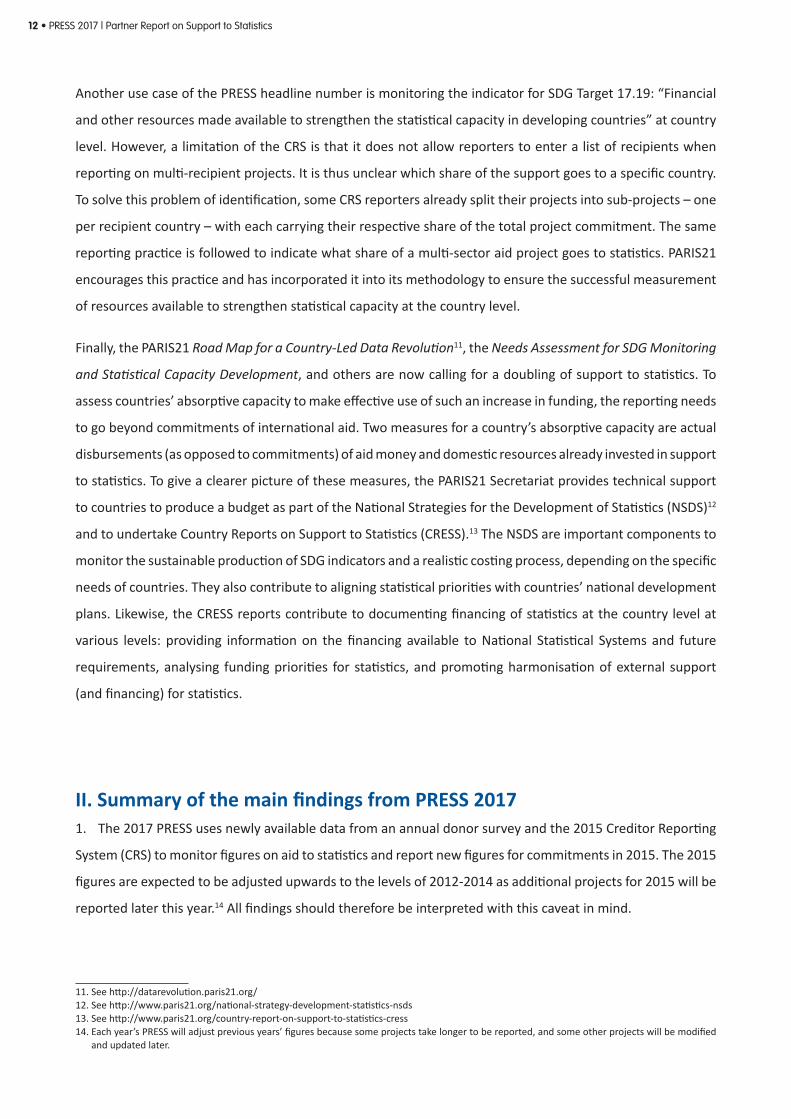
Trends in PRESS 2017Figure 1. Global Commitments to Statistics. 15 Total amount by data source
$102m $109m $104m$203m
$69m$119m $99m $113m $74m $71m
$67m
$181m$143m
$153m
$237m
$381m$355m
$442m
$394m$308m
$42m
$28m $95m
$44m $127m
$101m
$59m
$164m
$77m$163m
$211m
$318m$343m
$401m$433m
$602m
$513m
$719m
$544m $541m
$100m
0
$200m
$300m
$400m
$500m
$600m
$700m
$800m
2006 2007 2008 2009 2010 2011 2012 2013 2014 2015
CRS, Sector code PRESS Questionnaire CRS, other sectors Total
USD
Link to Figure Data: PRESS 2017_Figure Data
Figure 2a. Global Commitments to Statistics as percentage of ODA
0.14
0.230.20
0.240.26
0.35
0.30
0.39
0.29 0.30
0
0.05
0.10
0.15
0.20
0.25
0.30
0.35
0.40
0.45
2006 2007 2008 2009 2010 2011 2012 2013 2014 2015
%
Link to Figure Data: PRESS 2017_Figure Data
Figure 2b. Global Commitments to Statistics per capita
0.040.07 0.07
0.08 0.09
0.120.10
0.20
0.15 0.15
0
0.05
0.10
0.15
0.20
0.25
2006 2007 2008 2009 2010 2011 2012 2013 2014 2015
USD
Link to Figure Data: PRESS 2017_Figure Data
15. Global commitments to statistics and its share in ODA in 2006-2015 is referenced in the 2017 Development Co-operation Report (DCR). Unlike all PRESSs in the past, DCR 2017 shows the figures in 2014 constant price and thus caused the divergence between the numbers. http://www.oecd.org/dac/development-co-operation-report-20747721.htm

14 • PRESS 2017 | Partner Report on Support to Statistics
2. Support to statistics remains relatively low, but there is reason for hope. 2015 commitments to statistical
development of about USD 541 million mirrors the similar level from 2014 (see Figure 1). Still, the share of ODA
dedicated to statistics remains low (0.30%) in 2015. Both total commitments and the share of ODA are lower by 25%
compared with commitments in 2013, considered the peak period16. This should, however, not be interpreted as a
general trend because commitments often span over multiple years and fluctuations in annual figures are common.
Overall, it appears that commitments to statistics remained constant over three of the last four years (2012-2015).
With an increased focus on data and statistics, further commitments from donors such as the Bill and Melinda
Gates Foundation are yet to be fully reflected in this year’s report. In 2015, commitments remained stable
in per capita terms, despite a growing population in recipient countries, suggesting the increase in support
outweighed demographic growth.17
Statistical Capacity Building only cuts a small portion of the ODA at about 0.30% compared to other sectors18 such
as “Economic Infrastructure and Services or Health”. The total amount of aid to statistics remains negligible as
illustrated in Figure 3.
Figure 3. Share of Sectors on ODA, 2015, in USD
Statistics$541m
Others$121b
Education$12b
Production Sectors$15b
Government & Civil Society$18b
Health$15b
Economic Infrastructure & Services$39b
Link to Figure Data: PRESS 2017_Figure Data
3. Funding commitments remain aligned with NSDS.19 Between 2013 and 2015, the share of commitments
reportedly aligned with an NSDS remains at an overall high level (see Figure 4). However, more and more
reporters answered “Do not know” when asked about whether the projects are aligned with NSDS in the
PRESS survey.
16. The decrease from 2013 was also caused by two phenomena: first, a peak in total commitments in 2013 ($720M) that can be explained by several major com-mitments in Asia-Pacific countries that year, such as the Socio-Demographic and Economic Survey of Afghanistan ($47M) and the development of the Bangladesh Poverty Database ($40M); second, the peak can be explained by changes in the PRESS coverage. Indeed, in 2013 a total of 11 countries (i.e. Albania, China, Colom-bia, Dominican Republic, Ecuador, FYR of Macedonia, Iran, Jordan, Niue, Peru and Thailand) changed status from lower-middle-income countries to upper-middle income countries, and hence have not been covered in reporting for the last three years. In turn, the total population covered by the PRESS decreased from 5.2 billion in 2012 to 3.7 billion in 2015.
17. Population figures are drawn from the World Bank (http://data.worldbank.org/indicator/SP.POP.TOTL). Previous years’ PRESS used population figures from UNSD. The data source was changed to have the estimated numbers of year 2015, also to align the per capita figures with the World Bank Statistical Capacity score.
18. Sectorial categories and data are taken from the CRS.19. For details on the status of NSDSs in specific countries see PARIS21’s most recent NSDS Progress Report at www.paris21.org/nsds-status

PRESS 2017 | Partner Report on Support to Statistics • 15
Figure 4. Alignment of Projects with NSDS
100 100
96
98
99 100
98
9898
97
93
94
95
96
97
98
99
100
2006 2007 2008 2009 2010 2011 2012 2013 2014 2015
%
Link to Figure Data: PRESS 2017_Figure Data
BOX 3. What is a National Strategy for the Development of Statistics?
A National Strategy for the Development of Statistics
(NSDS) is undertaken to provide a country with a strategy
for developing statistical capacity across the entire
national statistical system (NSS). The NSDS provides a
vision of where the NSS should be in five to ten years
and sets milestones to achieve this vision. It presents a
comprehensive and unified framework for the continual
assessment of evolving user needs and priorities for
statistics, and for building the capacity necessary to
meet these needs in a more co-ordinated, synergistic
and efficient manner. It also provides a framework for
mobilising, harnessing, and leveraging resources (both
national and international), and a basis for effective and
results-oriented strategic management of the NSS.
As of February 2017, of the 77 IDA borrowers, 39 are
currently implementing their NSDS. A total of 88.3% are
currently engaged in an NSDS process. In Africa, 33 of
the 40 IDA countries on the continent are designing or
implementing a statistical strategy.
PARIS21 has been keeping the NSDS guidelines up-to-
date to include important new topics or reflect new ideas
such as how to plan open data, how to improve data
dissemination, how to improve gender disaggregated
data, etc.
Source: http://www.paris21.org/NSDS-Status
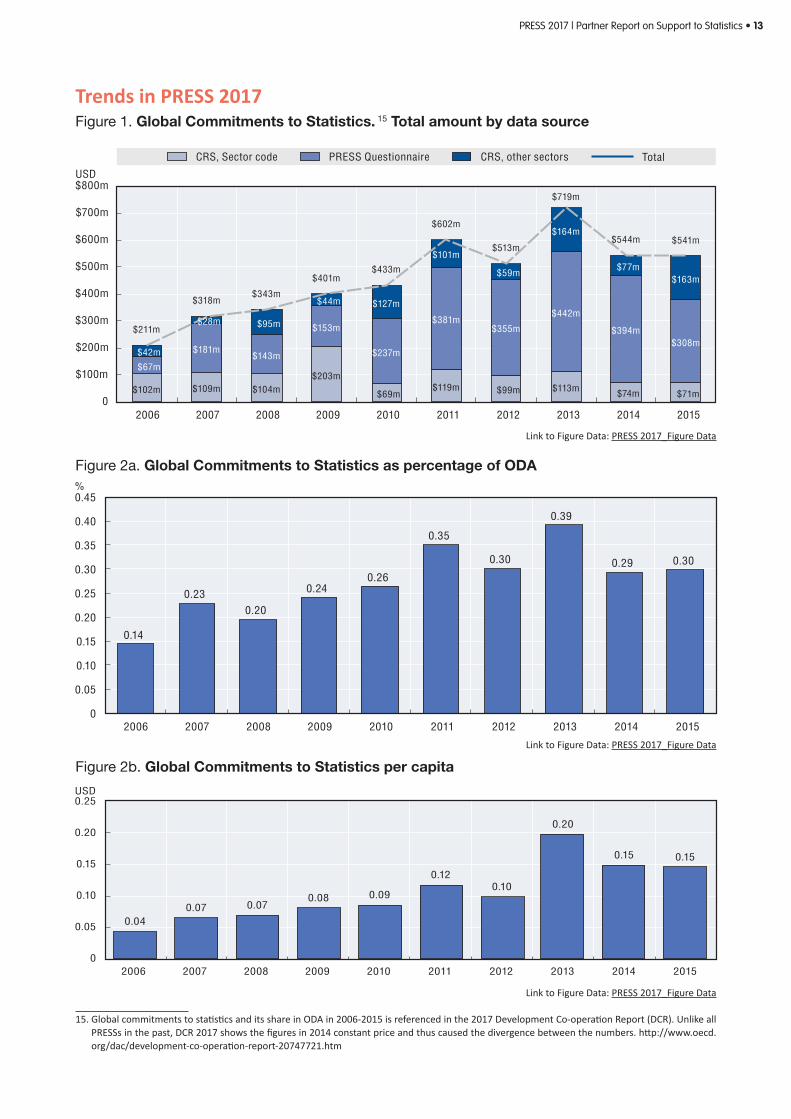
4. Multilateral, country-specific assistance remains the most popular means through which donors channel
support to countries.20 Figure 5 shows that support from multilateral bodies accounted for around 50% of
total aid to statistics before 2009 and increased thereafter. From 2013 to 2015, the share of country-specific
aid remained stable at 60%. More regional and unallocated commitments should be observed considering
the SDG’s focus on the planet and environment.
20. Multilateral support in this context refers to support coming from multilateral institutions, and country-specific assistance refers to projects for which there is a single country recipient. Open Data Watch’s Inventory of Financial Instruments provides further information about options for channelling aid funds at http://opendatawatch.com/monitoring-reporting/aid-for-statistics/
16 • PRESS 2017 | Partner Report on Support to Statistics
Figure 5. Allocation of Aid to Statistics, in USD
$62m $83m$117m
$54m $79m$66m $57m
$194m$64m $57m
$71m$184m $147m
$127m
$309m$439m
$333m$327m
$265m $253m
0%
10%
20%
30%
40%
50%
60%
70%
80%
90%
100%
2006 2007 2008 2009 2010 2011 2012 2013 2014 2015
Bilateral Country-Specific Multilateral Country-Specific Bilateral Unallocated Multilateral Unallocated
Link to Figure Data: PRESS 2017_Figure Data
5. General statistical items and methodology of data collection, processing, dissemination, and analysis
has been the dominant category in aid to statistics. Nearly 40% of total commitments in 2015 went to this
statistical domain (Figure 6). The share of aid to strategic and managerial issues of official statistics nationally
and internationally has been stable (27% of total commitments in 2015), and is expected to increase as the
SDGs and 2030 Agenda translate into stronger commitments. Demographic and social statistics accounted for
the third largest share (23%). The share of commitments to economic statistics decreased from 24% in 2014
to 8% in 2015 (see methodology). The share of commitments to economic statistics decreased from 24% in
2014 to 8% in 2015. Figure 6 shows the breakdown of aid to statistics across areas of statistical development.21
Figure 6. Areas of Aid to Statistics
20%9%
25% 23% 22% 25% 29% 27%21% 23%
28%56%
9%21% 18%
18% 9%19%
24%8%
1%
3%
11%
7% 10% 5%
4%
4% 11%
3%
26%
14%
32%31% 32%
26% 41%30%
27%
40%
24%18%
23% 19% 18%26%
18% 20% 18%27%
0
10
20
30
40
50
60
70
80
90
100
2006 2007 2008 2009 2010 2011 2012 2013 2014 2015
Environment and multi-domain statistics Economic statistics Demographic and social statistics
General statistical items and methodology of data collection, processing, dissemination and analysis
Strategic and managerial issues of official statistics at national and international level
%
Link to Figure Data: PRESS 2017_Figure Data
21. The purpose of a commitment is reported according to the statistical categories based on the “Classification on activities in the domain of statistical capacity building, adjusted for the reporting of donor and recipient activities”, developed by an inter-agency task team that defined PRESS metho-dology. This classification is largely based on the Classification of Statistical Activities used in the United Nations Economic Commission for Europe’s (UNECE) Database of International Statistical Activities, and, since 2009, for the list of subject matter domains in the Content-oriented Guidelines, produced by the SDMX (Statistical Data and Metadata eXchange) initiative. For more details, see the Methodological Annex.

PRESS 2017 | Partner Report on Support to Statistics • 17
Key findings by recipient
6. Africa received the lion’s share of statistical support with 56% (USD 1 billion) of total support in 2013-2015.
The share of total statistical support committed to Latin America and the Caribbean shows a decreasing trend
after 2012 due to Ecuador, Colombia and Peru becoming upper middle-income countries in 2013 and thus
not being covered by the report afterwards. Eastern Europe received 6% (USD 112 million) and Asia-Pacific
received 22% (USD 397 million) of the total statistical support in 2013-2015. A further 11% (USD 192 million) was
committed to global projects and programmes that were not country-specific.
Figure 7a. Commitment in 2006-15 over rolling 3-year period, by geographical region
43% 45%36% 37% 40% 45%
51%56%
28% 23%
26% 23%29%
32%28% 22%
3% 4%6% 7%
7%
6%6% 6%
13%21% 19% 14%
6% 7%9% 11%13%
21% 19% 14%6% 7%
9% 11%
0
10
20
30
40
50
60
70
80
90
100
2006-08 2007-09 2008-10 2009-11 2010-12 2011-13 2012-14 2013-15
13%7% 13% 19%
18%11% 6% 5%
13%7% 13% 19%
18%11% 6% 5%
Africa Asia-Pacific Eastern Europe Latin America and Caribbean Unallocated
%
Link to Figure Data: PRESS 2017_Figure Data
Figure 7b. Commitment in 2015, by geographical region
Africa69%
Asia-Pacific10%
Eastern Europe5%
Latin America and Caribbean2%
Unallocated13%
Link to Figure Data: PRESS 2017_Figure Data
18 • PRESS 2017 | Partner Report on Support to Statistics
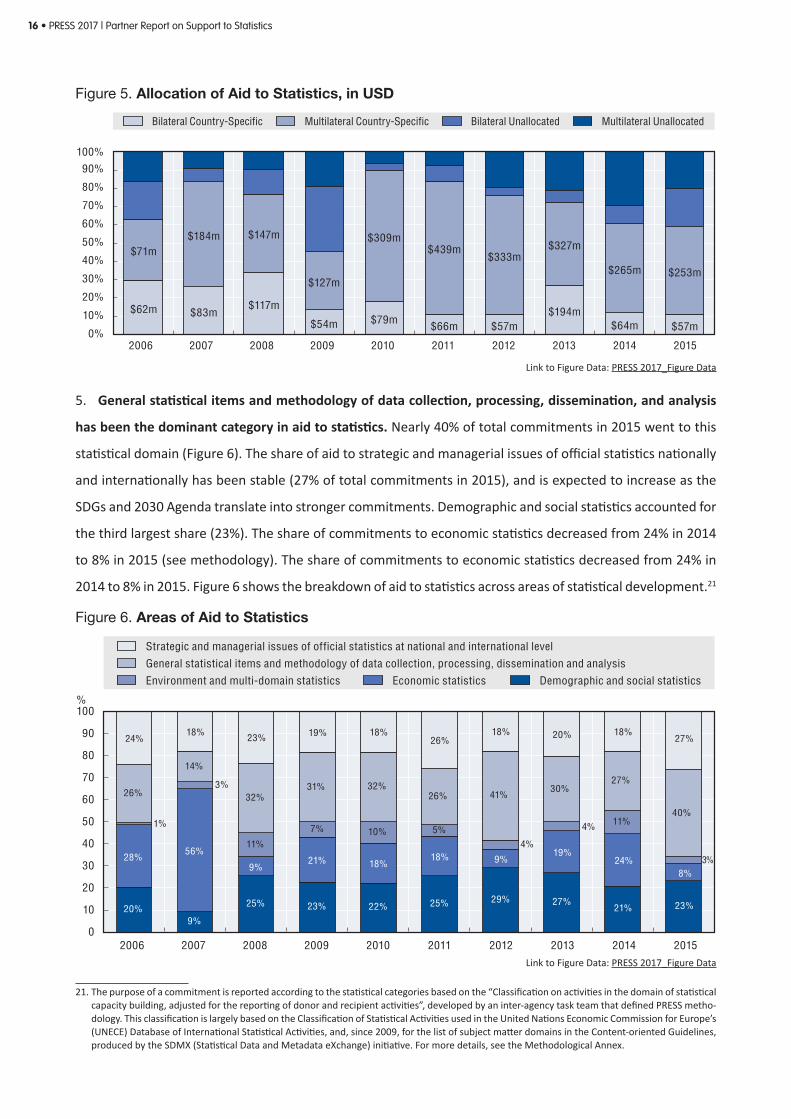
7. The focus on different areas of statistics varies among regions, highlighting the heterogeneity of
statistical capacity needs. In Eastern Europe, more than one third of aid to statistics was committed to
“Strategic and managerial issues of official statistics at national and international level”. It can be explained
by the efforts made by countries in this region who are required to improve their statistical institutions as
part of accession to the EU. On the other hand, “General statistical items and methodology of data collection,
processing, dissemination, and analysis” takes the lion’s share in other geographic regions because surveys
and censuses take up the biggest chunk under this category. “Environmental and multi-domain statistics”
takes the most stable but the lowest share of statistical areas in every region. Given the SDG focus on people,
planet and prosperity – donors should strike a balance in statistical funding to address these concerns.
Figure 8. Areas of Aid to Statistics by Region in 2006-2015
0
10
20
30
40
50
60
70
80
90
100
Africa Asia-Pacific Eastern Europe Latin Americaand the Caribbean
Unallocated
21% 22%17%
29%
13%
19% 19%20%
11%
29%
5% 5%5%
4%9%
36% 35%
23%
40%21%
19% 18%
35%
15%28%
21% 22%17%
29%
13%
19% 19%20%
11%
29%
5% 5%5%
4%9%
36% 35%
23%
40%21%
19% 18%
35%
15%28%
General statistical items and methodology of data collection, processing, dissemination and analysis
Strategic and managerial issues of official statistics at national and international level
Environment and multi-domain statistics Economic Statistics Demographic and social statistics
%
Link to Figure Data: PRESS 2017_Figure Data
8. Support to statistics remains concentrated with 25 countries receiving more than 60% of support to
82 countries in 2015. Countries in this ranking reappear from year to year: 17 of this year’s top 25 recipients
have been on the list at least three times in past 10 years. Between 2006 and 2015, countries like Afghanistan,
Bolivia, Rwanda and Tanzania rank highest in total terms.

PRESS 2017 | Partner Report on Support to Statistics • 19
Figure 9. Top Five Recipients of Country-specific Aid
3% 4% 3% 2% 3% 6% 4% 4% 4% 5%3%5% 4% 2% 5%
7%4% 6% 5% 6%3%
5%4%
3%
7%
7%
4%6% 6%
9%
4%
12 %
7%
3%
18 % 8%
6%
7% 6%
10 %
6%
20 %
12 %
7%
25 %
8%
12 %9%
7%
12 %50 %
71 %
65 %
38 %
82 %
77 %
58 %
62 %
56 %
68 %
0
10
20
30
40
50
60
70
80
90
0
10
20
30
40
50
60
70
SLV VNM MOZ RWA IND BOL MMR AFG RWA NGA
MOZ KEN AFG URY ECU IDN NGA BGD ETH COD
KEN RWA HTI TCD BGD GHA ZWE TZA COD KEN
NGA ETH LKA NER BOL TZA SSD MMR CIV MDG
MLI MWI PAK IND ALB SRB ETH BOL BOL TUR
2006 2007 2008 2009 2010 2011 2012 2013 2014 2015
Top 5 share of Total Aid (%) Top 25 share of Total Aid (%)
2nd Highest Recipient Highest Recipient Top 25 share of Total Aid
5th Highest Recipient 4th Highest Recipient 3rd Highest Recipient
Link to Figure Data: PRESS 2017_Figure Data
9. Countries with the lowest statistical capacity receive the most support in 2013-15, but not every one of
them. By matching the figures on commitments with the World Bank Statistical Capacity Indicator scores,22
one can begin to determine whether a relationship exists between the volume of statistical support provided
to countries and their need to develop capacity. Based on the 2017 PRESS database, countries with the least
statistical capacity score received the highest level of support with about USD 0.87 per capita in 2013-2015. The
other three quartiles receive roughly the same level of commitment between USD 0.30 to 0.40. This is a positive
sign for the current state of distribution of aid to statistical development. However, not every country in the
bottom quantile received high support in per capita terms in 2013-2015. Country-specific support to Angola,
whose capacity score was lower than 50 in 2013-2015, was only USD 0.03 per capita in those three years.
22. On an annual basis, the World Bank updates its “country-level statistical capacity indicator based on a set of criteria consistent with international recommendations.” This indicator – on a scale of 0 to 100 – is available for more than 140 countries. See http://bbsc.worldbank.org. This excludes those PRESS countries for whom the World Bank has not calculated a statistical capacity score (DR Korea, Kosovo, South Sudan and Tuvalu).

20 • PRESS 2017 | Partner Report on Support to Statistics
Figure 10. Average annual per capita commitment in 2013-2015
0.87
0.40 0.31
0,.37
Lowest 25% 2nd Quartile 3rd Quartile Highest 25%
Per capita commitment (in USD)
Sorted by Overall Statistical Capacity Score
Link to Figure Data: PRESS 2017_Figure Data
Small Island Developing States
10. Support to Small Island Developing States (SIDS)23 falls behind, despite high level in total values. Between
2013 and 2015, total commitments received by SIDS (USD 23 million for 25 countries) were higher than other
countries similar in population and GDP per capita such as Angola. However, not all beneficiary SIDS countries
are receiving the same level of support, and it is sometimes insufficient. Figure 11a shows that not a single
SIDS country received more than USD 5 million of support in 2013-2015. Allocation of commitments is also
uneven. Almost 80% of the funding was devoted to demographic, social and general statistical items, and
the remaining 20% was allocated for economic, environmental and multi-domain statistics. If the uneven
distribution of funds favouring one domain over others would continue in the coming years, it would put in
serious risk the SIDS countries’ ability to holistically monitor the 2030 Agenda. At present, there is dearth of
available data on environment and climate-change related issues which need to be addressed.
The Source of financial support for SIDS is concentrated, with over 75% of aid coming from five major donors
(Australia, European Commission/Eurostat, IMF,24 Inter-American Development Bank and UNFPA), which
suggests that statistical development in SIDS relies heavily on regional donors such as Australia and the
Inter-American Development Bank for Pacific and Caribbean, respectively. Still, the increasing statistical co-
operation among SIDS at the regional level has contributed to reduce statistical gaps. These achievements
have been possible through the establishment of regional statistical centres and programmes, the adoption
of strategic frameworks (such as the CARICOM Action Plan and the Ten Year Pacific Statistics Strategy 2011-
2020) and the adoption of standards, classifications and common methodologies in line with international
recommendations (OECD, forthcoming).
23. For the purposes of this report, the definition for a Small Island Developing State (SIDS) is drawn from the United Nations. See http://www.sids2014.org/index.php?menu=1496
24. Although ranked as one of the top five donors for SIDS, IMF, who was also one of the top five donors in 2014, did not make the deadline to report to PRESS 2017 and is thus not fully covered. Its commitments to statistical development will be included in next year’s report.

PRESS 2017 | Partner Report on Support to Statistics • 21
Figure 11a. Small Island Developing States with > USD 1 million of Commitments in 2013-2015
Timor-Leste$5m
Others$6m
Haiti$4m
Solomon Islands$3m
Guyana$2m
Dominica$2m
Guinea-Bissau$1m
Cabo Verde$1m
Link to Figure Data: PRESS 2017_Figure Data
Figure 11b. Top 5 Donors that Committed to Small Island Developing States in 2013-2015
Others23%
European Commission / EUROSTAT25%Australia
24%
International Monetary Fund - IMF11%
UNFPA10%
Inter American Development Bank7%
Link to Figure Data: PRESS 2017_Figure Data
Fragile States
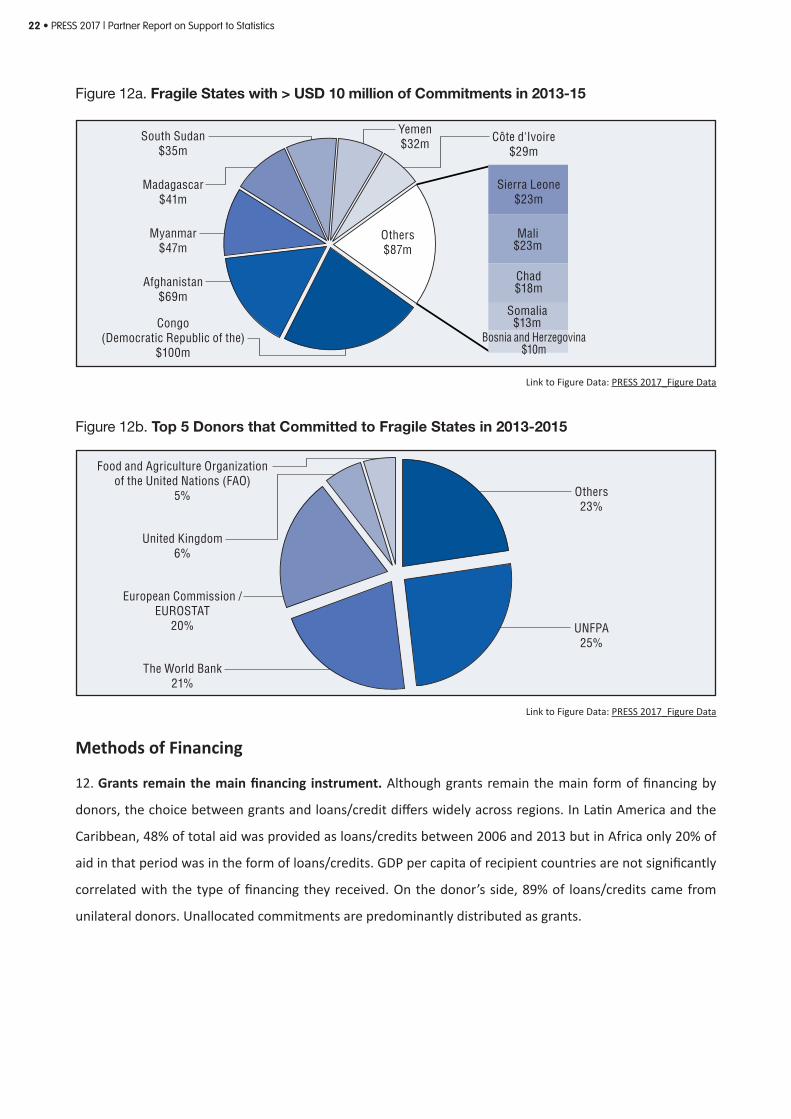
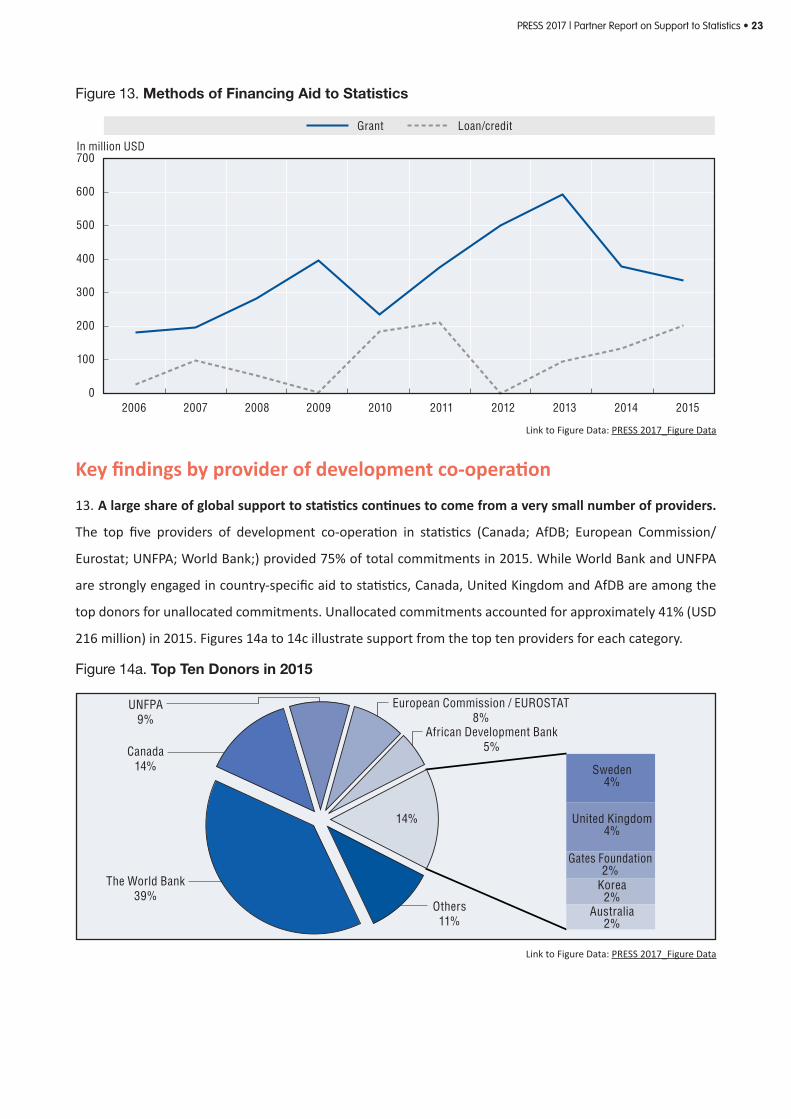
11. Fragile states25 receive considerable attention from the statistical development community. Currently,
all fragile states are included in the PRESS with commitments of USD 507 million reported between 2013 and
2015. This represents around one-third of all country-specific commitments in this period worldwide (USD
1 786 million). Afghanistan, Democratic Republic of Congo, Madagascar, Myanmar, South Sudan and Yemen
combined received more than two thirds of statistical aid to fragile states. Five of these six countries were
also the top five recipients among fragile states in 2012-2014. The only exception, Madagascar, received a
commitment from UNFPA that amounted to USD 31.6 million for its census in 2015. Figure 12a shows the
support to all fragile states that received more than USD 10 million in commitments. The top five donors
(Canada, United Kingdom, EU, UNFPA and the World Bank) provided nearly 80% of total aid to fragile states.
25. For the purposes of this report, the definition for fragility and the identification of countries satisfying those criteria are drawn from the World Bank’s harmonised list of fragile states. See http://go.worldbank.org/BNFOS8V3S0.
22 • PRESS 2017 | Partner Report on Support to Statistics
Figure 12a. Fragile States with > USD 10 million of Commitments in 2013-15
Côte d'Ivoire$29m
Yemen$32m
South Sudan$35m
Madagascar$41m
Myanmar$47m
Afghanistan$69m
Congo(Democratic Republic of the)
$100m
Sierra Leone$23m
Mali$23m
Chad$18m
Somalia$13m
Bosnia and Herzegovina$10m
Others$87m
Link to Figure Data: PRESS 2017_Figure Data
Figure 12b. Top 5 Donors that Committed to Fragile States in 2013-2015
United Kingdom6%
European Commission /EUROSTAT
20%
The World Bank21%
Food and Agriculture Organizationof the United Nations (FAO)
5%
UNFPA25%
Others23%
Link to Figure Data: PRESS 2017_Figure Data
Methods of Financing
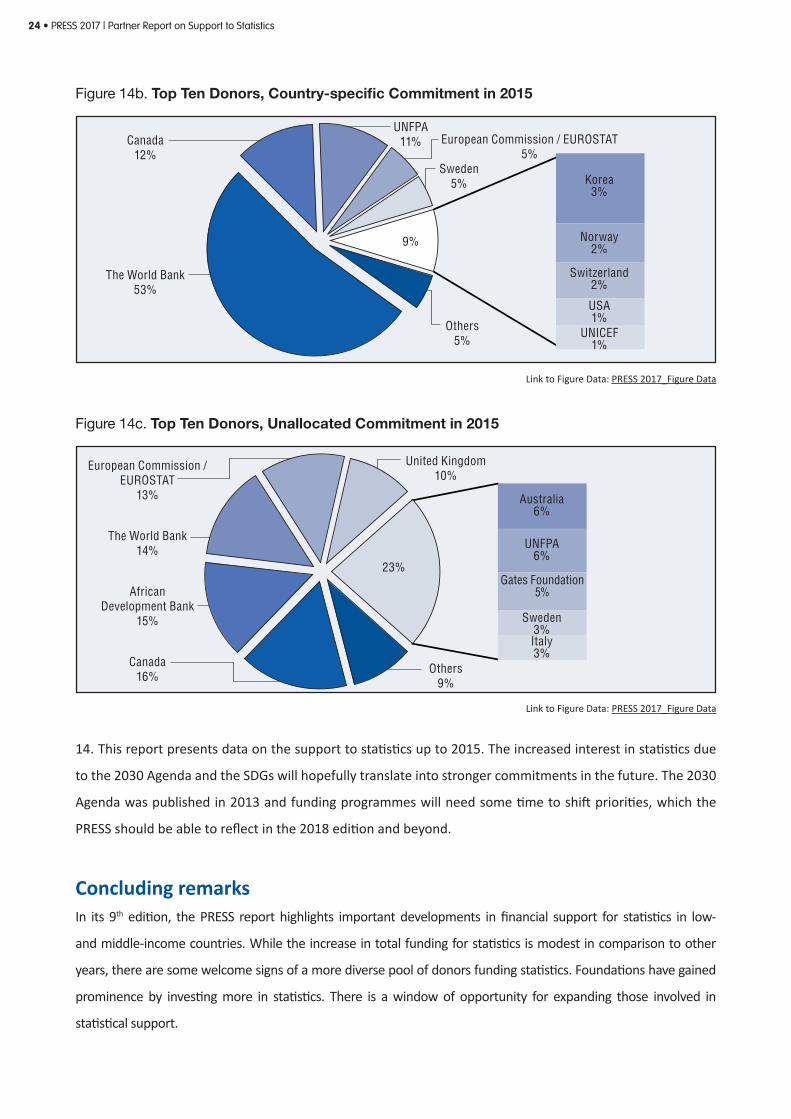
12. Grants remain the main financing instrument. Although grants remain the main form of financing by
donors, the choice between grants and loans/credit differs widely across regions. In Latin America and the
Caribbean, 48% of total aid was provided as loans/credits between 2006 and 2013 but in Africa only 20% of
aid in that period was in the form of loans/credits. GDP per capita of recipient countries are not significantly
correlated with the type of financing they received. On the donor’s side, 89% of loans/credits came from
unilateral donors. Unallocated commitments are predominantly distributed as grants.
PRESS 2017 | Partner Report on Support to Statistics • 23
Figure 13. Methods of Financing Aid to Statistics
0
100
200
300
400
500
600
700
2006 2007 2008 2009 2010 2011 2012 2013 2014 2015
Grant Loan/credit
In million USD
Link to Figure Data: PRESS 2017_Figure Data
Key findings by provider of development co-operation
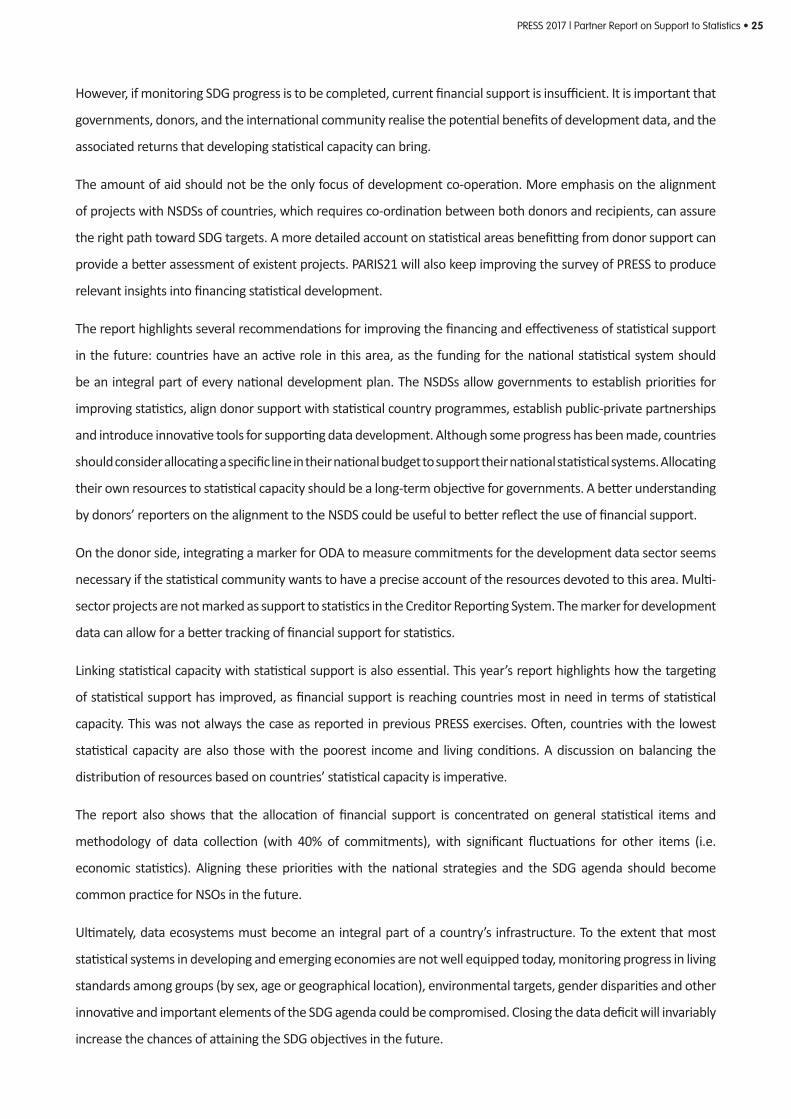
13. A large share of global support to statistics continues to come from a very small number of providers.
The top five providers of development co-operation in statistics (Canada; AfDB; European Commission/
Eurostat; UNFPA; World Bank;) provided 75% of total commitments in 2015. While World Bank and UNFPA
are strongly engaged in country-specific aid to statistics, Canada, United Kingdom and AfDB are among the
top donors for unallocated commitments. Unallocated commitments accounted for approximately 41% (USD
216 million) in 2015. Figures 14a to 14c illustrate support from the top ten providers for each category.
Figure 14a. Top Ten Donors in 2015
UNFPA9%
Canada14%
The World Bank39%
Others11%
Sweden4%
United Kingdom4%
Gates Foundation2%
Korea2%
Australia2%
14%
European Commission / EUROSTAT8%
African Development Bank5%
14%
Link to Figure Data: PRESS 2017_Figure Data
24 • PRESS 2017 | Partner Report on Support to Statistics
Figure 14b. Top Ten Donors, Country-specific Commitment in 2015
European Commission / EUROSTAT5%
Sweden5%
UNFPA11%
Others5%
Canada12%
The World Bank53%
Korea3%
Norway2%
Switzerland2%
USA1%
UNICEF1%
9%
Link to Figure Data: PRESS 2017_Figure Data
Figure 14c. Top Ten Donors, Unallocated Commitment in 2015
United Kingdom10%
Australia6%
UNFPA6%
Gates Foundation5%
Sweden3%Italy3%
European Commission /EUROSTAT
13%
The World Bank14%
AfricanDevelopment Bank
15%
Canada16%
Others9%
23%
Link to Figure Data: PRESS 2017_Figure Data
14. This report presents data on the support to statistics up to 2015. The increased interest in statistics due
to the 2030 Agenda and the SDGs will hopefully translate into stronger commitments in the future. The 2030
Agenda was published in 2013 and funding programmes will need some time to shift priorities, which the
PRESS should be able to reflect in the 2018 edition and beyond.
Concluding remarksIn its 9th edition, the PRESS report highlights important developments in financial support for statistics in low-
and middle-income countries. While the increase in total funding for statistics is modest in comparison to other
years, there are some welcome signs of a more diverse pool of donors funding statistics. Foundations have gained
prominence by investing more in statistics. There is a window of opportunity for expanding those involved in
statistical support.
PRESS 2017 | Partner Report on Support to Statistics • 25
However, if monitoring SDG progress is to be completed, current financial support is insufficient. It is important that
governments, donors, and the international community realise the potential benefits of development data, and the
associated returns that developing statistical capacity can bring.
The amount of aid should not be the only focus of development co-operation. More emphasis on the alignment
of projects with NSDSs of countries, which requires co-ordination between both donors and recipients, can assure
the right path toward SDG targets. A more detailed account on statistical areas benefitting from donor support can
provide a better assessment of existent projects. PARIS21 will also keep improving the survey of PRESS to produce
relevant insights into financing statistical development.
The report highlights several recommendations for improving the financing and effectiveness of statistical support
in the future: countries have an active role in this area, as the funding for the national statistical system should
be an integral part of every national development plan. The NSDSs allow governments to establish priorities for
improving statistics, align donor support with statistical country programmes, establish public-private partnerships
and introduce innovative tools for supporting data development. Although some progress has been made, countries
should consider allocating a specific line in their national budget to support their national statistical systems. Allocating
their own resources to statistical capacity should be a long-term objective for governments. A better understanding
by donors’ reporters on the alignment to the NSDS could be useful to better reflect the use of financial support.
On the donor side, integrating a marker for ODA to measure commitments for the development data sector seems
necessary if the statistical community wants to have a precise account of the resources devoted to this area. Multi-
sector projects are not marked as support to statistics in the Creditor Reporting System. The marker for development
data can allow for a better tracking of financial support for statistics.
Linking statistical capacity with statistical support is also essential. This year’s report highlights how the targeting
of statistical support has improved, as financial support is reaching countries most in need in terms of statistical
capacity. This was not always the case as reported in previous PRESS exercises. Often, countries with the lowest
statistical capacity are also those with the poorest income and living conditions. A discussion on balancing the
distribution of resources based on countries’ statistical capacity is imperative.
The report also shows that the allocation of financial support is concentrated on general statistical items and
methodology of data collection (with 40% of commitments), with significant fluctuations for other items (i.e.
economic statistics). Aligning these priorities with the national strategies and the SDG agenda should become
common practice for NSOs in the future.
Ultimately, data ecosystems must become an integral part of a country’s infrastructure. To the extent that most
statistical systems in developing and emerging economies are not well equipped today, monitoring progress in living
standards among groups (by sex, age or geographical location), environmental targets, gender disparities and other
innovative and important elements of the SDG agenda could be compromised. Closing the data deficit will invariably
increase the chances of attaining the SDG objectives in the future.

26 • PRESS 2017 | Partner Report on Support to Statistics
References
Copenhagen Consensus Centre (2015). Online supplement to “The economics of optimism: The debate
heats up about what goals the world should set itself for 2030”. In: The Economist. Available at http://www.
copenhagenconsensus.com/post-2015-consensus/economist
The Economist (2015). The economics of optimism: The debate heats up about what goals the world should
set itself for 2030. Available at http://www.economist.com/news/finance-and-economics/21640361-debate-
heats-up-about-what-goals-world-should-set-itself-2030
Espey et al. (2015). Data for Development: A Needs Assessment for SDG Monitoring and Statistical Capacity
Development. United Nations Sustainable Development Solutions Network. Available at http://unsdsn.org/
wp-content/uploads/2015/04/Data-for-Development-Full-Report.pdf
GPSDD (2016), «The state of development data funding 2016», Global Partnership for Sustainable
Development Data.
Hanushek. E. and L. Woessmann (2012). Do better schools lead to more growth? Cognitive skills, economic
outcomes, and causation. Journal of Economic Growth 17, 267-321.
Jerven, M. (2014). Benefits and Costs of the Data for Development Targets for the Post-2015 Development
Agenda. Post-2015 Consensus Working Paper. Available at http://www.copenhagenconsensus.com/sites/
default/files/data_assessment_-_jerven.pdf
OECD (2007), Reporting Directives for the Creditor Reporting System. Available at http://www.oecd.org/dac/
stats/1948102.pdf
OECD (2010). The High Cost of Low Educational Performance: The long-run economic impact of improving
PISA outcomes. OECD, Paris. Available at http://www.oecd.org/pisa/44417824.pdf
OECD (2017), Development Co-operation Report 2017: Data for Development. OECD, Paris. http://www.oecd.
org/dac/development-co-operation-report-20747721.htm
OECD (forthcoming), Making International Co-Operation Work for Small Island and Developing States.
Organisation for Economic Co-Operation and Development. OECD, Paris.
ONS (2015). Regional Gross Value Added (Income Approach): December 2015. Available at http://www.ons.
gov.uk/economy/grossvalueaddedgva/bulletins/regionalgrossvalueaddedincomeapproach/latest
Open Data Watch (2016), Aid For Statistics: 2016 Inventory of Financial Instruments. Available at: http://
opendatawatch.com/wp-content/uploads/2016/09/2016-Aid-For-Statistics-An-Inventory-of-Financial-
Instruments.pdf
UNECE Task Force on the Value of Official Statistics (2016). Methodologies for Estimating Value of Official
Statistics, forthcoming.
UNSDSN (2015), “Data for Development: A Needs Assessment for SDG Monitoring and statistical capacity
Development”.

PRESS 2017 | Partner Report on Support to Statistics • 27
Methodology Annexes
Table 1. Countries Covered in PRESS 2017
IDA Borrower Countries
1 Afghanistan 39 Malawi
2 Angola 40 Maldives
3 Bangladesh 41 Mali
4 Benin 42 Mauritania
5 Bhutan 43 Moldova (Republic of)
6 Bolivia (Plurinational State of) 44 Mongolia
7 Burkina Faso 45 Mozambique
8 Burundi 46 Myanmar
9 Cambodia 47 Nepal
10 Cameroon 48 Nicaragua
11 Cabo Verde 49 Niger
12 Central African Republic 50 Nigeria
13 Chad 51 Pakistan
14 Comoros 52 Papua New Guinea
15 Congo 53 Rwanda
16 Congo (Democratic Republic of the) 54 Samoa
17 Côte d’Ivoire 55 Sao Tome and Principe
18 Djibouti 56 Senegal
19 Dominica 57 Sierra Leone
20 Eritrea 58 Solomon Islands
21 Ethiopia 59 Somalia
22 Gambia 60 Sri Lanka
23 Georgia 61 Saint Lucia
24 Ghana 62 Saint Vincent and the Grenadines
25 Grenada 63 Sudan
26 Guinea 64 Tajikistan
27 Guinea-Bissau 65 Tanzania (United Republic of)
28 Guyana 66 Timor-Leste
29 Haiti 67 Togo
30 Honduras 68 Tonga
31 Kenya 69 Uganda
32 Kiribati 70 Uzbekistan
33 Kosovo 71 Vanuatu
34 Kyrgyz Republic 72 Viet Nam
35 Lao People’s Democratic Republic 73 Yemen, Republic
36 Lesotho 74 Zambia
37 Liberia 75 Zimbabwe
38 Madagascar

28 • PRESS 2017 | Partner Report on Support to Statistics
Low-Income, Lower-Middle Income Countries & Remaining African Countries
76 Algeria 91 Morocco
77 Armenia 92 Namibia
78 Botswana 93 Palestinian Authority
79 Egypt 94 Paraguay
80 El Salvador 95 Philippines
81 Equatorial Guinea 96 Seychelles
82 Gabon 97 South Africa
83 Guatemala 98 South Sudan
84 India 99 Swaziland
85 Indonesia 100 Syrian Arab Republic
86 Korea (People’s Republic of) 101 Tokelau
87 Libya 102 Tunisia
88 Marshall Islands 103 Tuvalu
89 Mauritius 104 Ukraine
90 Micronesia (Federated States of)
Source: The definition for IDA borrowers is drawn from the World Bank, as of March 2017. The definition for Low Income and Lower
Middle Income Countries is drawn from the OECD DAC list, as of March 2017. NB: Not all countries listed above received support to
their statistical systems during the reporting period. This document and all maps included herein are without prejudice to the status of or
sovereignty over any territory, to the delimitation of international frontiers and boundaries and to the name of any territory, city or area.
Table 2. Exchange Rates - Period Average (currency/USD)
Co-operation Provider
Exchange rate in year
2006 2007 2008 2009 2010 2011 2012 2013 2014 2015Australia 1.33 1.20 1.21 1.28 1.09 0.97 0.97 0.96 1.11 1.33
Canada 1.13 1.07 1.08 1.14 1.03 0.99 1.00 1.01 1.10 1.28
Denmark 5.94 5.44 5.17 5.35 5.62 5.36 5.79 5.62 5.62 6.73
Japan 116.40 117.80 103.50 93.40 87.76 79.71 79.81 97.59 0.11 0.12
New Zealand 1.54 1.36 1.45 1.60 1.39 1.27 1.23 1.22 1.21 1.43
Norway 6.41 5.86 5.71 6.28 6.04 5.60 5.81 5.88 6.30 8.06
Sweden 7.37 6.76 6.68 7.63 7.20 6.49 6.77 6.51 6.86 8.43
Switzerland 1.25 1.20 1.10 1.08 1.04 0.89 0.94 0.93 0.92 0.96
Euro 0.80 0.73 0.69 0.72 0.76 0.72 0.78 0.76 0.75 0.90
Pound Sterling 0.54 0.50 0.55 0.64 0.65 0.62 0.63 0.65 0.61 0.65
PRESS 2017 | Partner Report on Support to Statistics • 29
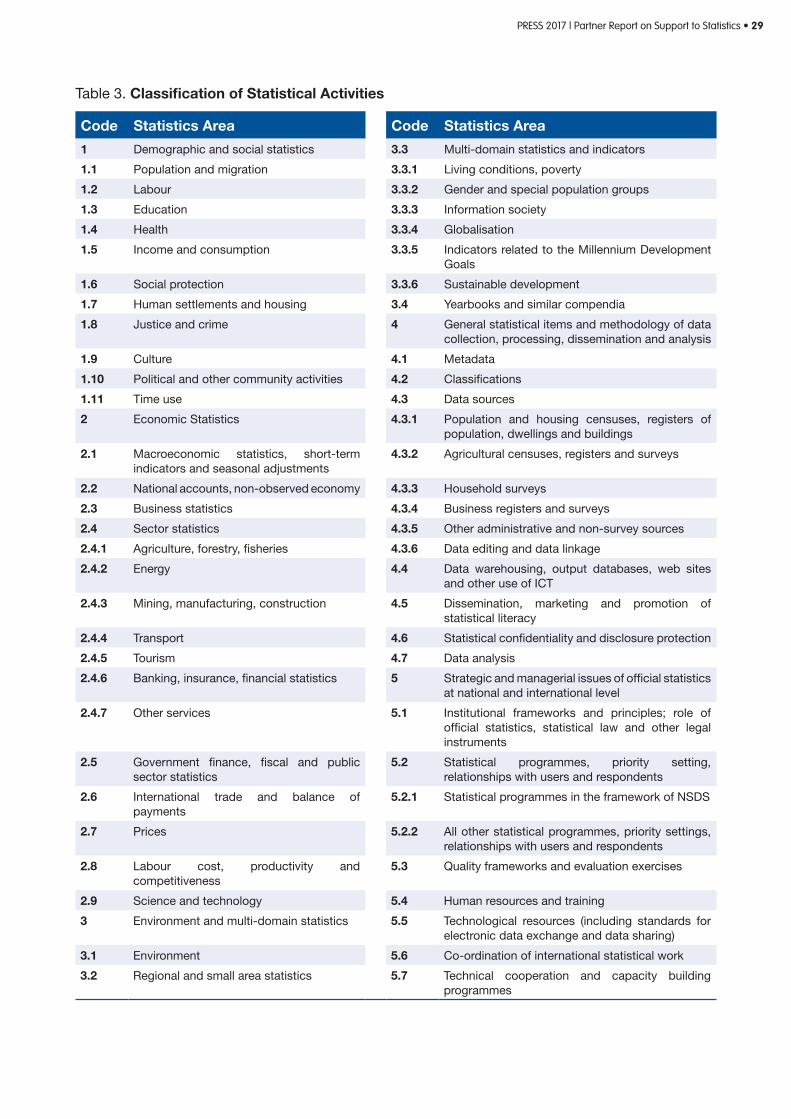
Table 3. Classification of Statistical Activities
Code Statistics Area Code Statistics Area
1 Demographic and social statistics 3.3 Multi-domain statistics and indicators
1.1 Population and migration 3.3.1 Living conditions, poverty
1.2 Labour 3.3.2 Gender and special population groups
1.3 Education 3.3.3 Information society
1.4 Health 3.3.4 Globalisation
1.5 Income and consumption 3.3.5 Indicators related to the Millennium Development Goals
1.6 Social protection 3.3.6 Sustainable development
1.7 Human settlements and housing 3.4 Yearbooks and similar compendia
1.8 Justice and crime 4 General statistical items and methodology of data collection, processing, dissemination and analysis
1.9 Culture 4.1 Metadata
1.10 Political and other community activities 4.2 Classifications
1.11 Time use 4.3 Data sources
2 Economic Statistics 4.3.1 Population and housing censuses, registers of population, dwellings and buildings
2.1 Macroeconomic statistics, short-term indicators and seasonal adjustments
4.3.2 Agricultural censuses, registers and surveys
2.2 National accounts, non-observed economy 4.3.3 Household surveys
2.3 Business statistics 4.3.4 Business registers and surveys
2.4 Sector statistics 4.3.5 Other administrative and non-survey sources
2.4.1 Agriculture, forestry, fisheries 4.3.6 Data editing and data linkage
2.4.2 Energy 4.4 Data warehousing, output databases, web sites and other use of ICT
2.4.3 Mining, manufacturing, construction 4.5 Dissemination, marketing and promotion of statistical literacy
2.4.4 Transport 4.6 Statistical confidentiality and disclosure protection
2.4.5 Tourism 4.7 Data analysis
2.4.6 Banking, insurance, financial statistics 5 Strategic and managerial issues of official statistics at national and international level
2.4.7 Other services 5.1 Institutional frameworks and principles; role of official statistics, statistical law and other legal instruments
2.5 Government finance, fiscal and public sector statistics
5.2 Statistical programmes, priority setting, relationships with users and respondents
2.6 International trade and balance of payments
5.2.1 Statistical programmes in the framework of NSDS
2.7 Prices 5.2.2 All other statistical programmes, priority settings, relationships with users and respondents
2.8 Labour cost, productivity and competitiveness
5.3 Quality frameworks and evaluation exercises
2.9 Science and technology 5.4 Human resources and training
3 Environment and multi-domain statistics 5.5 Technological resources (including standards for electronic data exchange and data sharing)
3.1 Environment 5.6 Co-ordination of international statistical work
3.2 Regional and small area statistics 5.7 Technical cooperation and capacity building programmes

30 • PRESS 2017 | Partner Report on Support to Statistics
Table 4. List of stemmed keyword sequences used to identify statistics components in CRS project descriptions
English
birth registr
vital statist
vital registr
civil registr
death registr
crvs
administrative databas
data port
devinfo
data arch
archive data
data dissemin
disseminate data
disseminate statist
statistics dissemin
microdata
metadata
data manag
data document
survey data
household survey
quality statist
statistics qu
quality survey
survey qu
quality data
data qu
access data
open data
use data
produce data
production data
data us
data produc
data outreach
data awar
data product
statistical product
statistical busi
data collect
data process
data access
statistical harmon
survey harmon
data harmon
harmonization data
statistical system
nsds
development statist
mdg indic
statistical standard
data standard
statistical capac
data cur
curating data
statistics offic
office statist
statistics bureau
bureau statist
statistics train
institute statist
demographic data
demographic statist
mdg monitor
monitoring mdg
release data
data releas
national survey
survey programm
survey program
agency statist
statistics ag
survey catalogu
survey catalog
afristat
ckan
prsp monitor
data revolut
lfs questionnair
force survey
government statist
govt statist
statistics law
statistics legisl
disaggregated data
data disaggreg
disaggregated sex
disaggregated gend
gender disaggreg
sex disaggreg
statistical studi
collection method
business registr
registration busi
survey design
data compil
survey system
statistician
statistical program
statistical programm
minimum statist
statistical data
data entri
statistical oper
questionnaire design
design questionnair
statistics survey
statistics questionnair
sampling plan
agricultural survey
multiple ind
cluster survey
business survey
national Survey
health survey
partnership statist
regional statist
national statist
metadata exchang
mdg assess
assessment mdg
measuring ind
indicator measur
statistical methodolog
evaluation methodolog
survey methodolog
census
data improv
improv data
improv statist
statistics improv
gender statist
disaggregated ind
disaggregated statist
regional survey
national data
statistics databas
statistics db
national account
data avail
availability data
statistics avail
availability statist
data develop
develop data
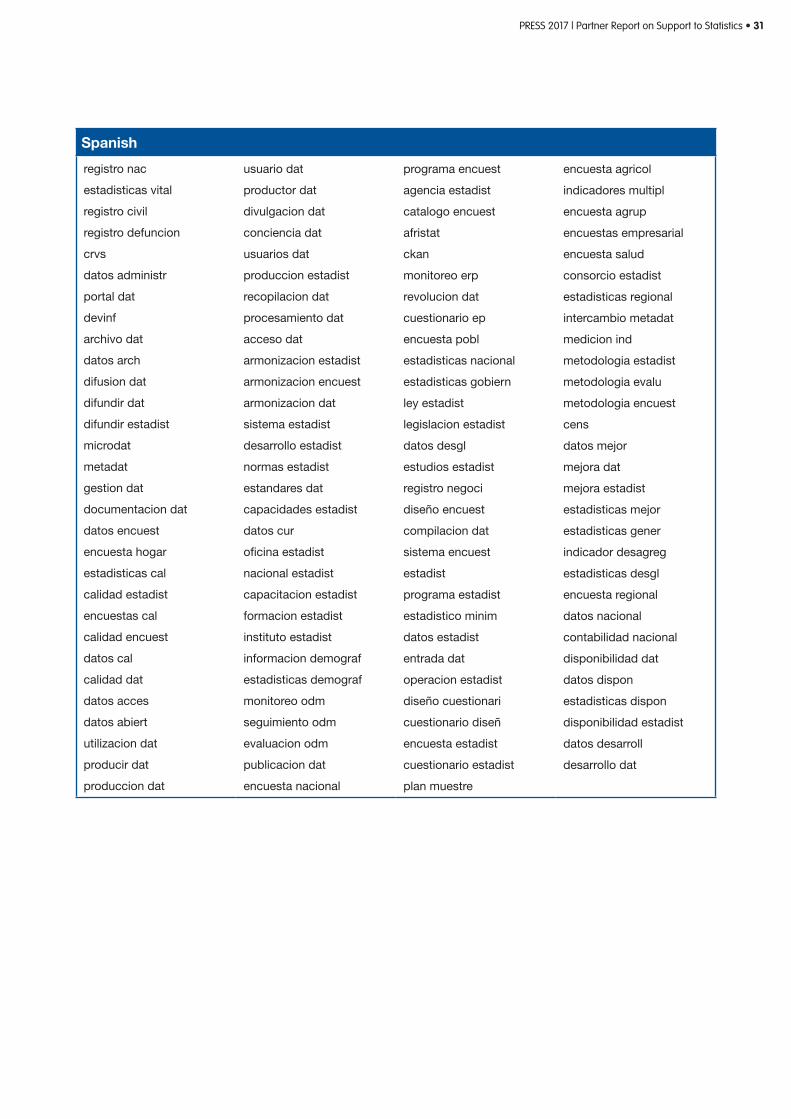
PRESS 2017 | Partner Report on Support to Statistics • 31
Spanish
registro nac
estadisticas vital
registro civil
registro defuncion
crvs
datos administr
portal dat
devinf
archivo dat
datos arch
difusion dat
difundir dat
difundir estadist
microdat
metadat
gestion dat
documentacion dat
datos encuest
encuesta hogar
estadisticas cal
calidad estadist
encuestas cal
calidad encuest
datos cal
calidad dat
datos acces
datos abiert
utilizacion dat
producir dat
produccion dat
usuario dat
productor dat
divulgacion dat
conciencia dat
usuarios dat
produccion estadist
recopilacion dat
procesamiento dat
acceso dat
armonizacion estadist
armonizacion encuest
armonizacion dat
sistema estadist
desarrollo estadist
normas estadist
estandares dat
capacidades estadist
datos cur
oficina estadist
nacional estadist
capacitacion estadist
formacion estadist
instituto estadist
informacion demograf
estadisticas demograf
monitoreo odm
seguimiento odm
evaluacion odm
publicacion dat
encuesta nacional
programa encuest
agencia estadist
catalogo encuest
afristat
ckan
monitoreo erp
revolucion dat
cuestionario ep
encuesta pobl
estadisticas nacional
estadisticas gobiern
ley estadist
legislacion estadist
datos desgl
estudios estadist
registro negoci
diseño encuest
compilacion dat
sistema encuest
estadist
programa estadist
estadistico minim
datos estadist
entrada dat
operacion estadist
diseño cuestionari
cuestionario diseñ
encuesta estadist
cuestionario estadist
plan muestre
encuesta agricol
indicadores multipl
encuesta agrup
encuestas empresarial
encuesta salud
consorcio estadist
estadisticas regional
intercambio metadat
medicion ind
metodologia estadist
metodologia evalu
metodologia encuest
cens
datos mejor
mejora dat
mejora estadist
estadisticas mejor
estadisticas gener
indicador desagreg
estadisticas desgl
encuesta regional
datos nacional
contabilidad nacional
disponibilidad dat
datos dispon
estadisticas dispon
disponibilidad estadist
datos desarroll
desarrollo dat

32 • PRESS 2017 | Partner Report on Support to Statistics
French
enregistrement naiss
statistiques état
enregistrement état
enregistrement faits
statistiques vital
état civil
enregistrement déces
crv
données administr
portail don
devinfo
archive don
données arch
diffusion don
diffusion statist
microdon
métadon
gestion don
documentation don
données enquêt
enquête ménag
statistiques qual
enquête qual
qualité enquêt
données qual
qualité don
données acces
données ouvert
produire don
données utilis
utilisateur don
données product
producteur don
sensibilisation don
production don
production statist
modèle statist
statistique général
collecte don
traitement don
accès don
harmonisation statist
harmonisation enquêt
harmonisation don
système statist
snd
développement statist
statistiques développ
indicateur omd
normes statist
normes don
capacités statist
curation don
national statist
bureau statist
formation statist
enquête agricol
institut statist
statistiques démograph
données démograph
suivi omd
omd surveil
données rejet
enquête national
programme enquêt
agence de statist
catalogue enquêt
afristat
ckan
suivi dsrp
révolution don
enquête forc
rgph
statist pay
gouv statist
loi statist
don ventil
ventil sex
étud statist
désagreg sex
méthodes collect
enregistrement entrepris
examen don
conception enquêt
compilation don
système enquêt
matière collect
statisticien
programme statist
statistique minimum
don statist
saisie don
opération statist
rédaction questionnair
plans sondag
enquête statist
indicateurs multipl
méthodologie enquêt
enquêtes conjoncturel
enquête sant
indice harmonis
partenariat statist
statistiques régional
statistiques national
échange metadon
évaluation omd
mesurer ind
recueillir don
méthodologie statist
méthodologie évalu
méthodologie enquêt
recens
amélioration don
données amélior
amélioration statist
statistiques amélior
statistiques sex
indicateur désagreg
statistiques ventil
enquête régional
données national
comptes national
disponibilité don
disponibilité statist
développement don
données développ

PRESS 2017 | Partner Report on Support to Statistics • 33
Table 5. List of sector codes used to identify statistics components in CRS project descriptions
CRS Sector Code CRS Sector
11110
11330
11430
12110
12240
13010
15110
15111
15130
15153
16010
16020
16050
22040
23010
25010
31110
31164
43010
43082
74010
EDUCATION
Education policy and administrative management
Vocational training
Advanced technical and managerial training
HEALTH
Health policy and administrative management
Basic nutrition
POPULATION POLICIES/PROGRAMMES AND REPRODUCTIVE HEALTH
Population policy and administrative management
GOVERNMENT AND CIVIL SOCIETY
Public sector policy and administrative management
Public finance management
Legal and judicial development
Media and free flow of information
OTHER SOCIAL INFRASTRUCTURE AND SERVICES
Social/ welfare services
Employment policy and administrative management
Multisector aid for basic social services
COMMUNICATION
Information and communication technology (ICT)
ENERGY GENERATION AND SUPPLY
Energy policy and administrative management
BUSINESS AND OTHER SERVICES
Business support services and institutions
AGRICULTURE
Agricultural policy and administrative management
Agrarian reform
MULTISECTOR/CROSS-CUTTING
Multisector aid
Research/scientific institutions
HUMANITARIAN AID
Disaster prevention and preparedness

www.PARIS21.org@contactPARIS21