partner country series building energy use in … · partner country series building energy use in...
TRANSCRIPT
PARTNER COUNTRY SERIES
Building EnergyUse in China
Transforming Construction and Influencing Consumption to 2050
Secure Sustainable Together
PARTNER COUNTRY SERIES
Secure Sustainable Together
Building EnergyUse in China
Transforming Construction and Influencing Consumption to 2050
Secure Sustainable Together

INTERNATIONAL ENERGY AGENCY
The International Energy Agency (IEA), an autonomous agency, was established in November 1974. Its primary mandate was – and is – two-fold: to promote energy security amongst its member
countries through collective response to physical disruptions in oil supply, and provide authoritative research and analysis on ways to ensure reliable, affordable and clean energy for its 29 member countries and beyond. The IEA carries out a comprehensive programme of energy co-operation among its member countries, each of which is obliged to hold oil stocks equivalent to 90 days of its net imports. The Agency’s aims include the following objectives:
n Secure member countries’ access to reliable and ample supplies of all forms of energy; in particular, through maintaining effective emergency response capabilities in case of oil supply disruptions.
n Promote sustainable energy policies that spur economic growth and environmental protection in a global context – particularly in terms of reducing greenhouse-gas emissions that contribute to climate change.
n Improve transparency of international markets through collection and analysis of energy data.
n Support global collaboration on energy technology to secure future energy supplies and mitigate their environmental impact, including through improved energy
efficiency and development and deployment of low-carbon technologies.
n Find solutions to global energy challenges through engagement and dialogue with non-member countries, industry, international
organisations and other stakeholders.IEA member countries:
Australia Austria
Belgium Canada
Czech RepublicDenmark
EstoniaFinland
FranceGermany
GreeceHungary
Ireland Italy
JapanKoreaLuxembourgNetherlandsNew Zealand NorwayPolandPortugalSlovak RepublicSpainSweden
SwitzerlandTurkey
United KingdomUnited States
The European Commission also participates in
the work of the IEA.
© OECD/IEA, 2015International Energy Agency
9 rue de la Fédération 75739 Paris Cedex 15, France
www.iea.org
Please note that this publication is subject to specific restrictions that limit its use and distribution.
The terms and conditions are available online at www.iea.org/t&c/
The Tsinghua University Building Energy Research Center
The Tsinghua University Building Energy Research Center (BERC) was created in 2005. The
mission of BERC is devoted to the development of energy-efficient and environmentally
responsible buildings in China in accordance with national and international energy and
environmental targets, including buildings research and innovation.
The principal research activities within BERC include:
Assessment of the current buildings status in China and strategic outlooks on buildings
energy consumption and efficiency.
Occupant behaviour and buildings simulation research.
Research and development (R&D) of innovative high-efficiency buildings technology
and systems.
Energy efficiency application research on sub-sectors, including: space heating in
Northern China; rural residential buildings and urban residential buildings; and public
and commercial buildings.
BERC is involved in international exchange and co-operation projects, including its on-
going collaboration with the International Energy Agency. BERC is also responsible for the
Annual Report on China Building Energy Efficiency, which has been published annually
since 2007. BERC’s research for this report was supported by the 12th Five-Year National
Key Technology R&D Program of China (Grant No. 2012 BAJ12B01).

Buildings Energy Use in China © OECD/IEA 2015 Transforming Construction and Influencing Consumption to 2050
Page | 4
Table of Contents Acknowledgements ................................................................................................................... 7
Executive summary ................................................................................................................... 8
Introduction ............................................................................................................................ 10
China’s buildings sector ........................................................................................................... 15
Final energy data for China’s buildings sector (IEA) ................................................................ 15 Primary energy data for China’s buildings sector (TU) ............................................................ 17 Economic, population and energy trends ............................................................................... 28 Global buildings energy consumption and comparisons ........................................................ 31
Buildings sector drivers ........................................................................................................... 35
Estimating drivers for residential energy demand .................................................................. 36 Climatic conditions .................................................................................................................. 37 Consumer behaviour and lifestyles ......................................................................................... 38 Appliances and lighting ............................................................................................................ 40
Buildings energy perspectives for China ................................................................................... 42
ETP energy consumption and savings forecasts ...................................................................... 42 CO2 emissions reduction potential in China ............................................................................ 45
Buildings policies and technologies ......................................................................................... 46
Current energy and development policies in China ................................................................ 46 Current buildings sector policies ............................................................................................. 47 Recommended policies and technologies for China ............................................................... 52
Recommendations and conclusion .......................................................................................... 70
Policy recommendations ......................................................................................................... 70 Technology recommendations ................................................................................................ 72 Conclusions .............................................................................................................................. 73
Annex A. Energy balance analysis and future ........................................................................... 75
Annex B. Analytical framework ............................................................................................... 78
Annex C. Detailed energy performance metrics ....................................................................... 83
Annex D. Heat pump technology ............................................................................................. 87
Acronyms, abbreviations and units of measure ....................................................................... 90
Definitions............................................................................................................................... 92
References .............................................................................................................................. 93
© OECD/IEA 2015 Buildings Energy Use in China Transforming Construction and Influencing Consumption to 2050
Page | 5
List of figures
Figure 1 • Buildings final energy consumption forecasts for major regions and countries, 2012-50 ....................................................................................................................... 11
Figure 2 • Additional buildings floor area forecasts for major regions and countries, 2012–50 ... 13 Figure 3 • Buildings sector final energy and biofuels consumption in China by end-use, 2012 .... 16 Figure 4 • Buildings sector final energy by fuel type and power generation mix in China, 2012 ..... 16 Figure 5 • China buildings sector carbon emissions (direct and indirect), 2000-12 ................... 17 Figure 6 • Primary energy and biofuels consumption by end-use, 2012 (TU) ............................ 18 Figure 7 • Primary energy use by buildings sub-sector, excluding biofuels and solar,
2000-12 (TU) ............................................................................................................... 19 Figure 8 • NUH heated floor area by equipment share, 2000-12 (TU) ....................................... 22 Figure 9 • Primary energy use and intensity for district heating in NUH, 2000-12 (TU) ............. 23 Figure 10 • CPB primary energy use and intensity, excluding NUH, 2000-12 (TU) ....................... 24 Figure 11 • Urban residential primary energy use and intensity, excluding NUH, 2000-12 (TU) .... 25 Figure 12 • Rural residential primary energy use and intensity, 2000-12 (TU) ............................. 27 Figure 13 • Urbanisation and GDP per capita growth and forecasts in China .............................. 29 Figure 14 • Economic, population and energy trends for several major economies, 2000-12 .... 30 Figure 15 • Buildings sector final energy by fuel type for OECD countries and non-members,
2012 ............................................................................................................................ 32 Figure 16 • Buildings sector final energy consumption across major regions, 2012 .................... 32 Figure 17 • Buildings energy and emissions metrics for selected countries, 2012 ....................... 33 Figure 18 • Estimates for growth in residential floor area in China to 2050 ................................ 37 Figure 19 • China climate zones for energy consumption and policy ........................................... 38 Figure 20 • Intensity of electricity consumption for space cooling for different households ...... 39 Figure 21 • Annual cooling electricity consumption by system type across China ....................... 40 Figure 22 • Urban and rural appliance and electronics ownership levels, 2000 and 2012 ........... 41 Figure 23 • Energy consumption scenarios in the Chinese buildings sector by energy source .... 43 Figure 24 • Energy consumption scenarios in the Chinese buildings sector by end-use .............. 43 Figure 25 • Energy savings in the Chinese buildings sector to 2050, 6DS to 2DS ......................... 44 Figure 26 • Emissions reduction in the Chinese buildings sector, 6DS to 2DS .............................. 45 Figure 27 • Progression of building construction from old stock to future technology ............... 53 Figure 28 • Demonstration of low-energy high-rise residential and commercial buildings ......... 54 Figure 29 • Building energy code insulation U-values by country and climate zone indexed
to HDD ........................................................................................................................ 59 Figure 30 • Comparison of building energy code requirements and existing air leakage rates ... 60 Figure 31 • Examples of energy performance labels in China....................................................... 62 Figure B1 • Structure of the ETP buildings model ......................................................................... 78 Figure B2 • Average household occupancy levels relative to GDP per capita .............................. 80 Figure B3 • Example floor area per capita growth rates in China to 2050 .................................... 81 Figure C1 • Buildings final energy per capita across countries (total and percentage change) .... 84 Figure C2 • Residential final energy per household across countries (total and percentage
change) ....................................................................................................................... 85 Figure C3 • Services final energy unit floor area across countries (total and percentage
change) ....................................................................................................................... 86
Buildings Energy Use in China © OECD/IEA 2015 Transforming Construction and Influencing Consumption to 2050
Page | 6
List of tables
Table 1 • Primary energy consumption indicators in China’s buildings sub-sectors, 2012 (TU) .. 19 Table 2 • Drivers and forecasts for energy consumption in China’s buildings sector to 2050 .. 30 Table 3 • The main targets of energy conservation in the 12th Five-Year Plan on Buildings .... 48 Table 4 • Examples of EUIs in the new energy consumption standard ..................................... 50 Table 5 • Shanghai’s tiered energy price tariff .......................................................................... 51 Table 6 • Recommended heat pump technology and application areas for priority ................ 63 Table 7 • Priority policy and technology recommendations by sub-sector ............................... 70 Table 8 • Policy recommendations and actions for consideration ............................................ 71 Table 9 • Technology recommendations and actions for consideration ................................... 73 Table A1 • China buildings sector energy balances comparison, PJ ............................................ 76
List of boxes
Box 1 • IEA Energy Technology Perspectives scenarios to 2050 ..................................................... 10 Box 2 • Moving towards optimised advanced district heating with efficient building envelopes .... 21 Box 3 • Space heating in the Yangtze River Basin ........................................................................... 26 Box 4 • Solutions for the rural residential transition from biofuels ............................................... 28 Box 5 • China’s Green Building Action Plan .................................................................................... 49 Box 6 • Monitoring, verification and enforcement of building codes and standards .................... 55

© OECD/IEA 2015 Buildings Energy Use in China Transforming Construction and Influencing Consumption to 2050
Page | 7
Acknowledgements This publication was prepared jointly by the International Energy Agency (IEA) Directorate of Sustainable Energy Policy and Technology (SPT) and the Tsinghua University (TU) Building Energy Research Center. The lead authors were Marc LaFrance (IEA, lead) and Professor Yi Jiang (TU, lead), Professor Da Yan (TU, co-lead), John Dulac (IEA, lead analyst), Siyue Guo (TU), Shan Hu (TU) and Chen Peng (formerly TU, currently the Center of Science and Technology of Construction, China Ministry of Housing and Urban-Rural Development [MOHURD]).
Data presented in this report come from two key sources: IEA final energy consumption (on-site energy) is taken from Energy Technology Perspectives 2015: Mobilising Innovation to Accelerate Climate Action (IEA, 2015a); and primary energy (including all fuel sources for electricity and commercial heat attributed to the buildings sector) is taken from the TU China Building Energy Model.1
Philippe Benoit, Acting Director of SPT, Jean-François Gagné, Head of the Energy Technology Policy Division, and Cecilia Tam, former Head of the Energy Demand Technology Unit, provided project guidance. David Benazeraf (IEA), Brian Dean (IEA), Yang Liu (IEA), Eric Masanet (IEA), Roberta Quadrelli (IEA), Ming Shan (TU), Melanie Slade (IEA), Xudong Yang (TU), and Jianjun Xia (TU) provided peer review and contributed to the report. Astrid Dumond, Angela Gosmann and Therese Walsh supported report production. The report was edited by Justin French-Brooks.
Special thanks go to reviewers and contributors:
Alexander Ablaza (Sustainable Infrastructure Finance and Investments), Renilde Becqué (Consultant), Cliff Elwell (University College London Energy Institute), Meredydd Evans (PNNL), Pierre Gallant (Morrison Hershfield, Canada), Virginia Gori (University College London Energy Institute), Adam Hinge (Sustainable Energy Partnerships), Tianzhen Hong (LBNL), Joseph Huang (International Copper Association, China), Daniel Huff (Consultant), Patrick Hughes (ORNL), Prashant Kapoor (International Finance Corp, World Bank Group), Jayond Li (CLASP), Rick McCurdy (McCurdy & Associates, LLC), Julie McDonnell (Peking University Graduate), Bill Noel (Deloitte Consulting LLP), Yamina Saheb (EU Joint Research Centre), Sophie Shnapp (Consultant), Cecilia Tam (APERC), Ingo Wagner (Euroheat and Power), Peter Winters (European Solar Shading Organization), Hongwei Yang (ERI NDRC), Xiu Yang (NCSC, NDRC), Sha Yu (PNNL), Jianguo Zhang (ERI NDRC), Nan Zhou (LBNL), and Xianli Zhu (Copenhagen Centre on Energy Efficiency).
1 Further data and details are available in the 2014 Annual Report on China Building Energy Efficiency (TU, 2014).

Buildings Energy Use in China © OECD/IEA 2015 Transforming Construction and Influencing Consumption to 2050
Page | 8
Executive summary The global buildings sector accounts for nearly one-third of world final energy consumption, and almost one-third of global carbon dioxide (CO2) emissions associated with the energy sector when upstream emissions from power generation are considered. Despite significant policy efforts in recent years to improve energy efficiency in buildings, buildings energy use has still risen by nearly 20% since 2000. Without concerted effort to limit future growth, global buildings energy demand could increase by an additional 50% over 2012 levels by 2050 under a business-as-usual scenario.
The People’s Republic of China (hereafter “China”) is an increasingly significant actor and energy consumer in the buildings sector. China is the largest energy-consuming economy in the world, and buildings energy use in China is the second-largest in the world after the United States, representing nearly 16% of total final energy consumption in buildings globally in 2012 (or more than 18 exajoules [EJ]). Between 2000 and 2012, final energy consumption in Chinese buildings grew by 37%, and if this trend continues, it could increase by an additional 70% from 2012 to 2050.
This report was prepared jointly by the International Energy Agency (IEA) and the Tsinghua University Building Energy Research Center (TU BERC) to provide significant detail on energy consumption in the buildings sector in China, with global perspectives for reference. While China’s energy consumption per capita is still low by global standards, the total impact of energy use and emissions in the buildings sector – on the Chinese economy, on local air quality and health, and on the overall well-being of China’s population – is nevertheless significant and China would benefit from pursuing a more sustainable pathway.
China is in a unique position, with expectation of strong, sustained growth in wealth and unprecedented rates of construction, and a government that has a proven track record of implementing energy policy measures. The possibility of China achieving a much lower energy footprint in the buildings sector is therefore strong. While China has pursued assertive public policy decisions in recent years, it is essential to elevate energy efficiency in the buildings sector as a priority for action so that policy development and implementation can be achieved quickly.
China has already initiated many of the recommendations offered in this report. Implementation and evaluation of the pending energy consumption standard have the potential to influence energy policy globally. However, further action is needed to pursue key policies and technological developments before the anticipated growth in China’s building stock takes place. There is a small window of opportunity for action, given the large expected growth in the coming two decades, and in some cases policy could take significant time to implement.
© OECD/IEA 2015 Buildings Energy Use in China Transforming Construction and Influencing Consumption to 2050
Page | 9
Key findings in the report are as follows:
• It is expected that China will continue to see robust levels of construction over the next decade or two, and implementation of policies to improve the efficiency of buildings throughout the country as rapidly as possible is important to avoid the “lock-in effect”.2
• Building codes need to be strengthened and properly implemented, especially in areas beyond the large well-known cities.
• Greater effort is needed to further disaggregate energy consumption in the Chinese buildings sector within its four key sub-sectors (generally related to building type, urbanisation and energy service).
• Continued progress in and evaluation of minimum efficiency performance standards for building equipment should remain a high priority for the foreseeable future.
• Research and development of advanced components (such as heat pumps) and system-based solutions (such as deep energy renovation and zero-energy buildings) continue to be important areas for consideration.
• Adding value through more efficient buildings could lead to greater economic productivity, jobs and prosperity, along with lower growth in energy consumption.
This publication is intended to provide policy makers with improved data and knowledge so that more robust policies can be considered for the buildings sector. As buildings sector investment and economic prosperity are closely linked, if implemented correctly, the transition towards more efficient, sustainable buildings can lead to continued economic growth while reducing total energy consumption and CO2 emissions at the same time.
2 New buildings will be in-service a long time before refurbishment is required and energy renovation can be costly.
Buildings Energy Use in China © OECD/IEA 2015 Transforming Construction and Influencing Consumption to 2050
Page | 10
Introduction The global buildings3 sector accounts for nearly one-third of world final energy consumption, and almost one-third of global carbon dioxide (CO2) emissions associated with the energy sector when upstream emissions from power generation are considered. Despite significant policy efforts in recent years to improve energy efficiency in buildings, buildings energy use has still risen by nearly 20% since 2000. Without concerted effort to limit future growth, global buildings energy demand could increase by an additional 50% over 2012 levels by 2050 under a business-as-usual scenario (Box 1) (IEA, 2015a).
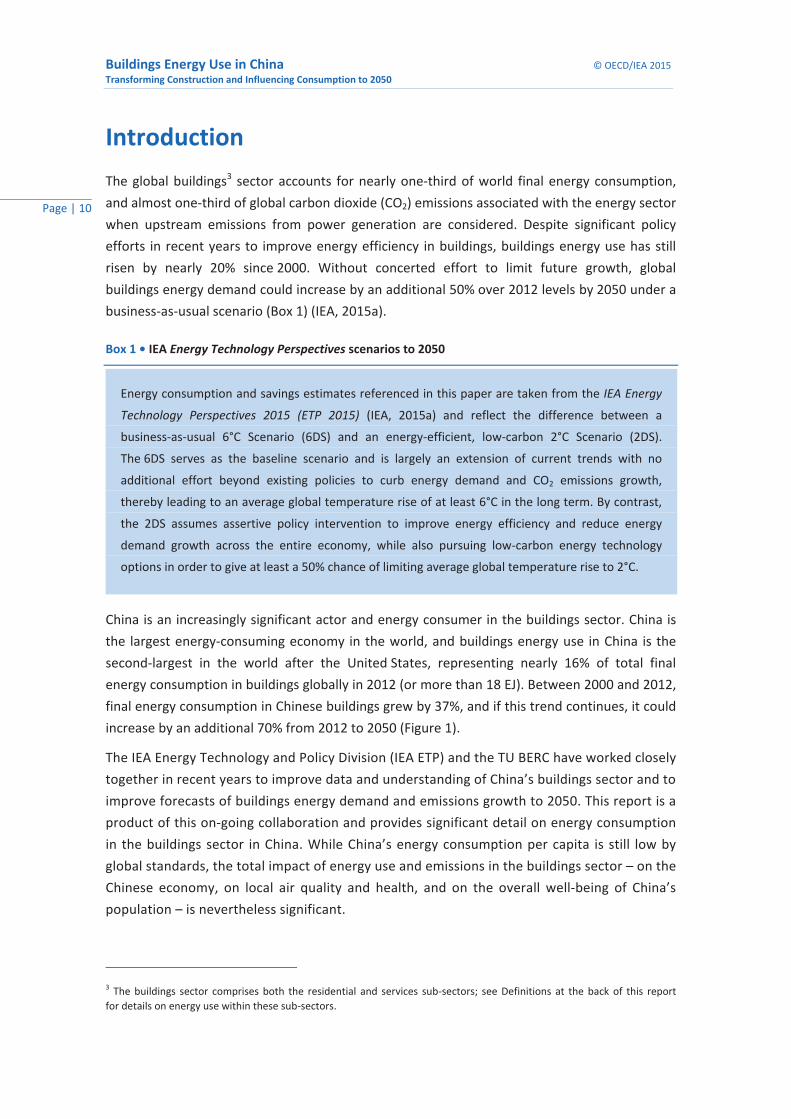
Box 1 • IEA Energy Technology Perspectives scenarios to 2050
China is an increasingly significant actor and energy consumer in the buildings sector. China is the largest energy-consuming economy in the world, and buildings energy use in China is the second-largest in the world after the United States, representing nearly 16% of total final energy consumption in buildings globally in 2012 (or more than 18 EJ). Between 2000 and 2012, final energy consumption in Chinese buildings grew by 37%, and if this trend continues, it could increase by an additional 70% from 2012 to 2050 (Figure 1).
The IEA Energy Technology and Policy Division (IEA ETP) and the TU BERC have worked closely together in recent years to improve data and understanding of China’s buildings sector and to improve forecasts of buildings energy demand and emissions growth to 2050. This report is a product of this on-going collaboration and provides significant detail on energy consumption in the buildings sector in China. While China’s energy consumption per capita is still low by global standards, the total impact of energy use and emissions in the buildings sector – on the Chinese economy, on local air quality and health, and on the overall well-being of China’s population – is nevertheless significant.
3 The buildings sector comprises both the residential and services sub-sectors; see Definitions at the back of this report for details on energy use within these sub-sectors.
Energy consumption and savings estimates referenced in this paper are taken from the IEA Energy
Technology Perspectives 2015 (ETP 2015) (IEA, 2015a) and reflect the difference between a
business-as-usual 6°C Scenario (6DS) and an energy-efficient, low-carbon 2°C Scenario (2DS).
The 6DS serves as the baseline scenario and is largely an extension of current trends with no
additional effort beyond existing policies to curb energy demand and CO2 emissions growth,
thereby leading to an average global temperature rise of at least 6°C in the long term. By contrast,
the 2DS assumes assertive policy intervention to improve energy efficiency and reduce energy
demand growth across the entire economy, while also pursuing low-carbon energy technology
options in order to give at least a 50% chance of limiting average global temperature rise to 2°C.
© OECD/IEA 2015 Buildings Energy Use in China Transforming Construction and Influencing Consumption to 2050
Page | 11
China has been working in recent years to reduce rapidly growing energy demand in its buildings sector, but concerns remain that effective implementation may be limited as the economy and gross domestic product (GDP) per capita in particular continue to grow at a rapid pace. This report is intended to provide a view into the current status of energy consumption and trends in the Chinese buildings sector in order to help focus priorities for the development of buildings policies within China. It also includes perspectives from a global context, alongside certain unique circumstances that may only exist in China.
The recommendations presented in this report have been prepared in collaboration with TU BERC, and are consistent with the global recommendations outlined in the IEA Transition to Sustainable Buildings: Strategies and Opportunities to 2050 (IEA, 2013c). This report provides details on how to enable ambitious policy action in China, including recommendations for near-term action, such as expanding more stringent building energy codes to all regions of China, as well as suggestions on research and development (R&D) activities that can put the Chinese buildings sector on a 2DS pathway (e.g. investigating the potential for solar thermal and heat pump water heater combination units in urban high-rise residential buildings).
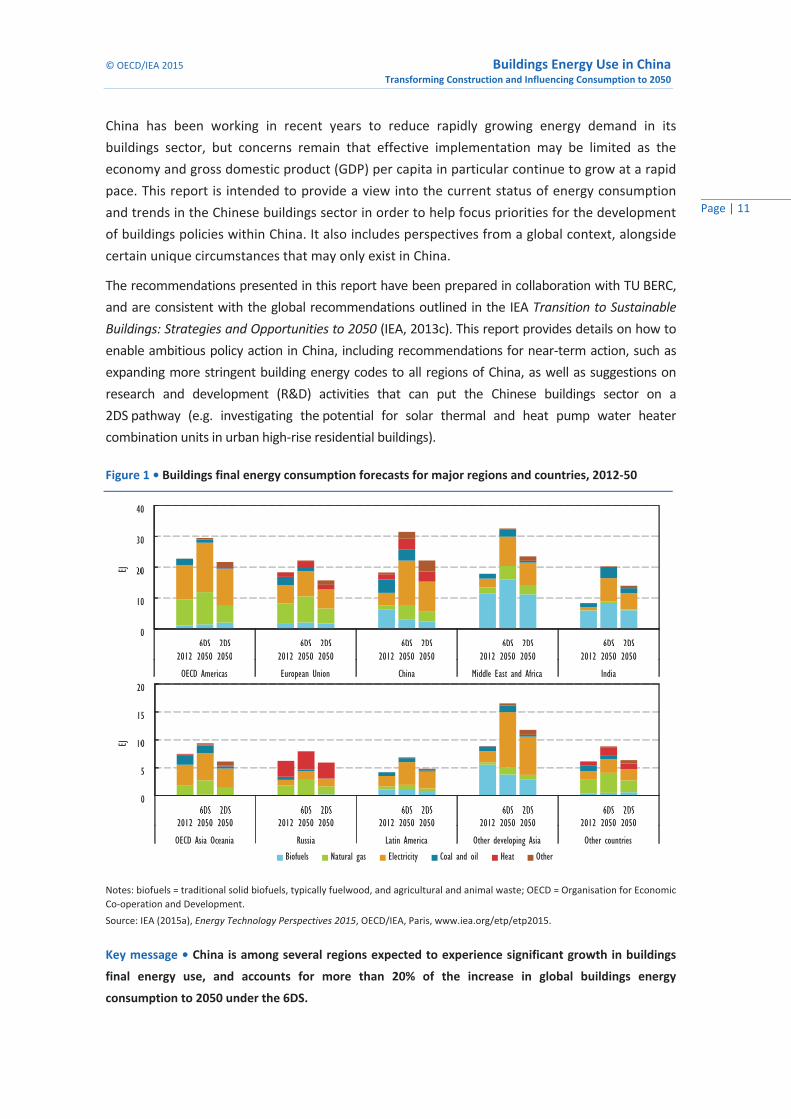
Figure 1 • Buildings final energy consumption forecasts for major regions and countries, 2012-50
Notes: biofuels = traditional solid biofuels, typically fuelwood, and agricultural and animal waste; OECD = Organisation for Economic Co-operation and Development. Source: IEA (2015a), Energy Technology Perspectives 2015, OECD/IEA, Paris, www.iea.org/etp/etp2015.
Key message • China is among several regions expected to experience significant growth in buildings
final energy use, and accounts for more than 20% of the increase in global buildings energy
consumption to 2050 under the 6DS.
0
10
20
30
40
2012 6DS 2050
2DS 2050 2012
6DS 2050
2DS 2050 2012
6DS 2050
2DS 2050 2012
6DS 2050
2DS 2050 2012
6DS 2050
2DS 2050
OECD Americas European Union China Middle East and Africa India
EJ
0
5
10
15
20
2012 6DS 2050
2DS 2050 2012
6DS 2050
2DS 2050 2012
6DS 2050
2DS 2050 2012
6DS 2050
2DS 2050 2012
6DS 2050
2DS 2050
OECD Asia Oceania Russia Latin America Other developing Asia Other countries
EJ
Biofuels Natural gas Electricity Coal and oil Heat Other

Buildings Energy Use in China © OECD/IEA 2015 Transforming Construction and Influencing Consumption to 2050
Page | 12
Energy statistics and trends
Two different sources of energy data are presented in this report, comprising buildings final energy consumption from the IEA ETP 2015 (IEA, 2015a) and buildings primary energy consumption taken from the TU China Building Energy Model (CBEM). CBEM buildings energy data include an allocation of primary energy consumed in the production of electricity and commercial heat for the buildings sector and its subsequent sub-sectors and end-uses. While both data sources are similar, they reflect different perspectives to evaluating China’s buildings sector. Both representations have been presented in this report to illustrate the importance of electricity and commercial heat generation in the buildings sector. The following section on China’s energy balance describes data differences and on-going work by the IEA and TU to improve energy statistics and buildings sector data.4
Unless specifically noted, data for residential and services (commercial and public) buildings in this report are taken from the IEA energy balance. Data in the report also refer to final energy consumption (the energy that is consumed on-site, including final electricity and district heating but excluding primary energy, such as fuel burned in power generation or district heat generation) unless otherwise indicated as primary energy data from TU.
Final energy consumption in China’s buildings sector has increased continuously throughout the last 20 years, driven by the country’s large population, its rapid economic growth and increasing demand for energy services. Both the Chinese government and industry are working hard to slow this increasing demand for energy in buildings. Trends in data suggest that China is likely to surpass the United States as the single largest buildings energy consumer in the world.5 While current buildings energy consumption in China on a per household or per capita basis is still relatively low compared to more developed economies, demand for larger housing units with fewer inhabitants and increased energy services is narrowing this gap. Over the past 15 years, China’s average residential floor area per person (including urban and rural residential) has already increased from less than 20 m2 per person to nearly 32 m2 per person in 2012 (TU, 2014). The average residential floor area per person in rural areas is about 37 m2 per person, while in urban areas it is closer to 26 m2. However, with increasing wealth and greater demand for space, the gap is narrowing. In the coming years, it is expected that the total buildings floor area in China (including the services sub-sector) will continue to grow at a rapid pace, second only to India in terms of space added between 2012 and 2050 (Figure 2).
4 Further information on energy data, sources and methodologies can be found in Annex A of this report. 5 Energy data are as of 2012, so China may have surpassed the United States in 2014.
© OECD/IEA 2015 Buildings Energy Use in China Transforming Construction and Influencing Consumption to 2050
Page | 13
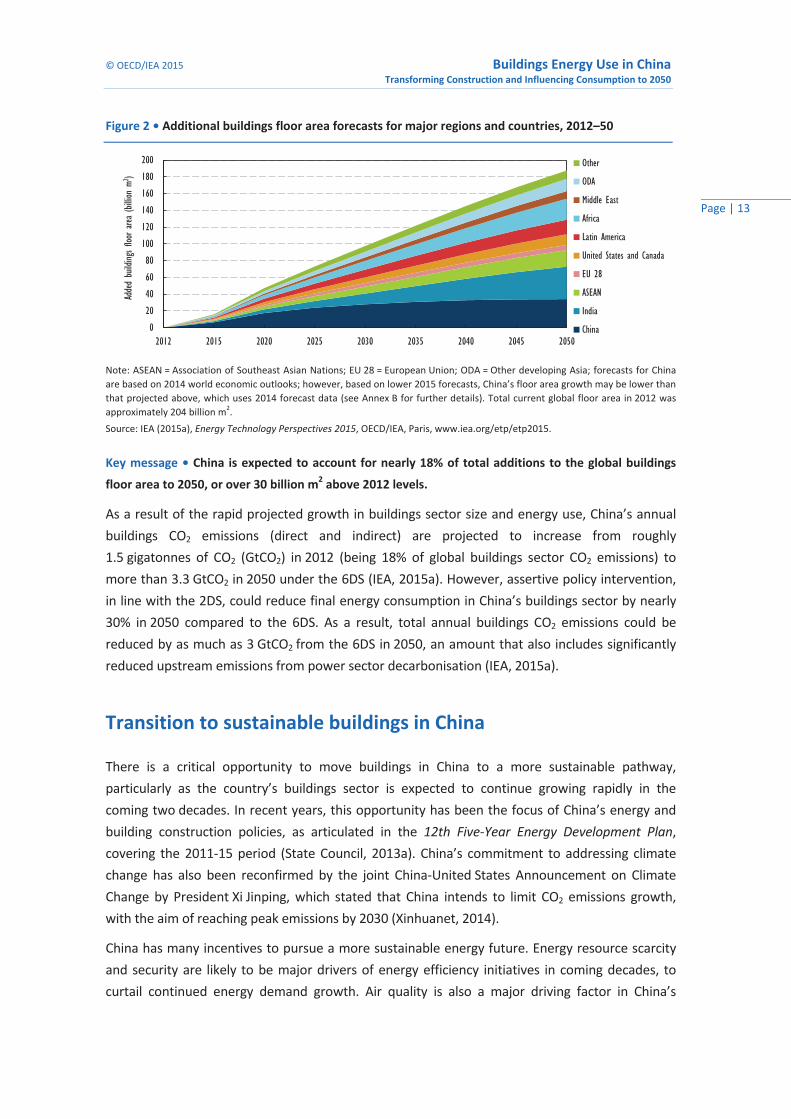
Figure 2 • Additional buildings floor area forecasts for major regions and countries, 2012–50
Note: ASEAN = Association of Southeast Asian Nations; EU 28 = European Union; ODA = Other developing Asia; forecasts for China are based on 2014 world economic outlooks; however, based on lower 2015 forecasts, China’s floor area growth may be lower than that projected above, which uses 2014 forecast data (see Annex B for further details). Total current global floor area in 2012 was approximately 204 billion m2. Source: IEA (2015a), Energy Technology Perspectives 2015, OECD/IEA, Paris, www.iea.org/etp/etp2015.
Key message • China is expected to account for nearly 18% of total additions to the global buildings
floor area to 2050, or over 30 billion m2 above 2012 levels.
As a result of the rapid projected growth in buildings sector size and energy use, China’s annual buildings CO2 emissions (direct and indirect) are projected to increase from roughly 1.5 gigatonnes of CO2 (GtCO2) in 2012 (being 18% of global buildings sector CO2 emissions) to more than 3.3 GtCO2 in 2050 under the 6DS (IEA, 2015a). However, assertive policy intervention, in line with the 2DS, could reduce final energy consumption in China’s buildings sector by nearly 30% in 2050 compared to the 6DS. As a result, total annual buildings CO2 emissions could be reduced by as much as 3 GtCO2 from the 6DS in 2050, an amount that also includes significantly reduced upstream emissions from power sector decarbonisation (IEA, 2015a).
Transition to sustainable buildings in China
There is a critical opportunity to move buildings in China to a more sustainable pathway, particularly as the country’s buildings sector is expected to continue growing rapidly in the coming two decades. In recent years, this opportunity has been the focus of China’s energy and building construction policies, as articulated in the 12th Five-Year Energy Development Plan, covering the 2011-15 period (State Council, 2013a). China’s commitment to addressing climate change has also been reconfirmed by the joint China-United States Announcement on Climate Change by President Xi Jinping, which stated that China intends to limit CO2 emissions growth, with the aim of reaching peak emissions by 2030 (Xinhuanet, 2014).
China has many incentives to pursue a more sustainable energy future. Energy resource scarcity and security are likely to be major drivers of energy efficiency initiatives in coming decades, to curtail continued energy demand growth. Air quality is also a major driving factor in China’s
0
20
40
60
80
100
120
140
160
180
200
2012 2015 2020 2025 2030 2035 2040 2045 2050
Added
build
ings flo
or are
a (bi
llion
m2)
Other
ODA
Middle East
Africa
Latin America
United States and Canada
EU 28
ASEAN
India
China
Buildings Energy Use in China © OECD/IEA 2015 Transforming Construction and Influencing Consumption to 2050
Page | 14
increasing commitment to curtailing inefficient and polluting fossil fuel combustion. Government policies to limit CO2 emissions are also a driver. Other constraints, such as high urban densities with limited space for significant additional buildings growth, may also potentially contribute to restrained growth in buildings sector energy demand.
A notable selection of energy demand reduction policies are critical to reducing energy consumption in the Chinese buildings sector. This report intends to help decision makers focus on technologies and policies that can reduce buildings sector energy consumption in China while also meeting China’s socio-economic objectives, including continued economic growth and improved living conditions. There are also a variety of options available to provide cleaner energy supply in China, but these are outside the scope of this report.
The following sections address the key drivers and buildings energy trends that will shape the energy outlook for the buildings sector in China. The report then considers the energy perspectives for China under the 6DS (business-as-usual), and the major energy technology and policy options that can help achieve a low-carbon, energy-efficient buildings sector in China, including high priority areas for the Chinese market. Finally, the report recommends critical next steps and priority technology policy areas for decision makers to move the buildings sector in China to a sustainable 2DS pathway over the coming decades.
© OECD/IEA 2015 Buildings Energy Use in China Transforming Construction and Influencing Consumption to 2050
Page | 15
China’s buildings sector The IEA and the Chinese National Bureau of Statistics (NBS) have a formal agreement to collaborate on energy statistics as a long-term activity that includes all segments of the economy. IEA ETP also works with TU to further disaggregate and improve China’s energy balance data across the various buildings sector end-uses. This collaboration has helped improve data collection and accuracy in IEA-TU buildings modelling and analysis activities, and is expected to inform the formal energy statistics reporting process to the IEA, as well as secure access to higher quality data sources (see Annex A for further details). Significant opportunities remain to address data gaps, to reduce variability in data quality, and to improve consistencies between approaches to energy reporting and end-use disaggregation.
The following sections present 1) final energy drawn from IEA data, and 2) primary energy data and analysis for the buildings sector in China drawn from TU sources. Further research is needed to improve the coverage and quality of data and to fully disaggregate the buildings sub-sectors in China across all end-uses and fuel types, although current data and analysis still show key trends that can help influence policy recommendations.6
Final energy data for China’s buildings sector (IEA)
Energy use in China's buildings sector is dominated by the residential sub-sector, whose final energy consumption increased by nearly 30% between 2000 and 2012, reaching more than 15 EJ. The residential sub-sector represents roughly 85% of total buildings sector final energy consumption in China (including estimated biofuels use), with the remainder consumed in the services sub-sector (commercial and public buildings [3 EJ]). Energy consumption in services buildings more than doubled between 2000 and 2012.
The latest IEA estimates7 of final energy consumption (excluding biofuels) by end-use show space and water heating to represent 52% of total buildings final energy use (almost 6.2 EJ), with cooking representing another 14%, and lighting, space cooling, appliances and other electronic equipment representing an additional 30% (Figure 3). Biofuels are the largest energy source in China’s buildings sector (Figure 4), accounting for 35% of the total in 2012 (or roughly 6.4 EJ). Key differences exist between IEA and TU estimates of total final consumption of biofuels, and the two groups are working together to reconcile these differences and improve understanding of biofuel use in China.8
6 The IEA and TU, along with other partners, continue to work on improving this data analysis and disaggregation. 7 The IEA works to disaggregate building sub-sectors into detailed end-uses and fuel shares. The subsequent section on TU’s primary energy data highlights differences across the buildings sub-sectors when primary energy is taken into account, an issue that is particularly important for space heating in urban Northern China. 8 For details about buildings final energy consumption, see Annex A. The apportionment of end-uses, especially for biofuels, is expected to change in the future as further work is done in this area between the IEA and TU.

Buildings Energy Use in China © OECD/IEA 2015 Transforming Construction and Influencing Consumption to 2050
Page | 16
Figure 3 • Buildings sector final energy and biofuels consumption in China by end-use, 2012
Note: primary energy consumption is shown in Figure 6 below. Source: IEA (2015a), Energy Technology Perspectives 2015, OECD/IEA, Paris, www.iea.org/etp/etp2015.
Key message • Space heating and water heating account for more than half of total final energy
consumption in buildings (excluding biofuels). It is estimated that nearly 60% of biofuels used in
buildings are used for cooking purposes.
Figure 4 • Buildings sector final energy by fuel type and power generation mix in China, 2012
Oil (LPG)10%
Electricity22%
Heat9%
Coal14%
Natural gas7%
Biomass35%
Other3%
Buildings sector final energy consumption, 18.3 EJ Power generation (heat and electricity) energy mix
Other, 3%
Nuclear, 2%
Natural gas, 2%
Hydro, 6%
Coal, 87%
Source: IEA (2015a), Energy Technology Perspectives 2015, OECD/IEA, Paris, www.iea.org/etp/etp2015.
Key message • Biofuels account for 35% of total final energy use in China’s buildings sector. Primary
energy use for electricity and heat production (not included in the buildings final energy use shown
above) is dominated by coal power generation in China.
Use of biofuels in China is assumed mainly to comprise traditional sources (e.g. fuelwood, agricultural waste, etc. used on open fires), especially in rural households. As the income of rural households increases, they typically purchase commercial energy (e.g. coal and liquefied petroleum gas [LPG]) as a replacement for biofuels. From an energy policy perspective, transition from biofuels is often considered a low priority, other than to increase sustainable use of biomass. However, as the use of biofuels in China disproportionately affects the health and well-being of women and children due to pollution and poor indoor air quality, it does merit additional attention and study.
Space heating32%
Water heating20%
Cooking14%
Lighting, space cooling and appliances
30%
Other4%
Energy by end-use (without biomass), 11.9 EJ
Space heating26%
Water heating15%
Cooking59%
Estimated biomass use by end-use, 6.4 EJ

© OECD/IEA 2015 Buildings Energy Use in China Transforming Construction and Influencing Consumption to 2050
Page | 17
Direct fossil fuel consumption (excluding fossil fuels used for power and commercial heat generation) accounted for 31% of buildings final energy consumption in 2012. Coal consumption, largely used in rural households, accounted for roughly 14% of total final energy use in buildings, while natural gas and oil (mostly LPG) consumption (more typically used in urban buildings) accounted for another 17%. A significant portion of electricity and commercial heat, which accounted for more than 30% of total buildings final energy use in 2012, was produced using fossil fuels, including in particular coal, which accounted for 87% of total electricity and commercial heat production in China that year (Figure 4).
The move from biofuel consumption towards commercial fuels (e.g. coal, LPG and electricity) has significantly affected the carbon footprint of the Chinese buildings sector. Between 2000 and 2012, direct CO2 emissions from fuel combustion in buildings increased by 55%, while indirect emissions9 more than tripled, largely because of coal-fired electricity and commercial heat generation (Figure 5). China now represents more than 18% of total global buildings sector CO2 emissions (direct and indirect), having surpassed the European Union in 2011 to become second to the United States (23% in 2012).
Figure 5 • China buildings sector CO2 emissions (direct and indirect), 2000-12
Notes: MtCO2 = million tonnes of carbon dioxide; indirect emissions are calculated using total final electricity and heat demand and the average emissions intensity per unit of electricity or heat (in MtCO2 per kilowatt hour [kWh]) generated in the conversion sectors from primary energy to commercial energy. Source: calculations derived from IEA (2014d), “World energy balances”, IEA World Energy Statistics and Balances (database).
Key message • Increasing electricity and commercial heat consumption has led to significant increases
in indirect emissions in China’s buildings sector. China now accounts for more than 18% of total global
direct and indirect CO2 emissions from buildings.
Primary energy data for China’s buildings sector (TU)
Space and water heating account for the largest share of primary energy use in buildings across China, at nearly 45% of total primary energy consumption (including use of commercial fuels
9 Indirect CO2 emissions come from fossil fuel electricity and heat generation that serve the buildings sectors.
0
200
400
600
800
1 000
1 200
1 400
1 600
1 800
2000 2002 2004 2006 2008 2010 2012
MtCO
2
Direct emissions Indirect emissions

Buildings Energy Use in China © OECD/IEA 2015 Transforming Construction and Influencing Consumption to 2050
Page | 18
and biofuels) in 2012 (Figure 6). Biofuels are still primarily used in rural residential buildings, and cooking is the largest end-use, at nearly 60% of total biofuels consumption in 2012. The IEA and TU continue to work together to improve the disaggregation of data on buildings energy use by sub-sector and end-use, including accounting for differences in shares across primary and final energy consumption.
Figure 6 • Primary energy and biofuels consumption by end-use, 2012 (TU)
Source: TU (2014), 2014 Annual Report on China Building Energy Efficiency, Tsinghua University Building Energy Research Center, Beijing.
Key message • Space heating and water heating account for nearly half of primary commercial energy
use, while biofuels are still principally used for cooking purposes in rural China.
Primary energy consumption across the buildings sub-sectors
China reports buildings sector energy consumption in four main sub-sectors, comprising: 1) northern urban heating (NUH), which primarily represents district heating that serves multiple building types (e.g. public, residential and commercial); 2) commercial and public buildings (CPB) excluding NUH (in essence the services sub-sector excluding heating under NUH); 3) urban residential excluding NUH; and 4) rural residential. The four sub-sectors are predominately categorised by core technical and physical differences in energy provision across buildings in China, which also has implications for structural and potential policy influence. While this divisional approach may not be readily clear compared to traditional residential and services disaggregation, the categories are not problematic and can be compared with other traditional energy balance reports if further disaggregation is applied to compare detailed breakdowns of end-use and fuel share.
Since 2000, total primary energy consumption (excluding biofuels and solar energy) in urban residential and CPBs has grown at nearly twice the rate of primary energy growth in rural residential buildings, due largely to rapid urbanisation (Figure 7).10 NUH primary energy
10 Overall primary energy doubled from 2000 to 2012 due to large increases in fuel consumption for electricity and heat. This is much greater than final energy increases, discussed in the previous section.
Space heating37%
Water heating9%
Cooking15%
Lighting13%
Space cooling10%
Appliances and other16%
Primary energy by end-use (without biomass and solar), 20.1 EJ
Space heating26%
Water heating15%
Cooking59%
Estimated biofuels use by end-use, 3.4 EJ

© OECD/IEA 2015 Buildings Energy Use in ChinaTransforming Construction and Influencing Consumption to 2050
Page | 19
consumption increased at a slower pace (roughly 60% between 2000 and 2012), due in part to energy efficiency improvements in district heating and building envelopes. By 2012, the four sub-sectors accounted for comparable shares of total buildings primary energy use (excluding biofuels and solar), although primary energy demand by fuel type (e.g. electricity in CPB and urban residential areas) and energy intensities across the sub-sectors still differ significantly (Table 1).
Figure 7 • Primary energy use by buildings sub-sector, excluding biofuels and solar, 2000-12 (TU)
Note: energy consumption in urban residential and CPB does not include district heating accounted for under NUH. Source: TU (2014), 2014 Annual Report on China Building Energy Efficiency, Tsinghua University Building Energy Research Center, Beijing.
Key message • Primary energy consumption (excluding biofuels and solar) in the four Chinese sub-
sectors was fairly equal in size in 2012, with CPB having grown the most since 2000.
Table 1 • Primary energy consumption indicators in China’s buildings sub-sectors, 2012 (TU)
NUH CPB
(excluding NUH)
Urban residential (excluding
NUH)
Rural residential Total
Population (millions) - - 712 642 1 354
Households (millions) - - 249 165 414
Floor area (billion m2) 10.6* 8.3 18.8 23.8 51.0
Total primary energy (EJ, excluding biofuels and solar) 5.0 5.3 4.8 5.0 20.1
Electricity (billion kWh) 8.2 490.1 378.7 159.4 1 036.4
Biofuels (PJ)** - - - 3.4 3.4
Energy intensity (GJ/m2) 0.47 0.64 0.31*** 0.21*** 0.39
Energy intensity (GJ/household) - - 19.5 30.3 -
* Provided for reference, not part of total floor area value since it represents a portion of CPB and urban residential.** Major differences exist between estimates of total final biofuel energy consumption by the IEA and TU, and the two groups are working together to narrow this gap and improve understanding of biofuel use in China. *** Provided for reference, TU uses GJ/household for urban and rural residential buildings (excluding NUH). Notes: GJ/m2 = gigajoule per square metre; PJ = petajoule. Source: TU (2014), 2014 Annual Report on China Building Energy Efficiency, Tsinghua University Building Energy Research Center, Beijing.
0
1
2
3
4
5
6
2000 2002 2004 2006 2008 2010 2012
EJ
CPB
Rural residential
NUH
Urban residential
Buildings Energy Use in China © OECD/IEA 2015 Transforming Construction and Influencing Consumption to 2050
Page | 20
Northern urban heating The NUH sub-sector represents space heating (primarily the numerous district heating networks in Northern China and some individual building heating systems) provided in urban areas in the cold zones during winter months.11 It covers about 90% of floor area in these urban regions, or approximately 10.6 billion m2 (roughly 22% of total floor area in China), and it represents nearly 45% of total urban floor area. The NUH district heating network is now the world's largest network, and is currently the fastest-growing network in the world (Euroheat and Power, 2013; Euroheat and Power, 2015).
The NUH sub-sector is fuelled predominantly by coal, which accounts for more than 80% of district heat generation in China. Comparing total system performance is difficult, as many network systems include co-generation,12 and attributing efficiency performance to combined heat and electricity generation requires further operational information.13 The IEA has published previous work on this subject (IEA, 2014d), and anticipates providing more detailed analysis of optimised integration of energy-efficient buildings with advanced district heating systems in its forthcoming Energy Technology Perspectives 2016 (ETP 2016) publication (Box 2) (IEA, forthcoming).
The NUH district heating networks in China use several kinds of heat sources and equipment, including large-scale and small-scale co-generation, coal-fired or gas-fired boilers at the regional level or on a community scale, and large-scale heat pumps. NUH heating also includes some centralised14 heating systems at the buildings level and individual heating equipment at the individual household or apartment level, such as gas and coal boilers, small-scale heat pumps and electric heaters. Co-generation (mostly coal-fired) and coal boilers provided heat to nearly 90% of the floor area in NUH buildings in 2012, while gas boilers provided another 8.5% (Figure 8). This is a measurable change since 2000, when 99% of heat was provided by coal boilers and co-generation, while gas boilers accounted for less than 1%. With the promotion of a “coal to gas” switch, a trend to abolish coal boilers has emerged.
11 See later section of this report and Figure 19 on climatic conditions in China’s different climate zones. 12 Co-generation refers to the combined production of heat and power. 13 Further information about the methodologies used by TU to estimate co-generation efficiency can be found in the 2015 Annual Report on China’s Building Energy Efficiency (TU, 2015). 14 In this report, central or centralised heating systems refer to a whole-building system that is usually a large commercial, public or multifamily high-rise building. Individual systems refer to apartment or dwelling units, typically heat pumps or small boilers.
© OECD/IEA 2015 Buildings Energy Use in China Transforming Construction and Influencing Consumption to 2050
Page | 21
Box 2 • Moving towards optimised advanced district heating with efficient building envelopes
Globally, significant effort is needed to reduce energy used for space heating in buildings. Very low-
energy, zero-energy and even positive-energy buildings are feasible, although they are highly likely
to depend on renewable energy resources (e.g. solar thermal and photovoltaic). This poses a
potential challenge in urban areas, where access to on-site renewable energy may be limited by
building surface area, urban densities and extensive building shading.
Advanced district heating (including the use of co-generation) can help to increase the share of
renewable energy for heating in cities, as almost all types of resource and technology can be
connected to modern low-temperature district heating systems. Waste heat recovery can also be
used in advanced district heating systems. As China has numerous potential sources of industrial
waste heat, this field merits further study. Key issues to be evaluated in the utilisation of industrial
waste heat include: the collection and integration of multi-grade heat sources; the implications of
delivery over long distances; and the need to manage variable heating system demand without
causing an impact on the industrial process (TU, 2015). The IEA, TU and other partners plan to
assess the potential for waste heat utilisation in Northern China, including the potential of both
existing and future sources given that industrial heat output may change. Waste heat recovery
could also include use of low-grade heat with heat pump applications, which may offer a significant
energy and carbon abatement opportunity in China.
Advanced district heating systems have been widely demonstrated through the IEA District Heating
and Cooling (DHC) Implementing Agreement, even establishing that solar energy can provide 90%
of heating loads in new developments using modern district energy network design, even in cold
climates (Sibbitt, 2012). These systems use low temperature gradients, which are highly compatible
with the modernisation of older district heating networks concurrent with building renovations. If
properly designed, existing district heating networks can be even expanded to more buildings
without adding further system capacity, while operating temperatures can be lowered, thereby
improving operating efficiencies.
Better integration, optimisation and co-ordination of a wide variety of modern district heating
resources with energy-efficient buildings offers a promising approach to reducing CO2 emissions in
urban areas, and to attaining energy efficiency goals. However, investment in co-generation and
DHC are typically pursued independently of building renovations and investment in energy-efficient
buildings. In some cases, these activities are competing for public policy guidance alongside limited
public funding. Often, solutions proposed for buildings and district energy systems are assessed
independently of each other, and the overall impact at a system level can be negative.
To minimise the necessary investment in energy performance and CO2 emission abatement,
integrated analysis is needed to address the technical, economic, policy and business case for co-
generation, DHC and building energy efficiency solutions. In ETP 2016, the IEA will analyse in detail
the technology and policy options to move more rapidly towards optimised building energy
efficiency with advanced district heating. The IEA will continue its collaboration with TU to support
more effective design of energy policies targeting higher energy efficiency of buildings and
advanced district heating in China.
Buildings Energy Use in China © OECD/IEA 2015 Transforming Construction and Influencing Consumption to 2050
Page | 22
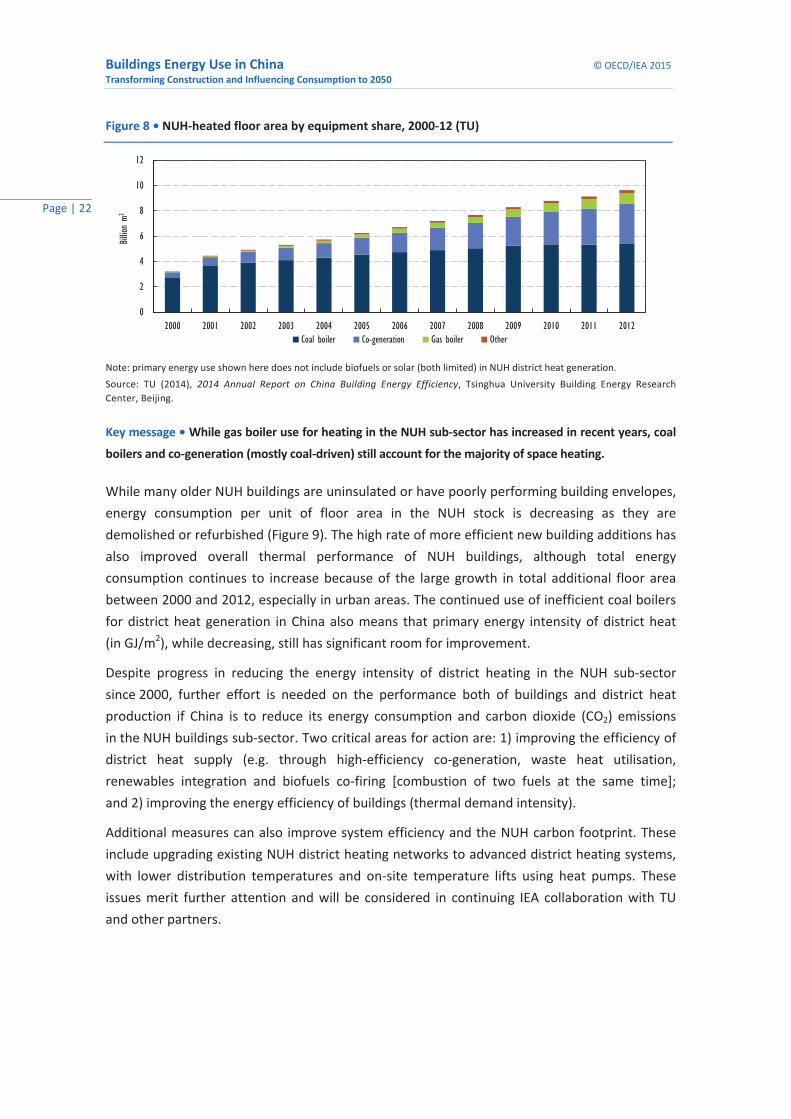
Figure 8 • NUH-heated floor area by equipment share, 2000-12 (TU)
Note: primary energy use shown here does not include biofuels or solar (both limited) in NUH district heat generation. Source: TU (2014), 2014 Annual Report on China Building Energy Efficiency, Tsinghua University Building Energy Research Center, Beijing.
Key message • While gas boiler use for heating in the NUH sub-sector has increased in recent years, coal
boilers and co-generation (mostly coal-driven) still account for the majority of space heating.
While many older NUH buildings are uninsulated or have poorly performing building envelopes, energy consumption per unit of floor area in the NUH stock is decreasing as they are demolished or refurbished (Figure 9). The high rate of more efficient new building additions has also improved overall thermal performance of NUH buildings, although total energy consumption continues to increase because of the large growth in total additional floor area between 2000 and 2012, especially in urban areas. The continued use of inefficient coal boilers for district heat generation in China also means that primary energy intensity of district heat (in GJ/m2), while decreasing, still has significant room for improvement.
Despite progress in reducing the energy intensity of district heating in the NUH sub-sector since 2000, further effort is needed on the performance both of buildings and district heat production if China is to reduce its energy consumption and carbon dioxide (CO2) emissions in the NUH buildings sub-sector. Two critical areas for action are: 1) improving the efficiency of district heat supply (e.g. through high-efficiency co-generation, waste heat utilisation, renewables integration and biofuels co-firing [combustion of two fuels at the same time]; and 2) improving the energy efficiency of buildings (thermal demand intensity).
Additional measures can also improve system efficiency and the NUH carbon footprint. These include upgrading existing NUH district heating networks to advanced district heating systems, with lower distribution temperatures and on-site temperature lifts using heat pumps. These issues merit further attention and will be considered in continuing IEA collaboration with TU and other partners.
0
2
4
6
8
10
12
2000 2001 2002 2003 2004 2005 2006 2007 2008 2009 2010 2011 2012
Billio
n m2
Coal boiler Co-generation Gas boiler Other
© OECD/IEA 2015 Buildings Energy Use in China Transforming Construction and Influencing Consumption to 2050
Page | 23
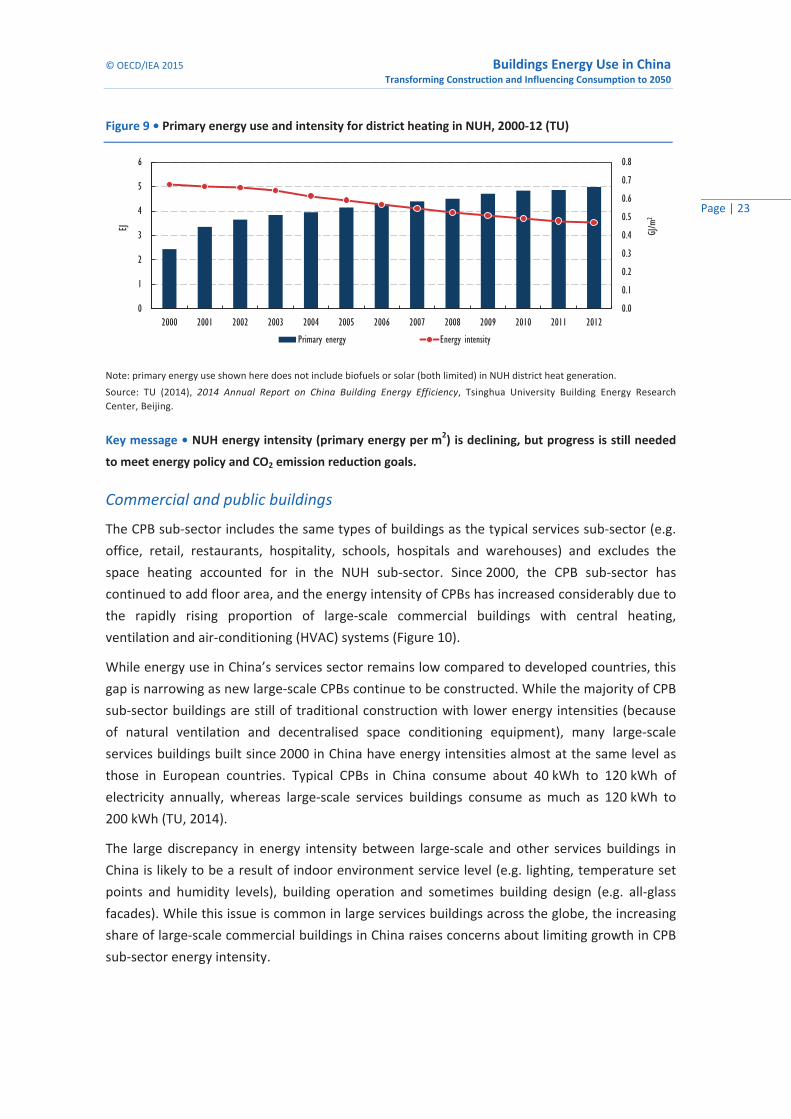
Figure 9 • Primary energy use and intensity for district heating in NUH, 2000-12 (TU)
Note: primary energy use shown here does not include biofuels or solar (both limited) in NUH district heat generation. Source: TU (2014), 2014 Annual Report on China Building Energy Efficiency, Tsinghua University Building Energy Research Center, Beijing.
Key message • NUH energy intensity (primary energy per m2) is declining, but progress is still needed
to meet energy policy and CO2 emission reduction goals.
Commercial and public buildings
The CPB sub-sector includes the same types of buildings as the typical services sub-sector (e.g. office, retail, restaurants, hospitality, schools, hospitals and warehouses) and excludes the space heating accounted for in the NUH sub-sector. Since 2000, the CPB sub-sector has continued to add floor area, and the energy intensity of CPBs has increased considerably due to the rapidly rising proportion of large-scale commercial buildings with central heating, ventilation and air-conditioning (HVAC) systems (Figure 10).
While energy use in China’s services sector remains low compared to developed countries, this gap is narrowing as new large-scale CPBs continue to be constructed. While the majority of CPB sub-sector buildings are still of traditional construction with lower energy intensities (because of natural ventilation and decentralised space conditioning equipment), many large-scale services buildings built since 2000 in China have energy intensities almost at the same level as those in European countries. Typical CPBs in China consume about 40 kWh to 120 kWh of electricity annually, whereas large-scale services buildings consume as much as 120 kWh to 200 kWh (TU, 2014).
The large discrepancy in energy intensity between large-scale and other services buildings in China is likely to be a result of indoor environment service level (e.g. lighting, temperature set points and humidity levels), building operation and sometimes building design (e.g. all-glass facades). While this issue is common in large services buildings across the globe, the increasing share of large-scale commercial buildings in China raises concerns about limiting growth in CPB sub-sector energy intensity.
0.0
0.1
0.2
0.3
0.4
0.5
0.6
0.7
0.8
0
1
2
3
4
5
6
2000 2001 2002 2003 2004 2005 2006 2007 2008 2009 2010 2011 2012
GJ/m
2
EJ
Primary energy Energy intensity
Buildings Energy Use in China © OECD/IEA 2015 Transforming Construction and Influencing Consumption to 2050
Page | 24
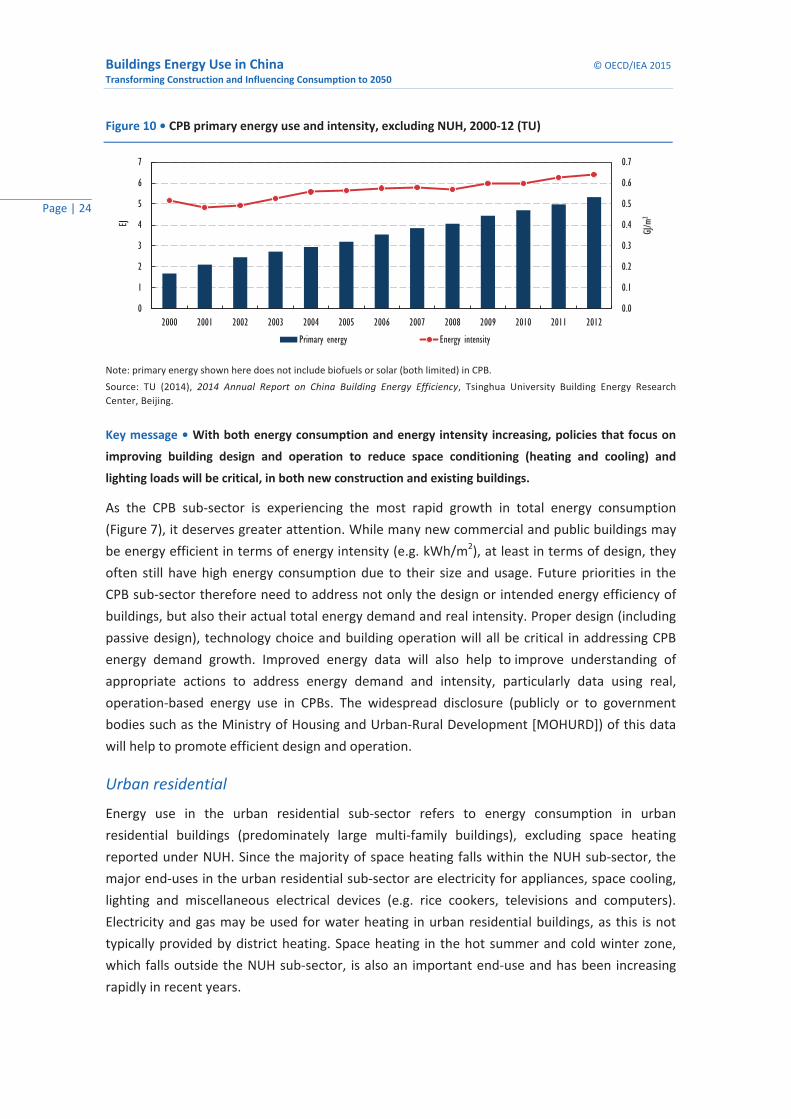
Figure 10 • CPB primary energy use and intensity, excluding NUH, 2000-12 (TU)
Note: primary energy shown here does not include biofuels or solar (both limited) in CPB. Source: TU (2014), 2014 Annual Report on China Building Energy Efficiency, Tsinghua University Building Energy Research Center, Beijing.
Key message • With both energy consumption and energy intensity increasing, policies that focus on
improving building design and operation to reduce space conditioning (heating and cooling) and
lighting loads will be critical, in both new construction and existing buildings.
As the CPB sub-sector is experiencing the most rapid growth in total energy consumption (Figure 7), it deserves greater attention. While many new commercial and public buildings may be energy efficient in terms of energy intensity (e.g. kWh/m2), at least in terms of design, they often still have high energy consumption due to their size and usage. Future priorities in the CPB sub-sector therefore need to address not only the design or intended energy efficiency of buildings, but also their actual total energy demand and real intensity. Proper design (including passive design), technology choice and building operation will all be critical in addressing CPB energy demand growth. Improved energy data will also help to improve understanding of appropriate actions to address energy demand and intensity, particularly data using real, operation-based energy use in CPBs. The widespread disclosure (publicly or to government bodies such as the Ministry of Housing and Urban-Rural Development [MOHURD]) of this data will help to promote efficient design and operation.
Urban residential
Energy use in the urban residential sub-sector refers to energy consumption in urban residential buildings (predominately large multi-family buildings), excluding space heating reported under NUH. Since the majority of space heating falls within the NUH sub-sector, the major end-uses in the urban residential sub-sector are electricity for appliances, space cooling, lighting and miscellaneous electrical devices (e.g. rice cookers, televisions and computers). Electricity and gas may be used for water heating in urban residential buildings, as this is not typically provided by district heating. Space heating in the hot summer and cold winter zone, which falls outside the NUH sub-sector, is also an important end-use and has been increasing rapidly in recent years.
0.0
0.1
0.2
0.3
0.4
0.5
0.6
0.7
0
1
2
3
4
5
6
7
2000 2001 2002 2003 2004 2005 2006 2007 2008 2009 2010 2011 2012
GJ/m
2
EJ
Primary energy Energy intensity

© OECD/IEA 2015 Buildings Energy Use in China Transforming Construction and Influencing Consumption to 2050
Page | 25
Floor area in the urban residential sub-sector increased by nearly 260% between 2000 and 2012 as a result of high rates of urbanisation in China. When paired with increased access to and use of energy services as populations move to cities in China, this trend has resulted in significant growth in energy consumption since 2000 (Figure 11). Energy intensity in urban residential buildings increased at a slower pace compared to construction growth due to energy efficiency improvements (e.g. in lighting, appliances and cooking), but it is still increasing quite fast.
Figure 11 • Urban residential primary energy use and intensity, excluding NUH, 2000-12 (TU)
Note: primary energy here does not include biofuels or solar (beginning to be used for water heating) in urban buildings. Source: TU (2014), 2014 Annual Report on China Building Energy Efficiency, Tsinghua University Building Energy Research Center, Beijing.
Key message • Urban residential buildings are a critical priority area for energy technology and policy
engagement, as urbanisation, floor area growth and increases in energy intensity continue to drive
total energy consumption.
Energy intensity varies across the different end-uses in urban residential buildings, with different implications for future energy demand growth. For instance, considering the current low intensity of hot-water use per person or per household in urban residential China compared with developed countries, it is expected that the demand for hot water will increase in coming years. The ownership of appliances is also expected to increase considerably as income levels rise, as are the size and intensity of use for some appliance types. Demographic and behavioural trends (e.g. young people tending to use more space cooling than older generations) may also influence urban residential energy demand.
Other end-uses, such as lighting and cooking, may not see as dramatic increases in energy consumption or energy intensity in the future. For example, energy-efficient lamps (e.g. compact fluorescent lamps [CFLs]) are already widely used in urban residential China, and urban households are not demonstrating strong growth in lighting demand intensity (in terms of usage per m2). Energy intensity for cooking similarly is not expected to increase significantly, as most urban households have already moved to modern commercial fuels (e.g. gas and LPG). Nonetheless, growth in urban household numbers and floor area will still lead to increases in total lighting and cooking energy consumption unless additional energy efficiency gains are made.
0
5
10
15
20
25
0
1
2
3
4
5
2000 2001 2002 2003 2004 2005 2006 2007 2008 2009 2010 2011 2012
GJ/hou
sehold
EJ
Primary energy Energy intensity
Buildings Energy Use in China © OECD/IEA 2015 Transforming Construction and Influencing Consumption to 2050
Page | 26
Growing demand for space cooling could cause considerable increases in energy intensity and consumption in urban residential buildings across China (and especially in the warmer southern regions), as could demand for space heating in the hot summer and cold winter climate zone (Box 3).15 Overall demand for thermal comfort continues to rise with growth in household wealth, and it will be critical to address this potential growth in energy demand by instituting energy-efficient building envelope technologies and advanced buildings codes throughout China.
Box 3 • Space heating in the Yangtze River Basin
15 See section below on China’s climatic conditions. 16 See discussion regarding building energy codes that continually need to be assessed for greater stringency in accordance with local climates, building types, energy prices and cost of building materials.
Space heating in the Yangtze River Basin (YRB) is a recent topic of significant debate in China. While
space heating is needed in the moderate winters, it is not required by law as is the case in
Northern China. The YRB is also the most developed area in China, including large cities such as
Shanghai, Hangzhou, Nanjing, Wuhan and Chongqing. With growing household wealth, demand and
energy use for space heating have risen in recent years, and China is now considering whether DHC
are a valid option for the YRB.
Initial analysis by TU indicates that pursuing large district heating networks would not be advisable for
the YRB, because the climate is not markedly cold and the heating season is short. Large capital
expenditure to install such networks is unlikely to be cost effective. While such systems could possibly
encourage greater utilisation of renewable energy sources from outside city centres, the potential
benefit may be low compared to the negative impact that greater heat supply would have on the
system. In particular, total energy wasted may exceed the potential benefits from renewable energy use.
Conclusions from the research being done by TU on this topic include the following:
• Space heating for the YRB should be considered in the context of national energy conservation
and emissions reduction planning and policy. Heating and cooling options to meet space
conditioning needs in the temperate and warm regions of China should be researched and
designed from the perspective of overall buildings energy conservation objectives using
appropriate technology mixes, including energy efficiency measures.
• District space heating systems should not be pursued in provincial or city-level planning.
• For the cities in the YRB with centralised heating, adjustable temperature controls, heat
metering and energy prices based on consumption, with increasing tariffs for greater
consumption, should be promoted to encourage energy-saving behaviour.
• Building insulation levels should be improved along with proper air sealing, especially for new
construction, in accordance with advanced building energy codes (standards) such as the
criteria in Shanghai (DB, 2011), Hubei (DB, 2013) and Jiangsu (DB, 2008).16
• Marginal tier increasing energy pricing schemes for residential consumers, covering electricity and
natural gas, should be promoted to encourage sustainable, energy-saving behaviours.

© OECD/IEA 2015 Buildings Energy Use in China Transforming Construction and Influencing Consumption to 2050
Page | 27
Rural residential
Energy use in the rural residential sub-sector is quite different from that in urban residential buildings in China. Like many other rural areas in developing countries, biofuels (meaning traditional, non-commercial biomass) are the predominant source of energy and are used inefficiently for cooking, water heating and space heating, bringing serious indoor air quality concerns and health impacts. High quality data for biofuels use are very limited globally.
TU research and data collection show a dramatic downward trend in biofuel consumption in rural residential areas in recent years, as households gain access and switch to modern commercial energy (e.g. electricity, coal and LPG) (Figure 12). It is believed that the major portion of this shift has been to coal (Box 4),17 although electricity use has also increased dramatically as rural household income has grown, allowing the purchase of appliances and electronics.
Figure 12 • Rural residential primary energy use and intensity, 2000-12 (TU)
Note: variations between IEA and TU data exist; see Annex A for further details; excludes solar. Source: TU (2014), 2014 Annual Report on China Building Energy Efficiency, Tsinghua University Building Energy Research Center, Beijing.
Key message • Primary energy intensity has remained constant, as improved living standards and
increased use of commercial energy have offset shifts away from inefficient use of biofuels. Increased
fossil fuel use also means CO2 emissions for this sector have increased considerably.
Unlike urban residential buildings, which are mostly multi-family, almost all rural residential buildings comprise single-family houses. Average household floor area has continued to increase since 2000 as wealth has increased, growing from 104 m2 in 2000 to 144 m2 in 2012. Household wealth and improved living standards have played an important role in increasing overall energy intensity in rural households, especially in colder regions where space heating is a major energy end-use.
17 The IEA is working with NBS in China to improve rural coal energy reporting, which is expected to be available shortly.
0
10
20
30
40
50
60
0
2
4
6
8
10
12
2000 2001 2002 2003 2004 2005 2006 2007 2008 2009 2010 2011 2012GJ/hou
sehold
EJ
Commercial energy Biomass Commercial energy intensity Total primary energy intensity

Buildings Energy Use in China © OECD/IEA 2015 Transforming Construction and Influencing Consumption to 2050
Page | 28
Box 4 • Solutions for the rural residential transition from biofuels
As rural China continues to develop, two major issues remain to be solved for rural households: one is sanitation (indoor and outdoor), and the other is to improve building thermal conditions. The Chinese government has paid great attention to sanitation in rural areas, but energy demand for thermal comfort needs further consideration. Rural residential buildings, in general, have limited levels of insulation and airtightness, and as energy use for space conditioning can be a financial burden on rural households, many dwellings today remain cold in the winter and hot in the summer. Demand for comfort is very likely to increase as rural household wealth continues to grow, and reducing growth in residential thermal intensity will be a major area for policy consideration.
Economic, population and energy trends
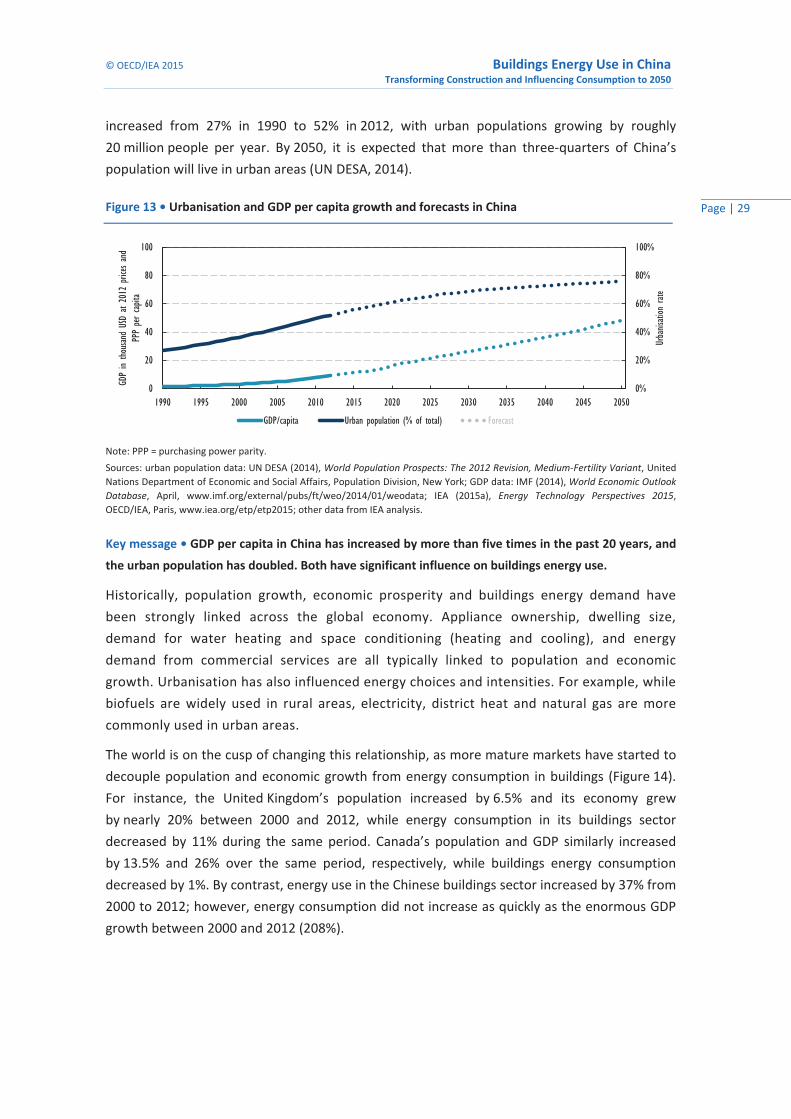
In 1990, the total population of China was 1.17 billion people. By 2012, China’s population was 1.38 billion (20% growth over 1990), exceeding the total combined population of member countries of the OECD (UN DESA, 2014). Since the 1990s, China’s economy has maintained rapid growth, with per capita gross domestic product (GDP) increasing from USD 1 360 in 1990 to USD 9 120 in 2012 (IMF, 2014) (Figure 13). Alongside economic development, China has also experienced large demographic shifts. The proportion of the population living in urban areas
Significant fuel switching is being seen in rural China, from biofuels to coal and LPG. Options to
improve utilisation of rural biofuels include improved gathering and storing of agricultural and
animal waste, and fuelwood, and more efficient stoves that could significantly improve the energy
efficiency of biofuels, while also improving indoor air quality. Biofuels could also be used in the
generation of biogas, for example by using small-scale biogas digesters. Biogas can be used as a
direct replacement for LPG and other fuels used in buildings, although this goes beyond the scope
of this report (see IEA, 2012 for more information).
Beyond the continued use of biofuels, coal and LPG, certain interim solutions may offer efficiency
improvements. For example, advanced kangs (a traditional type of cooking stove that allows flue
gases to travel through a brick-type of bed in a bedroom adjacent to the kitchen) have improved
combustion chambers and can reduce the amount of biofuel or coal that is needed to maintain the
temperature of the cooking stove. The stove is used for food preparation and for hot water, while
also heating the sleeping area (Wang, P. et al., 2014). While China leads the world in solar thermal
that is mostly used for water heating, new innovative solar collectors (air and water) can be
promoted for space heating applications. Thus, more research is needed to address rural residential
energy consumption and increasing CO2 emissions due to higher use of coal and LPG.
Source: Wang, P. et al. (2014), “A new Chinese kang with forced convection: System design and thermal performance
measurements”, Energy and Buildings, Vol. 85, pp. 410-415.
© OECD/IEA 2015 Buildings Energy Use in China Transforming Construction and Influencing Consumption to 2050
Page | 29
increased from 27% in 1990 to 52% in 2012, with urban populations growing by roughly 20 million people per year. By 2050, it is expected that more than three-quarters of China’s population will live in urban areas (UN DESA, 2014).
Figure 13 • Urbanisation and GDP per capita growth and forecasts in China
Note: PPP = purchasing power parity. Sources: urban population data: UN DESA (2014), World Population Prospects: The 2012 Revision, Medium-Fertility Variant, United Nations Department of Economic and Social Affairs, Population Division, New York; GDP data: IMF (2014), World Economic Outlook Database, April, www.imf.org/external/pubs/ft/weo/2014/01/weodata; IEA (2015a), Energy Technology Perspectives 2015, OECD/IEA, Paris, www.iea.org/etp/etp2015; other data from IEA analysis.
Key message • GDP per capita in China has increased by more than five times in the past 20 years, and
the urban population has doubled. Both have significant influence on buildings energy use.
Historically, population growth, economic prosperity and buildings energy demand have been strongly linked across the global economy. Appliance ownership, dwelling size, demand for water heating and space conditioning (heating and cooling), and energy demand from commercial services are all typically linked to population and economic growth. Urbanisation has also influenced energy choices and intensities. For example, while biofuels are widely used in rural areas, electricity, district heat and natural gas are more commonly used in urban areas.
The world is on the cusp of changing this relationship, as more mature markets have started to decouple population and economic growth from energy consumption in buildings (Figure 14). For instance, the United Kingdom’s population increased by 6.5% and its economy grew by nearly 20% between 2000 and 2012, while energy consumption in its buildings sector decreased by 11% during the same period. Canada’s population and GDP similarly increased by 13.5% and 26% over the same period, respectively, while buildings energy consumption decreased by 1%. By contrast, energy use in the Chinese buildings sector increased by 37% from 2000 to 2012; however, energy consumption did not increase as quickly as the enormous GDP growth between 2000 and 2012 (208%).
0%
20%
40%
60%
80%
100%
0
20
40
60
80
100
1990 1995 2000 2005 2010 2015 2020 2025 2030 2035 2040 2045 2050
Urba
nisati
on ra
te
GDP
in tho
usan
d US
D at
2012
pric
es an
d PP
P per c
apita
GDP/capita Urban population (% of total) Forecast

Buildings Energy Use in China © OECD/IEA 2015 Transforming Construction and Influencing Consumption to 2050
Page | 30
Figure 14 • Economic, population and energy trends for several major economies, 2000-12
Note: varying scales for graphs top and bottom. Sources: population data: IEA (2015b), Statistics Database, www.iea.org/statistics/statisticssearch; GDP data: IMF (2014), World Economic Outlook Database, April, www.imf.org/external/pubs/ft/weo/2014/01/weodata; calculations derived from IEA (2014d), “World energy balances”, IEA World Energy Statistics and Balances (database).
Key message • While certain countries have decreased energy consumption relative to population and
GDP growth, significant work is needed to decouple these drivers on a global scale. China’s population
is expected to peak around 2030 and this will curb a key driver for energy consumption growth.
Continued population growth, economic development and urbanisation are expected to have a strong influence on energy demand and consumption in the Chinese buildings sector to 2050. While the country’s population is expected to stabilise in the coming decades and then decrease slightly post 2030,18 GDP growth will continue to drive buildings sector growth and energy consumption. In particular, residential floor area is expected to increase by as much as 30% by 2030 and an additional 10% by 2050 (Table 2). These strong drivers will continue to shape buildings energy demand in China, especially if additional policies to improve buildings efficiency and further decouple economic development from energy consumption are not adopted soon.
18 The recent policy to relax the one-child policy for couples if either of them is a single child could be evaluated for its impact on total population forecasts and resultant energy use.
-15%-10%-5%0%5%
10%15%20%25%30%
2000 2012
Chan
ge rela
tive to
2000
Canada
0%
50%
100%
150%
200%
250%
2000 2012
Chan
ge rela
tive to
2000
India
Population GDP Energy Floor area
0%
50%
100%
150%
200%
250%
2000 2012
China
-15%-10%-5%0%5%
10%15%20%25%30%
2000 2012
United Kingdom

© OECD/IEA 2015 Buildings Energy Use in China Transforming Construction and Influencing Consumption to 2050
Page | 31
Table 2 • Drivers and forecasts for energy consumption in China’s buildings sector to 2050
2012 2020 2030 2040 2050
Population (million) 1 380 1 440 1 460 1 445 1 390
GDP (trillion 2012 USD*) 12.6 22.9 38.4 52.4 67.4
Per capita income (USD GDP/capita) 9 118 15 922 26 250 36 319 48 385
Residential floor area (billion m2) 41.4 57.1 66.8 71.0 72.0
Services floor area (billion m2) 8.2 9.9 10.7 11.4 11.6
Number of households (million) 429 518 575 587 572
Occupancy rate (people per household) 3.2 2.8 2.5 2.4 2.4
Average dwelling size (m2) 97 110 116 121 126
*GDP values shown at PPP. Note: further description of IEA scenario development and indicators can be found in the Buildings sector drivers section below and in Annex B; forecasts are based on 2014 world economic outlooks and may be different using 2015 outlooks. Sources: population data: UN DESA (2014), World Population Prospects: The 2012 Revision, Medium-Fertility Variant, United Nations Department of Economic and Social Affairs, Population Division, New York; for GDP data: IMF (2014), World Economic Outlook Database, April, www.imf.org/external/pubs/ft/weo/2014/01/weodata; IEA (2015a), Energy Technology Perspectives 2015, OECD/IEA, Paris, www.iea.org/etp/etp2015; other data from IEA analysis.
To move forward, a paradigm shift is needed in the relationship between energy demand and buildings sector growth. The coming decades will be important for the Chinese buildings market, as construction of buildings with very low or zero-energy consumption levels will help to offset continued growth in floor area. Critical buildings policies need to be implemented to achieve this shift, including establishing, monitoring and enforcing ambitious building energy codes across all regions of China, with a long-term focus on achieving low-energy buildings. While this shift will take time to mature, it can be expedited in emerging markets, such as China, through a focus on pursuing sustainable construction practices. This approach allows the greatest energy efficiency performance within cultural, climatic and regional construction constraints, while also working to transform these constraints, where possible, over time.
Global buildings energy consumption and comparisons
In 2012, buildings final energy use totalled 118 EJ globally (representing 32% of global final energy consumption), with 74% of that total used in the residential sub-sector and the remainder in the services sub-sector (commercial and public buildings). Electricity, natural gas, oil (including LPG) and biofuels accounted for 90% of all energy consumed in the buildings sector, although the fuel shares vary significantly across OECD countries and OECD non-members (Figure 15). OECD countries have a much greater share of commercial energy (oil, electricity and gas), whereas developing countries, especially in rural areas, have a much greater share of biofuel and coal consumption.

Buildings Energy Use in China © OECD/IEA 2015 Transforming Construction and Influencing Consumption to 2050
Page | 32
Figure 15 • Buildings sector final energy by fuel type for OECD countries and non-members, 2012
Notes: oil share includes LPG, kerosene, gasoline and diesel, and other light fuel oil; in China, it is mostly LPG. Source: IEA (2015a), Energy Technology Perspectives 2015, OECD/IEA, Paris, www.iea.org/etp/etp2015.
Key message • Commercial energy typically dominates energy consumption in OECD countries, while
traditional biofuels and coal are very common in developing countries.
In China, the shift from biofuels to commercial energy is occurring rapidly with increasing wealth and urbanisation. In 2000, biofuels represented nearly 60% of total final energy consumption in the buildings sector, decreasing to roughly 35% in 2012, 19 while direct fossil fuel consumption (i.e., excluding fossil fuel use for electricity and commercial heat production) increased from 25% in 2000 to 31% in 2012. As a result, use of biofuels decreased by roughly 1.5 EJ, while total buildings energy consumption in China increased by nearly 5 EJ between 2000 and 2012, leading China to account for nearly 16% of total final energy consumption in the global buildings sector in 2012 (Figure 16).
Figure 16 • Buildings sector final energy consumption across major regions, 2012
Source: IEA (2015a), Energy Technology Perspectives 2015, OECD/IEA, Paris, www.iea.org/etp/etp2015.
Key message • China now accounts for nearly 16% of global final energy use in buildings.
19 Biofuels data reporting is difficult to accurately assess; see Annex A for further details.
12%
2%
34%
42%
6%1%
3%
OECD 50 EJ
Oil Coal Natural gas Electricity Biofuels Other Commercial heat
9%
5%12%
20%
45%
1%
8%
OECD non-members 68 EJ
0
5
10
15
20
25
Uited Statesand Canada
Latin America EU 28 OECD Pacific China India Other DevelopingAsia
Africa andMiddle East
Other
EJ
Global buildings final energy consumption, 118 EJ (2012)
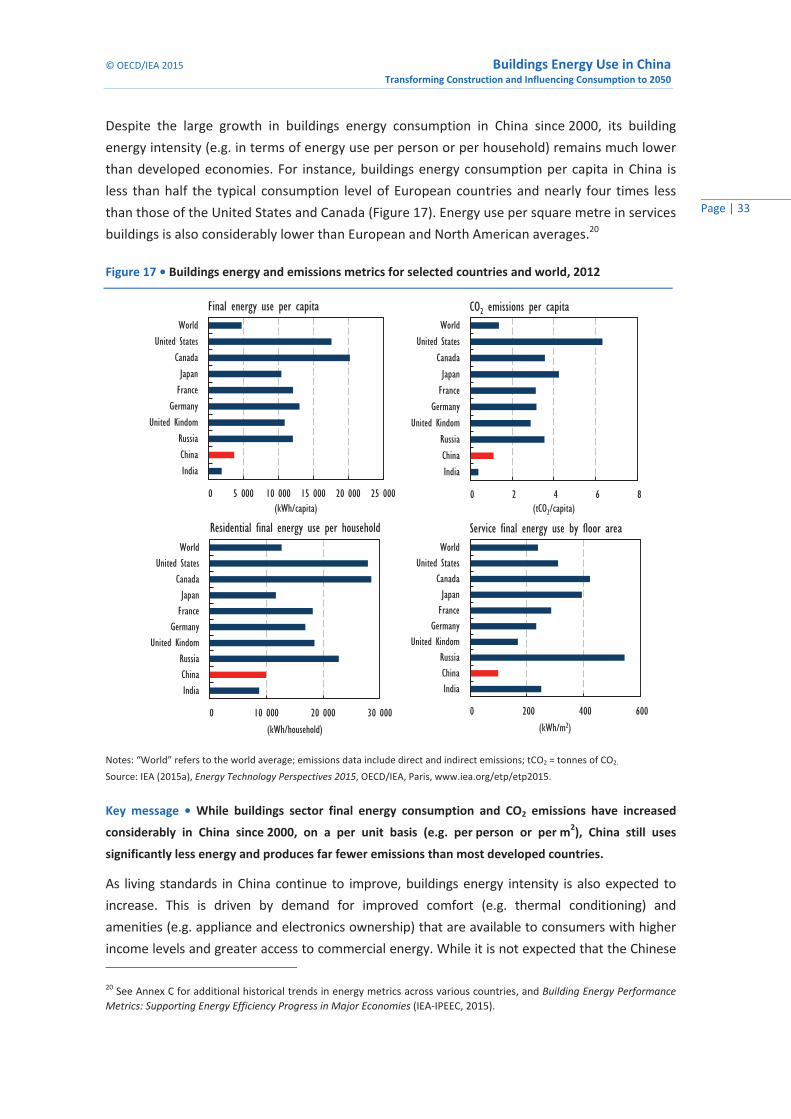
© OECD/IEA 2015 Buildings Energy Use in China Transforming Construction and Influencing Consumption to 2050
Page | 33
Despite the large growth in buildings energy consumption in China since 2000, its building energy intensity (e.g. in terms of energy use per person or per household) remains much lower than developed economies. For instance, buildings energy consumption per capita in China is less than half the typical consumption level of European countries and nearly four times less than those of the United States and Canada (Figure 17). Energy use per square metre in services buildings is also considerably lower than European and North American averages.20
Figure 17 • Buildings energy and emissions metrics for selected countries and world, 2012
Notes: “World” refers to the world average; emissions data include direct and indirect emissions; tCO2 = tonnes of CO2. Source: IEA (2015a), Energy Technology Perspectives 2015, OECD/IEA, Paris, www.iea.org/etp/etp2015.
Key message • While buildings sector final energy consumption and CO2 emissions have increased
considerably in China since 2000, on a per unit basis (e.g. per person or per m2), China still uses
significantly less energy and produces far fewer emissions than most developed countries.
As living standards in China continue to improve, buildings energy intensity is also expected to increase. This is driven by demand for improved comfort (e.g. thermal conditioning) and amenities (e.g. appliance and electronics ownership) that are available to consumers with higher income levels and greater access to commercial energy. While it is not expected that the Chinese
20 See Annex C for additional historical trends in energy metrics across various countries, and Building Energy Performance Metrics: Supporting Energy Efficiency Progress in Major Economies (IEA-IPEEC, 2015).
0 5 000 10 000 15 000 20 000 25 000
IndiaChinaRussia
United KindomGermanyFranceJapan
CanadaUnited States
World
(kWh/capita) 0 2 4 6 8
IndiaChinaRussia
United KindomGermanyFranceJapan
CanadaUnited States
World
(tCO2/capita)
0 10 000 20 000 30 000
IndiaChinaRussia
United KindomGermanyFranceJapan
CanadaUnited States
World
(kWh/household)
0 200 400 600
IndiaChinaRussia
United KindomGermanyFranceJapan
CanadaUnited States
World
(kWh/m2)
Final energy use per capita CO2 emissions per capita
Residential final energy use per household Service final energy use by floor area
Buildings Energy Use in China © OECD/IEA 2015 Transforming Construction and Influencing Consumption to 2050
Page | 34
population will fully adopt the energy-consuming behaviour of other industrialised, energy-intensive economies due to a number of economic and structural reasons,21 it is nonetheless likely that China will adopt more intensive behaviours compared to current practice. China has already put in place numerous energy efficiency policies (e.g. appliance labelling and standards) to address this issue, but further study in this field is nonetheless merited to understand the potential impact of changes in consumer choices and behaviour.
As China continues to develop, and demand for energy services in buildings continues to increase, additional policy solutions are needed to pursue energy efficiency and technology solutions that will limit the impact of these changes. Similarly, policy programmes could be adopted to address the behavioural aspects of potential energy growth, by influencing consumer choice and raising awareness of energy efficiency opportunities.
21 Many mature economies adopted intense energy-consuming behaviour at a time when energy was inexpensive and plentiful. Other factors, such as the prevalence of high-density multi-family residential developments, are also likely to cause lower buildings energy use in China when compared to some other developed countries.
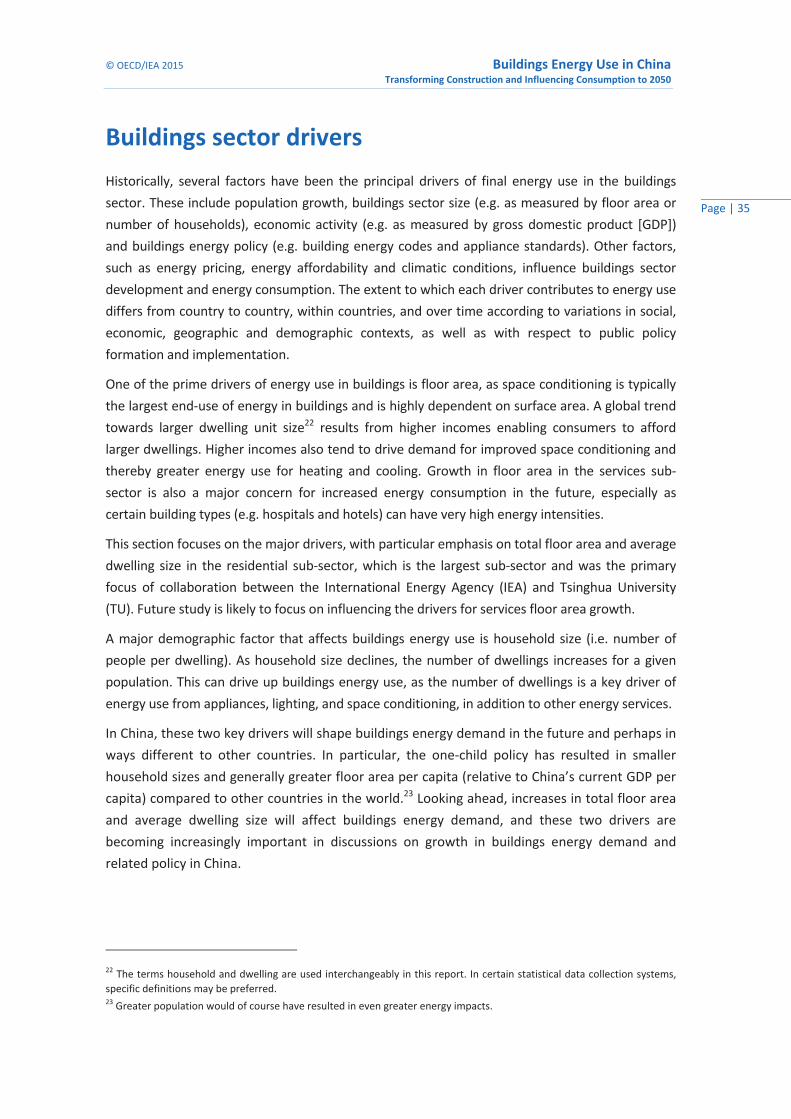
© OECD/IEA 2015 Buildings Energy Use in China Transforming Construction and Influencing Consumption to 2050
Page | 35
Buildings sector drivers Historically, several factors have been the principal drivers of final energy use in the buildings sector. These include population growth, buildings sector size (e.g. as measured by floor area or number of households), economic activity (e.g. as measured by gross domestic product [GDP]) and buildings energy policy (e.g. building energy codes and appliance standards). Other factors, such as energy pricing, energy affordability and climatic conditions, influence buildings sector development and energy consumption. The extent to which each driver contributes to energy use differs from country to country, within countries, and over time according to variations in social, economic, geographic and demographic contexts, as well as with respect to public policy formation and implementation.
One of the prime drivers of energy use in buildings is floor area, as space conditioning is typically the largest end-use of energy in buildings and is highly dependent on surface area. A global trend towards larger dwelling unit size22 results from higher incomes enabling consumers to afford larger dwellings. Higher incomes also tend to drive demand for improved space conditioning and thereby greater energy use for heating and cooling. Growth in floor area in the services sub-sector is also a major concern for increased energy consumption in the future, especially as certain building types (e.g. hospitals and hotels) can have very high energy intensities.
This section focuses on the major drivers, with particular emphasis on total floor area and average dwelling size in the residential sub-sector, which is the largest sub-sector and was the primary focus of collaboration between the International Energy Agency (IEA) and Tsinghua University (TU). Future study is likely to focus on influencing the drivers for services floor area growth.
A major demographic factor that affects buildings energy use is household size (i.e. number of people per dwelling). As household size declines, the number of dwellings increases for a given population. This can drive up buildings energy use, as the number of dwellings is a key driver of energy use from appliances, lighting, and space conditioning, in addition to other energy services.
In China, these two key drivers will shape buildings energy demand in the future and perhaps in ways different to other countries. In particular, the one-child policy has resulted in smaller household sizes and generally greater floor area per capita (relative to China’s current GDP per capita) compared to other countries in the world.23 Looking ahead, increases in total floor area and average dwelling size will affect buildings energy demand, and these two drivers are becoming increasingly important in discussions on growth in buildings energy demand and related policy in China.
22 The terms household and dwelling are used interchangeably in this report. In certain statistical data collection systems, specific definitions may be preferred. 23 Greater population would of course have resulted in even greater energy impacts.
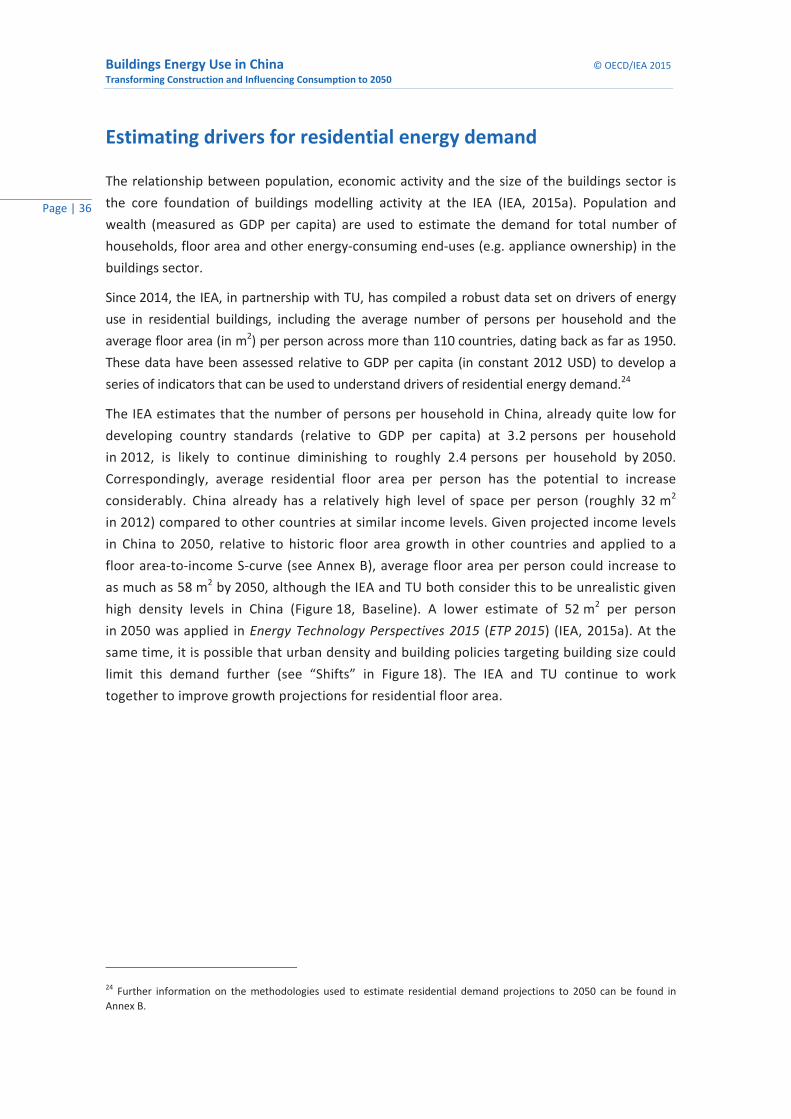
Buildings Energy Use in China © OECD/IEA 2015 Transforming Construction and Influencing Consumption to 2050
Page | 36
Estimating drivers for residential energy demand
The relationship between population, economic activity and the size of the buildings sector is the core foundation of buildings modelling activity at the IEA (IEA, 2015a). Population and wealth (measured as GDP per capita) are used to estimate the demand for total number of households, floor area and other energy-consuming end-uses (e.g. appliance ownership) in the buildings sector.
Since 2014, the IEA, in partnership with TU, has compiled a robust data set on drivers of energy use in residential buildings, including the average number of persons per household and the average floor area (in m2) per person across more than 110 countries, dating back as far as 1950. These data have been assessed relative to GDP per capita (in constant 2012 USD) to develop a series of indicators that can be used to understand drivers of residential energy demand.24
The IEA estimates that the number of persons per household in China, already quite low for developing country standards (relative to GDP per capita) at 3.2 persons per household in 2012, is likely to continue diminishing to roughly 2.4 persons per household by 2050. Correspondingly, average residential floor area per person has the potential to increase considerably. China already has a relatively high level of space per person (roughly 32 m2 in 2012) compared to other countries at similar income levels. Given projected income levels in China to 2050, relative to historic floor area growth in other countries and applied to a floor area-to-income S-curve (see Annex B), average floor area per person could increase to as much as 58 m2 by 2050, although the IEA and TU both consider this to be unrealistic given high density levels in China (Figure 18, Baseline). A lower estimate of 52 m2 per person in 2050 was applied in Energy Technology Perspectives 2015 (ETP 2015) (IEA, 2015a). At the same time, it is possible that urban density and building policies targeting building size could limit this demand further (see “Shifts” in Figure 18). The IEA and TU continue to work together to improve growth projections for residential floor area.
24 Further information on the methodologies used to estimate residential demand projections to 2050 can be found in Annex B.
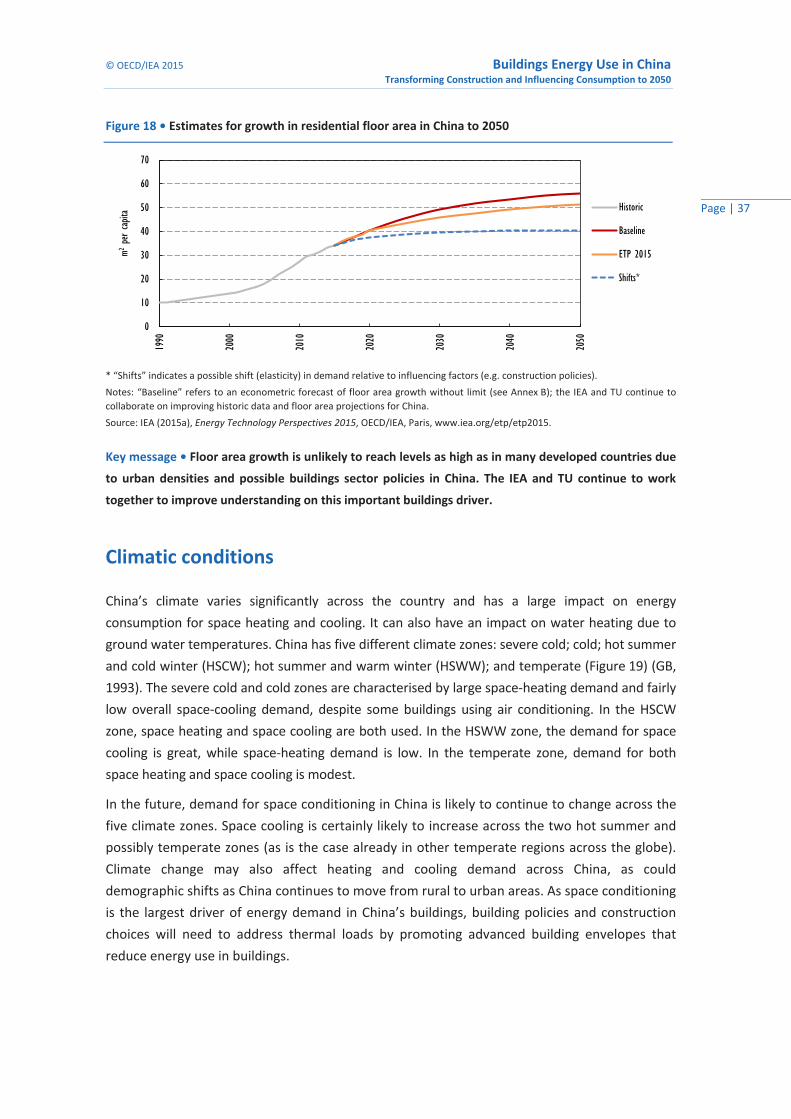
© OECD/IEA 2015 Buildings Energy Use in ChinaTransforming Construction and Influencing Consumption to 2050
Page | 37
Figure 18 • Estimates for growth in residential floor area in China to 2050
* “Shifts” indicates a possible shift (elasticity) in demand relative to influencing factors (e.g. construction policies).Notes: “Baseline” refers to an econometric forecast of floor area growth without limit (see Annex B); the IEA and TU continue to collaborate on improving historic data and floor area projections for China. Source: IEA (2015a), Energy Technology Perspectives 2015, OECD/IEA, Paris, www.iea.org/etp/etp2015.
Key message • Floor area growth is unlikely to reach levels as high as in many developed countries due
to urban densities and possible buildings sector policies in China. The IEA and TU continue to work
together to improve understanding on this important buildings driver.
Climatic conditions
China’s climate varies significantly across the country and has a large impact on energy consumption for space heating and cooling. It can also have an impact on water heating due to ground water temperatures. China has five different climate zones: severe cold; cold; hot summer and cold winter (HSCW); hot summer and warm winter (HSWW); and temperate (Figure 19) (GB, 1993). The severe cold and cold zones are characterised by large space-heating demand and fairly low overall space-cooling demand, despite some buildings using air conditioning. In the HSCW zone, space heating and space cooling are both used. In the HSWW zone, the demand for space cooling is great, while space-heating demand is low. In the temperate zone, demand for both space heating and space cooling is modest.
In the future, demand for space conditioning in China is likely to continue to change across the five climate zones. Space cooling is certainly likely to increase across the two hot summer and possibly temperate zones (as is the case already in other temperate regions across the globe). Climate change may also affect heating and cooling demand across China, as could demographic shifts as China continues to move from rural to urban areas. As space conditioning is the largest driver of energy demand in China’s buildings, building policies and construction choices will need to address thermal loads by promoting advanced building envelopes that reduce energy use in buildings.
0
10
20
30
40
50
60
7019
90
2000
2010
2020
2030
2040
2050
m2per c
apita
Historic
Baseline
ETP 2015
Shifts*

Buildings Energy Use in China © OECD/IEA 2015 Transforming Construction and Influencing Consumption to 2050
Page | 38
Figure 19 • China climate zones for energy consumption and policy
Note: this report and any map included herein are without prejudice to the status of sovereignty over any territory, to the delimitation of international frontiers and boundaries and to the name of any territory, city or area. Source: adapted from GB (1993), Thermal design code for civil building (GB 50176-93), China.
Key message • China’s climate zones have considerable impact on buildings energy demand,
particularly for space heating and cooling. Building codes and construction choices need to address
thermal loads to reduce energy demand for space conditioning.
Consumer behaviour and lifestyles
Occupants and building system operators play an important role in buildings energy consumption. Occupant activities (e.g. opening windows and turning on lights) and how occupants operate energy-consuming equipment (e.g. space conditioning systems and appliances) can significantly affect overall buildings energy consumption. In commercial and public buildings, and often in multi-family buildings, building operators similarly influence energy consumption, as they are typically responsible for decisions relating to space conditioning, ventilation and lighting.
The choices of consumers and operators can lead to significant energy consumption differences in any region of the world. In China, studies have shown that these choices can vary energy consumption by as much as two- to six-fold in households and between two- and ten-fold in office buildings (Zhang, S. et al., 2010). For instance, large variations were measured in electricity consumption for mini-split air conditioners across different apartments in the same multi-family building in Beijing (Figure 20). Some of these variations could be explained by greater use of natural ventilation, the use of exterior shading or lower set-point temperatures in apartments. However, the study also found that occupant age was a strong determinant, with older occupants using much less or no energy for mechanical cooling. At the same time, further data disaggregation is needed to validate these correlations relative to other possible
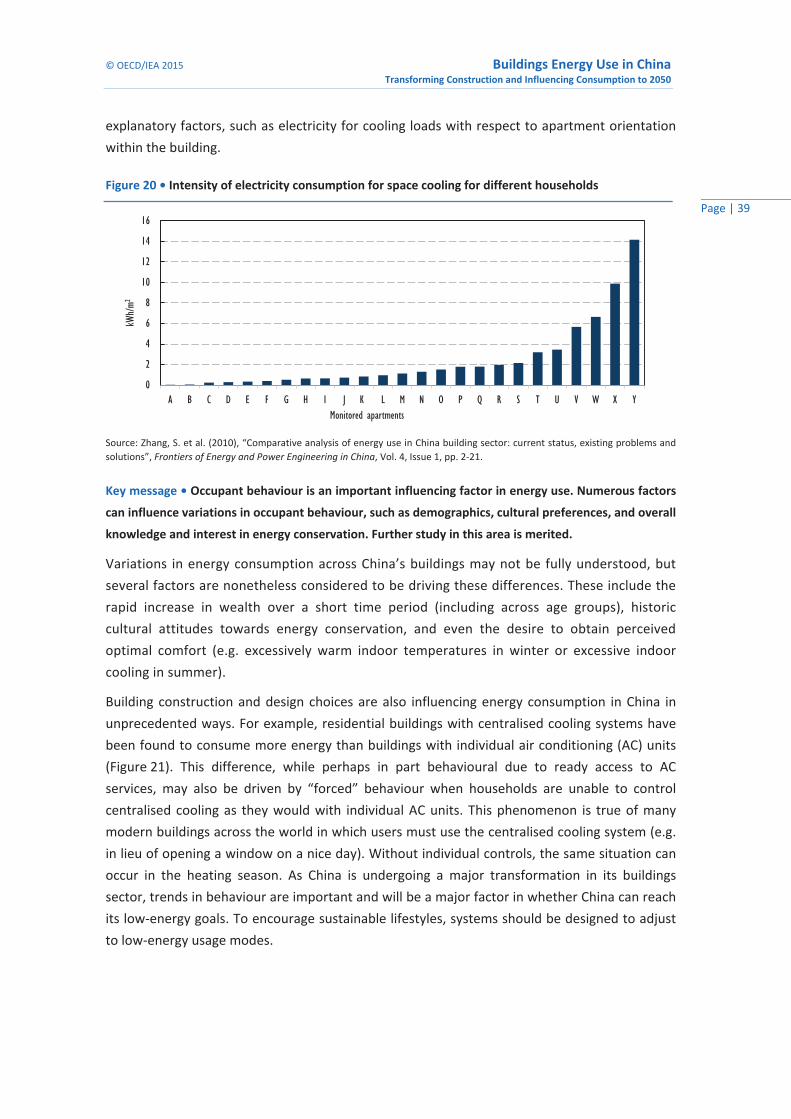
© OECD/IEA 2015 Buildings Energy Use in China Transforming Construction and Influencing Consumption to 2050
Page | 39
explanatory factors, such as electricity for cooling loads with respect to apartment orientation within the building.
Figure 20 • Intensity of electricity consumption for space cooling for different households
Source: Zhang, S. et al. (2010), “Comparative analysis of energy use in China building sector: current status, existing problems and solutions”, Frontiers of Energy and Power Engineering in China, Vol. 4, Issue 1, pp. 2-21.
Key message • Occupant behaviour is an important influencing factor in energy use. Numerous factors
can influence variations in occupant behaviour, such as demographics, cultural preferences, and overall
knowledge and interest in energy conservation. Further study in this area is merited.
Variations in energy consumption across China’s buildings may not be fully understood, but several factors are nonetheless considered to be driving these differences. These include the rapid increase in wealth over a short time period (including across age groups), historic cultural attitudes towards energy conservation, and even the desire to obtain perceived optimal comfort (e.g. excessively warm indoor temperatures in winter or excessive indoor cooling in summer).
Building construction and design choices are also influencing energy consumption in China in unprecedented ways. For example, residential buildings with centralised cooling systems have been found to consume more energy than buildings with individual air conditioning (AC) units (Figure 21). This difference, while perhaps in part behavioural due to ready access to AC services, may also be driven by “forced” behaviour when households are unable to control centralised cooling as they would with individual AC units. This phenomenon is true of many modern buildings across the world in which users must use the centralised cooling system (e.g. in lieu of opening a window on a nice day). Without individual controls, the same situation can occur in the heating season. As China is undergoing a major transformation in its buildings sector, trends in behaviour are important and will be a major factor in whether China can reach its low-energy goals. To encourage sustainable lifestyles, systems should be designed to adjust to low-energy usage modes.
0
2
4
6
8
10
12
14
16
A B C D E F G H I J K L M N O P Q R S T U V W X Y
kWh/m2
Monitored apartments
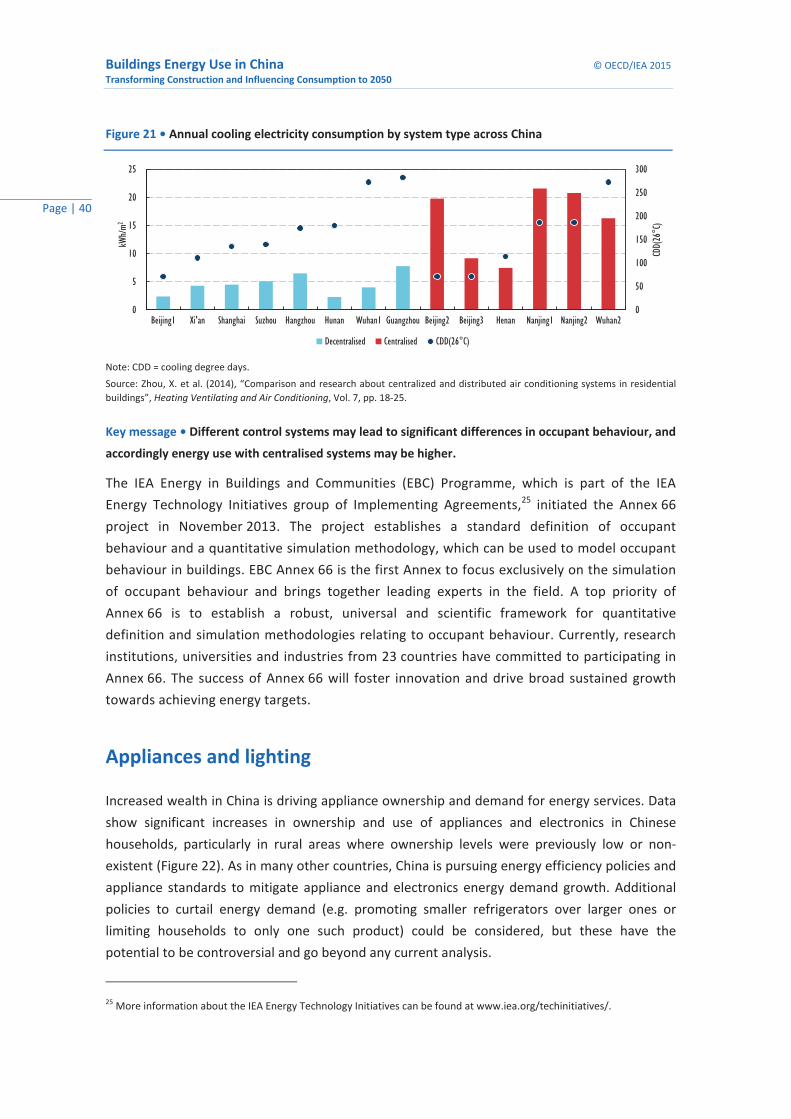
Buildings Energy Use in China © OECD/IEA 2015 Transforming Construction and Influencing Consumption to 2050
Page | 40
Figure 21 • Annual cooling electricity consumption by system type across China
Note: CDD = cooling degree days. Source: Zhou, X. et al. (2014), “Comparison and research about centralized and distributed air conditioning systems in residential buildings”, Heating Ventilating and Air Conditioning, Vol. 7, pp. 18-25.
Key message • Different control systems may lead to significant differences in occupant behaviour, and
accordingly energy use with centralised systems may be higher.
The IEA Energy in Buildings and Communities (EBC) Programme, which is part of the IEA Energy Technology Initiatives group of Implementing Agreements,25 initiated the Annex 66 project in November 2013. The project establishes a standard definition of occupant behaviour and a quantitative simulation methodology, which can be used to model occupant behaviour in buildings. EBC Annex 66 is the first Annex to focus exclusively on the simulation of occupant behaviour and brings together leading experts in the field. A top priority of Annex 66 is to establish a robust, universal and scientific framework for quantitative definition and simulation methodologies relating to occupant behaviour. Currently, research institutions, universities and industries from 23 countries have committed to participating in Annex 66. The success of Annex 66 will foster innovation and drive broad sustained growth towards achieving energy targets.
Appliances and lighting
Increased wealth in China is driving appliance ownership and demand for energy services. Data show significant increases in ownership and use of appliances and electronics in Chinese households, particularly in rural areas where ownership levels were previously low or non-existent (Figure 22). As in many other countries, China is pursuing energy efficiency policies and appliance standards to mitigate appliance and electronics energy demand growth. Additional policies to curtail energy demand (e.g. promoting smaller refrigerators over larger ones or limiting households to only one such product) could be considered, but these have the potential to be controversial and go beyond any current analysis.
25 More information about the IEA Energy Technology Initiatives can be found at www.iea.org/techinitiatives/.
0
50
100
150
200
250
300
0
5
10
15
20
25
Beijing1 Xi'an Shanghai Suzhou Hangzhou Hunan Wuhan1 Guangzhou Beijing2 Beijing3 Henan Nanjing1 Nanjing2 Wuhan2
CDD(26
°C)
kWh/m2
Decentralised Centralised CDD(26°C)
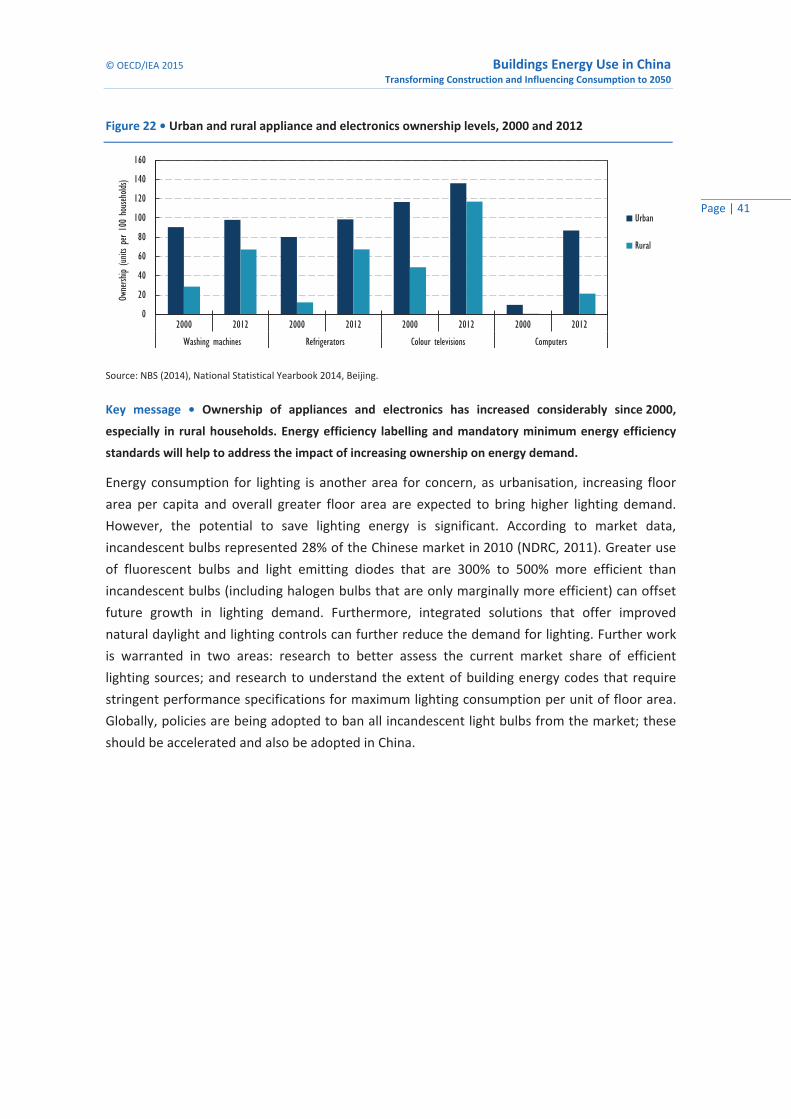
© OECD/IEA 2015 Buildings Energy Use in China Transforming Construction and Influencing Consumption to 2050
Page | 41
Figure 22 • Urban and rural appliance and electronics ownership levels, 2000 and 2012
Source: NBS (2014), National Statistical Yearbook 2014, Beijing.
Key message • Ownership of appliances and electronics has increased considerably since 2000,
especially in rural households. Energy efficiency labelling and mandatory minimum energy efficiency
standards will help to address the impact of increasing ownership on energy demand.
Energy consumption for lighting is another area for concern, as urbanisation, increasing floor area per capita and overall greater floor area are expected to bring higher lighting demand. However, the potential to save lighting energy is significant. According to market data, incandescent bulbs represented 28% of the Chinese market in 2010 (NDRC, 2011). Greater use of fluorescent bulbs and light emitting diodes that are 300% to 500% more efficient than incandescent bulbs (including halogen bulbs that are only marginally more efficient) can offset future growth in lighting demand. Furthermore, integrated solutions that offer improved natural daylight and lighting controls can further reduce the demand for lighting. Further work is warranted in two areas: research to better assess the current market share of efficient lighting sources; and research to understand the extent of building energy codes that require stringent performance specifications for maximum lighting consumption per unit of floor area. Globally, policies are being adopted to ban all incandescent light bulbs from the market; these should be accelerated and also be adopted in China.
0
20
40
60
80
100
120
140
160
2000 2012 2000 2012 2000 2012 2000 2012
Washing machines Refrigerators Colour televisions Computers
Ownersh
ip (un
its p
er 10
0 ho
usehold
s)
Urban
Rural

Buildings Energy Use in China © OECD/IEA 2015 Transforming Construction and Influencing Consumption to 2050
Page | 42
Buildings energy perspectives for China In the period to 2050, rapid growth in gross domestic product (GDP) per capita in China is expected to result in a large increase in the number of households, total floor area and other energy drivers, including appliance ownership and demand for lighting and comfort (e.g. space conditioning and increased use of hot water). China is already the second-largest energy consumer in the global buildings sector, and is shortly expected to outpace the United States to become the world’s largest buildings sector measured by final energy consumption. It is therefore critical that policies are adopted to address buildings sector energy consumption and anticipated increases in demand, ensuring that market opportunities are realised when possible.
The following section presents the energy and carbon dioxide (CO2) emissions forecasts for China to 2050, as presented in Energy Technology Perspectives 2015 (ETP 2015) (IEA, 2015a). The analysis and modelling aim to identify plausible pathways, up to 2050, to shift development in the buildings sector away from current unsustainable trends to a low-carbon, energy-efficient pathway as identified in the ETP 2°C Scenario (2DS). The baseline 6°C Scenario (6DS) presented below assumes no energy efficiency or CO2 abatement measures are implemented beyond current policy measures (i.e. a business-as-usual scenario), whereas the 2DS puts forward a pathway that gives at least a 50% chance of limiting mean global temperature rise to 2°C.
ETP energy consumption and savings forecasts
Total energy consumption in the Chinese buildings sector reaches 31 exajoules (EJ) in 2050 under the 6DS and 22 EJ in the 2DS (Figure 23). Under the 6DS, electricity is the largest energy source in 2050, accounting for over 40% of total energy use in buildings and growing at roughly 3.5% annually between 2012 and 2050. Natural gas also accounts for an increasing share of buildings energy use, rising more than three-fold to 2050. Biofuels and waste, used mainly for heating and cooking, decrease to 3.1 EJ in 2050, or about 45% below current levels. Oil and coal decline by nearly 20%.
Under the 2DS, energy consumption is 21% higher in 2050 than that in 2012, despite energy efficiency and fuel switching measures in addition to those in the 6DS. At the same time, electricity demand is roughly 40% lower than the 6DS in 2050. Solar thermal use increases significantly and reaches 3.5 EJ in 2050, which is more than 65% higher than in the 6DS.
In the residential sub-sector, space and water heating continue to dominate under both the 6DS and 2DS in 2050, accounting for a little less than half of household energy use in both scenarios. Energy consumption for space cooling increases considerably as incomes rise, while average household energy intensity, in terms of annual kilowatt hours (kWh) per household, increases by about 15% by 2050 over 2012 levels in the 6DS. Under the 2DS, residential energy intensity decreases by 20% by 2050 over 2012 levels, as a result of energy efficiency improvements and fuel switching.
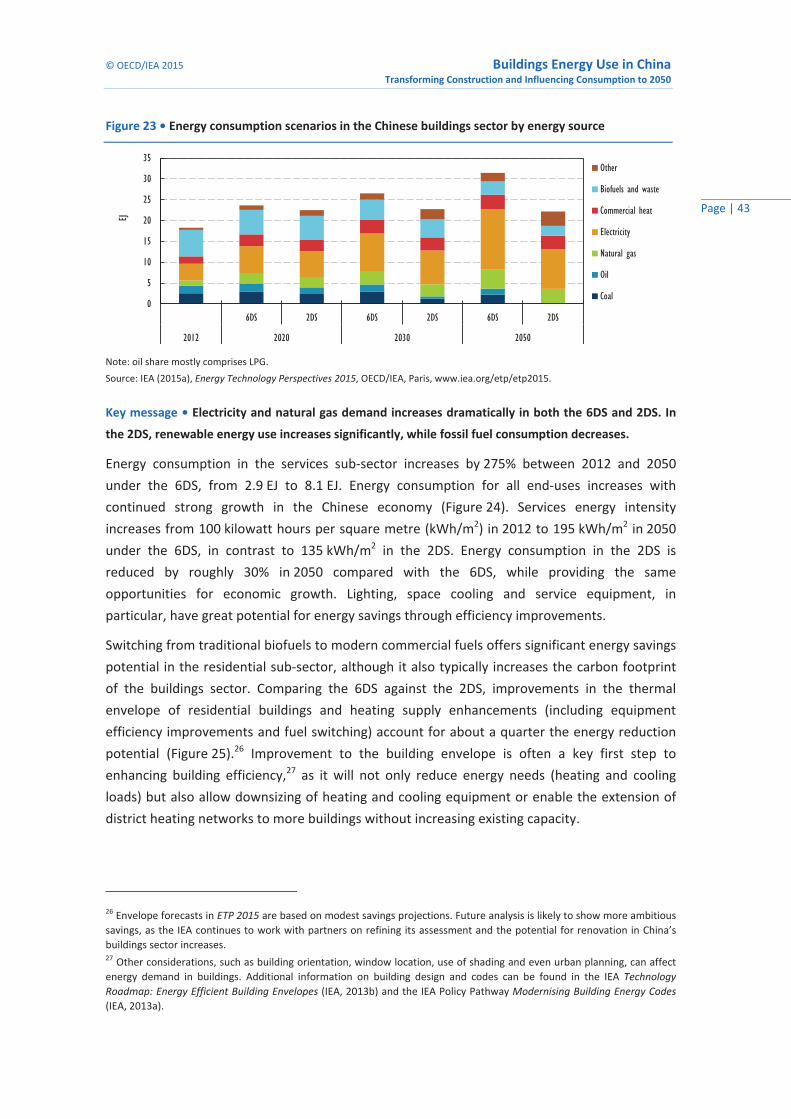
© OECD/IEA 2015 Buildings Energy Use in China Transforming Construction and Influencing Consumption to 2050
Page | 43
Figure 23 • Energy consumption scenarios in the Chinese buildings sector by energy source
Note: oil share mostly comprises LPG. Source: IEA (2015a), Energy Technology Perspectives 2015, OECD/IEA, Paris, www.iea.org/etp/etp2015.
Key message • Electricity and natural gas demand increases dramatically in both the 6DS and 2DS. In
the 2DS, renewable energy use increases significantly, while fossil fuel consumption decreases.
Energy consumption in the services sub-sector increases by 275% between 2012 and 2050 under the 6DS, from 2.9 EJ to 8.1 EJ. Energy consumption for all end-uses increases with continued strong growth in the Chinese economy (Figure 24). Services energy intensity increases from 100 kilowatt hours per square metre (kWh/m2) in 2012 to 195 kWh/m2 in 2050 under the 6DS, in contrast to 135 kWh/m2 in the 2DS. Energy consumption in the 2DS is reduced by roughly 30% in 2050 compared with the 6DS, while providing the same opportunities for economic growth. Lighting, space cooling and service equipment, in particular, have great potential for energy savings through efficiency improvements.
Switching from traditional biofuels to modern commercial fuels offers significant energy savings potential in the residential sub-sector, although it also typically increases the carbon footprint of the buildings sector. Comparing the 6DS against the 2DS, improvements in the thermal envelope of residential buildings and heating supply enhancements (including equipment efficiency improvements and fuel switching) account for about a quarter the energy reduction potential (Figure 25).26 Improvement to the building envelope is often a key first step to enhancing building efficiency,27 as it will not only reduce energy needs (heating and cooling loads) but also allow downsizing of heating and cooling equipment or enable the extension of district heating networks to more buildings without increasing existing capacity.
26 Envelope forecasts in ETP 2015 are based on modest savings projections. Future analysis is likely to show more ambitious savings, as the IEA continues to work with partners on refining its assessment and the potential for renovation in China’s buildings sector increases. 27 Other considerations, such as building orientation, window location, use of shading and even urban planning, can affect energy demand in buildings. Additional information on building design and codes can be found in the IEA Technology Roadmap: Energy Efficient Building Envelopes (IEA, 2013b) and the IEA Policy Pathway Modernising Building Energy Codes (IEA, 2013a).
0
5
10
15
20
25
30
35
6DS 2DS 6DS 2DS 6DS 2DS
2012 2020 2030 2050
EJ
Other
Biofuels and waste
Commercial heat
Electricity
Natural gas
Oil
Coal
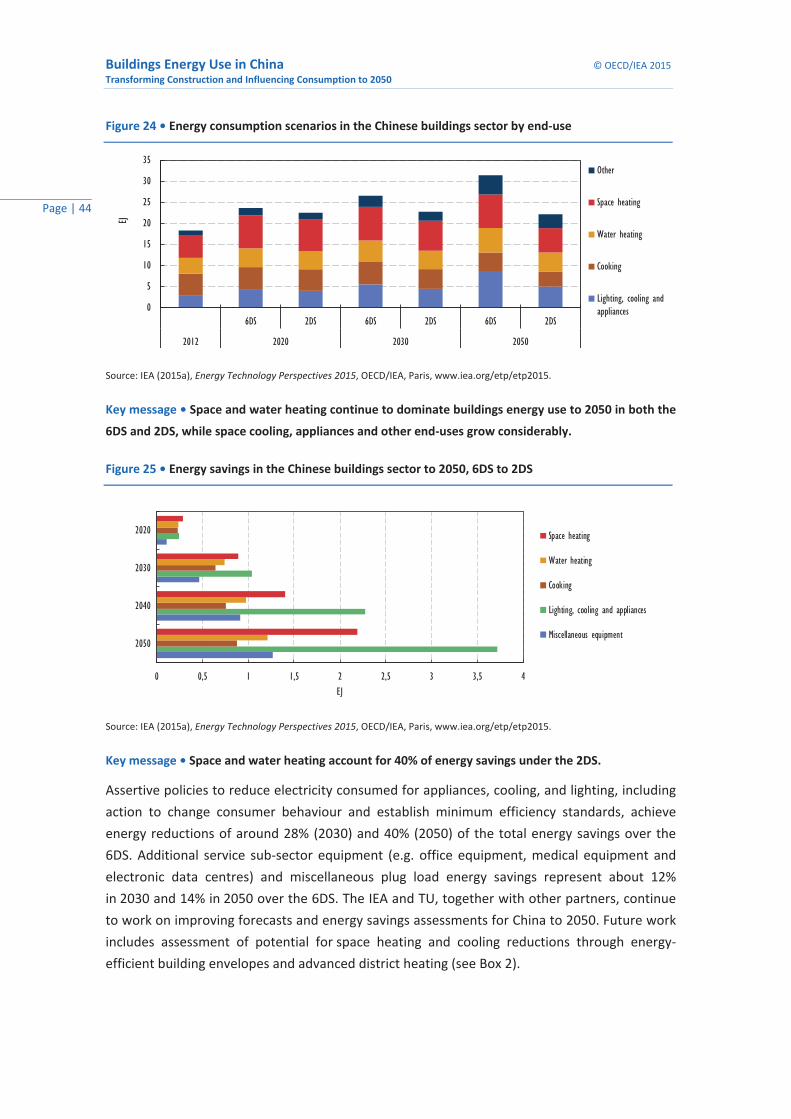
Buildings Energy Use in China © OECD/IEA 2015 Transforming Construction and Influencing Consumption to 2050
Page | 44
Figure 24 • Energy consumption scenarios in the Chinese buildings sector by end-use
Source: IEA (2015a), Energy Technology Perspectives 2015, OECD/IEA, Paris, www.iea.org/etp/etp2015.
Key message • Space and water heating continue to dominate buildings energy use to 2050 in both the
6DS and 2DS, while space cooling, appliances and other end-uses grow considerably.
Figure 25 • Energy savings in the Chinese buildings sector to 2050, 6DS to 2DS
0 0,5 1 1,5 2 2,5 3 3,5 4
2050
2040
2030
2020
EJ
Space heating
Water heating
Cooking
Lighting, cooling and appliances
Miscellaneous equipment
Source: IEA (2015a), Energy Technology Perspectives 2015, OECD/IEA, Paris, www.iea.org/etp/etp2015.
Key message • Space and water heating account for 40% of energy savings under the 2DS.
Assertive policies to reduce electricity consumed for appliances, cooling, and lighting, including action to change consumer behaviour and establish minimum efficiency standards, achieve energy reductions of around 28% (2030) and 40% (2050) of the total energy savings over the 6DS. Additional service sub-sector equipment (e.g. office equipment, medical equipment and electronic data centres) and miscellaneous plug load energy savings represent about 12% in 2030 and 14% in 2050 over the 6DS. The IEA and TU, together with other partners, continue to work on improving forecasts and energy savings assessments for China to 2050. Future work includes assessment of potential for space heating and cooling reductions through energy-efficient building envelopes and advanced district heating (see Box 2).
0
5
10
15
20
25
30
35
6DS 2DS 6DS 2DS 6DS 2DS
2012 2020 2030 2050
EJ
Other
Space heating
Water heating
Cooking
Lighting, cooling andappliances
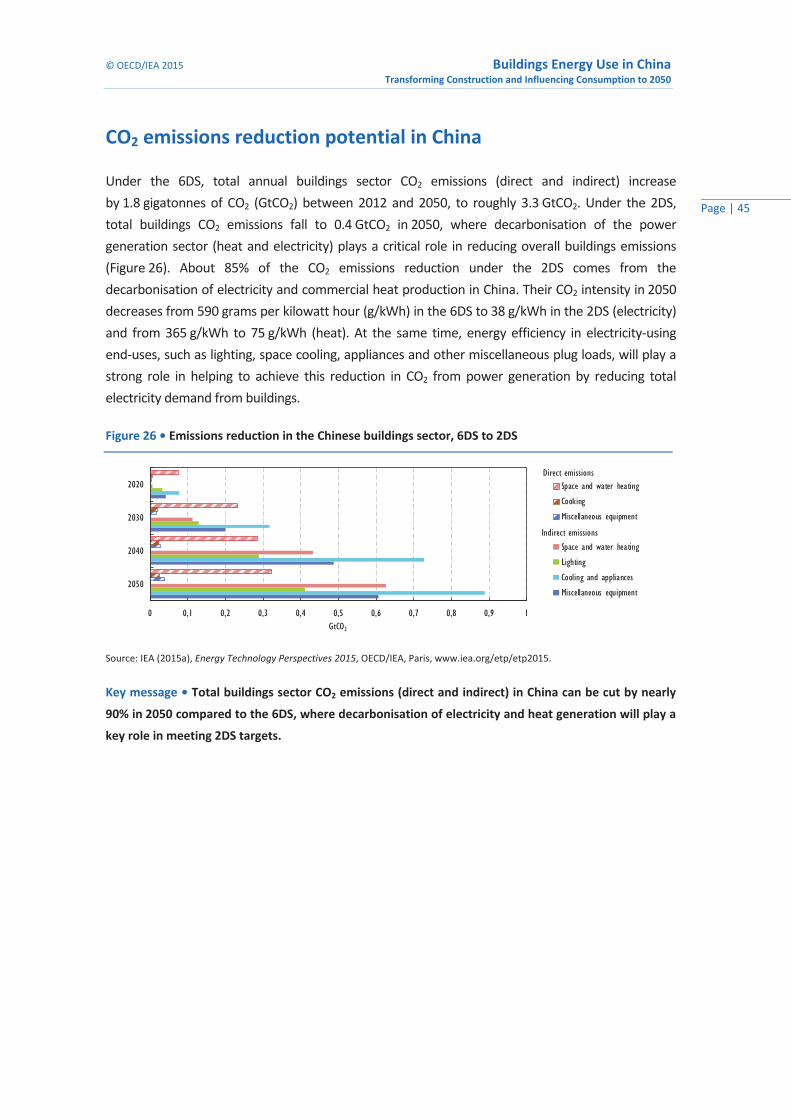
© OECD/IEA 2015 Buildings Energy Use in China Transforming Construction and Influencing Consumption to 2050
Page | 45
CO2 emissions reduction potential in China
Under the 6DS, total annual buildings sector CO2 emissions (direct and indirect) increase by 1.8 gigatonnes of CO2 (GtCO2) between 2012 and 2050, to roughly 3.3 GtCO2. Under the 2DS, total buildings CO2 emissions fall to 0.4 GtCO2 in 2050, where decarbonisation of the power generation sector (heat and electricity) plays a critical role in reducing overall buildings emissions (Figure 26). About 85% of the CO2 emissions reduction under the 2DS comes from the decarbonisation of electricity and commercial heat production in China. Their CO2 intensity in 2050 decreases from 590 grams per kilowatt hour (g/kWh) in the 6DS to 38 g/kWh in the 2DS (electricity) and from 365 g/kWh to 75 g/kWh (heat). At the same time, energy efficiency in electricity-using end-uses, such as lighting, space cooling, appliances and other miscellaneous plug loads, will play a strong role in helping to achieve this reduction in CO2 from power generation by reducing total electricity demand from buildings.
Figure 26 • Emissions reduction in the Chinese buildings sector, 6DS to 2DS
0 0,1 0,2 0,3 0,4 0,5 0,6 0,7 0,8 0,9 1
2050
2040
2030
2020
GtCO2
Space and water heating
Cooking
Miscellaneous equipment
Space and water heating
Lighting
Cooling and appliances
Miscellaneous equipment
Direct emissions
Indirect emissions
Source: IEA (2015a), Energy Technology Perspectives 2015, OECD/IEA, Paris, www.iea.org/etp/etp2015.
Key message • Total buildings sector CO2 emissions (direct and indirect) in China can be cut by nearly
90% in 2050 compared to the 6DS, where decarbonisation of electricity and heat generation will play a
key role in meeting 2DS targets.

Buildings Energy Use in China © OECD/IEA 2015 Transforming Construction and Influencing Consumption to 2050
Page | 46
Buildings policies and technologies
Current energy and development policies in China
The Chinese government attaches great importance to energy savings and carbon dioxide (CO2) emissions, a position underscored in the Energy Conservation and Emission Reduction Plan announced as part of basic national policy in 2009. Ambitions to limit total energy consumption were similarly announced in 2013 under the 12th Five-Year Energy Development Plan (State Council, 2013a). The 12th Five-Year Plan is the first time the Chinese government has announced that total energy use across the entire economy should be limited. The plan aims to reduce annual energy consumption in China by 4.0 billion tonnes of coal equivalent (TCE) (117 exajoules [EJ]), including 0.34 billion TCE (10 EJ) of imported energy, by 2015. Annual electricity consumption is targeted to be less than 6 150 terawatt hours (TWh) (22 EJ). These targets for energy use and electricity consumption have been split across China’s provinces; although no specific sectorial targets have been designated (e.g. buildings energy use limits were not specified).
The National Plan on Climate Change (2014-20) aims to reduce national CO2 emissions per unit of GDP by between 40% and 45% by 2020 compared with 2005 levels (NDRC, 2014). Buildings sector CO2 emissions per unit of GDP already decreased by approximately 11% between 2005 and 2012. In 2014, President Xi Jinping announced additional ambitions to cap greenhouse gas emissions by 2030 or earlier, while also increasing the share of non-fossil fuels in primary energy consumption to around 20% by 2030 (Xinhuanet, 2014). These ambitions are expected to affect future energy policy development, as are related policies on energy action plans and urbanisation, described below.
Energy Development Strategy Action Plan
China’s State Council unveiled its Energy Development Strategy Action Plan in 2014, creating a roadmap for China’s energy use and development from 2014 to 2020. According to the plan, China will cap its annual primary energy consumption to 4.8 billion TCE (141 EJ) (State Council, 2014a). Consequently, China’s energy sector should only grow by 3.5% or less each year until 2020. The plan also announced a goal of capping total coal use at roughly 4.2 billion TCE (roughly 123 EJ) by 2020. As a result, China is expected to limit its coal use to roughly 15% above 2013 levels before reaching the targeted cap.
New national urbanisation plan
In April 2014, the Central Committee of the Communist Party of China and the State Council officially issued the National Plan on New Urbanisation for 2014 to 2020 (State Council, 2014b).
© OECD/IEA 2015 Buildings Energy Use in China Transforming Construction and Influencing Consumption to 2050
Page | 47
It is a macroscopic, strategic plan on urban development priorities and is the first plan on urbanisation in China enacted by the central authorities. The plan stresses ecological conservation and notes that China should: promote green and low-carbon development; conserve water, land, energy and other resources and use them efficiently; intensify ecological restoration and environmental treatment; promote the development of green cities and smart cities; and encourage sustainable lifestyles and low-carbon city construction, operation and management methods.
Current buildings sector policies
The buildings sector will play an important role in meeting China’s objectives on energy conservation and emissions reduction. The Chinese government has instituted new policies to promote building energy conservation, including buildings requirements under the objectives for an “Ecological Civilisation”. For example, the Law on Energy Conservation was adopted in October 2007 (became effective April 2008), applied new regulations on buildings energy conservation, particularly in Northern China and for residential buildings. A series of building energy conservation standards for new buildings also took effect in recent years, including the energy efficiency design standard for public buildings (GB, 2005), and residential buildings in cold and several cold zones (GB, 2010a), in hot summer and cold winter zones (GB, 2010b) and in hot summer and warm winter zones (GB, 2012).
The 12th Five-Year Plan for Building Energy Conservation
The 12th Energy Development Five-Year Plan underscored that there are several major challenges for China’s development, including resource constraints, energy security and environmental quality. In the buildings sector, a similar plan for buildings energy conservation was released in May 2012 by the Ministry of Housing and Urban-Rural Development (MOHURD, 2012). This plan, the 12th Five-Year Plan for Building Energy Conservation, set targets and pathways for buildings energy conservation from 2010 to 2015, including implementation of mandatory standards for new construction, green building demonstration and development, and renovation of existing building stocks (Table 3). These objectives and targets expanded on previous work done under the 11th Five-Year Building Energy Conservation Plan, including significant growth of the green buildings programme and expansion of energy retrofits from Northern China to the temperate and hot climate zones in the south. While the 12th Energy Development Five-Year Plan sets macro economy-wide energy caps, the 12th Five-Year Plan on Building Energy Conservation does not set a cap or target for total buildings energy use.
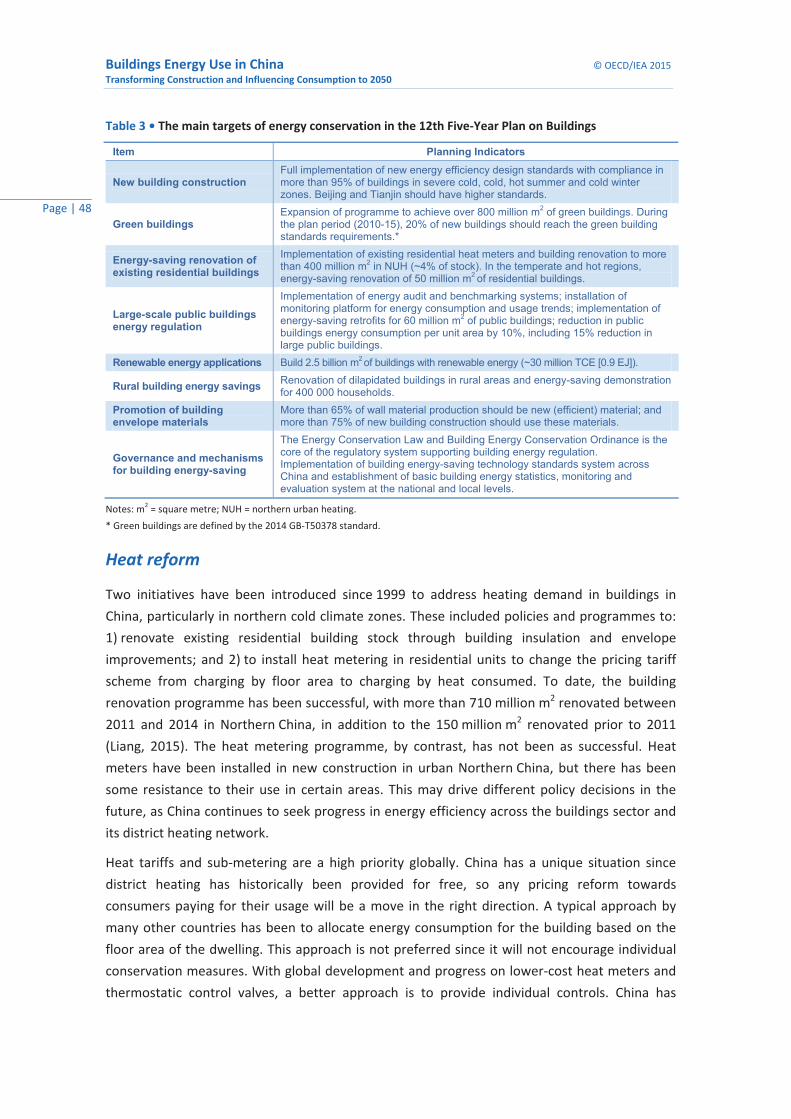
Buildings Energy Use in China © OECD/IEA 2015 Transforming Construction and Influencing Consumption to 2050
Page | 48
Table 3 • The main targets of energy conservation in the 12th Five-Year Plan on Buildings
Item Planning Indicators
New building construction Full implementation of new energy efficiency design standards with compliance in more than 95% of buildings in severe cold, cold, hot summer and cold winter zones. Beijing and Tianjin should have higher standards.
Green buildings Expansion of programme to achieve over 800 million m2 of green buildings. During the plan period (2010-15), 20% of new buildings should reach the green building standards requirements.*
Energy-saving renovation of existing residential buildings
Implementation of existing residential heat meters and building renovation to more than 400 million m2 in NUH (~4% of stock). In the temperate and hot regions, energy-saving renovation of 50 million m2 of residential buildings.
Large-scale public buildings energy regulation
Implementation of energy audit and benchmarking systems; installation of monitoring platform for energy consumption and usage trends; implementation of energy-saving retrofits for 60 million m2 of public buildings; reduction in public buildings energy consumption per unit area by 10%, including 15% reduction in large public buildings.
Renewable energy applications Build 2.5 billion m2 of buildings with renewable energy (~30 million TCE [0.9 EJ]).
Rural building energy savings Renovation of dilapidated buildings in rural areas and energy-saving demonstration for 400 000 households.
Promotion of building envelope materials
More than 65% of wall material production should be new (efficient) material; and more than 75% of new building construction should use these materials.
Governance and mechanisms for building energy-saving
The Energy Conservation Law and Building Energy Conservation Ordinance is the core of the regulatory system supporting building energy regulation. Implementation of building energy-saving technology standards system across China and establishment of basic building energy statistics, monitoring and evaluation system at the national and local levels.
Notes: m2 = square metre; NUH = northern urban heating. * Green buildings are defined by the 2014 GB-T50378 standard.
Heat reform
Two initiatives have been introduced since 1999 to address heating demand in buildings in China, particularly in northern cold climate zones. These included policies and programmes to: 1) renovate existing residential building stock through building insulation and envelope improvements; and 2) to install heat metering in residential units to change the pricing tariff scheme from charging by floor area to charging by heat consumed. To date, the building renovation programme has been successful, with more than 710 million m2 renovated between 2011 and 2014 in Northern China, in addition to the 150 million m2 renovated prior to 2011 (Liang, 2015). The heat metering programme, by contrast, has not been as successful. Heat meters have been installed in new construction in urban Northern China, but there has been some resistance to their use in certain areas. This may drive different policy decisions in the future, as China continues to seek progress in energy efficiency across the buildings sector and its district heating network.
Heat tariffs and sub-metering are a high priority globally. China has a unique situation since district heating has historically been provided for free, so any pricing reform towards consumers paying for their usage will be a move in the right direction. A typical approach by many other countries has been to allocate energy consumption for the building based on the floor area of the dwelling. This approach is not preferred since it will not encourage individual conservation measures. With global development and progress on lower-cost heat meters and thermostatic control valves, a better approach is to provide individual controls. China has
© OECD/IEA 2015 Buildings Energy Use in China Transforming Construction and Influencing Consumption to 2050
Page | 49
pursued the installation of individual heat sub-metering since 2003, but more policy and pricing mechanism analysis is needed to encourage broad market uptake (TU, 2011); (TU, 2015). However, there may be other approaches in the interim since the implementation requirements are challenging, and this area should be further studied.
China announced a Green Building Action Plan in 2013 to promote the development of energy-efficient buildings throughout China (Box 5). A new Green Building Evaluation Standard (GB-T50378-2014) was also created in 2014 (implemented in January 2015) to address building system efficiency, heat recovery and waste heat use, and renewable energy implementation. Under the new standard, buildings are evaluated for energy system efficiency by comparison with the energy efficiency design standards for public buildings (GB, 2005). Heat recovery of exhaust air and waste heat is encouraged for space conditioning, and renewable energy use is promoted. Using this evaluation standard, buildings are given a rating, where greater use of efficiency measures and renewable energy is awarded a higher score. However, no specific criteria have been set for real energy consumption, so there is a risk that buildings could score a high rating but still have high levels of energy consumption.
Box 5 • China’s Green Building Action Plan
In January 2013, the State Council approved the Green Building Action Plan created by the
National Development and Reform Commission and MOHURD. The plan emphasises the
importance of implementing sustainable buildings to: 1) promote the integration of ecological
progress into urban and rural construction; 2) seize the “whole-building life cycle” concept;
3) push forward the Green Building Action Plan; and 4) accelerate the creation of a resource-
saving and environmentally friendly society by implementing policies and regulations,
institutional mechanisms, planning, standardised criteria, technology promotion, construction
and operation, and industry support (MOHURD, 2014).
The action plan focuses on new building construction and retrofitting of existing buildings.
Compared with previous objectives under the 12th Five-Year Plan, the new plan increased the goal
of new green construction from 0.8 billion to 1 billion m2, while the target for retrofitting existing
public buildings increased from 60 million to 120 million m2. The plan did not identify specific
buildings energy savings targets, although it stressed the need to address the resources used
throughout the building life cycle. The action plan would achieve better integration with the spirit of
the 18th Party (ecological construction) if it included measures to limit actual energy consumption.
Two points are worth noting from the action plan. First, it seeks to actively encourage green rural
housing construction by promoting the application of solar thermal technology, building envelope
insulation, fuel-saving stoves, energy-saving kangs and more efficient utilisation of biofuels. Second,
the plan implemented a building demolition management procedure to avoid illegal demolition
processes, extend the life cycle of buildings, save construction materials and decrease building
materials production and energy consumption. This should help to reduce the total life-cycle
resource consumption of buildings in China.
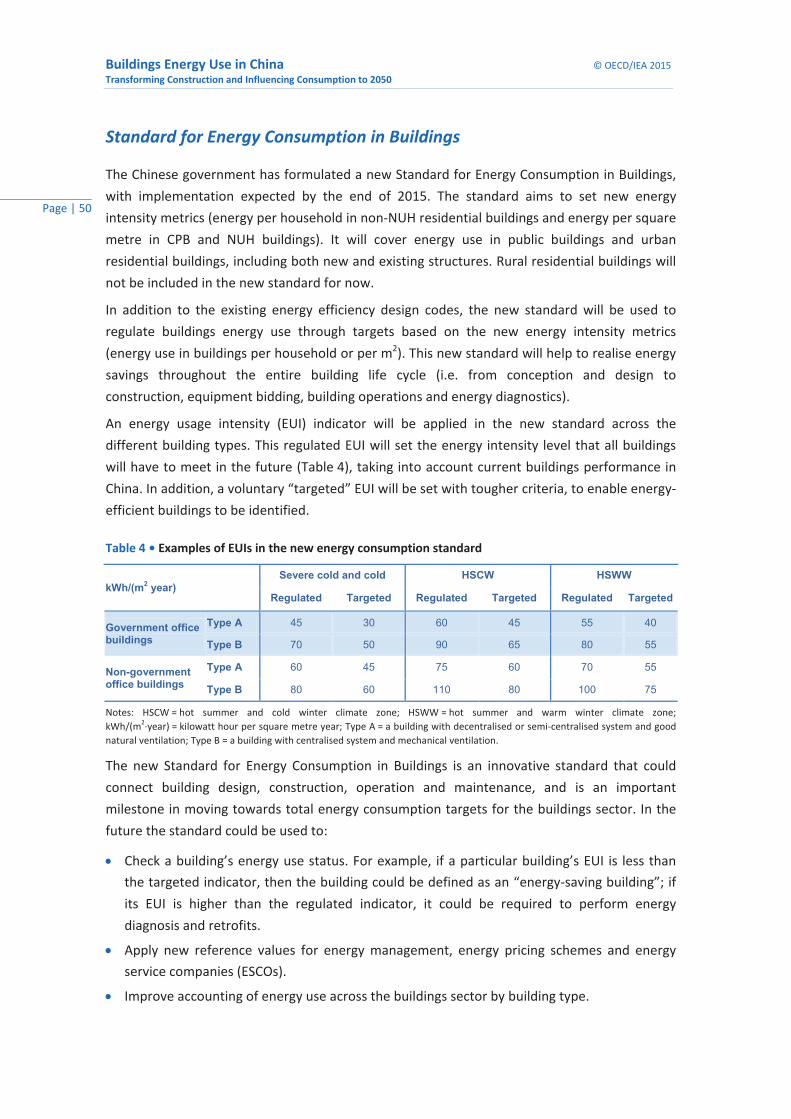
Buildings Energy Use in China © OECD/IEA 2015 Transforming Construction and Influencing Consumption to 2050
Page | 50
Standard for Energy Consumption in Buildings
The Chinese government has formulated a new Standard for Energy Consumption in Buildings, with implementation expected by the end of 2015. The standard aims to set new energy intensity metrics (energy per household in non-NUH residential buildings and energy per square metre in CPB and NUH buildings). It will cover energy use in public buildings and urban residential buildings, including both new and existing structures. Rural residential buildings will not be included in the new standard for now.
In addition to the existing energy efficiency design codes, the new standard will be used to regulate buildings energy use through targets based on the new energy intensity metrics (energy use in buildings per household or per m2). This new standard will help to realise energy savings throughout the entire building life cycle (i.e. from conception and design to construction, equipment bidding, building operations and energy diagnostics).
An energy usage intensity (EUI) indicator will be applied in the new standard across the different building types. This regulated EUI will set the energy intensity level that all buildings will have to meet in the future (Table 4), taking into account current buildings performance in China. In addition, a voluntary “targeted” EUI will be set with tougher criteria, to enable energy-efficient buildings to be identified.
Table 4 • Examples of EUIs in the new energy consumption standard
kWh/(m2 year) Severe cold and cold HSCW HSWW
Regulated Targeted Regulated Targeted Regulated Targeted
Government office buildings
Type A 45 30 60 45 55 40
Type B 70 50 90 65 80 55
Non-government office buildings
Type A 60 45 75 60 70 55
Type B 80 60 110 80 100 75
Notes: HSCW = hot summer and cold winter climate zone; HSWW = hot summer and warm winter climate zone; kWh/(m2·year) = kilowatt hour per square metre year; Type A = a building with decentralised or semi-centralised system and good natural ventilation; Type B = a building with centralised system and mechanical ventilation.
The new Standard for Energy Consumption in Buildings is an innovative standard that could connect building design, construction, operation and maintenance, and is an important milestone in moving towards total energy consumption targets for the buildings sector. In the future the standard could be used to:
• Check a building’s energy use status. For example, if a particular building’s EUI is less than the targeted indicator, then the building could be defined as an “energy-saving building”; if its EUI is higher than the regulated indicator, it could be required to perform energy diagnosis and retrofits.
• Apply new reference values for energy management, energy pricing schemes and energy service companies (ESCOs).
• Improve accounting of energy use across the buildings sector by building type.

© OECD/IEA 2015 Buildings Energy Use in China Transforming Construction and Influencing Consumption to 2050
Page | 51
Tiered energy prices for residential sector
In 2006, China initiated a pilot project to implement tiered pricing tariffs (increasing marginal rates) on residential electricity and gas prices for several provinces. In July 2012, China published an implementation plan for a tiered electricity pricing scheme for the entire country, based on the economy, climate and wealth of each province and city. Several provinces also include tiered gas pricing. The new pricing scheme is intended to target the top 20% of the population as measured by energy consumption, meaning that most families not using significant amounts of energy will not be affected unless they increase their electricity consumption.
Unlike in most wealthy countries, the tiered pricing schemes can be very aggressive. For example Shanghai’s electricity price schedule increases by 10% after an initial 3 120 kilowatt hours (kWh) electricity per year (equivalent to 260 kWh/month) with a further increase of 48% if electricity consumption exceeds 4 800 kWh/year (equivalent to 400 kWh/month) (Table 5) (MDRC, 2012). Similarly, gas pricing can go up by 40%.
Comparing the price of energy in China against personal income or GDP per capita, energy expenditure represents a much greater share of disposable income or wealth than in wealthier countries. This is an assertive policy tool that will enable the Standard for Energy Consumption in Buildings to be effective, and is one of the most important policies in the residential sector to limit energy consumption growth. While further study is needed on this subject, other countries could learn from this approach to pricing, especially when electricity energy consumption in wealthy countries is typically four- to ten-times greater per capita than in China (see Annex C).
Table 5 • Shanghai’s tiered energy price tariff
Annual electricity consumption (kWh/year)
Electricity price for 06:00 - 22:00 (CNY/kWh)
Increase Electricity price for
other period (CNY/kWh)
Increase
0~3 120 0.617 - 0.307 -
3 120~4 800 0.677 10% 0.337 10%
>4 800 0.977 58% 0.487 59%
Annual gas consumption (m3/year)
Gas price (CNY/m3)
Increase
0~310 3.00 -
310~520 3.30 10%
>520 4.20 40%
Notes: m3 = cubic metre; this tariff schedule represents pricing for smart meters which are common in Shanghai; however, the tariffs for conventional meters are very similar except that they do not offer lower night-time rates and the highest tier is about 10% lower.
Buildings Energy Use in China © OECD/IEA 2015 Transforming Construction and Influencing Consumption to 2050
Page | 52
Recommended policies and technologies for China
The importance of energy consumption in the buildings sector in China cannot be understated, as its large population and rapidly emerging economy continue to influence energy choices and trends. A broad array of policies has been put in place in recent years to influence the buildings market in China. Nevertheless, the high rate of growth in building construction and demand for greater energy services that come with increased wealth have continued to drive buildings energy consumption higher. Since it is expected that China will continue to see robust levels of construction over the next decade or two, implementation of policies to improve the efficiency of buildings throughout the country as rapidly as possible is important. With recent concerns about lower economic output, adding value through more efficient buildings could lead to greater economic productivity, jobs and prosperity along with lower growth in energy consumption.
To achieve long-term energy and CO2 emission reductions in the buildings sector, TU BERC has recommended the possible use of an energy target for the buildings sector (e.g. a targeted cap on energy consumption by buildings or a sector-wide energy efficiency target). This type of target could help to increase the authority and determination of policy makers to establish mandatory policies in the buildings sector, as policies in China to date have been limited to segments of the buildings market (e.g. targets for new green building development). Setting a central target for the buildings sector (similar to the energy sector caps announced under the 12th Five-Year Plan) could help to drive subsequent policy decisions and establish an overarching vision and metric for China’s buildings.
In 2013, the IEA issued a comprehensive publication, Transition to Sustainable Buildings: Strategies and Opportunities to 2050 (IEA, 2013c), which provided detailed technology chapters addressing: building envelopes; heating and cooling; and lighting, cooking and appliances. It also included a detailed policy chapter describing various policies to transform markets and to shift towards a more efficient buildings sector. With respect to China, the publication highlighted two critical technology areas that merit further attention (advanced building envelopes for cold climates and heat pumps) and two important areas for policy action (appliance and equipment standards, and building codes with supporting infrastructure).
TU BERC has also published an Annual Report on China’s Building Energy Efficiency since 2007, providing detailed current status updates, concept debates and technology policy recommendations across China’s four major buildings sub-sectors (NUH [2011, 2015 editions], CPB [commercial and public buildings] [2010, 2014 editions], urban residential [2013] and rural residential [2012]). These annual reports highlight key issues in China’s buildings sector and debate contentious topics, such as suitable technology-related policy options to address building occupant behaviour. The reports also underscore top-level priorities to address China’s buildings energy consumption, including buildings sector energy caps and target intensities as important policy suggestions.

© OECD/IEA 2015 Buildings Energy Use in China Transforming Construction and Influencing Consumption to 2050
Page | 53
The following sections outline four key areas of technology-related policy action for China’s buildings sector: 1) guiding the construction markets towards efficient buildings; 2) consumer demand and efficient equipment; 3) data and benchmarking to support energy efficiency and policy; and 4) beyond global policy best practice. The sections are not intended to be exhaustive, as additional background material has already been published by the IEA and TU. The case can certainly be made for additional measures, but the IEA and TU believe these recommendations provide a core set of areas for high-level priority consideration.
Guiding the construction market towards efficient buildings
A key goal for China is to transform its construction market and guide it towards high-performance energy-efficient buildings, with long-term targets for zero-energy buildings (Figure 27). Typical construction methods across China (e.g. in smaller cities) continue to produce poorly performing building envelopes, with single-glazed clear windows, little or no insulation and high rates of air leakage. The immediate priority should therefore be to raise construction standards across all of China, to levels comparable with those producing code-compliant buildings today in Canada, Northern Europe or the Northern United States.28 This includes requirements for low-e double-glazed windows, high levels of insulation and air sealing.
Figure 27 • Progression of building construction from old stock to future technology
Note: R&D = research and development. Source: Adapted from IEA (2013b), Technology Roadmap on Energy Efficient Building Envelopes, OECD/IEA, Paris, www.iea.org/publications/freepublications/publication/TechnologyRoadmapEnergyEfficientBuildingEnvelopes.pdf.
Key message • China needs to shift from inefficient buildings to modern buildings with ambitious
building energy codes. R&D on key technologies and systems integration should also be a priority to
make low-energy and zero-energy buildings possible in the future.
28 This type of construction is occurring in many regions of the world, but mostly represents a limited market given the scale of global buildings construction.
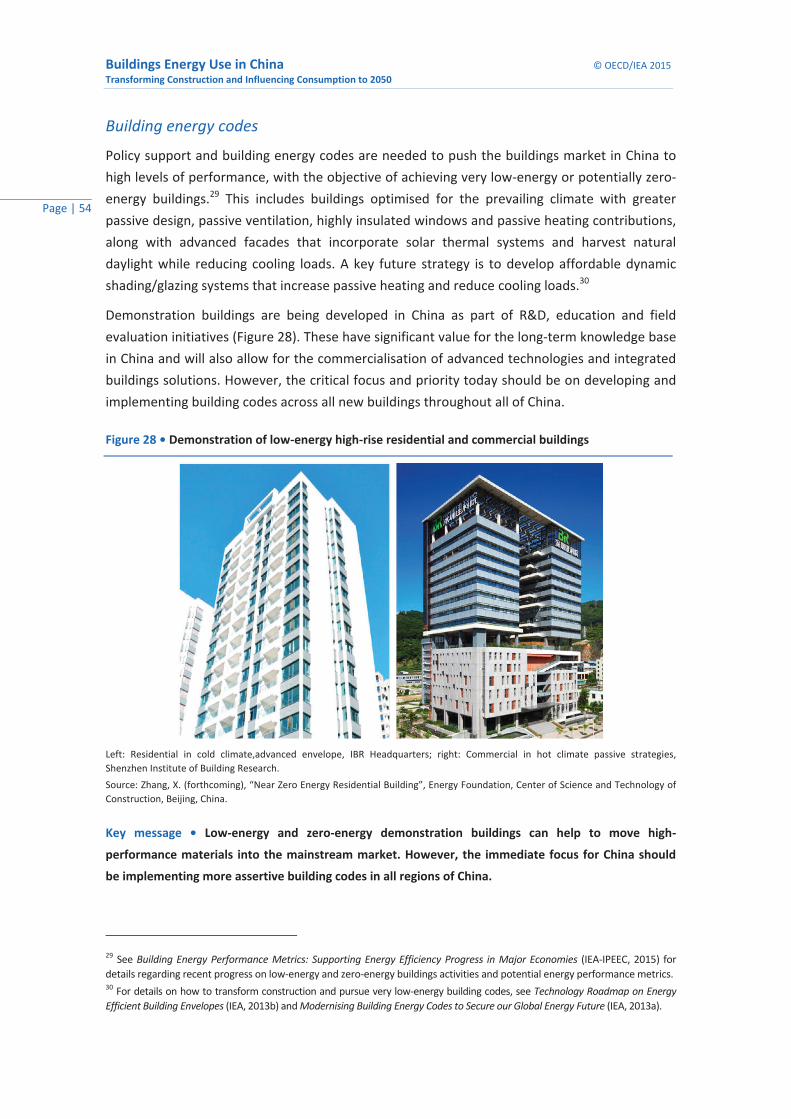
Buildings Energy Use in China © OECD/IEA 2015 Transforming Construction and Influencing Consumption to 2050
Page | 54
Building energy codes
Policy support and building energy codes are needed to push the buildings market in China to high levels of performance, with the objective of achieving very low-energy or potentially zero-energy buildings.29 This includes buildings optimised for the prevailing climate with greater passive design, passive ventilation, highly insulated windows and passive heating contributions, along with advanced facades that incorporate solar thermal systems and harvest natural daylight while reducing cooling loads. A key future strategy is to develop affordable dynamic shading/glazing systems that increase passive heating and reduce cooling loads.30
Demonstration buildings are being developed in China as part of R&D, education and field evaluation initiatives (Figure 28). These have significant value for the long-term knowledge base in China and will also allow for the commercialisation of advanced technologies and integrated buildings solutions. However, the critical focus and priority today should be on developing and implementing building codes across all new buildings throughout all of China.
Figure 28 • Demonstration of low-energy high-rise residential and commercial buildings
Left: Residential in cold climate,advanced envelope, IBR Headquarters; right: Commercial in hot climate passive strategies, Shenzhen Institute of Building Research. Source: Zhang, X. (forthcoming), “Near Zero Energy Residential Building”, Energy Foundation, Center of Science and Technology of Construction, Beijing, China.
Key message • Low-energy and zero-energy demonstration buildings can help to move high-
performance materials into the mainstream market. However, the immediate focus for China should
be implementing more assertive building codes in all regions of China.
29 See Building Energy Performance Metrics: Supporting Energy Efficiency Progress in Major Economies (IEA-IPEEC, 2015) for details regarding recent progress on low-energy and zero-energy buildings activities and potential energy performance metrics. 30 For details on how to transform construction and pursue very low-energy building codes, see Technology Roadmap on Energy Efficient Building Envelopes (IEA, 2013b) and Modernising Building Energy Codes to Secure our Global Energy Future (IEA, 2013a).
© OECD/IEA 2015 Buildings Energy Use in China Transforming Construction and Influencing Consumption to 2050
Page | 55
While it is widely accepted that building codes are the most effective policy instrument to influence new construction, the limitations and concerns relating to building code development in China need to be discussed. The majority of the world’s building energy codes deal with the major end-uses of energy (e.g. space heating and cooling) and the associated load resulting from materials that are used to construct the building envelope. Building energy codes sometimes include additional components, such as water heating and electric lighting standards. However, the basic focus of building energy codes is to ensure that a structure, with its core mechanical equipment, is built in accordance with the intended design to meet expected average or typical energy consumption (TEC) metric. The effectiveness of the building energy codes therefore also depends on the level of compliance, which typically requires monitoring, verification and enforcement of the policies, codes and standards (Box 6).
Box 6 • Monitoring, verification and enforcement of building codes and standards
Building energy codes requirements do not typically consider important issues such as urban density and variations in or preferences or behaviour of occupants. As a result, two identical structures, both fully compliant with the building energy code, can have large differences in energy consumption. Ideally, advanced designs should consider how a building will be used, but this is not necessarily standard practice and few countries have building energy codes requiring advanced design practice. As buildings erected in China today are expected to last at least 50 years or more, it will be critical to identify the core elements that need to be efficient, independent of the way its occupants behave. While analysis of current usage behaviour and low-energy prices may result in less stringent building energy codes, consideration has to be given for the potential impact of societal changes in the future. Therefore, investing in structures that are more efficient than fully warranted today can be seen as mitigating the risk of unexpected changes in the future.
Building codes, standards and labelling programmes are all important policy instruments to improving
energy efficiency in the buildings sector and in subsequent building end-uses (e.g. appliances).
However, these policy measures are only as effective as their compliance: monitoring, verification and
enforcement of policies are critical to achieving real energy efficiency improvements. Monitoring,
verification and enforcement (e.g. through energy performance certification) provide decision makers
with objective information on the compliance and achievements of buildings policies, which can also
help to define appropriate targets and develop supporting policy tools to achieve energy objectives.
The IEA published two policy pathways in support of developing appropriate tools for energy
efficiency programme compliance in 2010, including Energy Performance of Certification of Buildings
(IEA, 2010a) and Monitoring, Verification and Enforcement (IEA, 2010b). Additional information can
also be found in the 2013 IEA Policy Pathway on Modernising Building Energy Codes (IEA, 2013a) and
the International Partnership for Energy Efficiency Cooperation report on Building Energy Rating
Schemes: Assessing Issues and Impacts (IPEEC, 2014).
Buildings Energy Use in China © OECD/IEA 2015 Transforming Construction and Influencing Consumption to 2050
Page | 56
In general, energy performance-based building codes allocate an allowable amount of energy per unit of floor area. Often the performance-based energy budget is predicated upon a typical building configuration with prescriptive building characteristics. For example, the energy budget for a particular building may reflect a certain wall thickness with an associated amount of thermal resistance for a typically used insulation, using double-glazed low-emissivity windows with low conductive framing, an advanced heat pump, a conventional gas water heater and a specified lighting intensity.
Performance-based building code programmes have advantages and disadvantages. The advantages include flexibility to comply using a variety of approaches, which fosters creativity and construction efficiency. A related benefit is that, with increasingly stringent building codes, prescriptively specifying how someone will construct a building is less appropriate, especially when the variability associated with construction techniques is considered. A more stringent building code can be formulated by increasing the requirements without having to specify every detail.
The negative aspect of performance-based approaches is that certain building components may not be upgraded because builders find them too expensive or too cumbersome to change, leading to stagnant technological development of some products. For example, instead of investing in a high-performance building envelope, a builder may choose to specify the best possible heating, ventilation and air-conditioning (HVAC) system. While the energy budget allocation may be satisfied, this may mean inferior windows or doors, leading occupants to raise the thermostat temperature, thus using more energy than expected. Furthermore, later replacement of the HVAC equipment may not meet the high standard of the original premium equipment, thereby diminishing efficiency. Another example might be if someone uses renewable energy, such as solar thermal or photovoltaic cells, to meet their total energy budget. A subsequent owner may not replace the renewable energy system at the end of its life. Thus, it is essential that buildings being constructed achieve at least an acceptable level of energy efficiency independent of system-level activities.
A preferred solution is to apply a combination of minimum prescriptive requirements for individual elements (as generally prescribed by performance ratings), alongside whole-building performance criteria that are more stringent than the sum of the individual minimum criteria. This can ensure that a maximum level of efficiency is obtained overall, while making certain that all components are improved to at least a minimum threshold (IEA, 2013c).
Building envelopes The building envelope (also known as the building shell, fabric or enclosure) is the boundary between the conditioned interior of a building and the outdoors. The energy performance of building envelope components, including external walls, floors, roofs, ceilings, windows and doors, is critical in determining how much energy is required for heating and cooling. Energy loss through the building envelope is highly variable and depends on numerous factors, such as building age and type, climate, construction technique, orientation, geographical location and occupant behaviour (see Technology Roadmap on Energy Efficient Building Envelopes [IEA, 2013b] for detailed technical performance specification and testing protocols, etc.).
© OECD/IEA 2015 Buildings Energy Use in China Transforming Construction and Influencing Consumption to 2050
Page | 57
Of the numerous areas to focus on, certain key elements of the building envelope are a priority for China. The following sections describe them, including windows, insulation and air sealing. Additional recommendations, such as reflective surfaces, can be found in the IEA Technology Roadmap on Energy Efficient Building Envelopes (IEA, 2013b).
Windows
With a fast-growing urban population, the largest building segment in China is high-rise multi-family buildings. Generally, these buildings have much lower heat load requirements than single-family buildings because the exterior surface (building envelope) represents a small portion of each apartment. However, the glazing area within the thermal envelope represents a much greater portion (i.e. greater window-to-wall ratio). For example, typical window-to-wall ratios for single-family buildings may be 12% to 15%, whereas in some apartments the ratio might be as high as 60% or more. Installing better windows can have a dramatic impact in hot, cold and mixed climates, especially as the majority of new windows are not efficient (have low thermal performance) (IEA, 2013b).
The IEA and most government policy officers in mature economies promote whole-building performance ratings that take into account the full performance of the window system (i.e. glass, spacers and frames). Similarly, building code specifications and promotional programmes should be based on whole-window ratings (U-values). In this context, an important technology to improve window performance is low-emissivity (low-e) glass coatings. Low-e coatings act as a radiant barrier that reduce heat loss in winter and heat gain in summer. They also have varying optical properties that allow either low or high solar heat gain, tailored to heating or cooling dominated climates.31 Low-e coatings reduce heat loss through windows by around 33% to 40%, and can reduce heat gained from the sun by over 50% (IEA, 2013b).
In mature economies, window technology and markets progressed from single-glazed windows (clear glass), to double-glazed windows (clear glass), to double-glazed windows (low-e glass). Many mature economies are now pursuing triple-glazed windows (two surfaces of low-e glass). It is imperative that China “leap-frog” this development path and move from single-glazed clear glass windows to at least double-glazed low-e windows (and eventually triple-glazed low-e windows in the cold northern zones). While this could be generally implemented through whole-window U-value requirements that ensure overall performance is considered (e.g. U value of ≤ 1.8 W/m2K in accordance with ISO 15099 [IEA, 2013b]), the specific benefits of low-e glass are so critical that it needs to be targeted separately.
In 2014, the market share of low-e glass in China was 11% (RIC, 2015), up from around 1% in 2006 (PNNL, 2014). This is still low compared to Canada, Western Europe and the United States, which have market shares in the 60% to 90% range. The market share of low-e glass may already be high in Beijing, particularly on large showcase buildings, but much more effort is needed to promote
31 These terms and concepts can be complex; see Technology Roadmap on Energy Efficient Building Envelopes (IEA, 2013b) including its annexes for extensive discussion about these concepts.
Buildings Energy Use in China © OECD/IEA 2015 Transforming Construction and Influencing Consumption to 2050
Page | 58
it in all areas across China. The IEA has called for 100% market share of low-e glass globally (IEA, 2013c). While manufacturers have to respond to increased demand driven by market forces or government regulation, it is believed that the gradual growth in the low-e glass market can be significantly accelerated, as China currently has excess capacity and is exporting it. China has a great opportunity to ramp up its policies to stipulate low-e glass in all new and renovated buildings within a reasonable timeframe, and should strongly consider imposing mandatory adoption within a three- to five-year period. While low-e glass may be hard to discern from visual inspection (a potential concern for building energy code enforcement), inexpensive low-e detectors are now available for use by building code officials.
Additional window solutions would also provide significant benefits for China, including implementation of triple-glazed low-e windows for severe cold climates and zero-energy buildings. Dynamic solar control, such as exterior shading and dynamic glass, can also offer dramatic cooling load reductions beyond those provided by low-e glazing, and can offer increased passive heating contributions when designed and operated correctly (see Technology Roadmap on Energy Efficient Building Envelopes [IEA, 2013b] for detailed discussion, including window technology that can offer “energy-plus” or positive energy contributions to buildings).
Insulation
Most heat is lost from buildings through walls, roofs and floors, which represent the largest external area of most residential and services buildings. Proper insulation reduces heat loss in cold weather, keeps out excess heat in hot weather and helps maintain a comfortable indoor environment without incurring maintenance costs. The type and amount of insulation needed varies considerably according to building type. For example, many services sub-sector buildings have higher internal thermal loads because of a higher density of people, more electrical equipment and more artificial light; they may therefore need less insulation than a residential building.
Most new construction in China today has insulation, but the majority of buildings are under-insulated when environmental conditions, energy prices and the long-term nature of the measures are considered. Furthermore, improvements are needed in design, workmanship and installation technique. Significant effort is needed to increase the stringency of building energy codes in China, especially beyond large cities, including all rural areas and in heating-dominated climates (Figure 29). Building energy code compliance and enforcement are also areas of concern, and greater implementation should be considered and could benefit from further international collaboration (IPEEC, 2015).32 However, in addition to greater insulation levels and low U-values, overall building design is important. High-rise multi-family residential buildings are designed to have greater density, or a more efficient “shape coefficient”, and therefore require much lower heating demand compared to other residential building types. Consequently less stringent levels of insulation may be appropriate (TU, 2013).
32 See IEA Technology Roadmap on Energy Efficient Building Envelopes (IEA, 2013b) and its annexes for extensive details on insulation technology and policy.

© OECD/IEA 2015 Buildings Energy Use in China Transforming Construction and Influencing Consumption to 2050
Page | 59
Figure 29 • Building energy code insulation U-values by country and climate zone indexed to HDD
Notes: Chinese cities are coloured brighter with dark borders; US = United States; CZ = Climate zone (number refers to domestic zone for country); CAN = Canada; CN = China; SJZ = Shijiazhuang; BJ = Beijing; HB = Harbin; RUS = Russia; Elec./Non-Elec. refer to whether an electric resistance heating system is used as the main source of heat; lower U-values have less heat transfer or heat loss (see IEA, 2013b); HDD = heating degree days. Source: adapted from IEA (2015c), “Tracking clean energy progress 2015”, excerpt from Energy Technology Perspectives 2015, IEA Input to the Clean Energy Ministerial, OECD/IEA, Paris.
Key message • China’s building energy code requires lower insulation levels for walls and roofs
compared to mature economies. Globally, most countries need to increase insulation levels
established in building energy codes. However, with such a large share of multi-family high-rise
residential buildings, a modest lower level of insulation for the same climate zone is probably
warranted for residential buildings in China.
Air sealing
Air leakage, or normal air movement in and out of buildings (infiltration and exfiltration), is usually measured using air changes per hour (ACH). ACH is equal to the multiple of the volume of air in a structure that is exchanged with the outside at a specified pressure difference in one hour (e.g. an ACH of five would be a flow rate that equals five times the volume of the building leaking in one hour). Natural weather conditions, such as wind and temperature differences, can increase air leakage. Air-distributed heating and cooling systems can also increase air leakage if they create pressure differences between the inside and outside of a building.
Globally, much more effort is needed to implement air sealing so that air leakage is reduced, particularly as it can reduce heating, cooling and ventilation energy consumption by as much as 30%. Large variations exist among building practices and existing building stocks across the globe,
0
2 000
4 000
6 000
8 000
10 000
12 000
0.00.10.20.30.40.50.60.7
Sweden(Elec)
Sweden(Non-Elec)
CN-SJZ US-CZ6 CAN-CZ6 RUS-CZ3 CN-BJ US-CZ8 CAN-CZ8 RUS-CZ5 CN-HB
HDD
(18°
C)
u-valu
es (W
/m2 K)
Walls
0
2 000
4 000
6 000
8 000
10 000
12 000
0.0
0.1
0.2
0.3
0.4
0.5
0.6
Sweden(Elec)
Sweden(Non-Elec)
CN-SJZ US-CZ6 CAN-CZ6 RUS-CZ3 CN-BJ US-CZ8 CAN-CZ8 RUS-CZ5 CN-HB
HDD
(18°
C)
u-valu
es (W
/m2 K)
Roofs
Residential Services HDD (18°C)

Buildings Energy Use in China © OECD/IEA 2015 Transforming Construction and Influencing Consumption to 2050
Page | 60
including across buildings in China (Figure 30). While air leakage may not be a critical requirement for moderate climates that do not require the use of heating and cooling systems, it warrants a high priority for any building that will have space conditioning systems installed. More information on air leakage can be found in the IEA Technology Roadmap on Energy Efficient Building Envelopes (IEA, 2013b).
Figure 30 • Comparison of building energy code requirements and existing air leakage rates
Note: ACH at 50 Pascal. Source: adapted from IEA (2015c), “Tracking clean energy progress 2015”, excerpt from Energy Technology Perspectives 2015, IEA Input to the Clean Energy Ministerial, OECD/IEA, Paris.
Key message • China needs to ensure that air leakage tests and proper sealing are part of typical
construction and renovation construction practices.
Consumer demand and efficient equipment
While it is well known that mandatory policies can be very effective, a full range of activities and policies are available to influence consumer behaviour. Conservation has been at the core of many of China’s energy policies. As increasing wealth and the desire for more amenities, services and comfort continue to increase, it is expected that energy demand will continue to grow. A key consideration for policy makers is simultaneously to educate consumers about more efficient options to achieve their desired levels of quality of life, while also implementing policies that will promote energy conservation.
One of the most effective policy tools is to increase the tariffs on energy consumption so that consumers decide to be more conscientious about how much energy they consume. Europe and Japan have some of the highest energy prices in the world, and when combined with proper information, such as energy performance labels, consumers have responded by purchasing more efficient equipment.
Another effective approach to tariffs is to establish pricing tiers that increase above a certain allocation of energy per month. These are intended to curb energy consumption. A new area of interest is the installation of electricity meters with real-time pricing, which are intended to enable
0
2
4
6
8
10
12
Best practice Passivhaus Without ventilation With ventilation Cold climate Hot climate Inefficientold stock
Sweden United States
Voluntary Mandatory building codes
ACH
up to 20
© OECD/IEA 2015 Buildings Energy Use in China Transforming Construction and Influencing Consumption to 2050
Page | 61
consumer demand-response. These programmes are predominantly intended to address peak electricity demand, and can be beneficial in encouraging energy conservation when large quantities of renewable power are being managed. This subject is beyond the scope of this report.
China’s tiered energy pricing scheme has been discussed earlier in this publication. Further research is needed on the best ways to continue such pricing schemes, and evaluation should be conducted that could serve as a case study to help other countries around the world adopt more assertive energy tariff restructuring.
Whole-building energy performance labelling and reporting
While the many “green” building certificate programmes may be useful for assessing overall environmental performance, they usually do not adequately assess the full energy impact of buildings. The energy performance of whole buildings is ideally assessed in a similar way to that for individual items of energy-consuming equipment. The key benefit of a building energy performance rating and labelling policy is that it can influence the market at a critical time (e.g. when a building is being leased or sold). These energy performance policies can be applied both to new and existing buildings, with the primary intent being to generate market pressure for higher-performing buildings.
Performance certificates can be derived in a variety of ways, including actual measured data and from a building characteristic evaluation or asset rating. The building evaluation method usually involves simplified software rating tools. The credentials required of the auditor vary by programme, as does the entire scope of the programme, such as whether it is voluntary or mandatory. Key elements of any programme include reproducibility of ratings, and monitoring and evaluation.
Major differences in programme philosophy exist. Some programmes, such as the Residential Energy Services Network (RESNET) programme in the United States, have chosen to require energy auditors to meet criteria that are more stringent than mandatory certificates elsewhere, such as the widely used scheme in the European Union. The intent of the RESNET programme is to ensure that all performance ratings are of a very high quality. A drawback is that market entry and costs are high, while market uptake is slow. A balance for performance labelling is needed between rigour and accessibility; regardless, repeatability of performance ratings is of considerable importance. For example, it is highly recommended that EU ratings ensure that buildings undergo physical inspection and at least basic performance evaluation, such as air leakage testing. China could similarly pursue a whole-building performance and rating programme, while using a variety of the best elements of other programmes that exist in the world.
Appliance and equipment standards Global policy development in the field of appliance and equipment energy standards has been highly active. These include voluntary and mandatory energy consumption labelling and minimum energy efficiency standards programmes. Numerous evaluation studies have been conducted
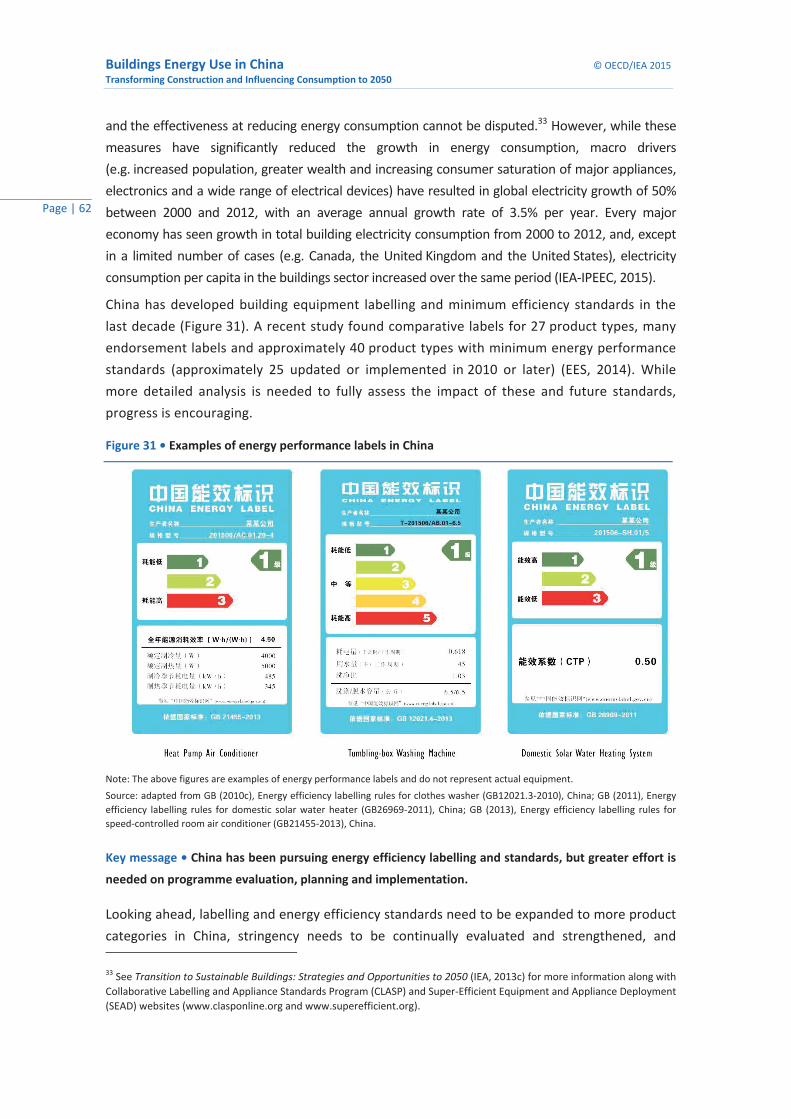
Buildings Energy Use in China © OECD/IEA 2015 Transforming Construction and Influencing Consumption to 2050
Page | 62
and the effectiveness at reducing energy consumption cannot be disputed.33 However, while these measures have significantly reduced the growth in energy consumption, macro drivers (e.g. increased population, greater wealth and increasing consumer saturation of major appliances, electronics and a wide range of electrical devices) have resulted in global electricity growth of 50% between 2000 and 2012, with an average annual growth rate of 3.5% per year. Every major economy has seen growth in total building electricity consumption from 2000 to 2012, and, except in a limited number of cases (e.g. Canada, the United Kingdom and the United States), electricity consumption per capita in the buildings sector increased over the same period (IEA-IPEEC, 2015).
China has developed building equipment labelling and minimum efficiency standards in the last decade (Figure 31). A recent study found comparative labels for 27 product types, many endorsement labels and approximately 40 product types with minimum energy performance standards (approximately 25 updated or implemented in 2010 or later) (EES, 2014). While more detailed analysis is needed to fully assess the impact of these and future standards, progress is encouraging.
Figure 31 • Examples of energy performance labels in China
Note: The above figures are examples of energy performance labels and do not represent actual equipment. Source: adapted from GB (2010c), Energy efficiency labelling rules for clothes washer (GB12021.3-2010), China; GB (2011), Energy efficiency labelling rules for domestic solar water heater (GB26969-2011), China; GB (2013), Energy efficiency labelling rules for speed-controlled room air conditioner (GB21455-2013), China.
Key message • China has been pursuing energy efficiency labelling and standards, but greater effort is
needed on programme evaluation, planning and implementation.
Looking ahead, labelling and energy efficiency standards need to be expanded to more product categories in China, stringency needs to be continually evaluated and strengthened, and
33 See Transition to Sustainable Buildings: Strategies and Opportunities to 2050 (IEA, 2013c) for more information along with Collaborative Labelling and Appliance Standards Program (CLASP) and Super-Efficient Equipment and Appliance Deployment (SEAD) websites (www.clasponline.org and www.superefficient.org).

© OECD/IEA 2015 Buildings Energy Use in China Transforming Construction and Influencing Consumption to 2050
Page | 63
enforcement is paramount to ensure consumer products and equipment are meeting expected efficiency levels. Continued collaboration with other countries on good practice (e.g. successful policy and market experiences), R&D of energy-efficient end-use equipment and even global or regional product standards development will help to improve the efficiency of appliances and equipment across China.
Heat pump technology
Heat pumps are a mature technology to transfer thermal energy from a heat source to a heat sink. They most commonly use a vapour compression cycle to extract heat from a lower temperature source and deliver it at a higher temperature for space or water heating in buildings. Most heat pumps use an electric motor to drive the vapour compression cycle, although other cycles exist, including thermally driven heat pumps that have been used predominantly for air conditioning.
The IEA has recommended that China pursue a wide variety of heat pump applications that can play a major role in reducing space and water heating in the buildings sector. The IEA Technology Heat Pump Programme is also conducting heat pump technology research, and China could consider joining this international collaborative project. Several key research projects that could directly apply to areas of high priority for China include: Annex 41 (Cold Climate Heat Pumps), Annex 43 (Fuel-Driven Sorption Heat Pumps) and Annex 47 (Heat Pumps in District Heating and Cooling Systems). TU has been pursuing research on absorption heat pumps that can be used in the return lines of district heating networks, and which can significantly improve overall system performance by reducing return temperatures.
Another critical area of research that TU is working on is to develop low-cost, heat-only heat pumps for rural applications. The intention is to provide an alternative to fuel switching that is currently occurring in China as rural populations transition from the burning of biofuels to coal or LPG for space heating. Annex D provides further detail on the various areas of focus, with a summary below (Table 6).
Table 6 • Recommended heat pump technology and application areas for priority
High priority application Core policy focus
Cold climate heat pumps NUH for application with or without district energy networks R&D
Thermally driven heat pumps
Air source for heating technology with COPs in the range of 1.5 to 1.8, at least 40% improvement over condensing boilers, all heating regions
R&D
Very low-cost, heat-only heat pumps
For rural household applications as alternative to coal or biofuels as primary source of heat
R&D and market transformation to commercialise affordable products, and field studies
Heat pump water heaters
For all hot-water applications including systems that may serve a group of apartments to make it market viable with higher hot-water demand
R&D and market transformation to commercialise affordable products
Ground source heat pumps
Cold and severe cold climates where air-source heat pumps may not perform the best, especially in the near term
Market deployment
District heating absorption heat pumps
NUH with district heating to reduce return temperatures
R&D, field study, and market deployment
Note: COP = coefficient of performance.
Buildings Energy Use in China © OECD/IEA 2015 Transforming Construction and Influencing Consumption to 2050
Page | 64
Energy management: sensors and controls
Energy management systems that improve the visibility of energy consumption by providing feedback to building operators and occupants can provide savings of 20% or more (IEA, 2013c). Buildings energy monitoring systems and sub-metering technology for commercial buildings should be encouraged as they allow for better data collection. Many commercial buildings in China already use energy management systems to analyse energy data, which can be helpful in saving energy.
Advanced systems that include a variety of sensors, controls and high quality interactive systems also allow for active energy management, such as programming temperature set points for unoccupied periods. They also allow for building energy systems (e.g. heat pumps) to be controlled in advance to satisfy expected future temperature requirements, without using electric resistance or gas-fired backup heaters. These systems also can play a key role in reducing peak electricity consumption, which could have a monetary value for consumers and provide improved value to electricity operators. While the exact operation of schemes may vary between building operators and individual consumers, a much greater focus on energy management can reduce the inefficient use of energy.
In hot regions, greater focus on independent control of humidity and sensible cooling can be deployed in large buildings, including a heat recovery system to allow comfortable conditions to be established while preventing over-cooling (excess energy) to reduce high humidity. More research is needed on smaller buildings, where established applications are not market viable on a smaller scale. Smart controls to optimise energy performance with a variety of technologies, including passive ventilation and mechanical cooling, could also be designed with improved consumer interface, resulting in better operation of the building. Many buildings in highly humid climates are excessively cooled to resolve the humidity problems, which results in very high cooling energy consumption. Consequently, having separate efficient dehumidification systems can offer improved comfort and energy savings.
Solar water heaters
Currently, China leads the world in solar thermal technology, with approximately 67% of the world’s installed capacity (IEA-SHC, 2014). While this is encouraging, most of the applications in China are small-scale systems in rural applications. With major urbanisation underway and increasing demand for hot water in large multi-family buildings, new strategies are needed for urban and multi-family applications. Roof-top systems are one option, although often there is insufficient roof area to provide heat to satisfy water heating demand in large buildings. Integrated facade solar thermal systems are an option for new construction and possibly for major building renovations, with further development to make them cost effective and viable.
One possible strategy could be an integrated solar thermal system with south and west shading facade system that blocks the sun from windows while also optimising the collector angle for maximum solar thermal harvesting. This system may be complex, but it has
© OECD/IEA 2015 Buildings Energy Use in China Transforming Construction and Influencing Consumption to 2050
Page | 65
the potential to be a valuable option in China if designed from a systems perspective and considers air conditioning loads, daylighting and domestic hot-water demand. R&D should be considered to expand solar thermal systems in urban areas, including the possible use of combination units that integrate solar with heat pump designs. While such systems will require greater capital investment (as two different systems are needed), they may enable an optimal design strategy, especially if a design can be implemented for a group or block of apartments, such as one-half of a floor of a high-rise building. This approach could offer improved economics over individual apartment solutions, while avoiding the large distribution heat loss that is common in whole-building (central) applications.
Research should also be expanded to include consideration of consumer behaviour and technology interface. For example, encouraging consumers to use hot water for bathing in the evening versus the morning can improve overall system efficiency of solar thermal systems. These types of practices could be considered in system design and implementation through appropriate time-of-use pricing, energy consumption feedback, or through educational information campaigns.
Data and benchmarking to support energy efficiency and policy
Both data and understanding building energy performance and use are critical to assessing progress in the buildings sector. Across all countries, buildings data are limited, especially with respect to end-use energy consumption, equipment and efficiency. In order for China to set meaningful targets on buildings performance (e.g. efficiency improvement or energy conservation targets), improved standards and benchmarking of building energy use will be needed. This includes monitoring and statistical systems that can help collect data and improve understanding of building energy use and consumer behaviour. To date, large-scale fully effective energy management programmes and system installation have seen limited application in China. Although some systems in are place and surveys of building energy consumption have taken place, the data are often not shared among stakeholders, and information can be misinterpreted.
China should consider improved policy and programme development to address building energy use and performance metrics, including increased application of building energy management systems and sharing of data. Similar problems exist in many other countries around the world, with data obtained through the energy management system being treated as proprietary. The recent joint IEA-IPEEC report, Building Energy Performance Metrics: Supporting Energy Efficiency Progress in Major Economies, specifically calls for greater collaboration on data gathering and exchange (IEA-IPEEC, 2015). Real energy consumption statistics will help to support objectives to reduce building energy intensities, and will allow for benchmarking of progress in the Chinese buildings sector (e.g. energy efficiency improvements relative to total building energy consumption). Issues to consider in developing a policy system based on real energy consumption and data include:
Buildings Energy Use in China © OECD/IEA 2015 Transforming Construction and Influencing Consumption to 2050
Page | 66
• Improved quality in benchmarking building energy data (including definition and application of boundaries, conversion methods, and classification of end-users). A unified definition and classification standard of building energy consumption could be established and enforced across China (and even internationally). Examples of current standards are ISO 12655 (Energy performance of buildings – presentation of measured energy use of buildings) and China’s national industry standard (JG/T358-2012), which was implemented in August 2012.
• Monitoring, survey and statistical system challenges, including training of building energy managers and operators.
• Increased openness and transparency of building energy data across public and private buildings. Building energy consumption data could be used to improve understanding of performance characteristics and best practice examples to encourage energy-saving methods across buildings.
• Top-level design and benchmarking of building energy performance standards across building types and cross-sectorially with respect to national energy objectives.
Improvements in buildings energy performance and consumption data will also help to develop understanding of policy and technology options that can influence consumer energy behaviour and choices. For example, data collected on space cooling energy consumption showed that residential occupant choice (e.g. centralised and individual air conditioning units) relative to residential occupant behaviour (e.g. how often they use a fan or air conditioner) can have considerable impact on energy intensity and total energy consumption (see Figure 20).
Statistical information on energy behaviour can also help to shape energy policy (e.g. choice of different energy programmes or technology choices) through better understanding of the potential impact. Further information on energy efficiency indicator development and statistics can be found in the IEA publications Energy Efficiency Indicators: Fundamentals on Statistics (IEA, 2014b) and Energy Efficiency Indicators: Essentials for Policy Making (IEA, 2014a).
Beyond global policy best practice
Energy efficiency in buildings has been pursued for years, and numerous policies exist that range from basic R&D to market conditioning, including incentives and enhanced financing to stimulate an early market for advanced products and high-performance buildings. These are generally seen as a way to establish a viable market, with initial success then allowing for consideration of mandatory policies. Any policy mechanism, technology, concept or rationale for pursuing low-energy buildings has to be constructed within the local, regional and national culture, and climatic and political conditions to ensure that it is appropriate, will resolve market barriers and ultimately be successful. Policy makers are now considering moving beyond the existing basket of policy instruments in the buildings sector.

© OECD/IEA 2015 Buildings Energy Use in China Transforming Construction and Influencing Consumption to 2050
Page | 67
New policies for building renovation and operation
Globally, mainstream building renovation programmes have typically achieved only modest energy savings, meaning that the benefits of widespread deep energy renovations are still to be realised. Definitions for deep energy renovation vary, but the IEA has supported criteria by the Global Buildings Performance Network that calls for at least 50% reduction in building code loads (space and water heating, cooling and lighting), or not more than 60 kWh/m2 (GBPN, 2013). Energy-saving programmes that are typically adopted by ESCOs and by social or public housing renovation programmes often achieve savings in the order of 10% to 25%. While these programmes are effective at saving energy, more ambition is needed, particularly in old, very poorly performing buildings. A new policy (currently in development in China) that could be very effective for China’s existing building stock combines several existing buildings sector policies with an industrial policy that requires mandatory energy management reporting and energy consumption reduction.
Pursuing a policy that requires mandatory energy consumption, energy performance and metrics reporting by building owners and operators would help establish a baseline for improvement locally, regionally and nationally. With a voluntary or mandatory approach to achieving stringent performance criteria similar to the Japanese Top Runner Programme, early adopters could be rewarded in a variety of ways, including possible financial incentives, and then at a later pre-determined date, the requirements would become mandatory and enforcement would include potential non-compliance penalties.
While several regions around the world are pursuing mandatory energy disclosure policies, the IEA and TU are not aware of anyone who is mandating a reduction in energy consumption in existing buildings. This policy is being proposed in China and will require significant effort and consideration to ensure that it is implemented effectively from the national to local level. Such programmes may be highly controversial, but it is intended to be targeted towards the largest buildings first (large multi-family, commercial and public buildings).
While initial efforts are intended more towards energy conservation and management, longer term more ambitious deep energy renovations will enable a package of energy efficiency measures to be pursued. This would allow for short- and long-term measures to be financed together to achieve a reasonable and affordable alternative to providing greater heat and electricity supply capacity. Such an approach allows for building envelope measures to be pursued that would result in much smaller capacity heating and cooling systems. However, if typically short-term measures are implemented alone, any future efficiency measures are unlikely to be cost effective by themselves. This is because it is typical for modest energy renovation activities to pursue measures that are highly cost effective, with payback of maybe two to ten years. This then precludes the packaging together of short-term measures with those that have payback of 15 to 30 years (e.g. facade renovation) to improve the overall payback period.
Buildings Energy Use in China © OECD/IEA 2015 Transforming Construction and Influencing Consumption to 2050
Page | 68
Energy renovations are an important way of improving the energy efficiency of the existing building stock. The appropriate scale of renovation depends on the estimated useful remaining life of the building. Where the building has a remaining life expectancy of 10 to 15 years, modest energy measures are appropriate. By contrast, where remaining life expectancy is greater, deep energy renovation makes economic and technical sense at the time of normal building refurbishment, which typically occurs around every 30 years. Conducting such periodic refurbishment without deep energy measures at the same time represents a missed opportunity to achieve major energy savings. The building efficiency community needs to look at new innovative ways to implement strong policies for existing buildings. China is leading the world with its new proposed energy consumption standard, and could contribute significantly to the world knowledge base, while also benefitting from participation in international discussion of these issues.
Building codes that limit floor area
Globally, the core policy area on building energy efficiency has been building code development and enforcement. However, other potential policies could have a measurable impact on building construction and energy consumption, including limits on the growth of total buildings floor area.
Floor area directly relates to energy consumption, and with large increases in building construction expected in China, the potential to reduce or limit this growth should be studied. One policy consideration is a possible limit on new floor area. This could have a potentially negative impact on economic growth if policies were to significantly affect the construction industry. However, increased investment in more efficient buildings and higher value-added construction could be used to offset limits on total floor area while not significantly impacting economic activity. In some countries larger dwelling size is seen as a proxy for wealth, so the intent of a market-based programme might be to see if this perspective can be changed so that consumers value sustainable buildings that could be more appropriately sized while having improved comfort among other benefits. However, we know that some wealthy countries have significantly lower floor area per capita based on culture and urban density (e.g. Japan and Korea).
The ETP buildings model forecasts floor area in China reaching approximately 52 m2 per capita in the 2030 to 2050 timeframe.34 However, if this level were limited to 40 m2 per person or lower, for example, buildings sector energy consumption to 2050 would decrease. The impact of related energy consumption and emissions (e.g. during the buildings construction process) would also be reduced. A potential policy therefore being considered by experts in China is to limit the floor area per capita for new construction. This policy may be controversial, but the expected energy growth in China (both in terms of energy and resource demands for new buildings) is substantial, and various policy approaches are being considered, including limiting dwelling size.
34 ETP methodology on household and floor area growth is described in the Buildings sector drivers section of this report.
© OECD/IEA 2015 Buildings Energy Use in China Transforming Construction and Influencing Consumption to 2050
Page | 69
China has considered a policy that would limit 70% of new apartments to less than 90 m2 since 2006 but it has not been effectively implemented (MOHURD, 2006). This policy could also be amended to ensure that the overall weighted average for all apartments does not exceed a maximum ceiling, such as 100 m2. While mandatory approaches are being considered, market-based approaches may be less controversial and easier to implement. The data on total floor area per capita represent the weighted average between urban and rural population, so urban policies would need to consider current household size (people per dwelling). Implementation of such a policy to restrict apartment size could be difficult to enforce, but it may be possible with large builders. This policy could be implemented in a manner that is similar to the well-established corporate average fuel efficiency standards for automobiles. Builders would design, build and promote a range of apartment sizes. Larger apartments would realise greater premiums and profits for builders, while smaller apartments would be provided to allow for a total weighted average of apartment sizes. Apartment offerings would be market-based, with builders having the flexibility to control their offerings, while ensuring the amount of floor area per capita is has reduced growth. Similar to the other policies that do not directly regulate construction and consumer choices, adding premiums or taxes on larger spaces could also help drive consumers to choose smaller apartments. Furthermore, for single-family homes, constructing homes larger than a specified size could trigger a requirement for greater investment in renewable energy, such as larger solar thermal systems or photovoltaic cells to be installed on the roof. Thus, a variety of policies should be considered for the future to help mitigate the growth in larger dwellings.
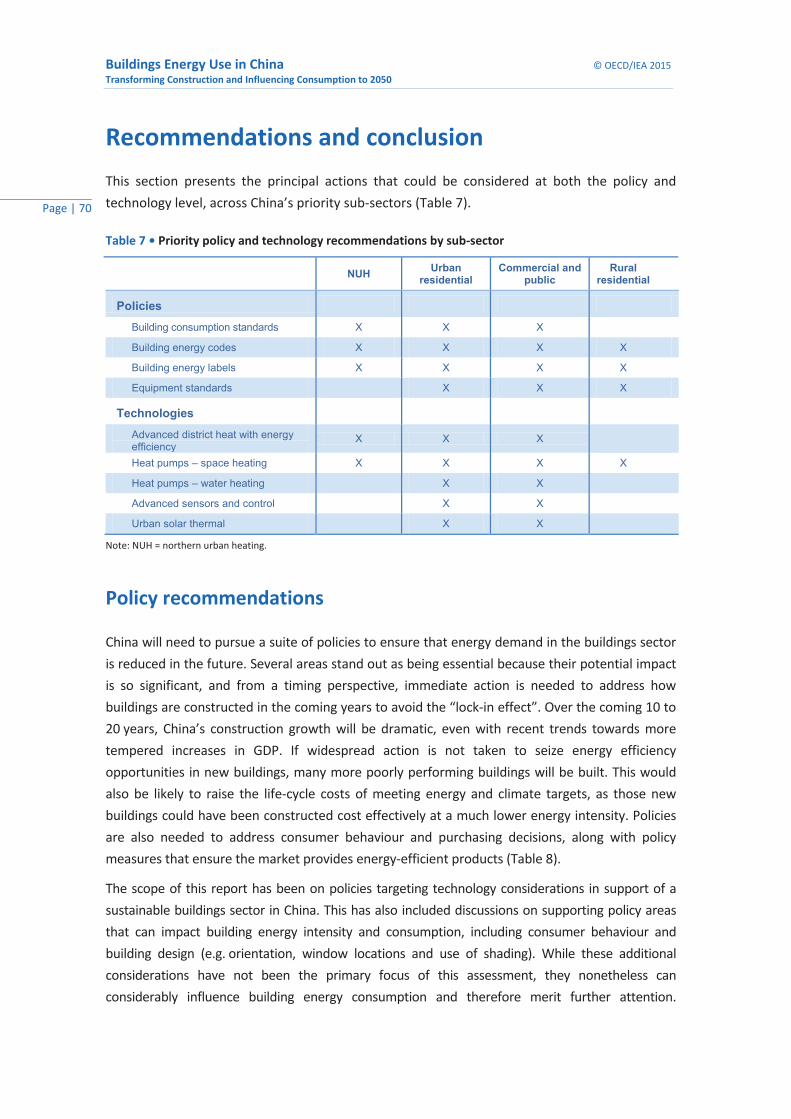
Buildings Energy Use in China © OECD/IEA 2015 Transforming Construction and Influencing Consumption to 2050
Page | 70
Recommendations and conclusion This section presents the principal actions that could be considered at both the policy and technology level, across China’s priority sub-sectors (Table 7).
Table 7 • Priority policy and technology recommendations by sub-sector
NUH Urban
residential Commercial and
public Rural
residential
Policies
Building consumption standards X X X
Building energy codes X X X X
Building energy labels X X X X
Equipment standards
X X X
Technologies
Advanced district heat with energy efficiency
X X X
Heat pumps – space heating X X X X
Heat pumps – water heating
X X
Advanced sensors and control
X X
Urban solar thermal
X X
Note: NUH = northern urban heating.
Policy recommendations
China will need to pursue a suite of policies to ensure that energy demand in the buildings sector is reduced in the future. Several areas stand out as being essential because their potential impact is so significant, and from a timing perspective, immediate action is needed to address how buildings are constructed in the coming years to avoid the “lock-in effect”. Over the coming 10 to 20 years, China’s construction growth will be dramatic, even with recent trends towards more tempered increases in GDP. If widespread action is not taken to seize energy efficiency opportunities in new buildings, many more poorly performing buildings will be built. This would also be likely to raise the life-cycle costs of meeting energy and climate targets, as those new buildings could have been constructed cost effectively at a much lower energy intensity. Policies are also needed to address consumer behaviour and purchasing decisions, along with policy measures that ensure the market provides energy-efficient products (Table 8).
The scope of this report has been on policies targeting technology considerations in support of a sustainable buildings sector in China. This has also included discussions on supporting policy areas that can impact building energy intensity and consumption, including consumer behaviour and building design (e.g. orientation, window locations and use of shading). While these additional considerations have not been the primary focus of this assessment, they nonetheless can considerably influence building energy consumption and therefore merit further attention.

© OECD/IEA 2015 Buildings Energy Use in China Transforming Construction and Influencing Consumption to 2050
Page | 71
Identifying opportunities for strategic building development (from conception to planning and construction) could offer significant energy savings potential as the buildings sector in China continues to grow at a rapid pace in the coming two decades. These types of strategic decisions (e.g. urban planning and building orientation), when paired with critical building code development, will support the achievement of an energy-efficient, low-carbon buildings sector in China.
Table 8 • Policy recommendations and actions for consideration
Policy area Area of consideration Action required Benefit
Building energy standard: regulate energy usage in buildings
All buildings excluding rural residential sub-sector
Further development and implementation plan, including local implementation of energy usage standards for different building types
Greater visibility of energy consumption and mandates to reduce energy consumption
Building code: cold climate
Severe cold and cold climate zones, all conditioned buildings
Ensure high levels of low thermal conductive building materials; integration and air sealing implemented on all new buildings, including in smaller cities and rural locations; specify performance metrics (e.g. maximum kWh/m2)
Greater GDP from value-added construction; reduced energy consumption; improved comfort; large reduction of coal for district heating
Building code: hot climate
Hot summer climates, all buildings
Greater focus on reflective building materials, exterior shading, reduced urban heat island, low SHGC windows, air sealing and adequate insulation on all new buildings, including in smaller cities and rural locations
Greater GDP from value-added construction; reduced energy consumption; improved comfort; lower urban temperatures; lower city pollution; improved quality of life for city inhabitants
Building code: mixed climate
Climate areas with both significant heating and cooling loads
Actions for both cold and hot climate zones based on technical, climatic and economic analyses
Same as cold and hot climate zones
Consumer behaviour Household occupants
Provide information regarding energy consumption – product labelling, whole-building performance certificates, real-time energy feedback; increased energy tariffs
Energy savings; reduced rate of energy infrastructure growth requirements; disposable income spending increased in other segments of the economy
Building operator behaviour
All commercial and public buildings, multi-family buildings >5 units
Require whole-building energy reporting with targets for reduction; consider energy penalty or surcharge for excessive consumption or address through increasing energy tariffs
Energy savings; reduced rate of energy infrastructure growth requirements; renovation will help construction market that may be declining from its peak output
Manufacturer and product supplier behaviour
Energy-consuming building equipment, windows, solar thermal, and building integrators; applicable to large stock of unoccupied buildings, replacement products, and new buildings
Evaluate and strengthen mandatory building efficiency standards; establish minimum country criteria, and regionally when appropriate; regulate professional competency at evaluating and improving building energy performance
Raises the bar for domestic and export markets; widely applicable to entire economy and adds wealth while reducing dependence on imported energy; reduces pollution from coal for electricity generation
Green building programmes
Voluntary programmes to promote efficient “green” buildings
Ensure that programme includes minimum energy performance criteria
Ensures that green buildings go beyond environmental and renewable energy policy and address core energy efficiency goals
Note: SHGC = solar heat gain coefficient.
Buildings Energy Use in China © OECD/IEA 2015 Transforming Construction and Influencing Consumption to 2050
Page | 72
In addition, proper implementation of buildings sector energy efficiency policies should include the right policy instruments to ensure compliance across all building types and end-uses in China. While monitoring, verification and enforcement have not been the core focus of this report, none of the technology and policy recommendations made here would be successful without also ensuring that policy objectives are being complied with. Monitoring, verification and enforcement (e.g. through energy performance certification) can provide decision makers with objective information on compliance and the achievements of buildings policies, which can also help to define appropriate targets, policy reforms and supporting policy instruments to achieve energy and climate objectives.
Technology recommendations
China has pursued technological development in many areas, but several areas of technology in the buildings sector deserve to be given a higher priority (Table 9). As space heating is the largest end-use of energy in China’s buildings, much greater effort is needed to advance solutions that constrain it, including options for NUH district heating and for heating in individual buildings, and reducing space-heating demand through more efficient building envelopes. In urban areas, as demand for hot water continues to grow, solutions that promote solar thermal applications will be essential. Integrated solutions offering improved daylight, while increasingly common, also need to be widely promoted, along with advanced windows and efficient lighting sources. A wide array of heat pump solutions is available that includes individual and system applications for both water and space heating, powered by both gas and electricity.
Many of these areas of opportunity are not unique to China. Working both internationally and collaboratively to achieve the best solutions for all countries will enable faster development at lower research and development (R&D) costs and can lead to large economies of scale for high-volume manufacturing. China’s investment in high-performance solutions will also allow it to serve global markets with sustainable technologies.
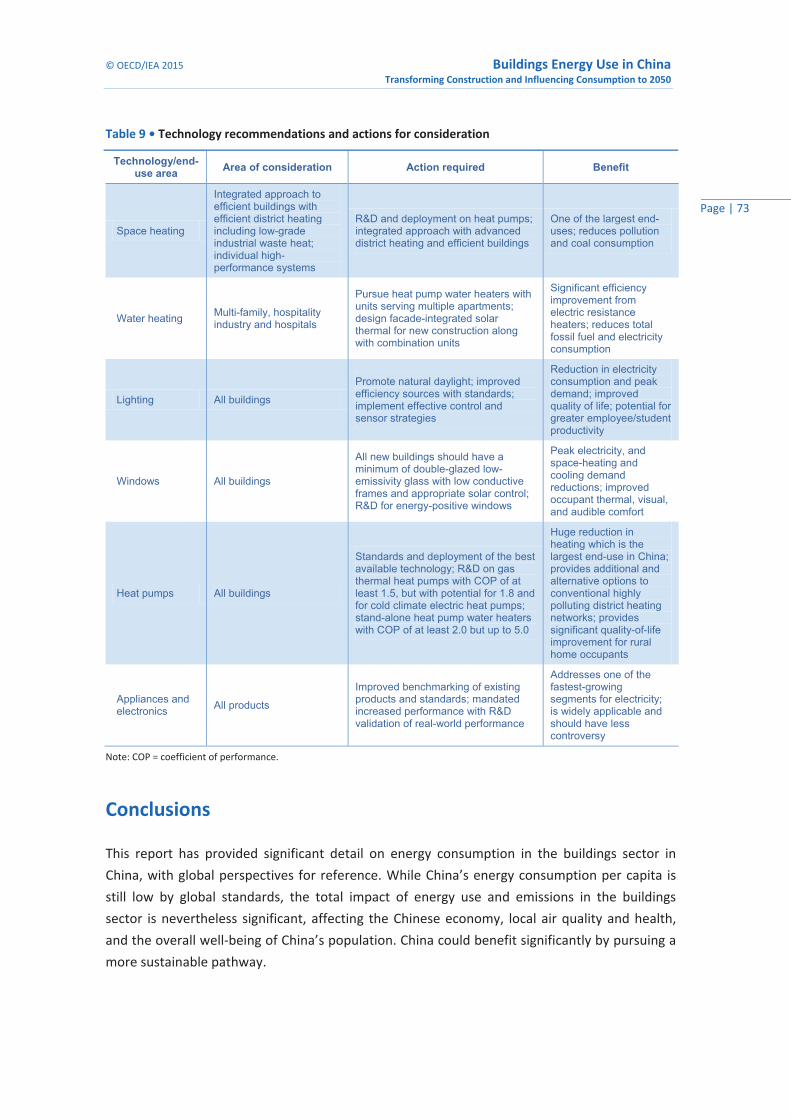
© OECD/IEA 2015 Buildings Energy Use in China Transforming Construction and Influencing Consumption to 2050
Page | 73
Table 9 • Technology recommendations and actions for consideration
Technology/end-use area Area of consideration Action required Benefit
Space heating
Integrated approach to efficient buildings with efficient district heating including low-grade industrial waste heat; individual high-performance systems
R&D and deployment on heat pumps; integrated approach with advanced district heating and efficient buildings
One of the largest end-uses; reduces pollution and coal consumption
Water heating Multi-family, hospitality industry and hospitals
Pursue heat pump water heaters with units serving multiple apartments; design facade-integrated solar thermal for new construction along with combination units
Significant efficiency improvement from electric resistance heaters; reduces total fossil fuel and electricity consumption
Lighting All buildings
Promote natural daylight; improved efficiency sources with standards; implement effective control and sensor strategies
Reduction in electricity consumption and peak demand; improved quality of life; potential for greater employee/student productivity
Windows All buildings
All new buildings should have a minimum of double-glazed low-emissivity glass with low conductive frames and appropriate solar control; R&D for energy-positive windows
Peak electricity, and space-heating and cooling demand reductions; improved occupant thermal, visual, and audible comfort
Heat pumps All buildings
Standards and deployment of the best available technology; R&D on gas thermal heat pumps with COP of at least 1.5, but with potential for 1.8 and for cold climate electric heat pumps; stand-alone heat pump water heaters with COP of at least 2.0 but up to 5.0
Huge reduction in heating which is the largest end-use in China; provides additional and alternative options to conventional highly polluting district heating networks; provides significant quality-of-life improvement for rural home occupants
Appliances and electronics All products
Improved benchmarking of existing products and standards; mandated increased performance with R&D validation of real-world performance
Addresses one of the fastest-growing segments for electricity; is widely applicable and should have less controversy
Note: COP = coefficient of performance.
Conclusions
This report has provided significant detail on energy consumption in the buildings sector in China, with global perspectives for reference. While China’s energy consumption per capita is still low by global standards, the total impact of energy use and emissions in the buildings sector is nevertheless significant, affecting the Chinese economy, local air quality and health, and the overall well-being of China’s population. China could benefit significantly by pursuing a more sustainable pathway.
Buildings Energy Use in China © OECD/IEA 2015 Transforming Construction and Influencing Consumption to 2050
Page | 74
China’s unique situation, anticipating strong sustained growth in wealth and unprecedented levels of construction, together with a government that has a proven track record of implementing energy policy measures, presents the real possibility of achieving a much lower energy footprint in the buildings sector. While China has followed assertive public policy decisions in recent years, energy efficiency in the buildings sector should be elevated as a priority for action so that effective policies can be developed and implemented quickly.
China has already initiated many of the recommendations in this report, but further positive action is recommended to ensure that key policy and technological developments come into effect in advance of the expected growth in China’s building stock. A small window of opportunity for action presents itself, as in some cases policy could take significant time to implement. An overall, long-term strategy is therefore needed to facilitate low-energy buildings operated by trained buildings operators, within a legal and financial framework that encourages energy efficiency and conservation. This includes considerations for supporting energy efficiency measures (e.g. building orientation and design) as well as the necessary policy instruments to validate building energy standards through monitoring and enforcement. These actions will be essential across all segments of the economy, across climate zones and across China’s population. Notwithstanding concerns over variability in consumer behaviour as household wealth grows, or inconsistency in building code compliance, effective energy policy can ensure lower energy consumption compared with a situation where such policies are not enacted.
© OECD/IEA 2015 Buildings Energy Use in China Transforming Construction and Influencing Consumption to 2050
Page | 75
Annex A. Energy balance analysis and future The IEA Energy Data Centre (EDC) has procedures to collect comprehensive data from national sources, which are used to develop and improve energy balances for the entire energy sector for well over 100 countries. These balances include a detailed breakdown of fuel share (biofuels, coal, electricity, gas, oil, solar thermal, etc.) for both the residential and services (commercial and public buildings) sub-sectors. A key element of the collaboration between TU and IEA ETP is to look at issues of macro energy balance and to disaggregate end-use energy consumption much further. For example, researchers have estimated detailed fuel shares per major end-use (space heating, water heating, lighting, space cooling, cooking, appliances), and general categories such as “miscellaneous” residential consumption and services “other” consumption.
This report contains significant discussion of the TU analysis of four major building sub-sectors: rural residential; urban residential; northern urban heating; and commercial and public buildings. The variations that exist between IEA and TU statistics on biofuels and commercial heat are also discussed. The long-term objective of the IEA-TU partnership is to minimise these differences through further analysis, peer review and core data collection. A first attempt to present the existing macro data set shows that, overall, IEA and TU statistics are mostly in agreement beyond a limited number of important areas (e.g. biofuels, commercial heat, and solar thermal) (Table A1). Furthermore, the analysis includes elements that go beyond the IEA energy balance, and presents final modelling assessments for buildings as published in Energy Technology Perspectives 2015 (ETP 2015) (IEA, 2015a).
In emerging markets such as China, it is not uncommon to see significant data variability. In the case of electricity generation, a significant quantity has not been allocated to any sub-sector and is called “other non-specified”. It is likely that a portion of this component is consumed in the buildings sector, but how much is really not known. ETP allocates a portion from this category to the buildings sector as part of the detailed energy balance, but ultimately this entire category needs to be further disaggregated by major sector (industrial, residential, services, etc.).
Officially, China’s National Bureau of Statistics tracks buildings sector energy statistics, but the classification of buildings energy use is not disaggregated enough and additional categories need to be taken into account (for example, biofuels used in rural residential are not included in the official statistics, and energy consumption in the public and commercial sector is not an individual category but separated into several different items). TU and other institutes are working to improve the quality of data on China’s buildings energy use, but further work is needed.
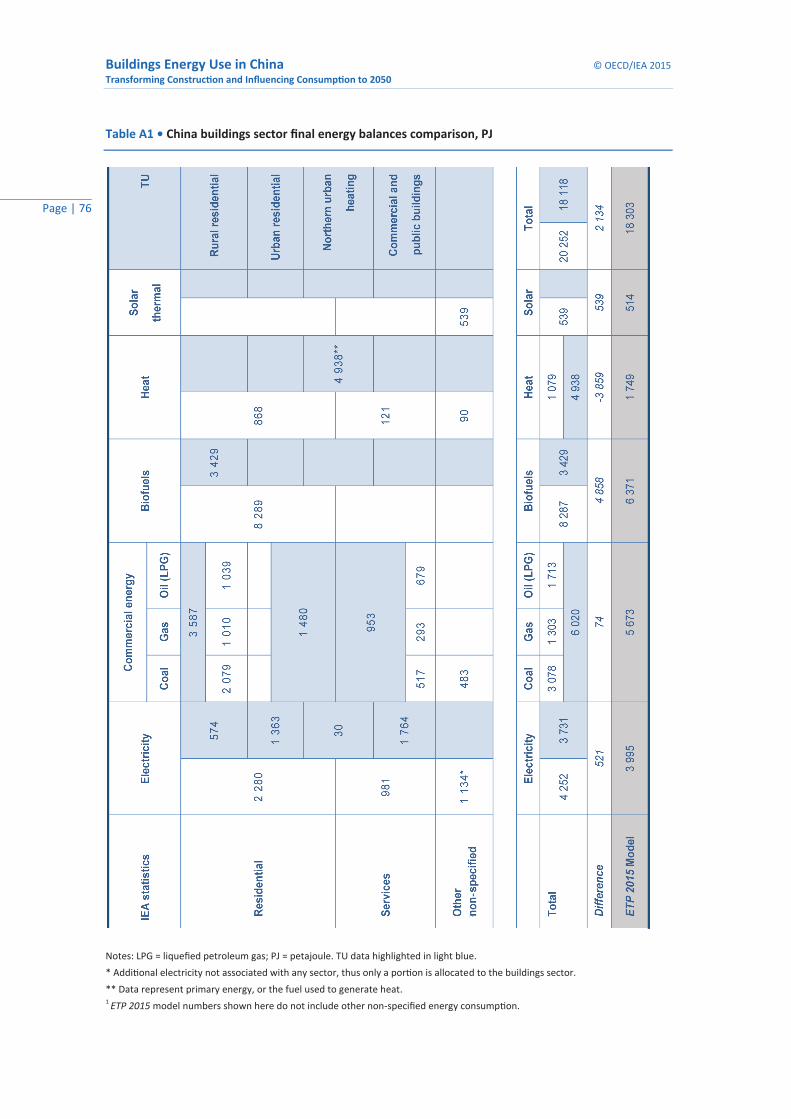
Buildings Energy Use in China © OECD/IEA 2015 Transforming Construction and Influencing Consumption to 2050
Page | 76
Table A1 • China buildings sector final energy balances comparison, PJ
Notes: LPG = liquefied petroleum gas; PJ = petajoule. TU data highlighted in light blue. * Additional electricity not associated with any sector, thus only a portion is allocated to the buildings sector. ** Data represent primary energy, or the fuel used to generate heat. 1 ETP 2015 model numbers shown here do not include other non-specified energy consumption.
© OECD/IEA 2015 Buildings Energy Use in China Transforming Construction and Influencing Consumption to 2050
Page | 77
TU conducts research and administers surveys to assess real-world energy usage in a variety of buildings. It has estimated a dramatic reduction in biofuels due mostly to wealthier rural households moving to coal and LPG, which are more expensive but much easier to use than gathering and burning biofuels. The IEA uses several historical sources for its data and estimates consumption trends over time. The benefits of additional data sources and updates would be significant. The TU data analysis shows a declining trend for traditional biofuels that is consistent with future estimates from a variety of forecasts. Furthermore, current research by China’s National Bureau of Statistics is likely to show a large increase in rural coal consumption (TU, 2012).
For commercial heat, there is a statistical disconnect, as TU only shows primary energy while the entire matrix analysis (Table A1) is in final energy (or on-site energy) unless noted. With the major source of heating for district heat in China coming from coal co-generation, its analysis can be highly complex. This issue is expected to be further explored in the forthcoming ETP 2016.
Solar thermal systems are used predominately for residential water heating and do not generate CO2 emissions; they are therefore not reported in typical energy balances by TU. However, the IEA includes these statistics to ensure that a full energy balance is assessed, which is important as future forecasts will show fossil fuel and electricity consumption for water heating being displaced by greater shares of solar thermal.
The long-term goal should be to disaggregate the four Chinese sub-sectors into detailed end-use and fuel shares, so that a full energy balance can be derived that is consistent with statistical standards in accordance with the United Nations International Recommendations on Energy Statistics (UN IRES) (UNSD, 2011). While this standard is used globally and the process of complying with it will take time, further effort is also needed to improve the global statistical requirements of buildings sector reporting. For example, the UN IRES describes details for disaggregating industry in accordance with section 8.36, “Manufacturing, construction and non-fuel mining industries”, and for disaggregating transport in accordance with section 8.37, “Transport”, with further clarifications in section 8.38. However, section 8.40 “Other” provides categories for “households, commerce and public services, agriculture, forestry, fishing and not elsewhere specified”. Therefore, “buildings” does not exist as a sector of its own, whereas industrial and transport sectors are defined. The current “low visibility” given to the buildings sector should be changed and elevated to a higher level of reporting similar to the other sectors. This would also increase its importance globally, helping to make the case for improved reporting by China and other countries.
Detailed disaggregation within the large Chinese economy will take a significant amount of time. Therefore the IEA and TU suggest that certain areas should be given priority, with the emphasis on improving data for areas that have the highest importance. The IEA and TU plan to work with key stakeholders to establish priorities based on qualitative perspectives, considering their importance with regard to total energy consumption, the ability to reasonably improve the data, and expected levels of interest from a variety of stakeholders in China, including government officials, academia, institutes and regional partners. The development of a formal strategy and plan to improve the data and obtain resources should be considered for future action.
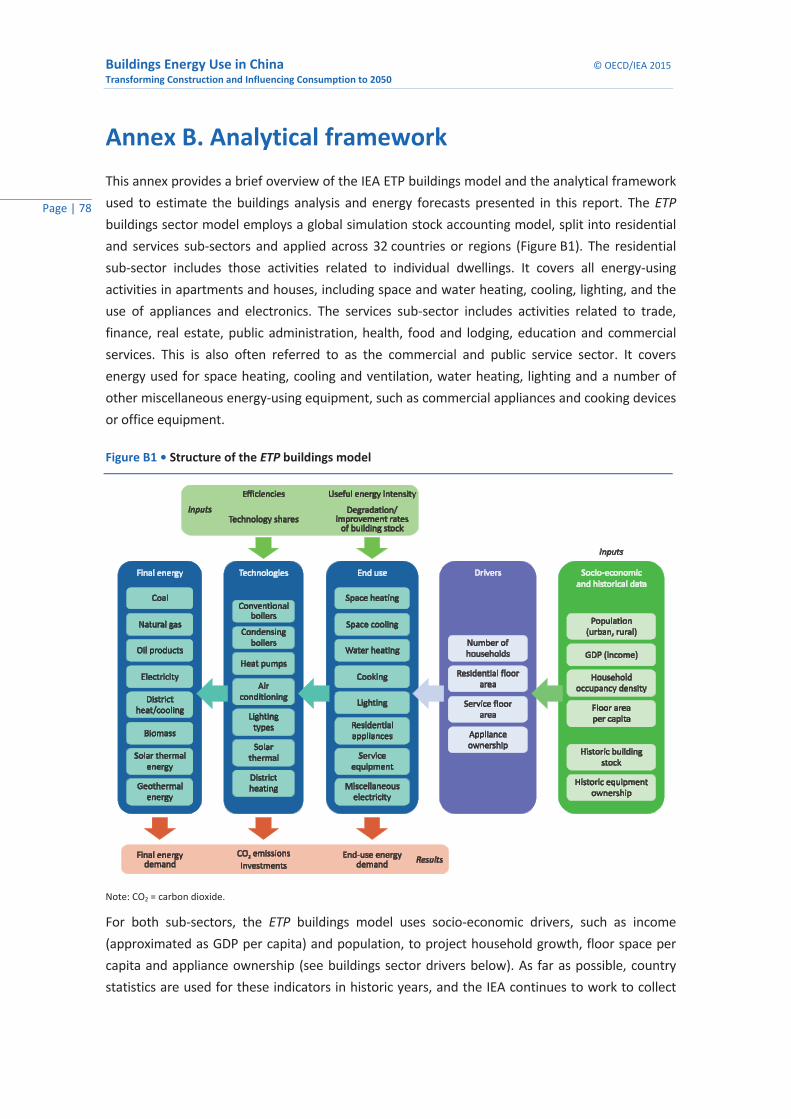
Buildings Energy Use in China © OECD/IEA 2015 Transforming Construction and Influencing Consumption to 2050
Page | 78
Annex B. Analytical framework This annex provides a brief overview of the IEA ETP buildings model and the analytical framework used to estimate the buildings analysis and energy forecasts presented in this report. The ETP buildings sector model employs a global simulation stock accounting model, split into residential and services sub-sectors and applied across 32 countries or regions (Figure B1). The residential sub-sector includes those activities related to individual dwellings. It covers all energy-using activities in apartments and houses, including space and water heating, cooling, lighting, and the use of appliances and electronics. The services sub-sector includes activities related to trade, finance, real estate, public administration, health, food and lodging, education and commercial services. This is also often referred to as the commercial and public service sector. It covers energy used for space heating, cooling and ventilation, water heating, lighting and a number of other miscellaneous energy-using equipment, such as commercial appliances and cooking devices or office equipment.
Figure B1 • Structure of the ETP buildings model
Note: CO2 = carbon dioxide.
For both sub-sectors, the ETP buildings model uses socio-economic drivers, such as income (approximated as GDP per capita) and population, to project household growth, floor space per capita and appliance ownership (see buildings sector drivers below). As far as possible, country statistics are used for these indicators in historic years, and the IEA continues to work to collect
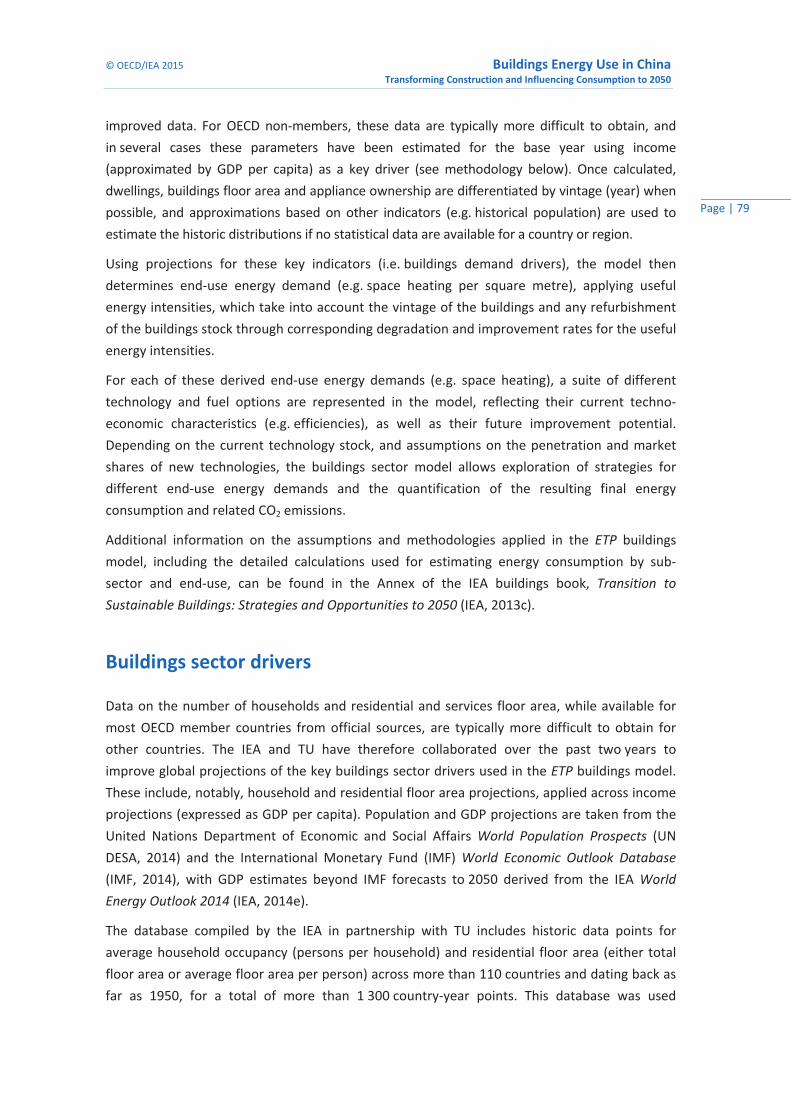
© OECD/IEA 2015 Buildings Energy Use in China Transforming Construction and Influencing Consumption to 2050
Page | 79
improved data. For OECD non-members, these data are typically more difficult to obtain, and in several cases these parameters have been estimated for the base year using income (approximated by GDP per capita) as a key driver (see methodology below). Once calculated, dwellings, buildings floor area and appliance ownership are differentiated by vintage (year) when possible, and approximations based on other indicators (e.g. historical population) are used to estimate the historic distributions if no statistical data are available for a country or region.
Using projections for these key indicators (i.e. buildings demand drivers), the model then determines end-use energy demand (e.g. space heating per square metre), applying useful energy intensities, which take into account the vintage of the buildings and any refurbishment of the buildings stock through corresponding degradation and improvement rates for the useful energy intensities.
For each of these derived end-use energy demands (e.g. space heating), a suite of different technology and fuel options are represented in the model, reflecting their current techno-economic characteristics (e.g. efficiencies), as well as their future improvement potential. Depending on the current technology stock, and assumptions on the penetration and market shares of new technologies, the buildings sector model allows exploration of strategies for different end-use energy demands and the quantification of the resulting final energy consumption and related CO2 emissions.
Additional information on the assumptions and methodologies applied in the ETP buildings model, including the detailed calculations used for estimating energy consumption by sub-sector and end-use, can be found in the Annex of the IEA buildings book, Transition to Sustainable Buildings: Strategies and Opportunities to 2050 (IEA, 2013c).
Buildings sector drivers
Data on the number of households and residential and services floor area, while available for most OECD member countries from official sources, are typically more difficult to obtain for other countries. The IEA and TU have therefore collaborated over the past two years to improve global projections of the key buildings sector drivers used in the ETP buildings model. These include, notably, household and residential floor area projections, applied across income projections (expressed as GDP per capita). Population and GDP projections are taken from the United Nations Department of Economic and Social Affairs World Population Prospects (UN DESA, 2014) and the International Monetary Fund (IMF) World Economic Outlook Database (IMF, 2014), with GDP estimates beyond IMF forecasts to 2050 derived from the IEA World Energy Outlook 2014 (IEA, 2014e).
The database compiled by the IEA in partnership with TU includes historic data points for average household occupancy (persons per household) and residential floor area (either total floor area or average floor area per person) across more than 110 countries and dating back as far as 1950, for a total of more than 1 300 country-year points. This database was used

Buildings Energy Use in China © OECD/IEA 2015 Transforming Construction and Influencing Consumption to 2050
Page | 80
to develop a set of curves to express the historic relationship between GDP per capita and 1) the average number of persons per household, and 2) the average residential floor area per person, where both indicators were weighted by GDP per capita to determine appropriate historic values for aggregated regions in the model.
The figures below illustrate the historic trends and model curves developed to estimate these two key residential drivers. The average number of persons per household can be expressed as an asymptotic function, where the average number of persons per household typically declines as average income levels increase (Figure B2). Average residential floor area per person can be expressed as an S-curve (sigmoid function), where typically there is a rapid increase in floor area per person as income levels rise, followed by a decreasing rate of growth (i.e. negative acceleration) as demand for additional floor area relative to income stabilises and then eventually begins to saturate (Figure B3).
Figure B2 • Average household occupancy levels relative to GDP per capita
Notes: Data shown have not been labelled due to the large number of countries displayed and are intended to show historic trends used to derive the modelling functions described in this annex; further detail on country data and the methodologies described here are expected to be released in a forthcoming joint IEA-TU paper (late 2015). PPP = purchasing power parity.
Key message • As income levels increase, the average number of persons per household typically
decreases, with most developed countries having between two and three persons per household.
China is expected to decrease to slightly above two persons per household, largely as a result of the
historic one-child policy.
© OECD/IEA 2015 Buildings Energy Use in China Transforming Construction and Influencing Consumption to 2050
Page | 81
Figure B3 • Example floor area per capita growth rates in China to 2050
Note: Data shown have not been labelled due to the large number of countries displayed and are intended to show historic trends used to derive the modelling functions described in this annex.
Key message • Building elasticities have been applied to the ETP buildings model drivers to account for
other explanatory factors (e.g. population density) that may not be explicitly explained by GDP per
capita growth.
In order to account for exceptions in historic indicator data relative to average global trends (e.g. smaller floor area per capita because of higher population density levels), and to better forecast residential buildings drivers for the 32 ETP buildings model country/regions, high, low and median curves were applied for both modelling functions (as shown in Figures B2 and B3). These curves were used to interpolate projected future growth rates relative to the distance of historic country data between the median curve and lower and upper bounds (shown as “Initial” forecast in Figures B2 and B3). In some cases, this initial curve did not fit historic data well (e.g. initial square metres [m2] per capita forecasts in China), and consequently, a second curve was developed to improve the interpolated forecast and to reflect better the historic trend. This “Baseline” curve reflects the expected average household size or floor area per person relative to income (GDP per capita) forecasted for the model country or region.
Because other factors (e.g. urban density and housing policy) not accounted for in the ETP buildings model can affect these key residential drivers, an additional elasticity function was applied to both functions to allow for changes in forecasted future growth rates in response to other explanatory influences (e.g. high population density). For instance, while the average historic residential floor area per person in China is higher than the global median, thereby
Buildings Energy Use in China © OECD/IEA 2015 Transforming Construction and Influencing Consumption to 2050
Page | 82
leading to a higher forecasted baseline, the IEA and TU believe that high urban densities and possible building policy programmes to limit growth in new buildings could lead to lower growth rates in average floor area per capita. The model drivers and applied elasticities (roughly 0.3 in China for m2 per person projections) therefore allow for these exceptions to account for the impact of different growth rates (shown through the “Shift” curve in Figures B2 and B3).
A slight elasticity was similarly applied to the household occupancy function for China, as the historic one-child policy is likely to have continued impact on household size. For both residential drivers (household size and floor area projections), the IEA and TU continue to work together to improve historic data collection and forecasts to 2050. The IEA and TU are also working on developing a similar function for forecasting services sub-sector floor area growth, which is currently based on an elasticity factor between services floor area and value-added observed in countries where this information is available. This is then applied using projected value-added to year 2050.
Based on this set of drivers, demand for individual energy services and the share of each energy technology needed to meet this demand are projected to 2050. In the services sub-sector, floor area is the driver for estimates of energy consumption for all end-uses. In the case of residential, floor area is the key driver for the development of energy consumption for space heating, space cooling and lighting, while appliances, cooking and water-heating energy consumption are driven by the number of households.
© OECD/IEA 2015 Buildings Energy Use in China Transforming Construction and Influencing Consumption to 2050
Page | 83
Annex C. Detailed energy performance metrics Historically, several factors have been the main drivers of final energy use in the buildings sector: population size; buildings sector size (e.g. as measured by floor area or number of households in the residential sub-sector); economic activity (e.g. as measured by gross domestic product [GDP]); and buildings energy policy. Other factors include energy prices and climate. The extent to which each driver contributes to energy use differs from country to country, within countries, and over time according to variations in social, economic, geographic and demographic contexts, as well as in policy environments.
The metrics presented in this annex are based on extensive analysis of energy efficiency indicator (EEI) data that the International Energy Agency (IEA) has developed with its member countries for many years. In 2014, the IEA published two guidebooks, Energy Efficiency Indicators: Fundamentals on Statistics and Energy Efficiency Indicators: Essentials for Policy Making (IEA, 2014b; IEA, 2014a). These publications provide energy analysts with information on the priority areas for developing EEIs, and how to select and develop the data and indicators that best support energy efficiency policy. The IEA, in partnership with the International Partnership for Energy Efficiency Cooperation (IPEEC), published an extensive set of metrics for major economies (IEA-IPEEC, 2015), which serves as a reference. However, certain key metrics for selected major economies (world average, G7 economies, India and China) are shown for total buildings final energy per capita (Figure A1), residential final energy per household (Figure A2), and services final energy per unit of floor area (Figure A3).

Buildings Energy Use in China © OECD/IEA 2015 Transforming Construction and Influencing Consumption to 2050
Page | 84
Figure C1 • Buildings final energy per capita across countries (total and percentage change)
Notes: kWh = kilowatt hour; “World” refers to the world’s average. Source: calculations derived from IEA (2014d), “World energy balances”, IEA World Energy Statistics and Balances (database), http://dx.doi.org/10.1787/data-00512-en.
Key message • Compared with developed countries, buildings final energy use per capita in China
remains low and less than the world average level, despite an increase of more than 25% between
2000 and 2012.
World
Canada
China
European Union
France Germany
India
Italy
Japan United Kingdom
United States
0
5 000
10 000
15 000
20 000
25 0002000 2002 2004 2006 2008 2010 2012
kWh/capit
a
World
Canada
China
European Union
France
Germany
India
Italy
Japan
United Kingdom
United States
-20%
-15%
-10%
-5%
0%
5%
10%
15%
20%
25%
30%
2000 2002 2004 2006 2008 2010 2012
Perce
nt chan
ge rela
tive to
2000

© OECD/IEA 2015 Buildings Energy Use in China Transforming Construction and Influencing Consumption to 2050
Page | 85
Figure C2 • Residential final energy per household across countries (total and percentage change)
Source: calculations derived from IEA (2014d), “World energy balances”, IEA World Energy Statistics and Balances (database), http://dx.doi.org/10.1787/data-00512-en.
Key message • Due to energy efficiency improvements, smaller family size, and a shift in rural homes
from very inefficient biofuels to commercial energy (mostly coal and LPG), China’s residential final
energy use per household grew by less than 5% from 2000 to 2012.
World
Canada
China
European Union
France Germany
India
Italy
Japan
United Kingdom
United States
0
5 000
10 000
15 000
20 000
25 000
30 000
35 0002000 2002 2004 2006 2008 2010 2012
kWh/ho
usehold
World
Canada
China
European Union
France Germany
India
Italy
Japan
Korea
United Kingdom
United States
-25%
-20%
-15%
-10%
-5%
0%
5%
10%
15%
2000 2002 2004 2006 2008 2010 2012
Perce
nt chan
ge rela
tive to
2000
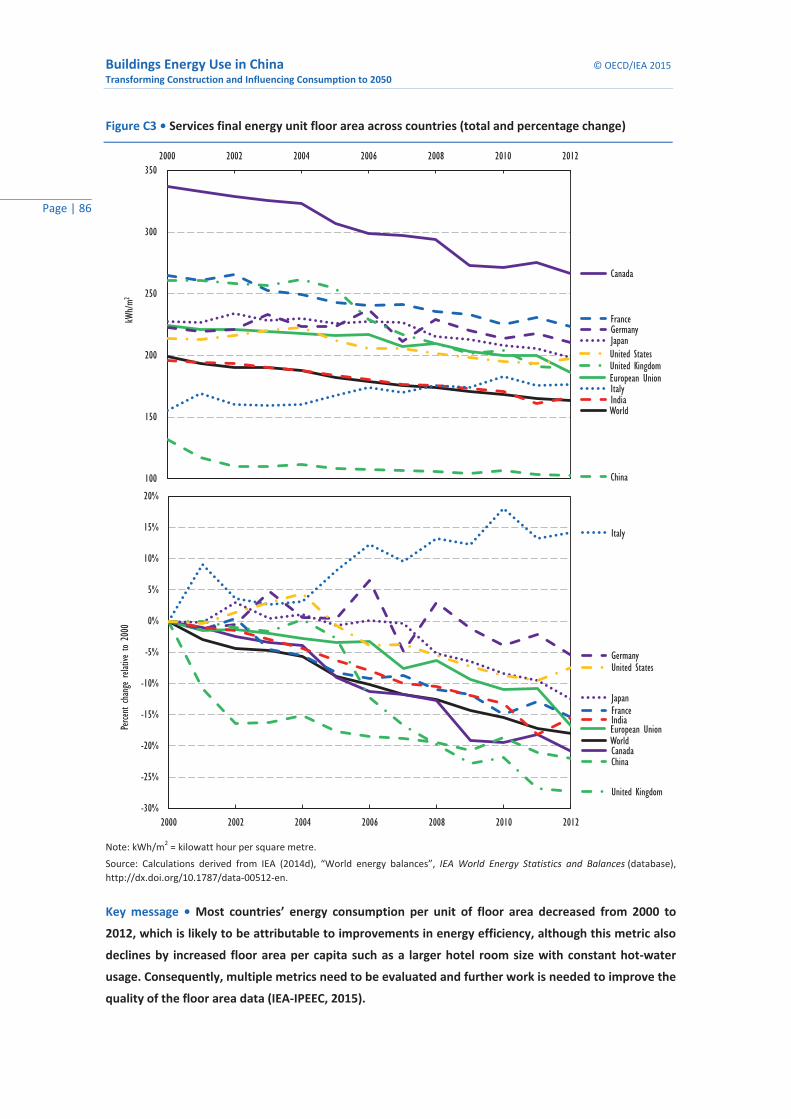
Buildings Energy Use in China © OECD/IEA 2015 Transforming Construction and Influencing Consumption to 2050
Page | 86
Figure C3 • Services final energy unit floor area across countries (total and percentage change)
Note: kWh/m2 = kilowatt hour per square metre. Source: Calculations derived from IEA (2014d), “World energy balances”, IEA World Energy Statistics and Balances (database), http://dx.doi.org/10.1787/data-00512-en.
Key message • Most countries’ energy consumption per unit of floor area decreased from 2000 to
2012, which is likely to be attributable to improvements in energy efficiency, although this metric also
declines by increased floor area per capita such as a larger hotel room size with constant hot-water
usage. Consequently, multiple metrics need to be evaluated and further work is needed to improve the
quality of the floor area data (IEA-IPEEC, 2015).
World
Canada
China
European Union
France Germany
India Italy
Japan
United KingdomUnited States
100
150
200
250
300
3502000 2002 2004 2006 2008 2010 2012
kWh/m2
World Canada China
European Union
France
Germany
India
Italy
Japan
United Kingdom
United States
-30%
-25%
-20%
-15%
-10%
-5%
0%
5%
10%
15%
20%
2000 2002 2004 2006 2008 2010 2012
Perce
nt chan
ge rela
tive to
2000
© OECD/IEA 2015 Buildings Energy Use in China Transforming Construction and Influencing Consumption to 2050
Page | 87
Annex D. Heat pump technology
Air-source heat pumps in cold climates
Conventional air-source heat pumps (ASHPs) are not highly efficient in very cold climates because of large temperature lifts (gradients between exterior temperatures and output temperatures), and they often need to heat (defrost) system coils at sub-freezing temperatures. ASHPs in moderately cold climates function with a defrost cycle that is an energy penalty, because electric resistance heat is used to provide adequate heat supply to the conditioned space while the heat pump coil is defrosting. Despite this, conventional ASHP efficiency over the entire heating season, including fluctuating temperatures, is usually at least 2.5 times greater than a heating system relying purely on electric resistance heaters (i.e. 250% efficient, or a coefficient of performance [COP) of 2.5). When ambient temperatures drop too low (approximately -10°C to -25°C), ASHP performance deteriorates, causing the heat pump to have the same efficiencies as a typical electric resistant heater (e.g. 100%).
The International Energy Agency (IEA) Implementing Agreement (IA) for Heat Pumping Technologies is a programme of research, development, demonstration and promotion of heat pumps. It has a research project underway to improve the performance of heat pumps in cold climates. This type of research should be a high priority for China and other cold climate countries, as it could significantly increase the efficiency of heating equipment during cold winter months.
Thermally driven heat pumps
Thermally driven heat pumps operate on the same principle as a vapour compression cycle. Instead of mechanically compressing a working fluid using a motor, thermally driven technologies use heat to drive the heat pump process.35 In recent years, large-scale, thermally driven heat pumps have become more common, especially where using gas incurs lower costs than using electrically driven chillers. Regulations and incentives to reduce electricity demand during peak hours have also encouraged increased adoption of thermally driven gas heat pumps.
While the predominant use of gas thermal heat pumps has been for space cooling, when market pricing conditions favoured their use over electrically driven systems, the current interest is primarily for the heating mode. The IEA is aware of significant research going on in Germany, France, Japan and the United States to develop air-source gas thermal heat pumps that could result in a major shift in energy efficiency by replacing the best performing condensing gas boilers. The IEA called for the development of affordable gas thermal heat pumps with COPs of at
35 See Transition to Sustainable Buildings: Strategies and Opportunities to 2050 (IEA, 2013c) for further information.
Buildings Energy Use in China © OECD/IEA 2015 Transforming Construction and Influencing Consumption to 2050
Page | 88
least 1.2, which would offer an efficiency improvement of at least 25% over the best available boilers (IEA, 2013c). However, recent research development within the IEA Technology Network (Energy in Buildings and Community Programmes Implementing Agreement, Annex 43) has shown that COP performance in the range of 1.5 to 1.8 is possible. Furthermore, a field study is currently underway in France, in collaboration with GrDF, on units with comparable performance where the main focus is on providing space heating (BoostHEAT, 2015).
China will require a wide variety of solutions to pursue a more efficient future. In such a large and diverse country, coal or gas boilers are likely to be used for space heating in many applications for a long time to come. These applications may be part of district energy networks or could be for individual buildings. For this reason, pursuing an R&D plan to develop high-performance gas thermal heat pumps should be a high priority in China, given that they could potentially more than double the current efficiencies for space heating. When advanced heating solutions are combined with more efficient buildings envelopes, overall space-heating consumption can be reduced in the order of 70% to 90%. Making alternative individual systems available could also create more competitive market conditions, which would enable the economy to select the best performing systems. This could result in large-scale improvement in district heating networks or in the abandonment of lower performing networks in favour of individual building solutions. The variety of space heating alternatives are multiple, but a variety of electric and gas thermal heat pumps that use air, waste heat, waste water, ground water, etc. will provide a broad range of technology opportunities.
Tsinghua University’s research focuses on the development and application of absorption heat pumps (AHPs), or the absorption heat exchangers (AHEs) in heating systems, particularly for waste heat recovery. One of the main functions of AHPs and AHEs is to adjust the gradient of the heat to meet various demands, with a key objective being to reduce the temperature of return water in the primary network. With lower return water temperatures, the capacity of hot-water systems can be enlarged significantly without increasing pump power consumption. Furthermore, waste heat can be recovered at lower temperatures. AHPs can be applied to district heating systems to decrease the return water temperature to as low as 25°C, with the only additional energy input being pump energy.
Very low-cost heat pumps
With large quantities of coal being used in rural parts of China for space heating, the pursuit of alternative heating approaches is critical. Conventional heat pumps that provide high levels of comfort in a wide range of conditions are generally too expensive for low-income rural populations. Initiatives to develop a very low-cost heat pump (heat-only mode) for rural locations that have access to electricity should be a priority in China. This could accelerate the transition away from traditional biofuels and coal use to equipment that can leap-frog conventional electric resistance heaters or other inefficient boiler systems by being more efficient. These low-cost heat pumps may not be sufficient for heat during all heating hours of the year, but could offer overall economic, energy and health benefits to rural households.
© OECD/IEA 2015 Buildings Energy Use in China Transforming Construction and Influencing Consumption to 2050
Page | 89
Beyond the development of such systems, it would be essential to launch market adoption and diffusion plans. For example, highly subsidised deployment of very low-cost heat pumps could reduce overall CO2 emissions and reduce high levels of particulates from the burning of coal and biofuels, while being a far less expensive mitigation strategy than other measures currently being pursued or considered for the future.
Heat pump water heaters
Heat pump water heaters (HPWHs) have the potential to improve electric resistance water-heating efficiency by as much as 50%, to over 400% (IEA, 2013c). Japan is currently the only country where HPWHs have a significant share of the market, exceeding sales of over 500 000 units per year (IEA, 2014c). The United States has made significant progress on the development of low-cost HPWH technology, with a selling cost that is approximately one-third that in Europe. However, sales in the United States remain around one-fortieth of those in Japan on a per capita basis. Europe’s sales per capita are also very low.
Many HPWH designs are large and only market viable and cost effective if they are installed in locations with large water-heating demand. China’s water heating demand per household is very low compared to most developed countries, while Japan has one of the largest hot-water heating demands per capita in the world due to cultural preferences. On the surface, it therefore appears that HPWHs may not be well suited to China. However, in large multi-family buildings, HPWHs can be installed to serve multiple apartment units. This may be a challenge in existing buildings, but they could easily be incorporated in newly constructed buildings.
One significant barrier in China is that the purchase of a water-heating unit is seen as a requirement of the apartment owner rather than the builder (a classic example of a split incentive). Generally, most apartments are sold without appliances, water heaters or air conditioners, being the responsibility of the apartment owner. Integrating water heating into the basic building design would therefore change this philosophy and may be resisted by builders. It should, however, be possible through the building energy code process. A large unit providing hot water to several apartments is also likely to require sub-metering to ensure energy conservation behaviour is adopted. These barriers are not insurmountable and will require policy intervention, particularly in the design of new buildings. If these types of hot-water systems are not pursued for new construction designs now, then it may be difficult to implement them later (e.g. alongside urban solar thermal systems and as possible combination units).
Buildings Energy Use in China © OECD/IEA 2015 Transforming Construction and Influencing Consumption to 2050
Page | 90
Acronyms, abbreviations and units of measure
Acronyms and abbreviations
2DS ETP 2°C Scenario 6DS ETP 6°C Scenario AC air conditioning ACH air changes per hour AHE absorption heat exchanger AHP absorption heat pump ASEAN Association of Southeast Asian Nations ASHP air-source heat pump CBEM China Building Energy Model (TU) CDD cooling degree days CFL compact fluorescent lamp CO2 carbon dioxide COP coefficient of performance CPB commercial and public buildings DHC district heating and cooling EBC Energy in Buildings and Communities Programme (IEA) EDC Energy Data Centre (IEA) EEI energy efficiency indicator ERI, NDRC Energy Research Institute, National Development and Reform Commission ESCO energy services company ETP Energy Technology Perspectives EUI Energy usage intensity GDP gross domestic product HDD heating degree days HPWH heat pump water heater HSCW hot summer and cold winter HSWW hot summer and warm winter HVAC heating, ventilation and air conditioning IEA International Energy Agency IEA ETP Energy Technology and Policy Division (IEA) IMF International Monetary Fund IPEEC International Partnership for Energy Efficiency Cooperation LBNL Lawrence Berkeley National Laboratory LPG liquefied petroleum gas MOHURD Ministry of Housing and Urban-Rural Development (China) NBS National Bureau of Statistics (China)
© OECD/IEA 2015 Buildings Energy Use in China Transforming Construction and Influencing Consumption to 2050
Page | 91
NCSC, NDRC National Center for Climate Change Strategy and International Cooperation, National Development and Reform Commission
NUH northern urban heating OECD Organisation for Economic Co-operation and Development ORNL Oak Ridge National Laboratory PNNL Pacific Northwest National Laboratory PPP purchasing power parity R&D research and development RESNET Residential Energy Services Network (United States) SPT Sustainable Energy Policy and Technology Directorate (IEA) TEC typical energy consumption TCE tonne coal equivalent TU Tsinghua University UN IRES United Nations International Recommendations on Energy Statistics USD US dollar YRB Yangtze River Basin (China)
Units of measure
EJ exajoule (10^18 joules) GJ gigajoule (10^9 joules) Gt gigatonne (10^9 tonnes) kWh kilowatt (10^3 watts) hour m2 square metre Mt million tonnes (10^6 tonnes) PJ petajoule (10^15 joules) tCO2 tonne of carbon dioxide TWh terawatt (10^12 watts) hour

Buildings Energy Use in China © OECD/IEA 2015 Transforming Construction and Influencing Consumption to 2050
Page | 92
Definitions Biofuels: Biofuels are fuels derived from biomass or waste feedstocks, and include ethanol and biodiesel. They can be classified as conventional and advanced biofuels according to the technologies used to produce them and their respective maturity.
Biomass: Biological material that can be used as fuel or for industrial production. It includes solid biomass such as wood, plant and animal products, gases and liquids derived from biomass, industrial waste and municipal waste.
Final energy consumption: Refers to the energy used at a site that includes all sources, such as natural gas, coal, electricity, solar thermal, biofuels and commercial heat from district heating networks. However, it does not include the fuel burned or other sources of energy to generate electricity or the heat of district heating networks.
Liquefied petroleum gases (LPG): LPG refers to liquefied propane (C3H8) and butane (C4H10) or mixtures of both. Commercial grades are usually mixtures of the gases with small amounts of propylene, butylene, isobutene and isobutylene stored under pressure in containers. It is considered a component of oil by international standard classification.
Primary energy consumption: Refers to the full energy associated with the buildings sector, including the final energy consumption along with all of the fuels and other energy sources that are used to generate electricity and heat, including any associated generation and distribution losses.
Residential sub-sector: The residential sub-sector includes those activities related to dwellings, whether single-family homes or multi-family buildings. It covers all energy-using activities in apartments and houses, including space and water heating, cooling, lighting and the use of appliances. It does not include energy used for personal transport, which is covered in the transport sector.
Services sub-sector: The services sub-sector includes activities related to trade, finance, real estate, public administration, health, food and lodging, education and commercial services (International Standard Industrial Codes 50 to 55 and 65 to 93). It is also referred to as the commercial and public services sub-sector. It covers energy used for space heating, cooling and ventilation, water heating, lighting, and for other miscellaneous equipment such as commercial appliances and cooking devices, x-ray machines, office equipment and generators. Energy used for transport, or for commercial transport fleets, is excluded from the services sub-sector.

© OECD/IEA 2015 Buildings Energy Use in China Transforming Construction and Influencing Consumption to 2050
Page | 93
References BoostHEAT (2015), boostHEAT Residential Heat Pump Boiler Field Trials,
DOI: www.boostheat.com/en/fieldtrials.
EES (Energy Efficiency Strategies) (2014), Energy Standards and Labelling Programs Throughout the World in 2013, Victoria, Australia.
DB (China Regional Building Code) (2013), Design standard for residential buildings of low energy consumption (DB42/T 559-2013), regional building code, Hubei.
DB (2011), Design standard for energy efficiency of residential buildings (DGJ08-205-2011), regional building code, Shanghai.
DB (2008), Design standard of thermos-environmental and energy conservation for residential buildings in Jiangsu Province (DBJ32/J 71-2008), regional building code, Jiangsu.
Euroheat and Power (2015), District Heating and Cooling: Country by Country 2015 Survey, DOI: www.euroheat.org/Publications-8.aspx?PID=211&M=NewsV2&Action=1&NewsId=557, Brussels.
Euroheat and Power (2013), District Heating and Cooling: Country by Country 2013 Survey, DOI: www.euroheat.org/Publications-8.aspx?PID=211&M=NewsV2&Action=1&NewsId=274, Brussels.
GB (China National Building Code) (2014), Evaluation standard for green building (GB/T 50378-2014), China.
GB (2013), Energy efficiency labelling rules for speed-controlled room air conditioner (GB21455-2013), China.
GB (2012), Energy efficiency design standard for residential buildings in hot summer and warm winter zones, China.
GB (2011), Energy efficiency labelling rules for domestic solar water heater (GB26969-2011), China.
GB (2010a), Energy efficiency design standard for residential buildings in cold and severe cold zones (JGJ26-2010), China.
GB (2010b), Energy efficiency design standard for residential buildings in hot summer and cold winter zones (JGJ134-2010), China.
GB (2010c), Energy efficiency labelling rules for clothes washer (GB12021.3-2010), China.
GB (2005), Energy efficiency design standard for public buildings (GB50189-2005), China.
GB (1993), Thermal design code for civil building (GB 50176-93), China.
GBPN (2013), “What is a deep renovation definition?” Technical Report, Global Buildings Performance Network, Paris.
IEA (International Energy Agency) (forthcoming), Energy Technology Perspectives 2016, OECD/IEA, Paris.
IEA (2015a), Energy Technology Perspectives 2015, OECD/IEA, Paris, www.iea.org/etp/etp2015.
IEA (2015b), Statistics Database, OECD/IEA, Paris, www.iea.org/statistics/statisticssearch, OECD/IEA, Paris.
IEA (2015c), “Tracking clean energy progress 2015”, excerpt from Energy Technology Perspectives 2015, IEA Input to the Clean Energy Ministerial, OECD/IEA, Paris.
Buildings Energy Use in China © OECD/IEA 2015 Transforming Construction and Influencing Consumption to 2050
Page | 94
IEA (2014a), Energy Efficiency Indicators: Essentials for Policy Making, DOI: http://dx.doi.org/10.1787/9789264215665-en, OECD/IEA, Paris.
IEA (2014b), Energy Efficiency Indicators: Fundamentals on Statistics, DOI: http://dx.doi.org/10.1787/9789264215672-en, OECD/IEA, Paris.
IEA (2014c), Tracking Clean Energy Progress 2014: Energy Technology Perspectives 2014 Excerpt IEA Input to the Clean Energy Ministerial, OECD/IEA, Paris.
IEA (2014d), “World energy balances”, IEA World Energy Statistics and Balances (database), http://dx.doi.org/10.1787/data-00512-en, (accessed on 11 March 2015), OECD/IEA, Paris.
IEA (2014e), World Energy Outlook 2014, DOI: www.worldenergyoutlook.org/publications/weo-2014/ , OECD/IEA, Paris.
IEA (2013a), Modernising Building Energy Codes to Secure our Global Energy Future, DOI: www.iea.org/publications/freepublications/publication/PolicyPathwaysModernisingBuildingEnergyCodes.pdf, OECD/IEA, Paris.
IEA (2013b), Technology Roadmap: Energy Efficient Building Envelopes, DOI: www.iea.org/publications/freepublications/publication/TechnologyRoadmapEnergyEfficientBuildingEnvelopes.pdf, OECD/IEA, Paris.
IEA (2013c), Transition to Sustainable Buildings: Strategies and Opportunities to 2050, DOI: http://dx.doi.org/10.1787/9789264202955-en, OECD/IEA, Paris.
IEA (2012), Technology Roadmap: Bioenergy for Heat and Power, OECD/IEA, Paris.
IEA (2010a), Energy Performance Certification of Buildings: A Policy Tool to Improve Energy Efficiency, OECD/IEA, Paris.
IEA (2010b), Monitoring, Verification and Enforcement: Improving Compliance within Equipment and Energy Efficiency Programmes, OECD/IEA, Paris.
IEA-IPEEC (International Partnership for Energy Efficiency Cooperation) (2015), Building Energy Performance Metrics: Supporting Energy Efficiency Progress in Major Economies, OECD/IEA, Paris.
IEA-SHC (IEA Solar Heating and Cooling Implementing Programme) (2014), Solar Heat Worldwide: Markets and Contribution to the Energy Supply 2012, Gleisdorf, Austria.
IMF (2014), World Economic Outlook Database, April, International Monetary Fund, Washington, D.C., www.imf.org/external/pubs/ft/weo/2014/01/weodata.
IPEEC (International Partnership for Energy Efficiency Cooperation) (2015), Delivering Energy Savings in Buildings: International Collaboration on Building Energy Code Implementation, OECD/IPEEC, Paris.
IPEEC (2014), Building Energy Rating Schemes: Assessing Issues and Impacts, OECD/IPEEC, Paris.
Liang, C. et al. (2015), “Progress and thinking on heat metering reform and energy saving renovation in North China”, Building Technology Journal (建设科技), Issue 9, pp. 12-16, DOI: http://jskj.cstcmoc.org.cn/zhengceyanjiu/2015/0602/868.html.
MDRC (Shanghai Municipal Development and Reform Commission) (2012), “Notice of residential electricity price pilot implementation in Shanghai”, Shanghai.
MOHURD (Ministry of Housing and Urban-Rural Development of the People’s Republic of China) (2014), Green Building Action Plan, Beijing.
MOHURD (2012), “The 12th five-year plan for building energy conservation”, Beijing.
© OECD/IEA 2015 Buildings Energy Use in China Transforming Construction and Influencing Consumption to 2050
Page | 95
MOHURD (2006), “Implementation of the requirement of new constructed building’s proportion”, Beijing.
NBS (National Bureau of Statistics of the People’s Republic of China) (2014), National Statistical Yearbook 2014, Beijing.
NDRC (National Development and Reform Commission of the People’s Republic of China) (2014), “National plan on climate change (2014-2020)”, Beijing.
NDRC (2011), China’s Roadmap to Ban Incandescent Lighting, Beijing.
PNNL (Pacific Northwest National Laboratory) (2014), Analysis of the Chinese Market for Building Energy Efficiency, DOI: www.pnnl.gov/main/publications/external/technical_reports/PNNL-22761.pdf, United States.
RIC (ResearchInChina) (2015), Global and China Low-e Glass Industry Report 2014-2017, DOI: www.researchinchina.com/Htmls/Report/2014/8029.html, Beijing.
Sibbitt, B. et al. (2012), “The performance of a high solar fraction seasonal storage district heating system – Five years of operation”, Energy Procedia, Vol. 30, pp. 856-865.
State Council (State Council of the People's Republic of China) (2014a), Energy Development Strategy Action Plan, Beijing.
State Council (2014b), National Plan on New Urbanisation for 2014 to 2020, Beijing.
State Council (2013a), 12th Five-Year Energy Development Plan, Beijing.
State Council (2013b), China’s Green Building Action Plan, Beijing.
TU (Tsinghua University) (2015), 2015 Annual Report on China Building Energy Efficiency, Tsinghua University Building Energy Research Center, Beijing.
TU (2014), 2014 Annual Report on China Building Energy Efficiency, Tsinghua University Building Energy Research Center, Beijing.
TU (2013), 2013 Annual Report on China Building Energy Efficiency, Tsinghua University Building Energy Research Center, Beijing.
TU (2012), 2012 Annual Report on China Building Energy Efficiency, Tsinghua University Building Energy Research Center, Beijing.
TU (2011), 2011 Annual Report on China Building Energy Efficiency, Tsinghua University Building Energy Research Center, Beijing.
TU (2010), 2010 Annual Report on China Building Energy Efficiency, Tsinghua University Building Energy Research Center, Beijing.
UN DESA (2014), World Population Prospects: The 2012 Revision, Medium-Fertility Variant, CD-ROM edition, United Nations Department of Economic and Social Affairs, Population Division, New York.
UNSD (United Nations Statistics Division) (2011), International Recommendations for Energy Statistics (IRES), draft version, New York.
Xinhuanet (2014), China-US Joint Announcement on Climate Change, Beijing, China, 12 November, http://news.xinhuanet.com/world/2014-11/12/c_1113221744.htm.
Wang, P. et al. (2014), “A new Chinese kang with forced convection: System design and thermal performance measurements”, Energy and Buildings, Vol. 85, pp. 410-415.
Zhou, X. et al. (2014), “Comparison and research about centralized and distributed air conditioning systems in residential buildings”, Heating Ventilating & Air Conditioning, Vol. 7, pp. 18-25.

Buildings Energy Use in China © OECD/IEA 2015 Transforming Construction and Influencing Consumption to 2050
Page | 96
Zhang, S. et al. (2010), “Comparative analysis of energy use in China building sector: current status, existing problems and solutions”, Frontiers of Energy and Power Engineering in China, Vol. 4, Issue 1, pp. 2-21.
Zhang, X. (forthcoming), Near Zero Energy Residential Building, Energy Foundation, Center of Science and Technology of Construction, Beijing.
This document and any map included herein are without prejudice to the status of or sovereignty over any territory, to the delimitation of international frontiers and boundaries and to the name
of any territory, city or area.
This publication reflects the views of the International Energy Agency (IEA) Secretariat but does not necessarily reflect those of individual IEA member countries. The IEA makes no
representation or warranty, express or implied, in respect to the publication’s contents (including its completeness or accuracy) and shall not be responsible for any use of, or reliance on,
the publication.
IEA Publications 9, rue de la Fédération, 75739 Paris cedex 15
Typesetting by Jouve - Printed in France by IEA, August 2015 Cover design: IEA. Photo credits: © Top : Flickr - Forgemind ArchiMedia; Middle : Flickr - IQRemix;
Bottom : GraphicObsession
The paper used has been produced respecting ecological, social and ethical standards.
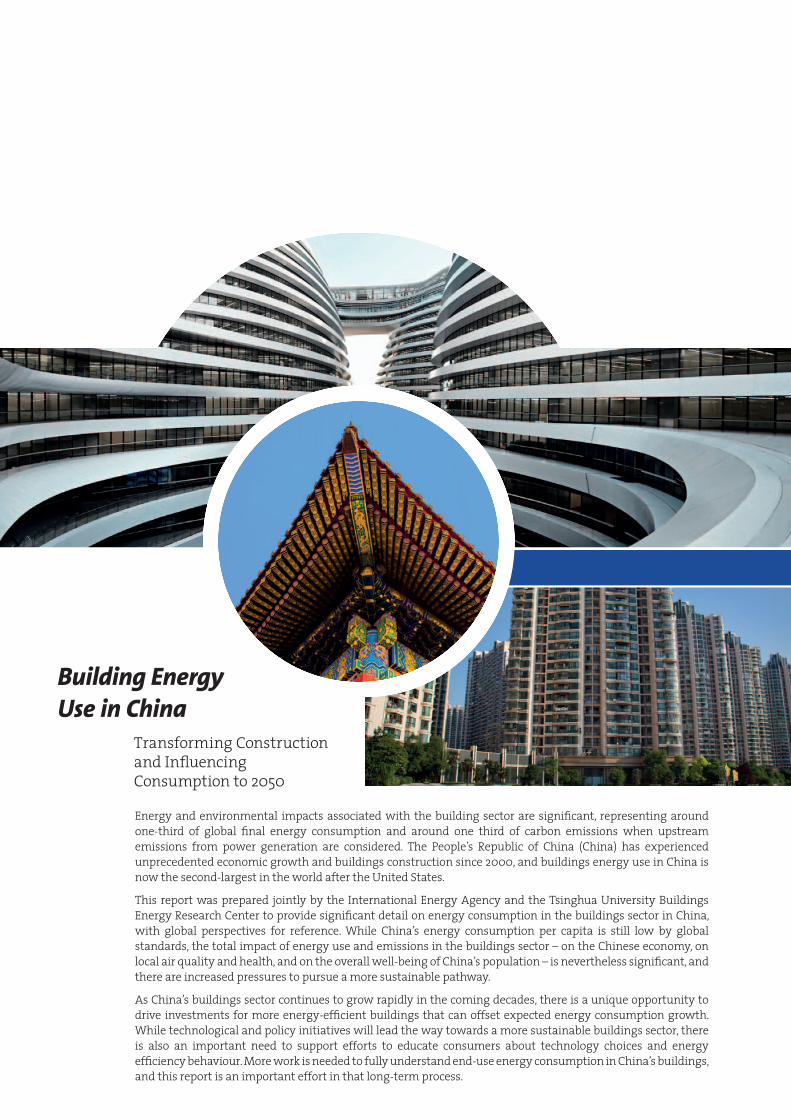
Building EnergyUse in China
Transforming Construction and Influencing Consumption to 2050
Energy and environmental impacts associated with the building sector are significant, representing around one-third of global final energy consumption and around one third of carbon emissions when upstream emissions from power generation are considered. The People’s Republic of China (China) has experienced unprecedented economic growth and buildings construction since 2000, and buildings energy use in China is now the second-largest in the world after the United States.
This report was prepared jointly by the International Energy Agency and the Tsinghua University Buildings Energy Research Center to provide significant detail on energy consumption in the buildings sector in China, with global perspectives for reference. While China’s energy consumption per capita is still low by global standards, the total impact of energy use and emissions in the buildings sector – on the Chinese economy, on local air quality and health, and on the overall well-being of China’s population – is nevertheless significant, and there are increased pressures to pursue a more sustainable pathway.
As China’s buildings sector continues to grow rapidly in the coming decades, there is a unique opportunity to drive investments for more energy-efficient buildings that can offset expected energy consumption growth. While technological and policy initiatives will lead the way towards a more sustainable buildings sector, there is also an important need to support efforts to educate consumers about technology choices and energy efficiency behaviour. More work is needed to fully understand end-use energy consumption in China’s buildings, and this report is an important effort in that long-term process.