particle formation in ambient mass ... - lsu digital commons
TRANSCRIPT

Louisiana State UniversityLSU Digital Commons
LSU Doctoral Dissertations Graduate School
2014
Particle formation in ambient mass spectrometryThabiso MusapeloLouisiana State University and Agricultural and Mechanical College
Follow this and additional works at: https://digitalcommons.lsu.edu/gradschool_dissertations
Part of the Chemistry Commons
This Dissertation is brought to you for free and open access by the Graduate School at LSU Digital Commons. It has been accepted for inclusion inLSU Doctoral Dissertations by an authorized graduate school editor of LSU Digital Commons. For more information, please [email protected].
Recommended CitationMusapelo, Thabiso, "Particle formation in ambient mass spectrometry" (2014). LSU Doctoral Dissertations. 574.https://digitalcommons.lsu.edu/gradschool_dissertations/574

PARTICLE FORMATION IN AMBIENT MASS SPECTROMETRY
A Dissertation
Submitted to the Graduate Faculty of the
Louisiana State University and
Agricultural and Mechanical College
in partial fulfillment of the
requirement for the degree of
Doctor of Philosophy
in
The Department of Chemistry
by
Thabiso Musapelo
B.A. Chemistry, Berea College, KY, 2008
May 2014

ii
ACKNOWLEDGEMENTS
I would like to thank Dr. Kermit Murray for offering me an opportunity to carry out this research
in his group, his guidance and help that made it possible for me to complete my work. To my
committee members, Dr. Jayne Garno and Dr. William Crowe thank you for your endless
support, time and advice. To my friends and Murray Research Group past and present members,
your encouragement, kindness and friendship is what kept me going and for that, I am very
thankful to all of you.
Special gratitude goes out to my parents, for always being there to love and care for me when I
am down, encouraging, and believing in me. To my lovely sister, Thato, thank you for being a
perfect friend I know I can always count on.

iii
TABLE OF CONTENTS
ACKNOWLEDGEMENTS ............................................................................................................ ii
LIST OF TABLES .......................................................................................................................... v
LIST OF FIGURES ....................................................................................................................... vi
LIST OF ABBREVIATIONS ...................................................................................................... viii
ABSTRACT ……… ...................................................................................................................... ix
CHAPTER 1. INTRODUCTION .............................................................................................. 1
1.1 Particles in Mass Spectrometry ...........................................................................................4
1.2 Methods for Particle Size Measurement ............................................................................12
1.3 Research Objectives ...........................................................................................................16
1.4 References ..........................................................................................................................16
CHAPTER 2. EXPERIMENTAL............................................................................................ 25
2.1 Particle Size Measurement System ....................................................................................25
2.2 Reagents and Standards .....................................................................................................33
2.3 References ..........................................................................................................................33
CHAPTER 3. PARTICLE FORMATION IN AMBIENT MALDI PLUMES ....................... 35
3.1 Introduction ........................................................................................................................35
3.2 Experimental ......................................................................................................................36
3.3 Results ................................................................................................................................36
3.4 Conclusions ........................................................................................................................48
3.5 References ..........................................................................................................................49
CHAPTER 4. PARTICLE FORMATION BY INFRARED LASER ABLATION ................ 52
4.1 Overview ............................................................................................................................52
4.2 Introduction ........................................................................................................................52
4.3 Experimental ......................................................................................................................54
4.4 Results ................................................................................................................................55
4.5 Discussion ..........................................................................................................................64
4.6 Conclusions ........................................................................................................................70
4.7 References ..........................................................................................................................71
CHAPTER 5. PARTICLE PRODUCTION IN REFLECTION AND TRANSMISSION:
IMPLICATIONS FOR LASERSPRAY IOINIZATION ............................................................. 75
5.1 Introduction ........................................................................................................................76
5.2 Experimental ......................................................................................................................78
5.3 Results ................................................................................................................................79
5.4 Conclusions ........................................................................................................................89

iv
5.5 References ..........................................................................................................................90
CHAPTER 6. SIZE DISTRIBUTIONS OF AMBIENT SHOCK-GENERATED PARTICLES
...….. .....................................................................................................................................94
6.1 Introduction ........................................................................................................................94
6.2 Experimental ......................................................................................................................95
6.3 Results ................................................................................................................................96
6.4 Conclusions ......................................................................................................................100
6.5 References ........................................................................................................................101
CHAPTER 7. CONCLUSIONS AND FUTURE DIRECTIONS ......................................... 103
APPENDIX A. PARTICLE SIZE CALCULATIONS STATISTICS ....................................... 106
APPENDIX B. SPECIFICATIONS FOR THE AERODYNAMIC PARTICLE SIZER .......... 107
APPENDIX C. SPECIFICATIONS FOR SCANNING MOBILITY PARTICLE SIZER ........ 108
APPENDIX D. LETTERS OF PERMISSION ........................................................................... 109
VITA……………………….. ..................................................................................................... 127

v
LIST OF TABLES
Table 3-1. Summary of physical properties of particles resulting from 337 nm UV laser ablation
of common solid MALDI matrixes at different laser fluences. .................................................... 42
Table 4-1. Summary of the physical properties of particles IR laser ablated from matrix
compounds at laser wavelength from 2.880 – 3.00 µm at a laser fluence of 8500 J/m2. .............. 67
Table 4-2. Summary of the physical properties of particles IR laser ablated from matrix
compounds at different laser fluences using 2.940 µm wavelength. ............................................ 68
Table 5-1. Particle size and concentration values for matrixes DHB, CHCA, SA, DHAP, and
NPG............................................................................................................................................... 82
Table 6-1. Concentration and average diameter of shock-generated particles ............................. 96

vi
LIST OF FIGURES
Figure 1-1. Schematic diagram of a general spray ionization method ........................................... 5
Figure 2-1. Experimental setup for particle detection by differential mobility analyzer and light
scattering aerodynamic particle sizer. ........................................................................................... 25
Figure 2-2. Schematic of light scattering aerodynamic particle sizer. .......................................... 26
Figure 2-3. Schematic of differential mobility analyzer (DMA). ................................................. 28
Figure 2-4. Schematic diagram of the condensation particle counter (CPC) ............................... 31
Figure 3-1. Particle size distribution measured in particle count at different laser fluences
increasing from 300 (black; bottom trace), 500 (green), 750 (blue), and 1100 J/m2 (red) for ..... 39
Figure 3-2. Total particle concentration as a function of laser fluence for (a) DHB, (b) NA, (c)
CHCA, and (d) SA irradiation. The error bars represent three standard deviations in the
measurement. ................................................................................................................................ 40
Figure 3-3. Average particle diameter as a function of laser fluence for (a) DHB, (b) NA, (c)
CHCA, and (d) SA. The error bars represent three standard deviations in the measurement. ..... 41
Figure 3-4. Mass weighted particle size distribution for (a) DHB, (b) NA, (c) CHCA, and (d) SA
at laser fluences of 300 (black; bottom trace), 500 (green), 750 (blue), and 1100 J/m2 (red). ..... 43
Figure 3-5. Ratio of mass ejected as coarse particles (>450 nm) and nanoparticles (<450 nm) as a
function of the laser fluence for (a) DHB, (b) NA, (c) CHCA, and (d) SA.................................. 44
Figure 4-1. Particle size distributions presented in a number concentration for a) BA b) CHCA ,
and c) glycerol at different laser fluences; 6000 (black), 7500 (green), 8500 (red) and 9500 J/m2
(blue). The laser wavelength was 2.94 µm. .................................................................................. 56
Figure 4-2. Mass weighted concentration plots for a) BA b) CHCA, and c) glycerol at different
laser fluences; 6000 (black), 7500 (green), 8500 (red) and 9500 J/m2 (blue). The laser
wavelength was kept constant at 2.940 µm. ................................................................................. 58
Figure 4-3. Plot of glycerol ablated particle number concentration as a function of wavelength, a)
2.88, b) 2.90, c) 2.92, d) 2.94, e) 2.960, f) 2.98, and g) 3.00 µm. ................................................ 60
Figure 4-4. Plot of BA particle mass concentration as a function of a) 2.880, b) 2.900, c) 2.920,
d) 2.940, e) 2.960, f) 2.980, and g) 3.00 µm at 8500 J/m2 fluence. .............................................. 61

vii
Figure 4-5. Particle concentration as a function of wavelength for a) BA, b) CHCA, and c)
glycerol at 8500 J/m2 fluence. ....................................................................................................... 62
Figure 4-6. Particle mass concentration as a function of wavelength for a) BA, b) CHCA , and c)
glycerol. ........................................................................................................................................ 63
Figure 4-7. Total concentration for coarse particles of glycerol at 8500 J/m2 laser fluence as a
function of wavelength for a) number concentration and b) mass weighted concentration. ........ 64
Figure 5-1. Schematic of inlet ionization a) laserspray ionization (LSI) and ............................... 77
Figure 5-2. Reflection mode particle size distribution measured in particle count at different laser
fluences increasing from 1400 (black), 1700 (green), 2000 (red), and 2300 J/m2 (blue) for
matrices: (a) DHB, (b) CHCA, (c) SA, (d) DHAP, and (e) NPG. ................................................ 81
Figure 5-3. Transmission mode particle size distribution measured in particle count at different
laser fluences increasing from 1400 (black), 1700 (green), 2000 (red,) and 2300 J/m2 (blue) for
matrices: (a) DHB, (b) CHCA, (c) SA, (d) DHAP, and (e) NPG. ................................................ 83
Figure 5-4. Reflection mode mass weighted particle size distribution for (a) DHB, (b) CHCA, (c)
SA, (d) DHAP, and (e) NPG at laser fluences 1400 (black), 1700 (green), 2000 (red), and 2300
J/m2 (blue). .................................................................................................................................... 85
Figure 5-5. Transmission mode mass weighted particle size distribution for (a) DHB, (b) CHCA,
(c) SA, (d) DHAP, and (e) NPG at laser fluences 1400 (black), 1700 (green), 2000 (red), and
2300 J/m2 (blue). ........................................................................................................................... 86
Figure 6-1. Particle number concentration as a function of size for impact-formed particles from
MALDI matrices: (a) DHB, (b) NA, (c) SA, (d) DHAP, and (e) NPG. ....................................... 97
Figure 6-2. Particle mass concentration as a function of size for impact-formed particles from
MALDI matrices: (a) DHB, (b) NA, (c) SA, (d) DHAP, and (e) NPG. ....................................... 98
Figure 7-1. Particle size analyzer coupled to mass spectrometry for size selection. .................. 104

viii
LIST OF ABBREVIATIONS
AFM
APCI
AP-MALDI
APS
CPC
DESI
DMA
ELDI
ESI
IR
LDI
LSII
MAII
MALDESI
MALDI
OPO
SMPS
SSI
UV
atomic force microscopy
atmospheric pressure chemical ionization
atmospheric pressure matrix-assisted laser desorption ionization
aerodynamic particle sizer
condensation particle counter
desorption electrospray ionization
differential mobility analyzer
electrospray laser desorption ionization
electrospray ionization
infrared
laser desorption ionization
laserspray inlet ionization
matrix-assisted inlet ionization
matrix-assisted laser desorption electrospray ionization
matrix-assisted laser desorption ionization
optical parametric oscillators
scanning mobility particle sizer
sonic spray ionization
ultraviolet

ix
ABSTRACT
A particle sizing system was developed that couples a light scattering particle sizer with a
differential mobility analyzer for particle detection and elucidation with the capability for
measuring particle sizes in the range of 10 nm to 20 µm. The particle sizing system was used to
investigate particle formation that is associated with several methods of atmospheric pressure ion
formation used in mass spectrometry: atmospheric pressure matrix-assisted laser desorption
ionization (MALDI) and inlet ionization. The methods for particle formation were 1) ultraviolet
(UV) laser ablation, 2) infrared (IR) laser ablation, and 3) shock-generated particle formation.
Particles formed by UV laser irradiation of solid MALDI matrix materials were analyzed at laser
fluences from 300 J/m2 to 1100 J/m
2. It was discovered that a large number of ejected particles
were nanoparticles in the range of 40 nm to 200 nm. These particles were attributed to
hydrodynamic sputtering of melted matrix with additional contribution from agglomeration of
smaller particles and clusters. A relatively large mass of particulate was observed between 500
nm and 2 µm and was attributed to spallation and matrix melting. A third local maximum of
particle size was observed between 10 and 30 nm and attributed to direct ejection of clusters.
Particle size measurements were made at IR laser wavelengths between 2.8 and 3.0 µm. The
laser fluence and wavelength dependence of particle sizes from IR irradiation of glycerol and
three solid matrices were investigated. The distribution of particles was characterized by a large
concentration of clusters with diameters near 20 nm and large fraction of the ejected mass as
coarse particle with diameters greater than 1 μm. The wavelength dependence revealed a shift for
the maximum particle production with respect to the IR absorption of the matrix compounds that
is attributed to heating and disruption of the hydrogen bonds in the matrix that shifts the
absorption to shorter wavelengths. Particle formation under inlet ionization conditions was

x
investigated with the goal of elucidating the ionization mechanism of this technique. In inlet
ionization, ions are formed from particles directed toward the inlet of mass spectrometer either
directly from powder or by laser ablation of particles. The particle size measurements revealed a
high concentration of particles with diameters near 10 nm was observed in both shock-generated
particle formation and transmission mode laser ablation. Matrix compounds with high efficiency
for inlet ionization had a high concentration of clusters. The high concentration of clusters is
consistent with postulated mechanisms for inlet ionization.

1
CHAPTER 1. INTRODUCTION
High energy pulsed lasers are efficient tools for sampling in chemical analysis because they
can be efficiently directed at specific areas of a sample to remove small quantities for analysis.
Several analytical methods use pulsed lasers to remove material for chemical analysis including
laser ablation inductively coupled plasma atomic emission spectroscopy (ICP-AES),1-1-2
laser
ablation inductively coupled plasma mass spectrometry ICP MS3-5
laser induced breakdown
spectroscopy (LIBS),6-8
and laser desorption ionization mass spectrometry,9 including matrix-
assisted laser desorption ionization (MALDI) mass spectrometry.10
In all of these materials
processing and analysis methods, it is important to know the quantity and size distribution of the
material that is ablated.
It is especially important to understand the role of particles in ambient ionization, the
formation of ions that occurs under ambient conditions of pressure and temperature.11
Ambient
ionization methods can use metastable ions12
or charged droplets13
directed at a sample surface to
remove material for ionization. Lasers can also be used for ambient ionization by removing
material from a sample under ambient conditions for direct ionization away from the surface. One
mode of off-surface ionization is electrospray: the laser desorbs or ablates material that combines
with the charged electrospray droplets for ionization. The material can be removed directly without
a matrix (in analogy to laser desorption ionization) in a technique called electrospray laser
desorption ionization (ELDI).14
When a matrix is used, the technique is called matrix-assisted laser
desorption electrospray ionization (MALDESI).15
Laser material removal can also be combined
with metastable cluster ionization16-17
or the ablated material can be captured for ionization by
electrospray or MALDI.18-19
Ion formation in these methods may result from the desorption or
ablation of free molecules, molecular clusters, or particles from the samples.20
A recently

2
developed matrix assisted inlet ionization method has been shown to produce ions through ambient
laser particle generation or by direct introduction of particles into a heated ion source.21
In all of
these ionization methods, particles are thought to play a role yet the number and size distribution
of particles generated under the conditions leading to ion formation is not well characterized.
Most studies of particle formation in mass spectrometry have concentrated on MALDI.
Molecular dynamics simulations have been used to model laser desorption and ablation under the
conditions used for MALDI and laser-based ambient ionization.22-24
In these studies, the matrix is
simulated by breathing spheres with a single vibrational mode and the analyte is modeled using a
simple bead and spring approach. In a MALDI experiment, the laser pulse width is on the order of
10 ns, which places the system in the regime of thermal confinement since the laser pulse is short
compared to the thermal diffusion out of the irradiated region. Because the laser pulse is longer
than the mechanical relaxation of the system (limited by the propagation of acoustic waves in the
sample), the system is not in the regime of stress confinement. The model predicts distinct
thresholds for desorption of individual molecules and the ablation of clusters and nanoparticles.
Analyte ejection is observed only above the ablation threshold.23
Molecular dynamics simulations
have been combined with a theoretical treatment of ionization that includes radiative and
nonradiative energy transfer, exciton hopping, energy pooling, and electron capture.15, 25
Analyte
molecules are observed as components of ejected clusters resulting from phase explosion
(explosive boiling of superheated material) and spallation, although the modeling is limited by the
size of the computational cells to the simulation of particles with diameters up to tens of
nanometers.
There have been several experimental studies aimed at the direct measurement of particle
size and concentration under MALDI conditions. In one study, particles were produced under

3
vacuum with an ultraviolet (UV) laser from a thin film of a 2,5-dihydroxybenzoic acid (DHB)
matrix and poly(ethylene glycol) analyte.26
The particle size was determined by atomic force
microscopy of the collected particles, and it was found that particles approximately 200 nm in
diameter were ejected and that the ratio of molecules to particles increased at higher energies. In
another study, a differential mobility particle sizer was used to measure nanometer-sized particles
ejected from a MALDI target at atmospheric pressure.27
Two maxima in the particle size
distributions were found: clusters near 10 nm in size and nanoparticles in the 100 to 200 nm range.
In our laboratory, a light scattering particle sizer was used to obtain the concentration and size
distributions of coarse particles larger than 500 nm from MALDI matrix thin films at atmospheric
pressure using a 337 nm UV laser.28
It was found that a significant fraction of the material ablated
under MALDI conditions is removed as coarse particulate. Similar studies were performed with a
wavelength tunable IR laser.29
Previous particle size studies have been limited by the available particle size measurement
instrumentation. Differential mobility analyzers are limited to particle sizes lower than 500 nm,
and light scattering particle sizers are limited to particles with diameters greater than
approximately 500 nm. In the work described in this thesis, we developed an approach that uses
both instruments to measure the full range of particle sizes. The use of DMA and light scattering
particle sizers in parallel to measure the full range of particle sizes from 10 nm to 20 μm are
described herein. Several solid MALDI matrix materials (that are also suitable for MALDESI and
inlet ionization) were irradiated with a pulsed 337 nm laser. The full range of particle sizes was
measured simultaneously.
In another study, particle formation at IR laser wavelengths and various fluences were
investigated. The physical processes leading to particle formation and the particle`s role in

4
ionization mechanisms were elucidated. In a final study, the role of particles in inlet ionization
was investigated.
An overview of particle formation in mass spectrometry is presented in this chapter. The
ionization techniques in ambient mass spectrometry are discussed with their corresponding
mechanism and specific applications. Furthermore, particle size measurements in mass
spectrometry are reviewed while outlining their advantages and their drawbacks.
1.1 Particles in Mass Spectrometry
Particle formation can play a large role in a variety of spray and laser ablation mass
spectrometry. Laser ablation is one of the most versatile solid sampling techniques in mass
spectrometry.30
Laser ablation can lead to ejection of clusters and particles and changes in laser
parameters such as fluence or wavelength can lead to formation of particles of different sizes and
concentrations. This means that clusters and particles of different sizes can be part of the material
ejected in every laser ablation based mass spectrometry method and can be a significant factor to
ion production.
In spray ionization methods, particles are created directly from the desolvation of droplets
by heat, electric field, statistical charging, or by gas flow. In some of these ionization techniques,
particles are formed by laser ablation of the sample which then interacts with the spray of droplets.
1.1.1 Spray Methods
For ambient mass spectrometry applications, spray ionization methods are used to produce
ions and their carriers (droplets and particles), which then transfer their charge to the neutral
analyte molecules for analyte ion formation.31
In general, the charged droplets are desolvated and
subjected to processes where ions are generated through different processes depending on each
type of spray ionization. Figure 1-1 illustrates a general diagram of spray ionization. The spray is

5
not always directed towards the mass spectrometer, for example as in desorption electrospray
ionization DESI where the analyte is desorbed from the target by the spray directed at the target.
The spray can be generated by different means, for example by applying a voltage to the spray
needle, applying heat, or simply relying on statistical droplet.
Figure 1-1. Schematic diagram of a general spray ionization method
One of the first spray interfaces developed for mass spectrometry was the monodisperse
aerosol generation interface for liquid chromatography/ mass spectrometry which is a spray
technique based on a particle beam interface.32
The monodisperse aerosol generation interface uses
pneumatic nebulization into the desolvation chamber to produce small uniform particles. The
liquid jet produced from the interface is broken down at the exit of controlled capillary through
natural instabilities (Rayleigh instability) into small particles. Volatile components of the aerosol
evaporate and are eliminated before the particles enter the mass spectrometer. Subsequently, these
particles are then faced with a perpendicular gas flow which disperses the particles and prevents
agglomeration.33
Desolvated analyte is eventually directed into mass spectrometer.34-35
The
advantage of this particle beam interface in removal of the solvent from the aerosol is that it
enables easy implementation of chemical ionization and electron ionization.34

6
Thermospray involves the vaporization of a liquid as it passes through a heated capillary
tube: heat is used to liberate the sample intact from the condensed phase to the vapor phase.36
A
supersonic jet of vapor is created (normally containing a mist of fine particles and solvent droplets)
with nonvolatile molecules in the solution retained within the charged droplets that are
formed.37
Droplets from the spray contain a statistical imbalance of charges and shrink in size and
produce ions through various gas phase ion chemistry mechanisms.38
Molecular ions with a few
solvent molecules gradually evaporate from the superheated droplets assisted by the high local
electrical fields generated by the charge on the droplet.36
Gas phase ion/molecules reactions have a
strong influence the on relative ion intensity.38-39
Thermospray is a soft (low fragmentation)
ionization method that ionizes small molecules efficiently.
Atmospheric pressure chemical ionization (APCI) is a soft spray ionization method that is a
variant of chemical ionization (CI) which operates with a spray at atmospheric pressure.40
In APCI,
the evaporated solvent is ionized in a corona discharge to form reagent ions.41-42
The reagent ions
go through ion-molecule reactions that lead generation of analyte ions. Inside the APCI source,
analyte molecules are desolvated inside the heated vaporizer tube and introduced to the ion
molecule reaction portion of the source which is at atmospheric pressure.43
At atmospheric
pressure, there are collisions of reagent ions with analyte molecules leading to the formation of
analyte ions.42
Electrospray ionization (ESI) method is a soft spray ionization that can be used to ionize a
variety of analytes from biopolymers to nucleic acids and proteins of very high molecular weight
resulting with multiply charged ions.44
Analyte ions are generated when a sample solution is
sprayed through a high voltage needle at the tip of the capillary.45
The liquid coming out of the
electrospray needle disperses a fine mist of highly charged droplets.46
These charged droplets
7
move towards an oppositely charged electrode under atmospheric pressure conditions. The solvent
evaporates and the charge density on the droplets builds to the point where surface tension is equal
to Coulomb repulsion at the Rayleigh limit.45
At this point, smaller particles are ejected.46
These
smaller droplets eventually lead to the release of highly charged gas phase ions that can be
detected by mass spectrometer.
Nano-electrospray ionization is a form of ESI which utilizes smaller needle orifices and
flow rates on the order of nL/min.47
This leads to generation of smaller droplets and relatively high
analyte ion signal for a solution of given concentration.48
Ambient ionization is any method that permits the ionization of samples outside the mass
spectrometer, with minimal sample preparation.11, 49
Several ambient ionization methods have been
developed and they employ different mechanisms to create ions for mass spectrometric analysis.12,
50-52 In ambient ionization material is liberated from a solid or liquid sample in a number of
different ways, for example by laser irradiation or by bombardment with charged droplets or ions.
Most ambient ionization techniques require no sample preparation and this makes them ideal for
analysis of the surface composition of different condensed phase samples. Ambient ionization
techniques have been widely applied in different fields from forensics, to pharmaceuticals, and
environmental analysis.
Sonic spray ionization (SSI) is an ambient spray ionization approach where the sample
solution is sprayed with the assistance of gas flow without a high voltage.53-54
The formation of
charged droplet size is attributed to statistical charging.53
Ions are produced from the charged
droplets after solvent evaporation.53
The analyte ion signal intensity is strongly dependent on the
gas flow. It has also been demonstrated that the size of the droplet decreases with increasing gas

8
velocity and is correlated with the droplet size.54-55
In this method it is not necessary to apply heat
or an electric field in the ion source.53, 55
Desorption electrospray ionization (DESI) is an ambient spray ionization technique that is a
variant of electrospray ionization. The electrospray droplets are directed at the sample surface.13
As the charged droplets hit the surface, the analyte is dissolved into the solvent. Droplets
subsequently ejected from the surface are directed into the atmospheric inlet of mass spectrometer
for analysis. Mass spectra obtained from DESI are similar to ESI with multiply charged analyte
ions.13
1.1.2 Laser Desorption/Ablation Methods
In laser based mass spectrometry, lasers are used to produce ions directly or to generate
molecules, clusters, or particles which can be ionized by different means.26
Laser desorption and
ablation methods typically use a pulsed laser to remove species from a surface. Laser desorption
involves laser-induced surface heating and vaporization of individual molecules at relatively low
laser fluence while laser ablation involves ejection of clusters and particles of different sizes and
takes place at a much higher laser fluences.3, 56
Direct laser desorption relies on rapid heating of the
sample or sample substrate to vaporize molecules. The exact desorption/ablation and ionization
physical process and mechanisms depend on the material properties of the compounds and on the
laser irradiation parameters.15
Laser Desorption Ionization (LDI)
Laser desorption/ionization (LDI) employs a pulsed laser to desorb sample from a target.
Desorption is defined as the release of ions or neutrals from a condensed phase into the gas
phase.57
Desorption of neutrals in many cases may be induced thermally by either direct or indirect

9
heating. Different LDI experiments vary immensely depending on the lasers used (e.g.
wavelengths, and pulse duration) and on sample preparation methods.
Laser ablation involves bulk material ejection processes that depend on the laser
parameters, sample characteristics, as well as on the ambient environment. 58-59
During laser
ablation the target material heats, melts, evaporates, and expands into the ambient environment.26
Mechanisms responsible for material ejection have a strong dependence on the rate of the laser
energy deposition.60
Some of these mechanisms and physical processes leading to material ejection
are discussed in Chapter 2.
Matrix-assisted laser desorption ionization (MALDI) is an ionization technique with low
analyte ion fragmentation because the matrix absorbs the laser energy directly instead of the
analyte.61
MALDI provides soft ionization of both large and small molecules. In MALDI, ions are
produced by pulsed laser irradiation of an analyte that is co-crystallized from solution with a
matrix. Matrixes employed in MALDI are usually present in thousand to ten-thousand fold excess
and strongly absorbs the laser light.62
They facilitate desorption and ionization by absorbing the
energy from the laser when co-crystalized with the analyte.46
As a result, analyte ions as well as
matrix ion`s are formed in the expanding plume of material and are transferred into the mass
spectrometer. The matrix can also serve as a proton donor or acceptor and aid in ionizing an
analyte.25, 63
Lasers of different wavelengths and pulse temporal width have been used for MALDI but
the most commonly used are nitrogen lasers with a wavelength of 337 nm laser at (3 ns) pulse
duration.64-65
Ionization is MALDI is believed to involve gas phase protonation based on secondary
reactions taking place within the MALDI plume.66
It is postulated that the primary ions are formed
10
in the ablation plume consisting of a dense mixture of matrix molecules, clusters, and particles.7, 46
During the plume expansion, there are collisions and reactions of protonation and cationization of
the analyte. Different reaction pathways are responsible for analyte ion formation and they may be
take multiple steps.66-67
Some of the reaction taking place within the expanding plume are matrix-
matrix reactions and matrix-analyte reactions (e.g. protonation).7,
67
An alternate cluster ionization model postulates that desorption and ionization take place
simultaneously during ejection of clusters and small particles.68
This model proposes that analyte
molecules exist in the form of positively charged precursors in acidic environment of the matrix
and are released from particles or clusters of matrix during plume expansion.68-69
Loss of matrix from the cluster releases analyte ion. The model predicts the generation of a
large number of electrons from photoionization that serve to reduce the charge state of the
entrained analyte ion.63, 70
Most analyte ions will be reduced to charge state zero thus the singly
charged analyte ions are called “lucky survivors” in this model.63, 67
The cluster ionization model
accounts for singly charged ions observed in both UV and IR-MALDI spectra.63
Photochemical models approach the physical processes of desorption and ablation of the
sample material independently of the chemical processes leading to analyte ionization.7, 66
The
generation of neutral analyte molecules in the matrix and photoionization of the matrix are
assumed to be the first steps taking place within few nanoseconds upon laser irradiation and are
followed by analyte ion formation within the plume.7
Atmospheric pressure matrix-assisted laser desorption ionization (AP-MALDI) is a variant
of MALDI in which ions are formed at atmospheric pressure. In AP-MALDI, ionization takes
place outside mass spectrometer and ions are sampled through a small orifice into the mass

11
spectrometer.14
Since AP-MALDI is carried at atmospheric pressure, the complication of
introducing a sample into high vacuum of the mass spectrometer is eliminated. 71, 14
Laserspray inlet ionization is a recently introduced ionization technique similar to AP-
MALDI.72-73
Laserspray inlet ionization incorporates some common MALDI matrixes as well as
some newly introduced matrixes specific to inlet ionization.74
Inlet ionization can produce multiply
charged ions similar to those observed in ESI but without the application of voltage. It has been
postulated that the production of highly charged ions depends on the desolvation conditions that
remove matrix molecules from charged matrix/analyte clusters or particles.74
For desolvation, the
sample is introduced into a heated transfer inlet capillary after laser ablation of the sample.75
Ion
formation mechanisms in inlet ionization have been postulated to proceed through triboelectric
charging of small particles.
Matrix-assisted inlet ionization (MAII) is a form of inlet ionization that employs a shock to
induce particles formation and ejection from a metal sample target. Samples are introduced into a
heated transfer capillary and mass spectrometer.21, 76
Multiply protonated species, similar to those
produced in ESI, are observed with MAII and, as in ESI, large molecules can be ionized without
fragmentation. A typical sample preparation involves mixing a solid matrix with analyte; some
matrix-assisted laser desorption/ionization (MALDI) matrix materials function as MAII matrix and
additional compounds have been identified.77
Laser-based ambient mass spectrometry
Laser-based ambient mass spectrometry methods can be classified as two-step ionization
since samples are desorbed or ablated with laser irradiation and then ionized in a separate second
step. 78

12
Laser desorption/ablation plus electrospray ionization combines laser desorption or ablation
with ESI for ionization. This approach improves analysis of samples under ambient conditions.
Different names have been used for the general approach of laser desorption/ablation plus
electrospray, for example ELDI,79
MALDESI,80
LDESI81
, and LAESI,82
but they are
fundamentally the same process.
In laser desorption/ablation plus electrospray, a laser irradiates the sample under ambient
conditions to liberate ions, neutrals and clusters from the sample.19, 78-79
A plume consisting of free
molecules and particles merges with ESI spray following laser desorption. The neutral molecules
and/or particles, which make up for the majority of the desorbed plume, merge with the charged
droplets ultimately leading to production of free ions through an ESI-like droplet evaporation
mechanism.
1.2 Methods for Particle Size Measurement
Different methods for particle size measurement have been used to study particle formation
related to mass spectrometry. Particle size measurement plays a significant role in elucidating
physical processes in particle ejection and formation and contributes to understanding ionization
mechanisms that involve particle formation.
Particle Sizing
Atomic force microscopy (AFM) is a microscopy technique that analyzes the surface of a
sample at the nanometer level.83
AFM has been used for analysis of particle produced under
conditions of UV matrix-assisted laser desorption, laser-induced thermal desorption, and IR laser
ablation.26
In this work, a trapping plate was used to capture ejected particles for AFM analysis. It
was determined that clusters and small particles dominated under UV MALDI conditions while a
large fraction of the ablated material from IR laser ablation was large particles.

13
A differential mobility analyzer (DMA) is an instrument for measuring particles in the
range of 1 nm to about 1 µm in diameter based on their electrical mobility.84-85
Differential
mobility analysis requires that the classifier be interfaced to a detector, a flow control system, and
a data acquisition system to enable a measurement to be made;85
this is explained in more detail in
Chapter 2. DMA particle sizing was used to investigate the dependence of particle size on laser
wavelength, fluence and matrix.27
Two different particle size ranges were detected with the smaller
particles having an average particle diameter of 10 nm and large particles between 100 and 200 nm.
The small particles were attributed to nucleation and condensation while large particles were
attributed to coagulation of smaller particles. It was discovered that particles accounted for a
majority of ablated material under MALDI conditions. The difficulty in using a differential
mobility analyzer is that it does not detect larger particles in the micrometer size range.
Light scattering particle size measurements have also been utilized in measuring particle
sizes in mass spectrometry and elucidating their potential role in ionization.28, 86
The measurement
of particle size by observation of the scattered light from particles larger than the wavelength of
the incident light.87-88
The aerodynamic particle sizer (APS) is an instrument based on light scattering to
measure particle sizes in micrometer range. An APS has been employed in particle size
measurements where the effect of laser wavelength and fluence on particle size and concentration
ejected from a MALDI matrix were investigated.29
An APS has also been used in UV laser break-
up of IR laser ablated particles.89
The physical processes leading to material ejection under
MALDI conditions were elucidated from these studies. The APS used in this work is discussed in
Chapter 2.

14
Phase Doppler particle analysis (PDPA) refers to particle size measurements that involves
characterization of moving particles by applying the Doppler effect.90-91
PDPA is capable of
simultaneously measuring size, velocity, and concentration of moving particles. Particle velocities
and sizes are obtained by determining the frequency difference between the illuminating beam and
scattered beam and the phase shift between different reflected/refracted beams from different
detectors within a receiver.91-92
This capability allows a correlation to be made between the
velocity and particle size.
PDPA has recently been used in elucidating ionization mechanism in DESI by studying the
effect of operating conditions on the size and velocity of the DESI droplets.93
It was discovered
that the nebulizing gas pressure and distance between the sprayer and surface have a large effect
on the velocities of the droplets and on the signal in DESI. This discovery supports droplet
deposition and removal as the primary process for ionization in DESI technique.
1.2.1 Plume imaging
Plume imaging aids in understanding physical processes that take place in laser ablation by
providing images of ejected material, initial velocities of the ejected material, and collisions
between ejected particles, during expansion. The information acquired from plume imaging is of
fundamental importance in helping understand different ionization mechanisms.
Laser-induced light scattering imaging has recently been used in visualization of laser
ablation particle formation over a large particle size range and extended time.94
In laser light
scattering imaging, a periscope with dichroic mirrors is used to change laser light polarization from
horizontal to vertical. The use of vertically polarized light and collection of illumination light
(Nd:YAG, 532nm) from 90o angle enables full particle size range. A high-resolution CCD camera
is used to image scattered light parallel to the incoming light sheet. Anthracene and 2,5-

15
dihydroxybenzoic acid(DHB) plumes generated under atmospheric pressure laser ablation
indicates that a significant amount of ablated material is in the form of particles.
Laser induced fluorescence (LIF) imaging provides two-dimensional images of real
surfaces corresponding to a data on sample properties such as temperature and pressure across the
surface area.95
In LIF imaging, the resolution is controlled by laser beam properties in addition to
the camera and collection optics.30, 95
LIF imaging has been used in the past to study desorbed MALDI matrix, 3-
hydroxypicolinic acid (HPA) densities, and velocity distributions of the ejected plume at different
laser wavelengths.96-97
LIF imaging revealed two plume components: a fast and slow intensity
component of 3-HPA during expanding.
Most recently, LIF imaging has been used to investigate ionization mechanism of several
ambient ionization techniques based on desorption and ionization of samples deposited on a
surface.98
In these studies, LIF imaging was employed to characterize desorbed and ionized species
from desorption electrospray ionization (DESI), laserspray inlet ionization (LSII), and atmospheric
pressure matrix-assisted laser desorption ionization (AP-MALDI). It was discovered from these
studies that the common feature among these three ambient techniques was the formation of
solvated species and clusters.
Time-resolved imaging with high resolution and high speed imaging cameras was
employed in studying plume dynamics in laser ablation mass spectrometry.99-100
Plume expansion
was monitored as a function of time following plume ejection. Time resolved imaging has been
used with a CMOS camera to investigate the effect of pulse duration on plume expansion of
glycerol at 2.94 µm wavelength in IR-MALDI.101
Distinct differences in plume dynamics were
observed under different pulse durations of 100 ns and 6 ns.
16
In another study, time resolved imaging with high speed CMOS camera was employed to
investigate the effect of IR laser wavelengths between 2.7 and 3.5 µm and fluences (3000 and 9000
J/m2) on plume dynamics of IR ablated glycerol.
102 It was discovered that the ablation plume has a
strong dependence on laser wavelength. Moreover, more material was ejected and longest ejection
durations were observed when the laser was tuned to the OH stretch absorption of glycerol.
1.3 Research Objectives
The objective of this research was to measure particle sizes under the conditions of laser
desorption/ablation mass spectrometry. A particle size measurement system with extended particle
size range from 10 nm to 20 µm was developed and used to obtain particle size distributions and
aid in elucidating fundamental physical processes of ablation. The particle sizing system measured
the quantity and size of matrix samples ablated as a function of laser fluence and wavelengths
under ion formation conditions for different ambient laser desorption ionization techniques.
Particle formation in UV and IR MALDI was investigated with common solid matrixes. Particle
size distributions under laserspray ionization conditions were generated and used to elucidate ion
formation mechanisms. Similar studies were carried out for shock-generated particles in matrix
inlet ionization.
1.4 References
1. Russo, R. E., Laser ablation. Appl Spectrosc 1995, 49 (9), 14A-28A.
2. Mao, X.; Chan, W.-T.; Russo, R. E., Influence of sample surface condition on chemical analysis
using laser ablation inductively coupled plasma atomic emission spectroscopy. Appl. Spectrosc.
1997, 51 (7), 1047-1054.
3. Mokgalaka, N.; Gardea‐Torresdey, J., Laser ablation inductively coupled plasma mass
spectrometry: Principles and applications. J. Appl. Spectrosc. Rev. 2006, 41 (2), 131-150.
4. Hergenröder, R., Laser-generated aerosols in laser ablation for inductively coupled plasma
spectrometry. Spectrochim. Acta, Part B 2006, 61 (3), 284-300.

17
5. Günther, D.; Hattendorf, B., Solid sample analysis using laser ablation inductively coupled
plasma mass spectrometry. Trends Anal. Chem. 2005, 24 (3), 255-265.
6. Babushok, V.; DeLucia Jr, F.; Gottfried, J.; Munson, C.; Miziolek, A., Double pulse laser
ablation and plasma: laser induced breakdown spectroscopy signal enhancement. Spectrochim.
Acta B 2006, 61 (9), 999-1014.
7. Knochenmuss, R., Ion formation mechanisms in UV-MALDI. Analyst 2006, 131 (9), 966-986.
8. Sneddon, J.; Lee, Y.-I., Laser-induced breakdown spectrometry. Curr. Top. Anal. Chem. 2004,
4, 111-117.
9. Singh, S., Laser microprobe mass spectrometry. Nature 1987, 329, 183-184.
10. Stump, M. J.; Fleming, R. C.; Gong, W.-H.; Jaber, A. J.; Jones, J. J.; Surber, C. W.; Wilkins,
C. L., Matrix-assisted laser desorption mass spectrometry. Appl. Spectrosc. Rev. 2002, 37 (3),
275-303.
11. Cooks, R. G.; Ouyang, Z.; Takats, Z.; Wiseman, J. M., Ambient Mass Spectrometry. Science
2006, 311 (5767), 1566-1570.
12. Cody, R. B.; Laramée, J. A.; Durst, H. D., Versatile New Ion Source for the Analysis of
Materials in Open Air under Ambient Conditions. Anal. Chem 2005, 77 (8), 2297-2302.
13. Takats, Z.; Wiseman, J. M.; Gologan, B.; Cooks, R. G., Mass spectrometry sampling under
ambient conditions with desorption electrospray ionization. Science 2004, 306 (5695), 471-473.
14. Doroshenko, V. M.; Laiko, V. V.; Taranenko, N. I.; Berkout, V. D.; Lee, H. S., Recent
developments in atmospheric pressure MALDI mass spectrometry. Int J Mass Spectrom 2002,
221 (1), 39-58.
15. Knochenmuss, R.; Zhigilei, L. V., Molecular dynamics simulations of MALDI: laser fluence
and pulse width dependence of plume characteristics and consequences for matrix and analyte
ionization. J. Mass Spectrom. 2010, 45 (4), 333-346.
1 . alhena . . arris . . yadong . urray . . ern ndez . . mall olecule
Ambient Mass Spectrometry Imaging by Infrared Laser Ablation Metastable-Induced Chemical
Ionization. Anal. Chem 2010, 82 (6), 2178-2181.
17. Shelley, J. T.; Ray, S. J.; Hieftje, G. M., Laser ablation coupled to a flowing atmospheric
pressure afterglow for ambient mass spectral imaging. Anal. Chem 2008, 80 (21), 8308-8313.
18. Ovchinnikova, O. S.; Kertesz, V.; Van Berkel, G. J., Combining Laser Ablation/Liquid Phase
Collection Surface Sampling and High-Performance iquid Chromatography− Electrospray
Ionization-Mass Spectrometry. Anal. Chem 2011, 83 (6), 1874-1878.

18
19. Huang, M.-Z.; Jhang, S.-S.; Cheng, C.-N.; Cheng, S.-C.; Shiea, J., Effects of matrix,
electrospray solution, and laser light on the desorption and ionization mechanisms in
electrospray-assisted laser desorption ionization mass spectrometry. Analyst 2010, 135 (4), 759-
766.
20. Sampson, J. S.; Murray, K. K.; Muddiman, D. C., Intact and Top-Down Characterization of
Biomolecules and Direct Analysis Using Infrared Matrix-Assisted Laser Desorption
Electrospray Ionization Coupled to FT-ICR Mass Spectrometry. Journal of the American
Society for Mass Spectrometry 2009, 20 (4), 667-673.
21. McEwen, C. N.; Pagnotti, V. S.; Inutan, E. D.; Trimpin, S., New paradigm in ionization:
multiply charged ion formation from a solid matrix without a laser or voltage. Anal. Chem
2010, 82 (22), 9164-9168.
22. Zhigilei, L. V.; Kodali, P. B.; Garrison, B. J., A microscopic view of laser ablation. J. Phys.
Chem. B 1998, 102 (16), 2845-2853.
23. Zhigilei, L. V.; Yingling, Y. G.; Itina, T. E.; Schoolcraft, T. A.; Garrison, B. J., Molecular
dynamics simulations of matrix-assisted laser desorption—connections to experiment. Int. J.
Mass Spectrom. ion processes 2003, 226 (1), 85-106.
24. Zhigilei, L. V.; Leveugle, E.; Garrison, B. J.; Yingling, Y. G.; Zeifman, M. I., Computer
simulations of laser ablation of molecular substrates. Chem. Rev. 2003, 103 (2), 321-348.
25. Knochenmuss, R.; Zhigilei, L. V., Molecular dynamics model of ultraviolet Matrix-Assisted
Laser Desorption/Ionization including ionization processes. J. Phys. Chem. B 2005, 109, 22947-
22957.
26. Handschuh, M.; Nettesheim, S.; Zenobi, R., Laser-induced molecular desorption and particle
ejection from organic films. Appl. Surf. Sci. 1999, 137 (1), 125-135.
27. Alves, S.; Kalberer, M.; Zenobi, R., Direct detection of particles formed by laser ablation of
matrices during matrix‐assisted laser desorption/ionization. Rapid Commun. Mass Spectrom.
2003, 17 (18), 2034-2038.
28. Jackson, S. N.; Mishra, S.; Murray, K. K., Characterization of coarse particles formed by laser
ablation of MALDI matrixes. J. Phys. Chem. B 2003, 107 (47), 13106-13110.
29. Fan, X.; Little, M. W.; Murray, K. K., Infrared laser wavelength dependence of particles
ablated from glycerol. Appl.Surf.Sci. 2008, 255 (5), 1699-1704.
30. Johnson, M. E.; Landers, J. P., Fundamentals and practice for ultrasensitive laser-induced
fluorescence detection in microanalytical systems. Electrophoresis 2004, 25 (21-22), 3513-
3527.

19
31. Santos, V. G.; Regiani, T. s.; Dias, F. F.; Romao, W.; Jara, J. L. P.; Klitzke, C. c. F.; Coelho,
F.; Eberlin, M. N., Venturi easy ambient sonic-spray ionization. Anal. Chem 2011, 83 (4), 1375-
1380.
32. Willoughby, R. C.; Browner, R. F., Monodisperse aerosol generation interface for combining
liquid chromatography with mass spectroscopy. Anal. Chem 1984, 56 (14), 2626-2631.
33. Winkler, P. C.; Perkins, D. D.; Williams, W. K.; Browner, R. F., Performance of an improved
monodisperse aerosol generation interface for liquid chromatography/mass spectrometry. Anal.
Chem 1988, 60 (5), 489-493.
34. Abian, J., The coupling of gas and liquid chromatography with mass spectrometry. J. Mass
Spectrom. 1999, 34, 157-168.
35. Browner, R. F., Interfacing with aerosols: Concept, place, and time. Microchem. J. 1989, 40
(1), 4-29.
36. Vestal, M., Studies of ionization mechanisms involved in thermospray LC-MS. Int. J. Mass
Spectrom. Ion Physics 1983, 46, 193-196.
37. Vestal, M., Ionization techniques for nonvolatile molecules. Mass Spectrom. Rev. 1983, 2 (4),
447-480.
38. Alexander, A. J.; Kebarle, P., Thermospray mass spectrometry. Use of gas-phase ion/molecule
reactions to explain features of thermospray mass spectra. Anal. Chem 1986, 58 (2), 471-478.
39. Arpino, P., Combined liquid chromatography mass spectrometry. Part II. Techniques and
mechanisms of thermospray. Mass Spectrom. Rev. 1990, 9 (6), 631-669.
40. Munson, B., Development of chemical ionization mass spectrometry. Int. J. Mass Spectrom.
2000, 200 (1), 243-251.
41. Vestal, M. L., Methods of ion generation. Chem. Rev. 2001, 101 (2), 361-376.
42. Andrade, F. J.; Shelley, J. T.; Wetzel, W. C.; Webb, M. R.; Gamez, G.; Ray, S. J.; Hieftje, G.
M., Atmospheric Pressure Chemical Ionization Source. 1. Ionization of Compounds in the Gas
Phase. Anal. Chem 2008, 80 (8), 2646-2653.
43. Byrdwell, W. C., Atmospheric pressure chemical ionization mass spectrometry for analysis of
lipids. Lipids 2001, 36 (4), 327-346.
44. Kebarle, P., A brief overview of the present status of the mechanisms involved in electrospray
mass spectrometry. J. Mass Spectrom. 2000, 35 (7), 804-817.
45. Wilm, M., Principles of electrospray ionization. Molecular & Cellular Proteomics 2011, 10
(7).

20
46. Konermann, L.; Ahadi, E.; Rodriguez, A. D.; Vahidi, S., Unraveling the Mechanism of
Electrospray Ionization. Anal. Chem 2012, 85 (1), 2-9.
47. Juraschek, R.; Dülcks, T.; Karas, M., Nanoelectrospray—more than just a minimized-flow
electrospray ionization source. J. Am. Soc. Mass Spectrom. 1999, 10 (4), 300-308.
48. Schmidt, A.; Karas, M.; Dülcks, T., Effect of different solution flow rates on analyte ion
signals in nano-ESI MS, or: when does ESI turn into nano-ESI? J. Am. Soc. Mass Spectrom.
2003, 14 (5), 492-500.
49. Takáts, Z.; Wiseman, J. M.; Cooks, R. G., Ambient mass spectrometry using desorption
electrospray ionization (DESI): instrumentation, mechanisms and applications in forensics,
chemistry, and biology. J. Mass Spectrom. 2005, 40 (10), 1261-1275.
50. Harper, J. D.; Charipar, N. A.; Mulligan, C. C.; Zhang, X.; Cooks, R. G.; Ouyang, Z., Low-
Temperature Plasma Probe for Ambient Desorption Ionization. Anal. Chem 2008, 80 (23),
9097-9104.
51. Hajslova, J.; Cajka, T.; Vaclavik, L., Challenging applications offered by direct analysis in real
time (DART) in food-quality and safety analysis. TrAC, Trends Anal. Chem. 2011, 30 (2), 204-
218.
52. Cody, R. B., Observation of Molecular Ions and Analysis of Nonpolar Compounds with the
Direct Analysis in Real Time Ion Source. Anal. Chem 2008, 81 (3), 1101-1107.
53. Hirabayashi, A.; Sakairi, M.; Koizumi, H., Sonic spray mass spectrometry. Anal. Chem 1995,
67 (17), 2878-2882.
54. Hirabayashi, A.; Sakairi, M.; Koizumi, H., Sonic spray ionization method for atmospheric
pressure ionization mass spectrometry. Anal. Chem 1994, 66 (24), 4557-4559.
55. Dams, R.; Benijts, T.; Günther, W.; Lambert, W.; De Leenheer, A., Sonic spray ionization
technology: performance study and application to a LC/MS analysis on a monolithic silica
column for heroin impurity profiling. Anal. Chem 2002, 74 (13), 3206-3212.
56. Zhigilei, L. V.; Garrison, B. J., Molecular dynamics simulation study of the fluence
dependence of particle yield and plume composition in laser desorption and ablation of organic
solids. Appl. Phys. Lett. 1999, 74 (9), 1341-1343.
57. Hillenkamp, F., Laser Desorption Mass Spectrometry. A Review. In TrAC, Trends Anal.
Chem., Springer Berlin Heidelberg: 1986; Vol. 44, pp 471-475.
58. Russo, R. E.; Mao, X.; Liu, H.; Gonzalez, J.; Mao, S. S., Laser ablation in analytical
chemistry—a review. Talanta 2002, 57 (3), 425-451.
59. Zhigilei, L. V., Dynamics of the plume formation and parameters of the ejected clusters in the
short-pulse laser ablation. Appl. Phys. A 2003, 76, 339-350.

21
60. Zhigilei, L. V.; Garrison, B. J., Microscopic mechanisms of laser ablation of organic solids in
the thermal and stress confinement irradiation regimes. J. Appl. Phys. 2000, 88 (3), 1281-1298.
61. Bahr, U.; Karas, M.; Hillenkamp, F., Analysis of biopolymers by matrix-assisted laser
desorption/ionization (MALDI) mass spectrometry. Fresenius. J. Anal. Chem. 1994, 348 (12),
783-791.
62. Karas, M.; Bahr, U.; Giessmann, U., Matrix-assisted laser desorption ionization mass
spectrometry. Mass Spectrom. Rev. 1991, 10 (5), 335-357.
63. Karas, M.; Glückmann, M.; Schäfer, J., Ionization in matrix-assisted laser
desorption/ionization: singly charged molecular ions are the lucky survivors. J. Mass. Spectrom
2000, 35 (1), 1-12.
64. Busch, K. L., Desorption ionization mass spectrometry. Journal of Mass Spectrometry 1995,
30 (2), 233-240.
65. Dreisewerd, K.; Schürenberg, M.; Karas, M.; Hillenkamp, F., Matrix-assisted laser
desorption/ionization with nitrogen lasers of different pulse widths. International journal of
mass spectrometry and ion processes 1996, 154 (3), 171-178.
66. Zenobi, R.; Knochenmuss, R., Ion formation in MALDI mass spectrometry. Mass Spectrom.
Rev. 1998, 17 (5), 337-366.
67. Jaskolla, T. W.; Karas, M., Compelling evidence for lucky survivor and gas phase protonation:
The unified MALDI analyte protonation mechanism. J. Am. Soc. Mass Spectrom. 2011, 22 (6),
976-988.
68. Karas, M.; Kruger, R., Ion formation in MALDI: the cluster ionization mechanism. Chem. Rev
2003, 103 (2), 427-440.
69. Knochenmuss, R.; Zenobi, R., MALDI ionization: the role of in-plume processes. Chem. Rev
2003, 103 (2), 441-452.
70. Chang, W. C.; Huang, L. C. L.; Wang, Y.-S.; Peng, W.-P.; Chang, H. C.; Hsu, N. Y.; Yang, W.
B.; Chen, C. H., Matrix-assisted laser desorption/ionization (MALDI) mechanism revisited.
Anal. Chim. Acta 2007, 582 (1), 1-9.
71. Laiko, V. V.; Baldwin, M. A.; Burlingame, A. L., Atmospheric pressure matrix-assisted laser
desorption/ionization mass spectrometry. Anal. Chem 2000, 72 (4), 652-657.
72. Trimpin, S.; Herath, T. N.; Inutan, E. D.; Cernat, S. A.; Miller, J. B.; Mackie, K.; Walker, J.
M., Field-free transmission geometry atmospheric pressure matrix-assisted laser
desorption/ionization for rapid analysis of unadulterated tissue samples. Rapid Commun. Mass
Spectrom. 2009, 23 (18), 3023-3027.

22
73. Trimpin, S.; Inutan, E. D.; Herath, T. N.; McEwen, C. N., Laserspray ionization, a new
atmospheric pressure MALDI method for producing highly charged gas-phase ions of peptides
and proteins directly from solid solutions. Mol. Cell. Prot 2010, 9 (2), 362-367.
74. Trimpin, S.; Ren, Y.; Wang, B.; Lietz, C. B.; Richards, A. L.; Marshall, D. D.; Inutan, E. D.,
Extending the laserspray ionization concept to produce highly charged ions at high vacuum on a
time-of-flight mass analyzer. Anal. Chem 2011, 83 (14), 5469-5475.
75. Inutan, E. D.; Richards, A. L.; Wager-Miller, J.; Mackie, K.; McEwen, C. N.; Trimpin, S.,
Laserspray ionization, a new method for protein analysis directly from tissue at atmospheric
pressure with ultrahigh mass resolution and electron transfer dissociation. Mol Cell Proteomics
2011, 10 (2), M110 000760.
76. Trimpin, S.; Wang, B.; Inutan, E. D.; Li, J.; Lietz, C. B.; Harron, A.; Pagnotti, V. S.; Sardelis,
D.; McEwen, C. N., A mechanism for ionization of nonvolatile compounds in mass
spectrometry: considerations from MALDI and inlet ionization. J. Am. Soc. Mass. Spectrom.
2012, 23 (10), 1644-1660.
77. Li, J.; Inutan, E. D.; Wang, B.; Lietz, C. B.; Green, D. R.; Manly, C. D.; Richards, A. L.;
Marshall, D. D.; Lingenfelter, S.; Ren, Y.; Trimpin, S., Matrix assisted ionization: new aromatic
and nonaromatic matrix compounds producing multiply charged lipid, peptide, and protein ions
in the positive and negative mode observed directly from surfaces. J. Am. Soc. Mass Spectrom.
2012, 23 (10), 1625-1643.
78. Huang, M.-Z.; Cheng, S.-C.; Cho, Y.-T.; Shiea, J., Ambient ionization mass spectrometry: A
tutorial. Anal. Chim. Acta 2011, 702 (1), 1-15.
79. Shiea, J.; Huang, M. Z.; HSu, H. J.; Lee, C. Y.; Yuan, C. H.; Beech, I.; Sunner, J.,
Electrospray‐assisted laser desorption/ionization mass spectrometry for direct ambient analysis
of solids. Rapid Commun. Mass Spectrom. 2005, 19 (24), 3701-3704.
80. Sampson, J. S.; Hawkridge, A. M.; Muddiman, D. C., Generation and Detection of Multiply-
Charged Peptides and Proteins by Matrix-Assisted Laser Desorption Electrospray Ionization
(MALDESI) Fourier Transform Ion Cyclotron Resonance Mass Spectrometry. J. Am. Soc. Mass
Spectrom. 2006, 17 (12), 1712-1716.
81. Morelli, J. J.; Hercules, D. M., Laser Mass Spectra of Liquids Taken at Ambient Pressure. Appl
Spectrosc 1989, 43 (6), 1073-1081.
82. Stolee, J. A.; Vertes, A., Toward Single-Cell Analysis by Plume Collimation in Laser Ablation
Electrospray Ionization Mass Spectrometry. Anal. Chem 2013, 85 (7), 3592-3598.
83. Giessibl, F. J., Advances in atomic force microscopy. Rev. Mod. Phys. 2003, 75 (3), 949.
84. Flagan, R. C., Differential mobility analysis of aerosols: a tutorial. Kona Power Part. J. 2008,
254-258.

23
85. Intra, P.; Tippayawong, N., An overview of differential mobility analyzers for size
classification of nanometer-sized aerosol particles. Songklanakarin J. Sci. Technol. 2008, 30
(2), 243-256.
86. Jackson, S. N.; Kim, J. K.; Laboy, J. L.; Murray, K. K., Particle formation by infrared laser
ablation of glycerol: implications for ion formation. Rapid Commun. Mass Spectrom. 2006, 20
(8), 1299-1304.
87. Gouesbet, G., Generalized lorenz-mie theory and applications. Part. Part. Syst. Charact. 1994,
11 (1), 22-34.
88. Wriedt, T., A review of elastic light scattering theories. Part. Part. Syst. Charact. 1998, 15 (2),
67-74.
89. Fan, X.; Murray, K. K., UV laser irradiation of IR laser generated particles ablated from
nitrobenzyl alcohol. Appl. Surf. Sci 2009, 255 (12), 6297-6302.
90. Sankar, S. V.; Bachalo, W. D., Response characteristics of the phase Doppler particle analyzer
for sizing spherical particles larger than the light wavelength. Appl. Opt. 1991, 30 (12), 1487-
1496.
91. Dan Hirleman, E., History of Development of the Phase-Doppler Particle-Sizing Velocimeter.
Part. Part. Syst. Charact. 1996, 13 (2), 59-67.
92. Bachalo, W. D., The phase doppler method: analysis, performance evaluations, and
applications. Part. Part. Syst. Charact. 1994, 11 (1), 73-83.
93. Venter, A.; Sojka, P. E.; Cooks, R. G., Droplet Dynamics and Ionization Mechanisms in
Desorption Electrospray Ionization Mass Spectrometry. Anal. Chem 2006, 78 (24), 8549-8555.
94. Schmitz, T.; Koch, J.; Günther, D.; Zenobi, R., Characterization of aerosol plumes in
nanosecond laser ablation of molecular solids at atmospheric pressure. Appl. Phys. B 2010, 100
(3), 521-533.
95. Freegarde, T.; Hancock, G., A guide to laser-induced fluorescence diagnostics in plasmas. J.
Phys. IV 1997, 7 (C4), C4-15-C14-29.
96. Puretzky, A. A.; Geohegan, D. B., LIF imaging and gas-phase diagnostics of laser desorbed
MALDI-matrix plumes. Appl. Surf. Sci 1998, 127, 248-254.
97. Puretzky, A. A.; Geohegan, D. B., Gas-phase diagnostics and LIF-imaging of 3-
hydroxypicolinic acid MALDI-matrix plumes. Chem. Phys. Lett. 1998, 286 (5), 425-432.
98. Frankevich, V.; Nieckarz, R. J.; Sagulenko, P. N.; Barylyuk, K.; Zenobi, R.; Levitsky, L. I.;
Agapov, A. Y.; Perlova, T. Y.; Gorshkov, M. V.; Tarasova, I. A., Probing the mechanisms of
ambient ionization by laser-induced fluorescence spectroscopy. Rapid Commun. Mass
Spectrom. 2012, 26 (13), 1567-1572.

24
99. Koubenakis, A.; Frankevich, V.; Zhang, J.; Zenobi, R., Time-resolved surface temperature
measurement of MALDI matrices under pulsed UV laser irradiation. J. Phys. Chem. A 2004,
108 (13), 2405-2410.
100. Van Breemen, R.; Snow, M.; Cotter, R., Time-resolved laser desorption mass spectrometry. I.
Desorption of preformed ions. Int. J. Mass Spectrom. Ion Physics 1983, 49 (1), 35-50.
101. Leisner, A.; Rohlfing, A.; Röhling, U.; Dreisewerd, K.; Hillenkamp, F., Time-resolved
imaging of the plume dynamics in infrared matrix-assisted laser desorption/ionization with a
glycerol matrix. J. Phys. Chem. B 2005, 109 (23), 11661-11666.
102. Fan, X.; Murray, K. K., Wavelength and Time-Resolved Imaging of Material Ejection in
Infrared Matrix-Assisted Laser Desorption. J. Phys. Chem. A 2009, 114 (3), 1492-1497.

25
CHAPTER 2. EXPERIMENTAL
The goal of the work described in this thesis was to characterize the quantity and size
distributions of particles ejected by laser irradiation or mechanical shock under ambient conditions
and use this information to elucidate ionization mechanisms with respect to their particular
ionization technique conditions. In laser ablation experiments, the laser was initially used to ablate
particles from a thin layer of solid MALDI matrix compounds on a metal target that was
positioned at the center of an ablation chamber. For shock particle formation studies, the target was
placed at end of the chamber and mechanical shock was applied from the outside end with the
sample side of the target facing the chamber. The experimental set up, instrumentation, optics and
reagents used in this study are explained in detail in this chapter.
2.1 Particle Size Measurement System
Figure 2-1. Experimental setup for particle detection by differential mobility analyzer and light
scattering aerodynamic particle sizer.
The ablation chamber used in this study was a stainless steel six-way cross (2.75 in. conflat
flange) with a volume of 240 cm3
with a sapphire window for the laser through to the sample target
at the center of the chamber. The ablation chamber was placed directly over an aerodynamic light
scattering particle sizer and connected from one end to the inlet of the scanning mobility particle

26
sizer by a 20 cm length of 5 mm inner diameter conductive plastic tubing. The chamber had an
additional inlet at the top to draws in air from the atmosphere at a combined flow rate at 10 L/min
(5 L/min directed to each instrument). The air drawn into the chamber passes through high
efficiency particulate air (HEPA) filter. The schematic diagram of the experimental set up is
illustrated in Figure 2-1.
2.1.1 Aerodynamic Particle Sizer
Figure 2-2. Schematic of light scattering aerodynamic particle sizer.
The aerodynamic particle sizing (APS) instrument was used to measure particle size and
concentration in the particle size range of 0.5 to 20 µm.
In the APS, the aerodynamic particle diameter is defined as the diameter of a sphere with standard
density that is capable of settling at the same terminal velocity as the particle of interest.1 Terminal
settling velocity is a measure of the aerodynamic properties of the particle and obtained when the

27
gravitational force is equal and opposite to the drag force. The aerodynamic particle diameter, Dae,
of spherical particle of diameter Dp and density ρ is defined by
√ √ (Eq. 2–
1)
where C is the slip correction that depends upon pressure of the gas, P, and particle diameter.2
Particles that have the same aerodynamic diameter and have the same starting conditions follow
the same trajectory. The aerodynamic diameter increases with increasing density.1 Particle density
affects particle sizing in APS despite similar physical morphology of the particles. It has also been
noted that particles with density greater than 1.0 g/cm3, have aerodynamic diameters greater than
their geometrical or physical diameters. 1
The APS measures the time taken by individual particles to travel between two laser beams
positioned at the exit of a nozzle and determines particle size for particle velocity measurements.
Particles entering the APS are accelerated inside the sample flow down the center of an inner
accelerating orifice. The acceleration nozzle consists of inner and outer nozzle. The aerosol flow is
surrounded by the sheath air flow from the outer nozzle. The aerodynamic size of the particle
determines its acceleration rate with large particles accelerating more slowly due to their inertia.
This means that particles with different aerodynamic diameters have different velocities at the
nozzle exit. Upon exiting the nozzle, particles enter the detection area positioned at the outer
nozzle. Inside the detection area a particle passes through two parallel laser beams from a diode
laser (675 nm), light is scattered and it produces two light pulses. An elliptical mirror, placed at
right angle to the laser beam axis, collects the light and focuses it onto an avalanche photodetector.
The photodetector converts the light pulses into electrical pulses. The time difference between the

28
two pulses is the time-of-flight and it is used to determine the velocity of each particle which gives
the aerodynamic particle diameter.
2.1.2 Scanning Mobility Particle Sizer (SMPS)
The scanning mobility particle sizer consists of a differential mobility analyzer (DMA) and
a condensation particle counter (CPC). Particles are first size-selected with the DMA and
subsequently counted with the CPC.
Differential Mobility Analyzer (DMA)
Figure 2-3. Schematic of differential mobility analyzer (DMA).
A differential mobility analyzer (DMA) is made up of two concentric cylinders, an inner
cylinder and an outer cylinder. It reports the diameter of the sphere with the same migration
velocity in the constant electric field as the particle of interest.3 A particle that carries charge q and
exposed to the electric field experiences a force given by;
, (Eq. 2–2)

29
When this force is equal to the drag force, it produces the terminal electrophoretic migration
velocity;
= , (Eq. 2–3)
where Zp is the electrical mobility of the particle.3 The electrical mobility of the collected particle
is the function of the dimensions of the DMA, applied voltage, and the fluid flow rate according to;
Zp
, (Eq. 2–4)
where R1 and R2 are the radii of the outer and inner electrodes, L is the collecting electrode length,
V is the applied voltage and Qs and Qa are represent sheath air and aerosol flow respectively.4 The
application of the electrostatic field provides a convenient high resolution separation of small
particles.3
Particles entering the SMPS go through a cyclone that removes large particle (> 500 nm),
preventing counting errors and keep the instrument clean. Subsequently, the smaller particles go
through a 85
Kr beta emitter neutralizer and obtain a positive charge. Electrically charged particles
and sheath air enter DMA from the top and flow down between the two cylinders with no mixing
of the two laminar flows. The inner cylinder (collector electrode) is maintained at a negative
voltage ranging from 1 V to 10 kV while the outer cylinder is grounded, which creates the electric
field between the cylinders. The electric field causes positively charged particles to be attracted
through the sheath air to the negative charged collector rod. During classification, a particle moves
across the distance between the two electrodes. The particle moves at the velocity of;
v = ZpE, (Eq. 2–5)

30
where Zp is the particle electrical mobility and E can be represented by the equation below for a
cylindrical DMA with inner and outer radii of R1 and R2 respectively;3
E= V/r ln
. (Eq. 2–6)
Particles with a specific mobility pass through holes at the end of the collector rod. The path of the
particles depends on the particle electrical mobility (Zp), the fluid flow rate, and the DMA
geometry. Smaller particles and higher electrical charge lead to higher electrical mobility.
Particles with high electrical mobility are hit the top portion of inner cylinder while
particles with lower electrical mobility pass through holes on the lower portion. The collector
electrode voltage and the flow rates are scanned at certain values so that aerosol particles of
specific size ranges are drawn out from the DMA. By ramping up the voltage on the inner cylinder,
the selected particle diameter can be changed. Particles exit inner cylinder through a slit at the
bottom with the assistance of monodisperse air flow and are directed to the condensation particle
counter (CPC).
Condensation Particle Counter (CPC)
The condensation particle counter is used to count the particles separated by the DMA.
Particles enter a heated (390 C) section of the CPC that is they are saturated with butanol vapor.
The particles then pass into the condenser of the CPC at 140C.The butanol condenses on the
particles and hence enlarging them by a few micrometers to make them easily detectable by light
scattering. The particle flow is focused in a nozzle and directed into the detection area. The
particles pass a diode laser (780 nm) beam and each particle creates a single light pulse. Pulses
with amplitude above a certain threshold are counted using a photodetector. Particle number
concentration is calculated using the known gas flow rate.

31
Figure 2-4. Schematic diagram of the condensation particle counter (CPC)
The CPC utilizes two modes of operation: a single particle and photometric. In single particle
counting mode, particles are counted individually as they pass detection area. Photometric is used
for high concentration counting where the total amount of light scattered by all particles inside the
detection area is used to determine the concentration. Concentrations of up to 107 particles/cm
3 can
be measured by detecting total light scattered. The minimum detectable diameter for the CPC is 10
nm and is limited by the flow rate (0.3 –1.5 L/min).
Nitrogen laser
A nitrogen laser (VSL-337ND-S, Laser Science, Franklin, MA) was used in this work for
matrix ablation on different targets under MALDI and inlet ionization conditions. A nitrogen laser
emits invisible ultraviolet (UV) radiation at 337.1 nm wavelength. The pulse repetition rate can be
varied from less than one pulse per second up to 20 Hz. The maximum pulse energy is 170 µJ with
pulse duration of 4 ns at FWHM. The laser beam was directed through a sapphire window into the
ablation chamber where the sample target is placed for irradiation.

32
The laser spot size was measured by irradiating burn paper on a sample target inside the
ablation chamber. The spot size was measured with a 50x direct measuring microscope and found
to be 200 x 260 µm. A 15 cm focal length CaF2 lens was used to focus the laser beam. The laser
energy was measured with a pyroelectric detector (QE25LP-S-MB, Gentec- 152 EO, Quebec,
Canada) and was varied between 20 and 160 µJ which correspond to laser fluence of 300 and 2300
J/m2 at a repetition rate of 2 Hz.
Optical Parametric Oscillator (OPO) Laser
A tunable wavelength IR optical parametric oscillator (OPETEK, Carlsbad, CA, USA)
operating at a repetition rate of 2 Hz was employed for the IR laser ablation studies. The laser
fluence was varied between 6000 J/m2 and 9500 J/m
2 while keeping laser wavelength constant at
2.94 µm and to investigate the effects of laser fluence on particle formation. The wavelength was
varied from 2.8 µm to 3.0 µm while the laser fluence was kept constant at 8500 J/m2
to study the
wavelength dependence.
An optical parametric oscillator (OPO) is an all-solid-state, nonlinear optical conversion
device that is based on the parametric interaction between the electrical field of a pump source and
a nonlinear optical material.5 An OPO relies on the nonlinear response of a medium to a driving
field (the pump laser beam) to convert photons of one wavelength to multiple photons of longer
wavelengths.6 The pump laser interacts with the nonlinear optical material and converts the beam
into two lower energy beams (signal and idler).
If the nonlinear crystal is illuminated with light from a pump laser whose angular
frequency is ωp.6-7
The signal frequency ωs termed as idler frequency ωi are generated and satisfy
the relationship;
ωs + ωi = ωp 6-7
(Eq. 2–7)

33
The crystals are placed in a resonator which consists of mirrors providing feedback and having a
suitable reflection coefficient. The exact wavelengths of the signal and idler are determined by the
angle of the pump beam with respect to the crystal axis.7 As the crystal rotates, different
wavelengths of light are produced.
2.2 Reagents and Standards
Several common MALDI matrix compounds were studied: 2, 5-dihydroxybenzoic acid
(DHB; Sigma-Aldrich, St. Louis, MO), 4-nitroaniline (NA; Fluka, Ronkonkoma, NY), α-cyano-4-
hy-droxycinnamic acid (CHCA; Sigma-Aldrich), and sinapic acid (SA, Fluka). DHB, SA, and NA
were dissolved in methanol (Fisher, Fair Lawn, NJ) to give a 20 mg/mL solution. The α-cyano-4-
hydroxycinnamic acid was dissolved in a 70:30 (v/v) mixture of acetonitrile (Fisher, Fair Lawn, NJ)
and 0.1% aqueous trifluoroacetic acid (Fisher) to give a 20 mg/mL solution. The CPC used n-
butanol (Fisher). The other two matrixes were specifically used for inlet ionization studies were;
2,5-dihydroxyacetophenone (DHAP, Sigma-Aldrich), and 2-nitrophloroglucinol (NPG; Sigma-
Aldrich. The matrix solution concentrations were 40 mg/mL and were dissolved in 1:1 (vol/vol)
and 0.1 % acetonitrile aqueous TFA. For IR laser ablation studies; succinic acid (butanadioic acid,
BA, Sigma-Aldrich) was dissolved in methanol (Fisher, Fair Lawn, NJ) to a 20 mg/mL. 2-(4-
hydroxyphenylazo) benzoic acid (HABA; Aldrich, Milwaukee, WI) was dissolved in a 70:30 (v/v)
mixture of acetonitrile (Fisher, Fair Lawn, NJ) and 0.1% aqueous trifluoroacetic acid (Fisher) to
give also give 20 mg/mL solution while a thin layer of glycerol were prepared by depositing a 100
µL volume of neat glycerol (99%; Sigma, St. Louis, MO) on the sample target.
2.3 References
1. DeCarlo, P. F.; Slowik, J. G.; Worsnop, D. R.; Davidovits, P.; Jimenez, J. L., Particle
morphology and density characterization by combined mobility and aerodynamic diameter
measurements. Part 1: Theory. Aerosol Sci. Technol. 2004, 38 (12), 1185-1205.

34
2. Ananth, G.; Wilson, J. C., Theoretical Analysis of the Performance of the TSI Aerodynamic
Particle Sizer The Effect of Density on Response. Aerosol Sci. Technol. 1988, 9 (3), 189-199.
3. Flagan, R. C., Differential mobility analysis of aerosols: a tutorial. Kona Power Part. J. 2008,
254-258.
4. Intra, P.; Tippayawong, N., An overview of differential mobility analyzers for size classification
of nanometer-sized aerosol particles. Songklanakarin J. Sci. Technol. 2008, 30 (2), 243-256.
5. Zhou, J. X.; Hou, X.; Tsai, S.-J. J.; Yang, K. X.; Michel, R. G., Characterization of a tunable
optical parametric oscillator laser system for multielement flame laser excited atomic
fluorescence spectrometry of cobalt, copper, lead, manganese, and thallium in buffalo river
sediment. Anal. Chem 1997, 69 (3), 490-499.
. ischer R. ulevskiĭ . Optical parametric oscillators (review). J. Quantum Electron. 1977, 7
(2), 135.
7. Harris, S. E., Tunable optical parametric oscillators. Proceedings of the IEEE 1969, 57 (12),
2096-2113.

35
CHAPTER 3. PARTICLE FORMATION IN AMBIENT MALDI PLUMES
3.1 Introduction
The first set of experiments performed with the combined APS and SMPS particle sizing
system used a UV laser and solid MALDI matrix compounds. Previous experiments used either a
SMPS alone to measure particles less than 500 nm in diameter1 or an APS to measure particles
larger than 500 nm.2 The small particle study suggested that material removal is dominated by
small particles whereas the large particle study suggested that material removal is dominated by
large particles. As will be seen below, both studies were correct in their own way: there are more
small particles ablated but a comparable (and often larger) fraction of the ablated mass is contained
in the larger particles.
In this study, the ablated particle count and size distribution of four solid matrix materials
commonly used for matrix-assisted laser desorption ionization (MALDI) were measured with the
APS/SMPS particle size measurement system described in Chapter 2. The two particle sizing
instruments allowed size measurements in the range from 10 nm to 20 µm. The four solid matrixes
investigated were 2,5-dihydroxybenzoic acid (DHB), 4-nitroaniline ( ) α-cyano-4-
hydroxycinnamic acid (CHCA), and sinapic acid (SA). A thin film of the matrix was deposited on
a stainless steel target using the dried droplet method and it was irradiated with a 337 nm nitrogen
laser at atmospheric pressure. The target was rotated during the measurement. A large number of
nanoparticles were produced, and average particle diameters ranged from 40 to 170 nm depending
on the matrix and the laser fluence. These particles are attributed to agglomeration of smaller
The work reported in this chapter has been published in Analytical Chemistry. [Musapelo, T;
Murray, K.K., Particle Formation in MALDI Plumes, 2011]. Reprinted by permission of the
American Chemical Society.
36
particles and clusters and/or hydrodynamic sputtering of melted matrix. A coarse particle
component of the distribution was observed with diameters between 500 nm and 2 µm. The coarse
particles were significantly lower in number but had a total mass that was comparable to that of the
nanoparticles. The coarse particles are attributed to matrix melting and spallation. Two of the
compounds, CHCA and SA, had a third particle size distribution component in the range of 10 to
30 nm, which is attributed to the direct ejection of clusters.
3.2 Experimental
The sample target coated with a thin layer of solid matrix was irradiated with a 4 ns pulse
width 337 nm nitrogen laser at a repetition rate of 2 Hz. The laser was focused onto the spot using
a 25 cm focal length CaF2 lens to a spot size of 200 by 260 µm as measured by laser burn paper.
The laser energy was measured with a pyroelectric detector. The target was slowly rotated by hand
during the sample irradiation to avoid depletion of the matrix film. Particle size distribution
measurements were initiated 10 s after laser irradiation of the target and continued the 3 min
required for data acquisition.
Particle size and concentration were measured simultaneously with the APS and SMPS.
The two instruments are described in detail in Chapter 2.
3.3 Results
Particle size distribution measurements were made for (DHB), (NA), (CHCA), and (SA).
In order to obtain the background level of particulate, the particle count and size distribution from
irradiation of a clean stainless steel target at 500 J/m2 was obtained. The total background particle
concentration was less than 300 per cm3, and the total mass weighted background particle
concentration was less than 100 µg/m3. The average background particle diameter was 50 nm, and
negligible particles were observed above 400 nm diameter.

37
Particle size distribution plots for DHB, NA, CHCA, and SA are shown at laser fluences
300, 500, 750 and 1100 J/m2 in Figure 3-1. The total particle concentration at each fluence and the
average particle diameter (given by the arithmetic mean diameter) are indicated in Table 3-1. In
terms of particle count, the distributions are weighted in favor of nanoparticles in all cases. On the
scale of the plots, the coarse particle concentration above 600 nm is near the zero baseline (thus the
x-axis is truncated in the plot). The matrix NA and CHCA produced the smallest number of
particles, and DHB produced the largest number: approximately 4 to 10 times as many particles as
NA and CHCA and nearly double that of SA. The NA matrix produced the smallest particles with
diameters around 40-50 nm, whereas the largest particles were produced by CHCA matrix (130-
140 nm) and SA matrix (110-170 nm), two to three times as large as NA at all laser energies.
The CHCA and SA matrix have a second peak in the size distribution near 20 nm that can
be seen at the lower left of the plots in Figure 3-1c, d; this range of particle size was not included
in the average diameter calculation. For the purposes of the discussion below, we will call particles
in the size range below 20 nm “clusters” from 20 to 450 nm “nanoparticles” and greater than 450
nm “coarse particles”. The clusters with diameters less than 20 nm make up approximately 5% of
the particle count, and this fraction drops as the laser fluence increases. However, it should be
noted that this size range can experience diffusion loss in the DMA instrument, and the
measurement may underestimate the contribution of clusters to the particle size distribution.3 Plots
of the total particle concentration as a function of laser fluence are shown in Figure 3-2. The
threshold for particle production is near 300 J/m2 for all of the matrix materials, a value that has
been reported previously2 and is comparable to the laser fluence required for ion formation in
MALDI. The production of particles monotonically increases with laser fluence, and an
approximate tripling of particle concentration with a doubling of laser energy is observed in this

38
range of laser fluence. There is an indication of saturation in Figure 3-2a, c, and d; this behavior
has been noted previously in IR laser ablation of particles from glycerol4 and is attributed to plume
shielding due to the additional material removed at high laser fluence. For all matrix compounds,
the average particle diameter increased with increasing laser fluence as can be seen in Table 3-1.
Plots for average particle diameter at laser fluences from 300, 500, 750, and 1100 J/m2 are shown
in Figure 3-3. The particle size increased monotonically with increasing fluence for all matrix
materials, but the increase is not large and corresponds to an increase in diameter between 10 and
20% with a doubling of the laser energy.
Plots of the mass weighted particle diameter for DHB, NA, CHCA, and SA are shown in
Figure 3-4. These plots indicate the particulate mass that is detected as a function of particle
diameter and is calculated by multiplying the measured diameter by the mass of a particle with that
diameter. Each point on the plot indicates the mass of the material detected in that range of particle
diameters. From these plots, it can be seen that there are two maxima in the size distributions of
particles and that coarse particles and nanoparticles have comparable total mass.
The nanoparticles have average diameters (arithmetic mean of the mass weighted diameter)
between 200 and 300 nm, and coarse particles have average diameters between 700 and 900 nm.
The ratio of the total mass of the nanoparticles and total mass of the coarse particles is strongly
dependent on the matrix material. The matrix NA produces significantly more coarse particles
whereas DHB, CHCA, and SA produce slightly more nanoparticles. The average mass-weighted
particle diameters and the mass weighted concentrations for the nanoparticles (<450 nm) and
coarse particles (>450 nm) are indicated in Table 3-1.

39
Figure 3-1. Particle size distribution measured in particle count at different laser fluences
increasing from 300 (black; bottom trace), 500 (green), 750 (blue), and 1100 J/m2 (red) for
MALDI matrixes: (a) DHB, (b) NA, (c) CHCA, and (d) SA

40
Figure 3-2. Total particle concentration as a function of laser fluence for (a) DHB, (b) NA, (c)
CHCA, and (d) SA irradiation. The error bars represent three standard deviations in the
measurement.

41
Figure 3-3. Average particle diameter as a function of laser fluence for (a) DHB, (b) NA, (c)
CHCA, and (d) SA. The error bars represent three standard deviations in the measurement.

42
Table 3-1. Summary of physical properties of particles resulting from 337 nm UV laser ablation of
common solid MALDI matrixes at different laser fluences.
Matrix Laser fluence (J/m
2)
Average Particle Diameter(nm)
Total Concentration (cm-
3)
Mass-weighted Average particle Diameter (nm)
Mass Concentration (µg/m
3)
< 450 nm > 450 nm < 450 nm > 450 nm
DHB 300 86 25900 796 188 972
500 87 127000 228 804 19800 13000
700 95 242000 218 793 25600 28900
1100 98 329000 211 784 58000 33500
NA 300 40 2700 804 43 1700
500 43 19700 187 817 462 15800
700 47 56000 198 841 1400 48700
1100 52 131000 204 984 3200 72500
CHCA 300 128 4700 197 755 2200 2600
500 130 16000 207 736 10400 5900
700 134 62300 210 728 15000 8200
1100 137 90100 221 712 23000 12300
SA 300 108 14200 241 721 1700 837
500 110 76000 351 793 14400 6300
700 137 124000 283 798 13100 9000
1100 167 136000 297 805 18300 10300
The ratio of the total mass of nanoparticles to the total mass of coarse particles is plotted as
a function of laser fluence in Figure 3-5 for the four matrix compounds. The matrix NA is unique in
that the ratio of nanoparticles to coarse particles is between 1/30 and 1/60 as well as the fact that this
ratio decreases at higher laser fluence. The matrix compounds DHB, CHCA, and SA produce up to
twice as much nanoparticle mass, and the mass ratio increases with pulse energy.
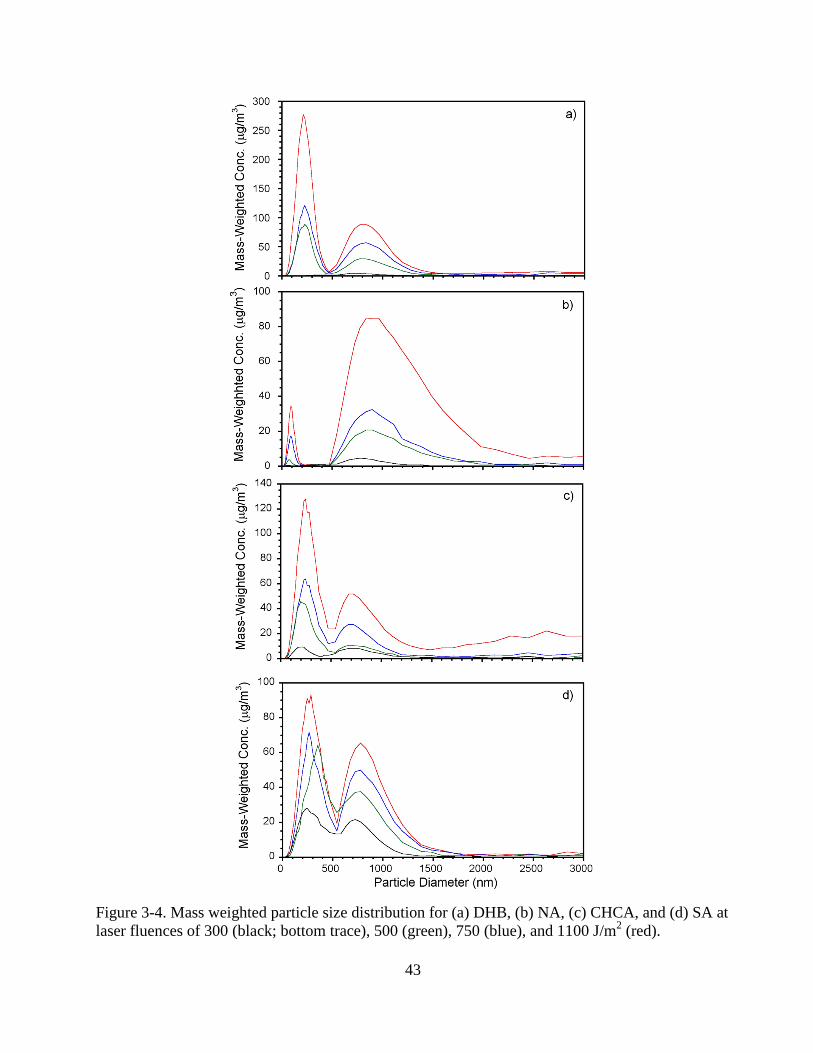
43
Figure 3-4. Mass weighted particle size distribution for (a) DHB, (b) NA, (c) CHCA, and (d) SA at
laser fluences of 300 (black; bottom trace), 500 (green), 750 (blue), and 1100 J/m2 (red).

44
Figure 3-5. Ratio of mass ejected as coarse particles (>450 nm) and nanoparticles (<450 nm) as a
function of the laser fluence for (a) DHB, (b) NA, (c) CHCA, and (d) SA.

45
In this study, we observe three distinct maxima in the particle size distribution: clusters,
nanoparticles, and coarse particles. These sets of particles arise from different processes induced
by the laser-material interaction. Multiple maxima in particle size distributions have been observed
previously in both experimental,1-8
and theoretical9 studies. In a previous study of MALDI matrix
materials at atmospheric pressure using a DMA, clusters and nanoparticles were observed.10
The
clusters were interpreted as arising from nucleation and condensation of desorbed matrix
molecules and the nanoparticles as arising from agglomeration of particles in the expanding plume.
A minor component of clusters near 20 nm in diameter was also observed and attributed to
nucleation and condensation of desorbed matrix molecules.
A separate study from our laboratory reported the production of coarse particles between
500 and 1000 nm.11
In a molecular dynamics simulation of cluster formation, it was found that
large clusters were formed near the sample surface under conditions of phase explosion.12
A
nonatomistic theoretical study of laser-induced particle formation from silicon showed that
nanoparticles on the order of 100 nm in diameter were created in an ambient gas on a microsecond
time scale by the condensation of clusters and smaller nanoparticles.1 A separate nonatomistic
treatment of the ablation of metals suggests that hydrodynamic sputtering can lead to nanoparticle
formation.8 In a study of UV laser ablation of NaNO3, the formation of nanoparticles was
attributed to hydrodynamic sputtering of the melted material.13
In our current work, we have
insufficient information to distinguish between agglomeration and hydrodynamic sputtering, and in
fact, both may be occurring. The coarse particles observed in this study are too large to result
either from gas-to-particle conversion or agglomeration. In the study of UV laser ablation of
NaNO3 noted above, a bimodal particle size distribution was observed and the coarse particle
component was attributed to melting and spallation of melted material that produced the coarse

46
particles (in contrast to nanometer particle production by hydrodynamic sputtering).14
It is likely
that spallation of melted material or solid material is the mechanism for the formation of coarse
particulate in our current work.
Two matrix parameters that could help to elucidate the mechanism of particle formation are
the melting point and the absorption coefficient. Of the matrix compounds used in the current
study, NA has a melting point of 146 0C,
15 DHB has a melting point of 205
0C,
16 CHCA has a
melting point of 242 0C,
17 and SA has a melting point of 200
0C.
18 The low melting point of NA is
consistent with the anomalous particle size distribution for the NA matrix in Figure 3-1b and
Figure 3-3b. We hypothesize that the more easily melted NA produces a large mass ejection of
melted matrix by spallation, and this is increasingly favored at higher pulse energies (Figure 3-5b).
The lower boiling point will also disfavor cluster and nanoparticle formation and agglomeration,
which could explain the relatively low nanoparticle average diameter. An additional parameter that
can help elucidate the mechanism is the absorption coefficient of the matrix because it is related to
the ablation depth and therefore particle size. The reciprocal absorption coefficients for thin films
of the matrix materials are 91 nm for SA, 126 nm for DHB, and 46 nm for CHCA.19
The reciprocal
absorption coefficient for NA is estimated to be 160 nm;20
thus, NA has the greatest penetration
depth, and the volumetric energy density is lower for a given laser fluence. This is consistent with
the ejection of a large quantity of the mass as coarse particles for the NA matrix.
The results of this study have important implications for MALDI, MALDESI, and related
techniques. Molecular dynamic simulations of MALDI that include both chemical and physical
processes suggest that ionization occurs through the ejection of analyte molecules in clusters.21
Although the mechanism of cluster desolvation to form free analyte ions is not clear, it would
appear that ion formation will be maximized if the cluster component of the ejected material is

47
maximized. In our work, the formation of clusters is highly dependent on the matrix and on the
laser pulse energy. For laser-based ambient ionization methods such as MALDESI, it has been
suggested that particles laser ablated from the sample merge with the electrospray droplets to form
ions and that this mechanism is particularly important when an infrared laser is used for ablation.22-
24 Others have suggested that ionization occurs through the desorption of individual biomolecules
that merge with the electrospray droplets.25-26
To maintain the charge density on the electrospray
droplet, it must merge either with a free molecule or a particle with a diameter smaller than a
charged droplet. Note that electrospray produces charged droplets with diameters 1 µm or
smaller.27
Experimental studies have shown that the highest ionization efficiency in ELDI is
obtained when the plume of desorbed and ablated material is introduced closest to the ESI spray
tip where the charged droplets are largest.28
This is suggestive of a mechanism in which a charged
electrospray droplet merges with a relatively large ablated particle, perhaps 100 nm or larger in
size. In this case, it will be important to produce conditions that favor particle agglomeration or
hydrodynamic sputtering and the formation of nanoparticles.
If particle fusion is an important mechanism for MALDESI and ELDI, the effect of analyte
partitioning must be considered; that is, the concentration of analyte in particles of a given size
range may not reflect the concentration in the bulk. It has been found that, in the bimodal particle
distributions found in laser ablation, the coarse particles are enriched in the less volatile
components whereas the smaller particles are depleted.7 It also should be noted that the presence of
large analyte molecules within the matrix results in the ejection of larger analyte-containing
droplets, particularly at low matrix to analyte molar ratio.29
This suggests that a more volatile
matrix such as NA, in addition to producing a large fraction of coarse particles, may also be
efficient at producing particles that are enriched in analyte molecules.

48
3.4 Conclusions
We combined light scattering and differential mobility analysis to obtain particle size
distributions after laser desorption and ablation of matrix materials used in ambient mass
spectrometry. The combined sizing instruments allow the assessment of the size and number of
particles from 10 nm to 20 µm for the MALDI matrix compounds 2,5-dihydroxybenzoic acid, 4-
nitroaniline α-cyano-4-hydroxycinnamic acid, and sinapic acid. The laser fluence threshold for
particle formation was found to be 300 J/m2, similar to that reported previously.
11 A bimodal
distribution was found comprising nanoparticles with average diameters near 100 nm and coarse
particles with average diameters near 1 µm in diameter. The nanoparticles are attributed to particle
agglomeration and/or hydrodynamic sputtering, and the coarse particles are attributed to melting
and spallation of the matrix. A third component of the size distribution was found for CHCA and
SA that is attributed to direct ejection of clusters in the 10 nm size range. The number of
nanoparticles exceeds the number of coarse particles by several orders of magnitude, but the mass
of particulate contained in the nanoparticles and coarse particles is comparable in most cases. The
exception is NA for which the mass of coarse particulate is 30 to 50 times larger than the mass of
the ejected nanoparticles. This behavior is attributed to the lower boiling point and lower
absorption coefficient of NA that results in a large quantity of matrix melt that is preferentially
removed by spallation.
These results have implications for MALDI and for laser-based ambient ionization
techniques such as MALDESI that rely on desorption and ablation of large biomolecules that are
ionized through the interaction with an electrospray of highly charged particles. It has been
suggested that MALDI involves the ejection of analyte in clusters that subsequently form free
ions.21
In this case, it will be important to maximize the production of clusters in the laser material

49
interaction. On the other hand, MALDESI is thought to involve the interaction of nanoparticles
with charged electrospray droplets.23
For this mode of ionization, it will be important to produce
larger particulate to facilitate analyte transfer to the charged electrospray droplet.
3.5 References
1. Bleiner, D., Mathematical modelling of laser-induced particulate formation in direct solid
microanalysis. Spectrochim. Acta, Part B 2005, 60 (1), 49-64.
2. Landström, L.; Márton, Z.; Boman, M.; Heszler, P., Monitoring nanoparticle formation during
laser ablation of graphite in an atmospheric-pressure ambient. Appl. Phys. A 2004, 79 (3), 537-
542.
3. Márton, Z.; Landström, L.; Boman, M.; Heszler, P., A comparative study of size distribution of
nanoparticles generated by laser ablation of graphite and tungsten. Mater. Sci. Eng., C 2003, 23
(1), 225-228.
4. Heszler, P., Emission spectroscopy and size distribution of gas phase nanoparticles generated by
laser-based methods. Appl. Surf. Sci 2002, 186 (1), 538-545.
5. Camata, R. P.; Hirasawa, M.; Okuyama, K.; Takeuchi, K., Observation of aerosol formation
during laser ablation using a low-pressure differential mobility analyzer. J. Aerosol Sci. 2000,
31 (4), 391-401.
6. Bereznai, M.; Heszler, P.; Tóth, Z.; Wilhelmsson, O.; Boman, M., Measurements of
nanoparticle size distribution produced by laser ablation of tungsten and boron-carbide in N<
sub> 2</sub> ambient. Appl. Surf. Sci. 2006, 252 (13), 4368-4372.
7. Hergenröder, R., Laser-generated aerosols in laser ablation for inductively coupled plasma
spectrometry. Spectrochim. Acta, Part B 2006, 61 (3), 284-300.
8. Trimpin, S.; Herath, T. N.; Inutan, E. D.; Cernat, S. A.; Miller, J. B.; Mackie, K.; Walker, J. M.,
Field-free transmission geometry atmospheric pressure matrix-assisted laser
desorption/ionization for rapid analysis of unadulterated tissue samples. Rapid Commun. Mass
Spectrom. 2009, 23 (18), 3023-3027.
9. Chen, Z.; Vertes, A., Early plume expansion in atmospheric pressure midinfrared laser ablation
of water-rich targets. Phys. Rev. E: Stat., Nonlinear, Soft Matter Phys. 2008, 77 (3), 036316.
10. Alves, S.; Kalberer, M.; Zenobi, R., Direct detection of particles formed by laser ablation of
matrices during matrix-assisted laser desorption/ionization. Rapid Commun. Mass Spectrom.
2003, 17 (18), 2034-2038.
11. Jackson, S. N.; Mishra, S.; Murray, K. K., Characterization of coarse particles formed by laser
ablation of MALDI matrixes. J. Phys. Chem. B 2003, 107 (47), 13106-13110.

50
12. Zhigilei, L., Dynamics of the plume formation and parameters of the ejected clusters in short-
pulse laser ablation. Appl. Phys. A 2003, 76 (3), 339-350.
13. Webb, R.; Dickinson, J.; Exarhos, G., Characterization of particulates accompanying laser
ablation of NaNO3. Appl. Spectrosc. 1997, 51 (5), 707-717.
14. Hergenroder, R., Hydrodynamic sputtering as a possible source for fractionation in LA-ICP-
MS. J. Anal. At. Spectrom. 2006, 21 (5), 517-524.
15. Sin, C.; Pang, H.; Lubman, D.; Zorn, J., Supercritical carbon dioxide injection in supersonic
beam mass spectrometry. Anal. Chem 1986, 58 (2), 487-490.
16. Karas, M.; Ehring, H.; Nordhoff, E.; Stahl, B.; Strupat, K.; Hillenkamp, F.; Grehl, M.; Krebs,
B., Matrix‐assisted laser desorption/ionization mass spectrometry with additives to 2,
5‐dihydroxybenzoic acid. Org. Mass Spectrom. 1993, 28 (12), 1476-1481.
17. Kitagawa, N. T., Synthesis of a Polyelectrolyte and Its Applications in Laser
Desorption/Ionization. Anal. Chem 2006, 78 (2), 459-469.
18. Jang, D. S.; Park, E. J.; Kang, Y.-H.; Su, B.-N.; Hawthorne, M. E.; Vigo, J. S.; Graham, J. G.;
Cabieses, F.; Fong, H. H.; Mehta, R. G., Compounds obtained fromSida acuta with the potential
to induce quinone reductase and to inhibit 7, 12-dimethylbenz-[a] anthracene-induced
preneoplastic lesions in a mouse mammary organ culture model. Arch. Pharm. Res. 2003, 26 (8),
585-590.
19. Allwood, D.; Dreyfus, R.; Perera, I.; Dyer, P., UV Optical Absorption of Matrices Used for
Matrix‐assisted Laser Desorption/Ionization. Rapid Commun. Mass Spectrom. 1996, 10 (13),
1575-1578.
20. Gimon-Kinsel, M.; Preston-Schaffter, L. M.; Kinsel, G. R.; Russell, D. H., Effects of matrix
structure/acidity on ion formation in matrix-assisted laser desorption ionization mass
spectrometry. J. Am. Chem. Soc. 1997, 119 (10), 2534-2540.
21. Knochenmuss, R.; Zhigilei, L. V., Molecular dynamics simulations of MALDI: laser fluence
and pulse width dependence of plume characteristics and consequences for matrix and analyte
ionization. J. Mass Spectrom. 2010, 45 (4), 333-346.
22. Vertes, A.; Nemes, P.; Shrestha, B.; Barton, A. A.; Chen, Z.; Li, Y., Molecular imaging by
Mid-IR laser ablation mass spectrometry. Appl. Phys. A 2008, 93 (4), 885-891.
23. Nemes, P.; Vertes, A., Laser ablation electrospray ionization for atmospheric pressure, in vivo,
and imaging mass spectrometry. Anal. Chem 2007, 79 (21), 8098-8106.
24. Rezenom, Y. H.; Dong, J.; Murray, K. K., Infrared laser-assisted desorption electrospray
ionization mass spectrometry. Analyst 2008, 133 (2), 226-232.
25. Huang, M.-Z.; Jhang, S.-S.; Cheng, C.-N.; Cheng, S.-C.; Shiea, J., Effects of matrix,
electrospray solution, and laser light on the desorption and ionization mechanisms in

51
electrospray-assisted laser desorption ionization mass spectrometry. Analyst 2010, 135 (4), 759-
766.
26. Huang, M.-Z.; Hsu, H.-J.; Lee, J.-Y.; Jeng, J.; Shiea, J., Direct protein detection from
biological media through electrospray-assisted laser desorption ionization/mass spectrometry. J.
Proteome Res. 2006, 5 (5), 1107-1116.
27. Bruins, A.; Covey, T.; Henion, J., Ion spray interface for combined liquid
chromatography/atmospheric pressure ionization mass spectrometry. Anal. Chem 1987, 59 (22),
2642-2646.
28. Shiea, J.; Huang, M.-Z.; Hsu, H.-J.; Lee, C.-Y.; Yuan, C.-H.; Beech, I.; Sunner, J.,
Electrospray-assisted laser desorption/ionization mass spectrometry for direct ambient analysis
of solids. Rapid Commun. Mass Spectrom. 2005, 19 (24), 3701-3704.
29. Leveugle, E.; Zhigilei, L. V., Molecular dynamics simulation study of the ejection and
transport of polymer molecules in matrix-assisted pulsed laser evaporation. J. Appl. Phys. 2007,
102 (7), 074914-074914-074919.
30. Alves, S.; Kalberer, M.; Zenobi, R., Direct detection of particles formed by laser ablation of
matrices during matrix-assisted laser desorption/ionization. Rapid Commun. Mass Spectrom. 2003,
17 (18), 2034-2038.
31. Jackson, S. N.; Mishra, S.; Murray, K. K., Characterization of coarse particles formed by laser
ablation of MALDI matrixes. J. Phys. Chem. B 2003, 107 (47), 13106-13110.
32. Frank, B. P.; Saltiel, S.; Hogrefe, O.; Grygas, J.; Garland Lala, G., Determination of mean
particle size using the electrical aerosol detector and the condensation particle counter:
Comparison with the scanning mobility particle sizer. J. Aerosol Sci. 2008, 39 (1), 19-29.
33. Trimpin, S.; Inutan, E. D.; Herath, T. N.; McEwen, C. N., Laserspray ionization, a new
atmospheric pressure MALDI method for producing highly charged gas-phase ions of peptides
and proteins directly from solid solutions. Mol. Cell. Prot 2010, 9 (2), 362-367.

52
CHAPTER 4. PARTICLE FORMATION BY INFRARED LASER ABLATION
4.1 Overview
Previous studies used wavelength tunable infrared lasers and an APS to measure the size
distribution of coarse particles ablated from glycerol.1-2
These studies were extended with the
combined APS/SMPS particle sizing system for measurements of particles ablated from glycerol
and solid MALDI matrix compounds.
The concentration and size distribution of the particles ablated from the infrared MALDI
matrix compounds succinic acid (butanedioic acid, BA), α-cyano-4-hydroxycinnamic acid
(CHCA), and glycerol were measured using the combined APS/SMPS system. The two sizing
instruments together had a sizing range to from 10 nm to 20 μm. Thin layers of the matrix
compounds were irradiated at fluences between 6.0 and 9.5 kJ/m2 and wavelengths between 2.8
and 3.0 μm. The distribution of particles was characterized by a large concentration of clusters in
the 20 nm diameter range and large component of mass in the range of coarse particle with
diameters greater than 1 μm. The wavelength dependence revealed a blue shift for the maximum
particle production that is attributed to heating and disruption of the hydrogen bonds in the
matrix that shifts the absorption to shorter wavelengths.
4.2 Introduction
Laser ablation is a useful sampling approach in analytical chemistry because it is fast,
requires minimal sample preparation, and can be used for two-dimensional imaging and depth
profiling of samples under ambient conditions.3-7
Various detection schemes have been devised
for the analysis of the sample components. Laser induced breakdown spectroscopy (LIBS) relies
on the detection of photons emitted from the expanding plume of laser ablated material.8 LIBS is
typically used to detect emission from atoms and atomic ions but a new variant, laser ablation

53
molecular isotopic spectroscopy (LAMIS) relies on optical emission from electronically excited
small molecules in the laser ablation plasma.8 Laser ablation can also be used as a sampling
method for mass spectrometry. With laser ablation inductively coupled plasma mass
spectrometry (LA ICPMS) laser ablated particles are ionized in a plasma and mass spectrometry
used to detect the atomic ions.9 Larger ions can be formed directly under ambient conditions by
atmospheric pressure matrix-assisted laser desorption ionization (AP-MALDI).10
Post ionization
can also be used, for example, ablated material can be combined with an electrospray,11-13
flowing afterglow,14
or photoionization.15
Laser ablated material can also be captured in a
solvent or on a surface and subsequently ionized for mass spectrometry.16-17
Pulsed infrared lasers tend to remove material by ablation with more limited chemical
bond fragmentation compared to UV lasers and this property can be useful in some chemical
analysis applications. IR lasers can be used for LIBS either alone or in combination with IR or
UV lasers in double-pulse experiments.4 In LA ICPMS, IR ablation can be useful in some
applications, for example the analysis of samples in powder form;18
however, there has been a
general move from IR to UV in geochemistry due to better bond-breaking characteristics of UV
lasers.19
Infrared lasers have been used for MALDI, but have seen limited application due to
difficulties in controlling the quantity of material removed with ionization under vacuum.20
IR
lasers are much more useful for sampling under ambient conditions with ionization accomplished
by subsequent interaction of the ablated material with charged electrospray droplets,21-23
metastable ions,24
or through photoionization.15
The efficiency of material removal by infrared
laser ablation makes this wavelength useful for sample transfer.25-26
Study of material removal is necessary to determine the optimum laser wavelength, pulse
width, pulse energy and other parameters for the particular analytical application. The plume of
54
ablated material can be viewed directly by detection of optical emission, shadowgraph, or light
scattering images.27-32
Material ablated as particulate can be collected and analyzed by
microscopy33-35
or subjected to particle size analysis.36-39
In previous work from our group, we
used tunable mid-infrared lasers operating in the 3 µm wavelength region to produce particles
from glycerol under conditions used for ionization and sampling in ambient mass spectrometry.1,
31, 37 By tuning the IR laser onto or off of the OH or CH stretch vibration, the particle size and the
amount of material removed could be varied greatly. However, particles smaller than 500 nm in
diameter were not measured in these studies.
A particle sizing system that extends the measurement capability from 500 nm down to
10 nm has been developed.39
This system was used to obtain full-range particle size distributions
from IR laser ablation of glycerol and particles ablated from thin films of crystalline MALDI
matrix compounds. Samples were deposited on a microscope slide and placed in a chamber at
atmospheric pressure. The samples were irradiated with tunable IR mini optical parametric
oscillator laser system at wavelengths between 2.8 and 3.0 µm. After irradiation, ablated
particles were sampled and the particle size and concentration were recorded for particles
between 10 nm and 20 µm diameter. The effects of laser fluence and wavelength on the particle
size and concentration distributions were investigated.
4.3 Experimental
The particle ablation system used in this work has been described in detail in Chapter 2. Particle
size measurements are made using two commercial instruments: an APS for particles between 20
μm and 500 nm in diameter and a SMPS for particles between 500 nm and 10 nm in diameter.
Particles are created in an ambient pressure chamber placed over the inlet of the APS and
connected to the SMPS with conductive tubing. The sample target was a borosilicate glass

55
microscope slide that was mounted at the center of the ablation chamber on a translation stage.
Samples deposited on the target were irradiated at normal incidence with the infrared optical
parametric oscillator at a repetition rate of 2 Hz. A 150 mm calcium fluoride lens was used to
focus the laser on the sample target to a 300 μm diameter spot size. While being irradiated the
sample target was moved manually in the vertical direction to ensure continuous and stable
particle production. The recording of particle size measurements was initiated 10 seconds after
the laser was turned on to assure that a steady particle generation was achieved. Five replicates
were obtained for each measurement at a particular wavelength and fluence. Thin films of
glycerol were prepared by depositing a 100 μ volume of neat glycerol on the sample target. The
solid MALDI matrix compounds were succinic acid and α-cyano-4-hydroxycinnamic acid. The
IUPAC name for succinic acid is butanedioic acid and below we will abbreviate it as BA to
avoid confusion with sinapinic acid, which is abbreviated “ ” above.
4.4 Results
Two solid and one liquid matrix were chosen for the IR laser ablation studies. Succinic acid
(abbreviated below as BA to indicate butanedioic acid) and glycerol are common IR MALDI
matrix compounds.20
The compound α-cyano-4-hydroxycinnamic acid (CHCA) is a common
UV MALDI matrix and laser ablation particle formation was reported in Chapter 3 above.39
Particle size measurements were recorded and reported both as the number of particles as well as
the mass-weighted particle concentration.

56
Figure 4-1. Particle size distributions presented in a number concentration for a) BA b) CHCA ,
and c) glycerol at different laser fluences; 6000 (black), 7500 (green), 8500 (red) and 9500 J/m2
(blue). The laser wavelength was 2.94 µm.

57
Particle size distribution plots for BA, CHCA and glycerol are shown in Figure 4-1. The
laser wavelength was set to 2.94 µm to enable comparison with results from studies using the
fixed wavelength Er:YAG laser. Laser fluences of 6.0, 7.5, 8.5, and 9.5 kJ/m2 were used. The
total particle concentration obtained at each fluence is given in Table 4-1. Glycerol produced the
greatest number of particles at all fluences, ranging from to 1.7 ×10⁵ /cm
3 at 6.0 kJ/m
2 to 3.6
×105 /cm
3 at 9.5 kJ/m
2. The total number of particles is more than double that of BA and CHCA
at high fluence and 7 and 4 times as much respectively at the lowest fluence. The distribution of
particle sizes was markedly different for glycerol compared to the solid matrices. Glycerol
displayed a bimodal particle size distribution at all fluences with contributions from smaller
particles at diameters from 10 – 50 nm and a contribution from a separate set of particles ranging
from 50 to 800 nm with an average diameter near 300 nm. In analogy with our previous UV
ablation study,39
we will call particles with diameters below 20 nm “clusters” those from 20 to
450 nm “nanoparticles” and particles with diameters greater than 450 nm “coarse particles”. The
ratio of nanoparticles to clusters increased from 15% at 6.0 kJ/m2 to 26% at 9.5 kJ/m
2 (Table 4-
1). The BA and CHCA particles were relatively much smaller with average diameters less than
20 nm. Average particle diameters are given in Table 4-1. The CHCA matrix produced a small
number of nanoparticles at higher fluences, but the ablated material was primarily clusters.
Plots of the mass concentration of ablated particulate as a function of particle size are
shown in Figure 4-2 for BA, CHCA, and glycerol. The data are identical to that in Figure 4-1 but
weighted for the particle mass. The laser wavelength was 2.94 µm and the fluence was 6.0, 7.5,
8.5, and 9.5 kJ/m2. The distribution of mass among the different particle sizes is strikingly
different among the different matrix compounds. The mass of the BA particles is represented by
particles around 1 µm in diameter at lower fluences, but at 8.5 kJ/m2 and above, a second

58
maximum in the distribution appears for particles around 3 µm in diameter. Average mass
weighted particle diameters are indicated in Table 4-1. The peak of the mass weighted size
distribution for CHCA is near 10 µm and does not shift with increasing energy.
Figure 4-2. Mass weighted concentration plots for a) BA b) CHCA, and c) glycerol at different
laser fluences; 6000 (black), 7500 (green), 8500 (red) and 9500 J/m2 (blue). The laser
wavelength was kept constant at 2.940 µm.

59
By mass, CHCA is ejected primarily as coarse particles. Glycerol has two maxima in the
mass weighted plot: there is a local maximum at 1 µm and a broad distribution of material in
particles with diameters from 2 to 20 µm. The average mass-weighted diameter of the large
particles increases with increasing laser fluence. The particle concentration as a function of
diameter for glycerol is shown in Figure 4-3 for a number of wavelengths between 2.88 and 3.00
µm. The laser fluence was 8.5 kJ/m2. The concentration, diameter, mass weighted concentration,
and mass weighted diameter for all of the matrix compounds are given in Table 4-2. The
maximum for both the concentration and mass weighted concentration of particulate is near 2.94
µm for all of the matrices. The average diameter of the glycerol clusters is near 30 nm for all
wavelengths. The nanoparticles are most prominent at 2.92 µm and decrease in relative
contribution to shorter wavelengths and contribute the least at 2.88 µm.
The mass weighted particle concentration as a function of particle size for BA at various
mid-IR wavelengths is shown in Figure 4-4. The laser fluence was 8.5 kJ/m2 and particle
concentration and diameter data are given in Table 4-2. There is a maximum in the distribution
near 1 µm diameter at all wavelengths and there is a prominent second maximum near 3 µm
diameter for all wavelengths except for 2.88 and 3.00 µm.
The wavelength dependence of the total particle concentration for BA, CHCA and
glycerol is given in Figure 4-5 and the wavelength dependence of the mass weighted
concentration is given in Figure 4-6. More data points were obtained for glycerol because the
liquid surface is self replenishing and could be irradiated for many more shots compared to the
solid matrix surfaces. The maximum signal is observed near 2.94 in all cases with the exception
of the total concentration for CHCA and the mass weighted concentration for BA that are at a
maximum near 2.96 µm.

60
Figure 4-3. Plot of glycerol ablated particle number concentration as a function of wavelength, a)
2.88, b) 2.90, c) 2.92, d) 2.94, e) 2.960, f) 2.98, and g) 3.00 µm.

61
Figure 4-4. Plot of BA particle mass concentration as a function of a) 2.880, b) 2.900, c) 2.920,
d) 2.940, e) 2.960, f) 2.980, and g) 3.00 µm at 8500 J/m2 fluence.

62
Figure 4-5. Particle concentration as a function of wavelength for a) BA, b) CHCA, and c)
glycerol at 8500 J/m2 fluence.

63
Figure 4-6. Particle mass concentration as a function of wavelength for a) BA, b) CHCA , and c)
glycerol.

64
Figure 4-7. Total concentration for coarse particles of glycerol at 8500 J/m2 laser fluence as a
function of wavelength for a) number concentration and b) mass weighted concentration.
4.5 Discussion
In the work reported in Chapter 3 on UV laser ablation particle formation, it was found
that there were three distinct ranges of particle size:39
clusters with diameters below 20 nm,
nanoparticles with diameters from 20 – 450 nm, and coarse particles with diameters greater than
450 nm. In this view, clusters are directly ejected from the irradiated matrix material, whereas
nanoparticles are formed by agglomeration of the clusters or hydrodynamic sputtering of the
melted matrix. Coarse particles are attributed to spallation of large chunks of the matrix material.
In the UV laser ablation study, the largest quantity of particulate was in the nanoparticle size
range whereas the mass of material ejected was nearly evenly distributed between the
nanoparticles and the coarse particles. With the UV laser, clusters made up about 5% of the

65
particle count with nanoparticles dominating the particle count. The particle mass was nearly
evenly distributed between the nanoparticles and coarse particles for the UV laser ablated
matrices.
The IR ablation results contrast with the UV ablation results in that the particle number
distribution is dominated by clusters for both the solid and liquid matrices. The solid matrices in
particular are characterized by the large number of clusters produced by IR laser ablation. The
liquid matrix glycerol produces a large number of nanoparticles at high laser fluence. The
comparison between CHCA with UV and IR laser ablation is striking. With UV ablation, the
average particle diameter is around 130 nm and the particle size distribution is dominated by
nanoparticles with a small contribution from clusters (Ref. 37 Figure 1c).1 In contrast, the
average diameter for IR ablated particles is close to 15 nm (Figure 4-1b). The CHCA mass
weighted particle diameter has contributions from nanoparticles and coarse particles nearly
evenly distributed (Ref 37 Figure 4c) in contrast to IR ablation, which is dominated by coarse
particles with mass weighted diameters near 10 µm. The IR laser ablation CHCA particle size
distributions are more similar to those obtained by transmission mode (back side irradiation) UV
laser ablation2 and shock generated particles
3 obtained under conditions aimed at replicating
those of inlet ionization. Although transmission mode UV ablation did not produce particles as
small as those from IR laser ablation, the mass weighted particle size distribution is dominated
by coarse particles, similar to the mass weighted distribution obtained from IR laser ablation.
This is consistent with the IR laser’s greater depth of penetration into the sample which removes
large chunks of material in a manner similar to transmission mode ablation that heats the thin
film from below to more efficiently remove large particulate.

66
It is interesting that the particles produced by IR laser ablation are similar to those
produced under ablation or shock particle production conditions amenable to inlet ionization. IR
MALDI is similar to inlet ionization in that both tend to produce multiply charged ions.4-5
It has
been postulated that the mechanism of inlet ionization involves the evaporation of matrix
“solvent” from highly charged clusters in the heated mass spectrometer inlet.6 The production of
relatively large concentrations of clusters under laserspray,2 matrix-assisted inlet ionization,
3 and
IR MALDI conditions is consistent with the propensity for multiply charged analyte ions.
The IR ablation of glycerol shown in Figure 4-1 can be distinguished from the solid
matrix ablation in that there are contributions both from clusters as well as from nanoparticles.
The nanoparticles are attributed to melting and hydrodynamic sputtering of a solid matrix but,
for the liquid glycerol matrix, sputtering can occur without the necessity of melting and is
therefore more facile. Indeed, the nanoparticle component of the ablation dominates even when
weighted for the mass of material removed as in Figure 4-2c.
The mid-infrared laser wavelength dependence of coarse particle ablation from glycerol
has been reported previously.7 This study used a light scattering particle sizer alone and was
limited to the measurement of particles with diameters greater than 450 nm. In this work, the
particle concentration peaked at a concentration of 3.0 µm, coincident with the IR absorption
maximum of a thin film of glycerol. This is in contrast with the maximum in particle
concentration at 2.93 µm indicated in Figure 4-5c of the current study for the full range of
particle sizes from 10 nm to 20 µm. The maximum of the mass-weighted concentration of coarse
particles was 3.1 µm compared to 2.3 µm measured in the current study (Figure 4-6c). This
discrepancy is due to the fact that both in terms of particle number and particle mass, the ablation
of glycerol is dominated by nanoparticles and clusters that are not efficiently detected by light

67
Table 4-1. Summary of the physical properties of particles IR laser ablated from matrix compounds at laser wavelength from 2.880 –
3.00 µm at a laser fluence of 8500 J/m2.
Matrix Laser fluence
(J/m²)
Particle
concentration
(/cm³)
Average particle
diameter (nm) Mass concentration
(µg/m³)
Average particle diameter
(mass weighted)
< 200 nm > 200 nm < 2 µm > 2 µm
BA
9500 144600 12 12400 0.95 2.8
8500 90400 12 11100 1.0 3.0
7500 32200 11 3500 1.3 3.4
6000 23800 10 1100 1.1 0
CHCA
9500 185300 17 11500 9.5
8500 133400 17 8300 10
7500 65700 15 6400 9.0
6000 43800 17 5700 9.0
Glycerol
9500 360400 32 355 27300 0.90 8.0
8500 296800 26 350 18200 0.90 7.0
7500 211300 28 280 10900 0.80 5.0
6000 171100 28 260 10300 0.70 5.0

68
Table 4-2. Summary of the physical properties of particles IR laser ablated from matrix compounds at different laser fluences using
2.940 µm wavelength.
Matrix Laser
wavelength (nm)
Particle
concentration (/cm³)
Average particle
diameter (nm) Mass
concentration (µg/m³)
Average particle
diameter (mass weighted)
< 200 nm > 200 nm < 2 µm > 2 µm
BA
2880 28900 11 2900 0.9 -
2900 39600 11 6200 0.9 2.5
2920 55700 13 9300 0.9 3.1
2940 90400 12 8100 1.0 3.0
2960 63900 12 12000 0.9 3.3
2980 51300 11 9200 1.1 3.0
3000 21800 11 4100 0.8 3.4
CHCA
2880 18000 16 1300 10
2900 32000 14 1900 11
2920 65600 16 5400 9
2940 133400 17 8300 10
2960 153700 17 6400 8
2980 143000 18 4400 10
3000 44000 16 950 18
Glycerol
2880 7900 31 210 3500 0.60 3.5
2900 166300 26 250 4800 0.85 3.8
2920 207100 31 330 10700 0.85 3.0
2940 296800 26 350 18200 0.90 7.0
2960 267100 28 340 18700 0.83 3.3
2980 157200 29 320 10000 0.90 4.5
3000 84200 29 280 2000 0.90 5.5

69
scattering. Further, the average particle diameter is significantly lower at 2.9 µm compared to 3.0
µm and longer wavelengths (See Figure 2 of Ref. 38).7 This result can be recovered from our
current data. Figure 4-7 shows a plot of the coarse particle concentration and mass weighted
concentration as a function of wavelength for glycerol. Although the OPO used in the current
study is not broadly tunable, it can be seen that the wavelength maximum for coarse particle
concentration is shifted toward 3.0 µm or above.
The production of nanoparticles and clusters of glycerol at 2.9 µm is interpreted as
resulting from rapid boiling (phase explosion) when the laser is tuned to the OH stretch
absorption maximum.8 The phase explosion produces a large number of clusters and
nanoparticles. This vigorous ejection of material on resonant absorption has been observed with
fast photography using light scattering.9 It was found that not only is the plume visibly larger on
resonance, the velocity of the plume front is greater between 2.9 and 3.0 µm compared to both
higher and lower wavelengths. The shift of the particle concentration maximum to the short
wavelength side of the peak of the OH stretch absorption may be related to the blue shift in ion
production in IR MALDI that has been attributed to a thermal bootstrap effect.10-13
Laser heating
of the matrix disrupts hydrogen bonding that shifts the absorption maximum to shorter
wavelengths and can lead to a maximum in ion production blue shifted with respect to the
absorption maximum.
The BA matrix displays a strong blue shift in the particle concentration maximum
compared to the IR absorption maximum that parallels the observation for IR MALDI mass
spectra.10, 12
The wavelength for the maximum IR absorption is near 3.4 µm but it functions most
efficiently as a MALDI matrix at 2.9 µm. The maximum for particle number is 2.94 µm and for
particle mass is 2.96 µm (Figures 4-5a and 4-6a). As with the IR MALDI performance, this is

70
likely due to disruption of the strong hydrogen bonds in the succinic acid crystal matrix that
shifts the OH stretch absorption to 2.9 µm. This strong absorption may be responsible for the
emission of greater numbers of coarse particles, which is favored at wavelengths between 2.90
and 2.98 µm (Figure 4-4) and higher pulse energies (Figure 4-2a).
4.6 Conclusions
We have used a combined light scattering and differential mobility analyzer system to
measure particle size distributions of matrix materials ablated by a mid-infrared optical
parametric oscillator. The size and number of particles with diameters between 10 nm and 20 µm
was measured for the DI matrix compounds succinic acid (butanedioic acid B ) α-cyano-
4-hydroxycinnamic acid (CHCA), and glycerol. Particle sizes were measured at laser fluences
between 6 and 9.5 kJ/m2 and wavelengths between 2.88 and 3.00 µm.
The most striking difference between the particles ablated by the mid-IR laser system and
UV laser is the production of large numbers of clusters (~20 nm) by the IR laser as opposed to
predominantly nanoparticles (20-450 nm) produced by the UV laser. IR ablation of the matrix
CHCA more closely resembled transmission mode ablation2 and shock-generated particle
formation3 than reflection mode ablation.
1 The particle count was dominated by clusters while
the particle mass was dominated by large coarse particles with diameters near 10 µm. The
production of large particles may be related to the deep penetration of the IR laser in the sample
that results from the relatively low IR absorption compared to UV absorption.
The wavelength dependence of particle formation tends to follow the free OH absorption
with its maximum near 2.9 µm rather than the IR absorption of the matrix film which tend to
have a maximum several hundred nanometers longer in wavelength. This blue shift is attributed

71
to disruption of hydrogen bonding in the matrix upon heating and has been observed previously
in IR MALDI.10-13
4.7 References
1. Hahn, D.W.; Omenetto, N., Laser-induced breakdown spectroscopy (LIBS), part I: review of
basic diagnostics and plasma-particle interactions: still-challenging issues within the
analytical plasma community. Appl. Spectrosc. 2010, 64, 335-366.
2. Hahn, D.W.; Omenetto, N., Laser-Induced Breakdown Spectroscopy (LIBS), Part II: Review
of Instrumental and Methodological Approaches to Material Analysis and Applications to
Different Fields. Appl. Spectrosc. 2012, 66, 347-419.
3. Wu, C.; Dill, A.L.; Eberlin, L.S.; Cooks, R.G.; Ifa, D.R., Mass spectrometry imaging under
ambient conditions. Mass Spectrom. Rev. 2012,
4. Becker, J.S., Imaging of metals in biological tissue by laser ablation inductively coupled
plasma mass spectrometry (LA-ICP-MS): state of the art and future developments. J. Mass
Spectrom. 2013, 48, 255-268.
5. Russo, R.E.; Mao, X.; Gonzalez, J.J.; Zorba, V.; Yoo, J., Laser Ablation in Analytical
Chemistry. Anal. Chem. 2013, 85, 6162-6177.
6. Russo, R.E.; Bol'shakov, A.A.; Mao, X.; McKay, C.P.; Perry, D.L.; Sorkhabi, O., Laser
Ablation Molecular Isotopic Spectrometry. Spectrochim. Acta B 2011, 66, 99-104.
7. Konz, I.; Fernández, B.; Fernández, M.L.; Pereiro, R.; Sanz-Medel, A., Laser ablation ICP-
MS for quantitative biomedical applications. Anal. Bioanal. Chem. 2012, 403, 2113-2125.
8. Laiko, V.; Baldwin, M.; Burlingame, A., Atmospheric pressure matrix-assisted laser
desorption/ionization mass spectrometry. Anal. Chem. 2000, 72, 652-657.
9. Shiea, J.; Huang, M.-Z.; Hsu, H.-J.; Lee, C.-Y.; Yuan, C.-H.; Beech, I.; Sunner, J.,
Electrospray-assisted laser desorption/ionization mass spectrometry for direct ambient
analysis of solids. Rapid Commun. Mass Spectrom.: RCM 2005, 19, 3701-3704.
10. Sampson, J.; Hawkridge, A.; Muddiman, D., Generation and detection of multiply-charged
peptides and proteins by matrix-assisted laser desorption electrospray ionization (MALDESI)
fourier transform ion cyclotron resonance mass spectrometry. J. Am. Soc. Mass Spectrom.
2006, 17, 1712-1716.
11. Brady, J.J.; Judge, E.J.; Levis, R.J., Mass spectrometry of intact neutral macromolecules
using intense non-resonant femtosecond laser vaporization with electrospray post-ionization.
Rapid Commun. Mass Spectrom. 2009, 23, 3151-3157.

72
12. Shelley, J.T.; Ray, S.J.; Hieftje, G.M., Laser Ablation Coupled to a Flowing Atmospheric
Pressure Afterglow for Ambient Mass Spectral Imaging. Anal. Chem. 2008, 80, 8308-8313.
13. Alvarez Ruiz, J.; Casu, A.; Coreno, M.; de Simone, M.; Hoyos Campo, L.M.; Juarez-Reyes,
A.M.; Kivimäki, A.; Orlando, S.; Sanz, M.; Spezzani, C., Synchrotron radiation
photoionization mass spectrometry of laser ablated species. Nucl. Instrum. Methods Phys. Res.
B 2010, 268, 425-429.
14. Huang, M.; Jhang, S.; Cheng, C.; Cheng, S.; Shiea, J., Effects of matrix, electrospray
solution, and laser light on the desorption and ionization mechanisms in electrospray-assisted
laser desorption ionization mass spectrometry. Analyst 2010, 135, 759-766.
15. Ovchinnikova, O.S.; Kertesz, V.; Van Berkel, G.J., Combining transmission geometry laser
ablation and a non‐contact continuous flow surface sampling probe/electrospray emitter for
mass spectrometry based chemical imaging. Rapid Commun. Mass Spectrom. 2011, 25, 3735-
3740.
16. Khumaeni, A.; Lie, Z.S.; Niki, H.; Kurniawan, K.H.; Tjoeng, E.; Lee, Y.I.; Kurihara, K.;
Deguchi, Y.; Kagawa, K., Direct analysis of powder samples using transversely excited
atmospheric CO2 laser-induced gas plasma at 1 atm. Anal. Bioanal. Chem. 2011, 400, 3279-
3287.
17. Heinrich, C.A.; Pettke, T.; Halter, W.E.; Aigner-Torres, M.; Audétat, A.; Gunther, D.;
Hattendorf, B.; Bleiner, D.; Guillong, M.; Horn, I., Quantitative multi-element analysis of
minerals, fluid and melt inclusions by laser-ablation inductively-coupled-plasma mass-
spectrometry. Geochim. Cosmochim. Acta 2003, 67, 3473-3497.
18. Murray, K.K.; Caprioli, R.M.; Gross, M. Infrared MALDI, 2006; Vol. 6.
19. Rezenom, Y.H.; Dong, J.; Murray, K.K., Infrared laser-assisted desorption electrospray
ionization mass spectrometry. Analyst 2008, 133, 226-232.
20. Nemes, P.; Vertes, A., Laser ablation electrospray ionization for atmospheric pressure, in
vivo, and imaging mass spectrometry. Anal. Chem. 2007, 79, 8098-8106.
21. Sampson, J.S.; Murray, K.K.; Muddiman, D.C., Intact and Top-Down Characterization of
Biomolecules and Direct Analysis Using Infrared Matrix-Assisted Laser Desorption
Electrospray Ionization Coupled to FT-ICR Mass Spectrometry. J Am Soc Mass Spectrom
2008,
22. Galhena, A.S.; Harris, G.A.; Nyadong, L.; Murray, K.K.; Fernandez, F.M., Small Molecule
Ambient Mass Spectrometry Imaging by Infrared Laser Ablation Metastable-Induced
Chemical Ionization. Anal. Chem. 2010, 82, 2178-2181.
23. Park, S.-G.; Murray, K.K., Infrared laser ablation sample transfer for MALDI and
electrospray. J. Am. Soc. Mass Spectrom. 2011, 22, 1352-1362.

73
24. Park, S.-G.; Murray, K.K., Infrared Laser Ablation Sample Transfer for MALDI Imaging.
Anal. Chem. 2012, 84 3240−3245.
25. Amoruso, S.; Bruzzese, R.; Spinelli, N.; Velotta, R., Characterization of laser-ablation
plasmas. J. Phy. B: Atomic, Molecular and Optical Physics 1999, 32, R131.
26. Apitz, I.; Vogel, A., Material ejection in nanosecond Er:YAG laser ablation of water, liver,
and skin. Appl. Phy. A 2005, 81, 329-338.
27. Rohlfing, A.; Leisner, A.; Hillenkamp, F.; Dreisewerd, K., Investigation of the Desorption
Process in UV Matrix-Assisted Laser Desorption/Ionization with a Liquid 3-Nitrobenzyl
Alcohol Matrix by Photoacoustic Analysis, Fast-Flash Imaging, and UV-Laser
Postionization†. J. Phys. Chem. C 2009, 114, 5367-5381.
28. Bubb, D.M.; Johnson, S.L.; Collins, B.; Haglund, J., Richard F, Thermal Confinement and
Temperature-Dependent Absorption in Resonant Infrared Ablation of Frozen Liquid Targets.
J. Phys. Chem. C 2010, 114, 5611-5616.
29. Fan, X.; Murray, K.K., Wavelength and time-resolved imaging of material ejection in
infrared matrix-assisted laser desorption. J. Phys. Chem. A 2010, 114, 1492-1497.
30. Russo, R.E.; Suen, T.W.; Bol'shakov, A.A.; Yoo, J.; Sorkhabi, O.; Mao, X.; Gonzalez, J.;
Oropeza, D.; Zorba, V., Laser plasma spectrochemistry. J. Anal. At. Spectrom. 2011, 26,
1596-1603.
31. Handschuh, M.; Nettesheim, S.; Zenobi, R., Laser-induced molecular desorption and particle
ejection from organic films. Appl. Surf. Sci. 1999, 137, 125-135.
32. Koch, J.; Günther, D., Review of the state-of-the-art of laser ablation inductively coupled
plasma mass spectrometry. Appl. Spectrosc. 2011, 65, 155-162.
33. Glaus, R.; Kaegi, R.; Krumeich, F.; Günther, D., Phenomenological studies on structure and
elemental composition of nanosecond and femtosecond laser-generated aerosols with
implications on laser ablation inductively coupled plasma mass spectrometry. Spectrochim.
Acta. B 2010, 65, 812-822.
34. Alves, S.; Kalberer, M.; Zenobi, R., Direct detection of particles formed by laser ablation of
matrices during matrix-assisted laser desorption/ionization. Rapid Commun. Mass Spectrom.
2003, 17, 2034-2038.
35. Jackson, S.N.; Mishra, S.; Murray, K.K., Characterization of Coarse Particles Formed by
Laser Ablation of MALDI Matrixes. J. Phys. Chem. B 2003, 107, 13106-13110.
36. Hergenröder, R., Hydrodynamic sputtering as a possible source for fractionation in LA-ICP-
MS. J. Anal. At. Spectrom. 2006,

74
37. Musapelo, T.; Murray, K.K., Particle Formation in Ambient MALDI Plumes. Anal. Chem.
2011, 83, 6601-6608.
38. Fan, X.; Little, M.; Murray, K.K., Infrared Laser Wavelength Dependence of Particles
Ablated from Glycerol. Appl. Surf. Sci. 2008, 255, 1699-1704.
39. Musapelo, T.; Murray, K.K., Particle Production in Reflection and Transmission Mode Laser
Ablation: Implications for Laserspray Ionization. J. Am. Soc. Mass Spectrom. 2013, 24, 1108-
1115.
40. Musapelo, T.; Murray, K.K., Size distributions of ambient shock-generated particles:
implications for inlet ionization. Rapid Commun. Mass Spectrom. 2013, 27, 1283-1286.
41. Overberg, A.; Karas, M.; Bahr, U.; Kaufmann, S.; Hillenkamp, F., Matrix-assisted Infrared-
laser (2.94 mm) Desorption/Ionization Mass Spectrometry of Large Biomolecules. Rapid
Commun. Mass Spectrom. 1990, 4, 293-296.
42. Overberg, A.; Karas, M.; Hillenkamp, F., Matrix-assisted Laser Desorption of Large
Biomolecules with a TEA-CO2-Laser. Rapid Commun. Mass Spectrom. 1991, 5, 128-131.
43. Trimpin, S.; Wang, B.; Inutan, E.D.; Li, J.; Lietz, C.B.; Harron, A.; Pagnotti, V.S.; Sardelis,
D.; McEwen, C.N., A mechanism for ionization of nonvolatile compounds in mass
spectrometry: considerations from MALDI and inlet ionization. J. Am. Soc. Mass Spectrom.
2012, 23, 1644-1660.
44. Huang, F.; Murray, K.K., Finite element simulation of infrared laser ablation for mass
spectrometry. Rapid Commun. Mass Spectrom. 2012, 26, 2145-2150.
45. Menzel, C.; Dreisewerd, K.; Berkenkamp, S.; Hillenkamp, F., Mechanisms of energy
deposition in infrared matrix-assisted laser desorption/ionization mass spectrometry. Int. J.
Mass Spectrom. 2001, 207, 73-96.
46. Cramer, R.; Haglund, J., Richard F; Hillenkamp, F., Matrix-assisted laser desorption and
ionization in the O-H and C=O absorption bands of aliphatic and aromatic matrices:
dependence on laser wavelength and temporal beam profile. Int. J. Mass Spectrom. Ion
Processes 1997, 169, 51-67.
47. Sheffer, J.; Murray, K.K., Infrared matrix-assisted laser desorption/ionization using OH, NH
and CH vibrational absorption. Rapid Commun. Mass Spectrom. 1998, 12, 1685-1690.
48. Johnson, S.; Schriver, K.; Haglund, J., Richard F; Bubb, D., Effects of the absorption
coefficient on resonant infrared laser ablation of poly (ethylene glycol). J. Appl. Phys. 2009,
105, 024901-024901-024906.
75
CHAPTER 5. PARTICLE PRODUCTION IN REFLECTION AND TRANSMISSION:
IMPLICATIONS FOR LASERSPRAY IOINIZATION
The final study of this thesis work used the combined APS/SMPS system to investigate the set
of ambient ionization method known as inlet ionization, specifically laserspray inlet ionization.1-2
This method uses a laser to ablate particles that enter the heated inlet of a mass spectrometer to
produce multiply charged ions. Laserspray typically uses transmission mode (back side) irradiation
and matrix compounds not typically used for MALDI. Because laserspray ionization is thought to
involve particles, the study of the particles ablated under laserspray conditions can offer some
insight into the ionization mechanism.
Particles were ablated from matrix thin films with a UV laser in reflection and transmission
geometries. Particle size distributions were measured with the combined APS/SMPS system that
measured particles in the size range from 10 nm to 20 μm. The matrix compounds investigated
were 2,5-dihydroxybenzoic acid (D B) α-cyano-4-hydroxycinnamic acid (CHCA), sinapic acid
(SA), 2,5-dihydroxy-acetophenone (DHAP), and 2-nitrophloroglucinol (NPG). Nanoparticles with
average diameters between 20 and 120 nm were observed in both transmission and reflection
geometry. The particle mass distribution was significantly different in reflection and transmission
geometry. In reflection geometry, approximately equal mass was distributed between particles in
the 20 to 450 nm range of diameters and particles in the 450 nm to 1.5 μm diameter range. In
transmission mode, the particle mass distribution was dominated by large particles in the 2 to 20
μm diameter range. blation the compounds with high efficiency for inlet ionization, DHAP and
The work reported in this chapter has been published in Journal of The American Society for
Mass Spectrometry. [Musapelo, T; Murray, K. K., Particle Production in Reflection and
Transmission Mode Laser Ablation: Implications for Laserspray Ionization , 2013]. Reprinted by
permission of the Springer.

76
NPG, produced particles that were 3 to 4 times smaller compared with the other matrices. The
results are consistent with ion formation by nanoparticle melting and breakup or melting and
breakup of the large particles through contact with heated inlet surfaces.
5.1 Introduction
The term laserspray has been used to describe the process in which laser desorption or
ablation produces highly charged macromolecular ions similar to those observed in electrospray
ionization.1-2
Although the defining feature of laserspray is the appearance of highly charged ions,
multiple charging can be achieved in a number of ways. What is now called laserspray initially
used a configuration similar to atmospheric pressure matrix assisted laser desorption ionization
(MALDI), and was reported as transmission mode MALDI.1 This initial configuration used
transmission mode irradiation in which the laser at high pulse energy irradiated the sample from
the back side rather than the more conventional reflection mode (front-side) irradiation. Also
notable is the lack of an electrical potential on the target. The temperature of the ion transfer tube
is also important and temperatures above 300°C are optimum for multiply charged ion production.3
In subsequent studies, it was found that high pulse energy transmission mode irradiation is not a
requirement for multiple charging.1 Irradiation at atmospheric pressure is also not a requirement
and multiple charging has been demonstrated with intermediate pressure (0.2 Torr) sources.4 High
vacuum ionization with multiply charged ions has been demonstrated with the matrix 2-
nitrophloroglucinol (NPG).5 Most interestingly, the laser itself is not required and particles
produced simply by forcefully striking the sample target also form highly charged ions in the mass
spectrometer inlet.3
Although rarely observed in MALDI with UV lasers, multiple charging is often seen with
infrared DI. With a 2.94 μm Er:Y laser up to 13 charges were observed with caffeic acid

77
and mouse IgG protein (ca. 150,000 Da).6 The propensity for multiple charging was found to be
higher for proteins greater than 30 kDa in mass. Other cinnamic acid derivative matrix compounds,
ferulic and sinapinic acid, were not found to produce multiple charging. Using a CO2 laser at 10.6
μm up to eight charges were observed with caffeic acid and mouse Ig protein.7
Figure 5-1. Schematic of inlet ionization a) laserspray ionization (LSI) and
b) matrix-assisted inlet ionization (MAII).
With matrixes other than caffeic acid, three to four charges were observed. Multiple
charging with up to six charges in positive ion mode for the protein BSA was found with a 6 ns
pulse width IR OPO and a glycerol matrix but not with an Er:YAG laser at 100 ns or 185 ns pulse
width.8 In atmospheric pressure IR MALDI, up to 10 charges were observed for cytochrome c
protein and up to 13 charges on myoglobin using a 2.94 μm laser and glycerol matrix. ll of the IR
MALDI studies were performed in reflection mode. The mechanism proposed for ion formation in
laserspray involves the production of highly charged particles that are desolvated in the heated
transfer tube of the mass spectrometer.9 In this model, the laser melts and ablates the matrix and
produces liquid droplets that contain matrix and analyte.

78
The mechanism for multiple charging is not clear, but may be non-statistical charging that
has been observed for sprayed droplets.10
The highly charged droplets are further heated in the ion
transfer tube to evaporate the matrix “solvent” and multiply charged analyte ions are liberated
from the particles as in the final stages of electrospray ion formation. Regardless of the specific
details of the ionization mechanism, it appears that the formation of particles by laser ablation is an
important component of the laserspray ionization process.
In this work, the APS/SMPS particle measurement approach was applied to laser ablation
under conditions comparable to laserspray ionization. Thin films of common crystalline MALDI
and inlet ionization matrix materials were irradiated at atmospheric pressure with a pulsed 337 nm
nitrogen laser in transmission and reflection mode. The particles were counted and sized using a
SMPS sizing instrument in tandem with an APS instrument. Particle size and concentration in the
range between 10 nm and 20 μm were measured.
5.2 Experimental
The particle ablation and sizing system used in this work was described in Chapter 2. The
sample target was a borosilicate glass microscope slide that was mounted at the center of the
chamber so that the sample could be irradiated at normal incidence from the front (reflection mode)
or from the back (transmission mode). The laser fluence was between 1400 and 2300 J/m2 at a
repetition rate of 2 Hz. Samples consisted of a thin film of the matrix on the microscope slide. Thin
films of matrixes were prepared by depositing a 50 μ volume on the sample target and allowing it
to air dry. The resulting spots were estimated to be 10 μm based on the solution concentration and
spot diameter. Particle size measurements were initiated after 10 s of irradiation, to assure that a
steady state of particle production and data acquired for 180 s (360 laser shots) for both reflection
and transmission mode irradiation. The matrix compounds studied were 2,5-dihydroxybenzoic acid

79
(DHB), sinapic acid (SA) α-cyano-hydroxycinnamic acid (CHCA), 2,5-dihydroxyacetophenone
(DHAP), and 2-nitrophloroglucinol (NPG; The matrix solution concentrations were 40 mg/mL).
The DHB and SA matrixes were dissolved in methanol; CHCA was dissolved in a 7:3 (vol/vol)
mixture of acetonitrile and 0.1 % aqueous trifluoroacetic acid and the DHAP and NPG solutions
were dissolved in 1:1 (vol/vol) and 0.1 % acetonitrile aqueous TFA.
5.3 Results
Particle size measurements were performed under UV MALDI conditions in reflection
mode using a metal target with DHB, CHCA, and SA in Chapter 3, but not with LSI matrices
DHAP or NPG.11
The DHAP and NPG matrices were added because they have been found to be
exceptionally good for inlet ionization.12
Of the other matrices, DHB has good performance for
inlet ionization and the matrices CHCA and SA perform less efficiently.
Particle number concentration plots for the matrixes, DHB, CHCA, SA, DHAP, and NPG
ablated in reflection mode are shown in Figure 5-2. The laser fluence was 1400, 1700, 2000, and
2300 J/m2. As the laser fluence increases, the particle concentration as well as the average particle
diameter increases. In all cases, the lowest laser fluence corresponds to the lowest particle
concentration and the highest fluence corresponds to the highest particle concentration trace. The
DHB, CHCA, and SA reflection mode are similar to those reported previously with a metal target11
and are included for comparison with reflection mode DHAP and NPG. The particle diameter
increases between 15 and 70 % from the lowest to highest fluence. The average particle diameter
and total particle concentration is indicated in Table 5-1 for the different matrix and laser fluence
combinations. The largest average particle diameter was observed for SA, which was more than
twice as large as for DHAP and NPG, which had the smallest diameters that were observed. The
total particle concentration increases with laser fluence as indicated in Table 5-1. The largest

80
concentration of particles was produced with NPG matrix, which produced roughly double the
particle concentration of the other matrices. Transmission mode particle number concentration
plots for DHB, CHCA, SA, DHAP, and NPG are shown in Figure 5-3 and the average particle
diameter and total particle concentration are indicated in Table 5-1. The particle diameter and the
particle concentration both increase with increasing laser fluence. The total particle concentration
is lower in transmission mode than in reflection mode for all of the matrices and all pulse energies
by a factor of two to three. For DHB, CHCA, and SA, the particle diameter is slightly smaller in
transmission mode: roughly two-thirds as large as the comparable reflection mode configuration.
For DHAP, the particle diameter in reflection and transmission mode is similar. NPG had the
smallest particle diameter in transmission mode, which was less than half as large as that observed
in reflection mode.
Particle mass concentration was recorded for reflection and transmission mode irradiation
for each matrix. In these plots, the total mass of particulate material is plotted as a function of
particle diameter, which gives an indication of the distribution of ejected mass as a function of
particle diameter. The mass concentration for reflection mode is plotted in Figure 5-3 for matrixes,
DHB, CHCA, SA, DHAP, and NPG ablated at fluences of 1400, 1700, 2000, and 2300 J/m2
(identical conditions to those used for data shown in Figure 5-2). As reported previously,11
two
maxima are observed in the mass concentration plot: smaller particles with diameters in the 100
nm range and larger particles with diameters in the 800 nm range. The small particles represent
two to three times as much mass as the large particles. As indicated in Table 5-1, the mass-
weighted average diameter of the small particles ranges from 200 to 300 nm with the exception of
DHAP with average diameter less than 100 nm. DHAP is unique in that there appears to be a third
maximum in the size distribution near 400 nm at higher laser fluences.

81
Figure 5-2. Reflection mode particle size distribution measured in particle count at different laser
fluences increasing from 1400 (black), 1700 (green), 2000 (red), and 2300 J/m2 (blue) for matrices:
(a) DHB, (b) CHCA, (c) SA, (d) DHAP, and (e) NPG

82
Table 5-1. Particle size and concentration values for matrixes DHB, CHCA, SA, DHAP, and NPG.
The mass-weighted average diameter of the large particles ranges from 700 to 900 nm with the
exception of NPG, which has a broad distribution of particle sizes that leads to a larger average
diameter. The mass concentration for transmission mode ablation is shown in Figure 5-4 for
matrixes, DHB, CHCA, SA, DHAP, and NPG at fluences of 1400, 1700, 2000, and 2300 J/m2 that
were identical to those above (the conditions were the same as those used to obtain Figure 5-2).
More than 1000 times more mass is ejected as particles greater than 450 nm in diameter compared
to the mass ejected as particles with diameters less than 450 nm and the mass weighted particle
diameter for the transmission mode ablated particles is larger than those observed in reflection
mode ablation. The results are indicated in Table 5-1; the mass-weighted particle diameters were
Matrix Laser fluence
Average Diameter(nm)
Total Concentration (/cm
3)
Mass Average diameter (reflection)
Mass total concentration (μg/m³) Reflect.
Mass Average diameter (μm)
J/m2 Reflect. Transm
. Reflect. Transm. <450 nm > 450 nm <450 >450 Transm. Reflect.
DHB 1400 85 68 48560 16110 245 835 850 420 12 750
1700 93 78 85440 25950 230 835 1050 580 13 1040
2000 95 77 100810 39160 245 835 2060 660 14 2600
2300 98 96 138260 52160 215 770 2720 940 16 3800
CHCA 1400 68 64 24050 9440 170 675 270 50 13 3900
1700 74 67 51980 18360 185 720 450 110 13 6510
2000 81 69 82720 40210 200 670 520 320 14 10340
2300 94 72 97920 66130 265 725 1040 380 16 12200
SA 1400 101 63 38140 27070 200 770 1060 410 12 2660
1700 116 72 46220 40110 245 900 2100 750 13 4020
2000 117 81 79420 43630 245 835 2600 880 15 6200
2300 124 84 96170 51910 265 900 4300 1260 16 7900
DHAP 1400 28 24 65000 17000 65 720 900 630 12 2500
1700 33 28 101000 29000 70 770 1100 750 13 3100
2000 41 36 114000 38000 85 835 1500 870 13 4300
2300 47 42 125000 43000 90 940 1700 1030 14 5600
NPG 1400 32 14 110000 14000 150 970 530 330 16 2600
1700 38 16 142000 32000 170 1040 950 450 16 2900
2000 45 19 189000 48000 180 1040 1540 590 16 4700
2300 47 24 234000 57000 200 1180 2080 900 18 6100

83
Figure 5-3. Transmission mode particle size distribution measured in particle count at different
laser fluences increasing from 1400 (black), 1700 (green), 2000 (red,) and 2300 J/m2 (blue) for
matrices: (a) DHB, (b) CHCA, (c) SA, (d) DHAP, and (e) NPG.

84
greater than 10 μm for all matrices and the average diameters are approximately 10 times larger for
transmission mode ablation compared to reflection mode ablation. The mass weighted total
concentration is larger in transmission mode for all matrices with the exception of DHB, for which
the two modes yield results of comparable magnitude. The main difference between the
distribution of particle sizes in reflection and transmission mode is the significantly greater size of
the particles produced in transmission mode compared to those produced in reflection mode. The
quantity of material ejected is similar, but the size of the particles ejected in transmission mode is
approximately ten times larger. The size distribution of particles less than 500 nm in diameter is
not significantly different between reflection and transmission ablation. The reason for the
difference in coarse particle size may be related to differences in large particles ejected in backside
compared with front-side ablation.
With pulsed ns lasers, there are two distinct mechanisms for material removal: desorption
and ablation.13
At lower fluences, the laser heats the surface relatively slowly, which results in
desorption of free molecules. At higher fluences, ablation of clusters and particles occur in part due
to explosive boiling (phase explosion) of the superheated material.14-17
If the sample is heated
rapidly to approximately 90 % of the critical temperature, the superheated material can undergo an
explosive phase transition that results in volume ejection of the upper layers of the sample. There
is a second distinction that involves the speed at which energy is added to a sample compared with
the speed at which it can be removed. Thermal confinement is achieved when heat is added to the
system faster than it is removed by thermal diffusion.18
This occurs under the laser desorption
conditions used for MALDI with UV lasers.19
Stress confinement occurs when the laser adds
energy to the system faster than it can be removed through pressure waves and is limited by the
speed of sound in the material.18

85
Figure 5-4. Reflection mode mass weighted particle size distribution for (a) DHB, (b) CHCA, (c)
SA, (d) DHAP, and (e) NPG at laser fluences 1400 (black), 1700 (green), 2000 (red), and 2300
J/m2 (blue).

86
Figure 5-5. Transmission mode mass weighted particle size distribution for (a) DHB, (b) CHCA, (c)
SA, (d) DHAP, and (e) NPG at laser fluences 1400 (black), 1700 (green), 2000 (red), and 2300
J/m2 (blue).

87
Typical vacuum MALDI conditions are not in the stress confinement regime; however, higher
laser energies may be sufficient to enter that regime. Explosive boiling can occur under both
thermal and stress confinement conditions, but stress confinement tends to produce larger
particles.18, 20
Material removal proceeds differently in front and back side irradiation. In reflection mode
the surface material absorbs the radiation and material is removed from the top layers. In the stress
confinement regime, the shock wave can propagate through the material and reflect back to the
surface causing spallation.21
In transmission mode, the material absorbing the laser radiation is at
the bottom of the thin film at the target surface. However, if the lower layers of the sample are
heated to the point of vaporization, the gas bubbles from the vaporized sample can form a layer
between the substrate and sample.22
uch a “boiling crisis” (film boiling) phenomenon has been
suggested as a means of material ejection in pulsed laser ablation.23
Large particles may be ejected
from the upper layers without significant heating by the laser. The need to remove the upper matrix
layer may be related to the higher energy required for transmission mode AP-MALDI compared to
reflection mode.24
The difference between reflection and transmission mode for particles below 450 nm in
diameter is not great; however, there is a difference between the matrices that function well for
inlet ionization (DHAP and NPG) and those that do not function as well (DHB, CHCA, and SA).
The particles produced from ablation of DHAP and NPG have average diameters less than 50 nm
both in reflection and transmission mode, whereas the DHB, CHCA, and SA matrices have
average diameters ranging from 70 to 125 nm in reflection mode and between 60 and 100 nm in
transmission mode. The smallest particles, with average diameters less than 25 nm, are produced
from NPG in transmission mode ablation. It has been suggested that ion formation in laserspray

88
occurs through matrix melting and charge segregation during droplet breakup to form highly
charged clusters and nanoparticles.25
Highly charged ions are then formed through the evaporation
of matrix molecules in a manner similar to electrospray. This idea is supported by measurements
of laser ablated fluorescent dyes mixed with matrix molecules.26
It was found that the laser ablated
dye molecules were in clusters or particles and no free dye molecules were detected. The fact that
the efficient laserspray matrix compounds DHAP and NPG produce smaller particles on ablation is
also consistent with this mechanism. The smaller particles will require less time for melting and
this is consistent with more efficient ion formation. It should be noted that the particle sizing
system used in this work does not detect small molecular clusters: a 10 nm matrix particle contains
a few thousand molecules and particles this size and smaller are not detected by the scanning
mobility particle sizer.
In addition to small particle charging, it may be possible to create highly charged clusters
and nanoparticles by the melting and breakup of large particles on contact with the heated ion
source inlet. Particles striking the walls of the capillary inlet will be heated rapidly and smaller
particles sheared from the surface could gain charge through a triboelectric mechanism25
and
produce highly charged ions by matrix evaporation.
When two material surfaces are contacted or slide against each and are separated, electrical
charge can be transferred leaving the surfaces charged. This charge transfer process is termed
either ‘contact electrification’ or triboelectric charging effect.27
Different mechanisms for
triboelectric charging have been proposed to address some questions on why rubbing two surfaces
enhances charge transfer or whether the frictional energy plays a role in charge transfer. 28-29
In addition, it has also been demonstrated that sliding velocity does not have any significant
influence on charge transfer despite the fact that sliding velocity influences frictional heating. In

89
the same study, it was proposed that that triboelectric charging is induced by frictional energy
dissipation that creates electron-hole pairs which then tunnel across the gap and that charge
fluctuations are induced by local transient changes in the electric field between two shearing
surfaces.29
The shearing surface leads to the molecular-level roughness and local dielectric
constant variations. No charge transfer was observed between two symmetric surfaces sheared
against each other. Particle triboelectric charging can take place either between particles or
between a particle and another object.27
The mechanical nature of the interaction between a
particle and a solid surface strongly influences the exchange of charge. For instance, triboelectric
charging tends to increase with the interaction energy, and sliding contact tends to transfer more
charge than simple normal contact.30
Two identical particles can also go through triboelectric
charging by experiencing different degree of friction.
Without such a surface interaction, it is not likely that the material ablated as large particles
will result in the production of ions.
5.4 Conclusions
Particle size distributions were measured for material ablated from crystalline thin films of
matrix compounds used for matrix-assisted ionization. Similar to previous studies of MALDI
matrix compounds,11
reflection mode ablation results in a bimodal distribution of particle sizes
with small particles averaging between 30 and 120 nm in diameter and an approximately equal
mass ejected as large particles approximately 1 μm in diameter. Transmission mode ablation also
results in a bimodal distribution, but most of the mass is removed as large particles greater than 10
μm in diameter. The other notable observation is that the matrix compounds that give the best
performance for inlet ionization, DHAP and NPG, produce the smallest particles both in reflection

90
and transmission mode. This is particularly notable for NPG in transmission mode where average
particle sizes near 20 nm in diameter were recorded.
The observed particle size distributions can be interpreted in the context of proposed
mechanisms for inlet ionization.25
Ion formation is believed to proceed through the evaporation of
matrix from highly charged small particles and clusters in a manner similar to electrospray except
that the “solvent” is the matrix itself. It has been suggested that non-statistical process during the
aerodynamic breakup of melted matrix particles could lead to the highly charged particles and
clusters. This hypothesis is consistent with the relatively small size of the particles ablated from
the efficient inlet ionization matrices DHAP and NPG. The smaller particles will melt more rapidly
and could more quickly fracture, forming small highly charged particles.
The large particles may also play a role in ion formation by striking the heated ion source
inlet, which could produce highly charged particles through a triboelectric effect or the molten
droplets could achieve a high charge through the aerodynamic breakup mechanism. Additional
studies will be necessary to determine whether nanoparticles, coarse particles, or both are
responsible for inlet ion formation. One potentially useful avenue is computer simulation. For
example, it should be possible to model droplet heating and breakup using finite element computer
simulations31-33
and assess the likelihood of an aerodynamic breakup charging mechanism.
Another approach is size selection of particles after their formation but before they enter the ion
source inlet, which could reveal the relationship between particle size and ionization efficiency.
5.5 References
1. Trimpin, S.; Inutant, E. D.; Herath, T. N.; McEwen, N. C., Matrix-Assisted Laser
Desorption/Ionization Mass Spectrometry Method for Selectively Producing Either Singly or
Multiply Charged Molecular Ions. Anal. Chem 2010, 82 (1), 11-15.
2. Trimpin, S.; Inutan, E. D.; Herath, T. N.; McEwen, C. N., Laserspray ionization, a new
atmospheric pressure MALDI method for producing highly charged gas-phase ions of peptides
and proteins directly from solid solutions. Mol. Cell. Prot 2010, 9 (2), 362-367.

91
3. Trimpin, S.; Inutant, E. D.; Herath, T. N.; McEwen, N. C., Laserspray Ionization, a new
atmospheric pressure MALDI method for producing highly charged gas-phase ions of peptides
and proteins directly from solid solutions. Mol.Cell.Prot 2010, 9, 362-367.
4. Inutan, E. D.; Wang, B.; Trimpin, S., Commercial intermediate pressure MALDI ion mobility
spectrometry mass spectrometer capable of producing highly charged laserspray ionization ions.
Anal. Chem 2011, 83 (3), 678-684.
5. Trimpin, S.; Ren, Y.; Wang, B.; Lietz, C. B.; Richards, A. L.; Marshall, D. D.; Inutan, E. D.,
Extending the laserspray ionization concept to produce highly charged ions at high vacuum on a
time-of-flight mass analyzer. Anal. Chem 2011, 83 (14), 5469-5475.
6. Overberg, A.; Karas, M.; Bahr, U.; Kaufmann, R.; Hillenkamp, F., Matrix‐assisted infrared‐laser
(2.94 μm) desorption/ionization mass spectrometry of large biomolecules. Rapid Commun.
Mass Spectrom. 1990, 4 (8), 293-296.
7. Overberg, A.; Karas, M.; Hillenkamp, F.; Cotter, R., Matrix‐assisted laser desorption of large
biomolecules with a TEA‐CO2‐laser. Rapid Commun. Mass Spectrom. 1991, 5 (3), 128-131.
8. Menzel, C.; Dreisewerd, K.; Berkenkamp, S.; Hillenkamp, F., The role of the laser pulse
duration in infrared matrix-assisted laser desorption/ionization mass spectrometry. J. Am. Soc.
Mass Spectrom. 2002, 13 (8), 975-984.
9. McEwen, C. N.; Trimpin, S., An alternative ionization paradigm for atmospheric pressure mass
spectrometry: flying elephants from Trojan horses. Int. J. Mass Spectrom. ion processes 2011,
300 (2), 167-172.
10. Zilch, L. W.; Maze, J. T.; Smith, J. W.; Ewing, G. E.; Jarrold, M. F., Charge separation in the
aerodynamic breakup of micrometer-sized water droplets. J. Phys. Chem. A 2008, 112 (51),
13352-13363.
11. Musapelo, T.; Murray, K. K., Particle formation in ambient MALDI plumes. Anal. Chem 2011,
83 (17), 6601-6608.
12. Li, J.; Inutan, E. D.; Wang, B.; Lietz, C. B.; Green, D. R.; Manly, C. D.; Richards, A. L.;
Marshall, D. D.; Lingenfelter, S.; Ren, Y.; Trimpin, S., Matrix assisted ionization: new aromatic
and nonaromatic matrix compounds producing multiply charged lipid, peptide, and protein ions
in the positive and negative mode observed directly from surfaces. J. Am. Soc. Mass Spectrom.
2012, 23 (10), 1625-1643.
13. Zhigilei, L. V.; Yingling, Y. G.; Itina, T. E.; Schoolcraft, T. A.; Garrison, B. J., Molecular
dynamics simulations of matrix-assisted laser desorption—connections to experiment. Int. J.
Mass Spectrom. ion processes 2003, 226 (1), 85-106.
14. Miotello, A.; Kelly, R., Laser-induced phase explosion: new physical problems when a
condensed phase approaches the thermodynamic critical temperature. Appl. Phys. A 1999, 69
(1), S67-S73.

92
15. Apitz, I.; Vogel, A., Material ejection in nanosecond Er: YAG laser ablation of water, liver,
and skin. Appl. Phys. A 2005, 81 (2), 329-338.
16. Vogel, A.; Venugopalan, V., Mechanisms of pulsed laser ablation of biological tissues. Chem.
Rev 2003, 103 (2), 577-644.
17. Zhigilei, L. a. G. B. J., Microscopic mechanisms of laser ablation of organic solids in the
thermal and stress confinement irradiatiion regimes J.Appl. Phys. 2000, 88 (3), 1281-1298.
18. Zhigilei, L. V.; Garrison, B. J., Microscopic mechanisms of laser ablation of organic solids in
the thermal and stress confinement irradiation regimes. J. Appl. Phys. 2000, 88 (3), 1281-1298.
19. Knochenmuss, R.; Zhigilei, L. V., Molecular dynamics model of ultraviolet matrix-assisted
laser desorption/ionization including ionization processes. J. Phys. Chem. B 2005, 109 (48),
22947-22957.
20. Leisner, A.; Rohlfing, A.; Röhling, U.; Dreisewerd, K.; Hillenkamp, F., Time-resolved
imaging of the plume dynamics in infrared matrix-assisted laser desorption/ionization with a
glycerol matrix. J. Phys. Chem. B 2005, 109 (23), 11661-11666.
21. Zhigilei, L. V.; Ivanov, D. S.; Leveugle, E.; Sadigh, B.; Bringa, E. M. In Computer modeling of
laser melting and spallation of metal targets, Proc. SPIE., International Society for Optics and
Photonics: 2004; pp 505-519.
22. Nikolayev, V. S.; Beysens, D. A., Boiling crisis and non-equilibrium drying transition.
Europhys. Lett. 1999, 47 (3), 345.
23. Bulgakova, N. M.; Bulgakov, A. V., Pulsed laser ablation of solids: transition from normal
vaporization to phase explosion. Appl. Phys. A 2001, 73 (2), 199-208.
24. Galicia, M. C.; Vertes, A.; Callahan, J. H., Atmospheric Pressure Matrix-Assisted Laser
Desorption/Ionization in Transmission Geometry. Anal. Chem 2002, 74 (8), 1891-1895.
25. Trimpin, S.; Wang, B.; Inutan, E. D.; Li, J.; Lietz, C. B.; Harron, A.; Pagnotti, V. S.; Sardelis,
D.; McEwen, C. N., A mechanism for ionization of nonvolatile compounds in mass
spectrometry: considerations from MALDI and inlet ionization. J. Am. Soc. Mass. Spectrom.
2012, 23 (10), 1644-1660.
26. Frankevich, V.; Nieckarz, R. J.; Sagulenko, P. N.; Barylyuk, K.; Zenobi, R.; Levitsky, L. I.;
Agapov, A. Y.; Perlova, T. Y.; Gorshkov, M. V.; Tarasova, I. A., Probing the mechanisms of
ambient ionization by laser-induced fluorescence spectroscopy. Rapid Commun. Mass Spectrom.
2012, 26 (13), 1567-1572.
27. Sow, M.; Lacks, D. J.; Sankaran, R. M., Effects of material strain on triboelectric charging:
Influence of material properties. J. Electostat 2012.
28. Owe Berg, T. The Mechanism of the Tribo Effect; DTIC Document: 1961.

93
29. Akbulut, M.; Godfrey Alig, A. R.; Israelachvili, J., Triboelectrification between smooth metal
surfaces coated with self-assembled monolayers (SAMs). J. Phys. Chem. B 2006, 110 (44),
22271-22278.
30. Dickinson, J.; Scudiero, L.; Yasuda, K.; Kim, M.-W.; Langford, S., Dynamic tribological
probes: particle emission andtransient electrical measurements. Tribo. Lett. 1997, 3 (1), 53-67.
31. Huang, F.; Murray, K. K., Finite element simulation of infrared laser ablation for mass
spectrometry. Rapid Commun. Mass Spectrom. 2012, 26 (18), 2145-2150.
32. Costa, A. B.; Graham Cooks, R., Simulated splashes: Elucidating the mechanism of desorption
electrospray ionization mass spectrometry. Chem. Phys. Lett. 2008, 464 (1), 1-8.
33. Costa, A. B.; Cooks, R. G., Simulation of atmospheric transport and droplet-thin film collisions
in desorption electrospray ionization. Chem. Commun. 2007, (38), 3915-3917.

94
CHAPTER 6. SIZE DISTRIBUTIONS OF AMBIENT SHOCK-GENERATED
PARTICLES
6.1 Introduction
Inlet ionization can be accomplished without a laser in a process called matrix-assisted inlet
ionization. 1 The mechanism proposed for MAII involves the production of particles through the
shock of a force striking the solid matrix and analyte sample that is deposited on a target. These
particles produce ions by heating and evaporation in the transfer region between atmospheric
pressure and the vacuum of the mass spectrometer. The transfer tube is typically heated to more
than 300 0C, sufficient to melt and evaporate the matrix, and leave the multiply charged ion. The
mechanism of particle charging is not known but is likely to be non-statistical given the large
number of charges observed.2 It has been suggested that matrix melting and shearing in the inlet
gas flow or on contact with the heated inlet surface could result in particle charging.1
A common component of proposed mechanisms is the presence of particles, which must be
dislodged from the surface, become highly charged, and eject highly charged analyte ions. Particle
size measurement has been used to aid in the understanding of ambient ionization, for example,
laser desorption3 and desorption electrospray ionization (DESI).
4 A phase Doppler anemometer
was used to measure the size and velocity impinging on and exiting the surface in DESI
experiments.
To measure laser-ablated particles in this study, the combined APS/SMPS system
described in Chapter 2 was used. When combined, these instruments can measure particle size and
The work reported in this chapter has been published in Rapid Communications in Mass
Spectrometry. [Musapelo, T; Murray, K. K., Size distributions of ambient shock-generated particles:
implications for inlet ionization , 2013]. Reprinted by permission of the John Wiley and Sons.

95
concentration in the size range between 10 nm and 20 µm.3 In this chapter, the SMPS/APS particle
measurement system was used to measure the size distribution of particles produced under
conditions of matrix-assisted inlet ionization. A simple spring impact device was used to strike
solid matrix and analyte samples deposited on a metal target. The resulting particles were counted
and sized using the SMPS sizing instrument in tandem with the APS instrument. The size and
concentration of particles in the range between 10 nm and 20 µm were measured.
6.2 Experimental
Particles were produced using a striker constructed from a traditional spring-operated
mousetrap (Victor M040, Woodstream, Lititz, PA, USA); a 19 mm diameter brass ball was
attached to the trap hammer for added weight. The target was constructed from 0.5 mm thick
stainless steel and was mounted perpendicular to the platform at the midpoint above the spring.
The hammer was operated by hand and was used to strike the target 10 times for each sizing
measurement. Thin films of matrix were formed by depositing a matrix solution onto the target. A
200 µL volume of matrix solution was deposited on the target and allowed to air dry. Spray
deposition was accomplished using a saturated matrix solution nebulized using a thin layer
chromatography sprayer. Three coats of matrix was applied for 5 s per coat and dried between
coats. Particle size measurements were initiated after one or two strikes to assure that a steady state
of particle production, and data were acquired for 180 s.
The compounds were 2,5-dihydroxybenzoic acid (DHB), 4-nitroaniline (NA), sinapinic
acid (SA), 2,5-dihydroxyacetophenone (DHAP), and 2-nitrophloroglucinol (NPG). Of these, DHB
is a good MAII matrix, NA and SA are functional but less efficient, and DHAP and NPG perform
exceptionally well for inlet ionization.5 The DHB, NA, SA, DHAP and NPG were used as received
without further purification. The matrix solution concentrations were 40 mg/mL. The DHB and SA

96
matrixes were dissolved in methanol; CHCA, DHAP, and NPG were dissolved in a 1:1 (v/v)
mixture of acetonitrile and 0.1% aqueous trifluoroacetic acid.
6.3 Results
Particle size distributions were measured for the five matrix compounds, DHB, NA, SA,
DHAP, and NPG, using the mousetrap striker system. Plots for the five matrix compounds are
shown in Fig. 6-1 and the total concentration is given in Table 6-1.
Table 6-1. Concentration and average diameter of shock-generated particles
Matrix Number
Concentration( /cm3)
Mass Concentration
(µg/m3)
Average
Diameter (nm)
Mass-weighted Average
Diameter (µm)
DHB 34000 400 20 15
NA 11000 7200 18 11
SA 21000 9000 15 10
DHAP 31000 4800 14 12
NPG 37000 3500 13 12
The maximum particle count is near 20 nm diameter for all matrices. The number of
particles with diameters greater than 100 nm is relatively low. The NA matrix has a small but
noticeable quantity of particles with diameters greater than 200 nm whereas the other matrices
have almost no particulate with diameters in that size range. From Table 6-1, the average particle
diameter is similar for all the matrices and is in the range of 13–20 nm. The total number
concentration is between 11,000 and 37,000/cm3.
Plots of the mass concentration for the four matrices are shown in Fig. 6-2. When weighted
for mass, which is proportional to the cube of the particle diameter, it can be seen that the
particulate mass is predominantly in the micrometer size range: most of the mass is contained in

97
Figure 6-1. Particle number concentration as a function of size for impact-formed particles from
MALDI matrices: (a) DHB, (b) NA, (c) SA, (d) DHAP, and (e) NPG.

98
Figure 6-2. Particle mass concentration as a function of size for impact-formed particles from
MALDI matrices: (a) DHB, (b) NA, (c) SA, (d) DHAP, and (e) NPG.

99
particles greater than 1 µm diameter. The average particle diameter weighted for mass is in the 10–
15 µm range (Table 6-1). The total mass-weighted concentration is between 4 and 9 mg/cm3.
Particle size measurements were made using spray deposited samples with the expectation
that the sample deposition method would have a strong effect on the size of the particles produced.
Counter to our hypothesis, the number concentration and mass concentration data were similar to
those obtained from dried droplet sample preparations: number concentration maxima were at
approximately 20 nm diameter and mass concentration maxima were at approximately 10 µm
diameter. This suggests that the crystallization method is not important to the distribution of
particle sizes.
The particle size distributions measured under MAII conditions differed significantly from
those obtained previously under conditions of atmospheric pressure MALDI using reflection mode
(front-side) irradiation.3 The nanometer-size particles are smaller in MAII than in MALDI:
approximately 20 nm for MAII in comparison with more than 100 nm for MALDI. Under MAII
conditions, most of the mass comes from particles greater than 500 nm in diameter whereas, in
MALDI, the mass of particles less than 500 nm is similar to the mass of particles greater than 500
nm. The mean mass-weighted diameter under MAII conditions is around 10 µm compared with a
mean mass-weighted diameter under MALDI conditions of near 1 µm.
The bimodal distribution of particle sizes can be considered in the context of the ion
formation mechanism. It has been suggested that ion formation in inlet ionization proceeds through
the non-statistical formation of highly charged clusters and nanoparticles formed by striking the
target (or by laser ablation in laserspray ionization).2 This mechanism suggests that the small 10
nm particles are responsible for the MAII ion signal, acquiring charge through melting and break
up or through interaction with the heated inlet. At the Rayleigh limit, a 10 nm water droplet can

100
sustain as many as 100 charges6 and an initially solid matrix particle could possibly support more.
If the nanometer-sized particles are responsible for ion formation in MAII, this suggests that
significant improvement in efficiency can be realized through the conversion of the much larger
quantity of material in large particles into nanoparticles. Indeed, the good performing MAII matrix
materials, DHB, DHAP, and NPG, produced the largest number of these nanoparticles.
An alternative possibility is the formation of ions through the large particles coming into
contact with the heated surface of the ion inlet. Multiple charging of particles is more efficient for
larger diameters7 and large particles may be formed with a high number of charges by triboelectric
processes or gain charge by striking the heated inlet surface.8 It is possible that the formation of
highly charged ions is due to the larger particles observed under MAII conditions: these particles
have the capacity to carry a larger charge and could produce highly charged ions either by
evaporation or by interaction with the heated inlet tube of the ion source. The contribution of the
large and small particles to the formation of ions in MAII can be tested by measuring particle
charge along with particle size and by inspecting the particle morphology. Particle collection using
opposite polarity electrodes and enumeration by electron microscopy have been used to determine
the charge on ejected material.9 Inspection of size and morphology of ejected material can be used
to infer melting.10
It may also be possible to size select particles prior to their entry into a heated
mass spectrometer inlet and measure the ion signal as a function of particle size.
6.4 Conclusions
In summary, a modified mousetrap was used to strike a metal target with a thin film of
dried crystalline matrix: DHB, NA, SA, DHAP, or NPG. The ejected material was sampled and
sized in the size range from 10 nm to 20 µm. Particle number concentrations of 11 000 to 37 000/
cm3 and mass concentration of between 4 and 7 mg/cm
3 were observed and a bimodal distribution

101
of particle sizes was found. A large number of particles with diameters near 20 nm were measured;
the largest fraction of mass was ejected as large particles with mean diameters near 10 µm. The
particle size results suggest that ion formation in MAII occurs through melting and evaporation of
highly charged ions from the small particles or through a secondary process in which the large
particles strike a heated surfaces to produce small highly charged particles, or through a
combination of large and small particle processes.
6.5 References
1. McEwen, C. N.; Pagnotti, V. S.; Inutan, E. D.; Trimpin, S., New paradigm in ionization:
multiply charged ion formation from a solid matrix without a laser or voltage. Anal. Chem 2010,
82 (22), 9164-9168.
2. Trimpin, S.; Wang, B.; Inutan, E. D.; Li, J.; Lietz, C. B.; Harron, A.; Pagnotti, V. S.; Sardelis, D.;
McEwen, C. N., A mechanism for ionization of nonvolatile compounds in mass spectrometry:
considerations from MALDI and inlet ionization. J. Am. Soc. Mass. Spectrom. 2012, 23 (10),
1644-1660.
3. Musapelo, T.; Murray, K. K., Particle formation in ambient MALDI plumes. Anal. Chem 2011,
83 (17), 6601-6608.
4. Venter, A.; Sojka, P. E.; Cooks, R. G., Droplet dynamics and ionization mechanisms in
desorption electrospray ionization mass spectrometry. Anal. Chem 2006, 78 (24), 8549-8555.
5. Li, J.; Inutan, E. D.; Wang, B.; Lietz, C. B.; Green, D. R.; Manly, C. D.; Richards, A. L.;
Marshall, D. D.; Lingenfelter, S.; Ren, Y.; Trimpin, S., Matrix assisted ionization: new aromatic
and nonaromatic matrix compounds producing multiply charged lipid, peptide, and protein ions
in the positive and negative mode observed directly from surfaces. J. Am. Soc. Mass Spectrom.
2012, 23 (10), 1625-1643.
6. Vestal, M., Ionization techniques for nonvolatile molecules. Mass Spectrom. Rev. 1983, 2 (4),
447-480.
7. Biskos, G.; Reavell, K.; Collings, N., Unipolar diffusion charging of aerosol particles in the
transition regime. J. Aerosol Sci. 2005, 36 (2), 247-265.
8. Forward, K. M.; Lacks, D. J.; Mohan Sankaran, R., Methodology for studying particle–particle
triboelectrification in granular materials. J. Electrostat 2009, 67 (2), 178-183.
9. Heitz, J.; Dickinson, J., Characterization of particulates accompanying laser ablation of pressed
polytetrafluorethylene (PTFE) targets. Appl. Phys. A 1999, 68 (5), 515-523.

102
10. Little, M. W.; Laboy, J.; Murray, K. K., Wavelength dependence of soft infrared laser
desorption and ionization. J. Phys. Chem. C 2007, 111 (3), 1412-1416.

103
CHAPTER 7. CONCLUSIONS AND FUTURE DIRECTIONS
Lasers can be used for ambient ionization by removing material from a sample under
ambient conditions for direct ionization away from the target. It is important to understand the role
of particles in ambient ionization, the formation of ions that occurs under ambient conditions of
pressure and temperature. Particles are believed to play a significant role, yet the number and size
distribution of particles generated under the conditions leading to ion formation are not well
characterized.
A particle sizing system was developed in this work that combines light scattering particle
sizer and scanning mobility particle sizer to achieve an extended size range from 10 nm to 20 µm.
This particle sizing system was utilized in measuring particle size and concentration distributions
following laser irradiation of the sample target or applying mechanical shock on a sample target
under atmospheric pressure and temperature.
Particles were generated from ablating thin film of common solid matrixes under UV-
MALDI and inlet ionization conditions and characterized based on concentration and size
distributions. A measurement of the full range of particle sizes reveals two major components of
particle production. The smaller size component has particle diameters around 100 nm and is
attributed to cluster agglomeration and hydrodynamic sputtering of the melted matrix. The larger
particles have diameters around 1 µm and are attributed to melting and spallation of large chunks
of the matrix.
In inlet ionization where multiply charged ions are observed after the plume is introduced
into the heated capillary, much larger particles are observed between 10-20 µm and they are
attributed to film boiling and shock-generated spallation. A high concentration of nanoparticles
between 10 and 20 nm is also observed but predominantly in inlet ionization matrixes and is

104
attributed to direct ejection. Moreover, these particles are deemed responsible for multiply charged
ions observed in inlet ionization. An ion formation mechanism involving large particles and heat
could lead to charging through the triboelectric effect.
This particle sizing system provides a promising approach to assist in elucidating physical
processes and ionization mechanisms in laser ablation/desorption ambient mass spectrometry.
Figure 7-1. Particle size analyzer coupled to mass spectrometry for size selection.
In the future, this particle sizing approach can be further extended by coupling it directly to
mass spectrometry and adding extra capability of size selection of particles introduced into the
mass spectrometer. Particle can be generated inside a chamber by either UV, IR lasers, sprayed
from pneumatic nebulizer or even shock induced. Ejected particles will be directed into the DMA
for size selection. Particle size selection in the differential mobility analyzer can be controlled by
altering applied voltage, sheath flow, or sample flow. The selected particles can be introduced
directly into the mass spectrometer or through transfer capillary depending on specific applications.
One of the challenges that faces this approach is ensuring the flow rate of exiting particles is
provides enough particles to detect by mass spectrometry.

105
In addition to coupling size selection to mass spectrometry, time resolved imaging may be
added by encompassing high speed and resolution camera focused inside the chamber. This
approach will provide another element of plume evolution and substantiate sizing results with a
better overall picture of physical process taking place prior to ionization.

106
APPENDIX A. PARTICLE SIZE CALCULATIONS STATISTICS
Table A-1. Description of statistics calculations used by the Aerosol Instrument Manager
software. The statistics are calculated for the interval defined by the upper and lower bounds
selected from the graphs.

107
APPENDIX B. SPECIFICATIONS FOR THE AERODYNAMIC PARTICLE SIZER
Table B-1. Specifications listing the most important features of the TSI APS 3321.
Measurement technique
The time-of-flight of individual particles is measured in an
accelerating flow field. Processing electronics measure the time-of-
flight of the particle using a single high-speed timing processor.
Phantom particle rejection is achieved through the use of a double
crested optical system. The particle size binning is based on an
internally stored calibration curve.
Particle Type Airborne solids and non-volatile liquids.
Particle Size Range 0.5 to 20 µm aerodynamic size, 0.3 to 20 µm optical size
Maximum Particle
Concentration
1000 pt/cm3 at 0.5 μm with less than 2% coincidence. 1 000 pt/cm3
at 10.0 μm with less than % coincidence.
Display Resolution 32 channels per decade of particle size (logarithmic). This results in
52 channels total. 1,024 bins of raw time-of-flight data (4 ns per bin)
Resolution 0.02 µm at 1.0 µm diameter. 0.03 µm at 10 µm diameter.
Flow Rates Aerosol sample: 1.0 ±0.2 lpm; Sheath Air: 4.0 ±0.1 lpm; Total flow:
5.0 ±0.1 lpm (feedback controlled
Atmospheric Pressure
Correction
Automatically corrected between 600 mbar and 1034 mbar.
Concentration Accuracy ±10% of reading plus variation from counting statistics
Operating Temperature 10 to 40°C (50 to 104°F).
Operating Humidity 10 to 90% RH non-condensing.
Laser Source 30 mW, 680 nm laser diode
Detector Avalanche photodetector (APD).
Power 85 to 264 VAC, 50–60 Hz, 100 W, single phase or 24 VDC
Outputs Digital I/O: 15-pin port (3 input, 3 output). Analog and digital pulse:
BNC. Configurable analog: BNC.
Dimensions (LWH) 380 mm x 300 mm x 180 mm (15 in. x 12 in. x 7 in.).

108
APPENDIX C. SPECIFICATIONS FOR SCANNING MOBILITY PARTICLE SIZER
Table C-1. Specifications listing the most important features of the TSI SMPS 3034 .
Mode of operation
Bipolar KR-85 charge neutralization, DMA
(differential mobility analyzer) particle size
separation, CPC (condensation particle counter)
concentration measurement.
Particle Size range 10 to 500 nanometers
Total particle concentration 102 to 10
7particles per cubic centimeter
Flowrates
Inlet (aerosol sample)
1 L/minute
Sheath flow 4 L/minute
Operating temperature range 5 to 35°C
Operating pressure range 75 to 105 kPa (sea level – 2132 m)
Operating humidity range Ambient humidity 0-95% RH noncondensing
Dimensions (LWH) 45.7 cm x 35.6 cm x 58.4.6 cm
Calibration NIST-traceable voltage and flow standards
Charger/Neutralizer Bipolar, Kr-85, 10 millicurie, half-life of 10.4 years

109
APPENDIX D. LETTERS OF PERMISSION
JOHN WILEY AND SONS LICENSE
TERMS AND CONDITIONS
Nov 25, 2013
This is a License Agreement between Thabiso Musapelo ("You") and John Wiley and Sons
("John Wiley and Sons") provided by Copyright Clearance Center ("CCC"). The license
consists of your order details, the terms and conditions provided by John Wiley and Sons,
and the payment terms and conditions.
All payments must be made in full to CCC. For payment instructions, please see
information listed at the bottom of this form.
License Number 3220930606187
License date Sep 02, 2013
Licensed content publisher John Wiley and Sons
Licensed content
publication
Rapid Communications in Mass Spectrometry
Licensed content title
Size distributions of ambient shock-generated particles:
implications for inlet ionization
Licensed copyright line Copyright © 2013 John Wiley & Sons, Ltd.

110
Licensed content author Thabiso Musapelo,Kermit K. Murray
Licensed content date Apr 30, 2013
Start page 1283
End page 1286
Type of use Dissertation/Thesis
Requestor type Author of this Wiley article
Format Electronic
Portion Full article
Will you be translating? No
Total 0.00 USD
Terms and Conditions
TERMS AND CONDITIONS
This copyrighted material is owned by or exclusively licensed to John Wiley & Sons, Inc.
or one of its group companies (each a "Wiley Company") or a society for whom a Wiley
Company has exclusive publishing rights in relation to a particular journal (collectively
"WILEY"). By clicking "accept" in connection with completing this licensing transaction,
you agree that the following terms and conditions apply to this transaction (along with the
billing and payment terms and conditions established by the Copyright Clearance Center
Inc., ("CCC's Billing and Payment terms and conditions"), at the time that you opened your
RightsLink account (these are available at any time at http://myaccount.copyright.com).
Terms and Conditions

111
1. The materials you have requested permission to reproduce (the "Materials") are protected
by copyright.
2.You are hereby granted a personal, non-exclusive, non-sublicensable, non-transferable,
worldwide, limited license to reproduce the Materials for the purpose specified in the
licensing process. This license is for a one-time use only with a maximum distribution equal
to the number that you identified in the licensing process. Any form of republication
granted by this license must be completed within two years of the date of the grant of this
license (although copies prepared before may be distributed thereafter). The Materials shall
not be used in any other manner or for any other purpose. Permission is granted subject to
an appropriate acknowledgement given to the author, title of the material/book/journal and
the publisher. You shall also duplicate the copyright notice that appears in the Wiley
publication in your use of the Material. Permission is also granted on the understanding that
nowhere in the text is a previously published source acknowledged for all or part of this
Material. Any third party material is expressly excluded from this permission.
3. With respect to the Materials, all rights are reserved. Except as expressly granted by the
terms of the license, no part of the Materials may be copied, modified, adapted (except for
minor reformatting required by the new Publication), translated, reproduced, transferred or
distributed, in any form or by any means, and no derivative works may be made based on
the Materials without the prior permission of the respective copyright owner. You may not
alter, remove or suppress in any manner any copyright, trademark or other notices displayed
by the Materials. You may not license, rent, sell, loan, lease, pledge, offer as security,
transfer or assign the Materials, or any of the rights granted to you hereunder to any other
person.
4. The Materials and all of the intellectual property rights therein shall at all times remain
the exclusive property of John Wiley & Sons Inc or one of its related companies (WILEY)
or their respective licensors, and your interest therein is only that of having possession of
and the right to reproduce the Materials pursuant to Section 2 herein during the continuance
of this Agreement. You agree that you own no right, title or interest in or to the Materials or

112
any of the intellectual property rights therein. You shall have no rights hereunder other than
the license as provided for above in Section 2. No right, license or interest to any trademark,
trade name, service mark or other branding ("Marks") of WILEY or its licensors is granted
hereunder, and you agree that you shall not assert any such right, license or interest with
respect thereto.
5. NEITHER WILEY NOR ITS LICENSORS MAKES ANY WARRANTY OR
REPRESENTATION OF ANY KIND TO YOU OR ANY THIRD PARTY, EXPRESS,
IMPLIED OR STATUTORY, WITH RESPECT TO THE MATERIALS OR THE
ACCURACY OF ANY INFORMATION CONTAINED IN THE MATERIALS,
INCLUDING, WITHOUT LIMITATION, ANY IMPLIED WARRANTY OF
MERCHANTABILITY, ACCURACY, SATISFACTORY QUALITY, FITNESS FOR A
PARTICULAR PURPOSE, USABILITY, INTEGRATION OR NON-INFRINGEMENT
AND ALL SUCH WARRANTIES ARE HEREBY EXCLUDED BY WILEY AND ITS
LICENSORS AND WAIVED BY YOU.
6. WILEY shall have the right to terminate this Agreement immediately upon breach of this
Agreement by you.
7. You shall indemnify, defend and hold harmless WILEY, its Licensors and their
respective directors, officers, agents and employees, from and against any actual or
threatened claims, demands, causes of action or proceedings arising from any breach of this
Agreement by you.
8. IN NO EVENT SHALL WILEY OR ITS LICENSORS BE LIABLE TO YOU OR ANY

113
OTHER PARTY OR ANY OTHER PERSON OR ENTITY FOR ANY SPECIAL,
CONSEQUENTIAL, INCIDENTAL, INDIRECT, EXEMPLARY OR PUNITIVE
DAMAGES, HOWEVER CAUSED, ARISING OUT OF OR IN CONNECTION WITH
THE DOWNLOADING, PROVISIONING, VIEWING OR USE OF THE MATERIALS
REGARDLESS OF THE FORM OF ACTION, WHETHER FOR BREACH OF
CONTRACT, BREACH OF WARRANTY, TORT, NEGLIGENCE, INFRINGEMENT
OR OTHERWISE (INCLUDING, WITHOUT LIMITATION, DAMAGES BASED ON
LOSS OF PROFITS, DATA, FILES, USE, BUSINESS OPPORTUNITY OR CLAIMS OF
THIRD PARTIES), AND WHETHER OR NOT THE PARTY HAS BEEN ADVISED OF
THE POSSIBILITY OF SUCH DAMAGES. THIS LIMITATION SHALL APPLY
NOTWITHSTANDING ANY FAILURE OF ESSENTIAL PURPOSE OF ANY LIMITED
REMEDY PROVIDED HEREIN.
9. Should any provision of this Agreement be held by a court of competent jurisdiction to be
illegal, invalid, or unenforceable, that provision shall be deemed amended to achieve as
nearly as possible the same economic effect as the original provision, and the legality,
validity and enforceability of the remaining provisions of this Agreement shall not be
affected or impaired thereby.
10. The failure of either party to enforce any term or condition of this Agreement shall not
constitute a waiver of either party's right to enforce each and every term and condition of
this Agreement. No breach under this agreement shall be deemed waived or excused by
either party unless such waiver or consent is in writing signed by the party granting such
waiver or consent. The waiver by or consent of a party to a breach of any provision of this

114
Agreement shall not operate or be construed as a waiver of or consent to any other or
subsequent breach by such other party.
11. This Agreement may not be assigned (including by operation of law or otherwise) by
you without WILEY's prior written consent.
12. Any fee required for this permission shall be non-refundable after thirty (30) days from
receipt
13. These terms and conditions together with CCC's Billing and Payment terms and
conditions (which are incorporated herein) form the entire agreement between you and
WILEY concerning this licensing transaction and (in the absence of fraud) supersedes all
prior agreements and representations of the parties, oral or written. This Agreement may not
be amended except in writing signed by both parties. This Agreement shall be binding upon
and inure to the benefit of the parties' successors, legal representatives, and authorized
assigns.
14. In the event of any conflict between your obligations established by these terms and
conditions and those established by CCC's Billing and Payment terms and conditions, these
terms and conditions shall prevail.
15. WILEY expressly reserves all rights not specifically granted in the combination of (i)
the license details provided by you and accepted in the course of this licensing transaction,
(ii) these terms and conditions and (iii) CCC's Billing and Payment terms and conditions.
16. This Agreement will be void if the Type of Use, Format, Circulation, or Requestor Type

115
was misrepresented during the licensing process.
17. This Agreement shall be governed by and construed in accordance with the laws of the
State of New York, USA, without regards to such state's conflict of law rules. Any legal
action, suit or proceeding arising out of or relating to these Terms and Conditions or the
breach thereof shall be instituted in a court of competent jurisdiction in New York County
in the State of New York in the United States of America and each party hereby consents
and submits to the personal jurisdiction of such court, waives any objection to venue in such
court and consents to service of process by registered or certified mail, return receipt
requested, at the last known address of such party.
Wiley Open Access Terms and Conditions
Wiley publishes Open Access articles in both its Wiley Open Access Journals program
[http://www.wileyopenaccess.com/view/index.html] and as Online Open articles in its
subscription journals. The majority of Wiley Open Access Journals have adopted the
Creative Commons Attribution License (CC BY) which permits the unrestricted use,
distribution, reproduction, adaptation and commercial exploitation of the article in any
medium. No permission is required to use the article in this way provided that the article is
properly cited and other license terms are observed. A small number of Wiley Open Access
journals have retained the Creative Commons Attribution Non Commercial License (CC
BY-NC), which permits use, distribution and reproduction in any medium, provided the
original work is properly cited and is not used for commercial purposes.
Online Open articles - Authors selecting Online Open are, unless particular exceptions

116
apply, offered a choice of Creative Commons licenses. They may therefore select from the
CC BY, the CC BY-NC and the Attribution-NoDerivatives (CC BY-NC-ND). The CC BY-
NC-ND is more restrictive than the CC BY-NC as it does not permit adaptations or
modifications without rights holder consent.
Wiley Open Access articles are protected by copyright and are posted to repositories and
websites in accordance with the terms of the applicable Creative Commons license
referenced on the article. At the time of deposit, Wiley Open Access articles include all
changes made during peer review, copyediting, and publishing. Repositories and websites
that host the article are responsible for incorporating any publisher-supplied amendments or
retractions issued subsequently.
Wiley Open Access articles are also available without charge on Wiley's publishing
platform, Wiley Online Library or any successor sites.
Conditions applicable to all Wiley Open Access articles:
The authors' moral rights must not be compromised. These rights include the right of
"paternity" (also known as "attribution" - the right for the author to be identified as
such) and "integrity" (the right for the author not to have the work altered in such a
way that the author's reputation or integrity may be damaged).
Where content in the article is identified as belonging to a third party, it is the
obligation of the user to ensure that any reuse complies with the copyright policies
of the owner of that content.
If article content is copied, downloaded or otherwise reused for research and other
purposes as permitted, a link to the appropriate bibliographic citation (authors,
journal, article title, volume, issue, page numbers, DOI and the link to the definitive
published version on Wiley Online Library) should be maintained. Copyright
notices and disclaimers must not be deleted.
o Creative Commons licenses are copyright licenses and do not confer any
other rights, including but not limited to trademark or patent rights.

117
Any translations, for which a prior translation agreement with Wiley has not been
agreed, must prominently display the statement: "This is an unofficial translation of
an article that appeared in a Wiley publication. The publisher has not endorsed this
translation."
Conditions applicable to non-commercial licenses (CC BY-NC and CC BY-NC-
ND)
For non-commercial and non-promotional purposes individual non-commercial
users may access, download, copy, display and redistribute to colleagues Wiley
Open Access articles. In addition, articles adopting the CC BY-NC may be adapted,
translated, and text- and data-mined subject to the conditions above.
Use by commercial "for-profit" organizations
Use of non-commercial Wiley Open Access articles for commercial, promotional, or
marketing purposes requires further explicit permission from Wiley and will be
subject to a fee. Commercial purposes include:
o Copying or downloading of articles, or linking to such articles for further
redistribution, sale or licensing;
o Copying, downloading or posting by a site or service that incorporates
advertising with such content;
o The inclusion or incorporation of article content in other works or services
(other than normal quotations with an appropriate citation) that is then
available for sale or licensing, for a fee (for example, a compilation produced
for marketing purposes, inclusion in a sales pack)
o Use of article content (other than normal quotations with appropriate
citation) by for-profit organizations for promotional purposes
o Linking to article content in e-mails redistributed for promotional, marketing

118
or educational purposes;
o Use for the purposes of monetary reward by means of sale, resale, license,
loan, transfer or other form of commercial exploitation such as marketing
products
o Print reprints of Wiley Open Access articles can be purchased from:
The modification or adaptation for any purpose of an article referencing the
CC BY-NC-ND License requires consent which can be requested from
Other Terms and Conditions:
BY CLICKING ON THE "I AGREE..." BOX, YOU ACKNOWLEDGE
THAT YOU HAVE READ AND FULLY UNDERSTAND EACH OF THE
SECTIONS OF AND PROVISIONS SET FORTH IN THIS AGREEMENT
AND THAT YOU ARE IN AGREEMENT WITH AND ARE WILLING
TO ACCEPT ALL OF YOUR OBLIGATIONS AS SET FORTH IN THIS
AGREEMENT.
v1.8
If you would like to pay for this license now, please remit this license along with your
payment made payable to "COPYRIGHT CLEARANCE CENTER" otherwise you
will be invoiced within 48 hours of the license date. Payment should be in the form of a
check or money order referencing your account number and this invoice number
RLNK501103414.

119
Once you receive your invoice for this order, you may pay your invoice by credit card.
Please follow instructions provided at that time.
Make Payment To:
Copyright Clearance Center
Dept 001
P.O. Box 843006
Boston, MA 02284-3006
For suggestions or comments regarding this order, contact RightsLink Customer
Support: [email protected] or +1-877-622-5543 (toll free in the US) or +1-
978-646-2777.
Gratis licenses (referencing $0 in the Total field) are free. Please retain this printable
license for your reference. No payment is required.

120
SPRINGER LICENSE
TERMS AND CONDITIONS
Nov 25, 2013
This is a License Agreement between Thabiso Musapelo ("You") and Springer ("Springer")
provided by Copyright Clearance Center ("CCC"). The license consists of your order
details, the terms and conditions provided by Springer, and the payment terms and
conditions.
All payments must be made in full to CCC. For payment instructions, please see
information listed at the bottom of this form.
License Number 3220931096513
License date Sep 02, 2013
Licensed content
publisher
Springer
Licensed content
publication
Journal of The American Society for Mass Spectrometry
Licensed content title
Particle Production in Reflection and Transmission Mode Laser
Ablation: Implications for Laserspray Ionization
Licensed content author Thabiso Musapelo
Licensed content date Jan 1, 2013

121
Volume number 24
Issue number 7
Type of Use Thesis/Dissertation
Portion Full text
Number of copies 1
Author of this Springer
article
Yes and you are the sole author of the new work
Order reference number
Title of your thesis /
dissertation
Particle Formation In Ambient Mass Spectrometry
Expected completion
date
Dec 2013
Estimated size(pages) 100
Total 0.00 USD
Terms and Conditions
Introduction
The publisher for this copyrighted material is Springer Science + Business Media. By
clicking "accept" in connection with completing this licensing transaction, you agree that
the following terms and conditions apply to this transaction (along with the Billing and
Payment terms and conditions established by Copyright Clearance Center, Inc. ("CCC"), at
the time that you opened your Rightslink account and that are available at any time at

122
http://myaccount.copyright.com).
Limited License
With reference to your request to reprint in your thesis material on which Springer Science
and Business Media control the copyright, permission is granted, free of charge, for the use
indicated in your enquiry.
Licenses are for one-time use only with a maximum distribution equal to the number that
you identified in the licensing process.
This License includes use in an electronic form, provided its password protected or on the
university’s intranet or repository including U I (according to the definition at the herpa
website: http://www.sherpa.ac.uk/romeo/). For any other electronic use, please contact
Springer at ([email protected] or
The material can only be used for the purpose of defending your thesis, and with a
maximum of 100 extra copies in paper.
Although Springer holds copyright to the material and is entitled to negotiate on rights, this
license is only valid, subject to a courtesy information to the author (address is given with
the article/chapter) and provided it concerns original material which does not carry
references to other sources (if material in question appears with credit to another source,
authorization from that source is required as well).
Permission free of charge on this occasion does not prejudice any rights we might have to

123
charge for reproduction of our copyrighted material in the future.
Altering/Modifying Material: Not Permitted
You may not alter or modify the material in any manner. Abbreviations, additions, deletions
and/or any other alterations shall be made only with prior written authorization of the
author(s) and/or Springer Science + Business Media. (Please contact Springer at
([email protected] or [email protected])
Reservation of Rights
Springer Science + Business Media reserves all rights not specifically granted in the
combination of (i) the license details provided by you and accepted in the course of this
licensing transaction, (ii) these terms and conditions and (iii) CCC's Billing and Payment
terms and conditions.
Copyright Notice:Disclaimer
You must include the following copyright and permission notice in connection with any
reproduction of the licensed material: "Springer and the original publisher /journal title,
volume, year of publication, page, chapter/article title, name(s) of author(s), figure
number(s), original copyright notice) is given to the publication in which the material was
originally published, by adding; with kind permission from Springer Science and Business
Media"
Warranties: None
Example 1: Springer Science + Business Media makes no representations or warranties with

124
respect to the licensed material.
Example 2: Springer Science + Business Media makes no representations or warranties with
respect to the licensed material and adopts on its own behalf the limitations and disclaimers
established by CCC on its behalf in its Billing and Payment terms and conditions for this
licensing transaction.
Indemnity
You hereby indemnify and agree to hold harmless Springer Science + Business Media and
CCC, and their respective officers, directors, employees and agents, from and against any
and all claims arising out of your use of the licensed material other than as specifically
authorized pursuant to this license.
No Transfer of License
This license is personal to you and may not be sublicensed, assigned, or transferred by you
to any other person without Springer Science + Business Media's written permission.
No Amendment Except in Writing
This license may not be amended except in a writing signed by both parties (or, in the case
of Springer Science + Business Media, by CCC on Springer Science + Business Media's
behalf).
Objection to Contrary Terms
Springer Science + Business Media hereby objects to any terms contained in any purchase
order, acknowledgment, check endorsement or other writing prepared by you, which terms

125
are inconsistent with these terms and conditions or CCC's Billing and Payment terms and
conditions. These terms and conditions, together with CCC's Billing and Payment terms and
conditions (which are incorporated herein), comprise the entire agreement between you and
Springer Science + Business Media (and CCC) concerning this licensing transaction. In the
event of any conflict between your obligations established by these terms and conditions
and those established by CCC's Billing and Payment terms and conditions, these terms and
conditions shall control.
Jurisdiction
All disputes that may arise in connection with this present License, or the breach thereof,
shall be settled exclusively by arbitration, to be held in The Netherlands, in accordance with
Dutch law, and to be conducted under the Rules of the 'Netherlands Arbitrage Instituut'
(Netherlands Institute of Arbitration).OR:
All disputes that may arise in connection with this present License, or the breach
thereof, shall be settled exclusively by arbitration, to be held in the Federal Republic
of Germany, in accordance with German law.
Other terms and conditions:
v1.3
If you would like to pay for this license now, please remit this license along with your
payment made payable to "COPYRIGHT CLEARANCE CENTER" otherwise you
will be invoiced within 48 hours of the license date. Payment should be in the form of a
check or money order referencing your account number and this invoice number

126
RLNK501103417.
Once you receive your invoice for this order, you may pay your invoice by credit card.
Please follow instructions provided at that time.
Make Payment To:
Copyright Clearance Center
Dept 001
P.O. Box 843006
Boston, MA 02284-3006
For suggestions or comments regarding this order, contact RightsLink Customer
Support: [email protected] or +1-877-622-5543 (toll free in the US) or +1-
978-646-2777.
Gratis licenses (referencing $0 in the Total field) are free. Please retain this printable
license for your reference. No payment is required.

127
Title: Particle Formation in Ambient
MALDI Plumes
Author: Thabiso Musapelo and Kermit
K. Murray
Publication: Analytical Chemistry
Publisher: American Chemical Society
Date: Sep 1, 2011
Copyright © 2011, American Chemical
Society
Logged in as:
Thabiso Musapelo
Account #:
3000691589
PERMISSION/LICENSE IS GRANTED FOR YOUR ORDER AT NO CHARGE
This type of permission/license, instead of the standard Terms & Conditions, is sent to you
because no fee is being charged for your order. Please note the following:
Permission is granted for your request in both print and electronic formats, and
translations.
If figures and/or tables were requested, they may be adapted or used in part.
Please print this page for your records and send a copy of it to your publisher/graduate
school.
Appropriate credit for the requested material should be given as follows: "Reprinted
(adapted) with permission from (COMPLETE REFERENCE CITATION). Copyright
(YEAR) American Chemical Society." Insert appropriate information in place of the
capitalized words.
One-time permission is granted only for the use specified in your request. No additional
uses are granted (such as derivative works or other editions). For any other uses, please
submit a new request

128
VITA
Thabiso Musapelo is the second son of Mathato and Letsatsi Musapelo. He graduated from
Berea College with Bachelor of Arts in chemistry in 2008. He immediately enrolled at Louisiana
state university doctoral program in analytical chemistry that same year. His research focused on
fundamental physical process in ionization mechanism in ambient mass spectrometry. He is
currently a member of the American Chemical Society (ACS) and the American Society for
Mass Spectrometry (ASMS). He has presented his research work at seven national conferences,
and he has three publications and one manuscript submitted as the first author. He is currently a
candidate for the degree of Doctor of Philosophy in chemistry, which will be awarded at the May
2014 commencement.