participatory local level assessment of life support...
TRANSCRIPT

574.5264 P(CES)
Participatory Local Level Assessment of Life Support Systems
A METHODOLOGY MANUAL
Madhav Gadgil1, Achar K. P.2, Amba Shetty3, Anirban Ganguly1, Harini Nagendra1, Harish R. Bhat1, Jayashree Venkatesan4, Krishna K.2, Krushnamegh Kunte1, Kunjeera Moolya5, Laxman Nandagiri3, Nayak M. B.1, Ranjit Daniels R. J.4,6, Shankar Joshi5, Shridhar Patgar1, Shrikant Gunaga1, Subramanian K. A.1, Suri Venkatachalam1, Utkarsh Ghate1, Yogesh Gokhale1
1. Centre for Ecological Sciences, Indian Institute of Science, Bangalore – 560 0122. Sri Bhuvanendra College of Arts and Science, Karkala – 574 1043. Karnataka Regional Engineering College, Surathkal – 574 1574. M. S. Swaminathan Research Foundation, Chennai – 600 1135. Mala Village – 574 1236. Madras Snake Park, Raj Bhavan Post, Chennai – 600 022
April 2000
TECHNICAL REPORT NO. 78Centre for Ecological Sciences
Indian Institute of ScienceBangalore – 560 012
India
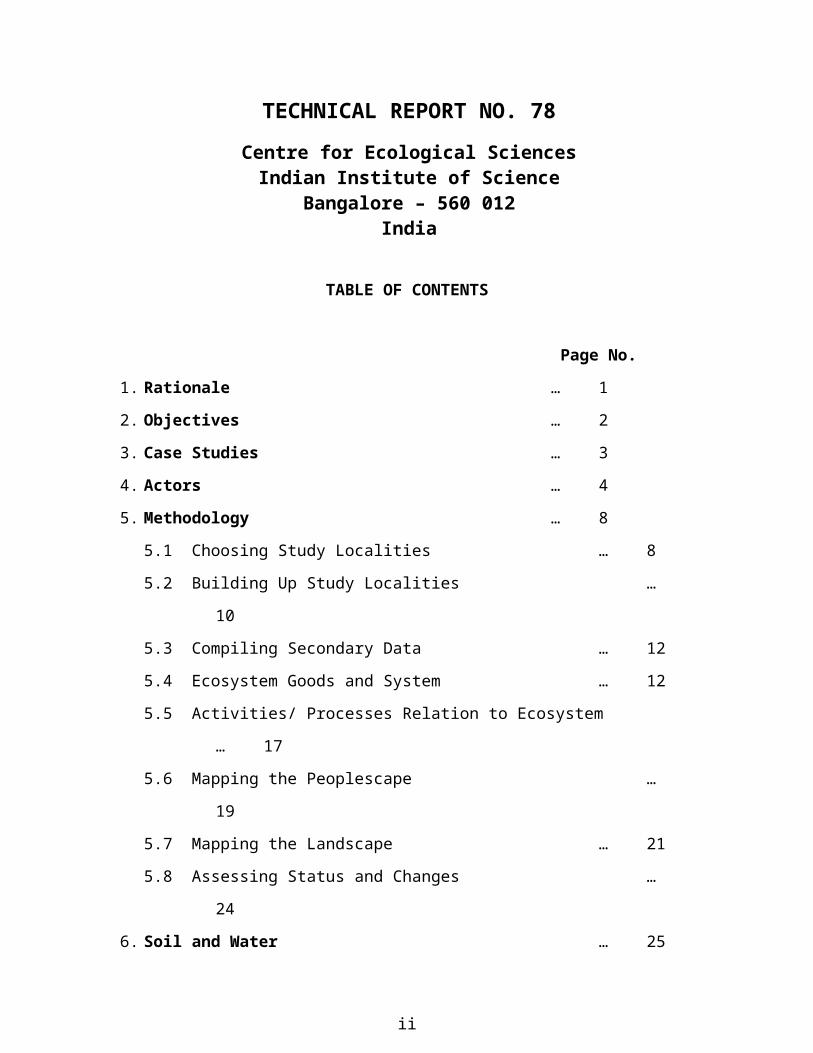
TABLE OF CONTENTS
Page No.
1. Rationale … 1
2. Objectives … 2
3. Case Studies … 3
4. Actors … 4
5. Methodology … 8
5.1 Choosing Study Localities … 8
5.2 Building Up Study Localities … 10
5.3 Compiling Secondary Data … 12
5.4 Ecosystem Goods and System … 12
5.5 Activities/ Processes Relation to Ecosystem … 17
5.6 Mapping the Peoplescape … 19
5.7 Mapping the Landscape … 21
5.8 Assessing Status and Changes … 24
6. Soil and Water … 25
6.1 Mapping and Measurement … 25
6.2 Joint Field Visits of Local People and Experts … 28
6.3 Discussions … 32
7. Landuse … 34
7.1 Mapping and Measurement … 34
7.2 Joint Fieldwork … 34
7.3 Discussions … 41
8. Agriculture and Tree Crops … 41
8.1 Measurement Carried Out in Collaboration with
Farmers … 41
8.2 Discussion … 50
ii

Page No.
9. Forests … 53
9.1 Measurements … 54
9.2 Joint Field Visits … 58
9.3 Discussions … 58
10. Forestry Plantations … 59
10.1 Measurements … 59
10.2 Joint Field Visits … 59
10.3 Discussions … 59
11. Grasslands … 60
11.1 Measurements … 60
11.2 Joint Field Visits … 60
11.3 Discussions … 61
12. Domestic Animals … 61
12.1 Measurements … 61
12.2 Joint Field Visits … 61
12.3 Discussions … 62
13. Fish … 62
13.1 Measurements … 62
13.2 Joint Field Visits … 62
13.3 Discussions … 62
14. Biodiversity … 63
14.1 Measurement … 63
14.2 Valuing Bird Taxa … 66
14.3 Birds … 71
14.4 Butterflies … 73
14.5 Aquatic Macroinvertebrates … 74
14.6 Discussions … 75
iii

Page No.
15. Health … 75
15.1 Measurement … 76
15.2 Joint Field Visits … 76
15.3 Discussions … 76
16. Scenario … 76
17. Values and Aspirations … 77
17.1 Kinds of Organisms … 77
17.2 Localities … 78
17.3 Ecological Problems … 79
18. Conflicts and Consensus … 79
19. Reponse Options … 79
20. Followup and Outreach … 80
References … 81
iv

LIST OF TABLES
Pg. No.
1. Knowledgeable people from different local communities, teachers,
village council members, physician at Primary Health Centre and
others who have contributed substantial amount of information to the
Mala cluster study.
…
10
2. Ecosystem goods and services and bads and disservices as reported by
people of Mala study cluster.
…
14
3. Activities and processes which relate the people of Mala study cluster
with ecosystem goods/ services/ bads/ disservices.
…
18
4. Major groups of people of Mala cluster defined in terms of their links
to the ecosystem.
…
v

20
5. Correspondence between ecotype types defined in terms of landscape
ecology and similarity of ecosystem goods/ services/ bads/ disservices.
…
22
6. Soil sample testing of mala village.
…
26
7. Water sample testing of Mala village
…
27
8. Ecosystem goods/ services/ bads/ disservices associated with aquatic
bodies in Mala study cluster.
…
32
9. Major events in the ecological history of Mala cluster of villages.
…
40
10. A checklist of cultivated plants, of Mala cluster study area.
vi

…
42
11. Cultivars of paddy grown currently or in recent past in the Mala cluster
study area.
…
49
12. Ecosystem goods/ services/ bads/ disservices associated with
cultivated lands of Mala study cluster.
…
51
13. Ecosystem goods/ services/ bads/ disservices associated with forest
lands of Mala study cluster.
…
54
14. Ecosystem goods/ services/ bads/ disservices associated with
grasslands of Mala study cluster.
…
60
15. Landscape element types of Mala cluster and Taxa sampled.
…
vii

71
16. Family-wise species richness of butterflies in different LSE types of
Mala cluster.
…
74
LIST OF FIGURES
Pg. No.
1. A map of India indicating the localities where People’s Biodiversity
Registers were compiled as a part of the Biodiversity Conservation
Prioritization Project during 1995-97, highlighting the location of
Mala village cluster.
…
5
2. A cross-section through Mala cluster study site, indicating the
occurrence of various ecotope types.
…
viii

7
3. The Mala cluster watershed.
…
9
4. A landscape map of Mala cluster.
…
23
5. A map of Mala cluster watershed indicating the names of all land and
water elements as employed by local people.
…
29
6. A map of Mala cluster watershed indicating areas with noticeable
levels of soil erosion.
…
ix

31
7. A map of Mala cluster watershed depicting major changes in land use
over the last century.
…
39
8. Dependence of estimator on sampling effort.
…
65
9. Species Richness (SR) and Mean Composite Conservation Value
(MCCV) for ecotopes samples for birds in Mala.
…
72
x

1. RATIONALE
1.0.1 The ability of earth's ecosystems to provide goods and services to support human
existence is under manifold stresses. It is important, as we enter the new millennium, to
understand the magnitude of these stresses and the forces that drive them, to
communicate this understanding to the citizens of the world, and to help build capacity
and appropriate institutions to tackle the challenges before us (Ayensu et al, 1999).
History tells us that it is not adequate to merely address the key policy makers, key
decision makers in the world, for they have a strong tendency to believe that human
ingenuity can always substitute for all of nature's services. For instance, soon after the
Russian revolution Leon Trotsky declared : “the proper goal of planning is the
domination of nature by technology ……. so that raw materials of nature will yield to
mankind all that it needs and more besides". The underlying values have been shared
by Governments of countries with free enterprise economies as well, so that
environmental action has always sprung from broader public concern (Guha, 2000). An
assessment of how the world's ecosystems are faring must therefore reach out not only
to policy makers, but to the people at large as well. It should especially reach out to the
weaker segments of the populations of the developing countries, for these are the
people who suffer most from a loss of nature's services. But these victims of
environmental degradation are also forced by circumstances to be amongst the most
active agents of destruction. The key to saving world's ecosystems therefore lies in
developing an understanding of what is happening in partnership with these people and
deploying this understanding towards promoting capacity and institutions to undertake
positive actions.
1.0.2 Involving such a broader base of people in assessing the state of world's
ecosystems calls for engaging in more locality specific assessments. This is because the
ecosystems are tremendously variable in space and time and what is relevant to
inhabitants of a coral atoll in the South Pacific is very different from what matters to
peasants in the Andes. Furthermore neither of these groups of people would be
particularly interested in very broad-brush pictures of what is happening to the world's
xi

oceans or mountains. Ultimately, therefore, we should aim to generate concrete,
locality-specific assessments that would cover all of the world's ecosystems.
1.0.3 Obviously this is a Herculean task and one must begin with a more limited
initiative covering a few, catalytic local level assessments. These local level
assessments would also complement the regional and global assessments in forcing one
to take a hard look at the quality of data available on the ground; helping one guard
against spurious certainties. For instance, it is now becoming clear that the concept of
maximum sustainable yield from fish or forest tree populations is beset with many
difficulties; yet a global assessment is likely to employ it on a wide scale. Looking at
very specific fish populations and their histories would likely help us to appreciate the
need for caution. Such is also the case with lists of endangered species. For instance,
we found a frog species, Micrixalus saxicolous, to be quite abundant along the hill
streams in the site of the major case study which forms the basis of this document. At a
1992 meeting of the Indian Subcontinent Reptile and Amphibian Specialist Group of
the Species Survival Commission of IUCN this species was listed amongst those
“presumed extinct”.
1.0.4 The choice of the limited number of specific local level assessments could be
made so as to cover as many as possible of the different biogeographic provinces or
major ecological regions of the earth; and within these regions different settings in
relation to parameters such as human population densities, intensity of inputs into
agriculture, and distance from protected areas such as national parks. This would
complement well the broad brush global painting with a mosaic of much more detailed
local pictures.
2. OBJECTIVES
2.0.1 To assess the status and trends over time and forces driving these trends in the
availability of ecosystem goods and services, as well as bads and disservices from the
divergent perspectives of people relating differently to the natural world in a
representative set of localities.
xii

2.0.2 To inform the regional/global assessments on the state of understanding of the
many parameters employed in terms of concrete, ground level data.
2.0.3 To create awareness amongst the public through concrete assessments including
scenarios of likely futures and possible response options, to which they can relate
themselves, communicated in their own languages.
2.0.4 To appreciate the nature of institutions needed to take positive action in the
particular social-economic-political contexts characterizing the different study
localities.
2.0.5 To build broad based capacity to assess the ecosystem status, to elaborate
appropriate institutions, to plan and implement environment friendly development.
3. CASE STUDIES
India has developed a series of experiences pertinent to local level ecosystem
assessments hand-in-hand with the elaboration of institutions of co-management of
natural resources such as forest and irrigation and decentralization of institutions of
governance down to village level. These have taken the form of Participatory Rural
Appraisals accompanying development planning, Panchayat (= Village Council) Level
Resource Mapping exercises in the state of Kerala and development of management plans
for Village Forest Committees. Following upon these was the initiative of the Foundation
for Revitalization of Local Health Traditions to record community level knowledge and
practices of use of medicinal herbs as Community Biodiversity Registers (CBRs). This
was followed by initiation of broader, biodiversity focussed People’s Biodiversity
Register (PBR) activities at 10 sites in 4 states of the Western Ghats region as a part of
the Western Ghats Biodiversity Network Programme co-ordinated by the Indian Institute
of Science (Gadgil et al, 1996; Gadgil et al, in press). Based on this experience was
organised an all-India programme of PBRs as a part of the WWF sponsored Biodiversity
Conservation Prioritisation Project. This programme covered a series of 52 villages
representing a variety of ecological and socio-economic contexts of the Indian sub-
continent (Figure 1). The PBRs involved local level ecosystem assessments along with an
understanding of the development aspirations, conservation priorities and elaboration of
biodiversity management plans. This exercise does provide an interesting model for local
xiii
ecosystem assessments; however it leaves out such significant issues as soil and water
and agrobiodiversity. We have therefore undertaken further field work in one of the PBR
study sites, namely, Mala and neighbouring villages constituting a watershed contributing
to the Swarna river in Karkala taluk of Udupi district in the state of Karnataka (Figure 2).
Much of the discussion in this methodology manual is based on the experience of the 52
PBR studies along with the more elaborate work in the Mala cluster.
4. ACTORS
4.0.1 Local level ecosystem assessments should be organized as participatory efforts
involving representatives of all segments of society enjoying the goods and services as
well as suffering from the bads and disservices flowing from the pertinent ecosystems.
At least some of these local people would be familiar with many facets of these
ecosystems and would bring in their knowledge to the process. Much of this
information especially relating to changes over time may only reside with local people;
their active involvement is therefore very important. However most of them are
unlikely to be familiar with the broader, systematic framework within which their
information needs to be organized. They would also be unfamiliar with important issues
such as chemical composition of soils and waters. The assessment would therefore need
to involve people with relevant scientific expertise as well; expertise in disciplines such
as ecology and environmental chemistry, as well as economics and anthropology. It
would be desirable that the technical experts be already familiar with the locality, the
society and the culture. This would be achieved if they are associated with one or more
neighbouring educational institutions.
4.0.2 The assessment should also involve creation of awareness, and building of
capacity and appropriate institutions at the local level. This would be facilitated by the
involvement of local NGOs, of farmers’ co-operative societies, of governmental
agencies concerned with resource management issues such as forest department and
institutions of local governance such as village councils.
xiv

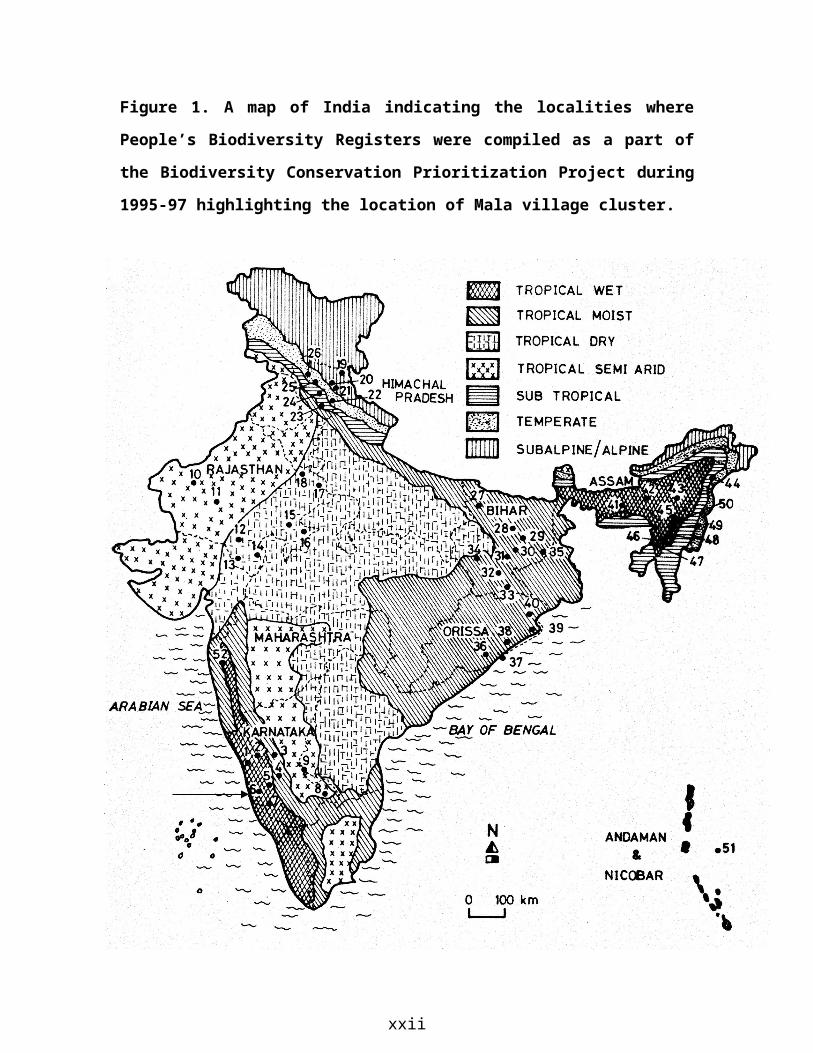
Figure 1. A map of India indicating the localities where People’s Biodiversity
Registers were compiled as a part of the Biodiversity Conservation Prioritization
Project during 1995-97 highlighting the location of Mala village cluster.
xv
MALA

LEGEND
Karnataka: 1. Holanagadde 2. Kalase 3. Kamadhodu 4. Neralekoppa5. Kigga 6. Mala 7. Subramanya8. Gandlahalli 9. Chennekeshavapura
Rajasthan: 10. Vrimdeora 11. Doli12. Bichiwara13. Mahad14. Kewara15. Devli 16. Dhikonia17. Aghapur18. Mathurawat
Himachal Pradesh: 19. Shgnam 20. Shainshar21. Karsog22. Kathog23. Darlaghat24. Kaihad25. Rajai26. Banet
Bihar: 27. Udaipur28. Kabar Lake29. Bhimbandh30. Ranchi Town32. Dalma33. Saranda34. Palamu35. Udhwa Lake.
Orissa: 36. Krushnanagar37. Berhampore38. Dhani39. Bhitarkanika40. Simlipal
Assam: 41. Rani-Garbhanga42. Nameri43. Majoli44. Dibru-Saikhowa45. Lamding46. Sone Beel47. Sat Beel48. Loharband49. Bhuban Hill50. Haflong
Andaman & Nicobar Union Territory: 51. Rangat
Maharashtra: 52. Shilimb
xvi

Figure 2. A cross-section through Mala cluster study site, indicating the occurrence of various ecotope types
xvii

5. METHODOLOGY
5.1 Choosing Study Localities
5.1.1 Two kinds of considerations governed the choice of the 52 study localities for
the PBR exercise over 1996-98. These were (a) the need to represent the whole range
of ecological and socio-economic contexts characteristic of the Indian subcontinent,
and (b) the need to identify a partner agency working close to the study site and
competent to organize a participatory assessment process. In response to these
considerations we selected 6 states and 1 union territory as representative of the
diversity of the country. These included (Figure 1) (1) Rajasthan representing the
desert and semi-arid regions, (2) Himachal Pradesh representing Himalayan hill
tracts (3) Bihar representing Gangetic plains and Central Indian hill tracts (4) Assam
representing Brahmaputra river valley and northeastern hill tracts (5) Orissa
representing east coast and Eastern Ghats and Central Indian hill tracts (6) Karnataka
representing the West coast, hill tracts of Western Ghats and the Deccan plateau and
(7) Andaman and Nicobar islands in the Bay of Bengal. Through our prior contacts
with NGOs interested in issues of environment and development, and in nature
conservation and with biology teachers interested in ecological research, we
identified for each state / union territory a nodal NGO willing to co-ordinate the
activities within the state. In turn these nodal agencies contacted other potential
investigating agencies. In consultation with this group we selected a series of study
localities, each representing a village or village cluster extending over 20-50 km2,
covering the whole range of ecological, socio-economic variation within the state, as
well as contexts such as being away from or proximate to a National Park. At this
stage, we did not bring in watershed related considerations, but in organizing the
more detailed Mala cluster study we have delineated the study area in terms of a set
of watersheds draining into the Swarna river (figure 3).
xviii

Figure 3. The Mala Cluster Watershed
xix
5.2 Building up Study Teams
5.2.1 The nodal responsibility for the Mala study lies with Dr. K. Prabhakar Achar,
Professor of Zoology at an undergraduate educational institution, Sri Bhuvanendra
College of Arts and Science at Karkala, located 20 km from the study locality. He
collaborates with Professor K. Krishna who teaches Economics in the same college.
Dr. Achar has been engaged in ecological fieldwork in the vicinity of Mala since
1991 and as a consequence had a familiarity with local ecology as well as people.
Other expertise in ecology, remote sensing and geographical information systems is
provided by members of the Centre for Ecological Sciences at the Indian Institute of
Science, Bangalore and in soils and hydrology by civil engineers at Karnataka
Regional Engineering College, Surathkal.
5.2.2 This group of technical experts has networked with a number of local people.
These include students and teachers of Primary and Middle Schools at Mala who
have undertaken an inventory of local plants and animals as a special exercise, and a
number of local people particularly knowledgeable in a variety of pertinent issues
such as medicinal plants, fisheries and water management for agriculture (Table 1).
Table 1. Knowledgeable people from different local communities, teachers,
village council members, physician at Primary Health Centre and others who
have contributed substantial amount of information to the Mala cluster study
Sl.No. Knowledgeable Individuals Community Occupation
1 Muniraj Ballal K. B. Jain Agriculturist
2 Shankar Joshi Brahmin Agriculturist
3 Jayakumar Ballal Jain Agriculturist
4 Narayana Barve Brahmin Agriculturist
5 Raghuram Phadke Brahmin Agriculturist
6 Gunapala Jain Agriculturist
7 Venkatesh Ranade Brahmin Agriculturist
xx

Sl.No. Knowledgeable Individuals Community Occupation
8 Madhav Marate Brahmin Agriculturist
9 Shashidhar Malekudiya NTFP collector,
Agriculturist
10 Padmayya Gowda Malekudiya NTFP collector,
Agriculturist
11 Babu Gowda Malekudiya Artisan
12 Kunjira Moolya Moolya Laborer
13 Dr. Shrinivas Poojari Poojari Health Inspector
14 Dr. Ivone Fernandes Christain Primary Health Centre Doctor
15 Daju Mera Mugera President of village council
16 Sadananda Hegde Hegde Member of village council
17 Ramakrishna Maiya Brahmin Village Accountant
18 Narayan Dongre Brahmin Primary School Retd. Headmaster
19 Vasanthi Brahmin Primary School Headmistress
20 Nagbushan Joshi Brahmin Primary School Teacher
21 Aravind Joshi Brahmin High School Headmaster
22 Simhasena Indra Jain High School Teacher
23 Jayanthi Shetty Bunts High School Teacher
5.2.3 The study team has also built rapport with members of the village council and
concerned officials such as the Divisional Forest Officer and the Wildlife Warden. It
also interacts with locally active rural development NGOs such as Dharmasthala
Grameena Abhivriddhi Yojana and Nagarika Seva Trust.
5.2.4 There has been a long process of gradual build up of contacts and links with the
local society through a series of individual and group discussions, partnership in
programmes such as school nature study project, involvement in social functions such
as formal handing over of the PBR report to the Village Council and so on. In other
localities where the group of technical experts is making a new entry, rapport with
local society will have to be built up through deliberate efforts, identifying local
xxi
leaders and individuals with extensive knowledge of ecosystem goods and services
and getting to work with them.
5.3 Compiling Secondary Data
5.3.1 At an early stage in the study it is necessary to put together all pertinent
secondary data such as survey maps indicating land ownership, topographic maps,
aerial photographs and satellite imagery, district gazetteers, human and livestock
census data, landuse, cropping patterns and crop production statistics, forest working
plans, fish landing statistics, statistics relating to commercial and industrial
establishments, information maintained by pollution control authorities, rainfall and
river flow statistics. It is also necessary to acquire reports and publications of any
previous investigations that relate to study locality or other neighbouring areas.
5.4 Ecosystem Goods and Services
5.4.1 A workable definition of ecosystem goods and services could be “those goods
and services which undergo relatively little transformation in the hands of people, that
is, conversion from the form in which it is provided by nature to the form in which it
can be used by people involves relatively little capital investment.” Ecosystem
goods and services could be available as a result of human modifications of
ecosystems including use of industrial goods, such as agriculture or plantations with
chemical pesticides as an input, or could be more direct gifts of nature such as wild
fruit or fishes. It may require significant and arduous human effort to access certain
ecosystem goods such as honey or toddy but the form in which they are tapped from
nature would usually be directly of use to humans without the need of any capital-
intensive transformation. For the purpose of the present exercise, we would also
include in this category simple products which are results of local value-addition not
involving any major external input, such as large serving spoons made of coconut
shells, since these products illustrate basic links of local people with their ecosystem.
5.4.2 For many ecosystem goods and services, market institutions for exchange do
not exist, which means that it is difficult to use price as a proxy for their value as
xxii

perceived by the user, although valuation can still be attempted through indirect
means. Locally collected and used firewood, for example is not exchanged through
markets and hence, not priced from the user’s viewpoint, though one could
theoretically value this ecosystem good in terms of opportunity costs, for example of
the labour involved in the collection, but this would be an outsider perspective.
5.4.3 We may illustrate these definitions further on the basis of some concrete
examples of ecosystem versus industrial goods and services
Ecosystem good: Locally available medicinal herb (Relatively little
transformation, no well-defined market, labour-intensive collection process)
Industrial good: Commercially produced drug capsule (High degree of
transformation, well-defined market, capital-intensive production process)
Ecosystem service: Pleasure and health benefits derived from staying in or
visiting a naturally green area (Little transformation, not necessarily priced
from user’s viewpoint)
Industrial service: Pleasure and health benefits of a gym session (Heavy use
of artifacts, definitely priced from user’s view-point)
5.4.4 Goods and services are defined with respect to their use-values to an individual,
a group of individuals or a community. In almost every case, many of the ecosystem
goods and services of an area (in our context, a well-defined watershed) are used by
people living outside. They may access these through the market (e.g. a marketed
NTFP such as Garcinia fruit), by virtue of locational advantages (e.g. watershed
benefits in downstream areas) or by physically accessing the ecosystem (e.g.
collecting firewood or enjoying scenic beauties). There would also be certain
ecosystem goods and services, which yield benefits to a much larger community
(beyond those with access through the above means). Forests, for example, provide
carbon sequestration benefits to the global community at large with impacts
potentially reaching a small island nation or a low lying delta facing threats of
submergence thousands of miles away. These benefits will typically have no
significance for the local people.
xxiii

5.4.5 We provide below an indicative list of ecosystem goods/bads and
services/disservices, as perceived by various groups of local people of Mala cluster
study site (Table 2).
Table 2. Ecosystem goods and services and bads and disservices as reported,
by people of Mala study cluster
Ecosystem goods Use Locally used Marketed
Oryza sativa (Paddy ) Food *Mangifera indica (Mango) Food *Achras sapota Food *Carica papaya Food *Artocarpus heterophyllus (Jackfruit ) Food *Musa sp (Banana) Food *Crabs Food *Bamboo shoots Food *Garcinia indica Food * *Mangifera indica Food * *Anacardium occidentale (fruit) Food * *Acacia catechu ( fruit ) Food * *Cocus nucifera ( fruit ) Food *Hopea ponga Firewood *Hopea parviflora Firewood *Terminalia crenulata Firewood *Terminalia paniculata Firewood *Calophyllum apetalum Firewood *Acacia catechu (leaves) Fuel *Leaf litter Fuel *Anacardium occidenale (branches) Fuel *Cocos nucifera (leaves) Fuel *Tectona grandis (branches) Fuel *Agri waste Fuel *Pandanus sp Mat-making *Calamus sp Basket-making *Ochalandra sp Basket-making *
xxiv

Ecosystem goods Use Locally used MarketedLeea indica Basket-making *Calycopteris floribunda Basket-making *Desmos lawii Basket-making *Uvaria narum Basket-making *Tylophora indica Basket-making *Hippocratea arnottiana Basket-making *Pothos scandens Basket-making *Vateria indica Rain-cover making *Garcinia cambogia Pickles * *Atrocarpus hirsutus Pickles * *Phyllanthus emblica Pickles *Myristica malabarica Condiment *Cinnamomum verum Condiment *Elettaria cardamomum Condiment * *Piper nigrum Condiment * *Vateria indica Varnish *Terminalia chebula Tanning *Randia dumatorum Fish poison *Acacia concinna Detergent * *Sapindus laurifolius Detergent * *Garcinia morella Coloring material *Areca catechu (stem) Water transportation *Hevea brasiliensis ( latex ) Rubber *Acacia catechu Timber *Casuarina equisetifolia Timber *Tectona grandis Timber *Ratsnake Pest control *Lizard Control of insects *Red ant Pollination *Honey bee Honey *Water Irrigation, domestic
uses, fishing*
Grass Grazing *Medicinal herbs Medicine * *Caryota urens (Toddy) Mild intoxicant * *Milk and milk products Nutrition *
xxv

Locally value-added ecosystem goods include mats, baskets, large serving spoons
made of coconut shells, rain-covers made of Vateria indica , milk products and areca
plates.
Ecosystem bads :
Ecosystem bads Dis-use
Wild Boar
Sloth Bear
Civet
Rat
Porcupine
Hare
Bandicoot
Gaur
Bonnet Macaque
Ticks
Leeches
Nuisance species
Nuisance species
Nuisance species
Nuisance species
Nuisance species
Nuisance species
Nuisance species
Nuisance species
Nuisance species
Nuisance species
Nuisance species
Mites
Caterpillar
Tea mosquito
Stem Borer
Terminal leaf eater
Tree borer
Beetles
Sparrow
White breasted waterhen
Jungle Fowl
Quail/ Partridge
Peafowl
Crop pest
Crop pest
Crop pest
Crop pest
Crop pest
Crop pest
Crop pest
Crop pest
Crop pest
Crop pest
Crop pest
Crop pest
Ecosytem services :
xxvi

Evergreen forests are origin of streams
Evergreen forests are repository of honeybees
Evergreen forests are asthetically and often, culturally important (for example,
when certain spots are associated with sacred beliefs).
Grasslands provide for grazing of livestock
Flowering of rubber plantations increase availability of honey
Plantations check soil erosion due to contour formations
Water streams provide water for irrigation and domestic uses
Ecosystem disservices :
Evergreen forests are repository of nuisance species, pests and vectors. (See
above)
Contaminated water streams lead to health problems
5.4.6 To these lists based on discussions with local people may be added other
goods/services, bads/disservices visualized from other, outside perspectives.
Examples of these include locally possibly relevant issues not visualized by any local
people such as pollination as a service, or more globally relevant issues like carbon
sequestration by vegetation and maintenance of biodiversity.
5.5 Activities / processes relating to ecosystems
5.5.1 People relate to ecosystems through a series of activities or processes such as
using the water of a stream or a well for domestic use or irrigation, grazing cattle on a
patch of grassland, selling fuelwood, growing coconuts, being bitten by mosquitoes
carrying malarial parasites, having one's goat being eaten by a panther and so on. The
ecosystem goods/ services/ bads/ disservices relate to people through such
activities /processes. The next step in the assessment should be an inventory of these
activities /processes. Table 3 provides for Mala cluster an illustrative list of such
activities / processes.
Table 3: Activities and processes which relate the people of Mala study cluster with ecosystem goods/ services/ bads/ disservices.
xxvii

A. Those (a) which are carried out by local people and (b) which do not need major
external input
NTFP collection
Medicinal herb collection
Firewood collection
Collection of wood for making implements
Drawing of water from streams/diverting streams for irrigating agricultural
and plantation crops and for domestic uses
Grazing of livestock in grasslands
Collection of cane for basket making
Making charcoal from stems of dead trees
Using leaf litter as manure
Using certain forested areas as picnic spots on festival days ( e.g. Ugadi, the New
Year )
Fishing from streams
Collecting small fishes, apple snails (Pila) and crabs from agricultural fields
Collection of firewood from river beds
Tapping of toddy from Caryota urens
Use of areca stems for transporting water
Use of coconut shells for making large serving spoon
Use of areca shells and rubber and cashew branches as fuel
Basket, mat and rain-cover making
B. Those (a) which are carried out by local people and (b) which need major external
input
Maintaining rubber, areca, coconut, cashew and cocoa plantations
Use of areca leaf sheath for plate making
Cultivation of paddy
Dairy activities and sweet making
xxviii

Trading in NTFP
C. Those which are carried out by outsiders
Trading in NTFP
Enjoying aesthetic values while visiting or passing through the area
Accessing ecosystem goods such as arecanuts and NTFPs or value-added products
such as sweets and areca leaf sheath plates through the market
Auctioning of timber from Forest Department plantations by government officials
5.6 Mapping the peoplescape
5.6.1 Different segments of local human population, men, women, children, peasants,
fisherfolk, traders, teachers, bureaucrats are likely to participate in different processes
or activities and be affected by different processes linking them to ecosystem
goods/services/bads/disservices. The next step in the assessment exercise would be to
classify people into groups pursuing a similar set of processes in relation to the
ecosystems. Table 4 provides such a categorization of people of Mala cluster with
further remarks on the livelihood strategies of the people assigned to different groups.
We may term such groupings as user groups.
5.6.2 Such a grouping is an important guide to allocating effort during the course of
further investigation. To this end, the next step should be identification of one or
more individuals particularly knowledgeable about the local ecosystems from each of
these groups. These individuals could then serve as a part of the investigative team
collaborating with the technical experts for the purpose of the remaining assessment.
Table 1 provides a list of such knowledgeable individuals from the Mala cluster.
xxix
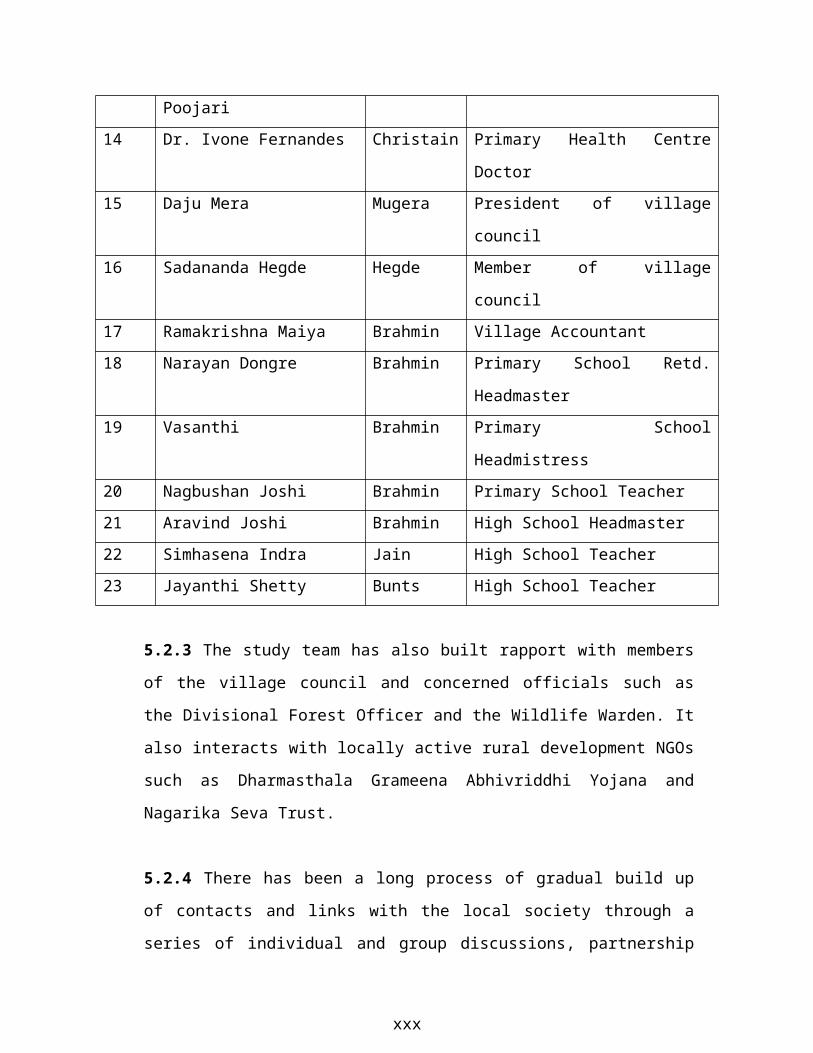
Table 4. Major groups of people of Mala cluster defined in terms of their links to
the ecosystem
Group Activities Processes
Land owners Maintaining plantations of rubber, areca, coconut etcPaddy cultivationDairy activitiesTrading in rubber and arecanutEmploying wage labourHiring toddy tappersDiversion of water from streams for irrigation and domestic purposesUse of areca stems for transporting waterUse of leaf litter as manureCollection of crabs, apple snails (Pila) and small fishes from agricultural landsBees and red ants as pollinators
Use of chemical fertilizers and pesticidesHumans and livestock affected by ticks and leechesCrops damaged by nuisance species such as ratsPest control by ratsnake and lizard
Landless labourers
NTFP collectionFirewood collectionLeaf litter collectionWorking in agricultural fieldsToddy tappingUse of water from streams for domestic purposes
Sloth bear damaging honey combsFlowering of rubber plantations increasing availability of honey
Fishermen Fishing in streamsUse of water from streams for domestic purposesUse of dynamites and fish poisons
Artisans Making of mats, baskets and rain coversSale of these products locally as well as in outside marketsCollection of climbers from evergreen forest Collection of wood for making implementsUse of water from streams for domestic purposes
Small scale industrialists
Collection and local purchase of areca leavesCultivation and purchase of jackfruitHeating and cooling through biogas-powered systemsUse of stream water for agricultural, industrial and domestic purposes
xxx

5.7 Mapping the Landscape
5.7.1 The study locality may be viewed as a mosaic of a number of irregular shaped
(eg. fields, orchards, grasslands, forests, lakes) or linear elements (eg. streams, roads)
of a number of different types. These different types of elements, variously termed
ecotope types or landscape element (LSE) types may be discriminated at different
spatial scales on many different bases. In the discipline of landscape ecology that has
developed especially since satellite imagery became widely available, the individual
elements are discriminated on the scale of a few hundred m2 to few hectares. The
basis of discrimination on land is the structure, physiognomy and phenology of the
dominant life form, e.g. trees in forest or herbs in grassland. The aquatic elements
may be classified on the basis of depth, flow regime and seasonality. Figure 4 is such
a landscape map of the Mala study cluster.
5.7.2 Another relevant basis for the mapping of the landscape is the set of ecosystem
goods / services / bads / disservices stemming from the different elements as
perceived by the people. Thus elements from which similar ecosystem goods /
services / bads / disservices are derived would be clubbed together under the same
ecotope type. These two classifications may be largely compatible with each other,
with a finer division characterizing the landscape ecology based system. Table 5
shows that this is the case for the Mala cluster with ecosystem goods / service based
classification grouping landscape ecology categories under fewer heads.
xxxi

Table 5. Correspondence between ecotype types defined in terms of landscape
ecology and similarity of ecosystem goods/ services/ bads/ disservices
Landscape Ecology Based
Classification
Ecosystem goods/ services (use) based
classification
Evergreen forest
Disturbed evergreen forest
Semi-evergreen forest
Riparian forest
Evergreen forest/ forest
Scrub
Thicket
Scrub
Paddy Field Agricultural land
Casuarina Plantation
Hopea Plantation
Arecanut Plantation
Coconut Grove
Cashew Plantation
Rubber Plantation
Acacia Plantation
Private Tree Plantation
Government Plantation
Stream Stream
Human Habitation Human Habitation
5.7.3 Finally another relevant consideration in mapping the landscape is that of
ownership and tenure. In Mala cluster, for instance, three major forms of ownership
prevail: forest department, land controlled by revenue department but meant for
community use and privately owned land. All streams and rivers are government
property, some of the tanks are private property. The ownership / tenure
considerations are important in governing the access to ecosystem goods and services
and should be borne in mind in the course of assessment.
xxxii

Figure 4. A Landscape Map of Mala Cluster
xxxiii

5.8 Assessing Status and Changes
5.8.1 Preparing a checklist of the ecosystem goods and services/ bads and disservices
as perceived by local people as well as from other, more global perspectives,
grouping people on basis of their links to the ecosystem, identifying knowledgeable
individuals and mapping the landscape in terms of elements that furnish similar sets
of ecosystem goods / services, bads / disservices completes the foundation for the
assessment. The parameters to be assessed belong to two broad categories (a) those
with which at least some members of the local community would be familiar, and (b)
those which require technical expertise unlikely to be available with any member of
local community. In the former case local collaborators would also be in a position to
provide some understanding of the changes in these parameters, at least over past two
decades and forces driving those changes. In case of parameters demanding technical
expertise it would be much more difficult to obtain information relating to changes
over time. In that case changes would have to be inferred on the basis of comparisons
with other localities representing the presumed earlier state. For instance, local
collaborators at Mala are in a position to provide information on current status as well
as changes in population of freshwater fish almost all of whom are locally consumed;
and most of which have distinctive local names, but have relatively little information
on the frog species. The scientific records and literature also provide little information
on historical status of frog populations of the region. The only recourse to assess
changes over time therefore is to look for, or freshly generate information on status of
frogs in other comparable localities of Western Ghats. Of particular relevance would
be localities in a similar environmental setting which have had relatively little human
intervention. Two such localities are Naravi in Belthangadi taluk and Pilarkanni
Udupi taluk. As a part of Mala cluster study it would be worthwhile to investigate the
current status of a number of parameters such as frog populations or soil nutrient
status in these localities.
5.8.2 Local assessments would employ three kinds of methodologies to generate the
required understanding. These would include : (1) mapping and measurements in the
field, primarily by technically trained personnel, (2) field visits, jointly by members
xxxiv

of local community and technical experts and (3) discussions at individual, small
groups or larger gatherings level by local community members working with
technical experts.
6. SOIL AND WATER
6.1 Mapping and Measurement
(i) Topography and hydrology: Topographic survey maps provide the base of all
further mapping. The study locality may be demarcated most conveniently on the
basis of watershed boundaries. Figure 3 is such a map of Mala cluster study
locality with the stream network. This watershed is a part of the Swarna river
basin for which records of flow are available. Rainfall information is also
available for a nearby locality. Using this information inferences will be
attempted as to any adverse impacts on stream discharges. Some fresh
measurements of precipitation using simple rain gauges and stream flow
employing a mobile prism - a sufficiently large cylindrical pipe marked with a
graduated meter scale are planned to be undertaken over the next year. Also
planned are measurements of gravity diversion as well as pumping of water from
streams by the farmers.
(ii) Soil erosion, siltation: Measurements in different seasons of turbidity of water
in the different streams are planned to yield information on possible levels of soil
erosion and siltation.
(iii) Soil quality: Systematic soil samples are being collected to represent the
different landuse / land cover based ecotope types (figure 4). These will be
analyzed for soil depth, soil texture, soil organic matter, soil carbon, nitrogen and
phosphorus and possibly for some important pollutants to be decided upon.
Similar soil sample analysis will be carried out from the Naravi and Pilarkaan
localities mentioned above for comparative studies. These results may yield
information on possible levels of soil degradation.
xxxv

Soil samples were so far collected from 6 different locations of Mala village.
These represent different land use/ land cover classes. One more sample was
collected from the scrub near the gaging location of Yennehole river. In all the
locations 3 samples were collected up to a depth of approximately 85cm.
Table 6. Some Soil Properties of Mala Village
Location Depth
(cm)
Dry Density
g/cm3
Sp. Gravity Porosity
Evergreen Forest
(Bejjale)
26 1.3 2.08 0.375
51 1.25 2.065 0.39
86 1.284 2.15 0.4
Scrub
(Kanegundi)
30 1.335 2.25 0.406
52 1.554 2.23 0.303
70 1.469 2.16 0.319
Paddy Field
(Kasinbail)
40 1.725 2.26 0.33
58 1.54 2.34 0.38
70 1.53 2.4 0.38
Arecanut Plantation
(Kodange)
30 1.428 2.36 0.39
56 1.39 2.35 0.408
70 1.43 2.43 0.41
Coconut Grove
(Mata)
30 1.328 2.40 0.446
56 1.423 2.39 0.4
75 1.53 2.34 0.346
Cashew Plantation 25 1.324 2.3 0.424
50 1.429 2.3 0.378
75 1.409 2.28 0.382
Scrub
(Near Yennehole
Guaging Station)
20 1.25 2.12 0.41
53 1.245 2.22 0.439
80 1.20 2.23 0.46
xxxvi

(iv) Ground water: Measurements of the depth of water table tapped by open
wells will be maintained for selected wells in all the subwatersheds of the study
locality. This information will be incorporated along with other hydrological
information to contribute to an understanding of the watershed function of the
study ecosystem.
(v) Water quality: Basic water quality parameters, Biological Oxygen Demand,
Chemical Oxygen Demand, Nitrogen and Phosphorous concentrations as well as a
few more sophisticated ones such as concentrations of the most intensively used
organic pesticides would be measured to understand the extent to which water
quality may have deteriorated.
Table 7. Some Water Properties of Mala Village
Sl.
No.
Test Evergreen
Forest
Machatte
Stream
Open
Well
Bore
Well
Ambidgundi
Stream
Yennehole
gauging
site
1 pH 7.29 6.8 5.61 7.06 6.6 7.13
2 TDS (ppm) 32 31 34 135 30 41
3 Hardness 24 16 18 96 10 20
4 Calcium (ppm) 2.4 3.2 2.4 26.4 2.4 2.4
5 Magnesium
(ppm)
2.187 0.972 1.458 3.645 0.486 1.701
6 Sodium (ppm) 2.07 2.07 0.69 3.22 2.07 1.38
7 Potassium
(ppm)
0.156 0.156 0.507 1.326 0.234 0.273
8 Chloride (ppm) 8 9 10 10 9 13
9 Alkalinity 22 18 22 100 16 22
10 Sulphate (ppm) 1.0 2.6 1.0 7.0 2.6 2.6
11 Nitrate (ppm) 0.474 0.1676 1.34 0.18 0.086 0.76
12 Iron (ppm) 0.0256 0.188 0.02 0.88 0.084 0.086
Sl. Test Evergreen Machatte Open Bore Ambidgundi Yennehole
xxxvii

No. Forest Stream Well Well Stream gauging
site
13 Fluoride (ppm) Nil Nil Nil 0.04 Nil Nil
14 Sodium
adsorption
ratio
0.233 0.26 0.087 0.156 0.32 0.167
15 Electrical
conductivity
(mmho/cm)
43.3 42.8 45.3 167 39.4 53.1
16 Dissolved
oxygen (mg/l)
6.8 6.9 6.0 6.5 6.8 6.9
6.2 Joint Field Visits of Local People and Experts
(i) Topography and hydrology: Figure 5 is a map depicting the local names of all
landscape and waterscape features familiar to the people. Such a map facilitates
further discussions between experts and local people by providing a commonly
understood set of geographical terms; it also contributes to an understanding of
the traditional landuse pattern in the study area. Field visits would also contribute
to mapping the extent of time for which various streams run dry and in obtaining
information on historical changes in levels of flow as well in the various demands
for water, including diversion for irrigation purposes.
(ii) Soil erosion, siltation: Figure 6 is a map of joint assessment of soil erosion
problems as revealed by exposure of stones and rocks and gully formation. Local
people further provide an understanding of the history of these processes as well
as forces driving them. They are also helping in mapping the extent and history of
siltation in the streams and impact of other processes such as commercial removal
of sand.
xxxviii

Figure 5. A map of Mala cluster watershed indicating the names of all land and
water elements as employed by local people.
xxxix

Local Names of the Habitat
1.Summada Gudda, 2. Summada Gadde, 3. Kattada Padi, 4. Kadari Gudda, 5. Nelli
Gudda, 6. Ramettuda Palke, 7. Kambala Kadachar, 8. Machotte Thanda, 9. Khare Palkel,
10. Mapoalike, 11. Koteangadi, 12. Manjilthar, 13. Parambuda Bali (Vaddharia), 14.
Mepajadda, 15. Peradka, 16. Halepalli, 17. Baladrabettu, 18. Mulluru, 19. Kallapalke, 20.
Ambidagundi, 21. Badakkodi, 22. Arasabettu, 23. Haigolibailu, 24. Kabalajiddu, 25.
Bandalu, 26. Kotemane, 27. Pergadabettu, 28. Nekkardalke, 29. Obbottu Palke, 30.
Matha (Ambidalike), 31. Kaje, 32. Guliga Palke, 33. Kalanabetto, 34. Gundoni Bailo, 35.
Attarguri, 36. Hediya, 37. Hosabettu, 38. Kempaladka, 39. Devasa, 40. Muttirumeru, 41.
Chowki, 42. Soutebettu, 43. Pergadedabailu, 44. Heggadthibailu, 45. Neeralkebail Bali,
46. Paanamberibail Bali, 47. Alangar, 48. Hoigehittilu Bali, 49. Suntigameru, 50.
Kadandhalaje, 51. Kallabettu, 53. Periadke, 54. Padhemane, 55. Pajeera, 56. Tandakadu,
57. Mallar, 58. Hallanthadka, 59. Yedappadi, 60. Mannapapu Jarige, 61. Kochchi Tota,
62. Shivatota, 63. Joshitota, 64. Bijjale, 65. Mitalanda, 66. Ettalgudde Cheranje, 67.
Hajanjodi (Pattanahitiilugali), 68. Kallotte Gudda, 69. Kanarabettu, 70. Kattebailu, 71.
Battida Kadu, 72. Chakkapadhe, 73. Punaragudda, 74. Hekkunje Gudda, 75. Kudabettu,
76. Kudiye, 77. Metada Katta, 78. Donsale, 79. Kairulli, 80. Kundibettu Bareil, 81.
Bangaru Padhe, 82. Hurabe Kadu, 83. Parmelu Kadu, 84. Hosabettu, 85. Hukratte, 86.
Nelluttu, 87. Khekada Kadu, 88. Paraneeru, 89. Ambidagundi, 90. Karambaje, 91.
Muokodi, 92. Paaji Gudda, 93. Ambechchar Gudda, 94. Ambechchar Bailu, 95.
Kuchchcharbettu Bilu, 96. Parappadi, 97. Chande Bailu, 98. Puchabettu Bailu, 99.
Puchabettu, 100. Polarabettu Bailu, 101. Manattu, 102. Kallachche Gudda, 103. Kukikal
Gudda, 104. Kallaje Gudda, 105. Kudiye, 106. Gandalike Gudda, 107. Aaredra Gudda,
108. Kenjudda, 109. Guritota, 110. Mordottu Bailu, 111. Baanadkada Bailu, 112. Kunteri
Bailu, 113. Mujale Bailu, 114. Halakki Bailu, 115. Kullechchav Gudde, 116. Kevudel
Bailu, 117. Mapalu Balu, 118. Kenjarada Bailu, 119. Attarguri Gudda, 120. Pillaje
Bailu, 121. Hariyappana Kere, 122. Renjal Gudda, 123. Galipadhe, 124. Hullu Gudda,
125. Kuringal Guda, 126. Lamdel Bailu
xl

Figure 6. A map of Mala cluster watershed indicating areas with noticeable levels of soil erosion
xli
(iii) Ground water: Joint visits are planned to map current dry and wet season
levels in open wells as well as to obtain information on the years during which
bore wells were dug and the depth at which water was struck. These visits would
also provide information on historical changes in ground water level.
(iv) Water quality: Joint visits are generating an understanding of nature and
intensity of use of pesticides in different fields and orchards and their likely
impact on water quality. In other localities considerable understanding on a
variety of air, water and soil pollution problems could come as a result of such
joint visits.
Table 8. Ecosystem goods/ services/ bads/ disservices associated with aquatic
bodies in Mala study cluster.
LSE UG CATEGORY USE COMMONNAME
Water streams Firewood collector
Firewood Fuel Hudenekki
Water streams Firewood collector
Dead woods floating down
Fuel
Water streams Agriculturist Water Irrigitaion / domestic
Water streams Plantation owner
Water Irrigitaion / domestic
Water streams Fishermen Fishes FishingWater streams All UGs Water Domestic
LSE : Landscape element , UG : User group
Pesticide contaminated water creates health problems for all UGs.
6.3 Discussions
(i) Topography and hydrology: Individual and group discussions are resulting in a
number of insights. One set of these are contributing to an inventory of
aesthetically pleasing land and water features, such as rocky promontories, caves,
waterfalls and deep pools, places whose beauty people wish to see preserved, their
history and prospects. It is also providing an understanding of the history of
xlii

surface water use, traditional irrigation and water sharing arrangements, the
modern developments, including growing demands for water and their
implications. For instance, it is reported that perennial crops have now greatly
increased in acreage compared to paddy confined to the rainy season. This has led
to a higher demand for irrigation water in the dry season. Furthermore, the
traditional gravity flow irrigation is now replaced by sprinklers which greatly
reduce the water going back into streams or percolating to underground water
table. With increasing use of electric pump sets lifting of water from the streams,
as well as from underground water table has also increased. As a result, dry
season stream flows have reduced and water table has gone down to an increased
depth. People are clearly aware that underground water is a renewable resource
and that overuse and reduction in recharge are leading to a depletion of this
capital resource. Another significant issue for discussion has been the possibility
of electricity generation through microhydel projects and local people have
suggested several potentially promising sites. Field visits and flow measurements
at these sites are being planned.
(ii) Soil erosion: In a discussion with rubber plantation owners it was claimed that
the soil conservation measures, including coverage of ground by a leguminous
climber have reduced soil erosion from these areas which were earlier heavily
grazed scrubby lands.
(iii) Soil quality: There is a widespread perception that a decline in the use of
organic manure accompanied by an increase in the application of chemical
fertilizers has led to a serious loss in soil fertility.
(iv) Water quality: There is a widespread perception that extensive use of
chemical pesticides has affected water quality and thereby aquatic animals,
however chemical fertilizers are not perceived as a problem in this context.
xliii

7. LAND USE
7.1 Mapping and Measurement
Figure 4, depicts as described earlier a landscape map, whose elements are
different types of ecotopes which reflect different types of land use.
7.2 Joint Fieldwork
7.2.1 Figure 7 is a map depicting major changes in land use and land cover over the
last century or so. The field work included an examination of older, natural trees
present in an area to infer the nature of vegetation that must have been replaced in
recent times, complemented by reporting of changes within the living memory, as
well as on basis of oral histories handed down from earlier generations. Documentary
sources such as land settlement records, forest working plans, district gazetteers also
aid in the reconstruction of the historical changes in land use and land cover. This
reconstruction is the foundation for assessment of changes in ecosystem goods/
services, as also bads/ disservice.
7.2.2 Quoted below is a sketch of Mala ecological history from the first People’s
Biodiversity Register prepared in 1997.
Ecological History of Mala
Major Historical Benchmarks
The Ecological history of Mala village could be traced back upto 300 years. However,
for the recent past the major benchmarks in the ecological history of recent past
pertaining to Mala village include the Land Reform Act of 1974, the period of Indian
Emergency (1975-77) and the declaration of Kudremukh National Park in 1987. These
were recognized by all groups of people.
xliv

Historical Social Changes
Pre - 1974 period
The first phase of landscape changes might have been started by the Malekudiyas
through shifting cultivation. The Chitpavan Brahmins probably immigrated to
Dakshina Kannada District about 300-400 years ago (1600 - 1680 A.D.) as immigrants
from the neighboring states of Maharashtra and Goa. They settled along the foothills of
Western Ghats in Dakshina Kannada district including Mala Village. An area now
called 'Mata', must have been occupied by Lingayaths (Jangamas) who were
worshippers of lord 'Shiva', before the arrival of Jains some 300-400 years ago. The
presence of Brahmalingeshwara temple across Kadari Hole at Ubharyl, about one
kilometer from Mata, supports this view. After settling, Jains must have taken to
agriculture and started paddy cultivation; while Chitpavans cleared forest patches at the
foothills of Western Ghats and must have started cultivating arecanut and became
horticulturists. Today, not a single Lingayat family is found in Mala village. Forces
responsible for their emigration from Mala village in the distant past are unknown.
The relatively recent history shows that the society mainly comprised of various
agrarian user groups with the rich landlords at the top and the insecure tenants and
labourers at the bottom of the hierarchy related to land. Paddy was the main agricultural
crop particularly in the plains of Mala village. In addition, horticultural cash crops such
as arecanut, coconut, cashew, pepper etc were also being cultivated in the foothills of
the Western Ghats. As a result two main systems of tenancy have flourished in the two
agro-economic settings. The Chalageni system of tenancy evolved in the paddy
cultivating zone, which may be called subsistence setting. Chalagenis were temporary
tenancies and their lease was for a limited term, usually for a year or so, and was liable
to be changed or terminated at will by the landlords. Chalageni tenants were quite often
exploited by their landlords, since the landlords had the right to raise the rent or evict
the tenant, if they refused to pay the enhanced rents. On the other hand, the Moolageni
system of tenancy evolved in cash crops growing zone, which can be called commercial
xlv

setting. Moolageni tenures were quite old and Moolagenigars were considered as
proprietary tenants since their rights on land were perpetual. The landlords could
neither enhance the rates nor evict the tenants if the rent was paid regularly. Apart from
agricultural labour, Malekudiya tribals used to collect forest produce like spices and
honey and sell it in the market. Fishing and practice of herbal medicine were also in
vogue.
Post Land Reforms (1974) Scenario
The implementation of Land Reforms Act of 1974 had a tremendous impact on agrarian
relations and user group pattern, not only in Mala but all over Dakshin Kannada. In the
subsistence setting, the traditional, big landlords nearly disappeared from the scene.
The hundreds of acres of land they owned partly got divided among family members
and partly got sold or transferred to tenants. But hostility between the landlords and
tenants continued and the landlords opposed even the fair claims of tenants and fought
for resumptions of leased land for self-cultivation both by fair and unfair means.
However, while it was quite tough for Chalagenigars, the moolgeni tenants reaped the
benefits of land reforms. The landlords, either evacuated the latter moolgeni tenants by
paying suitable compensation, or not.
One of the important outcomes of the implementation of the land reforms in the
subsistence setting has been the enormous increase in the number of the marginal and
small farmers and corresponding decrease in the number of large farmers. In a way, the
Land Reforms Act of 1974 not only unleashed major changes in the agrarian relations
and user group pattern, but also brought about changes in every section of the rural
society. Of late, some migrants from Kerala settled and started rubber plantations,
others engaged in rubber tapping. The various caste groups and their correlation with
their occupation started diluting, due to education and economic changes.
xlvi

Landscape Changes and Driving Forces
The ecological history of Mala village clearly shows that landscape has been
continuously changing and so also the forces moulding it, over last several decades and
even centuries. Forces that led to landscape change are broadly social, economic,
political and cultural. The chronological events of landscape history and the levels of
biodiversity are summarized in the Table 9.
It is difficult to estimate the biodiversity levels existent in the earliest phase, some 300
years ago. But intuitively, these must have been much higher. For, people describe how
dense and vast forests used to be and they were teeming with wildlife. The landscape
would have been a mosaic of successional ecosystems. While Chitpavan Brahmins
encroached on slope and riparian forests for arecanut plantations some 300 years ago,
the forest department banned the shifting cultivation which allowed some forest
restoration. However, the lust for revenue led to departmental and contractual
plundering of the majestic evergreen forests for timber and plywood. Later the
government gave some forest land on lease for cultivation and these got successively
regularized through political pressures. This led to considerable forest encroachment.
After this initial phase during the last decade the encroachment of areca cultivation on
forests slowed a bit. The forest department also imposed ban on tree felling and the
area was declared as Kudremukh National Park. All these events favored forest
restoration in areas that today look forested. The positive picture on the forest front is
contrasted by the scrub habitat that is being lost to arecanut and rubber cultivation over
the last decade at a fast rate.
The ecosystem people, especially women, have to spend more time and effort to gather
increasingly diminishing supplies of fuelwood, fodder and other land based resources
for bare survival. The need to collect more green manure due to growth in arecanut
cultivation has also resulted in the further loss of biomass support areas like scrub and
accentuated soil erosion. The forest department that planted scrub with Casuarina trees
earlier has now stopped such plantations altogether. This indeed is a welcome sign as it
xlvii

reduces additional competition pressure on the scrub species.
In addition, the new farming practices have led to the increased use of fertilizers and
pesticides and also intensive irrigation. The increasing area of monoculture plantation
crops, especially arecanut, coconut, and cashewnut has caused reduction in the output
of foodgrains. This all is reducing diversity of local, traditional cultivars and the wild
relatives of crop plants. Besides, intensive agriculture might also be affecting several
species of lower animals and microorganism in the soil.
The current system of offering time bound leases for forest produce exploitation has
resulted in overexploitation of forest resources. At the same time, the common lands
around habitations have been further rendered poorer in quality due to over exploitation
of fuelwood, exploitation of timber and uncontrolled grazing of cattle. With the
conversion of kumki land to plantation crops, other scrub patches and accessible
reserve forests are gradually beginning to supply biomass needed for agriculture. The
ecosystem people, mainly comprising of schedule castes and schedule tribes, who have
customarily depended on forest resources and traditional agricultural practices for their
livelihood, have been adversely affected by diminishing forests and common lands. Of
course , the special welfare schemes provided for them by the Government and NGOs
have been instrumental in improving social and economic conditions, to an extent, but
it is not adequate.
xlviii

Figure 7. A map of Mala cluster watershed depicting major changes in land use over the last century
xlix
Table 9. Major events in the ecological history of Mala cluster of villages
Phases Biodiversity Elements
Time (years before present)
Change (Nature and Magnitude)
Driving Forces (Management/Social Factors)
Impact on Biodiversity (+ve/ -ve)
Impact on People (+ve/ -ve)
I Natural forests with maximum Biodiversity Elements (LSEs, species of animals and plants)
> 300 yrs bp (=before present)
Mosaics of primary and secondary forests scrub, fallows etc
Malekudiyas shifting cultivation
Negative Positive
II Loss of forest biodiversity and increase in agrobiodiversity
300-200 yrs bp
Slope and rivarine forests lost
Chitpavan Brahmins Horticulture Areca plantation
Negative Positive
III Loss of forest biodiversity and increasein agrobiodiversity continued
200-100 yrs bp
Intensification and further erosion of riverine forests
Non-Brahmin communities population growth
Negative Positive
IV Further erosion of forest biodiversity increase of scrub jungles and thickets
50 yrs bp Selective felling and degradation of forests
Forest department timber, plywood and paper industries
Negative Positive
V Fragmentation of agrobiodiversity. No significant change in forest biodiversity
Degradation of forests continued
Land Reforms Act of 1974 conflicts between Landlords and Tenants
Negative Positive
VI Afforestation and partial restoration of forest biodiversity
15 yrs bp Gradual forest restoration. Social forestry declaration KNP
Ban on tree felling, reserve forestry were maintained
Positive Positive
VII Loss of Agrobiodiversity and intensification of plantation crops
10 yrs bp Loss of scrubs, thickets and agricultural lands
Ontroduction of rubber plantation and intensification of Areca plantation
Negative Positive
l

7.3 Discussions
7.3.1 During early 1960s the forest department initiated large scale fellings for
timber, for example, to meet the demands for railway sleepers, as well as auctioned
off extraction of minor forest produce such as cane. This encouraged the invasion of
an exotic weed, Eupatorium. A series of other ecosystem transformations followed in
a cascade., After the construction of the bridge over Kadarihole and a road to
Kudremukh from Karkala via Mala village in the year 1976, there have been radical
changes in the land use pattern, as this road rendered accessible a huge and rich forest
tract which previously supported subsistence demands of paddy and arecanut
cultivators, with only a few produces such as cane baskets reaching the wider market.
This historical development furnishes a case study on the effects of a large chunk of
largely untouched forest being rendered accessible and getting fragmented by roads.
7.3.2 Many insights have emerged as to people’s perceptions of appropriate patterns
of land use. For instance, it is felt that excessive levels of conversion of paddy fields
to arecanut orchards have been undesirable as this has increased irrigation water
demands to unsustainable levels; or that conversion of former village common lands
used as grazing grounds to habitation or Casuarina plantations has led to a forced
reduction in livestock holding and a decline in organic manure resources.
8. AGRICULTURE AND TREE CROPS
8.1 Measurements carried out in collaboration with farmers
Studies for land under agriculture, i.e. under cultivation of seasonal/ annual crops and
tree crops begin with the preparation of a checklist of cultivated plants (both seasonal
and perennial) with scientific names, and that of cultivars (Table 10). The former is a
straightforward task since the concept of botanical species is well defined. Cultivars
however pose some difficulties in case of farmer’s as opposed to breeder’s varieties.
The farmer’s varieties tend to be non-uniform - with a great deal of intra-varietal
variation, non-stable - with a great deal of variation from generation to generation and
non-distinctive - with considerable overlap with other varieties. The problem is
relatively less in case of largely self-pollinated plants such as paddy, or vegetatively
li

propagated crops like many mango varieties, but much more difficult for cross-
pollinated crops. It has to be ultimately based primarily on the basis of recognition
and naming by local people along with a careful recording of the attributes
characterizing them. Table 11 provides such a listing of the cultivars of paddy for
Mala cluster.
Table 10. A Checklist of Cultivated Plants of Mala Cluster Study Area
Sl.
No.
Scientific Name Type
1. Anacardium occidentale FR
2. Averrhoa bilimbi FR
3. Averrhoa carambola FR
4. Carica papaya FR
5. Citrus aurantium FR
6. Citrus decumana FR
7. Citrus limetta FR
8. Citrus limon FR
9. Citrus medica FR
10. Coffea arabica FR
11. Mangifera indica FR
12. Passiflora edulis FR
13. Sapindus laurifolius FR
14. Spondias mangifera FR
15. Syzygium hemisphericum FR
16. Syzygium malaccensis FR
17. Tamarindus indica FR
18. Theobroma cacao FR
19. Occimum sanctum MED
20. Occimum basilicum MED
21. Plumbago rosea MED
Sl. Scientific Name Type
No.
22. Allamanda cathartica OP
23. Allamanda neriifolia OP
24. Angelonia grandiflora OP
25. Antigonon leptopus OP
26. Asystasia gangetica OP
27. Bambusa vulgaris OP
28. Barleria involucrata OP
29. Barleria prionitis OP
30. Basella rubra OP
31. Bauhinia tomentosa OP
32. Begonia valdensianum OP
33. Bougainvillaea spectabilis OP
34. Breynia nivosa OP
35. Caladium hortulanum OP
36. Canna indica OP
37. Celosia cristata OP
38. Chrysanthemum morifolium OP
39. Chrysothemis pulchella OP
40. Clerodendron calamitosum OP
41. Clerodendron fragrans OP
42. Clerodendron siphonum OP
lii

Sl.
No.
Scientific Name Type
43. Coleus barbatus OP
44. Coleus blumei OP
45. Coleus rehneltianus OP
46. Cordyline terminalis OP
47. Crossandra unduleafolia OP
48. Croton varigatum OP
49. Epiprenum pinnatum OP
50. Episcia cupreata OP
51. Eranthium bicolour OP
52. Ervatamia coronaria OP
53. Ervatamia corymbosa OP
54. Haemanthus katherinae OP
55. Hedychium coronarium OP
56. Hedychium flavum OP
57. Heliconia rostrata OP
58. Hibiscus mutabilis OP
59. Hibiscus rosa-sinensis OP
60. Hibiscus schizopetalous OP
61. Hydrangea macrophylla OP
62. Ipomoea batatas OP
63. Ixora coccinea OP
64. Ixora macrothyrsa OP
65. Jasminum grandiflorum OP
66. Jasminum officinale OP
67. Jasminum sambac OP
68. Justicia betonica OP
69. Justicia gendarussa OP
70. Kalanchoe blossfeldiana OP
71. Lawsonia inermis OP
Sl. Scientific Name Type
No.
72. Magnolia sp. OP
73. Maranta arundinacea OP
74. Michelia champaca OP
75. Mirabilis jalapa OP
76. Nerium odorum OP
77. Nyctanthes arbor-tristis OP
78. Pachystachys lutea OP
79. Pandanus odoratissimus OP
80. Pentas carnea OP
81. Pilea cadierei OP
82. Plumeria acutifoila OP
83. Pogostemon patchouly OP
84. Polyalthia longifolia OP
85. Polyscias crispatum OP
86. Portulaca oleracea OP
87. Quisqualis indicus OP
88. Rosa indica OP
89. Russelia juncea OP
90. Salvia coccinea OP
91. Senecio cineraria OP
92. Sesabania grandiflora OP
93. Tagetes erecta OP
94. Tecoma stans OP
95. Thevetia neriifoila OP
96. Thunbergia alata OP
97. Thunbergia erecta OP
98. Thunbergia fragrans OP
99. Thunbergia grandiflora OP
100. Vernonia sp. OP
liii

Sl.
No.
Scientific Name Type
101. Wedelia trilobata OP
102. Zinnia elegans OP
103. Curcuma longa SP
104. Elettaria cardomomum SP
105. Mimusops elengi TIM
106. Benicasa hispida VEG
107. Capsicum annuum VEG
108. Capsicum annuum VEG
109. Citrullus vulgaris VEG
110. Coccinia indica VEG
111. Coriandrum sativum VEG
Sl.
No.
Scientific Name Type
112. Cucumis sativus VEG
113. Cucurbita maxima VEG
114. Lagenaria vulgaris VEG
115. Manihot esculenta VEG
116. Momordica charantia VEG
117. Moringa pterygosperma VEG
118. Solanum melongena VEG
119. Solanum suffruticosum VEG
120. Solanum torvum VEG
121. Solanum tuberosum VEG
122. Trichosanthes anguina VEG
LEGEND : FR – Fruit, OP – Ornamental Plants, MED – Medicinal Plants, SP – Spice,
TIM – Timber, VEG – Vegetable.
A Checklist of cultivars of Mala cluster study area
A) Coconut varieties (Cocos nucifera):
1) Kundhiri – size of the coconut is small and it yields about hundred coconuts per
bunch.
2) Gendhaali – colour of the coconut is orange; tender coconuts are preferred for
medicine.
3) Sithaali - colour of the coconut is yellow.
4) Padhnenma thingal – Starts yielding at the 18th month.
5) Keththe siyaala - The outer husk of the tender coconut is edible.
B) Arecanut varities (Areca catechu):
1) Rama adike - size of the fruit is bigger than normal; tree grows very tall. Fruit is
unshelled raw.
2) Mangala
liv

3) Vitla
4) Local
5) Singapore adike – the fruits are very small in size. Nuts are very hard.
C) Jackfruit (Artocarpus heterophyllus):
1) Thulve
2) Balke
3) Mundi pelakai
4) Rudhrakshi
D) Pepper (Piper nigrum):
1) Paniyoor
2) Mallige sara
3) Local
4) Kari munda
5) Kudhka munchi
E) Jamoon fruit (Syzygium cuminii):
1) Sakre jam
2) Pannerle
3) Punjaabi jam : white, red
4) Huli jam
F) Punarpuli (coccum) (Garcinia indica):
1) Red
2) Yellow
G) Ginger (Zingiber officinale):
1) Agar shunti
2) Kukku shunti
3) Shunti
H) Mango (Mangifera indica):
1) Mundappa
2) Gili maavu
3) Neelam
4) Malgova
5) Local
6) Nekkare
7) Aapoos
8) Thothapuri
9) Pairi
10) Gadhdhamaaru
lv

11) Manoranjan 12) Godhavari : gonchal godhi,
single
I) Betel (Piper betel):
1) Gobbara balli/kolire
2) Mundoli
3) Ambaadi
4) Pancholi
J) Colocasia (Colocasia sp):
1) Kariya sevu
2) Mara sevu
3) Mundi
4) Kaatu sevu
K) Lemon (Citrus sp.):
1) Gaja limbe
2) Local limbe
3) Kanchi puli
4) Mahalunga/Madhrampuli
5) Dhodra
L) Banana (Musa sp):
1) Surya baale (yellow)
2) Chandra baale (red)
3) Kadhali/Dhevu baale (2 variety)
4) Poobaare/Rasa baale
5) Kaatu baale
6) Yelakki baale
7) Mysore baale
8) Sahasra kadhali/Munde baare
(1000 fruits)
9) Put baare
10) Nendhra
11) Kevandis
12) Shilyanti
13) Onte baale
14) Bhoodh baale
M) Paddy varities (Oryza sativa):
1) Hallige
2) Athikaye
3) Kanuve
4) Kajakaayeme
5) Raajakaayeme
6) JB
7) Mogin boldhu
8) Kariyadhadi
9) Gandhasalai
10) Jeerasalai
lvi

11) I-R-8 12) Jaya
N) Spondias (Spondias sp.):
1) Khaara ambade
2) Godh ambade
3) Ambade
O) Coffee (Coffea arabica):
1) Robust
2) Local
Other vegetables and fruits:
1) Haagala
2) Boor peere
3) Southe
4) Mullu southe: Aaane muttu, yelu ire, chikka mullu southe, kudhka southe, kareeta
5) Kumbala : kempu (Cucurbita maxima), boodhu (Benicasa hispida)
6) Thonde kai
7) Poona kirengu (Dioscorea)
8) Thuppa kirengu (Dioscorea)
9) Suvarna gadde
10) Palm oil
11) Guava: Without seeds, hybrid.
12) Orange: Nagpur orange
13) Dhodle huli
14) Maaphala
15) Sweet lime
16) Vanilla
17) Clove
18) Egg fruit
19) Pineapple: Moris, local, without prickles
20) Lechi
lvii

Flowers:
A) Champaka (Michelia champaka):
1) Genda sampige
2) Chini sampige
3) Haladhi sampige
B) Jasmine (Jasminum sp.):
1) Jaaji (Jasminum grandiflorum)
2) Dhundu mallige
3) Kasthuri mallige
4) Mallige
5) Muththu mallige
6) Mundas mallige
C) Hibiscus: 25 varieties.
Livestock:
A) Poultry:
1) Manjole
2) Uriye
3) Praddige
4) Korange
5) Karbale
6) Hybrid
B) Dogs:
1) Kaalu
2) Maire
3) Mangale
4) Thoudu
5) Mudhol honda
C) Honey Bee:1) Thodde
2) Periya
3) Maduve
4) Kolcha : Pundi kolcha, Thatti
kolcha
5) Mujanti
lviii

Table 11. Cultivars of Paddy grown currently or in recent past in the Mala cluster
study area
Sl.No. Traditional Paddy Variety Sowing Time1 Kayame June2 Kavlukayame June3 Rajakayame June4 Thonnuru June5 Dhodre February6 Bolliari-small June7 Hambuge June8 Athikare June9 Gandhasale June10 Jeerasale June11 Peetisale June12 Maskathi June13 Suggi kayame October; February14 Karthi kayame June15 Kutti kayame June16 Hallige June17 Kanuve June18 Kage JB October19 Kattu mundai June-October20 Gaddu kayame June21 Kaje kayame22 Kumera June23 Kariyadhadi June24 Sooranje25 Boli ari-big June26 Sonpakutti October-February27 Sona bidhe October
The second step is a classification of the different cropping mixes under which cultivated
plants are grown, ranging from highly diverse home gardens to extensive paddy fields
under a single modern breeder’s variety. The number of classes to be recognised will
have to be decided upon primarily in terms of convenience. The third step is then a
lix

variety of measurements for representative fields of each class of cropping mix. These
would include : (a) Diversity of cultivated plants, (b) Diversity of pests, diseases, weeds,
(c) Diversity of other non-cultivated plants and animals associated with the crops, (d)
Inputs into cultivation including labour, specially purchased seeds, manure, fertilizers and
pesticides (e) Levels of biomass production (f) Levels of economically valuable products
and by-products of cultivation. In addition, of course, there would be soil and water
related measurements mentioned above.
8.2 Discussions
These would focus on how patterns and practices of cultivation have changed over
time, and how these have affected the ecosystem goods and services; bads and
disservices. People in Mala cluster have expressed a number of concerns, including
(i) non-sustainable use of irrigation water (ii) Loss of soil fertility under continued
application of chemical fertilizers (iii) death of many non-target organisms due to
applications of pesticides. However, there seems to be little concern with loss of
diversity of cultivars. There were many cultivars of paddy; there was little such
variation in other important crops such as arecanut and coconut . Since paddy is the
least paying of the crops and is losing out to other crops, there seems to be little
interest in the maintenance of its cultivars, though people do recall that the traditional
cultivars had better flavour and taste, although lower levels of yields. A very
interesting on-going effort in Mala cluster is that of revival of organic agriculture led
by one of the largest land-owners, Mr. Muniraj Ballal.
`Brahma Srushti’ and `Vishwamitra Srushti’:
Local people talk of Creation of two worlds or Srushtis, that of Brahma, the God of
Creation and of Vishwamitra, a sage. The usual cultivated varieties of plants have
been regarded as the `Brahma Srushti’. The wild relatives of cultivated plants,
including wild pepper, wild mango, wild jack-fruit, wild cardamom, wild nutmeg etc.
have been considered as `Vishwamitra Srushti’, and there have greater genetic vigour
and could be cross-pollinated/ grafted with the cultivated varieties to rejuvenate and
revitalize the cultivated varieties from time to time.
lx

Table 12. Ecosystem goods/ services/ bads/ disservices associated with cultivated
lands of Mala study cluster
Ecosystem goods
LSE UG COMMON NAME
CATEGORY USE M/L/B
Private tree plantations Firewood collector
Areca ( leaves)
Firewood Fuel L
Private tree plantations Firewood collector
Coconut (leaves)
Firewood Fuel L
Private tree plantations Firewood collector
Cashew (branches)
Firewood Fuel L
Private tree plantations Firewood collector
Rubber (branches)
Firewood Fuel L
Private tree plantations Firewood collector
Leaf litter Fuel L
Private tree plantations Agriculturist Areca (stems) Stems Water transportation
L
Private tree plantations Plantation owner / Outsider
Rubber Plantation crop
Commercial product
M
Private tree plantations Plantation owner / Outsider
Areca nut Plantation crop
Commercial product / Local consumption
B
Private tree plantations Plantation owner
Coconut Plantation crop
Local consumption
L
Private tree plantations Plantation owner / Outsider
Cashew Plantation crop
Commercial product / local consumption
B
Private tree plantations Plantation owner / Outsider
Pepper Plantation crop
Commercial product / local consumption
B
Private tree plantations Plantation owner / Outsider
Cocoa Plantation crop
Commercial product / local consumption
B
Private tree plantations Toddy tapper /Plantation owner
Toddy ( from Caryota )
Mild intoxicant B
Private tree plantations Folk artist Coconut leaves
Ornament L
Agricultural land Firewood collector
Agri-waste Fuel L
lxi

LSE UG COMMON NAME
CATEGORY USE M/L/B
Agricultural land/ Habitations
Agriculturist Paddy Crop Local consumption
L
Agricultural land/ Habitations
Agriculturist Sapota Crop Local consumption
L
Agricultural land/ Habitations
Agriculturist Mango Crop Local consumption
L
Agricultural land/ Habitations
Agriculturist Papaya Crop Local consumption
L
Agricultural land /Habitations
Agriculturist Jackfruit Crop Local consumption
L
Agricultural land/ Habitations
Agriculturist Banana Crop Local consumption
L
Agricultural land Agriculturist CrabsApple snails
CrustaceanMolluscs
Local consumption
L
Agricultural land Agriculturist Morantai(Cat fishes)
Fishes Local consumption
L
Private tree plantaions Outsiders Areca plates VA product Commercial product
M
Private tree plantations Outsiders Rubber sheets VA product Commercial product
M
Private tree plantations Outsiders / All local UGs
Large serving spoons (Coconut shells)
VA product Commercial product
B
M = Marketed, L = Locally used, B = Both marketed and locally used, VA = Value
added, LSE = Landscape Element (use-based), UG = User Group
Ecosystem services:
LSE UG ServicePrivate tree plantation Agriculturist / Plantation
owner Check on soil erosion ( due to contours )
Private tree plantation Honey collector Flowering of plantation crops leads to increased availability of honey
lxii

Ecosystem bads:
LSE UG Common name Dis-useAgricultural land / Plantation
Agriculturist / Plantation owner
Rat Nuisance
Agricultural land / Plantation
Agriculturist / Plantation owner
Hare Nuisance
Agricultural land / Plantation
Agriculturist / Plantation owner
Bandicoot Nuisance
Agricultural land /Plantation
Agriculturist / Plantation owner
Bonnet macaque Nuisance
Agricultural land /Plantation
Agriculturist / Plantation owner
Mite Crop pest
Agricultural land /Plantation
Agriculturist / Plantation owner
Caterpillar Crop pest
Agricultural land /Plantation
Agriculturist / Plantation owner
Stem borer Crop pest
Agricultural land /Plantation
Agriculturist / Plantation owner
Beetles Crop pest
Agricultural land /Plantation
Agriculturist / Plantation owner
Tree borer Crop pest
Agricultural land /Plantation
Agriculturist / Plantation owner
Terminal leaf eater Crop pest
Agricultural land Agriculturist Sparrow Crop pestAgricultural land Agriculturist Peafowl Crop pestAgricultural land Agriculturist Quail / Partidge Crop pestAgricultural land /Plantation
All UGs Ticks Nuisance
( Plantation refers to private tree plantations )
Ecosystem disservices :
Agricultural lands and private tree plantations are repository of nuisance species and pests ( See above ).
9. FORESTS
While from an ecological perspective we may discriminate several types of ecotopes
with natural or human impacted forest vegetation, the local people treat this as a single
type. They however recognize within the broad forest category different habitat
preferences – for instance, that some genera like Gymnacranthera and Pandanus are
restricted to swamps, others to streamsides, others to hill tops, and so on. The government
lxiii

forest department, on the other hand, treats all land under its legal control, regardless of
whether it is under grassland, Casuarina plantation or natural forest as forest.
9.1 Measurements
Apart from soil and water related parameters mentioned earlier, the scientific
measurements would focus on standing biomass, harvests and biodiversity. Methods
of biodiversity measurements would be considered below under section 14. Standing
biomass may be measured through quadrats or plotless methods such as point centred
quarter method. In the latter method a series of transects are laid from randomly
chosen starting points along random directions of compass with a sampling point
fixed at some predetermined interval, such as 100 meters. At this sampling point
distance, girth and height of trees nearest to the point in each of the four quarters are
measured; a tree being defined as a plant with a diameter of 10cm or more at a height
of 130cm. Standard textbooks on eoclogical methodology provide other details
including computational formulae. Other measurements such as leaf litter and
regeneration may also be undertaken.
Table 13. Ecosystem goods/ services/ bads/ disservices associated with forest lands of
Mala study cluster
Ecosystem goods:
LSE UG COMMON NAME
SCIENTIFIC NAME
CATEGORY USE M/L/B
Evergreen forest NTFP collector Manthapuli Garcinia cambogia
NTFP Pickles M
Evergreen forest NTFP collector Bherundi Garcinia indica NTFP Food BEvergreen forest NTFP collector Vatehuli Artocarpus
lakoochaNTFP Pickles B
Evergreen forest NTFP collector Rampatre Myristica malabarica
NTFP Condiment M
Evergreen forest NTFP collector Dalchini Cinnamomum verum
NTFP Condiment M
Evergreen forest NTFP collector Dhupa Vateria indica NTFP Varnish MEvergreen forest NTFP collector Norekai Sapindus
laurifoliusNTFP Detergent B
lxiv

LSE UG COMMON NAME
SCIENTIFIC NAME
CATEGORY USE M/L/B
Evergreen forest NTFP collector Karimenasu Piper nigrum NTFP Condiment BEvergreen forest NTFP collector Mavu Mangifera
indicaNTFP Food B
Evergreen forest NTFP collector Alale Terminalia chebula
NTFP Tanning L
Evergreen forest NTFP collector Mundaga Pandanus NTFP Mat making
L
Evergreen forest NTFP collector Bettha Calamus NTFP Basket making
L
Evergreen forest NTFP collector Vate Ochalandra NTFP Basket making
L
Evergreen forest Firewood collector
Honne Callophyllum apetalum
Firewood Fuel L
Evergreen forest Agriculturalist Leaf liiter Manure LEvergreen forest Agriculturalist Ratsnake Ptyas sp. Reptile Pest control
(Predator)Evergreen forest Fishermen Karekai Randia
dumatorumBush Fish poison L
Evergreen forest Honey/beewax collector
Honey and beewax
L
Evergreen forest Basket makers Nedil Lea indica Climbers Basket makers
B
Evergreen forest Basket makers Renjir Calycopteris floribunda
Climbers Basket makers
B
Evergreen forest Basket makers Ithalbooru Desmos lawii Climbers Basket makers
B
Evergreen forest Basket makers Pandil Uvaria narum Climbers Basket makers
B
Evergreen forest Basket makers Perbooru Tylophora indica
Climbers Basket makers
B
Evergreen forest Basket makers Madir Hippocratia arnottiana
Climbers Basket makers
B
Evergreen forest Basket makers Arkadabooru Pothos scandens Climbers Basket makers
B
Evergreen forest Artisans Stems of dead trees
Used as charcoal
L
Evergreen forest Folk artists Kiskara Ixora coccinea Flower Coloring material
L
Scrubland/ Thickets
NTFP collector Sheegakai Acacia concinna NTFP Detergent B
Scrubland/ Thickets
NTFP collector Soapnut Sapindus laurifolium
NTFP Detergent B
Scrubland/ Thickets
Artisans/ carpenters
Cashew (tree) Anacardium occidentale
Wood Implements L
Scrubland/ Thickets
Artisans/ carpenters
Korajji Ixora brachiata Wood Implements L
lxv

LSE UG COMMON NAME
SCIENTIFIC NAME
CATEGORY USE M/L/B
Scrubland/ Thickets
Artisans/ carpenters
Matthi Terminalia paniculata
Wood Implements L
Government plantations
Basket makers Cane Calamus sp. Basket making
B
Government plantations
Firewood collector
Cashew (branches)
Anacardium occidentale
Firewood Fuel L
Government plantations
Firewood collector
Acacia (branches)
Acacia auriculiformes
Firewood Fuel L
Government plantations
Firewood collector
Teak (branches)
Tectona grandis Firewood Fuel L
Government plantations
Firewood collector
Casuarina (branches)
Firewood Fuel L
Government plantations
Forest Dept officials
Acacia Acacia aurifuliformes
Wood Sale by auction
M
Government plantations
Forest Dept officials
Casuarina Casuarina equiserifolia
Wood Sale by auction
M
Government plantations
Forest Dept officials
Teak Tectona grandis Wood Sale by auction
M
Value-added products based on ecosystem goods derived from forests used by outsiders
include mats, baskets and rain-covers.
L = Locally used, M = Marketed , B = Both locally used and marketed, LSE =Landscape
element category ( use based ), UG = User group
Ecosystem services:
Evergreen forests are origin of streams
Evergreen forests are repository of honeybees
Evergreen forest are of aesthetic and cultural value, especially at sacred spots,
such as Brahmasthanam in Mala village.
lxvi

Ecosystem bads:
( All the bads refer to evergreen forest )
Common name UG Dis-useWild Boar Agriculturist / Plantation
ownerNuisance
Sloth Bear Agriculturist / Plantation owner
Nuisance
Civet Agriculturist / Plantation owner
Nuisance
Rat Agriculturist / Plantation owner
Nuisance
Porcupine Agriculturist / Plantation owner
Nuisance
Hare Agriculturist / Plantation owner
Nuisance
Gaur Agriculturist / Plantation owner
Nuisance
Bonnet macaque Agriculturist / Plantation owner
Nuisance
Mite Agriculturist / Plantation owner
Crop pest
Caterpillar Agriculturist / Plantation owner
Crop pest
Stem borer Agriculturist / Plantation owner
Crop pest
Terminal leaf eater Agriculturist / Plantation owner
Crop pest
Tree borer Agriculturist / Plantation owner
Crop pest
Beetle Agriculturist / Plantation owner
Crop pest
Jungle fowl Agriculturist / Plantation owner
Crop pest
Pea fowl Agriculturist / Plantation owner
Crop pest
Quail / Patridge Agriculturist / Plantation owner
Crop pest
Ticks All UGs NuisanceLeeches All UGs Nuisance
Ecosystem disservices :
Evergreen forests are repositories of nuisance species, pests and vectors ( See above ).
lxvii

9.2 Joint Field Visits
Information in official records of the harvest from forests, as well as management
regime is often incomplete and inaccurate. Moreover such records are not readily
accessible. Forest produce harvests, an important component of ecosystem goods and
services are therefore best estimated through joint field visits with local people many
of whom either work as forest labourers or collect forest produce for self-
consumption as well as sale. The joint field visits may also be used to reconstruct the
history of vegetation and of flow of ecosystem goods/ services/ bads/ disservices from
particular forest patches.
9.3 Discussions
9.3.1 Discussions have produced a wealth of information on flows of ecosystem
goods/ services/ bads/ disservices from the forest ecotopes. A significant historical
event in this context was the large scale felling of trees for railway sleepers in mid
1960’s. An important species being so felled was Poeciloneuron, whose resin renders
it susceptible to fire. Apparently there was a major crown fire during this operation
leading to large scale death of forest tree populations and drastically changing the
forest composition. A tribal hamlet in upper forest reaches reports, that it has required
many decades after this fire for the streams to their locality to resume normal dry
season flows.
9.3.2 A second major event reported was the commercial exploitation of canes
(rattan) around the same time. Cane of several Calamus species had traditionally been
very abundant in this forest and extensively used locally. It was marketed to a limited
extent as baskets woven by some artisanal households. In particular cane harvests
during 1960s included harvests of the top portion of rhizome along with the basal
segment of the stem to produce walking sticks with hooked tops. This new practice
reportedly totally decimated the very abundant cane stocks. However, in a recent
welcome development the forest department has reintroduced cane species in several
places within the newly declared national park.
lxviii

9.3.3 This phase of exploitation and opening up of the canopy coincided with the
invasion of the exotic composite weed Eupatorium odoratum (=Chromolaena
odorata). This weed has profoundly affected the understory herbs and shrubs as well
as trees regeneration and eliminated the sources of many minor forest produce as well
as grazing for cattle.
9.3.4 These discussions also bring out that people have a basic appreciation of the
idea that harvests from forests beyond a limit would lead to drastic depletions in the
forest stock. They also understand successional processes, remarking that reduction of
grazing and fire on grasslands enclosed by forest have led to a progressive change in
the vegetation from grassland to shrubby growth to woodland.
10. FORESTRY PLANTATIONS
10.1 Measurements
Soil, water, biomass, harvests and biodiversity would be quantitatively assessed in
case of the forestry plantations such as Casuarina equisetifolia, and Acacia
auriculiformis following methods similar to these discussed for forests above.
10.2 Joint Field Visits
These are very useful in recording the history of forestry plantations, especially in
terms of flow of ecosystem goods/ services – bads/ disservices from these locales.
These exotic species plantations do not permit any undergrowth and thereby exclude
grazing. They do not provide any leafy matter useful as green manure. Local
communities therefore view these as responsible for substantial loss of ecosystem
goods/ services earlier accessible to them.
10.3 Discussion
Forestry plantations have largely come up on lands that were earlier maintained as
community grazing lands. During the period 1970s, there was a spurt of
encroachment on these lands for cultivation and habitation both by the local
inhabitants and immigrants. One of the official reactions was the handover of
lxix
authority over such lands to Forest Department which brought them under plantations
of exotic species which would resist grazing pressure.
11. GRASSLANDS
All the grasslands under the temperature, rainfall, soil conditions prevalent at Mala
cluster study site are secondary, created either as a result of (a) shifting cultivation
practiced earlier and discontinued around the end of the 19 th century; these occur on
upper hill slopes, or (b) deliberate clearance of forest around settled cultivation and
habitation in the valley or lower hill slopes to create grazing resources for the cattle.
11.1 Measurements
Soil and water related measurements are to be carried out by appropriate methods as
discussed earlier. Biomass may be estimated at the end of the growing season,
coincident with cessation of rains around November through harvest of 1m x 1m
sampling plots distributed randomly in a representative set of grassland patches.
Biodiversity will be estimated through methods discussed further in section 14.
11.2 Joint Field Visits
Joint visits provide inputs on histories of particular grasslands and the flows of
ecosystems goods/ services and bads/ disservices.
Table 14. Ecosystem goods/ services/ bads/ disservices associated with grasslands of
Mala study cluster
LSE UG CATEGORY USE COMMON NAME
M/L/B
Grassland NTFP collector NTFP Pickles Emblica LGrassland Animal
husbandryGrass Fodder L
L = Locally used
LSE = Landscape element category ( use based )
UG = User group
lxx

11.3 Discussions
People identify grasslands as an ecotype tope that has been especially eroded in
recent decades, and whose ecosystem goods and services are now in great scarcity.
This is traced to two causes: (a) rapid decimation of common property resources as
traditional community organization and practices have changed due to a variety of
forces of modernization, and (b) antipathy of forest authorities towards cattle and fire;
two agents responsible for maintenance of grasslands.
12. DOMESTIC ANIMALS
Cattle, dogs and chicken are the three species maintained under domestication by a
significant proportion of people since many generations. Buffalo, goat and pig have been
introduced in the last few decades.
12.1 Measurements
Survey of randomly selected households from the different groups of people can
provide estimates of biomass, productivity and the variety of goods and services
furnished by domestic animals. There are no definable land races amongst the
traditionally maintained domesticated animal populations. Therefore, while their range
of variability may be noted, no investigation of land race diversity is called for.
12.2 Joint Field Visits
History of change in holding of domestic animals, availability of food resources to
these animals, change in their productivity, diseases, predation by wild animals and
the various goods and services provided by them can be ascertained through
discussions involving visits to households and grazing lands. These also bring out
some special insights: modern breeds of chicken are purchased only for meat and
never maintained for any length of time since all chicken are kept as free range
chicken feeding on their own. Moreover, cockfights are a favourite pastime and
traditional chicken are selectively bred as fighting cocks. People talk of a pale mutant
form of cattle “Kabetis” as a special sacred breed; in fact these appear not to be true
breed, nor are there any attempts to deliberately breed for them.
lxxi

12.3 Discussions
Free grazing cattle, primarily serving to convert natural vegetation into manure for
agriculture was traditionally a significant link between natural and managed
ecosystems. This link is now under considerable stress due to encroachment of
common grazing grounds and deterioration of grazing resources in the forest because
of the invasion by Eupatorium.
13. FISH
The aquatic ecosystems of Mala are primarily hill streams and some small artificial tanks
and wells. Fish are neither especially abundant nor diverse in these waterbodies, yet they
have been significantly depleted.
13.1 Measurements
Fish populations may be sampled using hook and line, cast nets, gill nets, baited traps
or sweeps of rectangular nets. They may also be sampled in conjunction with fishing
by people for their own purpose.
13.2 Joint Field Visits
History of changes in fish fauna in particular water bodies and forces driving these
changes are well documented through joint visits. Also of relevance was the visit to a
stretch of river protected through personal effort by a farmer who owns neighbouring
lands.
13.3 Discussions
Discussions have led to many insights into the history of fish populations. Large scale
road construction activity taken up in 1970’s has led to ready availability of dynamite.
This has been used in destructive fishing leading to a serious depletion in fish
populations, now estimated to be around 25% of the earlier level.
lxxii

14. BIODIVERSITY
Biodiversity is an issue somewhat different from water, agriculture, forest, livestock or
fish. While specific components of biodiversity are significant as sources of ecosystem
goods/ services – bads/ disservices, biodiversity per se does not constitute such goods or
services. Nevertheless status and trends in biodiversity per se are of substantial interest.
But nobody has so far succeeded in carrying out an all taxa biodiversity inventory, let
alone go down to the yet lower level of genetic diversity except to a very limited extent.
So the measurement of biodiversity will have to focus on some specific components
alone. For logistic reasons, we suggest the following upto species level: (a) angiosperms
(b) butterflies (c) birds (d) fishes (e) molluscs. At the family level: (f) aquatic insects. At
the level of varieties, cultivars, land races, we suggest (a) cultivated plants (b) domestic
animals.
14.1 Measurement
14.1.1 For local level assessments it is sufficient to record presence/ absence without
attempting to estimate abundances. The spatial units for the measurements should be
individual elements within the landscape e.g. a forest patch, rubber plantation or a
stretch of a stream. The attempt would then be to come up with a checklist of
occurrence of relevant family/ species/ cultivar within the patch.
14.1.2 For this purpose we need some standardized methodology. A species list
generated from an all out search of an area is the most frequently used method to
survey the species diversity. However, a practical problem associated with all such
efforts is the lack of knowledge of the number of species which are present but have
been “missed”. Can one estimate the number of species which have been “missed” in
this effort? An answer to this question will facilitate the evaluation of the
“completeness” of the species list and hence the necessity for further sampling effort.
In an attempt to come up with a simple methodology to answer this question we
undertook sampling exercises aimed at generating species lists for trees with three
observers in four different habitats in Mala village. We present here the details of the
lxxiii

sampling and data analysis methodology. The results of the analysis are also
presented. Each of the 3 observers spent an equal amount of time (Tobs, in minutes) in
each habitat while performing an all out search to prepare a list of observed species,
spotting A, B and C sets of species respectively. Let Nobs be the cumulative number of
species seen by the observers at the end of their sampling effort and Ntot be the total of
number of species that are present in the area. The latter quantity needs to be
estimated. Let Pi be the probability that the observer I will `spot’ a tree species. This
quantity could also be understood as the efficiency of the observer. Now, the aim of
the exercise described below is to estimate N tot from the observed data. For the
analysis the data is divided into the following seven categories:
Species seen by all three observers, A B C
Species seen by only two of the observers (A B C, A C B and B
C A)
Species seen by only one observer (A B C, B A C and C B
A)
14.1.3 The values of these seven categories can be estimated as following:
Estimate of species seen by all three observers is, (p1p2p3)Ntot
Estimates of species seen by only two observers are: p1p2(1-p3)Ntot, p1p3(1-
p2)Ntot and p2p3(1-p1)Ntot respectively.
Estimates of species seen by only one observer are: p1(1-p2)(1-p3)Ntot, p2(1-p1)
(1-p3)Ntot and p3(1-p1)(1-p2)Ntot respectively.
14.1.4 We have four unknown parameters, p1,p2,p3 and Ntot to be estimated from seven
data points estimates for which can be calculated as shown above. A 2 fit can now be
performed on the data to extract the best estimates of these four unknown parameters.
2 is defined as 2 = (obsi-esti)2/ (esti) where, obsi is the observed value of any of the
seven categories and esti is the associated estimate. The best estimates of these
parameters are those that correspond to the minimum value of 2. A numerical
procedure was implemented to minimize 2. The results of this analysis, indicating
lxxiv

the best estimate of Ntot, for the four different habitat patches surveyed are presented
below.
Evergreen Scrub Semi-evergreen(1) Semi-evergreen (2)
2 9.58 6.96 4.18 11.08
Ntot(est) 76 58 108 86
Nobs 66 52 98 74
Tobs(in min) 90 60 170 80
Figure 8
Note: An estimator for Ntot should be independent of the sampling effort. The
above figure (for data from semievergreen (1)) shows that except for very small
sampling efforts our estimator for Ntot fulfills this requirement.
14.1.5 Using this methodology for the Mala study sites we have some preliminary
data on flowering plants, butterflies, birds, aquatic insects and fish. Our interest is to
interpret this data to obtain an understanding of how the biological communities are
being impacted by ongoing interventions, and how to manage the interventions so as
to do as well as we could from a biodiversity perspective. One possible approach to
this is through assigning values to individual taxa, as well as assemblages from a
conservation perspective. We quote below relevant portions of a study of birds of
Western Ghats which attempts to do this (Pramod et al 1997).
14.2 Valuing Bird Taxa
14.2.1 We need to evaluate the bird species pools characterising the various habitat
types. This is best based on an evaluation of the individual member species of the
pool. This would be an exercise of quantifying the effort that the society might be
willing to devote to ensure continued persistence of any given species. This would
depend on a variety of attributes of the species. They belong to three major
categories; rarity, extent of threat of extinction and utility. In general, rarer the
lxxv

species, the more threatened the species, the greater the utility of the species, the
greater the effort that would be merited to ensure its continued persistence.
14.2.2 We may then assign to any particular species a conservation value reflecting
this effort, such that the value would increase with rarity, extent of threat and utility.
The actual values could either be ranks along a scale or a specific number. We
propose to leave out attempts to quantify utility of bird species and assign quantitative
values ranging between 0 and 1 on the basis of 7 attributes relating to rarity and
extent of threat. Four of these values relate to the geographical range: G1, over the
entire world divided into 6 zoogeographic regions; G2 over the oriental region
divided into 9 subregions; G3 over the Indian subregion divided into 8 provinces; and
G4 over the Malabar (Western Ghats plus West coast) province divided into 4
sections. The conservation value for a taxon by geographic range is given as:
G= (N-a)/ (N-1)
where `N’ is the number of subdivisions at a given level and `a’ is the number of
subdivisions from which the taxon is known. This ensures that the more restricted the
range on any of these scales, the greater would the conservation value be. The
conservation value of each taxon by habitat preference was computed as :
H= (N-a) / (N-1)
where `N’, is the total number of bird habitat types over the Western Ghats region and
`a’ the number of habitats favoured by a given taxon. This ensures that the more
limited the habitat range of a species, the greater would the value be. The
conservation value of a taxon reflecting its taxonomic distinctness was calculated as :
T= 1/(a * b)
lxxvi

where a is the number of species known in the family to which the taxon belongs and
b is the number of races under the species. Rarity is thus sought to be captured in
terms of narrowness of geographical range, narrowness of habitat preference and
limitations on number of related taxa. The conservation value by degree of
endangerment was assigned as:
E = p
where p is the proportion of endangered taxa in the family to which the taxon
belongs. This methodology has been discussed earlier in some detail by Daniels et.al.
(1991).
14.2.3 Admittedly these attempts to capture rarity and endangerment in terms of
broad patterns of geographical distribution, habitat preferences, taxonomic position
and number of related taxa recorded as threatened are crude. Nevertheless they are
based on information which is available for all bird species of Western Ghats, indeed
of the whole country, and therefore permit of an evaluation exercise which is
reasonably objective and accessible for verification by all who may be interested.
This overcomes problems which plague other more subjective exercises, including
the listing of threatened species in IUCN sponsored red data books. Thus the peafowl
(Pavo cristatus), the Nigiri Wood Pigeon (Columba eliphistonii), lesser adjutant
stork (Leptoptilos javanicus) and the redfaced malkoha (Phaenicophaeus
pyrrhocepahlus) are the 4 Western Ghats species included in the list of endangered
species. However of these four the peafowl is widely distributed in India with many
pockets of local abundance thanks to religious beliefs and the lesser adjutant stork is
locally quite common in its appropriate habitat.
Distribution of Conservation Values
14.2.4 The 212 species encountered by us over the 132 transects are a subset of the
586 species of the Western Ghats. We have computed for the set of 586 species of
Western Ghats conservation values for each of these 7 parameters, and a composite
lxxvii
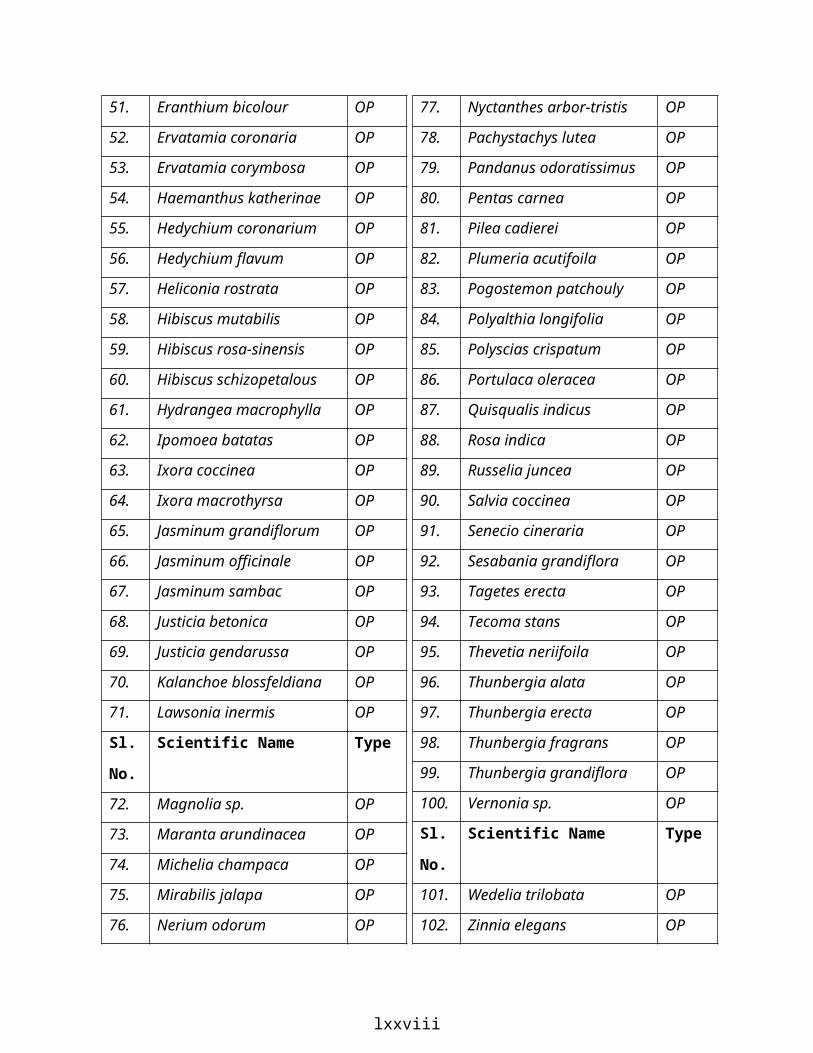
conservation value (CCV) as the sum of four values, namely the mean of the four
values derived from geographical distribution and the other three values related to
habitat preference, taxonomic uniqueness and degree of endangerment. This the CCV
ranges between 0.66 for the Indian jungle crow, widespread, habitat generalist, a
member of a speciose family with many races and of a family in little danger of
extinction to 2.77 for crab plover, a wader with a restricted geographical distribution,
narrow habitat preferences, and the only species in the family Dromadidae. The
cumulative frequency distribution rises rapidly at either end, with about 520 species
in the middle accounting for the values between 1.11 to 1.94. The bottom 22 and top
21 species with composite values substantially higher or lower than the majority are
then of special interest. Fifteen out of these are birds of aquatic habitats, egrets,
cormorants, cranes or skuas. Since our focus is on terrestrial habitats, we may take a
closer look at the other species. The terrestrial species with highest conservation
value include thrushes, babblers, woodpeckers, trogon, characteristic of forest
habitats with narrow ranges at least at the subspecies level; and gallinaceous birds
(quails, junglefowls etc.) that are extensively hunted and thereby threatened. The
species with the lowest conservation values include passerines, swallows, hawks and
falcons with a broad range of habitat tolerance and a wide geographical distribution,
many of whom have adapted to human presence.
14.2.5 It is also of interest to examine the distribution of the composite conservation
value amongst the broader groups of birds at family/subfamily level. Two groups of
water birds herons and curlews, and one group of terrestrial birds hawks and vultures
have significantly low composite conservation values. These have all very broad
geographical distributions. Although the hawks and vultures have a significantly
higher value in terms of endangerment, and curlews and sandpipers significantly
higher value because of their more limited habitat preference, their CCVs are still
significantly lower than the general population.
14.2.6 Three groups namely thrushes and chats, pheasants and quails and babblers
and laughing thrushes have significantly higher CCVs. These they owe in all three
lxxviii

cases to more restricted geographical distributions, and in the case of pheasants and
quails also to significantly higher degree of endangerment. Three other groups of
birds are notable for relatively high values along some of the dimensions of
conservation value, though their CCV is not significantly higher. These include ducks
and geese and pigeons and doves that have significantly high values in terms of
endangerment, and woodpeckers that have significantly higher values in terms of
restricted geographical distribution. Virakkala et al have suggested the use of
woodpeckers as indicators of the health of forest habitats of Finland. For the terrestial
habitats of Western Ghats the babblers would evidently be an appropriate choice as
the group with the highest CCV.
Valuing habitats
14.2.7 Having thus quantified the conservation value at the species level, we can
proceed to assign values to habitats on the basis of species they harbour. Most of the
earlier exercises of this nature have primarily relied on species richness. An important
advance in this context has been the use of taxonomic information as suggested Vane
Wright and his co-workers. Our concept of mean composite conservation value is
another attempt in this direction. It is notable that the two habitat types with lowest
mean CCV, gardens and scrub savanna are also richest in the number of species
whereas more natural habitats like shola-grassland and evergreen forest harbour
comparatively lower number of rarer species which have a high conservation
importance. This is because the former habitats are highly heterogeneous spatially
and are colonised by a large number of opportunistic species with wide geographical
distributions and broad habitat tolerances. It then appears appropriate not to base
conservation decisions on simple species richness, strengthening the case for using a
measure such as the mean composite conservation value. The mean CCV for shola-
grassland is significantly higher than all other values, that of evergreen and semi-
evergreen forests significantly higher than that of scrub- savanna and habitation,and
that of deciduous forests significantly higher than that of gardens (all statistically
significant at p < 0.05). The differences between evergreen forests, semi-evergreen or
deciduous forests and monoculture tree plantations are not significant. A caveat is
lxxix

however in order here. All the localities surveyed by us are a highly intricate mosaic
of several of these habitat types. In particular, the monoculture tree plantations
surveyed are of small extent and tend to abut on patches of evergreen and, deciduous
forests. Their bird communities though often poorer in total number of species, are
made up of many elements from neighbouring forest habitats. This may be the reason
why their mean CCV is not significantly lower in comparison with evergreen and
deciduous forest types.
Exploring conservation values for ecotope types
14.2.8 Sixteen ecotope or landscape element types were identified in the Mala cluster.
Fifteen of these were sampled for birds, butterflies and aquatic macroinvertebrates
(Table 15). Representative patch of each landscape element type was visited between
November 1999 and March 2000 to prepare a comprehensive checklist for birds,
butterflies and aquatic macroinvertebrates. Both sighting records and indirect
evidences (calls for birds) were used to prepare the checklists. Kick netting and all
out search method were employed to sample aquatic macroinvertebrates.
Table 15. Ecotope Types of Mala cluster and taxa sampled.
Ecotope Type Birds Butterflies Aquatic Macroinvertebrates
Evergreen + +Semi evergreen + +
Riparian + +Scrub + +
Thicket + +Grassland + +
Paddy field + +Casuarina plantation + +
Hopea plantation + +Arecanut garden + +Coconut grove + +
Cashew plantation + +Rubber plantation + +Acacia plantation - -
lxxx

Human habitation + +Streams +
14.3 Birds:14.3.1 A total of 127 bird species was recorded from Mala cluster, of these 106 were
recorded during sampling of various ecotope elements. Remaining 21 species were
observed while travelling through the landscape. Checklists of birds were used to
calculate Mean Composite Conservation Value (MCCV) for the birds recorded in
each ecotope type. Bird species encountered while travelling were not used to
calculate MCCV. Composite Conservation Value (CCV), has been calculated as the
sum of four conservation values, namely, mean of three geographical distribution
(global, oriental and Indian), taxonomic uniqueness, habitat threat and habitat
preference (Pramod et.al. 1999). Landscape elements of Mala cluster are then
prioritized for their conservation importance on the basis of the mean of CCV of each
landscape element. The preliminary results of such an exercise is shown in Figure 9.
MCCV of natural ecotopes is higher than that of the man-modified ecotopes. Riparian
evergreen forests have higher MCCV among the natural vegetation types followed by
evergreen and semi evergreen forests.
Figure 9 : Species richness (SR) and Mean Composite Conservation Value (MCCV) for ecotopes sampled for birds in Mala
lxxxi

Legends: RE: Riparian Evergreen; EG: Evergreen; DE: Disturbed Evergreen; RU: Rubber Plantation; SE: Semi Evergreen; HH: Human Habitation; HP: Hopea Plantation; CU: Cashew Nut Plantation; TH: Thicket; CA: Casuarina Plantation; PF: Paddy Field; AR: Arecanut garden; CO: Coconut grove; SC: Scrub.
As is evident from the figure, species richness does not necessarily reflect the
conservation importance of a landscape element. For example the MCCV of semi
evergreen forests with 50 bird species is less than that of riparian evergreen forests
with just 6 species. This is because the computation of CCV takes into consideration
important ecological attributes such as geographic range (endemic versus widespread)
and habitat use (specialist versus generalist). In this case riparian evergreen forests
with Western Ghat endemic birds such as Bluewinged Parakeet, Small Sunbird and a
habitat specialist- Malabar Whistling Thrush pulls up the MCCV even in the presence
lxxxii

of some wide spread and generalist species such as Golden Backed Three-toed
Woodpecker and Pond Heron. On the other hand, patches with high species richness
such as semi evergreen forests and human habitation have low MCCV even in the
presence of some common endemic species such as Bluewinged Parakeet. This is
because the rest of the birds are either with wide geographic range or are habitat
generalists with low CCV.
14.3.2 Use of MCCV of birds to prioritize a patch may not be always reliable as
exemplified by the case of rubber plantation in Mala cluster. The MCCV of rubber
plantation is on par with that of the evergreen forest. This high MCCV of rubber
plantation is due to presence of very few species, for example Bluewinged Parakeet,
Small Sunbird and Racket-tailed Drongo, with high CCV. The presence of forest
birds in the plantation is due to its spatial proximity with patches of high conservation
value such as evergreen forests. These forest birds may be using the plantation
transiently while moving into other patches. The significance of man modified
landscape elements with high MCCV, such as rubber plantation can be reliably
understood only after repeated sampling.
14.4 Butterflies:
14.4.1 A checklist of 185 field identifiable butterfly species was prepared, of which
100 species have so far been actually recorded from the study area. The species were
assigned to different ecotope types based on our earlier field observations in the
Western Ghats. Of the 185 species, 154 are from the semi evergreen forests and 121
from the evergreen forests. Plantations and human habitations have less than 30
species that they can sustain on their own (Table 16).
lxxxiii
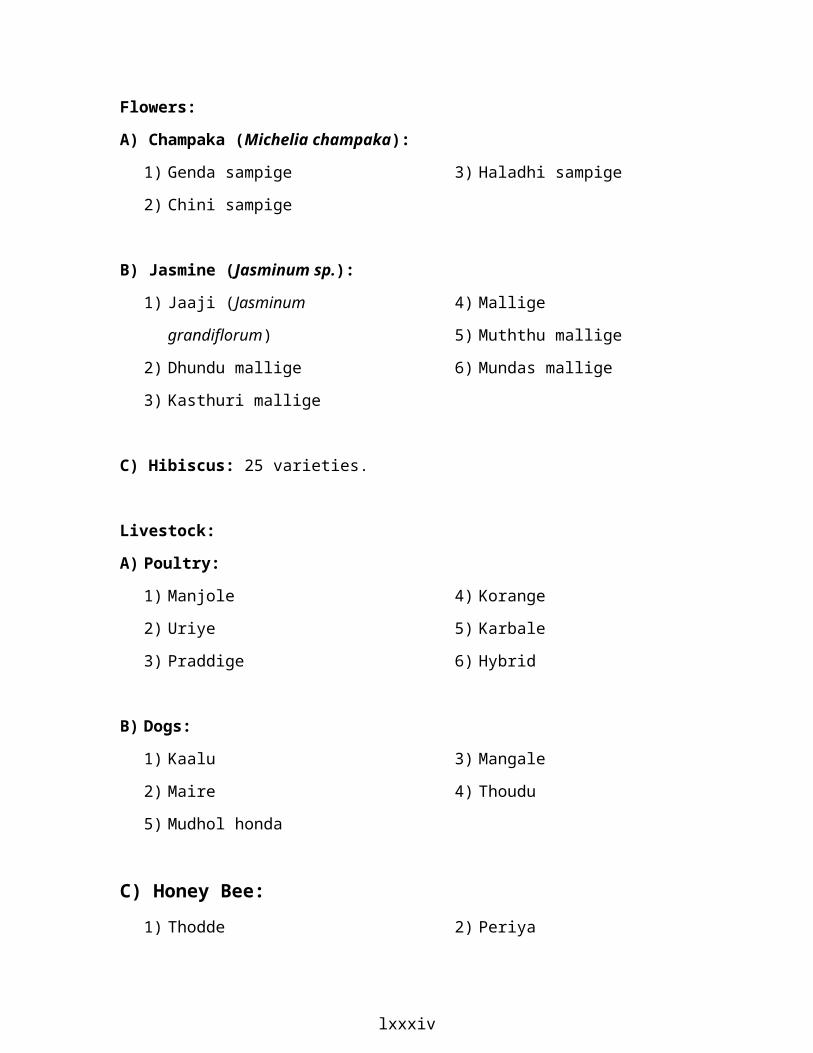
Table 16. Family-wise species richness of butterflies in different ecotope types of
Mala cluster.
FAMILIES EVG SEVG SCR SAV HUH PAF CASH CASS RUB COC
PAPILIONIDAE 16 16 0 5 7 3 0 0 0 1
PIERIDAE 11 18 18 6 4 2 1 0 0 1
NYMPHALIDAE 44 55 17 13 12 7 3 2 2 6
LYCAENIDAE 30 40 14 4 5 3 1 0 0 1
HESPERIIDAE 20 25 6 5 1 1 0 0 0 1
TOTAL 121 154 55 33 29 16 5 2 2 10
Legend: EVG: Evergreen; SEVG: Semi evergreen; SCR: Scrub; SAV: Savanna; HUH:
Human habitation; PAF: Paddy field; CASH: Cashew nut; CASS: Casuarina; RUB:
Rubber; COC: Coconut.
14.5 Aquatic Macroinvertebrates
14.5.1 Six streams flowing through ecotopes like evergreen, semievergreen forests
and human habitations were sampled for aquatic macroinvertebrates. Nineteen
aquatic insect families and two families of fresh water molluscs were recorded during
the study period. Insect fauna was composed of mayflies (Ephemereoptera), dragon
and damselflies (Odonata), stoneflies (Plecoptera), aquatic bugs (Hemiptera),
caddiesflies (Trichoptera), beetles (Coleoptera) and flies (Diptera). The presence of
insect families like Leptophlebiidae, Potamanthidae (Ephemeroptera), Perlidae
(Plecoptera), Chlorocyphidae, Euphidae (Odonata) is indicative of the unpolluted
nature of the streams of Mala cluster. It is worth noting that a mayfly family rare to
Western Ghats – Potamanthidae was recorded from the stream flowing through Sri
Brahmanath, a scared grove. The three fresh water molluscan species recorded from
these streams are Thiara scabra, Sulcospira huegeli (Fam: Thiaridae) and
Lamellidens marginalis (Fam: Unionidae).
lxxxiv

14.6 Discussions
14.6.1 Since there is no historical data available on changes in biodiversity levels, the
only source of information is accounts by knowledgeable individuals. One of the
most knowledgeable of these is Mr. Kunjira Moolya, who reports either
disappearance, or drastic decline in the populations of following plant species:
Kabale, Nare, Kaadu Karuvolu, Adka baare (Xeromphis uliginosa), Kaat Peeray and
the following fish species: Peruvolu (Tor kudri), Murante, Vaateharolu, Heekote,
Baale meenu (Wallago attu), Mugudu (Clarius batrachus), Poomeenu, Puriyol
(Anguilla bengalensis), Manjol sede, Madenji (Channa orientalis).
14.6.2 A number of traditional practices of protection of sacred animals, plants,
groves and tanks have played a role in maintenance of biodiversity. Discussions have
provided significant understanding of various forces impacting these practices and
their future. For instance, a section of immigrants to the village in the last thirty years
are Christians from the neighbouring state of Kerala. They do not observe the
traditional taboo on hunting of gaur (Bos gaurus), an animal related to cattle who are
venerated by Hindus.
15. HEALTH
15.0.1 Health status and health care have undergone drastic changes over the last fifty
years, primarily because of (1) Elimination of serious diseases such as smallpox and
malaria, and (2) Replacement of local health care systems grounded in herbal medicines
by modern allopathic system. Where traditional health care continues to be practiced as in
places like Mala, it is affected by decreasing availability of medicinal plants and animals.
Another major change is the increasing use of pesticides whose poisonous effects in high
dosages are noticeable, though there is no understanding of any possible effects in low
doses. Herbal treatment of livestock diseases may continue as well, even more than
human diseases as in Mala.
lxxxv

15.1 Measurements
15.1.1 If possible measurements may be directed towards estimation of pollutants
such as pesticides in water and food, as well as in air. Measurements may also be
undertaken of vector populations such as mosquitoes.
15.2 Joint Field Visits
15.2.1 Joint visits have been useful in assessing depletion of medicinally useful plants
and animals from different ecotope elements; as also in assessing the role of
traditional conservation practices in maintenance of biodiversity.
15.3 Discussions
15.3.1 Discussions with herbal medicinemen, as well as allopathic medical
practitioners and other community members suggest that potential health effects of
pesticides in water and food are of concern to some people. These discussions also
brought out the history of the outbreak of a relatively new viral disease, Kyasanur
Forest Disease (KFD) in some neighbouring areas. Locally this disease is known as
monkey disease since it kills primates. Apparently the outbreak of this disease is
linked to increasing incidence of tick bites to people. This increase in tick bites is
related to increasing infestation of cattle by ticks, in turn caused by spread of the
weed Eupatorium in forests subjected to overexploitation.
16. SCENARIO
16.0.1 Local level assessments furnish a very rich set of data on historical trends and
forces driving these trends. People are in a position to visualize the future as an
extrapolation of these trends and to project scenarios of what may happen in coming
years. What they are unable to incorporate are possible consequences of radically new
technologies. With this limitation, they responded when asked to construct the following
three sets of scenarios: (i) Business as usual, (ii) Worst that may happen (iii) Best that
they can hope for.
lxxxvi

A Conservationist Scenario
If a conservationist approach is adopted by returning to the cultivation of traditional crop
varieties, cutting down the Acacia and Casuarina plants from the hill tops and permitting
the grasslands to regenerate; by planting wild plants such as Artocarpus hirsutus,
Artocarpus heterophyllus, Mangifera indica, Dillenia pentagyna, Garcina cambogia,
Terminalia bellirica etc. instead of practicing monoculture cultivation; by regulating the
digging of more and more open wells and bore wells and equitable sharing of available
sources of water; by controlled burining of grasslands for regeneration of grass in the
subsequent year etc., the future scenario is likely to improve the life of people of Mala.
These are best generated through leisurely interviews person to person, or in small
or larger groups representing the various segments of population, women and men,
different age groups. These should cover all the sectors, one by one: soil, water (streams,
tanks, ground water), land use, agriculture, tree crops, forests (natural evergreen forest,
scrub land, forestry plantations), grasslands (grasslands in midst of forest, village
commons), livestock, fish, biodiversity, health. Many different perspectives, often
conflicting will emerge. Space should be provided to allow them to emerge, without the
investigators injecting any of their own biases in recording the scenarios.
17. VALUES AND ASPIRATIONS
17.0.1 A second series of similar interviews would focus on values people assign to
various environmental resources and processes and what they aspire to see as maintained
and changed. There are three major themes: (a) Kinds of living organisms, species,
cultivars, (b) Ecotope types, specific localities (c) Processes such as recharge or
withdrawal from ground water, free range grazing by cattle, dry season forest fires, use of
pesticides.
17.1 Kinds of organisms
17.1.1 The discussions on kinds of living organisms people value should begin with a
complete inventory of the types recognised; categories such as trees, grasses, birds
(which may include bats or even flying squirrels), fish (which may include shrimp),
lxxxvii

individual species of plants, birds etc, and any varieties within species (particularly in
case of cultivated plants and domesticated animals). This should be followed by those
that they value positively, in order of priority, as well as those that they consider
undesirable, again, in order of priority. This should be supplemented by a discussion
on any culturally conditioned values relating to these organisms; e.g. while bonnet
macaque is considered a great nuisance because of their destructions of field and
orchards, they are considered sacred and are not killed because of their association
with Lord Rama. The final set of discussions should pertain to what steps at either
conservation or elimination of any of these species they would like to see initiated,
and how these steps may be compatible, or incompatible with their other aspirations.
For instance, a farmer may wish to see several traditional cultivars of paddy
maintained on farm, but may not wish to do so on his own farm which he wants to
convert to arecanut plantation which is a more lucrative use of land.
17.2 Localities
17.2.1 The next theme for a whole series of discussions would pertain to the
localities, their current pattern of use and biological communities they harbour, their
value, and the preference for the kinds of use they should be put to and the kinds of
biological communities they should be managed to harbour. The map of local names
of all topographic elements provides the point of reference for this discussion
(Figure 5).
17.2.2 A variety of perspectives may emerge. For instance, some farmers are unhappy
at the ongoing conversion of paddy fields into arecanut orchards and would like to
ban such changes in land use. However, this would tend to freeze the social and
economic divisions, since most paddy fields are owned by poorer farmers from
communities with a lower social status, and because paddy yields far lower financial
returns than arecanut cultivation. The paddy field owners would therefore like to
promote such conversions. Others would like to see grasslands enclosed by forests
maintained since these provide grazing for wild herbivores such as Gaur, who
otherwise tend to raid crops.
lxxxviii

17.3 Ecological processes
17.3.1 The last series of discussions would pertain to a series of important ecological
processes, such as encroachment on village commons for habitation, encroachment on
forests for cultivations, tapping of ground water by borewells, dynamiting and other
destructive methods of fishing, promotion or suppression of fire in forest areas, free
range grazing by cattle. Perspectives should be generated on the manner in which
people view the consequences of these processes in various localities, and their
preferences as to how these processes should be managed and how such management
relates to their other aspirations. For instance, in a discussion involving members of
the Panchayat (= Village Council), some felt that the Panchayat should demarcate
areas in which no further bore wells should be dug; others disagreed. On the other
hand, they were unanimous that fishing using dynamite should be banned.
18. CONFLICTS AND CONSENSUS
18.0.1 An exhaustive documentation of the varying perspectives of the people relating to
management of species, localities and ecological processes would bring out instances of
congruencies as well as divergences. The next step is to document these and then hold
group discussions either to confirm congruencies, or more significantly, to see whether
the divergences can be narrowed down and some perspectives acceptable to all parties
achieved. If there are some irreconcilable divergences, then it should be recorded that the
proponents agree to disagree. This exercise would set the stage for a statement of broadly
what the community members would like to see happen in terms of the local biodiversity,
the various ecotopes and the key ecological processes.
19. RESPONSE OPTIONS
19.0.1 The concluding step of the assessment would be a series of discussions at
individual, small group and finally the entire village assembly level of the options
available to translate what community members would thus like to see happen into
practice. These options would relate to actions that may be taken by individuals (e.g.
farmers deciding to continue cultivation of a traditional cultivar of paddy in a small plot
on his own land), groups of people (e.g. members of Moghera community deciding to
lxxxix

abandon the tradition of ritual communal hunts twice a year), government functionaries
(e.g. village agricultural extension workers deciding to draw people’s attention to toxic
effects of certain pesticides), local institutions (e.g. local farmers’ co-operative deciding
to promote drip instead of sprinkler system of irrigation), formal governmental
institutions at local level (e.g. local village council deciding to ban use of dynamite in any
water body within village boundary) or governmental institutions at state level (e.g.
agriculture department deciding to give special reward to people for maintaining
traditional crop cultivars on their farm etc). The options may also include policy changes
that may be recommended at various levels, e.g. at local government level on tapping of
ground water through bore wells, or at state government level on sharing of revenue
obtained through levying collection changes on commercial harvests of medicinal plants.
20. FOLLOW UP AND OUTREACH
20.0.1 Finally there should be an attempt to put into operation as many of the response
options arrived at as possible, at local, state and national level by sharing the findings of
the assessment exercises, both in local languages, and in English through a variety of
channels. These channels could include local level discussions such as meetings of
farmers’ co-operatives, village council or annual school day; special exhibitions arranged
at annual village festival, articles in local, state and national level newspapers,
discussions at special state level meetings such as Wild Life Week celebrations, material
put on web page etc.
xc

REFERENCES
Guha, R. 2000. Environmentalism: A Global History. Oxford University Press, New
Delhi.
Ayensu, E., Claasen, D. R., Collins, M., Dearing, A., Fresco, L., Gadgil, M., Gitay, H.,
Glaser, G., Juma, C. Krebs, J., Lenton, R., Lubchenco, J., McNeely, J. A., Mooney, H.
A., Pinstrup-Anderson, P., Ramos, M., Raven, P., Reid, W. V., Samper, C., Sarukhan, J.,
Schei, P., Tundisi, J. G., Watson, R. T., Xu, G., Zakri, A. H. 1999. International
Ecosystem Assessment, Science, 286: 685-686.
Gadgil, M., et al. 1996. Recording Indian’s Wealth: People’s Biodiversity Register’,
Amruth, Vol. 1, 5, Oct 1996. Pp. 1-16.
Gadgil, M., Rao, P. R. S., Utkarsh, G., Pramod, P. and Ashwini Chhatre. New
Meanings for Old Knowledge: The Peoples Biodiversity Register Programme. Ecological
Applications (in press).
Daniels, R. J. R., Malathi Hegde, Joshi, N. V. and Madhav Gadgil. 1991. Assigning
Conservation Value: A Case Study from India. Conservation Biology, 5(4), 464-475.
Pramod, P., Daniels, R.J.R., Joshi, N. V. and Gadgil, M. 1997. Evaluating bird
communities of Western Ghats to plan for a biodiversity friendly development. Current
Science, 73(2), 156-162.
xci